rejecting the grand bargain: what …...rejecting the grand bargain: what happens when large...
TRANSCRIPT

REJECTING THE GRAND BARGAIN: WHAT HAPPENS WHEN
LARGE COMPANIES OPT OUT OF WORKERS’
COMPENSATION?*
Alison Morantz
Stanford Law Schoo1
* This project was funded by NSF Grant No. 0850636. Many thanks to Nipun Kant, Nate Atkinson, Garth
Sheldon-Coulson, Charlie Wysong, Brian Karfunkel, Yo-Jud Cheng, Adam Greenberg, Tim Hyde, Patrick
Leahy, Ted Westling, Kristen Altenburger, Rajlakshmi De, Austin Alleman, Alex Weiss, Kathleen Choi,
Sarah Levine, Nikhil Saifullah and Julia Bodson for skilled research assistance at various stages of the
project.

1
Abstract:
The “grand bargain” of workers’ compensation, whereby workers relinquished the right
to sue their employers in exchange for no-fault occupational injury insurance, was one of
the great tort reforms of the Twentieth Century. Yet there is one U.S. state that has
always permitted employers to decline workers’ compensation coverage, and in which
many firms have chosen to opt out of the statutory scheme: Texas. This study examines
the impact of the opt-out choice on fifteen large, multistate firms that provided their
Texas employees with private occupational injury insurance benefits in lieu of workers’
compensation from 1998-2010. As economic theory would lead one to expect, replacing
statutory benefits with private plans generated considerable cost savings. My estimates
suggest that costs per worker hour fell by about 44 percent. These savings were driven by
a drop in the frequency of more serious injury claims and by a decline in costs per claim.
Both medical and wage-replacement costs fell substantially. Although the decline in
wage-replacement costs was larger in percentage terms, the drop in medical costs was
equally financially consequential since medical costs comprise a larger share of total
costs. In the second stage, I find that non-traumatic injury claims were more responsive to
the opt-out choice than traumatic ones. In part, this disparity reflects the fact that private
plans categorically exclude some non-traumatic injuries from the scope of coverage. Yet
even non-traumatic injuries that were not excluded from coverage declined more than
traumatic injuries. This finding is consistent with aggressive claim screening by
employers and/or a decline in over-claiming and over-utilization by employees. The third
stage examines the effect of opting out on severe, traumatic injuries, which are presumed
to be the least susceptible to reporting bias. The observed sizable decline in such injuries,
although consistent with an improvement in real safety, could also be explained by
aggressive claim screening. The last stage of the study probes whether four ubiquitous
features of private plans – exclusion of permanent partial disabilities, exclusion of most
diseases and some non-traumatic injuries, capped benefits, and lack of chiropractic care –
explain most of the observed trends. Surprisingly, these features account for little of the
estimated cost savings. Although many study participants described limited provider
choice and 24-hour reporting windows as major cost drivers, data limitations preclude me
from identifying their respective impacts. Overall, my findings suggest a need for
policymakers to examine the efficiency and welfare effects of converting workers’
compensation from a cornerstone of the social welfare state into an optional program that
exists alongside privately-provided forms of occupational injury insurance.
2
I. Introduction
The “grand bargain” of workers’ compensation, whereby workers relinquished the
right to sue their employers in exchange for no-fault insurance for occupational injuries,
was one of the great tort reforms of the Twentieth Century. Every U.S. state adopted a
workers’ compensation law between 1910 and 1948 (Fishback & Kantor, 1998).
Although the level and duration of benefits for injured workers vary considerably across
states, the hallmark of the system is its near universality. In most U.S. states, virtually
every company is required to purchase workers’ compensation insurance, whether
through a private insurance carrier, a state insurance fund, or self-insurance (Shields &
Campbell, 2002). It is an open question whether the transition from a negligence-based
tort system to a no-fault strict liability system enhanced workplace safety or allocative
efficiency. Yet given the ubiquity of workers’ compensation, most scholars have taken
the program’s existence for granted and examined how different aspects of regulatory
design affect employers’ and employees’ incentives and, in turn, the frequency, duration,
and cost of claims.
This article explores an issue that has received very little attention in prior
academic scholarship: the consequences of converting workers’ compensation from a
compulsory system to a voluntary one. As late as the 1970s, many state laws were
elective, but by the mid-1970s, nearly all states amended their laws to make participation
mandatory (Shields & Campbell, 2002). When South Carolina followed suit in 1997,
3
Texas became the only state with a truly voluntary program.1 By 2012, about 33% of
Texas firms were “nonsubscribers” (firms that opt out of workers’ compensation) (Texas
Department of Insurance Workers’ Compensation Research and Evaluation Group,
2012). Although very small firms (those with 1-4 employees) have always been
disproportionately likely to forgo participation, in 2012, 17% of all large Texas
employers (those employing at least 500 workers) had opted out (Texas Department of
Insurance Workers’ Compensation Research and Evaluation Group, 2012). Almost all
large nonsubscribers chose to provide their Texas employees with customized
occupational injury insurance plans (“private plans”) whose features roughly resembled
those of workers’ compensation.
This study examines the consequences of nonsubscription for large companies
that operate in a homogenous manner across many U.S. states. I confine my analysis to
this segment of the Texas economy for several reasons. First and foremost, analyzing
granular data from large multistate firms with many homogenous facilities allows me to
mitigate several sources of selection bias because I can use the facility (rather than the
firm) as the unit of analysis, simultaneously exploiting variation between states and over
time. Second, large companies were the only size class in which nonsubscription rates
increased from 2000-2010 (Texas Department of Insurance Workers’ Compensation
Research and Evaluation Group, 2012), and they are at the forefront of lobbying efforts to
spread the nonsubscription option. Third, because large companies employ many workers
1 Until 2013, New Jersey was the only other state without mandatory workers’ compensation, but given the
highly restrictive nature of the statute, no firms have chosen to opt out (Shields & Campbell, 2002).

4
who in turn file many claims, they exert an outsized influence on economic productivity
and worker welfare. Fourth, their large workforces enable me to derive statistically
meaningful estimates. Finally, most large national corporations employ full-time
professionals to oversee the administration of occupational injury claims, and these
executives belong to professional organizations that facilitate information sharing. Thus,
large, multistate firms most likely function as rational corporate actors when opting to
forgo workers’ compensation coverage.
In the first stage of the analysis, I investigate costs paid by nonsubscribers. I find
that the opt-out choice is associated with a 44% decline in the total cost of injuries and
illnesses per worker hour. This decline is driven by a drop in both medical and wage-
replacement costs, and a concomitant decline in the frequency of more serious claims.
The second stage of the study examines whether some types of injuries fall more
dramatically with nonsubscription than others. Traumatic injuries occur (by definition) at
a discrete moment in time and usually have a clear precipitating cause, so they tend to be
the least susceptible to over-claiming (by employees) or unwarranted claim denials (by
employers). They are also the most compatible with evidence-based medicine, and as
such are presumably less conducive to under- and over-utilization of benefits (Morantz,
2017). My results show a disproportionate decline in non-traumatic injury claims and
costs, suggesting that incentive effects probably explain some of the observed cost
savings.
In the third stage of the analysis, I isolate the effect of nonsubscription on severe,
traumatic injury claims, which are generally the least susceptible to underreporting and
5
other incentive effects (Morantz, 2017). I find that the frequency of such injuries declines
substantially (by about 47%) with nonsubscription, which could be explained by a
decrease in the number of injury claims that are reported by employees or approved by
employers, or by an improvement in safety.
The final stage of the study probes causal mechanisms. I examine the likelihood
that four highly salient and nearly universal features of private plans – non-coverage of
permanent partial disabilities, categorical exclusion of some non-traumatic injuries and
diseases, caps on total benefits, and lack of chiropractic care – account for the bulk of the
observed cost savings. Surprisingly, my findings suggest that this is not the case.
Although many nonsubscribers contend that two other ubiquitous features of private
plans – short injury-reporting windows and control over provider choice – play important
causal roles, data limitations preclude me from identifying their respective impacts.
The primary limitation of the study is that I cannot quantify the ultimate
efficiency or distributional consequences of nonsubscription. Distinguishing between
observationally equivalent categories of incentive effects would require access to a
broader array of data sources than I possess. Consequently, several empirical
controversies raised by stakeholders remain unresolved. Most importantly, my reliance
on employer-provided data on paid claims, my inability to observe claims that are filed
yet denied, and my inability to observe whether (and if so, when) injured workers return
to work (or lose their jobs) preclude me from drawing any global conclusions regarding
net welfare effects. Yet in helping to quantify the cost savings that accrue to

6
nonsubscribers and identifying their most likely sources, I aim to bring current trends into
sharper focus and prioritize questions for future empirical investigation.
Ancillary materials and analyses that space constraints prevent me from including
here are available on a companion website.2
II. Features of Workers’ Compensation, Nonsubscription, and Private Plans
Although the elective nature of the Texas’s workers’ compensation statute is
unusual, in most other respects the law is similar to those of other states. The statute gives
injured employees a thirty-day “reporting window” in which to inform their employers
that they have been injured on the job (Office of Injured Employee Counsel of the State
of Texas, 2016). As in most states, the Texas program provides full coverage of medical
costs (with no copays, time limits, or monetary caps), wage replacement benefits are
untaxed, and employees are typically allowed to select their physician (International
Association of Industrial Accident Boards and Commissions and the Workers
Compensation Research Institute, 2009).3 Employees suffering from temporary total,
permanent total, or permanent partial disabilities receive 70-75% of their weekly wage
(capped at either 70% or 100% of the state’s average weekly wage4) tax-free, a generous
2 See http://amorantz.stanford.edu/companions/rejecting-the-grand-bargain/.
3 See Table 3. Workers’ Compensation Medical Benefits and Method of Physician Selection as of July 1,
2008.
4 Labor Code § 408.061.
7
rate by national standards (International Association of Industrial Accident Boards and
Commissions and the Workers Compensation Research Institute, 2009).5 The state
imposes a seven-day waiting period on receipt of wage replacement benefits, but the first
week’s benefits can be recouped if the absence lasts over thirteen days.6
In contrast to the transparent features of the workers’ compensation system, the
detailed attributes of nonsubscribers and their private plans are not publicly available
(Shields & Campbell, 2002). However, findings from periodic surveys of Texas
employers and employees indicate that the features of private plans offered by the
majority of nonsubscribers are remarkably homogenous (Texas Department of Insurance
Workers’ Compensation Research and Evaluation Group, 2014).
Table A compares Texas workers’ compensation to the private plans offered by
the fifteen study participants. Unlike workers’ compensation, all of the private plans
provide wage-replacement benefits from the first day of lost work. Most replace 85-100%
of lost wages, and to the benefit of higher-earning workers, that sum is not capped at the
state’s average weekly wage. Yet because private plan benefits are taxable and workers’
compensation benefits are not, the effect of nonsubscription on net take-home pay is
5 See Table 6. Benefits for Permanent Partial Disability Provided by Workers’ Compensation Systems as of
July 1, 2008.
6 The Texas legislature reduced the length of the “retroactive period” from 28 days to 14 days on September
1, 2005, see Texas Workers’ Compensation Act § 408.082. Thirteen of the fifteen companies studied in this
article had opted out by this date. The 14-day provision is relevant only to two of the participants that opted
out most recently.
8
uncertain. Additionally, the majority of the private plans also impose fixed per-person
caps on total benefits.
All of the plans limit employees’ choice of medical care provider, and none
compensates permanent partial disabilities or chiropractic care. Most also categorically
exclude from coverage some non-traumatic injuries (such as non-inguinal hernias and
carpal tunnel syndrome) and many occupational diseases (such as those caused by mold,
fungi, pollen, or asbestos).
The majority of the private plans also include discretionary grounds for denying
claims or terminating benefits. For example, the plans uniformly include an employee’s
failure to report an injury to a supervisor by the end of the work shift or within 24 hours
as a legitimate basis for claim denial.7 Many only provide coverage for injuries that fit
their definition of an accident: the injury must have “occurred by accident” and “from
unknown causes.” Most also reserve the right to deny a claim if the employee failed to
comply with safety policies or engaged in “inappropriate behavior,” such as horseplay.
Other common discretionary bases for terminating benefits (after a claim is filed) include
an employee’s refusal to submit to a drug or alcohol test, failure to seek approval for any
medical treatment, consultation with a non-approved physician, refusal to allow an
employer representative to accompany him/her to doctor’s appointments, tardiness or
non-appearance at doctors’ appointments, and failure to cooperate with the plan
7 Thirteen of the fifteen study participants have “good cause” provisions in their private plans, which allow
an employee to collect benefits for injuries they did not report within 24 hours if the claims administrator
determines there was good cause for their failure to provide timely notice.

9
administrator. Medical benefits can always be terminated if an employee is fired for gross
misconduct, and wage-replacement benefits can usually be terminated if an employee is
fired for any reason besides layoff.
Dispute resolution mechanisms also differ between the private plans and workers’
compensation. Whereas workers’ compensation appeals are handled through an
administrative adjudicatory process, challenges to a benefit determination under a private
plan are subject to the provisions of the plan itself and initially go through an internal
appeals process. Private plans are governed by the Employee Retirement Income Security
Act of 1974 (ERISA), so challenges to adverse benefit determinations must be brought in
federal district court. The highly deferential standard of review that pertains to ERISA
appeals typically makes them difficult for employees to win.8 For the resolution of tort
claims (alleging employer negligence), most plans mandate arbitration.9 Many plans also
include “final compromise and settlement” clauses specifying that an employee must
accept whatever settlement is offered after arbitration or receive no benefits at all.
Although the Texas Workers’ Compensation Act protects employees who file
workers’ compensation claims from retaliatory discharge (Altman et al., 2012), the Texas
8 See Firestone Tire & Rubber Co. v. Bruch, 489 U.S. 101 (1989).
9 A majority of nonsubscribers in Texas in 2012 and in this study select arbitrators registered with the
American Arbitration Association or the National Arbitration Forum (Texas Department of Insurance
Workers’ Compensation Research and Evaluation Group, 2012). Texas abolished the “unholy trinity” of
common law defenses to tort liability: the fellow-servant rule, assumption of risk, and contributory
negligence, see Texas Labor Code § 406.033.
10
Supreme Court has expressly declined to extend such protection to employees of
nonsubscribers.10 Thus the only legal recourse for a worker terminated in retaliation for
reporting an injury is to file an anti-retaliation claim under ERISA Section 510. Such
claims must be brought in federal court and offer narrower remedies than those available
under state law.11
III. Key Themes in Prior Literature
One important strand of workers’ compensation scholarship has focused on the
frequency of injuries for which claims are never filed. Empirical literature on
underreporting – perhaps better characterized as under-claiming in the workers’
compensation context – nearly always estimates the percentage of workplace injuries that
do not result in claims to exceed 35%.12
Another important line of research examines the extent to which injured workers
are compensated for their true economic losses. Though these studies of benefit adequacy
vary widely in methodological approach and in the type of disability analyzed, they
10 See Texas Mexican Railway Company v. Bouchet, 963 S.W.2d 52 (Texas 1998).
11 See 29 U.S.C. § 1132(e); Tolle v. Carroll Touch, Inc., 977 F.2d 1129, 1133-34 (7th Cir.1992); Eichorn v.
AT&T Corp., 484 F.3d 644, 651-53 (3d Cir. 2007). Punitive damages are not available under ERISA, see
29 U.S.C. § 1132(a)(3), unlike Texas Workers’ Compensation, see Texas Labor Code § 451.002.
12 Boden and Ozonoff, (2008) report the lowest estimate, 20%, and Biddle and Roberts (2003) report one of
the highest estimates, 45%.

11
virtually all conclude that benefit levels are inadequate on equitable grounds, efficiency
grounds, or both (Hunt, 2004; Viscusi and Moore, 1987).
An extensive body of work investigates evidence for the presence of incentive
effects throughout the workers’ compensation system. In the conventional framework, as
benefits increase, “risk-bearing” moral hazard predicts that employees will assume risks
on the job, and “claims-reporting” moral hazard predicts that a worker will be more likely
to file an injury claim (including for a feigned or off-the-job injury). Most empirical
studies report findings consistent with the presence of either (or both) forms of moral
hazard (Chelius, 1982; Worrall & Appel, 1982; Worrall & Butler, 1985; Butler &
Worrall, 1991; Ruser, 1991; Bolduc et al., 2002).13 Yet because an increase in benefits
also increases the number of claims reported, firms may invest more in safety or return-
to-work programs (Chelius, 1982; Moore & Viscusi, 1992; Kniesner & Leeth, 1988;
Kaestner & Carroll, 1997; Krueger, 1990).14
Another cluster of scholarship explores the drivers of costs per claim. Because the
cost of treating identical injuries is generally higher under workers’ compensation than
under group health, several authors have hypothesized that medical providers engage in
13 However, Krueger (1990: p. 73), finds that higher benefits are not associated with higher injury claims
among female CPS respondents, and Krueger and Burton (1990: p. 228) find costs to be less responsive to
benefit levels that previous estimates, and in some cases not significantly different from unit elasticity.
14 However, Fishback (1987: pp. 305-328) finds that adoption of workers' compensation in mining industry
in early 1900s increased rates of fatal injuries, presumably because of the change in incentive effects
associated with rising compensation.

12
price discrimination. Yet empirical work on this question (Fields & Venezian, 1991;
Baker & Krueger, 1993) – as well as the question of whether allowing claimants to select
their own doctors increases medical costs (Boden & Ruser, 2003; Neumark et al., 2007) –
is inconclusive. Meanwhile, studies focusing on permanent partial disability find that
such claims comprise only a third of workers’ compensation cases yet about two-thirds of
total costs (Sengupta et al., 2009). However, one California-based study suggests that
permanent partial disability’s disproportionate effect on costs is somewhat attenuated in
large companies (Reville et al., 2001: p. xv, 7).
Finally, several studies have estimated the extent to which employees effectively
“buy” a portion of workers’ compensation benefits through lower wages. Although
studies on the topic generally concur that compensating differentials exist, estimates of
their magnitudes differ widely (Kaestner & Carroll, 1997; Moore & Viscusi, 1992).
In contrast to the rich empirical literature on workers’ compensation, only two
academic studies have focused on Texas nonsubscription. Using aggregate company-
level data from 1992-94, Butler (1996) demonstrates that in most sectors, fatal injury
claim rates vary little between the workers’ compensation and nonsubscription regimes,
suggesting that safety levels are similar. Yet his data also show that nonsubscribers report
slightly more non-fatal injury claims and fewer chronic claims. Butler speculates that
these effects are explained by nonsubscribers’ elimination of permanent partial disability
benefits, their ability to weed-out pre-existing conditions, and their capacity to deter
employees from prolonging claims (Butler, 1996: p. 412, 426). However, he relies on
firm-level data confined to Texas, and he lacks the capacity to control for cross-firm, let

13
alone cross-facility, disparities in risk (Butler, 1996: p. 407). Moreover, the time period
analyzed predates the exodus of large, multistate companies from workers’
compensation.
The other academic study of nonsubscription, Morantz (2011), reports the results
of a phone survey administered to 54 large, multistate nonsubscribers (about 89% of all
such firms) in 2009. Nearly all survey participants cited the desire to save costs as their
main motivation for opting out. Most were surprised by the magnitude of cost savings,
which reportedly exceeded 50%, and by the scarcity of costly tort judgments.
Despite the scarcity of academic work, nonsubscription has notably been the
subject of a growing number of newspaper articles, industry studies, and practice guides
that reach widely disparate conclusions about its welfare effects (Rousmaniere, 2012;
Grabell & Berkes, 2015; Rousmaniere & Roberts, 2013; Rousmaniere, 2015; Robinson,
2015; Flynn, 2016; International Association of Industrial Accident Boards and
Commissions, 2016).
IV. Description of Data
Fifteen large, multistate firms that opted out of workers’ compensation in Texas
for at least some portion of the study period (1998-2010) contributed data to the present
study. Confidentiality restrictions preclude me from disclosing their identities, but their
diverse corporate attributes make them prime candidates for a research study. Nine are
retail chains, three are manufacturers, and three are services firms. All would be deemed
14
“large” within their industry groupings,15 and each operates at least fifteen homogenous
facilities in at least five U.S. states.16 Table B describes the participant characteristics in
detail.
Despite my capacity to analyze data at the claim and facility levels, two forms of
selection bias remain potential concerns. First, could it be that only the most successful
large, multistate Texas nonsubscribers agreed to join my study? I do not believe this form
of selection bias is likely to skew my findings because the study participants comprised a
sizable fraction – nearly a quarter – of all large, multistate nonsubscribers during the
period examined.17 In addition, the study participants’ responses to a prior phone survey
were very similar to those of the entire survey sample, which itself comprised almost the
entire population.18
15 I use the same industry groupings described in Morantz (2011: pp. 210-214). See Section 8.4 for
description of size and geographic distribution inclusion criteria for firms.
16 In the transportation industry the term “facility” refers to a distribution center or “hub.” For all other
industries, “facility” refers to a brick-and-mortar establishment.
17 See Morantz (2011). The author compiled a list of all large, multistate Texas nonsubscribers whose
identity could be gleaned from public and private sources. The search yielded a total of 61 firms, 54 of
whom which were included in that survey.
18 For a description of the content and results of the phone survey, see Morantz (2011). I performed t-tests
to determine whether the survey responses of the 15 study participants differed from those of the other 39
firms included in the survey. For most questions, I found no statistically significant difference between the
groups. For the handful of questions for which responses did significantly differ, participants were more
likely to cite adverse opt-out effects.
15
Alternatively, one might worry that all nonsubscribers are different from other
firms. For example, what if only the safest large, multistate firms opt-out? There is scant
support for this hypothesis; the study participants’ OSHA-recordable injury rates differ
little from those of other firms in their respective industry groups.19 Yet even if this form
of selection bias does exist, it would not undermine the relevance of my findings. The
treatment examined in this study is not the abolition of workers’ compensation, but the
shift from a compulsory law to an elective one. Only in an elective regime can firms opt
out of workers’ compensation and adopt private plans. So even in the presence of firm
self-selection, the elective nature of the statute has, in a meaningful sense, “caused” any
observable disparities in the frequency and cost of workplace injuries.
The study participants fall into two groups. Ten firms provided me with a dataset
encompassing at least one year before the private plan went into effect as well as a
portion of the post-opt-out period; I call these “panel” firms. The remaining five firms,
which I call “cross-sectional” firms, only provided me with data from after the date of
opt-out.
As is shown in Table B, the years for which data are available differ across firms,
as do the exact structure and scope of each company’s data. At a minimum, however,
each participant provided me with the following data files:
19 To explore this form of selection bias, the last row of Table B compares the OSHA-recordable injury rate
of each study participant to the comparable rate for all firms in its industry grouping.
16
(1) Texas Nonsubscription Claims File: This file contains detailed information on
all occupational injury claims accepted and paid by the firm during the period of
nonsubscription.20 A “claim” is defined as a reported injury for which the employer
incurred some direct costs.21
Three categories of reported injuries are not analyzed here. First, injuries for
which the employer incurred no costs – because the injury was deemed non-compensable
or non-work-related, the claim was denied for other reasons, or the injury was treated
through a different insurance system – are excluded from the analysis. Second, injuries
that received only first-aid treatment are excluded. Third, fatal injury claims are excluded
because they were too infrequent to permit robust comparisons across regimes.
The information available on each claim includes the date and type of injury; the
facility (and state) where it occurred; and any medical, wage-replacement, and/or legal
costs paid by the company.22 Yet to calculate total costs paid by a fixed maturation date,
claim-level financial information is not sufficient; costs must be tallied at the
transactional level. A “transaction” is a single payment (i.e., cashed check) attached to a
20 Company 10 is unique insofar as it “staggered” the implementation of its private plans across its Texas-
based facilities, and so the period of nonsubscription is facility-specific.
21 About 2% of claims have positive total costs but no medical costs. Of these, 10% contain only wage-
replacement costs, 30% contain only legal costs, and 60% contain miscellaneous expenses.
22 Breaking down each claim into medical, wage-replacement, and legal costs sometimes required minor
adjustments to the dataset. For example, ten companies use a payment category called “Medical-Legal,”
which includes the cost of medical exams conducted for purposes of litigation. I treat these payments as
legal costs. Tort judgments (if any) are included in legal expenses.

17
claim that was disbursed on a given date for a given purpose (such as medical care, lost
wages, or legal expenses). Of the fifteen study participants, thirteen (all companies except
6 and 7) provided me with transaction-level data in addition to claim-level data.
(2) Workers’ Compensation Claims File: This file contains claim-level
information (as well as, for thirteen of the fifteen companies, transaction-level data) on
all workers’ compensation claims filed throughout the study period. The file contains the
same data fields as the Texas Nonsubscription Claims File.
(3) Hours File: The hours file contains data on the total number of hours worked
per month (or quarter) at each of the company’s facilities nationwide.
I augmented these files with three smaller datasets concerning workers’
compensation. First, I obtained cost benchmark data from The Workers’ Compensation
Research Institute (WCRI) with average total costs, average wage-replacement costs, and
average medical costs per claim for the twenty states included in their annual survey.23
Second, I assembled a dataset indicating whether each state’s law limits an employee’s
initial choice of medical provider.24 Finally, I compiled a dataset on “reporting
23 The WCRI “CompScope Benchmarks” studies provide total and wage-replacement costs and their “The
Anatomy of Workers’ Compensation Medical Costs and Utilization” studies provide medical costs. I used
the 1st-13th editions to obtain estimates from 1998-2010. In regressions including the WCRI benchmarks, I
only included those 20 states for which WCRI benchmarks were available (AR, CA, CT, FL, GA, IA, IL,
IN, LA, MA, MD, MI, MN, NC, NJ, PA, TN, TX, VA, WI).
24 I used the WCRI National Inventory: Table 1 “Common Cost Containment Strategies,” as my data
source for the years 1998, 2001, and 2008. However, because the National Inventory relies exclusively on
18
windows”: the number of days in which each state requires an employee to report an
injury to his/her employer.25
V. Research Questions and Identification Strategy
The effect of nonsubscription on the frequency of claims is theoretically
indeterminate. On one hand, first-day provision of wage replacement benefits and the
lack of any maximum on weekly reimbursement rates may increase claim frequency,
especially for minor injuries. On the other hand, the capped benefits, restrictions on the
pool of providers, and narrower privacy protections that characterize private plans may
encourage injured employees to seek treatment through group health plans instead. On
the employers’ side, the newfound exposure to tort liability could strengthen
nonsubscribers’ incentives to implement safety improvements, lowering claim frequency.
Yet the myriad exclusions and mandatory arbitration clauses that private plans typically
survey data, I verified the Inventory’s accuracy with state statutes (and collected data for non-surveyed
years). In doing so, I identified (and corrected) coding errors involving six states (CT, LA, MS, VT and
WY), which were confirmed by Ramona Tanabe of WCRI.
25 The dataset lists the number of days in which an employee is required to notify his/her employer of an
occupational injury. I primarily relied on “Workers Compensation Claims Timelines” published by the
Property Casualty Insurers Association of America (PCI), but also examined individual states’ statutory
language on reporting windows to confirm the accuracy of the PCI data. For states with a range of windows
(e.g., 21 to 180 days), I used the upper bound (i.e. 180 days). When I contacted state agencies, I found that,
of the 16 states with reporting windows under 15 days, only SD claimed to strictly adhere to its three-day
injury reporting window.

19
impose may give nonsubscribers the flexibility to leave some injuries uncompensated.
The net effect of these cross-cutting factors on claim frequency is hard to predict.
The effect of nonsubscription on employer cost per claim is likewise uncertain.
On one hand, all nonsubscribers in this study (with the exception of 5 and 12) offer pre-
tax wage replacement rates that exceed those provided under workers’ compensation,
which will tend to increase costs. First-day wage replacement coverage and the absence
of any cap on weekly benefits will have the same effect. On the other hand, the
nonsubscribers’ elimination of permanent partial disability benefits and chiropractic care,
their imposition of caps on total benefits, their inclusion of many discretionary grounds
for terminating benefits, and their unfettered access to cost-containment strategies (such
as limits on provider choice) will tend to lower cost per claim. Legal costs are also
subject to offsetting effects. Exposure to tort suits may prove costly in exceptional cases,
but nonsubscribers’ reliance on mandatory arbitration may dampen this risk.
Under fairly minimal assumptions – such as profit maximization, sufficient
information on future costs, a reasonable time horizon, and minimal agency costs –
nonsubscription should be a profit-maximizing choice. Indeed, given the sizable
transaction costs involved, one might expect cost savings to be substantial. Yet the
magnitude of these savings, and the manner in which they are achieved, are open
questions. Understanding how and why nonsubscribers save money may provide clues
about the distributional consequences of private plans. Toward this end, I pose four
interrelated questions:

20
1. Does nonsubscription reduce costs for large companies? If so, how large are these
savings? Are they driven by a fall in claim frequency, costs per claim, or both?
Are medical, wage replacement, and legal costs equally affected?
2. Are some types of injury claims more responsive to the opt-out choice than
others?
3. Is there any significant decline in the frequency of severe and traumatic injuries,
which are assumed to be the least susceptible to incentive effects?
4. Do four of the most salient features of private plans – non-compensation of
permanent partial disabilities, categorical exclusion of many diseases and some
non-traumatic injuries from coverage, caps on total benefits, and lack of
chiropractic care – account for the lion’s share of cost savings?
First Research Question. I first attempt to isolate the relationship between
nonsubscription and claim frequency, costs per worker hour, and costs per claim.
To identify changes in claim frequency, I estimate negative binomial regression
models of the form:
𝒀 = exp{ln(𝑻) + 𝑿�̂� + 𝛜} (1)
where 𝒀 represents the number of claims with positive costs (calculated separately for
each cost type) as of one year from the date of injury, per facility-quarter.26 𝑿 is the
26 If a claim has accrued both wage replacement and medical costs, for example, it will be included in both
wage replacement and medical models.

21
design matrix, including state, company, and quarter dummies. This matrix also includes
the covariate of interest, the nonsubscription indicator, which takes on a value of 1 in
facility-quarters in Texas that post-date the opt-out choice. The exposure term is hours
worked (𝑻), and errors (𝛜) are clustered on facility. For ease of interpretation, I calculate
incidence rate ratios (IRR) for all coefficients.
Credibly identifying nonsubscription’s effects on cost per worker hour and on
cost per claim poses significant challenges. The difficulty is that in each case, some
observations accrue zero costs, and the data-generating process governing whether any
costs are paid (the extensive margin) may differ from the data-generating process
governing the magnitude of those costs (the intensive margin). For example, whether a
facility incurs any costs during a given quarter will depend partly on underlying safety
levels (whether any employees are injured), whereas the magnitude of costs will depend
largely on the quality of medical care and return-to-work programs. To derive unbiased
estimates, I must account for the possibility that nonsubscription affects both the
extensive and intensive cost margins, but through distinct causal channels.
Toward this end, I employ a two-step modeling procedure similar to that outlined
in Buntin and Zaslavsky (2004). The first step focuses on the extensive margin, using the
following probit model to determine whether nonsubscription significantly predicts the
likelihood of any costs being paid:
𝒀 = {
1, 𝑿𝛽 + 𝝐 > 00, 𝑿𝛽 + 𝝐 ≤ 0
} (2)
In this model, 𝒀 represents whether any costs were paid (estimated separately for
costs per claim and on costs per worker hour in a facility-quarter). 𝑿 is the design matrix,

22
including the nonsubscription indicator, as well as state, company, and quarter dummies.
Errors (𝛜) are clustered on facility.
Next, I devote attention to the intensive margin by modeling the effect of
nonsubscription on the magnitude of paid costs. Although there is some debate in the
literature regarding the relative merits of using Ordinary Least Squares (OLS) versus
Generalized Linear Models (GLM) to model the intensive margin (Duan, 1983; Manning
& Mullahy, 2001), I opt to mitigate the potential biases that afflict OLS by employing a
GLM, which yields unbiased estimates when the coefficients are transformed back to
their raw scale. Because GLM estimates are less precise than OLS (Manning & Mullahy,
2001), my modeling approach will, if anything, tend to understate the statistical
significance of my findings.
For these analyses, I specify the GLMs with the gamma model family because the
modified Park diagnostic test confirms that the variance of programmatic costs is
proportional to the square of its mean (Manning & Mullahy, 2001). In accordance with
prior literature (Finkelstein, 2007; Mahmoudi & Jensen, 2014), I employ the logarithmic
link function to mitigate the right skewness in the distribution of costs. I implement
GLMs of the following form:
ln(𝔼[𝒀]) = 𝑿𝛽, 𝒀 ~ Γ(𝛼, 𝛽) (3)
In the GLMs of costs per worker hour, 𝒀 represents the inflation-adjusted costs
(paid as of one year from the date of injury) per hour worked, for all injuries sustained in
a given facility-quarter. In the GLMs of costs per claim, 𝒀 represents the inflation-
adjusted costs per claim (paid as of one year from the date of injury). In either case, the
23
design matrix (𝑿) includes not only the covariates included in the design matrix in
Equation (2), but also WCRI benchmarks. Errors are clustered on facility, and coefficient
estimates are presented as incidence rate ratios (IRR).
The model I ultimately use to derive cost estimates depends upon the results of
this two-step procedure. If the probit model indicates that nonsubscription significantly
affects the likelihood of any costs being incurred, then I follow Manning and Mullahy
(2001) in using the results of the probit and GLMs to compute average predicted costs. In
this context, the GLM restricts the sample to claims (or facility-quarters) with positive
costs of the pertinent cost type, and I follow Wooldridge (2010: p. 438) and generate
bootstrapped standard errors to confirm the statistical significance of the estimates. If the
first step does not yield any statistically significant evidence of an extensive margin
effect, then I rely exclusively on the GLM to compute predicted costs. In the latter
scenario, the sample includes all claims or facility-quarters, including those with zero
paid costs.27
Another aspect of nonsubscription ripe for empirical investigation is its effect on
return to work. Many study participants cited a decline in lost work time as a major
benefit of nonsubscription. Unfortunately, however, I cannot accurately measure the
length of lost-work spells in my data. I can only observe the stream of benefits received,
not the date(s) on which employees were actually working. Nor can I observe the date, if
27 Not all claims with positive total costs include costs for all cost types. For example, a few claims with no
wage-replacement costs are included in wage-replacement cost models.

24
any, on which an employee was terminated, or the circumstances surrounding any such
termination.28
Robustness Checks for First Research Question. Given the complexity of the
trends examined, I consider numerous potential threats to validity. First, the fact that
costs declined in the Texas workers’ compensation system just after the turn of the
millennium (Texas Department of Insurance Workers’ Compensation Research and
Evaluation Group, 2012: p. 8) complicates my identification strategy, at least for firms
that opted out around this period. The concern is that I might erroneously attribute a
decline in costs to the adoption of a nonsubscription plan, when the drop merely reflected
a pervasive, statewide decline in the cost of workplace injuries.29
As a first step, I mitigate this problem by augmenting each model with state- and
year-specific cost benchmarks, for wage-replacement, medical, and total costs,
28 To use the date(s) during which benefits were received as a proxy for the dates of employment could bias
my estimates. If benefits were terminated on a certain day it could mean that the employee returned to
work, quit, was terminated under circumstances that ended benefits, or even died. Conversely, the
continuation of medical benefits does not imply that a worker remained employed. Thus I cannot credibly
investigate the relationship between opt-out and lost time, or the extent to which termination of injured
employees may help to reduce occupational injury costs.
29 This concern is not as strong as it may appear because many of the statutory reforms that led to the
decline would not directly reduce costs outside the workers’ compensation system. For example, the office
transferred regulatory authority to a new agency, created a new Office for Injured Employee Counsel,
increased reimbursement rates for workers’ compensation providers and permitted employers opt in to new
health care networks.

25
respectively, published by WCRI. (I use total cost benchmarks for legal cost models
because WCRI does not publish legal cost benchmarks.) Derived from a comprehensive
sample of workers’ compensation claims, WCRI benchmarks compare workers’
compensation costs across states. Including benchmarks, however, comes at a price: they
are only available for 20 states, so data from the remaining 30 states must be dropped.30
Moreover, no benchmarks are available for the frequency of claims.
All of my preferred models of costs, at both the claim and facility-quarter levels,
include benchmarks, whereas my preferred models of claim frequency do not. As a
robustness check, however, I estimated all models pertaining to my first research
question with and without benchmarks to ensure that this did not change my core
findings.31
In another attempt to account for potentially confounding trends over time, I
probe whether company-specific trends that preceded the date of opt-out could have
driven any observed cost savings. I conduct falsification tests with placebo dummies that
take on, for each company, a value of 1 a fixed number of quarters before the true opt-out
date, and 0 all subsequent quarters. A sizable number of statistically significant
coefficients on these placebo dummies would raise the concern that pre-existing
30 These twenty states – AR, CA, CT, FL, GA, IA, IL, IN, LA, MA, MD, MI, MN, NJ, NC, PA, TN, TX,
VA, and WI – include eight of the ten most populous states in the country (the exceptions are New York
and Ohio), and are generally viewed as highly indicative of national trends.
31 See Section 2: Alternate Specification Robustness Checks on the companion website.
26
company-specific trends, not the opt-out choice per se, explain any cost savings
observed.
A second methodological complexity arises from the fact that only ten firms
provided me with data on claims arising before and after the date of nonsubscription. For
these “panel” companies, I can employ a differences-in- differences approach,
simultaneously exploiting both cross-sectional variation (across states) and variation over
time (before and after the date of opt-out). For the remaining five cross-sectional
companies, I can only exploit cross-sectional variation given that all of their Texas-based
observations were drawn from the post-opt-out period. Models relying exclusively on
panel data might yield more credible estimates, because the “Texas effect” can be more
confidently distinguished from the “nonsubscription effect.” Yet I am reluctant to discard
data from the five cross-sectional participants, which are also household-name
companies. I present two sets of estimates for the all analyses: one set using data from the
entire sample, and the other relying exclusively on panel firms.32 I consider the latter to
be my preferred estimates, but present the former estimates as a robustness check.
As a third robustness check, I estimate the identical set of models described thus
far on several alternative samples with slightly different inclusion criteria. These samples
include: (a) costs paid as of 36 (instead of 12) months from the date of injury, (b) closed
(instead of all) claims, (c) incurred (instead of paid) costs, and (d) data from 13 or 14
32 Panel companies 6 and 7 did not provide transaction-level cost data, and therefore are not included in any
of the cost analyses, although they are included in all models of claim frequency.
27
companies, after all observations from 1-2 randomly-chosen firms have been dropped
from the dataset.
Finally, I explore the possibility that for some unknown reason (such as selection
bias or model misspecification), any apparent effect of nonsubscription on costs per
worker hour is a statistical artifact. Following Donohue and Ho (2007), I employ a
procedure called “randomization inference” to assess the likelihood of model
misspecification or sampling error.
Conducting all of these robustness checks enables me to assess how much
confidence can justifiably be placed in the findings of my first research question. For the
benefit of the interested reader, I also re-estimate the models from my first research
question for each study participant individually.
Second Research Question. The next stage of the analysis breaks down the
relationship between nonsubscription and claim cost/frequency by injury type. If
nonsubscription discourages workers from filing claims and/or utilizing benefits, and
likewise encourages employers to aggressively screen claims and/or terminate benefits,
one would expect some injuries to be more responsive than others to the opt-out choice.
In particular, injuries that are easy for employees to feign or for employers to deny – such
as those whose cause, severity and work-relatedness are difficult to prove – should
respond the most. Prior scholarship has identified strains and sprains, and sometimes non-
traumatic injuries in general, as meeting the latter criteria (Butler et al., 1996). Therefore,
I estimated models to assess cost per worker hour, cost per claim, and claim frequency
separately for “strains and sprains” (versus all other injuries) and again for traumatic

28
(versus non-traumatic) injuries. I also estimated these models on four different
subsamples that make even finer-grained distinctions between injury types.33 Although
these approaches all revealed similar patterns, the traumatic/non-traumatic distinction
was the most informative. My second research question, therefore, compares trends
between traumatic and non-traumatic injuries. 34
Any observed hyper-responsiveness of non-traumatic injuries to the opt-out
choice could be attributed to two different factors. First, as noted earlier, private plans
categorically exclude some injuries, most of which are non-traumatic, from the scope of
coverage. Second, private plans contain many discretionary provisions that
nonsubscribers may use to deny claims or terminate benefits, and that may deter
employees from filing claims in the first place. My focus is on the latter causal pathway,
which implies that even non-traumatic claims that are theoretically compensable may be
denied (or not filed) more often than other claims. Thus before estimating the models
pertaining to my second research question, I drop from the dataset any workers’
compensation claims that would have been excluded by the same firm’s voluntary plan.
This procedure mimics a scenario in which such injuries are not compensable under
either regime, limiting the comparison to non-traumatic injuries that are theoretically
compensable under both regimes.
33 See Morantz (2017) and the companion website for a detailed explanation of the injury classification
scheme.
34 See Part 5: Injury Type Analyses on the companion website for results of other injury schemes.
29
I estimate three different models to undertake these comparisons. First, I examine
the average marginal effect of nonsubscription on the percentage of total costs per
worker hour that arise from non-traumatic injuries. I follow Papke and Wooldridge
(1996) in using the following fractional logit model implemented with a GLM, specified
with a binomial family and a logit link function:
logit(𝔼[𝒀]) = 𝑿𝛽, 𝒀 ~ 𝐵𝑖𝑛(𝑛, 𝑝)
(4)
In these models, 𝒀 represents the proportion of costs per worker-hour (re-run
separately for each cost type) due to non-traumatic injuries (as of one year from the date
of injury), per facility-quarter. The design matrix (X) includes the nonsubscription
indicator, state, company, and quarter dummies, total hours worked per facility-quarter,
and total costs per hour per facility-quarter. Errors are clustered on the facility.
Second, I use a GLM specified with the gamma family and a log link, as detailed
in Equation (3), to test whether nonsubscription lowers cost per non-traumatic claim
more than it lowers cost per traumatic claim. In this context, 𝒀 represents costs per claim
as of one year from the date of injury, and 𝑿 is the design matrix including the
nonsubscription indicator, a non-traumatic injury indicator, an interaction term between
the non-traumatic and nonsubscription indicators, WCRI cost benchmarks, and state,
company, and quarter dummies. In these models, the covariate of interest is the
interaction between the non-traumatic injury and the nonsubscription indicators. Errors
are clustered on facility.
Third, I use the same fractional logit model described in Equation (4) to estimate
the average marginal effect of nonsubscription on the percentage of all claims arising
30
from non-traumatic injuries. In this implementation, 𝒀 represents the proportion of
claims per facility-quarter due to non-traumatic injuries with positive-paid costs as of one
year from the date of injury. The design matrix 𝑿 includes the nonsubscription indicator,
total hours worked per facility-quarter, total number of injuries per facility-quarter, and
state, company, and quarter dummies. Errors are clustered on facility.
Third Research Question. My third research question explores whether one can
rule out the possibility that nonsubscription affects the true prevalence of workplace
injuries, as opposed to merely the likelihood that claims are filed and processed. For this
portion of the analysis, I restrict the sample to injuries that are both severe and traumatic,
generally regarded as the least susceptible to over-claiming. As defined here, this
category includes amputations, concussions, fractures, brain damage, and enucleations. I
use the negative binomial model presented in Equation (1) to test whether these injuries
fall significantly with nonsubscription. Here, 𝒀 represents the number of claims per
facility quarter due to severe, traumatic injuries with positive paid costs per cost type as
of one year from the date of injury. All other aspects of Equation (1), namely 𝑿 and 𝑻,
are the same as those previously defined. If these injuries do not decline significantly
with nonsubscription, this would cast doubt on the likelihood of any safety effect. Yet a
significant fall could be explained, at least in part, by cross-regime differences in claim
screening, underreporting, and/or cost shifting to group health.
Fourth Research Question. Finally, I aim to tease out the likelihood that four
highly-publicized features of nonsubscription explain the lion’s share of any observed
cost savings. The value to firms of excluding many diseases and non-traumatic injuries

31
from coverage is self-evident, and the cost impact of permanent partial disability
coverage, chiropractic care and unfettered choice over medical providers has likewise
figured prominently in policy debates. One might expect the elimination of these
programmatic benefits to yield substantial savings. Yet because nonsubscribers bundle all
of them into their private plans, isolating their individual effects on total cost savings is
far from straightforward.
I use a unique exploratory technique in an effort to identify the cost impact of
these four salient plan characteristics. In effect, I try to retroactively “level the playing
field” by altering the dataset to retain only those cost components that are compensable
under both workers’ compensation and private plans. For example, I remove all
permanent partial disability and chiropractic payments from each workers’ compensation
claim. I likewise remove any costs that exceed benefit caps from each workers’
compensation claim. Finally, I remove all workers’ compensation claims that would be
categorically excluded by private plans. After the dataset is transformed in this way, I re-
estimate the cost per worker hour models from the analysis of my first research question
to see how much, if any, of the cost disparity remains. (The specification and all
covariates remain unchanged.) If the coefficient on the nonsubscription indicator in the
counterfactual models remains large and significant, I construe this as evidence that the
purged characteristic(s) likely explain(s) little of the observed variation in outcomes.
This procedure cannot account for two indirect effects of nonsubscription. First, it
cannot capture dynamic, long-term changes in the composition of benefits utilized. If
employees can no longer access certain benefits under private plans that would be

32
available under workers’ compensation, such as chiropractic care, they are likely to
increase their utilization of benefits that are covered by private plans, such as physical
therapy. Yet my inability to account for these cross-benefit substitution effects will, if
anything, tend to overstate the impact of eliminating any given programmatic benefit on
total cost savings, and in turn understate the residual impact of a private plan that is
captured by the nonsubscription indicator.
Second, and more subtly, the counterfactual models do not account for the
possibility that the mix of approved injury claims may shift with the opt-out choice. If the
composition of injury claims changes – and if, moreover, the four programmatic features
examined affect certain injury types more than others – this could also bias my estimates.
For example, if chiropractic care for low back injuries is extremely costly, and if the
proportion of approved claims for low back injuries falls with nonsubscription, then the
counterfactual model will overstate the impact of eliminating chiropractic coverage on
costs per worker hour. The direction of any such bias will depend on changes in both the
injury mix and the composition of costs for each injury type. If the frequency of approved
claims for non-traumatic injuries were to decline with nonsubscription – and if,
moreover, the four programmatic features examined were to comprise a
disproportionately large share of costs for non-traumatic injuries – then treating the
frequency of non-traumatic claims as fixed would overestimate the cost savings
associated with the elimination of these four plan features.
Private plans contain two other unique features that could give rise to significant
cost savings. First, as noted earlier, every study participant retained control over the pool
33
of medical providers, and many described this feature as an integral component of their
cost containment strategy. Second, the private plans universally impose a 24-hour or end-
of-shift reporting window, in contrast to the thirty-day window applicable to Texas
workers’ compensation claims. Although there are myriad reasons to hypothesize that
both limited provider choice and short reporting windows affect claim frequency and cost
per claim, there is no easy way to identify their respective effects. Because I cannot purge
the datasets of their influence, counterfactual models could not be estimated.
Yet because both features vary considerably across states, I try an alternative
approach. I assemble a dataset indicating, for each state and year, whether the workers’
compensation system limited an employee’s choice of medical provider, and the length of
the statutory reporting window. I then add these as covariates to the cost-per-worker-hour
models from my first research question to ascertain what remaining impact, if any,
nonsubscription exerts on cost per worker hour.
VI. Results
First Research Question. First, I investigate the relationship between
nonsubscription and claim frequency, total costs per worker hour, and costs per claim.
Mean values for these outcomes are displayed in Table C.35 Claim frequency falls across
the board with nonsubscription in the all-company sample. Yet in the panel-company
sample, the frequency of paid claims only falls among claims with wage-replacement and
35 An alternative method of computing descriptive statistics is presented in Part 2: Specification Robustness
Checks on the companion website.
34
legal costs, whereas the frequency of medical-only claims rises. Employers’ average paid
costs per worker hour and costs per claim are all lower in the nonsubscription
environment, especially among wage-replacement claims. This quick glimpse at the raw
data suggests that there are indeed important differences between the workers’
compensation and nonsubscription regimes.36 These differences are especially
pronounced for wage-replacement costs per claim, which is striking in light of the
literature, cited earlier, concluding that even workers’ compensation benefits do not
adequately compensate workers for post-injury wage loss.
Table 1 more formally probes the effect of nonsubscription on cost per worker-
hour. The upper section of the table displays the coefficient estimates for the panel-
company sample, upon which I focus the ensuing discussion, and the bottom section
presents results for the whole sample. Because nonsubscription significantly affects the
extensive margin in all panel-company models, the predicted statistics are constructed
using the results from the probit and GLM.
The results displayed in Table 1 are robust and dramatic. Total predicted cost per
worker-hour plummets 44%, from about 14¢ per worker-hour under workers’
compensation to about 8¢ per worker-hour under nonsubscription. This trend is partly
driven by a highly significant decline in predicted wage-replacement costs, which fall by
about 74% and reduce employers’ costs by about 2¢ per worker hour. The percentage
decline in medical costs is only 28%, but medical care comprises a larger share of total
36 See Section 8: Additional Descriptive Graphs of Employer Costs per Claim by Percentile on the
companion website.

35
costs, so the predicted net savings in medical costs is also roughly 2¢ per worker hour.
Legal costs – which, importantly, include all tort judgments – fall by 84%. However,
their effect on the participants’ bottom lines is relatively trivial.37
Table 2 explores whether the latter trends are driven in part by a fall in cost per
claim. The answer is a resounding yes. Nonsubscription nearly halves total cost per
claim, saving employers about $1900 per claim. Although wage replacement costs fall
more than medical costs in percentage terms (76% versus 35%), the predicted decline in
medical costs is larger in absolute terms ($836 versus $706). The percentage drop in legal
costs is the largest of all (95%), but saves employers only $166 per claim.
Table 3 investigates changes in paid claim frequency per facility-quarter.
Although claim frequency does not decline overall in the panel sample, more serious
claims involving wage replacement costs fall by 33%. Claims with legal costs also fall by
about 52%, yet are very rare in both regimes. Meanwhile, claims with medical costs
increase in the panel sample by 5%.
The simultaneous increase in all claims with medical costs and decrease in the
subset of serious claims that involve some loss of work is intriguing, raising the
possibility that some injuries that would accrue wage-replacement costs under workers’
compensation incur only medical costs under private plans. To investigate this
possibility, I explored whether the estimated rise in the number of claims that only
incurred medical costs approximated the estimated decrease in the number of claims
37 The omission of WCRI benchmarks only slightly alters coefficient estimates.

36
incurring both medical and wage-replacement costs. My analysis lends credence to this
hypothesis: the predicted increase in the number of medical-only claims (384) closely
resembles the predicted fall in wage-replacement claims (355).38
Overall, the inquiry pertraining to my first research question confirms the
hypothesis that nonsubscription dramatically reduces the cost to employers of workplace
injuries. The companion website summarizes in detail the robustness checks and
falsification tests performed. The results are broadly reassuring, suggesting that thedr
findings are very unlikely to be statistical artifacts.
Second Research Question. Next, I test whether non-traumatic injuries respond
disproportionately to the opt-out choice. If so, this might suggest that nonsubscribers are
using the discretionary exclusions displayed in Table A to aggressively screen out claims
and terminate benefits, or perhaps are especially adept at expediting claim resolution and
return to work for non-traumatic injuries. It could also reflect, at least in part, employees’
lessened willingness to file claims and/or to utilize benefits in the nonsubscription
environment.
As is shown in Table 4, nonsubscription significantly depresses (by about 10%)
the share of total cost per worker hour arising from non-traumatic injuries. The
interaction term in Table 5 likewise reveals that nonsubscription depresses total cost per
claim about 35% more among non-traumatic injury claims than among traumatic injury
claims. Finally, Table 6 indicates that nonsubscription significantly lowers, by more than
38 See Section 9: Testing Wage-Replacement Claim Migration Pertaining to Table 3 on the companion
website.
37
7%, the proportion of claims that arise from non-traumatic injuries. Adding categorically-
excluded injuries back into the dataset and re-running the analysis has little effect on the
coefficient estimates.39
The disparate trends observed for traumatic and non-traumatic injuries are
consistent with a story in which nonsubscription exacerbates incentive effects for
employers and/or employees. I cannot determine, however, which specific form(s) of
incentive effects empirically predominate.
Third Research Question. Third, I examine the frequency of severe, traumatic
injury claims. As discussed earlier, the absence of any decline in frequency would cast
doubt on the possibility of any safety effect. As is revealed in Table 7, however, these
claims do fall significantly with nonsubscription, and the magnitude of the predicted
decline – about 47% for total claims and 59% for claims with positive wage-replacement
costs – is substantial.
It is possible that the specter of tort liability incentivizes nonsubscribers to invest
more in safety-enhancing practices and technologies. Yet such a strong behavioral effect
would be counter-intuitive for several reasons. First, as shown in Table 1, legal costs
constitute a trivial proportion of cost per worker hour in both regimes, and these costs
actually fall with nonsubscription notwithstanding firms’ newfound liability to tort
39 See Section 1: Sample Robustness Checks on the companion website.

38
claims.40 Second, the homogeneity of facility-level operations and centralized corporate
control over safety practices would make it difficult, in practice, for firms to implement
safety improvements exclusively at their Texas facilities. Third, when asked if they
adopted any new safety-related practices or technologies in Texas around the same time
they opted out, the study participants’ risk managers denied having done so.
Several other programmatic factors could help explain this finding. Employees
that sustain severe, traumatic injuries may be more sensitive to the benefits caps, limited
provider choice, and weakened anti-retaliation protection that private plans entail,
incentivizing them to seek coverage through group health instead. The discretionary
exclusions described in Table A could also be used to deny coverage to severe, traumatic
claims. Without further information, it is difficult to know what may be causing the
observed decline.
Fourth Research Question. Finally, I consider whether four salient attributes that
distinguish private plans from workers’ compensation – non-coverage of permanent
partial disabilities, caps on total benefits, lack of chiropractic care, and categorical
exclusion of many diseases and non-traumatic injuries – could explain the trends
observed. Table 8 displays the total cost coefficients from the original models (in Table
40 A decision by the Texas Supreme Court in 2015 may further circumscribe nonsubscribers’ exposure to
tort claims. Under Austin v. Kroger Texas, 58 Tex. 1154, 465 S.W.3d 193 (2015), “an employee generally
cannot ‘recover against a nonsubscribing employer for an injury caused by a premises defect of which he
was fully aware but that his job duties required him to remedy.’”
39
1) beside the estimates from the counterfactual models. The results suggest that even in
combination, the four plan features examined account for little of the estimated cost
savings: even with all four factors accounted for, nonsubscription is still predicted to
lower total cost per worker hour by more than 35%.41
Finally, I probed the importance of limited provider choice and 24-hour reporting
windows. Given the impossibility of constructing counterfactual models for these two
features, I constructed variables reflecting cross-state and cross-year variation, hoping to
add them as covariates in the models pertaining to my first research question. Yet this
strategy proved fruitless. Although both variables vary widely across states, they do not
vary over time, and their effect is subsumed by the state dummies.42 Thus I was unable to
test the study participants’ claim that limited provider choice and short reporting
windows43 were key cost drivers.
VII. Discussion
41 Because the four programmatic features examined comprise a disproportionately large share of costs for
non-traumatic injuries (32% of non-traumatic injury claim costs as compared to 26%) – and the share of
non-traumatic injuries declines with nonsubscription – the counterfactual results likely overestimate the
cost savings association with these four plan features.
42 I tried several methods for overcoming the collinearity problem. See Section: 7. Limited Initial Medical
Provider Choice and Reporting Window Analysis on the companion website.
43 However, I was able to assess the relationship between lag time and claim cost in my dataset. See Section
6: Lag Time Analysis on the companion website.

40
Although participation in the workers’ compensation system is compulsory for
virtually all private-sector employers, Texas’s unique law offers a valuable opportunity to
explore the path not taken. About one-third of Texas firms have opted out of the workers’
compensation system, and the prevalence of nonsubscription has grown rapidly among
the nation’s largest employers. Recent developments suggest that the opt-out model has
captured the imagination (and the lobbying budget) of Corporate America (Berkes, 2016;
Goldberg, 2016).
To understand why many large employers are relinquishing the benefits of tort
immunity, I examine highly granular data from fifteen large, multistate nonsubscribers.
All of these firms opted out between 1998 and 2010, and all offered private occupational
injury insurance to their Texas employees. My analysis probes four different aspects of
the opt-out phenomenon.
First, I find that total paid costs per worker hour are about 44% lower in the opt-
out environment. Although the fall in wage-replacement costs is larger in percentage
terms, the fall in medical costs is equally consequential because of the outsized impact of
medical expenses on total costs. The cost savings are driven by a 33% decline in the
frequency of wage-replacement claims, and a 49% drop in cost per claim. The decline in
wage-replacement costs is especially noteworthy in light of prior work finding that even
workers’ compensation does not adequately compensate workers for the wage loss that
results from on-the-job injuries.
Second, I show that paid claims for non-traumatic injuries respond more to the
opt-out choice than paid claims for traumatic injuries, even after accounting for the fact
41
that most private plans exclude some non-traumatic injuries and occupational diseases
from the scope of coverage. This finding is consistent with employer incentive effects,
including more aggressive claim screening and termination of benefits under private
plans. It is also consistent with employee incentive effects such as a reduction in the
number of non-traumatic claims filed.
Third, I uncover a sizable and statistically significant decline in the severe,
traumatic injury claims, which are generally presumed to be the least prone to under- and
over-claiming. Although this decline is consistent with an improvement in safety, several
practical considerations – including the fact that the cost to employers declined under
private plans – seem to argue against this possibility. Alternative explanations include a
greater willingness on the part of workers to seek medical care through group health
instead of filing insurance claims, and a greater capacity on the part of employers (or
their agents) to use discretionary exclusions or preemptive termination to screen out
potential claims.
Finally, exploratory analysis suggests that four ubiquitous private plan features –
capped benefits, exclusion of permanent partial disabilities, lack of coverage for
chiropractic care, and exclusion of some non-traumatic injuries and diseases – explain
little of the observed cost savings. I am unable to test the effect of two other salient
programmatic features – limited provider choice and 24-hour reporting windows – that
many participants identified as major cost drivers.
My findings point toward several promising areas of future research. First and
foremost, more research is needed to understand nonsubscription’s impact on worker

42
welfare. It is an open question whether the opt-out choice is, or least has the potential to
become, a Pareto improvement whose benefits accrue to both employers and employees,
or whether it merely redistributes economic surplus from employees (and taxpayers) to
employers. Second, it is important to determine whether the costs of treating and
compensating many workplace injuries and illnesses, especially those that are not
covered by private plans, are being shifted onto other compensation systems, such as
Medicare. Third, it is important to identify which specific characteristics of private plans
are producing the bulk of cost savings, and why. Finally, it is vital to understand the
behavior of small- and medium-sized employers, some of whom opt to provide their
workers with no occupational injury insurance at all.
43
References
Altman, Leslie M., John M. Cerilli, Eduardo “Jim” Cuaderes Jr., Natalie C. Gros, Harry
D. Jones, Bonnie L. Kristan, Patrick H. Lewis, Eugene Ryu, Michael N. Salveson, Michael T.
Short, and Kimberly A. Zabroski. 2012. “Littler’s Workers’ Compensation Retaliation Survey.”
April 2012. Available at: http://www.littler.com/files/WorkersComp_RetaliationSurvey_4-3-
12.pdf (accessed April 6, 2016).
Baker, Laurence C., and Alan B. Krueger. 1993. “Twenty-Four-Hour Coverage and
Workers’ Compensation Insurance,” 12 Health Affairs 271-281.
Berkes, Howard. 2016. “Oklahoma Commission Declares Workers’ Comp Alternative
Unconstitutional.” NPR, February 29, 2016. Available at: http://www.npr.org/sections/thetwo-
way/2016/02/29/468611034/oklahoma-commission-declares-workers-comp-alternative-
unconstitutional (accessed April 6, 2016).
Biddle, Jeff, and Karen Roberts. 2003. “Claiming Behavior in Workers’ Compensation,”
70 Journal of Risk and Insurance 759-80.
Boden, Leslie and Alexander Ozonoff. 2008. “Capture-Recapture Estimates of Nonfatal
Workplace Injuries and Illnesses,” 18 Annals of Epidemiology 500-506.
Boden, Leslie I. and John W. Ruser. 2003. “Workers’ Compensation ‘Reforms,’ Choice
of Medical Care Provider, and Reported Workplace Injuries,” 84 Review of Economics and
Statistics 923-929.
Bolduc, Denis, Bernard Fortin, France Labrecque, and Paul Lanoie. 2002. “Workers’
Compensation, Moral Hazard, and the Composition of Workplace Injuries,” 37 Journal of Human
Resources 623-652.

44
Buntin, Melinda B., and Alan M. Zaslavsky. 2004. “Too Much Ado about Two-Part
Models and Transformation? Comparing Methods of Modeling Medicare Expenditures,” 23
Journal of Health Economics 525-542.
Butler, Richard J. 1996. “Lost Injury Days: Moral Hazard Differences between Tort and
Workers’ Compensation,” 63 Journal of Risk and Insurance 405-433.
Butler, Richard J., David L. Durbin, and Nurham Helvacian. 1996. “Increasing Claims
for Soft Tissue Injuries in Workers’ Compensation: Cost Shifting and Moral Hazard,” 13 Journal
of Risk Uncertainty 73-87.
Butler, Richard J., and John D. Worrall. 1991. “Claims Reporting and Risk Bearing
Moral Hazard in Workers’ Compensation,” 58 Journal of Risk and Insurance 191-204.
Chelius, James R. 1982. “The Influence of Workers’ Compensation on Safety
Incentives,” 35 Industrial and Labor Relations Review 235-242.
Duan, Naihua. 1983. “Smearing Estimate: A Nonparametric Retransformation Method,”
78 Journal of the American Statistical Association 605-610.
Finkelstein, Amy. 2007. “The Aggregate Effects of Health Insurance: Evidence from the
Introduction of Medicare,” 122 The Quarterly Journal of Economics 1-37.
Fields, Joseph A., and Emilio C. Venezian. 1991. “Medical Cost Development in
Workers’ Compensation,” 58 Journal of Risk and Insurance 497-504.
Fishback, Price V. 1987. “Liability Rules and Accident Prevention in the Workplace:
Empirical Evidence from the Early Twentieth Century,” 16 Journal of Legal Studies 305-328.
Fishback, Price V., and Shawn E. Kantor. 1998. “The Adoption of Workers’
Compensation in the United States, 1900-1930,” 41 Journal of Law and Economics 305-341.
Flynn, Meagan. 2016. “Don’t Fall Down on the Job in Texas: Employers Don’t Have to
Provide Injury Coverage.” Houston Press, February 2, 2016. Available at:

45
http://www.houstonpress.com/news/don-t-fall-down-on-the-job-in-texas-employers-don-t-have-
to-provide-injury-coverage-8120319 (accessed April 6, 2016).
Goldberg, Stephanie. 2016. “Opt-out Bills Put on Hold in Two States.” Business
Insurance, February 14, 2016. Available at:
http://www.businessinsurance.com/article/20160214/NEWS08/160219898/opt-out-bills-put-on-
hold-in-two-states?tags=%7C92%7C304 (accessed July 11, 2016).
Grabell, Michael, and Howard Berkes. 2015. “Inside Corporate America’s Campaign to
Ditch Workers’ Comp.” ProPublica, October 12, 2015. Available at:
https://www.propublica.org/article/inside-corporate-americas-plan-to-ditch-workers-comp
(accessed April 6, 2016).
Hunt, Allen H. 2004. “Benefit Adequacy in State Workers’ Compensation Programs,” 65
Social Security Bulletin-Washington 24.
International Association of Industrial Accident Boards and Commissions. 2016.
“IAIABC Forward: Understanding the Opt-Out Alternative.” Available at:
https://www.iaiabc.org/images/iaiabc/Resources/Understanding-the-Opt-Out-Alternative_05-11-
2016_Final.pdf (accessed April 6, 2016).
International Association of Industrial Accident Boards and Commissions and the
Workers Compensation Research Institute. 2009. Workers’ Compensation Laws, 2nd Edition.
Kaestner, Robert, and Anne Carroll, 1997. “New Estimates of the Labor Market Effects
of Workers' Compensation Insurance,” 63 Southern Economic Journal 635-651.
Kniesner, Thomas J., and John D. Leeth. 1988. “Simulating Hedonic Labor Market
Models: Computational Issues and Policy Applications,” 29 International Economic Review 755-
789.

46
Krueger, Alan B. 1990. "Incentive Effects of Workers’ Compensation Insurance,” 41
Journal of Public Economics 73-99.
Krueger, Alan B., and John F. Burton. 1990. “The Employers’ Costs of Workers’
Compensation Insurance: Magnitudes, Determinants, and Public Policy,” 72 Review of
Economics and Statistics 228-240.
Mahmoudi, Elham, and Gail A. Jensen. 2014. “Has Medicare Part D Reduced
Racial/Ethnic Disparities in Prescription Drug Use and Spending?” 49 Health Services Research
502-525.
Manning, Williard, and John Mullahy. 2001. “Estimating Log Models: To Transform or
Not to Transform?” 20 Journal of Health Economics 461-494.
Moore, Michael J., and W. Kip Viscusi. 1992. “Social Insurance in Market Contexts:
Implications of the Structure of Workers’ Compensation for Job Safety and Wages,” in Georges
Dionne, ed., Insurance Economics. Boston, MA: Kluwer Academic Publishers.
Morantz, Alison D. 2017. “Filing Not Found: The Underreporting of Injuries to Worker
Protection Agencies.” Unpublished manuscript, Stanford Law School.
Morantz, Alison D. 2011. "Opting Out of Workers’ Compensation in Texas: A Survey of
Large, Multistate Nonsubscribers," in Daniel Kessler, ed., Regulation vs. Litigation: Perspectives
from Economics and Law. Chicago, IL: University of Chicago Press.
National Council on Compensation Insurance. 2008. Annual Statistical Bulletin.
Neumark, David, Peter S. Barth, and Richard A. Victor. 2007. “The Impact of Provider
Choice on Workers’ Compensation Costs and Outcome,” 61 Industrial Labor Relations Review
121-142.

47
Office of Injured Employee Counsel of the State of Texas. 2016. “Notice of Injured
Employee Rights and Responsibilities in the Texas Workers’ Compensation System.” Available
at: http://www.oiec.texas.gov/documents/ierightsrespeng.pdf (accessed April 6, 2016).
Papke, Leslie E., and Jeffrey M. Wooldridge. 1996. “Econometric Methods for Fractional
Response Variables with an Application to 401 (K) Plan Participation Rates,” 11 Journal of
Applied Econometrics 619-632.
Reville, Robert T., Suzanne Polich, Seth Seabury, and Elizabeth Giddens. 2001.
“Permanent Disability at Private, Self-Insured Firms: A Study of Earnings Loss, Replacement and
Return to Work for Workers’ Compensation Claimants.” RAND Institute for Civil Justice.
Robinson, Thomas A. 2015. “Will 2016 Be the Year Opt-Out Legislation Catches Fire?”
November 4, 2015. Available at: https://www.lexisnexis.com/legalnewsroom/workers-
compensation/b/recent-cases-news-trends-developments/archive/2015/11/04/workers-
compensation-emerging-issues-will-2016-be-the-year-opt-out-legislation-catches-fire.aspx
(accessed April 6, 2016).
Rousmaniere, Peter. 2012. “Worker’s Compensation Opt-Out: Can Privatization Work?”
Sedgwick. Available at: https://www.sedgwick.com/NewsRelease/WCOpt-OutStudy.pdf
(accessed April 6, 2016).
Rousmaniere, Peter. 2015. "Opt-Out: A Painful Reassessment.” November 23, 2015.
Available at:
https://www.workcompcentral.com/columns/show/id/ea3c7f0a9b525b9be4eb8c32507ea402a4ba5
df5 (accessed April 6, 2016).
Rousmaniere, Peter, and Jack Roberts. 2013. “What Employers Need to Know About the
New Oklahoma Law.” Available at:
https://www.sedgwick.com/news/Documents/Oklahoma%20Option.pdf (accessed April 6, 2016).

48
Ruser, John W. 1991. “Workers’ Compensation and Occupational Injuries and Illnesses,”
9 Journal of Labor Economics 325-350.
Sengupta, Ishita, Virginia Reno, and John F. Burton. 2009. “Workers’ Compensation:
Benefits, Coverage, and Costs, 2007.” August 2009. Available at:
https://www.nasi.org/sites/default/files/research/Workers_Comp_Report_2007.pdf (accessed
April 6, 2016).
Shields, Joseph, and D. C. Campbell. 2002. “A Study of Nonsubscription to the Texas
Workers’ Compensation System: 2001 Estimates.” February 2002. Available at:
http://www.tdi.texas.gov/reports/wcreg/2001nonsub.html (accessed April 6, 2016).
Texas Department of Insurance Workers’ Compensation Research and Evaluation Group.
2012. “Employer Participation in the Texas Workers’ Compensation System: 2012 Estimates.”
Available at: http://www.tdi.texas.gov/reports/wcreg/documents/2012_Nonsub.pdf (accessed
April 6, 2016).
Texas Department of Insurance Workers’ Compensation Research and Evaluation Group.
2014. “Employer Participation in the Texas Workers’ Compensation System: 2014 Estimates.”
Available at: http://www.tdi.texas.gov/reports/wcreg/documents/nonsub.pdf (accessed April 6,
2016).
Viscusi, Kip W., and Michael J. Moore. 1987. “Workers’ Compensation: Wage Effects,
Benefit Inadequacies, and the Value of Health Losses,” 69 Review of Economics and Statistics
249-261.
Wooldridge, Jeffrey. 2010. Econometric Analysis of Cross Sectional and Panel Data. 2nd
ed. Cambridge, MA: The MIT Press.
Worrall, John D., and David Appel. 1982. “The Wage Replacement Rate and Benefit
Utilization in Workers’ Compensation Insurance,” 49 Journal of Risk and Insurance 361-371.

49
Worrall, John D., and Richard J. Butler. 1985. “Benefits and Claim Duration,” in
Workers’ Compensation Benefits: Adequacy, Equity, and Efficiency, John D. Worrall and Richard
J. Butler, eds. Cornell, NY: ILR Press.

Table A: Description of Nonsubscription Plans
TEXAS WC NONSUB
PLAN TYPEStatutory Yes NoneERISA No All
REPORTING DEADLINE30 days Yes None24 hours No 8/15 FirmsEnd of shift No 7/15 Firmsa
CAP ON TOTAL BENEFITS No 14/15 Firms (Max=$500K/Min=$150K/Median=$225K)
MEDICAL BENEFITS100% reimbursement rate Yes AllMaximum dollar amount No 1/15 Firms ($300K)Coverage for chiropractic care Yes NoneMaximum number of weeks No 13/15 Firms (Max=120/Min=104/Median=120)
MEDICAL PROVIDEREmployee has choice of medical provider Yesb None
DISPUTE RESOLUTION PROCESSMandatory arbitration of tort claims No 14/15 FirmsFinal compromise & settlement provision No 12/15 FirmsOther Yesc 1/15 Firmsd
DISABILITY BENEFITSWaiting period (number of days) 7e NoneMaximum number of weeks 401f 15/15 Firms (Max=520/Min=52/Median=120)Maximum weekly dollar amount 773g 4/15 Firms (Max=$1000/Min=$600/Median=$800)% of average weekly wage (AWW) 70-75%h Max=100%/Min=70%/Median=85%Permanent partial disability benefits 70%i None
DISMEMBERMENT BENEFITS 70-75%j 14/15 Firms (Max=$500K/Min=$100K/Median=$150K)
DEATH BENEFITSCap on death benefits 75%k 14/15 Firms (Max=$500K/Min=$100K/Median=$150K)Multiple of annual pay, if applicable No 4/15 Firms (Max=10x/Min=6x/Median=8.25x)
a Although several companies’ plans include an end-of-shift reporting deadline, several company officials suggested that in practice, they donot enforce them strictly, but instead enforce a 24-hour reporting window.b Unless the employer is a member of a Workers’ Compensation medical network (Texas Labor Code $408.031).c The employee must submit to a benefits review conference, followed by arbitration. The employee can opt for a contested case hearingin lieu of arbitration. If desired, appeals and requests for judicial review can be filed with the Appeals Panel and the State County Court,respectively (Texas Labor Code $410).d Dispute resolution procedures are not enumerated in one plan.e First week of benefits are paid retroactively if the disability lasts longer than 14 days. The retroactive period was shortened from 28 daysto 14 days effective September 1, 2005 (Texas Labor Code §408.082, Texas Insurance Code chapter 1305).f Under Texas workers’ compensation, employees that earn less than $8.50/hour receive wage replacement benefits at a rate of 75% of lostwages for the first 26 weeks of disability and 70% of lost wages thereafter (untaxed). All other employees receive wage replacement at 70%of lost wages (Texas Labor Code §408.103). Although in theory the wage replacement rate is 70-75%, the proportion may be much lower forhigher-income workers, because the weekly benefit level is capped at the State Average Weekly Wage (SAWW) (Texas Labor Code $408.061).However, workers’ compensation benefits are untaxed, whereas nonsubscription benefits are taxed.g Claimants are eligible to receive up to 104 weeks of wage replacement benefits for a temporary disability. At 104 weeks, maximum medicalimprovement (MMI) is established, and the claimant will receive 3 weeks of permanent income benefits for each percentage of impairment, upto a maximum of 401 weeks (Texas Labor Code $408.121-129).h The max weekly income benefit is set annually at 100% of the State Average Weekly Wage (Texas Labor Code $408.061). In 2006, themethod for calculating the SAWW was revised, resulting in an increase in the max weekly benefit, so that fewer workers are constrained by thestatutory cap. See Eccleston, Stacey M., Evelina Radeva, Carol A. Telles, Rui Yang, and Ramona P. Tanabe. 2009. Monitoring the impactof reforms in Texas: CompScope benchmarks. 9th edition. Cambridge, MA: Workers Compensation Research Institute.i 70% AWW, up to $541 for 297 weeks.j 70-75% of AWW. For a single dismemberment, the claimant can receive permanent partial disability benefits (70% AWW for up to 297weeks, subject to maximum of 70% of the SAWW) (Texas Labor Code §408.121-129). For multiple dismemberments, the claimant can receivepermanent total disability benefits (75% of AWW for life, with an increase of 3% per year, subject to a maximum of 100% of the SAWW)(Texas Labor Code §408.161-162).k 75% of pre-injury pay.

Table A: (continued) Description of Nonsubscription Plans
PROVISION TEXAS WC NONSUB
# Companies withProvision (out of 15)
PROTECTION FROM RETALIATORY DISCHARGE Statutory ERISA section 510a
CATEGORICAL EXCLUSIONS FROM COVERAGE:b None
• Hernias, unless such hernia is inguinal and did not exist in any degree prior to the injury - 10• Diseases or harm resulting from airborne contaminants not commonly found in company’s - 14working environment, such as pollen, fungi, or mold• Any damage or harm arising out of the use of or caused by asbestos, or asbestos fibers or products - 12• Any cumulative trauma, unless employee has worked >180 days of continuous, active employment - 12• Degeneration that could be result of poor posture/long-term use of a keyboard or cell phone, such - 11as carpal tunnel syndrome• Diagnostic labels that imply generalized musculoskeletal aches & pains such as fibrositis, - 11fibromyalgia, myositis, chronic fatigue syndrome, etc. - 11
DISCRETIONARY GROUNDS FOR EXCLUSION FROM COVERAGE:c None
• Injury was not reported within 24 hours and Claim Administrator does not determine good cause - 8exists for failure to give timely notice• Injury was not reported within 24 hours (whether or not there was good cause for late reporting) - 1• Injury was not reported by end of shift and Claim Administrator does not determine good cause - 5exists for failure to give timely notice• Injury was not reported by end of shift (whether or not there was good cause for late reporting) - 1• Injury was caused by an “accident” that did not “occur by chance” and/or “from unknown causes” - 11• Failure to comply with safety policies or request assistance was a proximate cause of injury - 2• Injury arose out of an act of a third person because of “personal reasons” and not directed at the - 13participant as an employee of, or because of his or her employment by, the employer• “Scuffling,” horseplay, or similar inappropriate behavior was a proximate cause of injury - 14
DISCRETIONARY GROUNDS FOR SUSPENSION/TERMINATION OF BENEFITS:d None
• Failure to accept final compromise & settlement provision - 12• Termination for gross misconduct - 15• Termination for reason other than lay-off (lose wage-replacement benefits only) - 12• Termination for any reason besides gross misconduct (lose wage-replacement benefits only) - 1• Refusal to submit to drug or alcohol test - 13• Failure to get prior approval for all medical, non-emergency care - 10• Use of non-approved physician or facility for non-emergency care - 13• Refusal to submit to an exam if the Claim Administrator requests a second opinion - 11• Persistent nonresponsiveness to treatment, including nonresponsiveness due to the need for - 14behavioral modification recommended by the treating physician• Failure to provide accurate information to, or follow directions of, treating physician - 14• Failure/refusal to let employer representative accompany claimant to doctor’s appointment - 14• Missing or arriving late to a scheduled appointment (first missed appointment results in warning) - 14• Engaging in injurious practice(s) that hinders recovery from injury - 14• Failure to periodically report to team leader and/or supervisor as directed - 14• Failure to immediately notify team leader and/or supervisor if cleared for work - 14• Receipt of any benefits under any workers’ compensation law - 13• Untruthfulness regarding any required information in employment or injury reporting process - 14• Untruthfulness to or failure to cooperate with the Claims Administrator - 14• Failure or refusal to comply with any plan provision(s) or rule(s) or demonstration of bad faith - 14in connection with the administration of the plan
a See pages 11-12 for a discussion of ERISA.b Categorical exclusions from coverage are specific injury categories which nonsubscription plans explicitly identify as being excluded fromthe scope of coverage.c Discretionary grounds for exclusion from coverage refers to case-specific circumstances which can result in an injury not being covered, ifstrictly enforced by the company.d Discretionary grounds for suspension or termination of benefits are provisions which, if strictly enforced by firms, can trigger the terminationof benefits. If not otherwise specified then both medical and wage-replacement benefits can be terminated.

Table B: Major Characteristics of Study Participants
COMPANY NO. 1 2 3 4 5 6 7 8
Sector Retail Retail Retail Retail Retail Retail Retail RetailNumber of US states >40 >40 >40 >40 >40 >20 >20 >20Number of facilities nationwidea >500 >1000 >1000 >1000 >1000 >100 >100 >1000Number of facilities in Texas >50 >100 >100 >100 >100 >50 >50 >100Annual WC claims nationwide >1000 >1000 >15000 >1000 >1000 >1000 >500 >1000Annual claims in Texas (WC & NS) >100 >100 >1000 >100 >50 >500 >100 >500Group Health Insurance/Life Insurance for Employees FT/FT All/All All/All FT/FT FT/FT All/None FT/None All/Don’t KnowShort Term/Long Term Disability Coverage for Employees FT/FT All/FT All/All FT/FT FT/FT All/None FT/FT FT/FTWellness Program/In-House First-Aid Clinics no/no nob/no yes/yes yes/yes no/yes no/no no/yes yes/yesAny Union Facilities no no no no no no no yesYears of “pre-” data/Years of ”post-” data 0/10.40[3.33]c 7.16/2.33 5.09/5.25 4.66[2.33]c/2.25 0/8.80[4.75]c 5.49/5.83 5.92/4.24 0/6.67OSHA-recordable injury rate (relative quartile)d 2nd quartile above mean 4th quartile 4th quartile below mean 2nd quartile above mean 3rd quartile
COMPANY NO. 9 10e 11 12 13 14 15
Sector Retail Mfg. Mfg. Mfg. Services Services ServicesNumber of US states >10 >40 >20 >10 >20 >20 >5Number of facilities nationwidea >1000 >100 >15 >50 >100 >100 >15Number of facilities in Texas >100 >10 >10 >3 >10 >10 >5Annual WC claims nationwide >100 >1000 >100 >1000 >1000 >1000 >50Annual claims in Texas (WC & NS) >100 >100 >100 >100 >100 >100 >20Group Health Insurance/Life Insurance for Employees All/All FT/All All/All All/All All/All All/All All/AllShort Term/Long Term Disability Coverage for Employees All/All All/All All/All All/All All/All All/All All/AllWellness Program/In-House First-Aid Clinics no/no yes/yes yes/no no/yes no/yes no/yes no/noAny Union Facilities no yes yes no yes no noYears of “pre-” data/Years of ”post-” data 0/5.82 10.81/7.83 9.00[5.50]c/3.50 4.91[2.00]c/4.65 5.50[3.50]c/3.00 1.22/4.75 0/4.31OSHA-recordable injury rate (relative quartile)d below mean 2nd quartile 2nd quartile 2nd quartile 2nd quartile 2nd quartile 1st quartile
a Facilities counts include storage warehouses and distribution centers, but exclude corporate headquarters and branch offices. For Company 14, a facility represents an account that the company services.For Company 15, a facility represents a regional “terminal” to which many employees are assigned.b Company 2 began to implement several elements of a wellness program in 2007, but did not implement a single comprehensive program until after the study period. Less than 20% of claims fromcompany 2 included in the study post-date the implementation of these elementsc Number of years for cost analysis [frequency analysis].d Quartiles are relative to sub-industry. Companies in the 1st quartile have the lowest injury rates in their industries, companies in the 4th quartile have the highest injury rates in their industries. Forindustries with very low injury rates, quartiles are unavailable and the table reflects whether the injury rate was above or below the industry mean. Owing to the limits of the available data, it is onlypossible to compare the companies’ OSHA-recordable claim rates to the relevant sub-industry quartiles during the nonsubscription period. Accordingly, in order to capture the relative safety level of thecompanies in the workers’ compensation regime (as opposed to the nonsubscription regime), I restricted the calculation of this statistic to states other than Texas when possible. Quartile boundaries forsub-industries were obtained from the Bureau of Labor Statistics website (http://www.bls.gov/iif/oshsum.htm). The BLS data is stratified by establishment employment size, which is defined as averageemployment by location or average employment by state depending on the the survey administered by the BLS. In each case, I compared the company’s rates to those of companies within the sameestablishment employment size stratum, defined by the average number of full-time worker equivalents employed at each location (a full-time worker is defined as 2,000 hours worked per year). Quartilestatistics for 2009 were not available at the time of this writing.e Company 10 staggered the implementation of its voluntary plans across its Texas-based facilities.Company Characteristics: Company characteristics presented in the table represent characteristics during the years for which I include claims data from each company.Computation of Quartile Statistics: Companies 1, 10, 12, 13, 15 : the quartile statistic is based on all locations in 2008. Company 2 : the quartile statistic is based on a sample of 5 locations outsideof Texas in 2009 and OSHA-recordable injury rate quartile data from 2008. Company 3 : the quartile statistic is based on data from 2005; the company’s claim rate fell into the fourth quartile. The datanecessary to make the comparison between the company’s OSHA-recordable claim rate and the BLS sub-industry quartiles are available for that year only. Company 4 : the quartile statistic is based on alllocations from 1/1/2009 - 3/31/2009 and BLS data from 2008. Company 5 : the quartile statistic is based on a sample of locations in all states in 2009 and BLS data from 2008. Company 6 : the quartilestatistic is based on a sample of 9 locations outside of Texas in 2008 and 2009, and BLS data from 2008. Company 7 : the quartile statistic is based on a sample of 110 locations outside of Texas in 2007 and2008. Company 8 : the quartile statistic is based on data from 2002 - 2008 (the injury rate steadily decreased from 2003 - 2008, but stayed in the 3rd quartile). Company 9 : the quartile statistic is basedon all locations from 1/1/2009 - 3/18/2009 and BLS data from 2008. Company 11 : the quartile statistic is based on a sample of 3 locations outside of Texas in 2009 and BLS data from 2008. Company14 : the quartile statistic is based on all locations in 2009 and BLS data from 2008.Definition of FT: FT refers to full-time and salaried employees.

Table C: Descriptive Statistics
All Companies Panel CompaniesWC WC Nonsub WC WC Nonsubnon-TX TX TX non-TX TX TX
Total $0.132 $0.127 $0.109 $0.126 $0.127 $0.088Mean Employer Costs Wage-Rep. $0.034 $0.029 $0.007 $0.029 $0.029 $0.017per Worker-Hour Medical $0.083 $0.077 $0.087 $0.080 $0.077 $0.060
Legal $0.006 $0.003 $0.002 $0.006 $0.003 $0.006Total $3446.26 $4454.18 $2092.36 $3395.17 $4454.18 $2116.34
Mean Employer Costs Wage-Rep. $904.23 $1039.34 $267.66 $832.69 $1039.34 $263.01per Claim Medical $2177.88 $2838.75 $1637.94 $2176.23 $2838.75 $1702.73
Legal $132.65 $84.07 $26.52 $125.92 $84.07 $13.78Total 1.376 1.305 0.645 1.682 1.305 1.837
Mean Frequency Wage-Rep. 0.245 0.263 0.086 0.292 0.263 0.254of Claims Medical 1.324 1.256 0.625 1.615 1.256 1.778
Legal 0.078 0.062 0.011 0.093 0.062 0.047
Notes: To calculate the figures in the top row, I calculated, for each facility-quarter with nonzero hours, the mean inflation-adjusted costsper worker-hour for all claims with positive total costs paid as of twelve months from the date of injury. To calculate the figures in the middlerow, I calculated the mean inflation-adjusted costs per claim for all claims with positive costs in the first 12 months after the date of injury.The bottom row presents the average frequency of claims with positive costs (of each designated type) within the first 12 months per quarter.Only facility-quarters with nonzero hours worked are included in the sample.
Table 1: Effect of Nonsubscription on Employer Costs per Worker-Hour
Panel Companies Total Costs Wage-Rep. Costs Medical Costs Legal Costs
Nonsubscription Dummy [0.027***/0.518*** ] [-0.042***/0.373*** ] [0.027***/0.663*** ] [-0.028***/0.285*** ][(0.01 )/(0.04 )] [(0.01 )/(0.04 )] [(0.01 )/(0.05 )] [(0.01 )/(0.11 )]
Percentage of Zero-Cost Facility-Quarters 47.7 81.4 48.5 92.7Average Predicted Hourly Costs: WC $0.136 $0.034 $0.084 $0.010Average Predicted Hourly Costs: NS $0.076 $0.009 $0.060 $0.002Average Predicted Cost Savings $0.06 $0.024 $0.024 $0.008Average Predicted Percent Savings 44.16 73.50 28.37 84.19
All Companies Total Costs Wage-Rep. Costs Medical Costs Legal Costs
Nonsubscription Dummy 0.004/0.527*** [-0.050***/0.262*** ] 0.009/0.758*** [-0.036***/0.560* ](0.01)/(0.05) [(0.01 )/(0.02 )] (0.01)/(0.07) [(0.00 )/(0.19 )]
Percentage of Zero-Cost Facility-Quarters 53.4 84.6 54.8 80.9Average Predicted Hourly Costs: WC $0.150 $0.050 $0.088 $0.008Average Predicted Hourly Costs: NS $0.079 $0.008 $0.067 $0.002Average Predicted Cost Savings $0.071 $0.042 $0.021 $0.006Average Predicted Percent Savings 47.27 84.35 24.18 80.74
Other Model Covariates: State dummies, company dummies, quarter dummies, and WCRI benchmarks.
Notes: Significance Levels: *** 1%, ** 5%, * 10%. Probit average marginal effects are presented (the first coefficient) and generalizedlinear model (GLM) coefficients are presented as incidence rate ratios (IRR). Unique facility-quarters are the unit of analysis. AveragePredicted Hourly Costs indicate the mean predicted costs per hour for workers’ compensation (WC) and nonsubscribers (NS) across all facility-quarters within the regression sample. Average Predicted Cost Savings represents the mean difference between the workers’ compensation andnonsubscription predicted costs. Average Predicted Percent Savings represents the mean of the predicted percent savings under nonsubscription(relative to workers’ compensation) calculated for each facility-quarter in the sample.
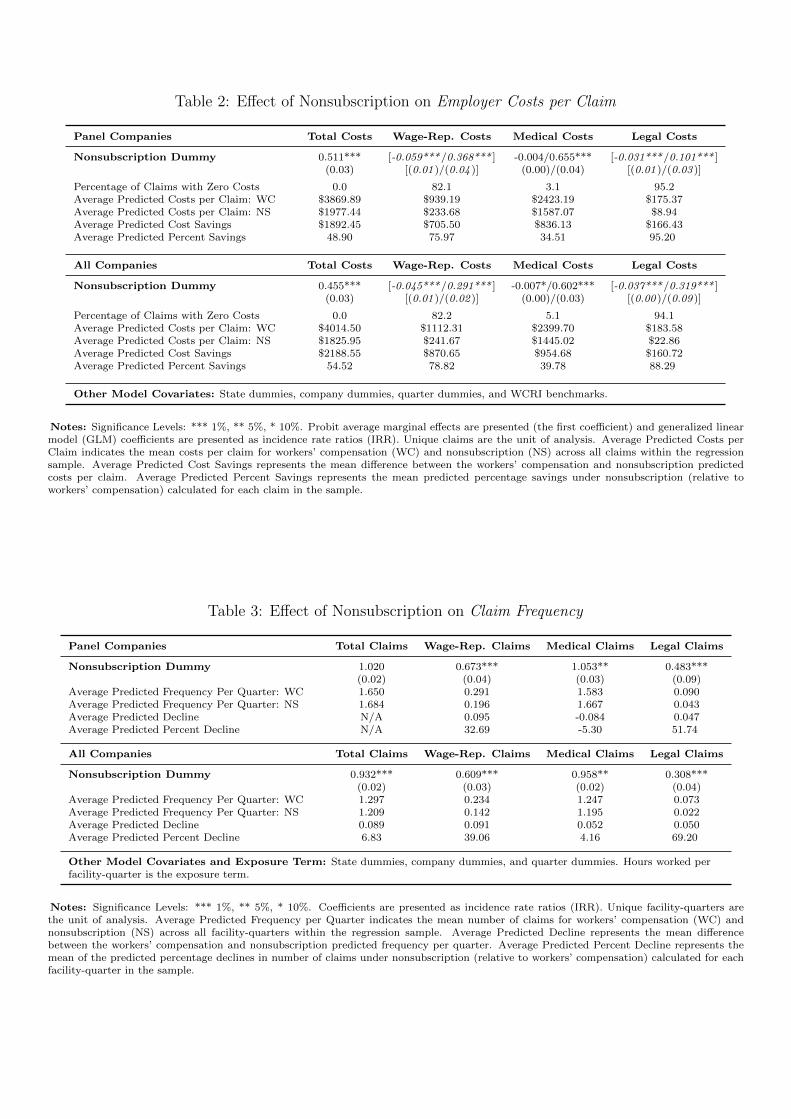
Table 2: Effect of Nonsubscription on Employer Costs per Claim
Panel Companies Total Costs Wage-Rep. Costs Medical Costs Legal Costs
Nonsubscription Dummy 0.511*** [-0.059***/0.368*** ] -0.004/0.655*** [-0.031***/0.101*** ](0.03) [(0.01 )/(0.04 )] (0.00)/(0.04) [(0.01 )/(0.03 )]
Percentage of Claims with Zero Costs 0.0 82.1 3.1 95.2Average Predicted Costs per Claim: WC $3869.89 $939.19 $2423.19 $175.37Average Predicted Costs per Claim: NS $1977.44 $233.68 $1587.07 $8.94Average Predicted Cost Savings $1892.45 $705.50 $836.13 $166.43Average Predicted Percent Savings 48.90 75.97 34.51 95.20
All Companies Total Costs Wage-Rep. Costs Medical Costs Legal Costs
Nonsubscription Dummy 0.455*** [-0.045***/0.291*** ] -0.007*/0.602*** [-0.037***/0.319*** ](0.03) [(0.01 )/(0.02 )] (0.00)/(0.03) [(0.00 )/(0.09 )]
Percentage of Claims with Zero Costs 0.0 82.2 5.1 94.1Average Predicted Costs per Claim: WC $4014.50 $1112.31 $2399.70 $183.58Average Predicted Costs per Claim: NS $1825.95 $241.67 $1445.02 $22.86Average Predicted Cost Savings $2188.55 $870.65 $954.68 $160.72Average Predicted Percent Savings 54.52 78.82 39.78 88.29
Other Model Covariates: State dummies, company dummies, quarter dummies, and WCRI benchmarks.
Notes: Significance Levels: *** 1%, ** 5%, * 10%. Probit average marginal effects are presented (the first coefficient) and generalized linearmodel (GLM) coefficients are presented as incidence rate ratios (IRR). Unique claims are the unit of analysis. Average Predicted Costs perClaim indicates the mean costs per claim for workers’ compensation (WC) and nonsubscription (NS) across all claims within the regressionsample. Average Predicted Cost Savings represents the mean difference between the workers’ compensation and nonsubscription predictedcosts per claim. Average Predicted Percent Savings represents the mean predicted percentage savings under nonsubscription (relative toworkers’ compensation) calculated for each claim in the sample.
Table 3: Effect of Nonsubscription on Claim Frequency
Panel Companies Total Claims Wage-Rep. Claims Medical Claims Legal Claims
Nonsubscription Dummy 1.020 0.673*** 1.053** 0.483***(0.02) (0.04) (0.03) (0.09)
Average Predicted Frequency Per Quarter: WC 1.650 0.291 1.583 0.090Average Predicted Frequency Per Quarter: NS 1.684 0.196 1.667 0.043Average Predicted Decline N/A 0.095 -0.084 0.047Average Predicted Percent Decline N/A 32.69 -5.30 51.74
All Companies Total Claims Wage-Rep. Claims Medical Claims Legal Claims
Nonsubscription Dummy 0.932*** 0.609*** 0.958** 0.308***(0.02) (0.03) (0.02) (0.04)
Average Predicted Frequency Per Quarter: WC 1.297 0.234 1.247 0.073Average Predicted Frequency Per Quarter: NS 1.209 0.142 1.195 0.022Average Predicted Decline 0.089 0.091 0.052 0.050Average Predicted Percent Decline 6.83 39.06 4.16 69.20
Other Model Covariates and Exposure Term: State dummies, company dummies, and quarter dummies. Hours worked perfacility-quarter is the exposure term.
Notes: Significance Levels: *** 1%, ** 5%, * 10%. Coefficients are presented as incidence rate ratios (IRR). Unique facility-quarters arethe unit of analysis. Average Predicted Frequency per Quarter indicates the mean number of claims for workers’ compensation (WC) andnonsubscription (NS) across all facility-quarters within the regression sample. Average Predicted Decline represents the mean differencebetween the workers’ compensation and nonsubscription predicted frequency per quarter. Average Predicted Percent Decline represents themean of the predicted percentage declines in number of claims under nonsubscription (relative to workers’ compensation) calculated for eachfacility-quarter in the sample.
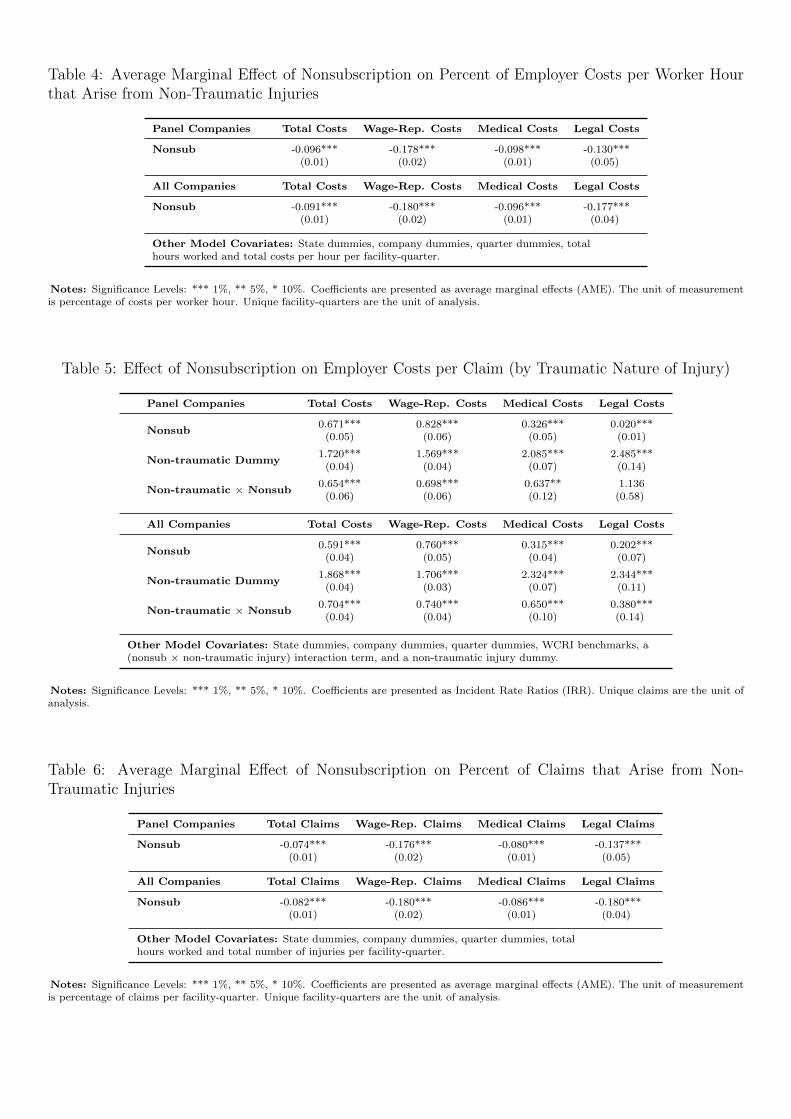
Table 4: Average Marginal Effect of Nonsubscription on Percent of Employer Costs per Worker Hourthat Arise from Non-Traumatic Injuries
Panel Companies Total Costs Wage-Rep. Costs Medical Costs Legal Costs
Nonsub -0.096*** -0.178*** -0.098*** -0.130***(0.01) (0.02) (0.01) (0.05)
All Companies Total Costs Wage-Rep. Costs Medical Costs Legal Costs
Nonsub -0.091*** -0.180*** -0.096*** -0.177***(0.01) (0.02) (0.01) (0.04)
Other Model Covariates: State dummies, company dummies, quarter dummies, totalhours worked and total costs per hour per facility-quarter.
Notes: Significance Levels: *** 1%, ** 5%, * 10%. Coefficients are presented as average marginal effects (AME). The unit of measurementis percentage of costs per worker hour. Unique facility-quarters are the unit of analysis.
Table 5: Effect of Nonsubscription on Employer Costs per Claim (by Traumatic Nature of Injury)
Panel Companies Total Costs Wage-Rep. Costs Medical Costs Legal Costs
Nonsub0.671*** 0.828*** 0.326*** 0.020***
(0.05) (0.06) (0.05) (0.01)
Non-traumatic Dummy1.720*** 1.569*** 2.085*** 2.485***
(0.04) (0.04) (0.07) (0.14)
Non-traumatic × Nonsub0.654*** 0.698*** 0.637** 1.136
(0.06) (0.06) (0.12) (0.58)
All Companies Total Costs Wage-Rep. Costs Medical Costs Legal Costs
Nonsub0.591*** 0.760*** 0.315*** 0.202***
(0.04) (0.05) (0.04) (0.07)
Non-traumatic Dummy1.868*** 1.706*** 2.324*** 2.344***
(0.04) (0.03) (0.07) (0.11)
Non-traumatic × Nonsub0.704*** 0.740*** 0.650*** 0.380***
(0.04) (0.04) (0.10) (0.14)
Other Model Covariates: State dummies, company dummies, quarter dummies, WCRI benchmarks, a(nonsub × non-traumatic injury) interaction term, and a non-traumatic injury dummy.
Notes: Significance Levels: *** 1%, ** 5%, * 10%. Coefficients are presented as Incident Rate Ratios (IRR). Unique claims are the unit ofanalysis.
Table 6: Average Marginal Effect of Nonsubscription on Percent of Claims that Arise from Non-Traumatic Injuries
Panel Companies Total Claims Wage-Rep. Claims Medical Claims Legal Claims
Nonsub -0.074*** -0.176*** -0.080*** -0.137***(0.01) (0.02) (0.01) (0.05)
All Companies Total Claims Wage-Rep. Claims Medical Claims Legal Claims
Nonsub -0.082*** -0.180*** -0.086*** -0.180***(0.01) (0.02) (0.01) (0.04)
Other Model Covariates: State dummies, company dummies, quarter dummies, totalhours worked and total number of injuries per facility-quarter.
Notes: Significance Levels: *** 1%, ** 5%, * 10%. Coefficients are presented as average marginal effects (AME). The unit of measurementis percentage of claims per facility-quarter. Unique facility-quarters are the unit of analysis.

Table 7: Effect of Nonsubscription on Frequency of Claims for Severe, Traumatic Injuries
Panel Companies Total Claims Wage-Rep. Claims Medical Claims Legal Claims
Nonsub 0.527*** 0.413*** 0.524*** 0.526(0.05) (0.07) (0.05) (0.23)
Average Predicted Frequency Per Quarter: WC 0.050 0.022 0.049 0.005Average Predicted Frequency Per Quarter: NS 0.026 0.009 0.025 0.002Average Predicted Decline 0.024 0.013 0.023 0.002Average Predicted Percent Decline 47.30 58.75 47.59 47.44
All Companies Total Claims Wage-Rep. Claims Medical Claims Legal Claims
Nonsub 0.624*** 0.479*** 0.618*** 0.450**(0.05) (0.06) (0.05) (0.18)
Average Predicted Frequency Per Quarter: WC 0.038 0.016 0.037 0.003Average Predicted Frequency Per Quarter: NS 0.024 0.008 0.023 0.002Average Predicted Decline 0.014 0.009 0.014 0.002Average Predicted Percent Decline 37.62 52.15 38.21 55.03
Other Model Covariates and Exposure Term: State dummies, company dummies, and quarter dummies. Hours worked isthe exposure term.
Notes: Significance Levels: *** 1%, ** 5%, * 10%. Coefficients are presented as incidence rate ratios (IRR). Unique facility-quarters are theunit of analysis. Severe, traumatic injuries include amputations, crushing, concussions, fractures, brain damage, and enucleation (loss of aneye). WC is workers’ compensation and NS is nonsubscription. Predicted Statistics are calculated in the same way as Table 3.
Table 8: Counterfactual (CF) Models of the Effects of Nonsubscription on Employer Costs per Worker-Hour, with Capped Benefits and Excluding Chiropractic Costs, PPD costs, and Categorical Exclusions
Panel Total Costs Total Costs Wage-Rep. Costs Medical Costs Legal CostsCompanies (CF) (Baseline) (CF) (CF) (CF)
Nonsub Dummy [0.030***/0.591*** ] [0.027***/0.518*** ] [-0.029***/0.478*** ] [0.030***/0.736*** ] [-0.025***/0.284*** ][(0.01)/(0.04)] [(0.01)/(0.04)] [(0.01)/(0.05)] [(0.01)/(0.05)] [(0.01)/(0.11)]
Avg. Pred. Hrly Costs: WC $0.123 $0.137 $0.026 $0.078 $0.010Avg. Pred. Hrly Costs: NS $0.079 $0.076 $0.010 $0.062 $0.002Avg. Pred. Cost Savings $0.045 $0.061 $0.016 $0.016 $0.008Avg. Pred. Percent Savings 35.67 44.16 62.35 19.82 83.52
All Total Costs Total Costs Wage-Rep. Costs Medical Costs Legal CostsCompanies (CF) (Baseline) (CF) (CF) (CF)
Nonsub Dummy 0.007/0.586*** 0.004/0.527*** [-0.041***/0.319*** ] 0.012/0.831** [-0.034***/0.559* ](0.01)/(0.05) (0.01)/(0.05) [(0.01)/(0.03)] (0.01)/(0.08) [(0.00)/(0.19)]
Avg. Pred. Hrly Costs: WC $0.136 $0.150 $0.041 $0.082 $0.008Avg. Pred. Hrly Costs: NS $0.080 $0.079 $0.009 $0.068 $0.002Avg. Pred. Cost Savings $0.056 $0.071 $0.032 $0.014 $0.006Avg. Pred. Percent Savings 41.40 47.273 79.16 16.89 80.30
Other Model Covariates: State dummies, company dummies, quarter dummies, and WCRI benchmarks.
Notes: Significance Levels: *** 1%, ** 5%, * 10%. GLM coefficients are presented as incidence rate ratios (IRR) and probit average marginaleffects are presented. Unique facility-quarters are the unit of analysis. WC is workers’ compensation and NS is nonsubscription. “Avg. Pred.Hrly Costs” is “Average Predicted Hourly Costs.” Predicted Statistics are calculated in the same way as Table 1.