reinvesting in drinking water...
TRANSCRIPT
AnAnalysisof TwentyUtilities’Needs forRepair andReplacement of Drinking WaterInfrastructure
A Study Sponsored byThe AWWA Water Industry Technical Action Fund
May 2001
Dawn of the Replacement Era
Reinvesting inDrinking WaterInfrastructure
American Water Works Association®
Dedicated to Safe Dr ink ing Water
Headquarters Office Government Affairs Office6666 W. Quincy Ave., Denver, CO 80235 1401 New York Ave., NW, Suite 640,(303) 794-7711 Fax: (303) 794-1440 Washington, DC 20005http://www.awwa.org (202) 628-8303 Fax (202) 628-2846
AMERICAN WATER WORKS ASSOCIATION 3
Reinvesting in Drinking WaterInfrastructure
Dawn of the Replacement Era
TABLE OF CONTENTS
Title Page
Executive Summary 5
Introduction 9
Findings 10
• Pipes are expensive, but invisible 10
• Pipes are hearty, but ultimately mortal 10
• Back to the future: pipe replacement needs are “demographic echo” 12
• Water infrastructure is local and therefore vulnerable to demographic changes 14
• Replacement of water treatment plants is also coming due 16
• Increased expenditures are needed to climb the ramp and avoid a gap 17
• Addressing affordability is the heart of the challenge 19
Recommendations 22
• Measures by utilities and local governments 22
• Reform of state programs 23
• A significant increase in federal assistance 23
Conclusion 24
20 Sets of Nessie Curves App A
Acknowledgments App B
AMERICAN WATER WORKS ASSOCIATION 5
Reinvesting in Drinking WaterInfrastructure
Dawn of the Replacement Era
EXECUTIVE SUMMARY
The importance of safe drinking water to public health and the nation’s economic welfareis undisputed. However, as we enter the 21st Century, water utilities face significant eco-nomic challenges. For the first time, in many of these utilities a significant amount ofburied infrastructure—the underground pipes that make safe water available at the turn ofa tap—is at or very near the end of its expected life span. The pipes laid down at differenttimes in our history have different life expectancies, and thousands of miles of pipes thatwere buried over 100 or more years ago will need to be replaced in the next 30 years. Mostutilities have not faced the need to replace huge amounts of this infrastructure because itwas too young. Today a new age has arrived. We stand at the dawn of the replacement era.
Extrapolating from our analysis of 20 utilities, we project that expenditures on the orderof $250 billion over 30 years might be required nationwide for the replacement of worn-out drinking water pipes and associated structures (valves, fittings, etc). This figure doesnot include wastewater infrastructure or the cost of new drinking water standards.Moreover, the requirement hits different utilities at different times and many utilities willneed to accelerate their investment. Some will see rapidly escalating infrastructure expen-diture needs in the next 10–20 years. Others will find their investment decisions subject toa variety of factors that cause replacement to occur sooner or at greater expense, such asurban redevelopment, modernization, coordination with other city construction, increas-ing pipe size, and other factors.
Overall, the findings confirm that replacement needs are large and on the way. There willbe a growing conflict between the need to replace worn-out infrastructure and the need toinvest in compliance with new regulatory standards under the Safe Drinking Water Act.In addition, the concurrent demands for investment in wastewater infrastructure and com-pliance with new Clean Water Act regulations, including huge needs for meeting com-bined sewer overflow (CSO) and stormwater requirements, will compete for revenue onthe same household bill.
Ultimately, the rate-paying public will have to finance the replacement of the nation’sdrinking water infrastructure either through rates or taxes. AWWA expects local funds tocover the great majority of the nation’s water infrastructure needs and remains committedto the principle of full-cost recovery through rates. However, many utilities may face needsthat are large and unevenly distributed over time. They must manage a difficult transitionbetween today’s level of investment and the higher level of investment that is required overthe long term. Facing an inexorable rise in infrastructure replacement needs driven bydemographic forces that were at work as much as 100 years ago, compounded by the neg-ative effects of changing demographics on per-capita costs in center cities, many utilitiesface a significant challenge in keeping water affordable for all the people they serve.
6 AMERICAN WATER WORKS ASSOCIATION
Meeting this challenge requires a new partnership in which utilities, states, and the feder-al government all have important roles. Utilities need to examine their rate structures toassure long-term viability. States need to streamline their programs. And the federal gov-ernment needs to significantly increase assistance for utilities.
To better understand this problem, the American Water Works Association undertookstudies of 20 large and medium utilities. The findings and recommendations of this reportprovide the basis for this new partnership to achieve the goal to which we all aspire—theprovision of safe and affordable drinking water for all Americans.
Findings:
• Water utilities must make a substantial reinvestment in infrastructure over the next30 years. The oldest cast iron pipes, dating to the late 1800s, have an average lifeexpectancy of about 120 years. Because of changing materials and manufacturingtechniques, pipes laid in the 1920s have an average life expectancy of about 100years, and pipes laid in the post-World War II boom can be expected to last about75 years. The replacement bill for these pipes will be hard on us for the next threedecades and beyond.
• Most utilities are just now beginning to face significant investments for infrastruc-ture replacement. Indeed, it would have been economically inefficient to makelarge replacement investments before now. The utilities we studied are well man-aged and have made the right decisions. But the bills are now coming due, and theyloom large.
• On average, the replacement cost value of water mains is about $6,300 per house-hold in today’s dollars in the relatively large utilities studied. If water treatmentplants, pumps, etc., are included, the replacement cost value rises to just under$10,000 per household, on average.
• Demographic shifts are a significant factor in the economics of reinvestment. Insome older cities, the per-capita replacement value of mains is more than threetimes higher than the average in this sample due to population declines since 1950.
• By 2030, the average utility in the sample will have to spend about three and a halftimes as much on pipe replacement due to wear-out as it spends today. Even so, theaverage utility will also spend three times as much on repairs in that year as itspends today, as the pipes get older and more prone to breakage.
• The water utilities studied concurrently face the need to replace infrastructure andupgrade treatment plants to comply with a number of new regulations to be imple-mented under the Safe Drinking Water Act. Many municipalities also face significantneeds for investments in wastewater infrastructure and compliance. This concurrentdemand significantly increases the financial challenge they face.
• Overall, in the 20 utilities studied, infrastructure repair and replacement requiresadditional revenue totaling about $6 billion above current spending over the next30 years. This ranges from about $550 per household to almost $2,300 per house-
AMERICAN WATER WORKS ASSOCIATION 7
hold over the period. These household impact figures do not include compliancewith new regulations or the cost of infrastructure replacement and compliance forwastewater.
• The pattern and timing of the need for additional capital will be different in eachcommunity, depending on its demographically driven replacement “wave.”
• Household impacts will be two to three times greater in smaller water systems($1,100 to $6,900 per household over 30 years) due to disadvantages of small scaleand the tendency for replacement needs to be less spread out over time.
• Because of demographic changes, rate increases will fall disproportionately on thepoor, intensifying the challenge that many utilities face keeping water affordable totheir customers.
Recommendations:
America needs a new partnership for reinvesting in drinking water infrastructure. Thereare important roles at all levels of government.
1) Measures by Utilities and Local Governments
Although the AWWA analysis has looked at the infrastructure issue in the aggregate, manykey issues must be addressed at the local utility level. Utilities should develop a compre-hensive local strategy that includes:
• Assessing the condition of the drinking water system infrastructure.
• Strengthening research and development
• Working with the public to increase awareness of the challenge ahead, assess localrate structures, and adjust rates where necessary.
• Building managerial capacity.
2) Reform of State Programs
The states too have an important role to play in addressing our infrastructure fundingneeds. States may need to match an appropriate share of any new federal funds that are pro-vided for infrastructure assistance. Moreover, states need to reform their existing programsto make them more effective. States should commit to:
• Respecting the universal eligibility of all water systems for federal assistance.
• Streamlining their programs for delivery of assistance and allow alternative pro-curement procedures that save money.
• Making their financing mechanisms more attractive by committing to grants andvery low or negative interest loans.
• Using federal funds in a timely fashion or face the reprogramming of those fundsto other states.
8 AMERICAN WATER WORKS ASSOCIATION
3) A Significant Increase in Federal Assistance
The federal government has a critical role to play in preventing the development of a gapin water infrastructure financing. AWWA recommends either changing and expanding theexisting Drinking Water State Revolving Fund and other drinking water programs, or cre-ating a new, infrastructure-focused fund. The federal role should include:
• Significantly increased federal funding for projects to repair, replace, or rehabili-tate drinking water infrastructure.
• An increase in federally supported research on infrastructure management, repairand replacement technologies.
• Steps to increase the availability and use of private capital.
AMERICAN WATER WORKS ASSOCIATION 9
Reinvesting in Drinking WaterInfrastructure
Dawn of the Replacement Era
Introduction
The importance of safe drinking water to the nation’s public health and economic welfareis undisputed. About 54,000 community drinking water systems provide drinking water tomore than 250 million Americans. By keeping water supplies free of contaminants thatcause disease, our public water systems reduce sickness and related health costs as well asabsenteeism in the workforce. By providing safe and sufficient supplies of water, America’spublic water systems create direct economic value across nearly every sector of the econo-my and every region of the country. However, significant economic changes are con-fronting the water profession as we enter the 21st Century. The new century poses newchallenges in sustaining the infrastructure—particularly the underground pipes—that pro-vides the broad public benefits of clean and safe water.
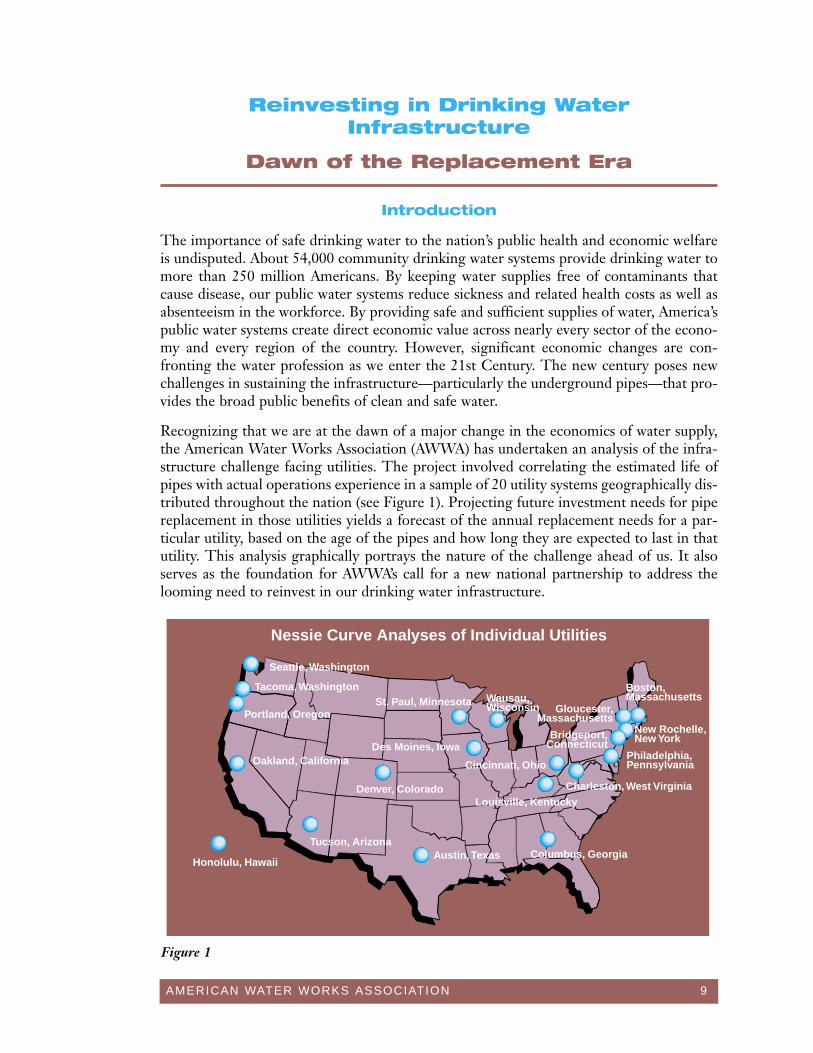
Recognizing that we are at the dawn of a major change in the economics of water supply,the American Water Works Association (AWWA) has undertaken an analysis of the infra-structure challenge facing utilities. The project involved correlating the estimated life ofpipes with actual operations experience in a sample of 20 utility systems geographically dis-tributed throughout the nation (see Figure 1). Projecting future investment needs for pipereplacement in those utilities yields a forecast of the annual replacement needs for a par-ticular utility, based on the age of the pipes and how long they are expected to last in thatutility. This analysis graphically portrays the nature of the challenge ahead of us. It alsoserves as the foundation for AWWA’s call for a new national partnership to address thelooming need to reinvest in our drinking water infrastructure.
Nessie Curve Analyses of Individual Utilities
Seattle, Washington
Tacoma, Washington
Portland, Oregon
Denver, Colorado
St. Paul, Minnesota
Honolulu, Hawaii
Oakland, California
Austin, TexasTucson, Arizona
Des Moines, Iowa
Wausau, Wisconsin
Columbus, Georgia
Louisville, KentuckyCharleston, West Virginia
Philadelphia, PennsylvaniaCincinnati, Ohio
Boston, Massachusetts
Gloucester,Massachusetts
Bridgeport,Connecticut
New Rochelle,New York
Figure 1
10 AMERICAN WATER WORKS ASSOCIATION
FINDINGS
Pipes are expensive, but invisible.
Most people do not realize the huge magnitude of the capital investment that has beenmade to develop the vast network of distribution mains and pipes—the infrastructure—that makes clean and safe water available at the turn of a tap. Water is by far the most cap-ital intensive of all utility services, mostly due to the cost of these pipes, water infrastruc-ture that is literally a buried treasure beneath our streets. But buried means out of sight.And as the old saying goes, out of sight means out of mind. Moreover, most of our pipeswere originally installed and paid for by previous generations. They were laid down dur-ing the economic booms that characterized the last century’s periods of growth and expan-sion. So not only do we take these pipes for granted because we can’t see them, we alsotake them for granted because, for the most part, we didn’t pay for them initially. What’smore, they last a long time (some more than a century) before they cost us very muchin maintenance expense near the end of their useful lives or ultimately need replace-ment. For the most part, then, the huge capital expense of the pipes is a cost that today’scustomers have never had to bear. It has always been there, but it’s always been invisibleto us.
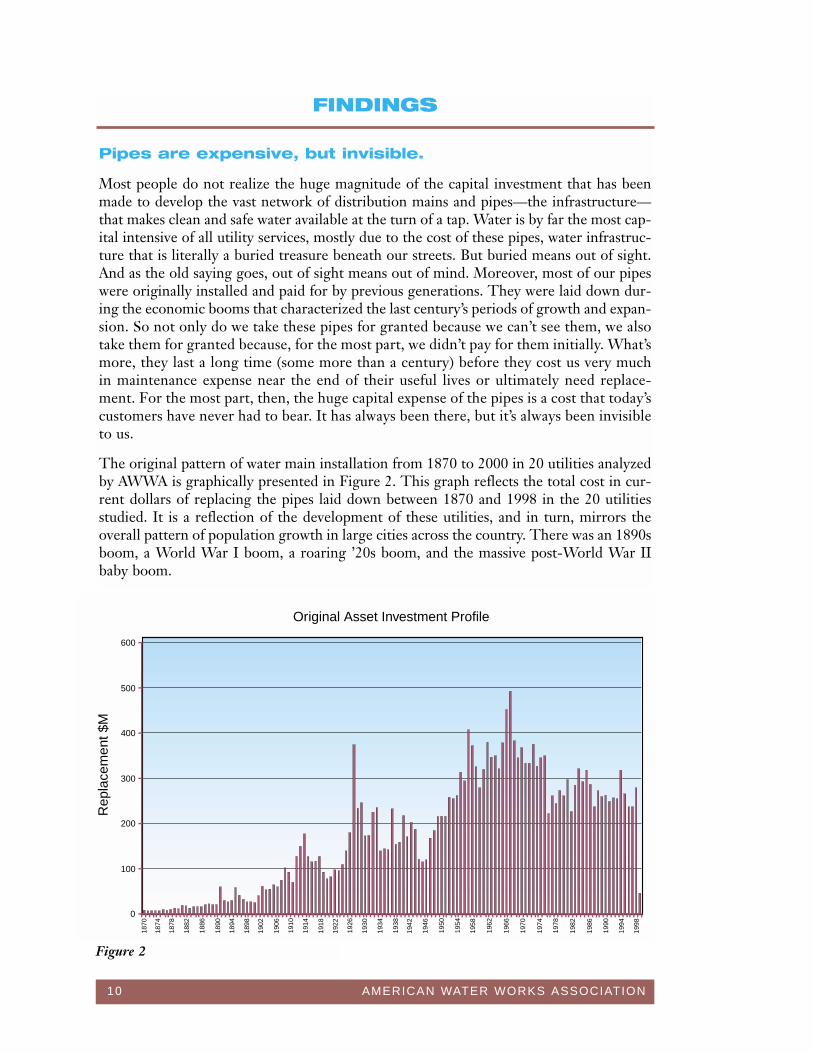
The original pattern of water main installation from 1870 to 2000 in 20 utilities analyzedby AWWA is graphically presented in Figure 2. This graph reflects the total cost in cur-rent dollars of replacing the pipes laid down between 1870 and 1998 in the 20 utilitiesstudied. It is a reflection of the development of these utilities, and in turn, mirrors theoverall pattern of population growth in large cities across the country. There was an 1890sboom, a World War I boom, a roaring ’20s boom, and the massive post-World War IIbaby boom.
0
100
200
300
400
500
600
1870
1874
1878
1882
1886
1890
1894
1898
1902
1906
1910
1914
1918
1922
1926
1930
1934
1938
1942
1946
1950
1954
1958
1962
1966
1970
1974
1978
1982
1986
1990
1994
1998
Rep
lace
men
t $M
Original Asset Investment Profile
Figure 2
AMERICAN WATER WORKS ASSOCIATION 11
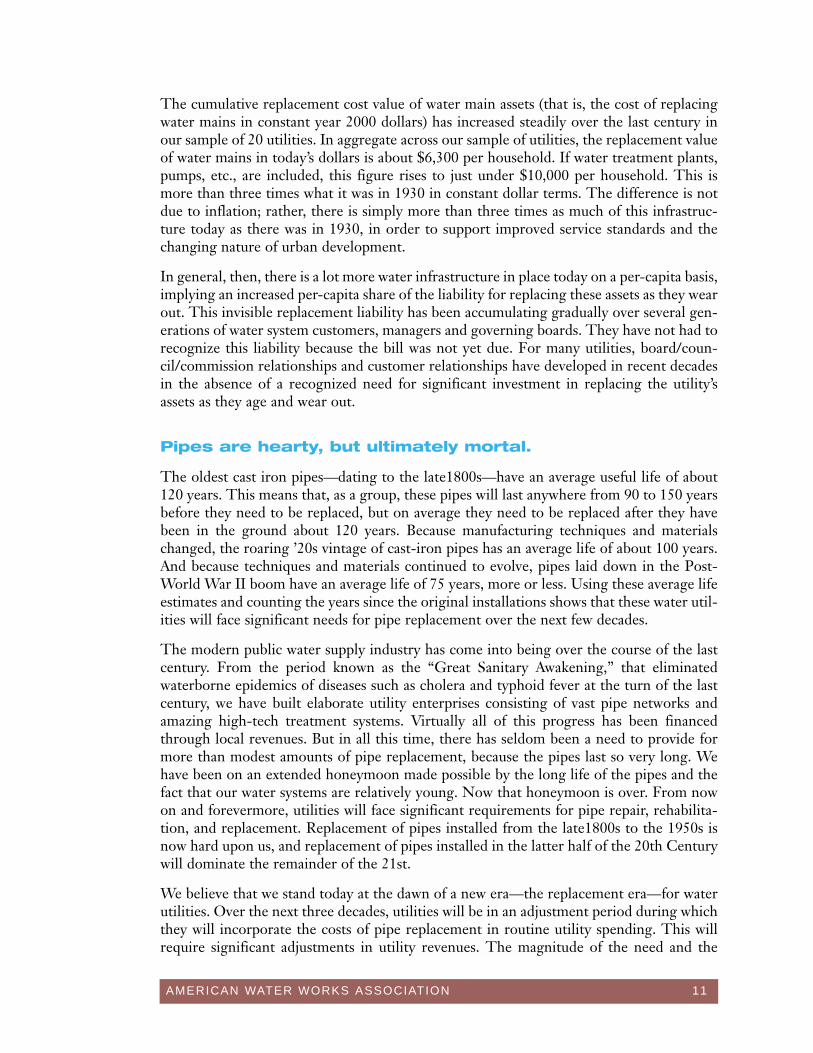
The cumulative replacement cost value of water main assets (that is, the cost of replacingwater mains in constant year 2000 dollars) has increased steadily over the last century inour sample of 20 utilities. In aggregate across our sample of utilities, the replacement valueof water mains in today’s dollars is about $6,300 per household. If water treatment plants,pumps, etc., are included, this figure rises to just under $10,000 per household. This ismore than three times what it was in 1930 in constant dollar terms. The difference is notdue to inflation; rather, there is simply more than three times as much of this infrastruc-ture today as there was in 1930, in order to support improved service standards and thechanging nature of urban development.
In general, then, there is a lot more water infrastructure in place today on a per-capita basis,implying an increased per-capita share of the liability for replacing these assets as they wearout. This invisible replacement liability has been accumulating gradually over several gen-erations of water system customers, managers and governing boards. They have not had torecognize this liability because the bill was not yet due. For many utilities, board/coun-cil/commission relationships and customer relationships have developed in recent decadesin the absence of a recognized need for significant investment in replacing the utility’sassets as they age and wear out.
Pipes are hearty, but ultimately mortal.
The oldest cast iron pipes—dating to the late1800s—have an average useful life of about120 years. This means that, as a group, these pipes will last anywhere from 90 to 150 yearsbefore they need to be replaced, but on average they need to be replaced after they havebeen in the ground about 120 years. Because manufacturing techniques and materialschanged, the roaring ’20s vintage of cast-iron pipes has an average life of about 100 years.And because techniques and materials continued to evolve, pipes laid down in the Post-World War II boom have an average life of 75 years, more or less. Using these average lifeestimates and counting the years since the original installations shows that these water util-ities will face significant needs for pipe replacement over the next few decades.
The modern public water supply industry has come into being over the course of the lastcentury. From the period known as the “Great Sanitary Awakening,” that eliminatedwaterborne epidemics of diseases such as cholera and typhoid fever at the turn of the lastcentury, we have built elaborate utility enterprises consisting of vast pipe networks andamazing high-tech treatment systems. Virtually all of this progress has been financedthrough local revenues. But in all this time, there has seldom been a need to provide formore than modest amounts of pipe replacement, because the pipes last so very long. Wehave been on an extended honeymoon made possible by the long life of the pipes and thefact that our water systems are relatively young. Now that honeymoon is over. From nowon and forevermore, utilities will face significant requirements for pipe repair, rehabilita-tion, and replacement. Replacement of pipes installed from the late1800s to the 1950s isnow hard upon us, and replacement of pipes installed in the latter half of the 20th Centurywill dominate the remainder of the 21st.
We believe that we stand today at the dawn of a new era—the replacement era—for waterutilities. Over the next three decades, utilities will be in an adjustment period during whichthey will incorporate the costs of pipe replacement in routine utility spending. This willrequire significant adjustments in utility revenues. The magnitude of the need and the
12 AMERICAN WATER WORKS ASSOCIATION
invisibility of that need to the person on (top of) the street will make this a particularlychallenging adjustment. The need for significantly greater investment in pipe replacementis all the more difficult to convey because it was never there before. It’s hard to explain whyit’s going to cost more to do the same job in the future than it cost in the past.
Many water systems all across America have seen this day coming and have already begunto ramp up their expenditures on pipe rehabilitation and replacement. But for many util-ities this problem is just emerging and is enormous in scope. For them the water supplybusiness will never be the same.
Back to the future: pipe replacement needs are a “demographic echo.”
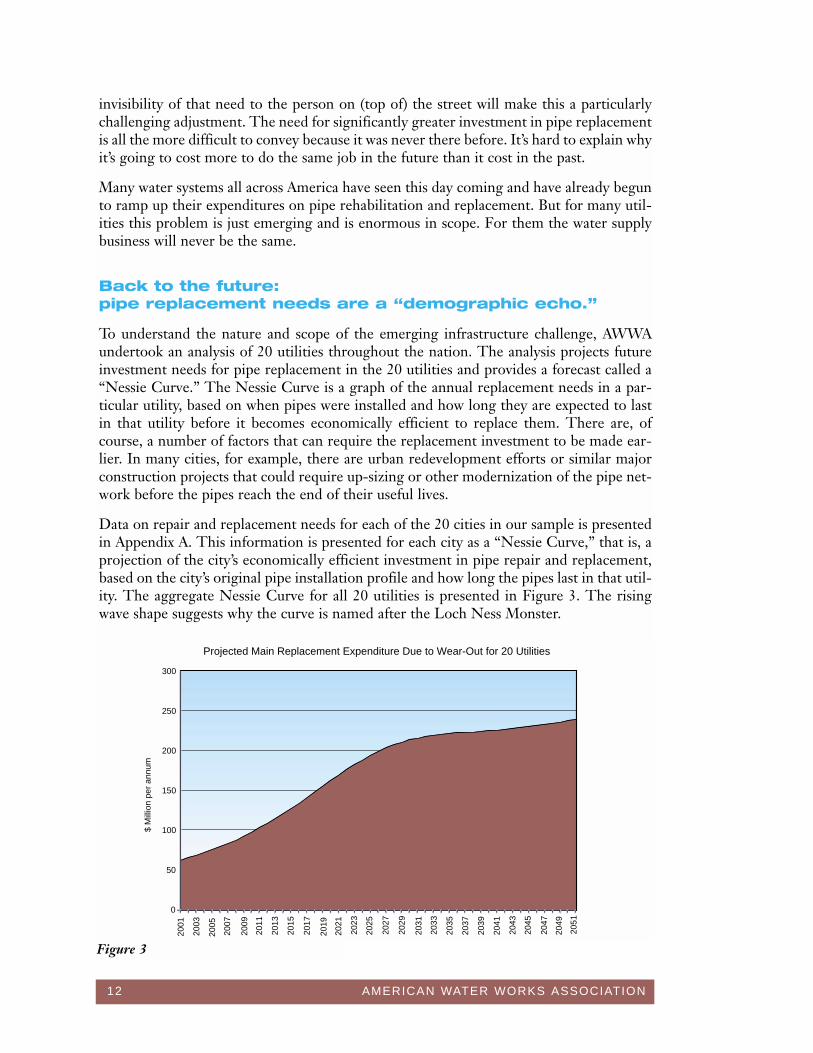
To understand the nature and scope of the emerging infrastructure challenge, AWWAundertook an analysis of 20 utilities throughout the nation. The analysis projects futureinvestment needs for pipe replacement in the 20 utilities and provides a forecast called a“Nessie Curve.” The Nessie Curve is a graph of the annual replacement needs in a par-ticular utility, based on when pipes were installed and how long they are expected to lastin that utility before it becomes economically efficient to replace them. There are, ofcourse, a number of factors that can require the replacement investment to be made ear-lier. In many cities, for example, there are urban redevelopment efforts or similar majorconstruction projects that could require up-sizing or other modernization of the pipe net-work before the pipes reach the end of their useful lives.
Data on repair and replacement needs for each of the 20 cities in our sample is presentedin Appendix A. This information is presented for each city as a “Nessie Curve,” that is, aprojection of the city’s economically efficient investment in pipe repair and replacement,based on the city’s original pipe installation profile and how long the pipes last in that util-ity. The aggregate Nessie Curve for all 20 utilities is presented in Figure 3. The risingwave shape suggests why the curve is named after the Loch Ness Monster.
0
50
100
150
200
250
300
Projected Main Replacement Expenditure Due to Wear-Out for 20 Utilities
2001
2003
2005
2007
2009
2011
2013
2015
2017
2019
2021
2023
2025
2027
2029
2031
2033
2035
2037
2039
2041
2043
2045
2047
2049
2051
$ M
illio
n pe
r an
num
Figure 3
AMERICAN WATER WORKS ASSOCIATION 13
The Nessie Curve reflects an “echo” of the original demographics that shaped a particularutility. It is very similar to the echo of demographics that predicts future liabilities for theSocial Security Trust Fund. Indeed, this is exactly the same type of problem that facesSocial Security. Historical demographic trends—in our case, pipes laid down as long as acentury ago—created a future financial obligation that is now coming due. By modeling thedemographic pattern and knowing the life expectancy of the pipes, we can estimate the tim-ing and magnitude of that obligation.
Just as in Social Security, a threat to affordability arises when there were powerful demo-graphic and economic trends at work originally, but the liability arrives at a later time whenthe demographic and economic conditions have changed. In the water business, the chal-lenge is magnified by pipes that last through several generations of customers before theyneed to be replaced.
Reflecting the pattern of population growth in large cities over the last 120 years, theNessie Curves in Appendix A forecast investment needs that will rise steadily like a ramp,extending throughout the 21st Century. The curves show that replacement expenditureswill have to rise steadily for the next 30 years. By 2030, the utilities in our sample of 20 willhave to spend on average over three-and-a-half times as much per year as they do now (inconstant dollars) to replace pipes that have reached the end of their economic lives. Someof the utilities in our sample will encounter the steepest part of the incline in the first 10years. Others will encounter most of the rise over 20 years, while some will experience asustained increase over 30 years.
Of course, every city has a different demographic history. In addition, numerous local fac-tors will affect the life of a utility’s pipes and therefore its Nessie Curve. Each utility has aunique set of circumstances and therefore a different set of infrastructure funding chal-lenges in the future. Nonetheless, demographics will produce the same type of laggedreplacement schedule in any major city.
If that were not enough of a challenge, there is an important corollary. As pipe assets age,they tend to break more frequently. But it is not cost-effective to replace most pipes before,or even after, the first break. Like the old family car, it is cost-efficient for utilities to enduresome number of breaks before funding complete replacement of their pipes.
Considering the huge wave of aging pipe infrastructure created in the last century, we canexpect to see significant increases in break rates and therefore repair costs over the comingdecades. This will occur even when utilities are making efficient levels of investment inreplacement that may be several times today’s levels. In the utilities studied by AWWA,there will be a three-fold increase in repair costs by the year 2030 despite a concurrentincrease of three and a half times in annual investments to replace pipes.
It is important to note that a Nessie Curve is a prediction, not a destiny. That is, a utilitycan choose to manage its infrastructure replacement needs in various ways. For example,the utility may accept increased break repair costs up to a point and delay the replacementof an old pipe, rehabilitate certain pipes to “buy time,” or adopt other asset managementtechniques to extend the life of the pipes as long as possible. Nevertheless, it appearsinevitable that many utilities will face substantial increases in infrastructure investmentsover the next 30 years, to replace pipes laid down as long as 120 years ago.
14 AMERICAN WATER WORKS ASSOCIATION
A final observation from our sample of 20 Nessie Curves is that the large “demographicwave” of replacement needs is only just now upon us. We are just now at the time whenthere is a compelling need to significantly increase the levels of replacement spending inmost utilities. Importantly, there is no evidence that utilities are “behind the curve” or thatAmerica is in ruins. That is not the nature of the challenge. We are not faced with mak-ing up for a historical gap in the level of replacement funding. In fact, break rates in oursample of 20 utilities are within a range that is considered representative of best manage-ment practices for water utilities, indicating that the utilities have made efficient decisionsand managed well up to this point. The challenge is ramping up utility budgets to preventa “replacement gap” from developing in the near future. Unfortunately, keeping up withreplacement needs is about to get a lot harder than ever before, and it’s going to stay thatway. We are coming face-to-face with a serious challenge that could become a crisis if weignore it.
Water infrastructure is local and therefore vulnerable to demographic changes.
Water utilities are the last natural monopolies. The large investment required in pipe net-works makes it impossible to have more than a single provider of water service within agiven area. These large investments are also a major source of financial vulnerability forwater utilities as the result of the very fixed nature of the assets and the very mobile natureof the customers. When populations grow, the infrastructure is expanded, but when peo-ple move away, the pipe assets and the liability for repair and replacement remain behind,creating a financial burden on the remaining customers.
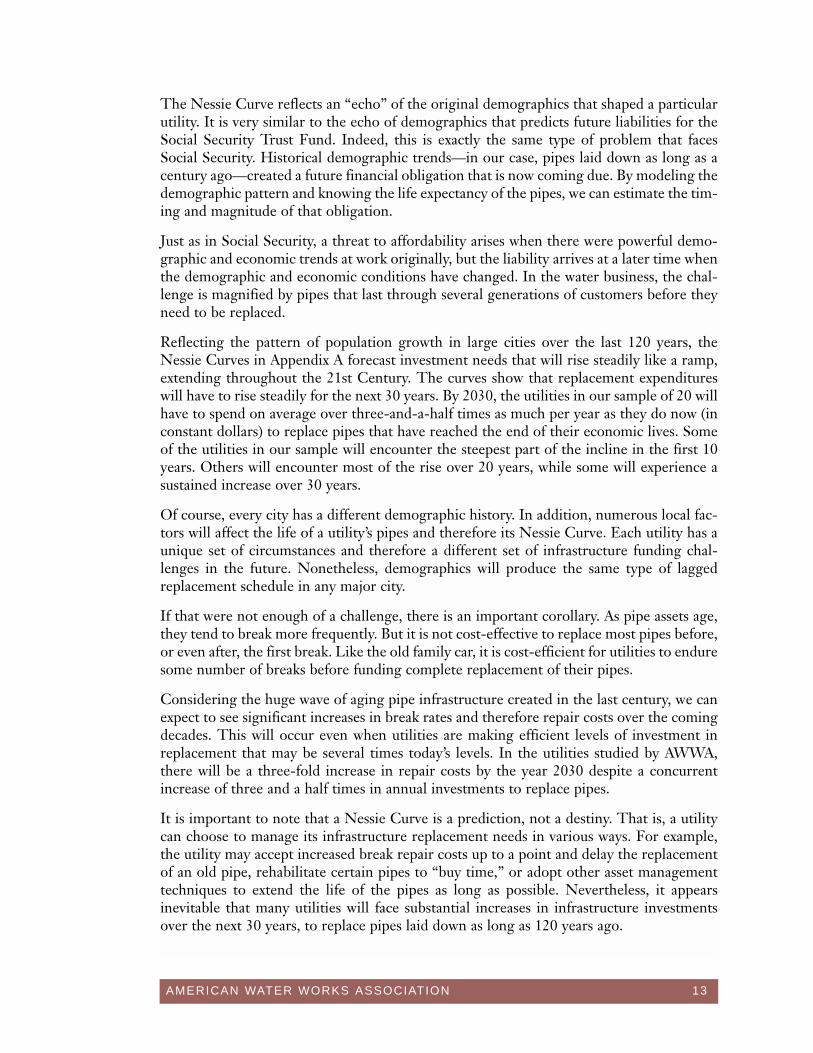
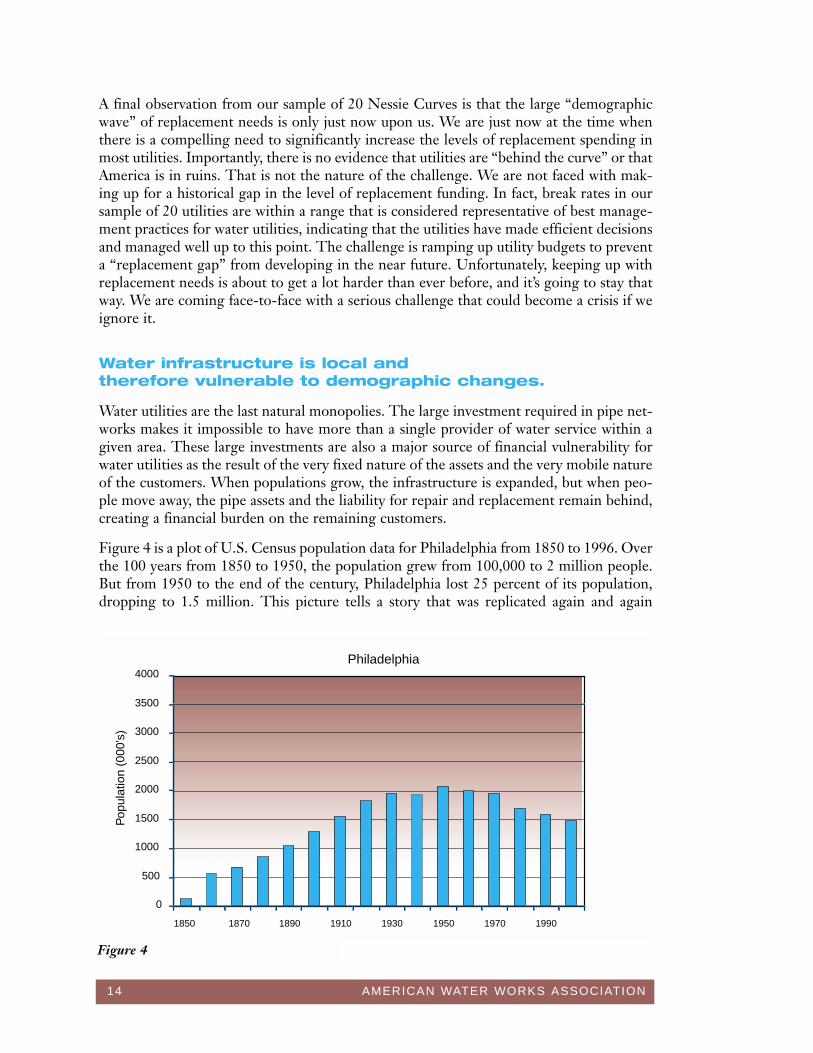
Figure 4 is a plot of U.S. Census population data for Philadelphia from 1850 to 1996. Overthe 100 years from 1850 to 1950, the population grew from 100,000 to 2 million people.But from 1950 to the end of the century, Philadelphia lost 25 percent of its population,dropping to 1.5 million. This picture tells a story that was replicated again and again
Philadelphia
0
500
1000
1500
2000
2500
3000
3500
4000
1850 1870 1890 1910 1930 1950 1970 1990
Pop
ulat
ion
(000
's)
Figure 4
AMERICAN WATER WORKS ASSOCIATION 15
throughout the Rustbelt cities of the Northeast and Midwest. The effect is to significant-ly increase the burden of replacement funding on the remaining residents of the city.
As previously discussed, the average per-capita value of water main assets in place todayacross our sample of 20 utilities is estimated to be three times the amount that was presentin 1930. In Philadelphia, however, that ratio is almost eight times the value in 1930 due topopulation declines since about 1950. This problem, known as “stranded capacity” (essen-tially, capital facilities that are not matched by rate revenue from current customers), istypical of Rustbelt demographics and adds considerably to the challenge of fundingreplacement in these cities.
Urban demographic history also explains many other dimensions of the infrastructurereplacement challenge facing the water industry. Both gains and losses in urban popula-tions created small system infrastructure problems in their wake. During the first half ofthe 20th Century, many of the people swelling the populations of the urban centers camefrom smaller rural towns, leaving small water system infrastructure behind to struggle withfewer customers. In the latter half of the century, the departure of big city residents for thesuburbs fueled an explosion of new, small water systems in suburban areas. Today abouthalf of all small water systems are within Standard Metropolitan Statistical Areas definedby the U.S. Census. Built in boom times, many of these suburban systems were not builtto enduring standards, creating another liability. When these systems are absorbed by larg-er metropolitan systems, it is commonly necessary to completely rebuild them.
The pattern reflected in Sunbelt cities is the other side of the story from that in theRustbelt. These cities are experiencing rapid growth and expansion which places capitalfinancing demands upon them that are truly the opposite side of the coin. When water util-ities are expanding, they must build some of the most expensive components—new sourcedevelopment, storage facilities, transmission mains, and treatment plants—in advance ofpopulation growth in order to serve people when they arrive. This is, in effect, anotherform of stranded capacity—capital facilities that must be paid for despite the fact the cus-tomers are not yet in place. Investor-owned utilities are, in fact, generally prohibited bystate regulatory commissions from recovering such costs in rates.
Demographic change thus places financial strain on all our public water systems. It is thesame whether they are large or small; urban or rural or suburban; and Rustbelt or Sunbelt.The inescapable fact is that water infrastructure is fixed while populations are mobile. Theresult is a form of “market failure”—an adverse side effect of market activity that creates anunfunded liability. America derives tremendous economic strength from the fact that it hasa highly mobile labor force. When people move around, however, there are costs imposedon the local water infrastructure. It is the same whether it is people moving from ruraltowns to the city, from the city to the suburbs, or from the Rustbelt to the Sunbelt. Ourlabor mobility imposes a significant cost on water utilities on both the giving end and thereceiving end of this market process, while the benefits are generally disseminatedthroughout the national economy.
16 AMERICAN WATER WORKS ASSOCIATION
Replacement of water treatment plants is also coming due.
Replacement of water treatment assets presents a different picture from that of the pipes,but greatly complicates infrastructure funding for utilities. Major investments in water andwastewater treatment plants were made in several waves following the growing under-standing of public health and sanitary engineering that evolved during the 20th Century.Of course, the installation pattern of treatment assets also reflects major populationgrowth trends. But whereas pipes can be expanded incrementally to serve growth, treat-ment must be built in larger blocks. Investments in treatment thus present a more con-centrated financing demand than investments in pipes.
Treatment assets are also much more short-lived than pipes. Concrete structures within atreatment plant may be the longest lasting elements in the plant, and may be good for 50to 70 years. However, most of the treatment components themselves typically need to bereplaced after 25 to 40 years or less. Replacement of treatment assets is therefore withinthe historical experience of today’s utility managers. Even so, many treatment plants builtor overhauled to meet EPA standards over the last 25 years are too young to have beenthrough a replacement cycle. Many are about due for their first replacement in the nextdecade or so.
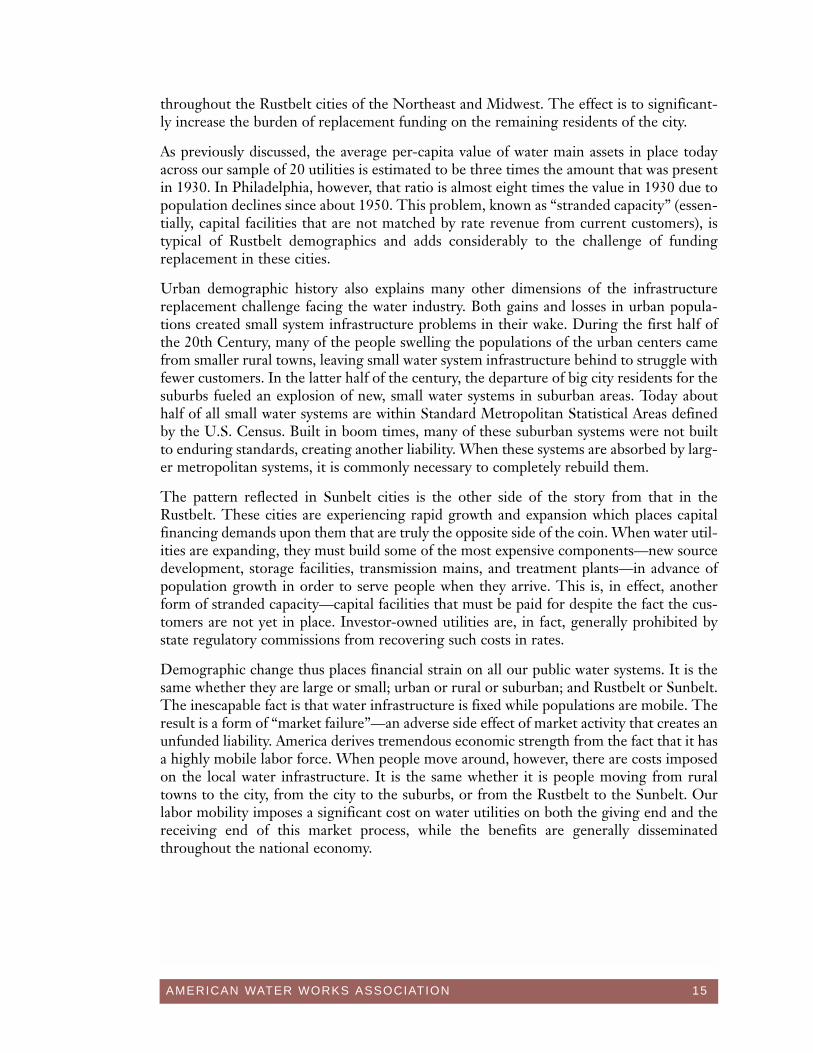
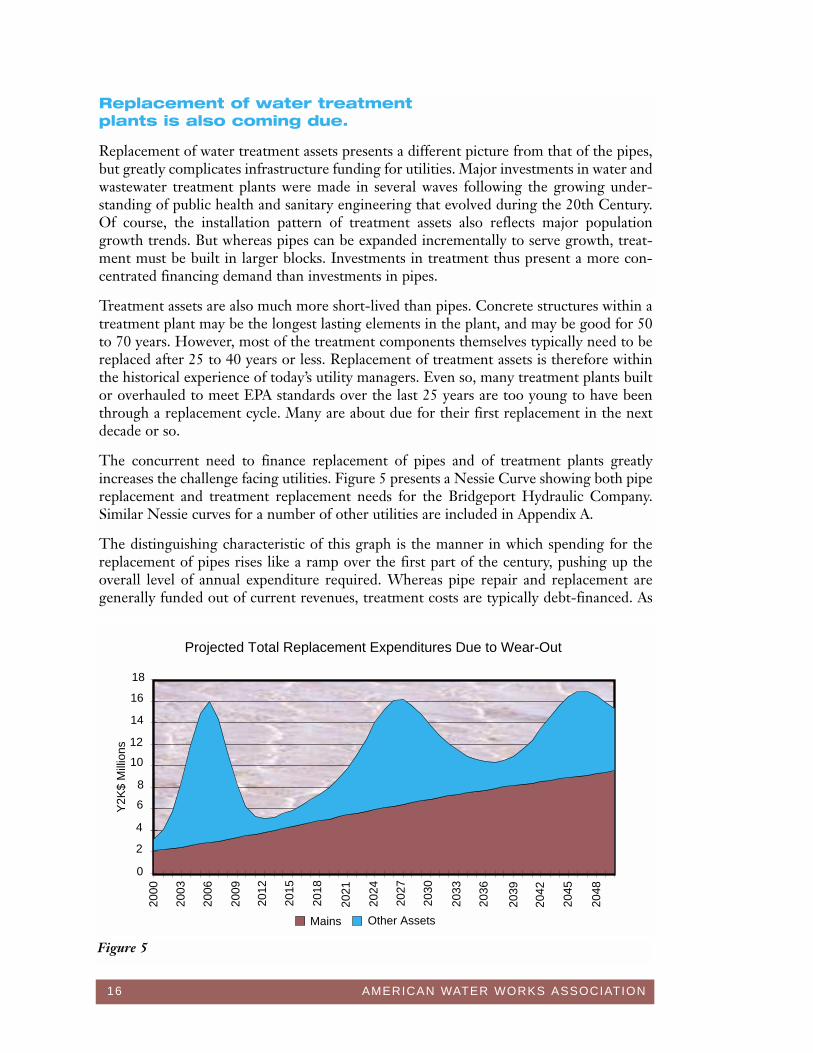
The concurrent need to finance replacement of pipes and of treatment plants greatlyincreases the challenge facing utilities. Figure 5 presents a Nessie Curve showing both pipereplacement and treatment replacement needs for the Bridgeport Hydraulic Company.Similar Nessie curves for a number of other utilities are included in Appendix A.
The distinguishing characteristic of this graph is the manner in which spending for thereplacement of pipes rises like a ramp over the first part of the century, pushing up theoverall level of annual expenditure required. Whereas pipe repair and replacement aregenerally funded out of current revenues, treatment costs are typically debt-financed. As
Projected Total Replacement Expenditures Due to Wear-Out
Y2K
$ M
illio
ns
Mains Other Assets
2000
2003
2006
2009
2012
2015
2018
2021
2024
2027
2030
2033
2036
2039
2042
2045
2048
18
16
14
12
10
8
6
4
2
0
Figure 5
AMERICAN WATER WORKS ASSOCIATION 17
utilities face ever rising costs for repair and replacement of pipes, more and more of theutility’s rate revenue will be required for those investments. This will leave the utility withincreasingly weakened credit every time it gets to another “treatment hump,” unless ratescan be raised to match the slope of the curve. A final point to note about the treatment costestimates used in developing Figure 5 and others like it in Appendix A is that these do notinclude the cost of new drinking water regulations likely to be implemented over the com-ing decades.
Increased expenditures are needed to climb the ramp and avoid a gap.
The Water Infrastructure Network (WIN) has developed a “gap analysis” to estimate thetotal increased spending that is required by water and wastewater utilities in order to avoidgetting behind in funding infrastructure replacement over the next 20 years.1 The first stepin the WIN estimate is accomplished by extrapolating from Census data on historical util-ity expenditures for 20 years into the future. The resulting baseline expenditure forecast isthen examined to see how much it must be increased in order to meet new expenditure“needs” for both new EPA compliance requirements and infrastructure repair and replace-ment over the same 20-year period. The “gap” between the baseline expenditure forecastand the future “needs” forecast is the amount of additional expenditure that must be forth-coming in order for water and wastewater utilities to maintain their critical infrastructurein a healthy condition.
The findings of this “gap analysis” indicate that the baseline expenditures of water utilitiesmust be increased by about $300 billion over 20 years to keep up with both compliance andinfrastructure needs. In similar fashion, the baseline expenditure trend in wastewater util-ities must be increased by about $400 billion to meet such needs. Taken together, andaccounting for the cost of capital, WIN has estimated that water and wastewater utilitiestogether need to increase their investments in infrastructure by almost $1 trillion over thenext 20 years.
The WIN “gap analysis” is easily misunderstood. Many have interpreted it to mean that atrillion-dollar deficiency already exists. It is important to stress that the gap estimate rep-resents the challenge ahead—the ramp that we must climb—in increasing utility expendi-tures in order to avoid such a deficiency. The AWWA Nessie Curve analysis of 20 utilitiesindicates that we are not now behind in maintaining our water infrastructure. There is nocurrent crisis in these 20 utilities. Rather, they are challenged with finding significant addi-tional funds over the next 30 years for investments in repair and replacement, in order toavoid getting behind.
Extrapolation from aggregate baseline trends, such as in the WIN gap analysis, is akin to“technical analysis” of the stock market using charts, graphs and trending techniques.Investment analysts typically like to supplement such “technical analysis” with “fundamentalanalysis” of the situation existing within individual companies. The AWWA Nessie Curveanalysis provides this type of supplemental perspective on increased expenditure needs.
1Water Infrastructure Network (WIN), Clean & Safe Water for the 21st Century, April 2000.
18 AMERICAN WATER WORKS ASSOCIATION
As illustrated in Figure 5, the Nessie Curve analysis indicates that expenditures on infra-structure repair and replacement must be significantly ramped-up over a period extendingfrom 2000 through 2030. The steep rise is shown to level off after that, but it does not goaway. Expenditures will have to continue to climb, albeit more gradually, throughout mostof the rest of the 21st Century. This shape is the signature pattern of the new replacementera that we have entered. It is not a short-term “hump” that we have to get over. Theshape of the challenge is that of a sustained rise in expenditures. This period of ramping-up is going to be a period of significant adjustments.
The Nessie Curves of the individual utilities shown in Appendix A present wide-rangingneeds for increased expenditure for replacement of pipes and treatment assets due to wear-out. In the 20 utilities studied, such needs total about $6 billion above current spending overthe next three decades. On a household basis, needs range from $550 to $2,300 over 30years. These figures do not include the prospective costs of numerous new SDWA regula-tions likely to be implemented over the coming decade, nor any costs from the wastewateror stormwater side of the urban utility business. Moreover, as seen in Appendix A, the utili-ties vary widely in the timing of these needs; some face sharp needs in the next 10 years,while others don’t face their highest needs for 10 or 20 years. The slope and the “humpy”patterns of increasing capital requirements are unique to each utility.
Our sample of 20 utilities represents relatively large water utilities. On a per householdbasis, the total 20-year capital needs for replacement illustrated in our sample is about thesame as that estimated by EPA for large water systems in their newly released DrinkingWater Needs Survey.2
The EPA Drinking Water Needs Survey uses a site visit methodology and a large samplingprogram to document needs in small systems and is probably the best information avail-able on small system needs. Extrapolating from EPA’s estimated 20-year capital need forsmall systems, we project the total 30-year expenditure for infrastructure repair andreplacement in small systems might be in a range of $1,490 per household to $6,200 perhousehold.
The result of this “fundamental analysis” using Nessie Curves is not inconsistent with theorder of magnitude of the need that WIN estimates to be facing water utilities ($300 bil-lion over 20 years). Extrapolation from our 20 sets of Nessie Curves suggests that the needmight be on the order of $250 billion nationally and extend over three decades. However,the Nessie Curve forecast is based on an assumption that pipes are left in the ground untiltheir economic life is over. The reality in utility operation is that myriad other influencescan cause the replacement need to arise sooner. These include urban redevelopment,modernization, coordination with other city construction schedules, increasing pipe size,and other factors.
2 U.S. Environmental Protection Agency, 1999 Drinking Water Infrastructure Needs Survey (EPA 816-R-01-004), February 2001.
AMERICAN WATER WORKS ASSOCIATION 19
Addressing affordability is the heart of the challenge.
The central question for policy makers and utilities is whether the increased rate of infra-structure spending that utilities must face over the next 30 years can be financed by the util-ities themselves at rates customers can afford. AWWA remains, committed to the principlethat utilities should be self-sustaining through their rates. For many utilities, however, thedegree of change involved in adapting to the dawning replacement era, the adverse effectof demographic change on per household costs, and the competing demand for investmentin wastewater and other municipal services, will combine to present a significant afford-ability challenge.
There are two related dimensions to the affordability concern. First is the ability of utili-ties to finance the needed additional expenditures within their rates. Second is the impactof higher rates on households.
In developing this study, AWWA brought together a group of utility managers from acrossthe country to discuss infrastructure issues. This group characterized the question from alocal perspective as an “affordability gap” or a “reality gap” and defined it as “the differ-ence between what you think you should be spending on infrastructure and what you oryour customers can afford to spend in reality.” This characterization of the problem reflectsthe difficulty of obtaining significant utility rate increases. Rate increases are best receivedwhen implemented gradually in a number of installments over several years. Unfortunately,the rate increases required to meet the challenges of pipe replacement that utilities nowface cannot be smoothly implemented in many cases.
There is small likelihood that the $550 to $2,300 per household projected to be requiredfor infrastructure repair and replacement in our 20 utilities over the next 30 years can bespread evenly or taken on gradually over that period. As illustrated in Appendix A, someNessie curves present a steeper funding challenge and some present a gentler slope due tolocal variations in the historical demographic trends. There are “humps” on the up-rampfor replacement of treatment plants and other equipment. Additional “humpy” expendi-tures for compliance with anticipated new regulations are not included. In small systems,the estimated $1,490 to $6,200 range of household impact is likely to be even more con-centrated since the original demographics were themselves more concentrated.
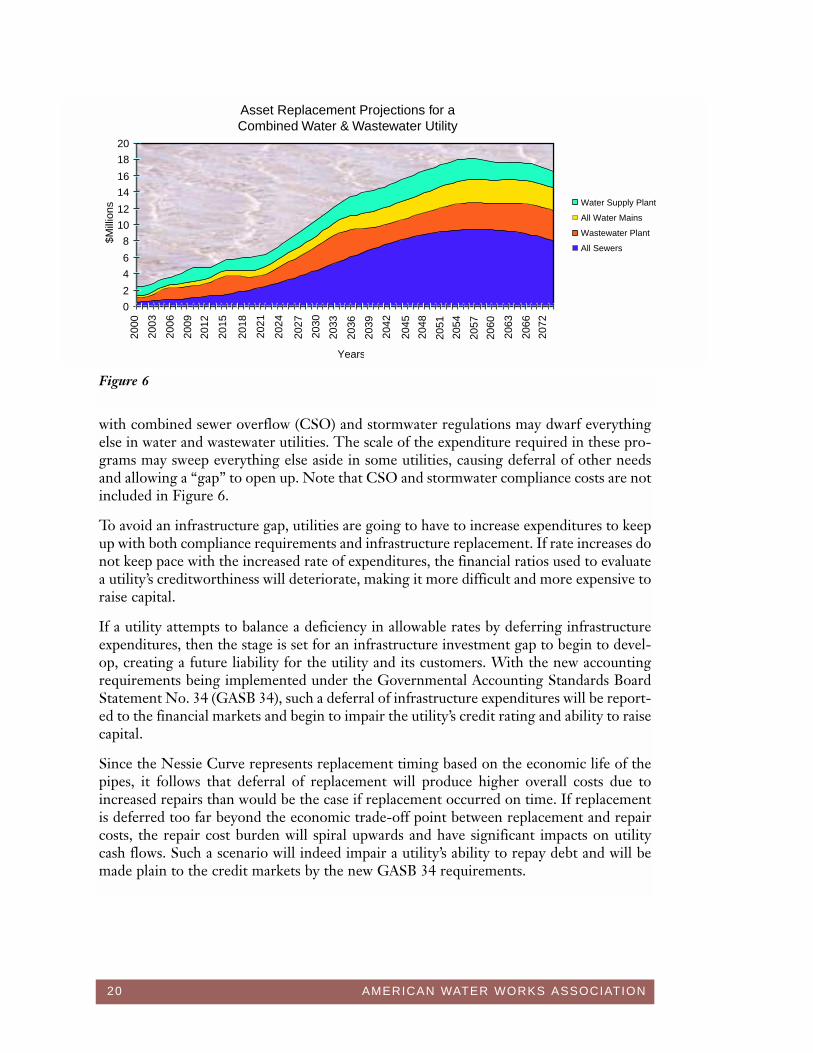
Compliance-driven requirements to replace treatment plants and invest to meet new man-dates will also dominate expenditures and push aside the more subtle need for investmentsin pipe replacement. This is exacerbated by the fact that the costs of water and wastewaterservice appear on the same bill in most communities. Thus, the needs to replace wastewatertreatment plants and to replace wastewater lines compete with drinking water needs for thesame consumer dollar. Sewer pipes generally impose higher unit replacement costs thanwater pipes, owing to their inherent characteristics (size, depth, etc.). Figure 6 presents aNessie curve for a combined water and wastewater utility showing replacement fundingneeds for both water and wastewater pipes and other assets (treatment, pumping, etc.). Thefigure illustrates the typical relationship between water supply and wastewater costs—wastewater facilities cost noticeably more to replace.
The combined repair and replacement needs for water and wastewater infrastructureamount to a significant financing challenge in their own right. But the cost of compliance
20 AMERICAN WATER WORKS ASSOCIATION
with combined sewer overflow (CSO) and stormwater regulations may dwarf everythingelse in water and wastewater utilities. The scale of the expenditure required in these pro-grams may sweep everything else aside in some utilities, causing deferral of other needsand allowing a “gap” to open up. Note that CSO and stormwater compliance costs are notincluded in Figure 6.
To avoid an infrastructure gap, utilities are going to have to increase expenditures to keepup with both compliance requirements and infrastructure replacement. If rate increases donot keep pace with the increased rate of expenditures, the financial ratios used to evaluatea utility’s creditworthiness will deteriorate, making it more difficult and more expensive toraise capital.
If a utility attempts to balance a deficiency in allowable rates by deferring infrastructureexpenditures, then the stage is set for an infrastructure investment gap to begin to devel-op, creating a future liability for the utility and its customers. With the new accountingrequirements being implemented under the Governmental Accounting Standards BoardStatement No. 34 (GASB 34), such a deferral of infrastructure expenditures will be report-ed to the financial markets and begin to impair the utility’s credit rating and ability to raisecapital.
Since the Nessie Curve represents replacement timing based on the economic life of thepipes, it follows that deferral of replacement will produce higher overall costs due toincreased repairs than would be the case if replacement occurred on time. If replacementis deferred too far beyond the economic trade-off point between replacement and repaircosts, the repair cost burden will spiral upwards and have significant impacts on utilitycash flows. Such a scenario will indeed impair a utility’s ability to repay debt and will bemade plain to the credit markets by the new GASB 34 requirements.
0
2
4
6
8
10
12
14
16
18
20
Years
Water Supply Plant
All Water Mains
Wastewater Plant
All Sewers
2000
2003
2006
2009
2012
2015
2018
2021
2024
2027
2030
2033
2036
2039
2042
2045
2048
2051
2054
2057
2060
2063
2066
2072
Asset Replacement Projections for aCombined Water & Wastewater Utility
$Mill
ions
Figure 6
AMERICAN WATER WORKS ASSOCIATION 21
In either of these scenarios—rates that don’t keep up with expenditures or expendituresthat don’t keep up with needs—the bottom line is the same. If both expenditures and raterevenues cannot be increased at the required rate, then the utility’s credit may be impaired,and it may face even higher costs as a result. For some utilities, there is the potential forthis to become a vicious cycle—a financial trap. These systemic financial risks are the rea-son why we have a clear and present need for an enhanced partnership between utilities,states and the federal government. We need to provide the means to assist utilities “up theramp and over the humps.” We need to minimize the credit risks utilities face over the nextthree decades as we make the adjustments in rates required to assure sustainability in thenew replacement era.
The second, and all important, dimension of the affordability challenge is the bottom-lineimpact of increased water rates on household budgets. AWWA believes it is critical to avoidsudden and significant changes in rates that can induce “rate shock” among customers. Thebroader issue involved in rate shock ties back to the pivotal role of safe drinking water inpromoting public health.
America has by far the safest drinking water in the world. Standards promulgated under theSafe Drinking Water Act aspire to the highest levels of technology and treatment opti-mization known to science. As we push farther into the limits of science and technology,we unavoidably encounter diminishing returns in terms of quantifiable health benefits atthe same time that we must take on increasing marginal costs. Many new standards relateto very subtle health concerns that are difficult to substantiate and quantify. Yet, to be pro-tective of health, there is a tendency to err on the side of safety, especially when the threatsmay relate to sensitive subpopulations such as children, the unborn, the elderly and thehealth-impaired.
This is where the issue of rate shock must be brought into focus as a public health concern.Whenever the sensitive subpopulations we are striving to protect are also among the low-income segment of the population and are forced to forego medical care or nutrition inorder to pay their utility bills, we could be doing more harm than good. The fact that weare now entering a significantly more expensive replacement era in water infrastructuremakes it all the more difficult to maintain the right balance in this aspect of public health.By some comparisons, it may appear that water is still cheap and there is room to increasewater rates. But such comparisons are not relevant to low-income households. The onlycomparison that matters in these households is the size of the incremental increase. If it islarge enough to trigger a budget substitution that negatively affects family health—forexample, giving up a prenatal visit in order to pay a utility bill—then we may be losingground.
Over the past decade, utilities have formed an increasingly closer partnership with EPA,states, the environmental community, the public health community and other groups tocontinue to make progress for public health despite significant scientific challenges. Thispartnership must now be broadened to address the financial challenges of infrastructurereplacement in order to preserve the fruits of our labors in the public health arena.
22 AMERICAN WATER WORKS ASSOCIATION
RECOMMENDATIONS
Considering all of these facts, the American Water Works Association believes it is timefor a new American partnership for clean and safe water. This partnership requires that alllevels of government and utilities play a role in working through the significant challengesahead. Specifically, we recommend:
1) Measures by Utilities and Local Governments
The infrastructure funding issue varies from place to place, reflecting the age, characterand history of the community. Although AWWA has looked at the infrastructure issue inthe aggregate, many key questions must be asked and answered at the local utility level.The development of a comprehensive local strategy can bring these elements into focusand create a new “reality” that will help make infrastructure repair and replacement moreaffordable. Such a comprehensive strategy includes:
• Assessing the condition of the drinking water system infrastructure. Over thelast few decades, utilities around the world have been developing innovative newapproaches to managing long-lived buried infrastructure. In North America andoverseas, some utilities are already taking advantage of tools such as geographicinformation systems, using new information to advance the state of the art andaggressively managing infrastructure replacement. Planning tools can help identi-fy and plan for needed investment decades in advance of the actual need for funds.We should learn from, adapt, and use such tools.
• Strengthening research and development. Although there is not likely to be asingle “silver bullet” to solve infrastructure management problems, an impressivearray of technological tools have been moving through the research and develop-ment process in recent years. Efforts to develop and deliver such tools should bestrengthened.
• Working with the public to increase awareness of the challenge ahead, assesslocal rate structures, and adjust rates as necessary. For many years, water andwastewater utilities have been nicknamed “the silent service.” Utilities have quiet-ly provided an extremely reliable supply of high-quality water at relatively lowrates compared to other public utilities and services. Partly as a result, a large num-ber of utilities, particularly smaller ones, do not have appropriate rate structures.The 1996 SDWA requirement for Consumer Confidence Reports provides a vehi-cle for many utilities to take the first step in broadening their dialogue with cus-tomers and the public at-large. Comprehensive, focused, and strategic communi-cations programs serve the dual function of providing consumers with importantinformation about their water systems and building support for needed invest-ments in infrastructure.
• Building the managerial capacity of many water systems. Congress took newsteps in the 1996 SDWA Amendments to assure the institutional capacity of smallsystems applying for state revolving fund loans. Much more remains to be done inthis area. EPA, in conjunction with water associations, could sponsor training pro-grams on appropriate rate structures, designed specifically to deliver assistance tosmall systems in planning for full cost recovery through rates.
AMERICAN WATER WORKS ASSOCIATION 23
2) Reform of State Programs
The states, too, have an important role to play in addressing our infrastructure fundingneeds. States may need to match an appropriate share of any new federal funds that are pro-vided for infrastructure assistance. Moreover, they need to reform their existing programsto make them more effective. For example, some states have not allowed larger systems toaccess the existing state revolving fund, or have excluded investor-owned systems. Somestates encumber their revolving funds with nonproductive red tape, charge high loan orig-ination and other fees, or charge loan rates that are equivalent to market rates. Some statespreclude the use of alternate procurement methods that minimize infrastructure procure-ment costs. For example, the “design/build” process for infrustructure procurement hasbeen documented to save 20–40% of construction costs for new treatment plants in somecases. Public procurement laws in many states, while not explicitly banning design/build,mandate a process that prevents its use where local authorities have determined it wouldbe advantageous.
The result is that, in many states, revolving loan funds have not proved to be useful or attrac-tive even to drinking water utilities desperately in need of capital. States should commit to:
• Respecting the universal eligibility of all water systems for federal assistance.
• Streamlining their programs for delivery of assistance and allowing alternative pro-curement procedures that save money.
• Making their financing mechanisms more attractive by committing to grants andvery low or negative interest loans.
• Using federal funds in a timely fashion or facing the reprogramming of those fundsto other states.
3) A Significant Increase in Federal Assistance
After accounting for the cost savings that can come from best practices in asset manage-ment, the development of new technologies, efforts to increase ratepayer awareness and sup-port, and possible alternative compliance scenarios, for many utilities there is likely to remaina gap between the required expenditure increases and the practical ability to raise water rates.This gap could grow over the next few decades as infrastructure built in the late-1800s tomid-1900s must be repaired, replaced, and rehabilitated at the same time that we are tryingto enhance the level of water treatment under the Safe Drinking Water Act (SDWA).
AWWA remains committed to the principle that utility operations should be fully supportedby rates. In the long run, the objectives must be to manage the costs of replacing pipes andtreatment plants and ensure financial sustainability through local rate structures. However,many utilities are going to face a period of adjustment in adapting to the new reality of thereplacement era described in this report. Many utilities and their customers will need addi-tional assistance in working through extraordinary replacement needs in the next 20 years.
The difference between drinking water utilities’ current expenditures for infrastructurereplacement and the needed level of expenditure is estimated by WIN to be about $11 bil-lion per year over the next 20 years. If the federal government were to provide half the costof this gap, the federal share of total utility spending would amount to under 12 percent oftotal utility spending. For comparison, the federal share of investment in roads, bridges,and airports is 80 percent.
24 AMERICAN WATER WORKS ASSOCIATION
To prevent the development of a gap in critical water infrastructure financing, AWWArecommends either changing and expanding the existing Drinking Water State RevolvingFund and other drinking water programs or creating a new, infrastructure-focused fund.Such a fund should provide:
• Significantly increased federal funding.
• Clear eligibility of projects to repair, replace, or rehabilitate drinking water infra-structure.
• Universal eligibility of all water systems, both public and investor owned, regard-less of size.
• Ability to make grants or loans in any combination and to use other financing toolsto leverage public and private capital.
• Reasonable terms and conditions such as demonstration of system viability andability to repay a loan.
• Streamlined procedures for those accessing the funds.
Research is a critical component of a comprehensive federal program on infrastructure.Research stimulates the development of new techniques and unleashes American ingenu-ity. It offers the chance to save billions of dollars over the years to come through more effi-cient management, repair, and replacement technologies. The federal government shouldsignificantly increase its support for research on infrastructure management, repair andreplacement technologies, methods for extending pipe life, and other means of advancingthe art while lowering the cost of infrastructure management.
Finally, the federal government should take other important steps to better access andleverage public and private capital. Congress should consider:
• Development of a national water infrastructure financing bond bank similar toFannie Mae.
• Tax code and other reforms to increase the availability and use of private capital.This could include steps such as the removal of constraints on private activitybonds, development of subsidized bond insurance, provision of federal loan guar-antees, and improved investment tax credit incentives.
CONCLUSION
Considering when pipes were laid down in many water systems and how long they can beexpected to last, it is clear that a new age—the replacement era—has arrived for water util-ities. Over the next 30 years, infrastructure replacement needs will compete with compli-ance needs for limited resources. Clearly, infrastructure needs and compliance with theSafe Drinking Water Act can’t be approached as separate issues, but need to be addressedtogether.
Only in the true spirit of a new partnership, as outlined in this report, can we think mostbroadly about these issues. Only in this spirit can we achieve the goals to which we allaspire: the provision of safe and affordable water to all Americans.
AMERICAN WATER WORKS ASSOCIATION A1
Reinvesting in Drinking WaterInfrastructure
Dawn of the Replacement Era
APPENDIX A
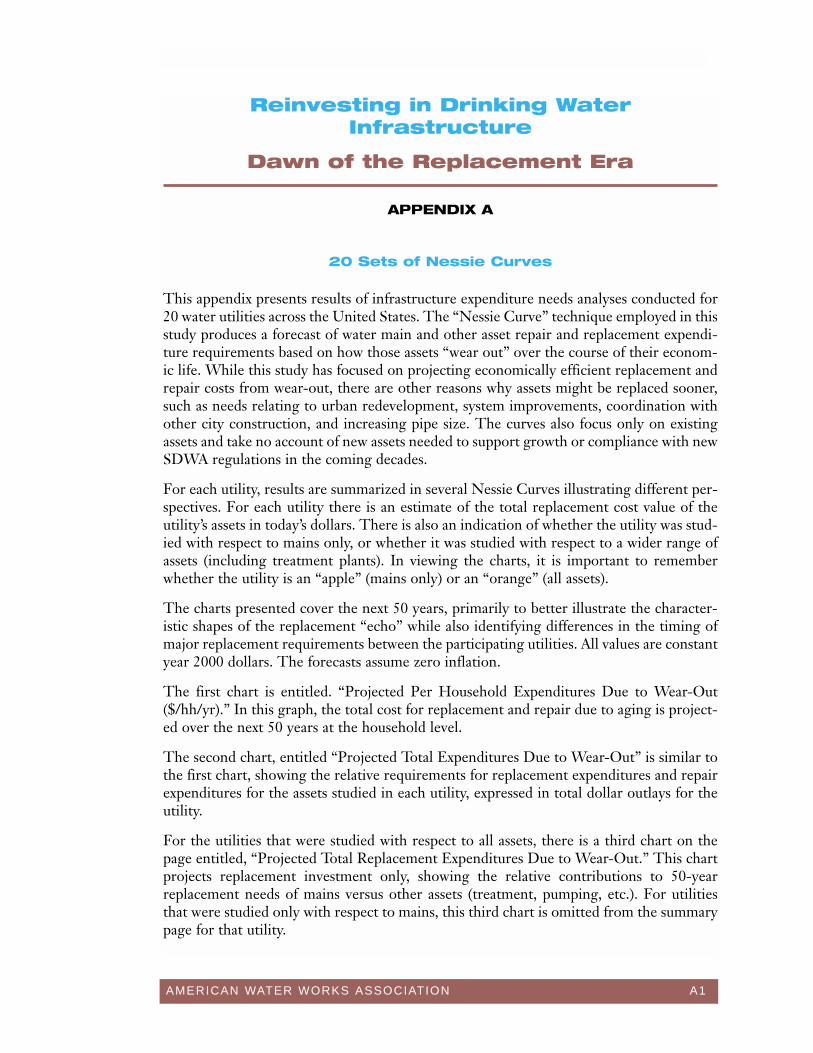
20 Sets of Nessie Curves
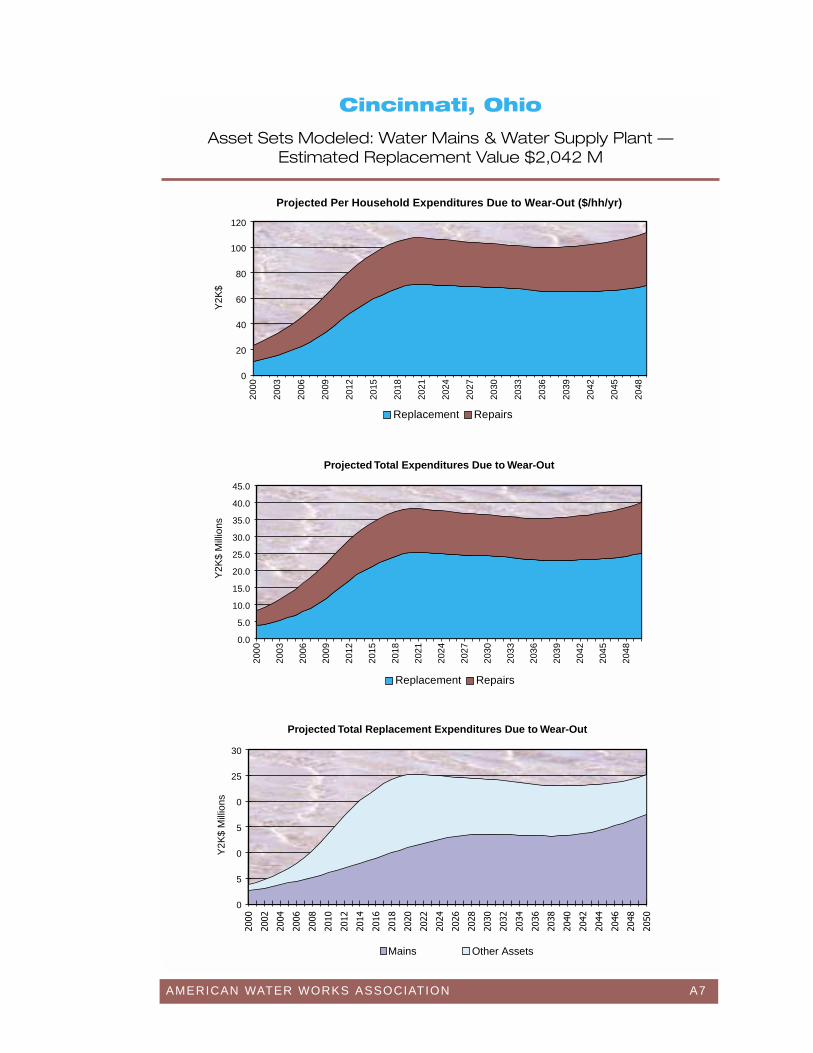
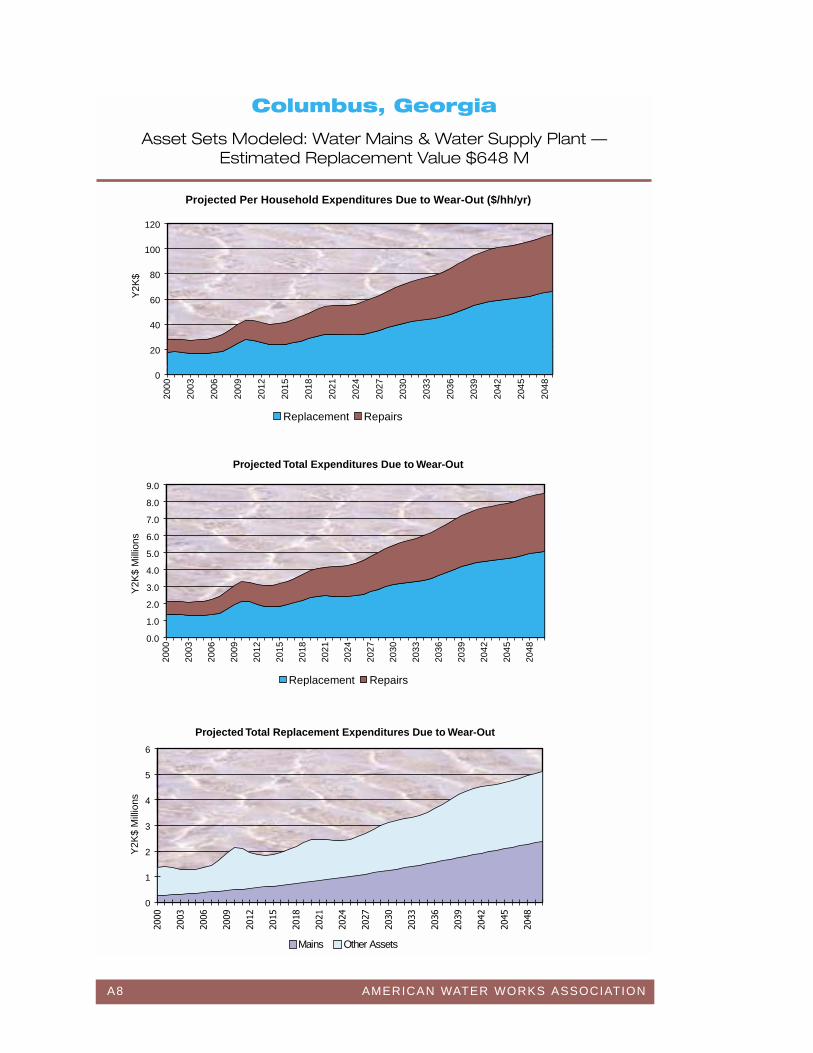
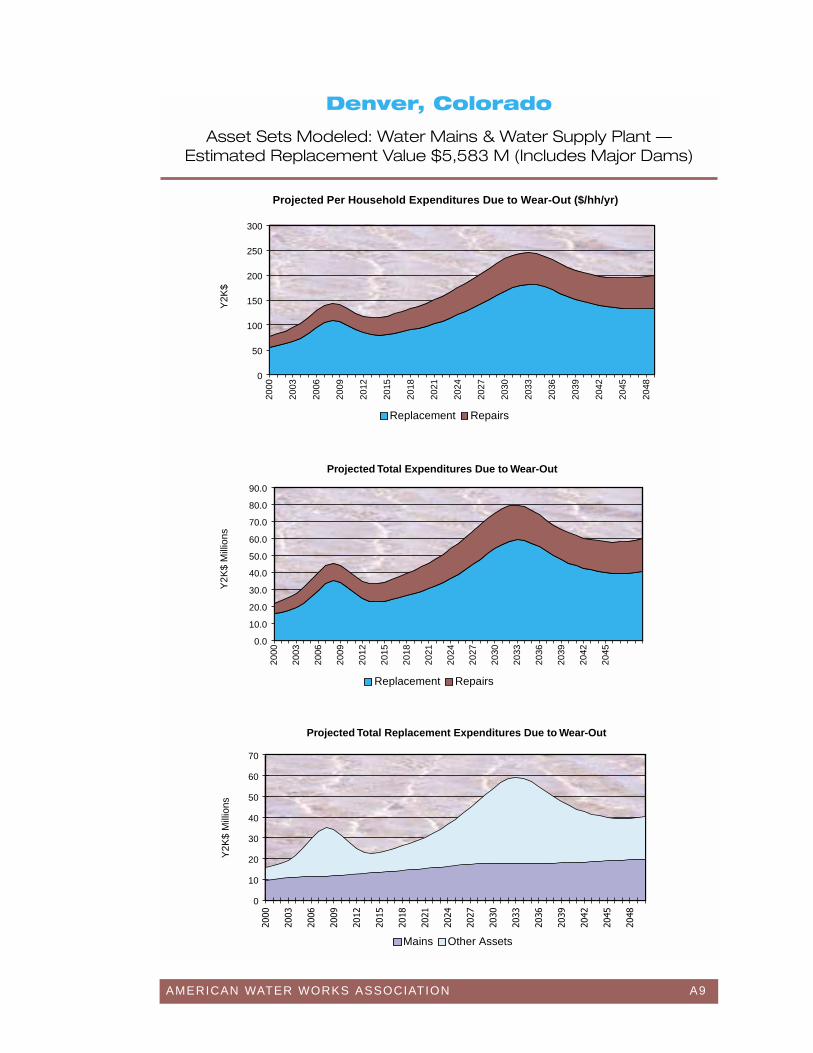
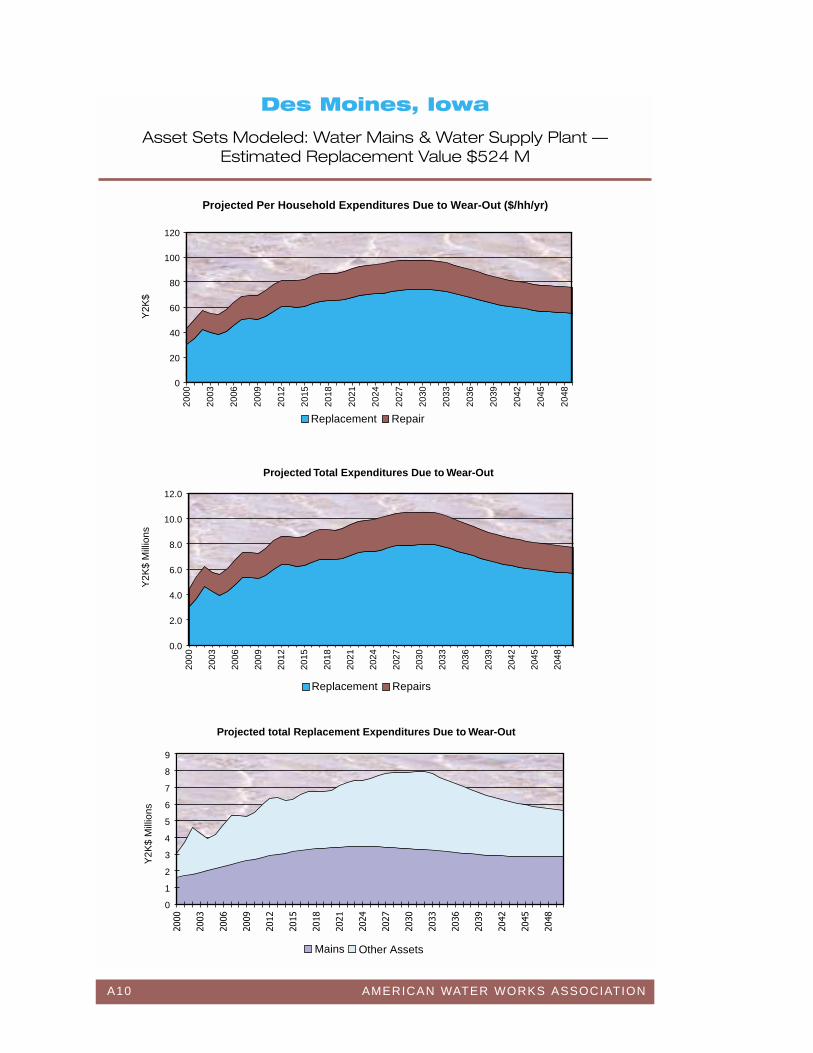
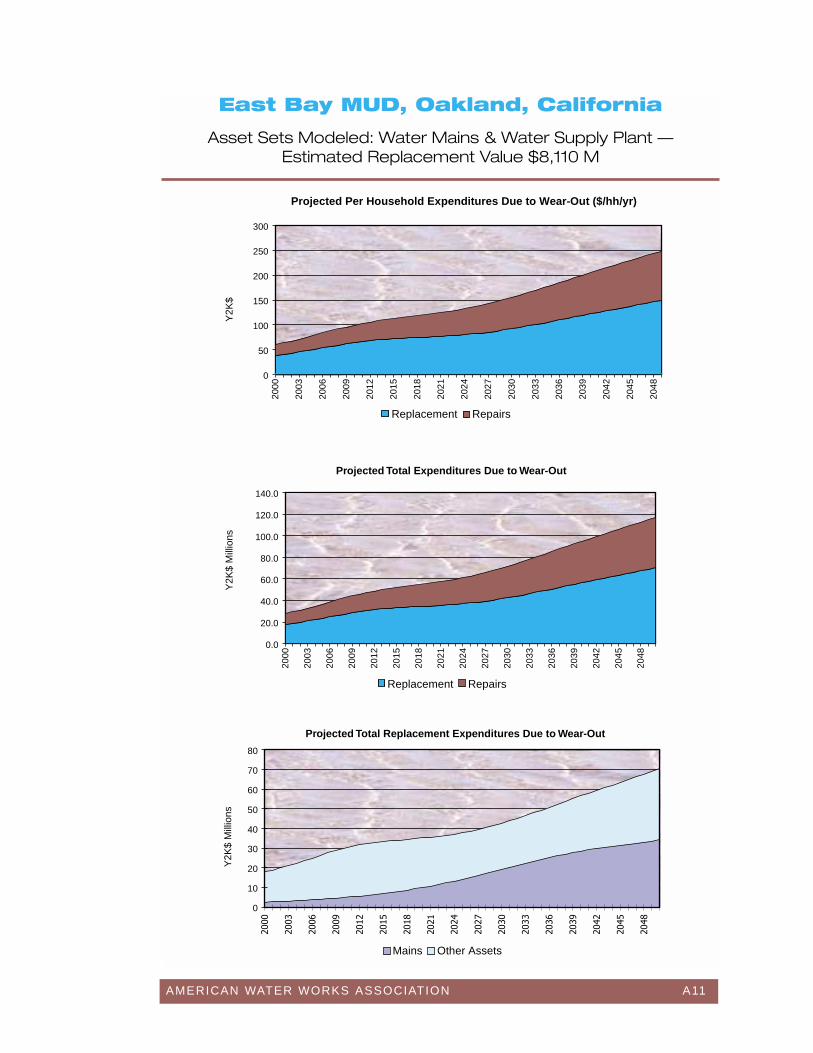
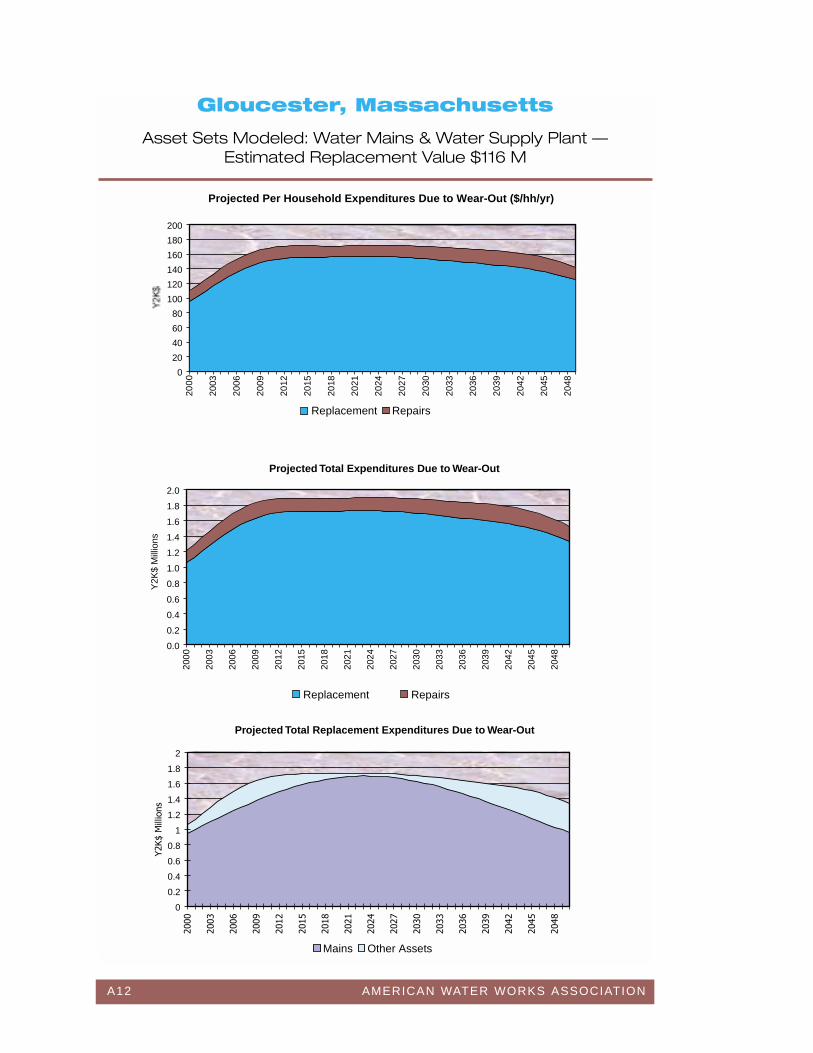
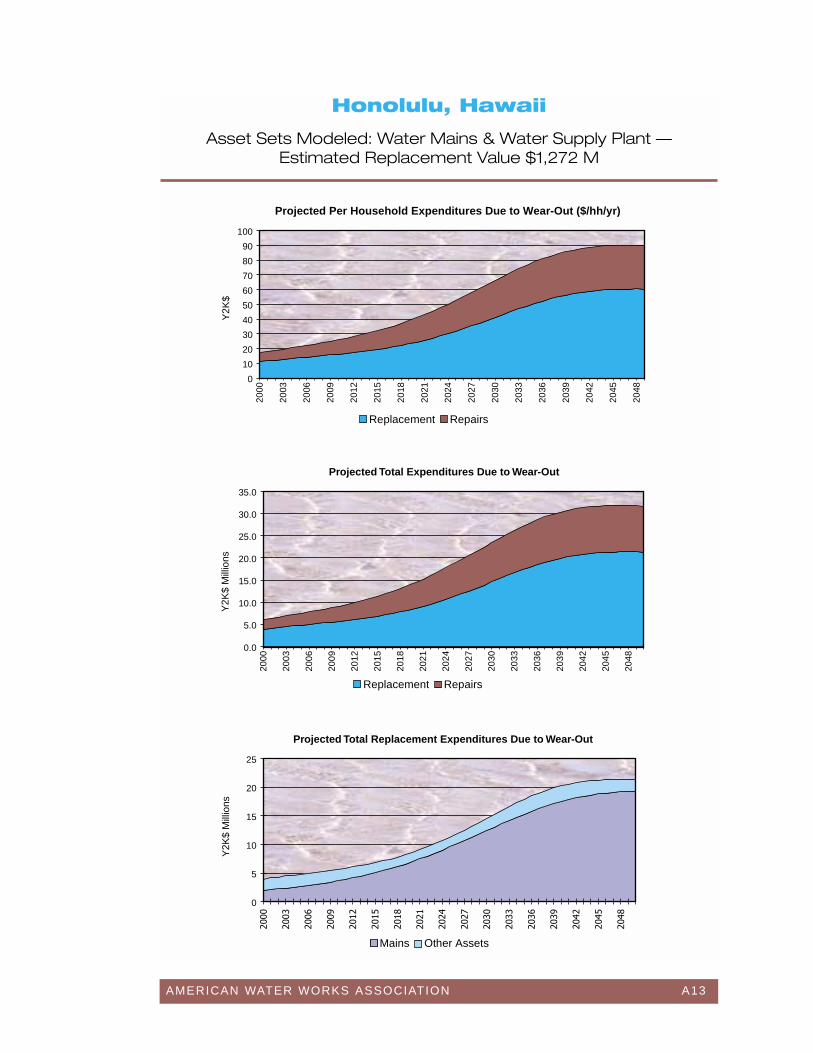
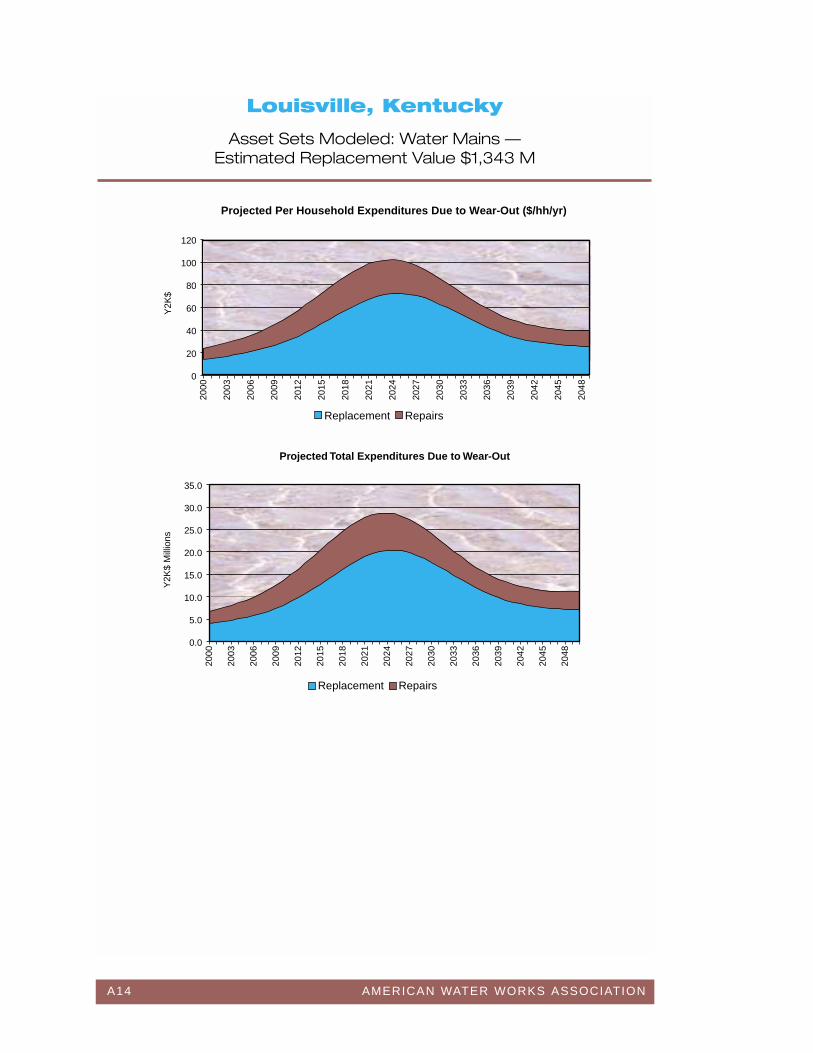
This appendix presents results of infrastructure expenditure needs analyses conducted for20 water utilities across the United States. The “Nessie Curve” technique employed in thisstudy produces a forecast of water main and other asset repair and replacement expendi-ture requirements based on how those assets “wear out” over the course of their econom-ic life. While this study has focused on projecting economically efficient replacement andrepair costs from wear-out, there are other reasons why assets might be replaced sooner,such as needs relating to urban redevelopment, system improvements, coordination withother city construction, and increasing pipe size. The curves also focus only on existingassets and take no account of new assets needed to support growth or compliance with newSDWA regulations in the coming decades.
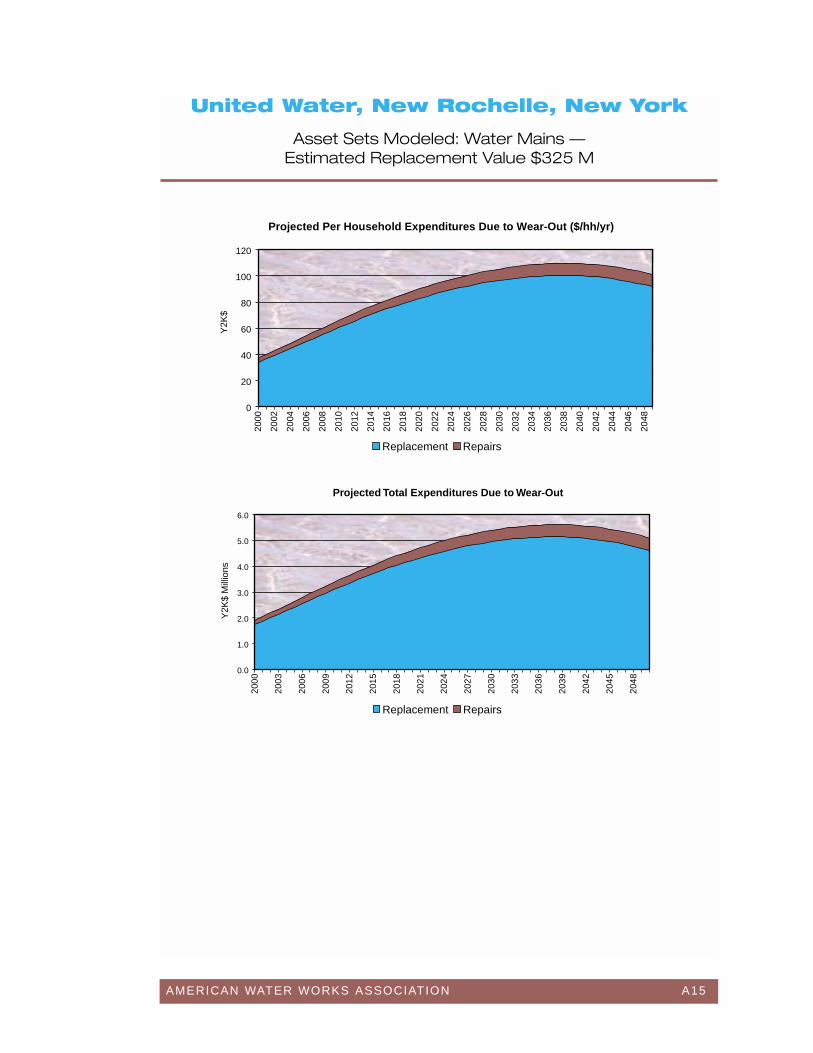
For each utility, results are summarized in several Nessie Curves illustrating different per-spectives. For each utility there is an estimate of the total replacement cost value of theutility’s assets in today’s dollars. There is also an indication of whether the utility was stud-ied with respect to mains only, or whether it was studied with respect to a wider range ofassets (including treatment plants). In viewing the charts, it is important to rememberwhether the utility is an “apple” (mains only) or an “orange” (all assets).
The charts presented cover the next 50 years, primarily to better illustrate the character-istic shapes of the replacement “echo” while also identifying differences in the timing ofmajor replacement requirements between the participating utilities. All values are constantyear 2000 dollars. The forecasts assume zero inflation.
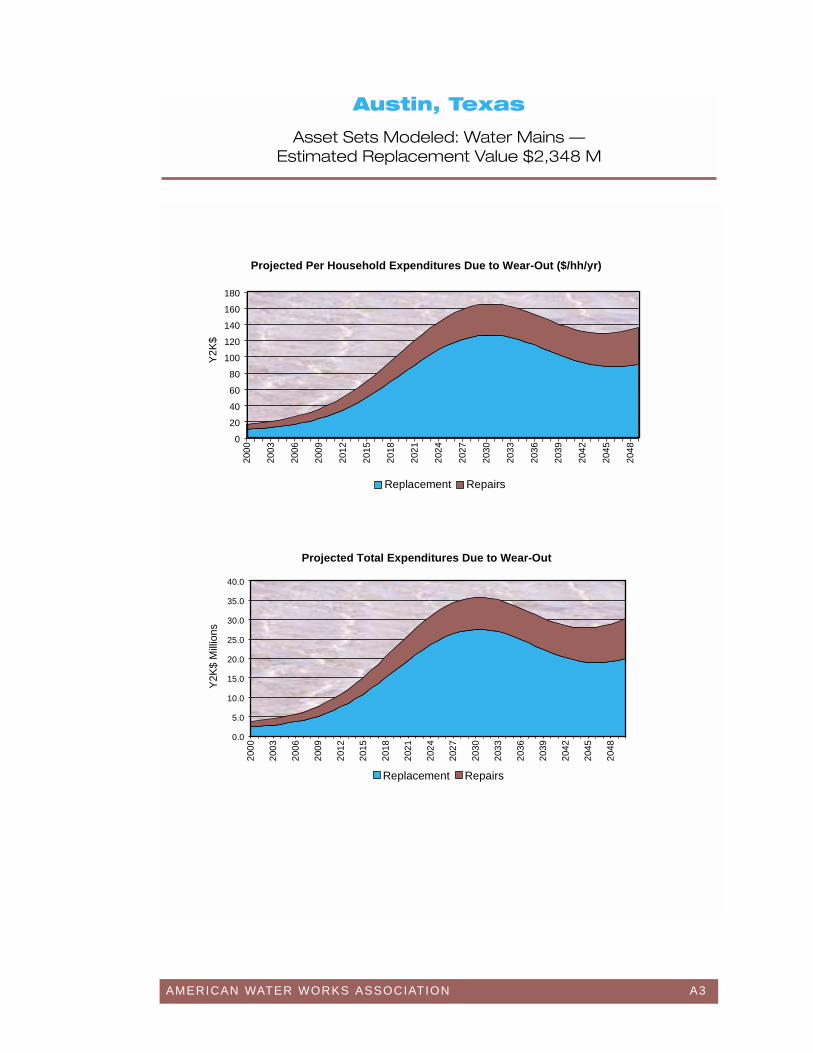
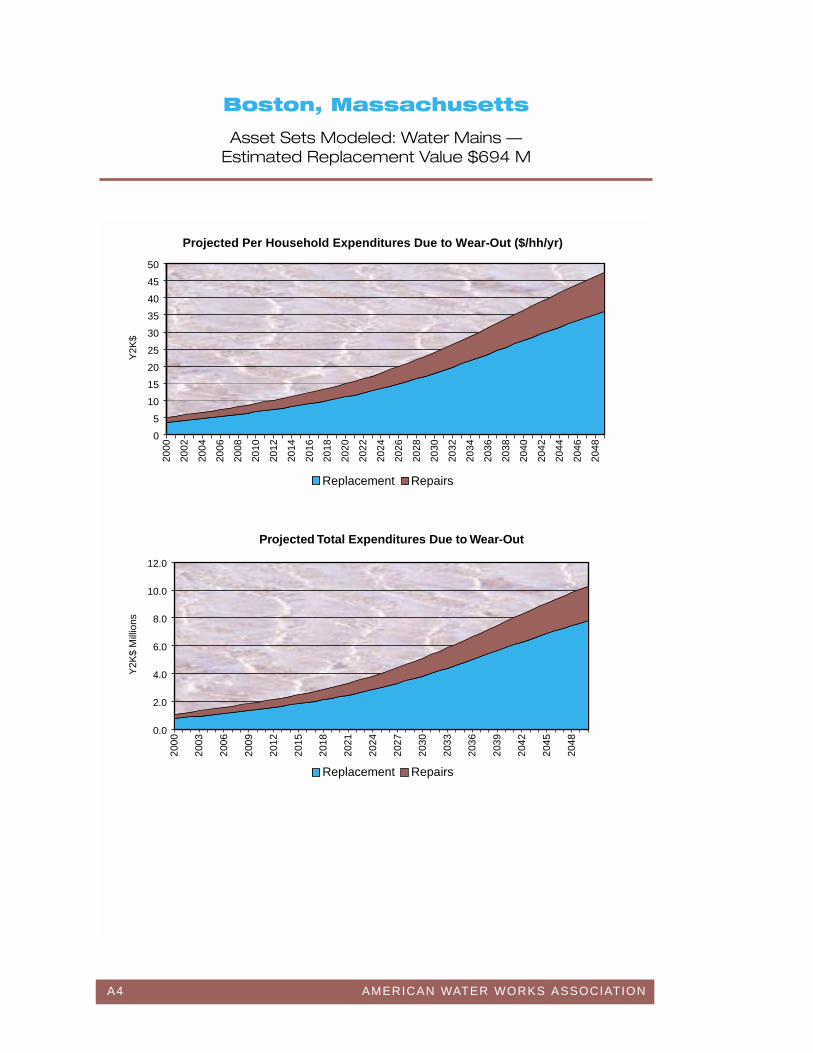
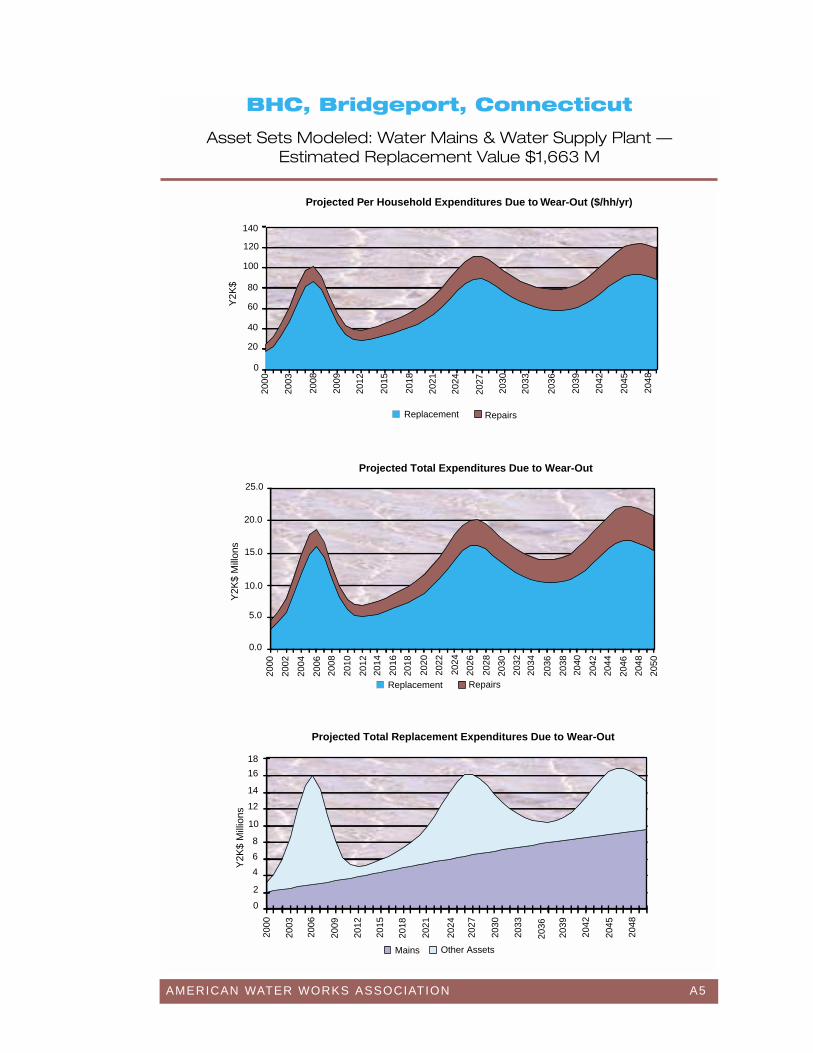
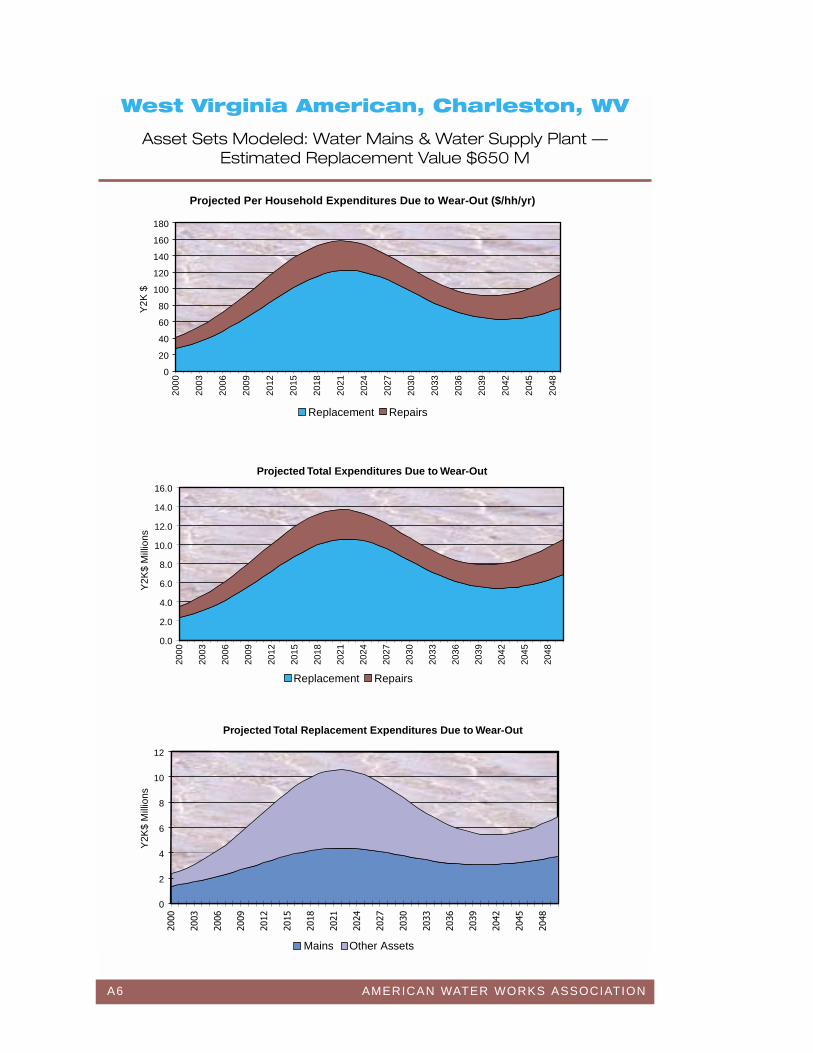
The first chart is entitled. “Projected Per Household Expenditures Due to Wear-Out($/hh/yr).” In this graph, the total cost for replacement and repair due to aging is project-ed over the next 50 years at the household level.
The second chart, entitled “Projected Total Expenditures Due to Wear-Out” is similar tothe first chart, showing the relative requirements for replacement expenditures and repairexpenditures for the assets studied in each utility, expressed in total dollar outlays for theutility.
For the utilities that were studied with respect to all assets, there is a third chart on thepage entitled, “Projected Total Replacement Expenditures Due to Wear-Out.” This chartprojects replacement investment only, showing the relative contributions to 50-yearreplacement needs of mains versus other assets (treatment, pumping, etc.). For utilitiesthat were studied only with respect to mains, this third chart is omitted from the summarypage for that utility.
A2 AMERICAN WATER WORKS ASSOCIATION
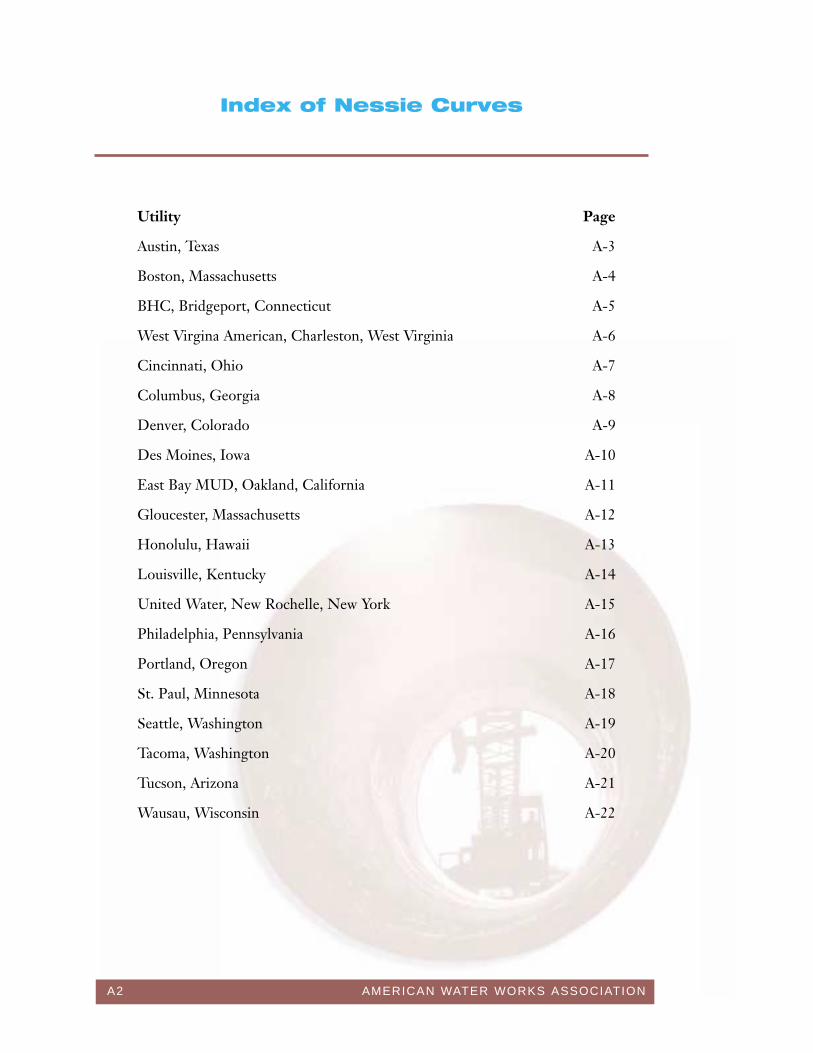
Index of Nessie Curves
Utility Page
Austin, Texas A-3
Boston, Massachusetts A-4
BHC, Bridgeport, Connecticut A-5
West Virgina American, Charleston, West Virginia A-6
Cincinnati, Ohio A-7
Columbus, Georgia A-8
Denver, Colorado A-9
Des Moines, Iowa A-10
East Bay MUD, Oakland, California A-11
Gloucester, Massachusetts A-12
Honolulu, Hawaii A-13
Louisville, Kentucky A-14
United Water, New Rochelle, New York A-15
Philadelphia, Pennsylvania A-16
Portland, Oregon A-17
St. Paul, Minnesota A-18
Seattle, Washington A-19
Tacoma, Washington A-20
Tucson, Arizona A-21
Wausau, Wisconsin A-22
AMERICAN WATER WORKS ASSOCIATION A3
Austin, Texas
Asset Sets Modeled: Water Mains — Estimated Replacement Value $2,348 M
Projected Per Household Expenditures Due to Wear-Out ($/hh/yr)
0
20
40
60
80
100
120
140
160
180
2000
2003
2006
2009
2012
2015
2018
2021
2024
2027
2030
2033
2036
2039
2042
2045
2048
Replacement Repairs
Projected Total Expenditures Due to Wear-Out
0.0
5.0
10.0
15.0
20.0
25.0
30.0
35.0
40.0
2000
2003
2006
2009
2012
2015
2018
2021
2024
2027
2030
2033
2036
2039
2042
2045
2048
Replacement Repairs
Y2K
$Y
2K$
Mill
ions
A4 AMERICAN WATER WORKS ASSOCIATION
Boston, Massachusetts
Asset Sets Modeled: Water Mains — Estimated Replacement Value $694 M
Projected Per Household Expenditures Due to Wear-Out ($/hh/yr)
0
5
10
15
20
25
30
35
40
45
50
2000
2002
2004
2006
2008
2010
2012
2014
2016
2018
2020
2022
2024
2026
2028
2030
2032
2034
2036
2038
2040
2042
2044
2046
2048
Replacement Repairs
0.0
2.0
4.0
6.0
8.0
10.0
12.0
2000
2003
2006
2009
2012
2015
2018
2021
2024
2027
2030
2033
2036
2039
2042
2045
2048
Replacement Repairs
Projected Total Expenditures Due to Wear-Out
Y2K
$ M
illio
nsY
2K$
AMERICAN WATER WORKS ASSOCIATION A5
BHC, Bridgeport, Connecticut
Asset Sets Modeled: Water Mains & Water Supply Plant — Estimated Replacement Value $1,663 M
Y2K
$Y
2K$
Mill
ons
Y2K
$ M
illio
ns
Projected Total Expenditures Due to Wear-Out
Projected Total Replacement Expenditures Due to Wear-Out
140
120
100
80
60
40
20
0
2000
2003
2008
2009
2012
2015
2018
2021
2024
2027
2030
2033
2036
2039
2042
2045
2048
Projected Per Household Expenditures Due to Wear-Out ($/hh/yr)
25.0
20.0
15.0
10.0
5.0
0.0
Replacement Repairs
2000
2002
2004
2006
2008
2010
2012
2014
2016
2018
2020
2022
2024
2026
2028
2030
2032
2034
2036
2038
2040
2042
2044
2046
2048
2050
Replacement Repairs
Mains Other Assets
18
16
14
12
10
8
6
4
2
0
2000
2003
2006
2009
2048
2045
2042
2039
2036
2033
2012
2030
2024
2027
2021
2018
2015
A6 AMERICAN WATER WORKS ASSOCIATION
West Virginia American, Charleston, WV
Asset Sets Modeled: Water Mains & Water Supply Plant — Estimated Replacement Value $650 M
Projected Per Household Expenditures Due to Wear-Out ($/hh/yr)
0
20
40
60
80
100
120
140
160
180
2000
2003
2006
2009
2012
2015
2018
2021
2024
2027
2030
2033
2036
2039
2042
2045
2048
Replacement Repairs
0.0
2.0
4.0
6.0
8.0
10.0
12.0
14.0
16.0
2000
2003
2006
2009
2012
2015
2018
2021
2024
2027
2030
2033
2036
2039
2042
2045
2048
Replacement Repairs
0
2
4
6
8
10
12
����
����
����
����
����
����
����
����
���
���
����
����
����
����
���
���
���
Mains Other Assets
Projected Total Expenditures Due to Wear-Out
Projected Total Replacement Expenditures Due to Wear-Out
Y2K
$Y
2K$
Mill
ions
Y2K
$ M
illio
ns
AMERICAN WATER WORKS ASSOCIATION A7
Cincinnati, Ohio
Asset Sets Modeled: Water Mains & Water Supply Plant — Estimated Replacement Value $2,042 M
0
5
0
5
0
25
30
����
����
���
����
����
����
����
���
����
����
����
����
���
����
����
����
����
���
����
����
���
���
��
���
���
����
Mains Other Assets
Projected Total Replacement Expenditures Due to Wear-Out
Projected Per Household Expenditures Due to Wear-Out ($/hh/yr)
0
20
40
60
80
100
120
2000
2003
2006
2009
2012
2015
2018
2021
2024
2027
2030
2033
2036
2039
2042
2045
2048
Replacement Repairs
0.0
5.0
10.0
15.0
20.0
25.0
30.0
35.0
40.0
45.0
2000
2003
2006
2009
2012
2015
2018
2021
2024
2027
2030
2033
2036
2039
2042
2045
2048
Replacement Repairs
Projected Total Expenditures Due to Wear-Out
Y2K
$Y
2K$
Mill
ions
Y2K
$ M
illio
ns
A8 AMERICAN WATER WORKS ASSOCIATION
Columbus, Georgia
Asset Sets Modeled: Water Mains & Water Supply Plant — Estimated Replacement Value $648 M
Projected Per Household Expenditures Due to Wear-Out ($/hh/yr)
0
20
40
60
80
100
120
2000
2003
2006
2009
2012
2015
2018
2021
2024
2027
2030
2033
2036
2039
2042
2045
2048
Replacement Repairs
0.0
1.0
2.0
3.0
4.0
5.0
6.0
7.0
8.0
9.0
2000
2003
2006
2009
2012
2015
2018
2021
2024
2027
2030
2033
2036
2039
2042
2045
2048
Replacement Repairs
0
1
2
3
4
5
6
����
����
����
����
����
����
����
����
���
���
����
����
����
����
���
���
���
Mains Other Assets
Projected Total Expenditures Due to Wear-Out
Projected Total Replacement Expenditures Due to Wear-Out
Y2K
$Y
2K$
Mill
ions
Y2K
$ M
illio
ns
AMERICAN WATER WORKS ASSOCIATION A9
Denver, Colorado
Asset Sets Modeled: Water Mains & Water Supply Plant — Estimated Replacement Value $5,583 M (Includes Major Dams)
Projected Per Household Expenditures Due to Wear-Out ($/hh/yr)
0
50
100
150
200
250
300
2000
2003
2006
2009
2012
2015
2018
2021
2024
2027
2030
2033
2036
2039
2042
2045
2048
Replacement Repairs
0.0
10.0
20.0
30.0
40.0
50.0
60.0
70.0
80.0
90.0
2000
2003
2006
2009
2012
2015
2018
2021
2024
2027
2030
2033
2036
2039
2042
2045
Replacement Repairs
0
10
20
30
40
50
60
70
����
����
����
����
����
����
����
����
���
���
����
����
����
����
���
���
���
�
Mains Other Assets
Projected Total Expenditures Due to Wear-Out
Projected Total Replacement Expenditures Due to Wear-Out
Y2K
$Y
2K$
Mill
ions
Y2K
$ M
illio
ns
A10 AMERICAN WATER WORKS ASSOCIATION
Des Moines, Iowa
Asset Sets Modeled: Water Mains & Water Supply Plant — Estimated Replacement Value $524 M
Projected Per Household Expenditures Due to Wear-Out ($/hh/yr)
0
20
40
60
80
100
120
2000
2003
2006
2009
2012
2015
2018
2021
2024
2027
2030
2033
2036
2039
2042
2045
2048
Replacement Repair
0.0
2.0
4.0
6.0
8.0
10.0
12.0
2000
2003
2006
2009
2012
2015
2018
2021
2024
2027
2030
2033
2036
2039
2042
2045
2048
Replacement Repairs
0
1
2
3
4
5
6
7
8
9
����
����
����
����
����
����
����
����
���
���
����
����
����
����
���
���
���
Mains Other Assets
Projected Total Expenditures Due to Wear-Out
Projected total Replacement Expenditures Due to Wear-Out
Y2K
$Y
2K$
Mill
ions
Y2K
$ M
illio
ns
AMERICAN WATER WORKS ASSOCIATION A11
East Bay MUD, Oakland, California
Asset Sets Modeled: Water Mains & Water Supply Plant — Estimated Replacement Value $8,110 M
Projected Per Household Expenditures Due to Wear-Out ($/hh/yr)
0
50
100
150
200
250
300
2000
2003
2006
2009
2012
2015
2018
2021
2024
2027
2030
2033
2036
2039
2042
2045
2048
Replacement Repairs
0.0
20.0
40.0
60.0
80.0
100.0
120.0
140.0
2000
2003
2006
2009
2012
2015
2018
2021
2024
2027
2030
2033
2036
2039
2042
2045
2048
Replacement Repairs
0
10
20
30
40
50
60
70
80
����
����
����
����
����
����
����
����
���
���
����
����
����
����
���
���
���
Mains Other Assets
Projected Total Replacement Expenditures Due to Wear-Out
Projected Total Expenditures Due to Wear-Out
Y2K
$Y
2K$
Mill
ions
Y2K
$ M
illio
ns
A12 AMERICAN WATER WORKS ASSOCIATION
Gloucester, Massachusetts
Asset Sets Modeled: Water Mains & Water Supply Plant — Estimated Replacement Value $116 M
Projected Per Household Expenditures Due to Wear-Out ($/hh/yr)
0
20
40
60
80
100
120
140
160
180
200
200
0
2003
2006
2009
2012
2015
2018
2021
2024
2027
2030
2033
2036
2039
2042
2045
2048
Replacement Repairs
0.0
0.2
0.4
0.6
0.8
1.0
1.2
1.4
1.6
1.8
2.0
2000
2003
2006
2009
2012
2015
2018
2021
2024
2027
2030
2033
2036
2039
2042
2045
2048
Replacement Repairs
0
0.2
0.4
0.6
0.8
1
1.2
1.4
1.6
1.8
2
����
����
����
����
����
����
����
����
���
���
����
����
����
����
���
���
���
�� ���
�����
��
Mains Other Assets
Projected Total Expenditures Due to Wear-Out
Projected Total Replacement Expenditures Due to Wear-Out
Y2K
$ M
illio
ns
AMERICAN WATER WORKS ASSOCIATION A13
Honolulu, Hawaii
Asset Sets Modeled: Water Mains & Water Supply Plant — Estimated Replacement Value $1,272 M
Projected Per Household Expenditures Due to Wear-Out ($/hh/yr)
0
10
20
30
40
50
60
70
80
90
100
2000
2003
2006
2009
2012
2015
2018
2021
2024
2027
2030
2033
2036
2039
2042
2045
2048
Replacement Repairs
0.0
5.0
10.0
15.0
20.0
25.0
30.0
35.0
2000
2003
2006
2009
2012
2015
2018
2021
2024
2027
2030
2033
2036
2039
2042
2045
2048
Replacement Repairs
0
5
10
15
20
25
����
����
����
����
����
����
����
����
���
���
����
����
����
����
���
���
���
Mains Other Assets
Projected Total Expenditures Due to Wear-Out
Projected Total Replacement Expenditures Due to Wear-Out
Y2K
$Y
2K$
Mill
ions
Y2K
$ M
illio
ns
A14 AMERICAN WATER WORKS ASSOCIATION
Louisville, Kentucky
Asset Sets Modeled: Water Mains — Estimated Replacement Value $1,343 M
Projected Per Household Expenditures Due to Wear-Out ($/hh/yr)
0
20
40
60
80
100
120
2000
2003
2006
2009
2012
2015
2018
2021
2024
2027
2030
2033
2036
2039
2042
2045
2048
Replacement Repairs
0.0
5.0
10.0
15.0
20.0
25.0
30.0
35.0
2000
2003
2006
2009
2012
2015
2018
2021
2024
2027
2030
2033
2036
2039
2042
2045
2048
Replacement Repairs
Projected Total Expenditures Due to Wear-Out
Y2K
$Y
2K$
Mill
ions
AMERICAN WATER WORKS ASSOCIATION A15
United Water, New Rochelle, New York
Asset Sets Modeled: Water Mains —Estimated Replacement Value $325 M
Projected Per Household Expenditures Due to Wear-Out ($/hh/yr)
0
20
40
60
80
100
12020
00
2002
2004
2006
2008
2010
2012
2014
2016
2018
2020
2022
2024
2026
2028
2030
2032
2034
2036
2038
2040
2042
2044
2046
2048
Replacement Repairs
0.0
1.0
2.0
3.0
4.0
5.0
6.0
2000
2003
2006
2009
2012
2015
2018
2021
2024
2027
2030
2033
2036
2039
2042
2045
2048
Replacement Repairs
Projected Total Expenditures Due to Wear-Out
Y2K
$Y
2K$
Mill
ions
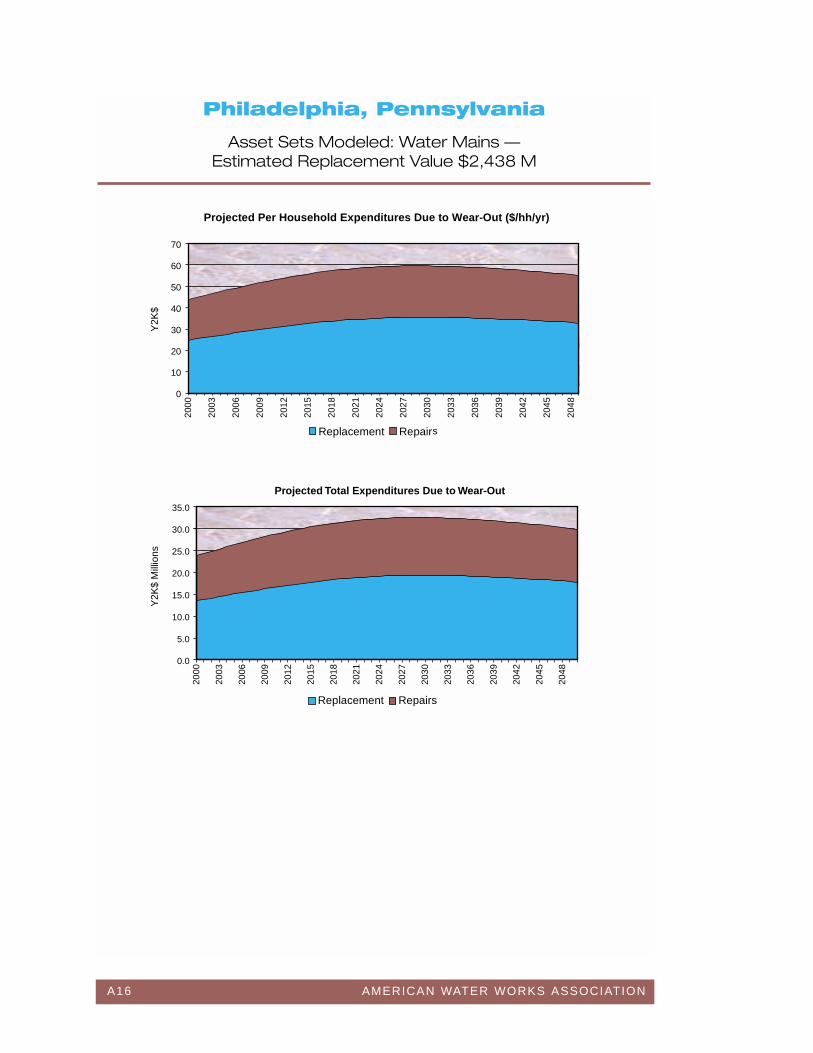
A16 AMERICAN WATER WORKS ASSOCIATION
Philadelphia, Pennsylvania
Asset Sets Modeled: Water Mains — Estimated Replacement Value $2,438 M
Projected Per Household Expenditures Due to Wear-Out ($/hh/yr)
0
10
20
30
40
50
60
70
2000
2003
2006
2009
2012
2015
2018
2021
2024
2027
2030
2033
2036
2039
2042
2045
2048
Replacement Repair
0.0
5.0
10.0
15.0
20.0
25.0
30.0
35.0
2000
2003
2006
2009
2012
2015
2018
2021
2024
2027
2030
2033
2036
2039
2042
2045
2048
Replacement Repairs
Projected Total Expenditures Due to Wear-Out
s
Y2K
$ M
illio
nsY
2K$
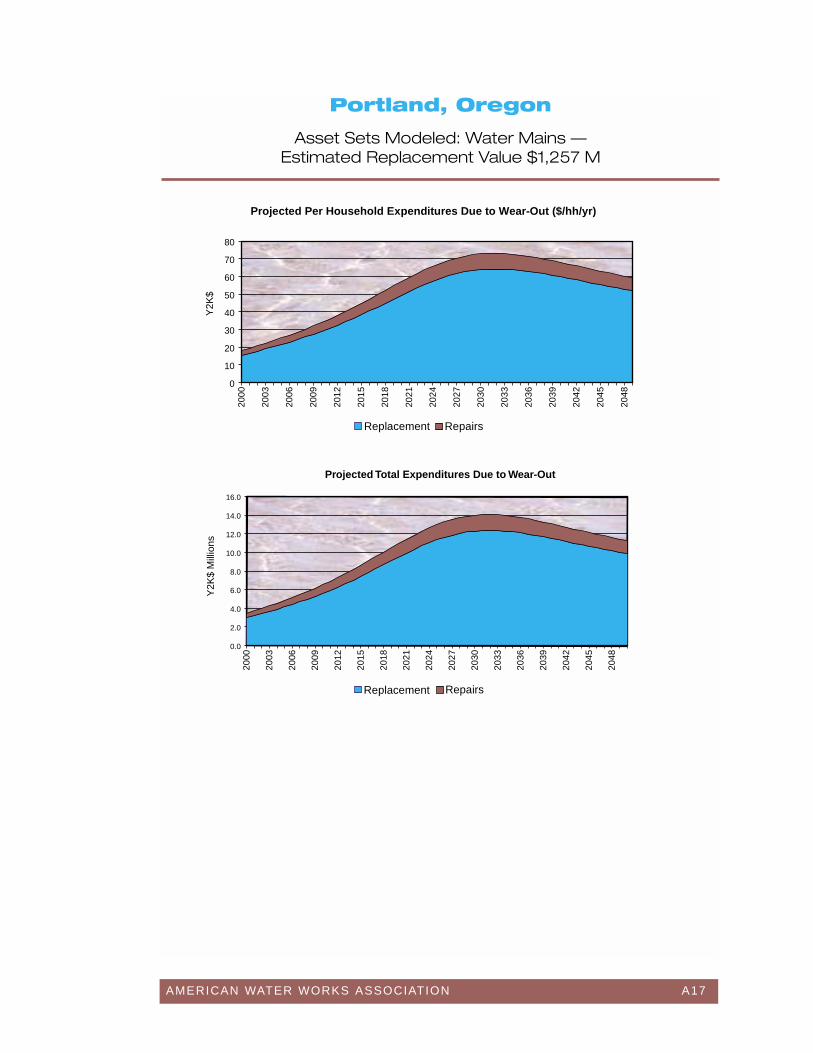
AMERICAN WATER WORKS ASSOCIATION A17
Portland, Oregon
Asset Sets Modeled: Water Mains — Estimated Replacement Value $1,257 M
Projected Per Household Expenditures Due to Wear-Out ($/hh/yr)
0
10
20
30
40
50
60
70
8020
00
2003
2006
2009
2012
2015
2018
2021
2024
2027
2030
2033
2036
2039
2042
2045
2048
Replacement Repairs
0.0
2.0
4.0
6.0
8.0
10.0
12.0
14.0
16.0
2000
2003
2006
2009
2012
2015
2018
2021
2024
2027
2030
2033
2036
2039
2042
2045
2048
Replacement Repairs
Projected Total Expenditures Due to Wear-Out
Y2K
$ M
illio
nsY
2K$
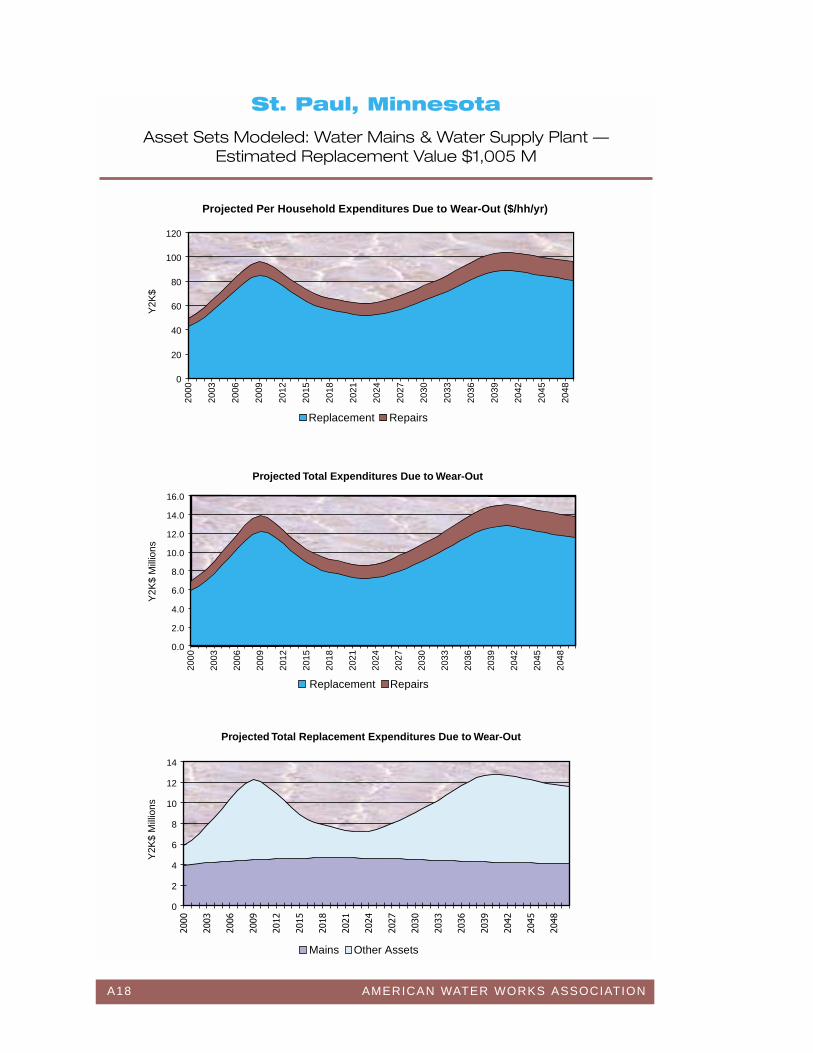
A18 AMERICAN WATER WORKS ASSOCIATION
St. Paul, Minnesota
Asset Sets Modeled: Water Mains & Water Supply Plant — Estimated Replacement Value $1,005 M
Projected Per Household Expenditures Due to Wear-Out ($/hh/yr)
0
20
40
60
80
100
120
2000
2003
2006
2009
2012
2015
2018
2021
2024
2027
2030
2033
2036
2039
2042
2045
2048
Replacement Repairs
0.0
2.0
4.0
6.0
8.0
10.0
12.0
14.0
16.0
2000
2003
2006
2009
2012
2015
2018
2021
2024
2027
2030
2033
2036
2039
2042
2045
2048
Replacement Repairs
0
2
4
6
8
10
12
14
����
����
����
����
����
����
����
����
���
���
����
����
����
����
���
���
���
Mains Other Assets
Projected Total Expenditures Due to Wear-Out
Projected Total Replacement Expenditures Due to Wear-Out
Y2K
$Y
2K$
Mill
ions
Y2K
$ M
illio
ns
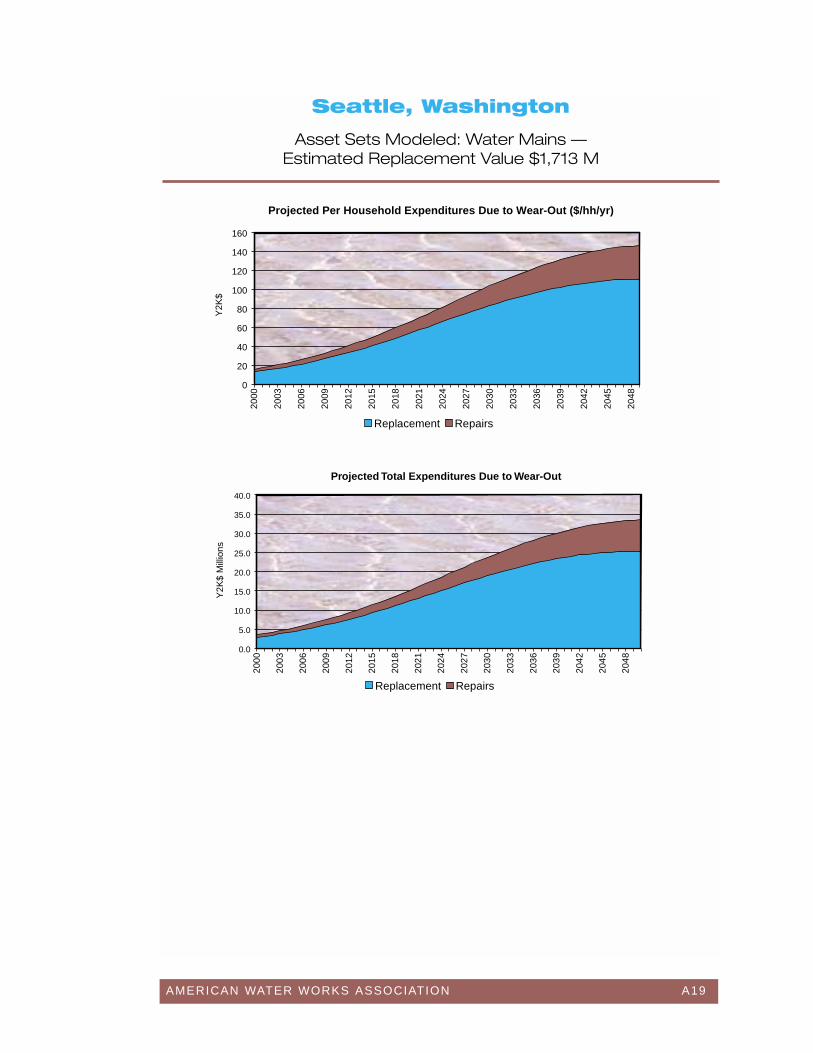
AMERICAN WATER WORKS ASSOCIATION A19
Seattle, Washington
Asset Sets Modeled: Water Mains — Estimated Replacement Value $1,713 M
Projected Per Household Expenditures Due to Wear-Out ($/hh/yr)
0
20
40
60
80
100
120
140
160
2000
2003
2006
2009
2012
2015
2018
2021
2024
2027
2030
2033
2036
2039
2042
2045
2048
Replacement Repairs
0.0
5.0
10.0
15.0
20.0
25.0
30.0
35.0
40.0
2000
2003
2006
2009
2012
2015
2018
2021
2024
2027
2030
2033
2036
2039
2042
2045
2048
Replacement Repairs
Projected Total Expenditures Due to Wear-Out
Y2K
$Y
2K$
Mill
ions
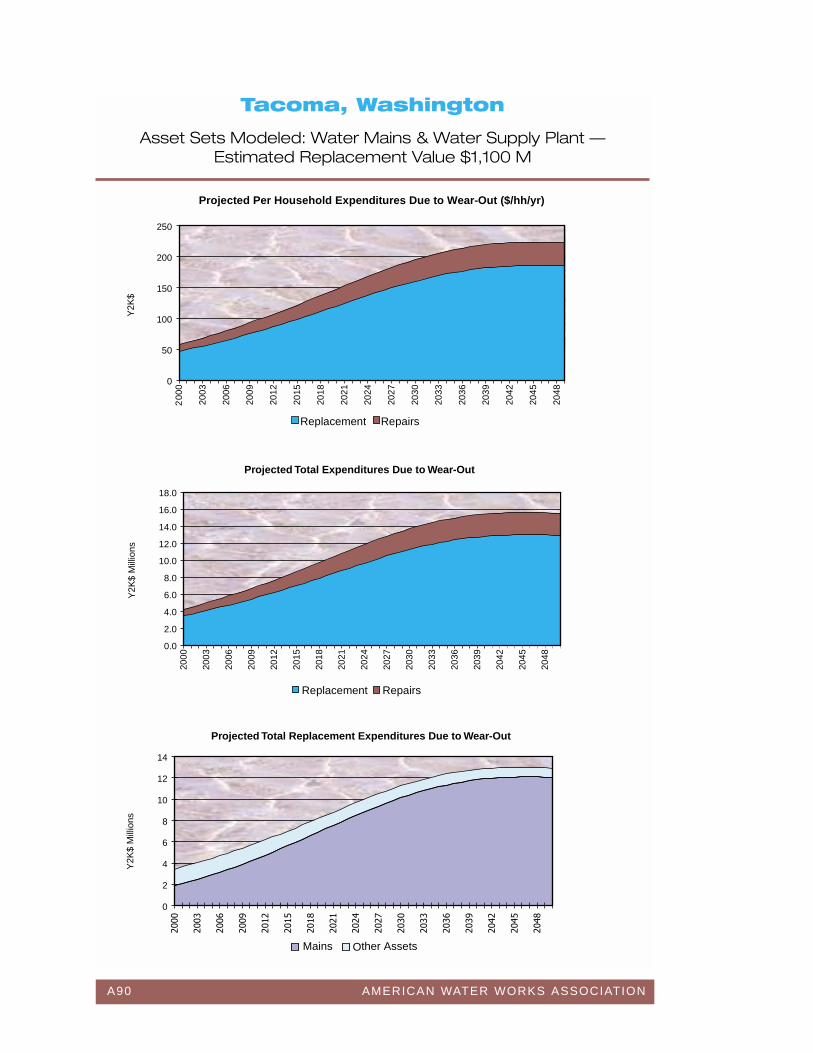
A90 AMERICAN WATER WORKS ASSOCIATION
Tacoma, Washington
Asset Sets Modeled: Water Mains & Water Supply Plant — Estimated Replacement Value $1,100 M
Projected Per Household Expenditures Due to Wear-Out ($/hh/yr)
0
50
100
150
200
250
200
0
2003
2006
2009
2012
2015
2018
2021
2024
2027
2030
2033
2036
2039
2042
2045
2048
Replacement Repairs
0.0
2.0
4.0
6.0
8.0
10.0
12.0
14.0
16.0
18.0
2000
2003
2006
2009
2012
2015
2018
2021
2024
2027
2030
2033
2036
2039
2042
2045
2048
Replacement Repairs
0
2
4
6
8
10
12
14
����
����
����
����
����
����
����
����
���
���
����
����
����
����
���
���
���
�
Mains Other Assets
Projected Total Expenditures Due to Wear-Out
Projected Total Replacement Expenditures Due to Wear-Out
Y2K
$Y
2K$
Mill
ions
Y2K
$ M
illio
ns
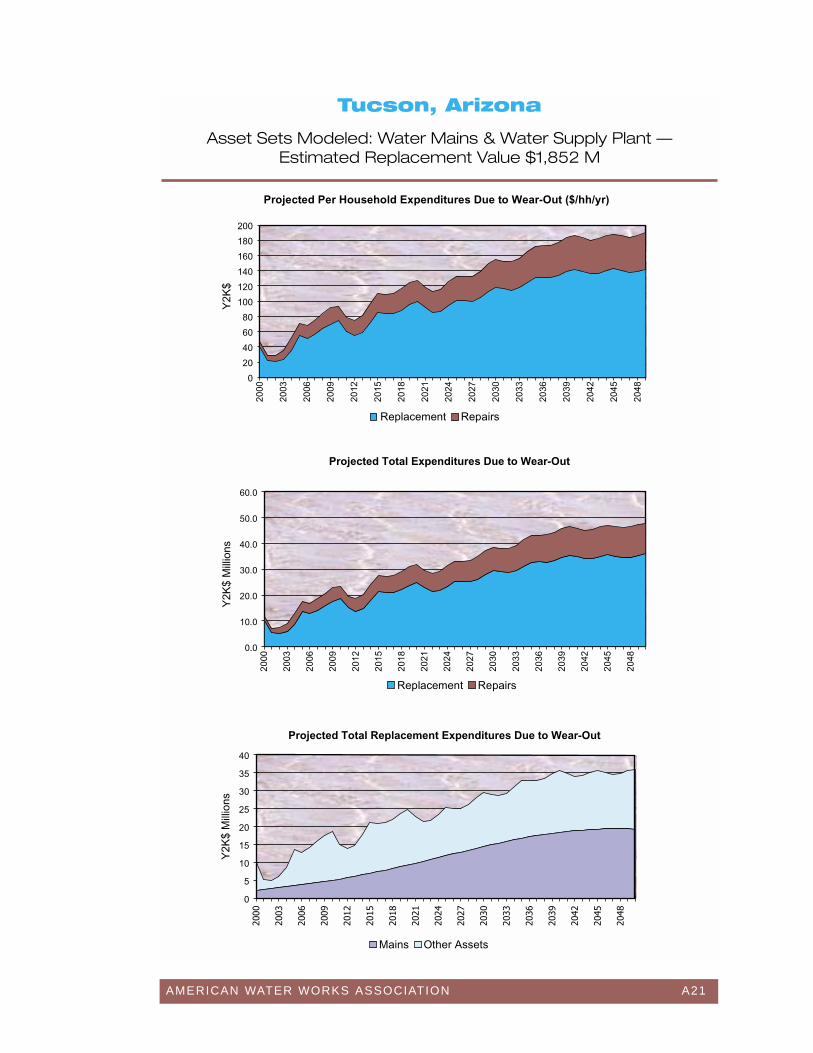
AMERICAN WATER WORKS ASSOCIATION A21
Tucson, Arizona
Asset Sets Modeled: Water Mains & Water Supply Plant — Estimated Replacement Value $1,852 M
Projected Per Household Expenditures Due to Wear-Out ($/hh/yr)
0
20
40
60
80
100
120
140
160
180
200
2000
2003
2006
2009
2012
2015
2018
2021
2024
2027
2030
2033
2036
2039
2042
2045
2048
Replacement Repairs
0.0
10.0
20.0
30.0
40.0
50.0
60.0
2000
2003
2006
2009
2012
2015
2018
2021
2024
2027
2030
2033
2036
2039
2042
2045
2048
Replacement Repairs
0
5
10
15
20
25
30
35
40
����
����
����
����
����
����
����
����
���
���
����
����
����
����
���
���
���
Mains Other Assets
Projected Total Expenditures Due to Wear-Out
Y2K
$Y
2K$
Mill
ions
Y2K
$ M
illio
ns
Projected Total Replacement Expenditures Due to Wear-Out
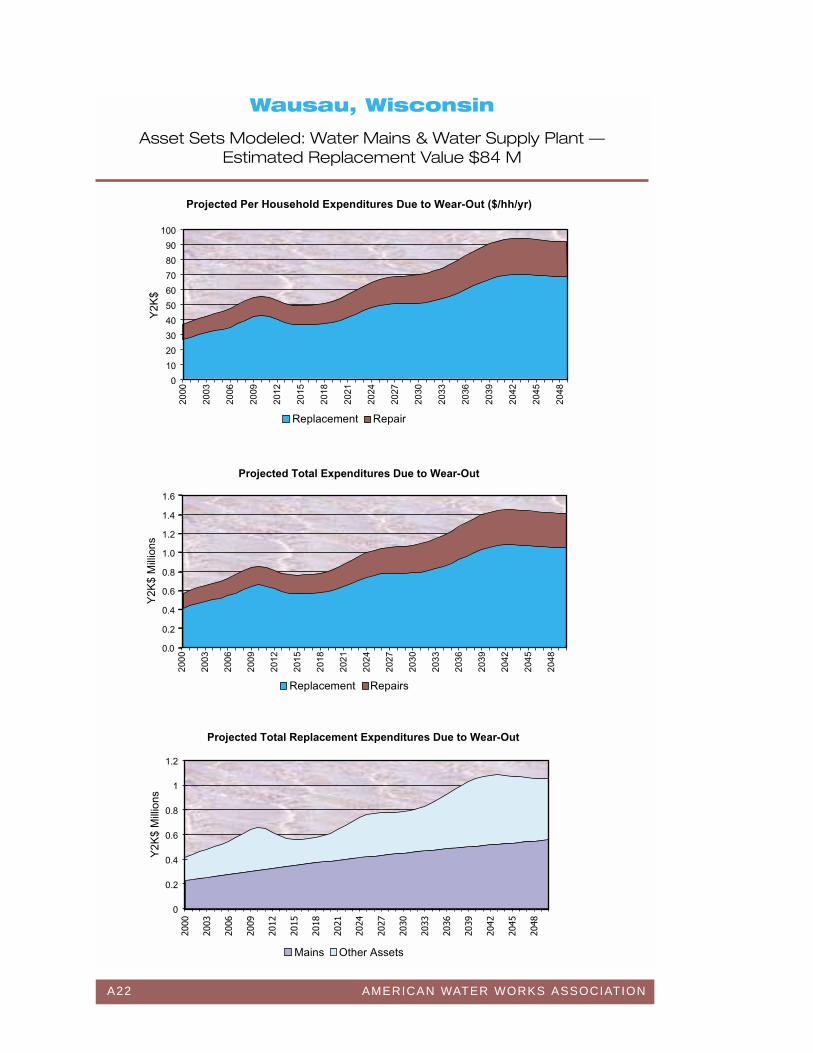
A22 AMERICAN WATER WORKS ASSOCIATION
Wausau, Wisconsin
Asset Sets Modeled: Water Mains & Water Supply Plant — Estimated Replacement Value $84 M
Projected Per Household Expenditures Due to Wear-Out ($/hh/yr)
0
10
20
30
40
50
60
70
80
90
100
2000
2003
2006
2009
2012
2015
2018
2021
2024
2027
2030
2033
2036
2039
2042
2045
2048
Replacement Repair
0.0
0.2
0.4
0.6
0.8
1.0
1.2
1.4
1.6
2000
2003
2006
2009
2012
2015
2018
2021
2024
2027
2030
2033
2036
2039
2042
2045
2048
Replacement Repairs
0
0.2
0.4
0.6
0.8
1
1.2
����
����
����
����
����
����
����
����
���
���
����
����
����
����
���
���
���
Mains Other Assets
Y2K
$Y
2K$
Mill
ions
Y2K
$ M
illio
ns
Projected Total Expenditures Due to Wear-Out
Projected Total Replacement Expenditures Due to Wear-Out
AMERICAN WATER WORKS ASSOCIATION B1
Reinvesting in Drinking WaterInfrastructure
Dawn of the Replacement Era
APPENDIX B
ACKNOWLEDGMENTS
The following people contributed the preparation of this report:
RESEARCH TEAM
John CromwellPA Consulting Group
Arlington, Virginia
Elisa SperanzaPA Consulting Group
Cambridge, Massachusetts
Haydn ReynoldsHaydn Reynolds & Associates, Pty. Ltd
Adelaide, South Australia
AWWA WATER UTILITY COUNCIL—INFRASTRUCTURE ISSUES GROUP
Aurel Arndt, General ManagerLehigh County AuthorityAllentown, Pennsylvania
Paul DemitCamp Dresser & McKee
Cambridge, Massachusetts
Tom ErrichettiBHC
Bridgeport, Connecticut
Peter GallantBHC
Bridgeport, Connecticut
Joseph Gehin, Utilities DirectorWassau Water WorksWausau, Wisconsin

B2 AMERICAN WATER WORKS ASSOCIATION
David HughesPhiladelphia Suburban Water Company
Bryn Mawr, Pennsylvania
William KnechtCincinnati Water Works
Cincinnati, Ohio
John LoughryDenver Water
Denver, Colorado
Marilyn MillerEast Bay Municipal Utility District
Oakland, California
Robert MillerLouisville Water Company
Louisville, Kentucky
David MonieSB Water Company
Cherry Hill, New Jersey
Dan PedersenAzurix Corporation
Houston, Texas
Charles SchoeningAustin Water and Wastewater Department
Austin, Texas
David Siburg, ManagerPublic Utility District #1 of Kilsap County
Poulsbo, Washington
John Sullivan, Chief EngineerBoston Water and Sewer Commission
Boston, Massachusetts
John TraxNational Rural Water Association
Washington, D.C.
AMERICAN WATER WORKS ASSOCIATION B3
AWWA WATER UTILITY COUNCIL—INFRASTRUCTURE FUNDING OPTIONS DEVELOPMENT GROUP
Hamlet J. “Chips” Barry III, ManagerDenver Water
Denver, Colorado
Joseph Gehin, Utilities DirectorWassau Water WorksWausau, Wisconsin
Stephen Gorden, DirectorDetroit Water and Sewerage Department
Detroit, Michigan
Gurney Gunter, DirectorKansas City Water Services Department
Kansas City, Missouri
James McInerney, ChairmanBHC
Bridgeport, Connecticut
Howard Neukrug, Director, Office of WatershedsPhiladelphia Water Department
Philadelphia, Pennsylvania
Clair Olivers, Public Works DirectorCity of Everett
Everett, Washington
David Siburg, ManagerPublic Utility District #1 of Kilsap County
Poulsbo, Washington
PARTICIPATING UTILITIES
A special thanks to the managers and staff of the following utilities for their time andeffort in developing the Nessie Curves:
City of Austin Water and Wastewater DepartmentAustin, Texas
Boston Water and Sewer CommissionBoston, Massachusetts
B4 AMERICAN WATER WORKS ASSOCIATION
BHCBridgeport, Connecticut
West Virginia AmericanCharleston, West Virginia
Cincinnati Water WorksCincinnati, Ohio
Columbus Water WorksColumbus, Georgia
Denver Water BoardDenver, Colorado
Des Moines Water WorksDes Moines, Iowa
East Bay Municipal Utility DistrictOakland, California
City of GloucesterGloucester, Massachusetts
Board of Water SupplyHonolulu, Hawaii
Louisville Water CompanyLouisville, Kentucky
United Water New RochelleNew Rochelle, New York
Philadelphia Water DepartmentPhiladelphia, Pennsylvania
Portland Water BureauPortland, Oregon
St. Paul Regional Water ServicesSt. Paul, Minnesota
Seattle WaterSeattle, Washington
Tacoma Public UtilitiesTacoma, Washington
AMERICAN WATER WORKS ASSOCIATION B5
Tucson WaterTucson, Arizona
Wausau Water WorksWausau, Wisconsin
AWWA STAFF
Tom Curtis, Deputy Executive DirectorGovernment Affairs Office
Washington, D.C.
Albert E. Warburton, Director of Legislative AffairsGovernment Affairs Office
Washington, D.C.
Tommy Holmes, Legislative Programs ManagerGovernment Affairs Office
Washington, D.C.
FUNDING
The research, analysis and production of this report was funded by the Water Industry Technical Action Fund (WITAF).