reinsurance and financial performance of short- …
TRANSCRIPT
Univers
ity of
Cap
e Tow
n
REINSURANCE AND FINANCIAL PERFORMANCE OF SHORT-
TERM INSURANCE COMPANIES IN SOUTH AFRICA
A Dissertation
presented to
The Development Finance Centre (DEFIC), Graduate School of Business
University of Cape Town
In partial fulfilment
of the requirements for the Degree of
Master of Commerce in Development Finance
by
GEORGE SERMADOR SOGNON
(SGNGEO001)
December, 2018
Supervisor: Abdul Latif Alhassan, Ph.D.

Univers
ity of
Cap
e Tow
n
The copyright of this thesis vests in the author. No quotation from it or information derived from it is to be published without full acknowledgement of the source. The thesis is to be used for private study or non-commercial research purposes only.
Published by the University of Cape Town (UCT) in terms of the non-exclusive license granted to UCT by the author.

i
PLAGIARISM DECLARATION
I know that plagiarism is wrong. Plagiarism is to use another’s work and pretend that it is
one’s own. Allowing another person to copy my work is also plagiarism.
I have used a recognised convention for citation and referencing. Each significant
contribution and quotation from the works of other people has been attributed, cited and
referenced.
I certify that this dissertation is my own work.
I have not allowed and will not allow anyone to copy this essay with the intention of passing
it off as his or her own work.
George Sermador Sognon

ii
TABLE OF CONTENTS
PLAGIARISM DECLARATION ............................................................................................................ i
DEDICATION ........................................................................................................................................ v
ACKNOWLEDGEMENT...................................................................................................................... vi
ABSTRACT .......................................................................................................................................... vii
GLOSSARY OF TERMS ...................................................................................................................... ix
CHAPTER ONE ..................................................................................................................................... 1
INTRODUCTION ................................................................................................................................... 1
1.1 Background ................................................................................................................................... 1
1.2 Statement of Research Problem .................................................................................................... 4
1.3 Statement of Research Objectives and Hypotheses ....................................................................... 6
1.4 Justification of the study................................................................................................................ 6
1.5 Organization of the study .............................................................................................................. 7
CHAPTER TWO ..................................................................................................................................... 8
LITERATURE REVIEW ........................................................................................................................ 8
2.1. Introduction .................................................................................................................................. 8
2.2 Overview of short-term insurance market in South Africa ........................................................... 8
2.2.1 Premium Development ......................................................................................................... 10
2.2.2 Market Concentration ........................................................................................................... 10
2.2.3 Insurance penetration ........................................................................................................... 11
2.2.4 Reinsurance by short-term insurers ...................................................................................... 11
2.3 Risk Management in insurance market: Theory of Reinsurance ................................................. 13
2.3.1 Agency theory ...................................................................................................................... 13
2.3.2 Corporate Demand Theory ................................................................................................... 13
2.4 Empirical literature on the relationship between reinsurance and financial performance ........... 14
2.5 Summary of the literature ............................................................................................................ 20
CHAPTER THREE ............................................................................................................................... 21
RESEARCH METHODOLOGY .......................................................................................................... 21
3.1 Introduction ................................................................................................................................. 21
3.2. Sample size and data period ....................................................................................................... 21
3.3 Analytical framework .................................................................................................................. 21
3.3.1 Hypotheses Development ..................................................................................................... 22
3.4 Estimation techniques.................................................................................................................. 25
3.4.1 Random and Fixed Effects Panel Data Model...................................................................... 25
CHAPTER FOUR ................................................................................................................................. 27
DISCUSSION OF FINDINGS .............................................................................................................. 27
4.1 Introduction ................................................................................................................................. 27
iii
4.2 Descriptive Statistics ................................................................................................................... 27
4.2.3 Correlation Results ............................................................................................................... 28
4.3 Regression Results: Reinsurance and Financial Performance ..................................................... 29
CHAPTER FIVE ................................................................................................................................... 32
CONCLUSION AND RECOMMENDATION .................................................................................... 32
5.1 Introduction ................................................................................................................................. 32
5.2 Summary of findings and conclusion .......................................................................................... 32
5.4 Recommendation ......................................................................................................................... 33
BIBLIOGRAPHY ................................................................................................................................. 35
APPENDIX: LIST OF SHORT-TERM INSURANCE COMPANIES IN SA ..................................... 39

iv
List of Tables
Figure 1: Non-life insurance penetration (premiums in % of GDP) and GDP per capita ($) ................. 2
Figure 2: Estimated non-life reinsurance market of selected African markets 2015/2016 ($ mn) .......... 4
Table 2. 1 Classes of business underwritten in the short-term insurance market .................................... 9
Table 2. 2: Short term premiums written over the last five years ......................................................... 10
Table 2. 3: Premiums written by the 10 leading short-term insurers in 2016 ....................................... 10
Table 2. 4: Premiums written by the 3 leading short-term reinsurers in 2016 ...................................... 11
Table 2.5: Premiums written by the 3 leading short-term reinsurers in 2016 ....................................... 19
Table 3. 1: Summary of independent variables ..................................................................................... 25
Table 4.1: Summary statistics ............................................................................................................... 28
Table 4.2: Correlation Matrix ................................................................................................................ 28
Table 4.3: Regression Results ............................................................................................................... 31

v
DEDICATION
This dissertation is dedicated to my parents, Theresa Akua Moru and Raymond Sognon and
also to Ms. Klara Schmitt and Pascal Kwame Sognon for their continuous prayerful support,
love and guidance. A special dedication to a superwoman, Professor Dorothy Jane Oluman
Ffoulkes-Crabbe who was instrumental to my childhood development.

vi
ACKNOWLEDGEMENT
I would like to take this opportunity to express my sincere thanks to the Almighty God for life
and strength over the years, especially whiles studying at the University of Cape Town (UCT)
Graduate School of Business (GSB). Most importantly to the Albert Baker Fund (ABF) for
blessing mankind with good and serving the cause of Christian Science. I appreciate the
continuous support of ABF towards my undergraduate education and my masters’ programme
at UCT GSB.
Writing this research would have been impossible without the immerse support from my
supervisor, Dr. Abdul Latif Alhassan. His many constructive feedback, inputs and
contributions helped me stay on course and successfully complete my dissertation. I cannot
ignore the numerous in-house support from faculty and the librarian on data collection and
referencing. The Financial Services Board (FSB) of South Africa (SA) database was helpful
in my data analysis.
I appreciate the great time, support and assistance from my classmates at the GSB MComm.
2018 class including Aamirah, Imraan, Kuhle, Mary-Anne, Sharon, Gertrude, Thandiwe and
Joy. You made the experience a memorable one.
Not forgetting my supportive boss, Bright Owusu-Amofah, my friends and colleagues at
home including Delphina Duodu, Ayesha Abdulrahaman, Eric Opoku, Ivy Kulego, Prince
Oppong, Hope Tetteh, Tracy Ba-Taa-Banah and Armah Akotey. Your prayer, support, care
and well wishes have brought me this far.
vii
ABSTRACT
Profit driven companies have a responsibility to generate decent returns and
pay dividends to their shareholders. Investors and shareholders of financial
institutions are particularly concerned about their cash flow, risk and returns to
ascertain the financial performance of the business. In the insurance industry,
risk management and financial performance goes hand-in-hand. In order for
the short-term insurance industry in South Africa to thrive, the right risk
management policy is needed to keep the business afloat and make returns for
shareholders and most importantly, effectively perform the risk
indemnification function of meeting claim payment on the occurrence of
specified losses.
This research undertakes a study to understand the relationship between the
use of reinsurance contracts by insurers as a risk management tool and its
impact on financial performance of short-term insurance companies in South
Africa. It employs data on 79 short-term insurers (2007 – 2014) sourced from
the insurance department of the Financial Services Board (FSB). The random
effect and fixed effect panel techniques are employed in this study to estimate
both static panel data models to identify the determinants of financial
performance for insurers. Return on assets (ROA), return on equity (ROE) and
underwriting profit (UPROF) are employed as proxies of financial
performance.
The data analysis indicate that the average reinsurance ratio is 44% over the
period of the study. The second-stage regression analysis showed that
reinsurance contracts reduces profitability, which suggests that any potential
risk diversification associated with reinsurance usage is offset by the loss of
revenue in investment incomes. The findings also indicate that a negative
relationship exist between underwriting risk and financial performance of
short-term insurers. As underwriting risk exposure increases, insurers are
expected to report lower profitability. The size of a short-term insurer
correlates positively with financial performance. According to the findings,
large insurance corporations in South Africa perform better than smaller sized
insurers. As a result, mergers and acquisitions is the way-forward for the
industry since consolidation positively impacts bottom-line due to economies
of scale and capacity. The results from the findings also indicate that the use of
leverage positively impacts financial performance of insurers as most insurers
in South Africa are benefiting from reduced income tax payable due to interest
payment to debt holders. A positive relationship exists between diversification
of business lines and financial performance. The findings seem to suggest that
diversified insurers increase gross premiums from the same client whiles
reducing cost due to the scale of transactions.
The findings from this study recommends that for short-term insurers to
improve their financial performance, they will have to increase their retention
ratio. This will lead to low reinsurance ratios allowing room for high net
premiums to be available to the firm. While doing this, insurers have to be
mindful of their risk management policies. Insurance companies also have to
diversify their business lines, increase leverage and the asset size of the firm in
viii
order to increase profitability. The regulatory environment should be opened to
reduced reinsurance ratios as long as risk management measures and enough
capital are available to absorb risk in the future.

ix
GLOSSARY OF TERMS
Bn Billion
CEO Chief Executive Officer
DIV Diversification
FSB Financial Services Board
GDP Gross Domestic Product
GSB Graduate School of Business
LEV Leverage
MD Managing Director
M&A Mergers and Acquisitions
Mn Million
NA Namibia
NAIC National Association of Insurance Commissioners
ORSA Own Risk and Solvency Assessment
Q Quarter
R Rand
RE Reinsurance
ROA Return on Asset
ROE Return on Equity
ROUP Return on Underwriting Profit
SA South Africa
SSA Sub-Saharan Africa
SAM Solvency Assessment Management
SCR Solvency Capital Requirement
SPSS Statistical Package for Social Sciences

x
UCT University of Cape Town
UPROF Underwriting profit
URISK Underwriting risk
USD United States Dollars
VaR Value at Risk
VLF Variance Inflation Factor
ZAR South African Rand

1
CHAPTER ONE
INTRODUCTION
1.1 Background
South Africa (SA) and Namibia (NA) are considered to be among the very few nations in
Africa to record high insurance penetration rates over the last decade, with rates of 14.0% and
7.3% respectively in 2013 (KPMG, 2016) while more than half of all African nations
recorded less than 1% insurance penetration rate (KPMG, 2016), indicating the severity of the
situation as well as the opportunities for growth. In spite of the success chalked by the South
African insurance industry, only 19.5% of the total gross premium recorded can be attributed
to short-term insurance compared to the 81.5% by the long-term insurance (KPMG, 2016).
Hence relatively lower revenues are earned on the average by players in the short-term
insurance industry in SA. The short-term insurance industry as a result can be regarded as less
developed and still in its early stages compared to long-term insurance and is also faced with
a number of challenges particularly competition, high claims, macroeconomic and high cost
of reinsurance.
“Insurance for insurers” is how Baur & Breutel-O’Donoghue (2004) simply puts the
definition of reinsurance. Reinsurance provides the means by which an insurance company
protects itself from unexpected losses that it cannot cover for. Reinsurance by short-term
insurers in South Africa has grown significantly in recent years given the severity of risk and
challenges to meet demands by the insured. This has multiple impact on the risk borne by
insurers and their financial performance. What reinsurance does, is to transfer a part of the
risk of loss of an insurer to be incurred by the reinsurer. South African start-up insurer,
Resolution Life failed to build-up its capital after ceding most of its premiums to a re-insurer.
This led to an eventual collapse of the company due to low cash inflow from net premiums. If
management and board had undertaken an Own Risk and Solvency Assessment (ORSA) in
order to maintain a good balance between risk and return, Resolution Life would have
increased its capital base and relied less on reinsurance (KPMG, 2013).
Of the estimated USD 5.2 billion in premiums written by short-term reinsurers in Africa,
South Africa claimed 39% in 2016. (Dr. Schanz; Alms & Company, 2017). Cessions of gross
premiums from emerging markets in the short-term reinsurance industry was approximately

2
USD 42.0 billion (Dr. Schanz; Alms & Company, 2017). In 2015, average global short-term
cession rate was 8.4% compared to 24% and 26% by Africa and South Africa respectively
(PwC, 2014). The high rate of reinsurance by short-term insurers in Africa, can be attributed
to the lack of local underwriting capacity for large scale risks. Reinsurance by short-term
insurers increased to 29.4% in 2016 from 25.8% in 2015 as against 30.6% in Quarter 3 (Q3)
2017. The increase can be attributed to high expected disasters and claims by the insured
(Financial Services Board, 2016).
Figure 1: Non-life insurance penetration (premiums in % of GDP) and GDP per capita ($)
Source: (Dr. Schanz; Alms & Company, 2017)
Risk management is an important part of the business model for all insurance companies
(PwC, 2012). Insurance companies as part of risk management strategy reinsure or cede part
of its gross premiums to another company i.e. reinsurer. This is to ensure that in the event of a
liability or claim by the insured, the insurer will not be overly-burden. It also ensures the
sharing of risk between insurers and reinsurers. One of the many reasons why insurers
reinsure is because of the limited capital size (i.e. small size of equity on the books) to fully

3
underwrite a transaction, in that case they partner with other insurers and rely on reinsurers in
other to meet the capital requirement by the regulator (FSB) in completing the deal.
Managers of insurance companies have to decide on the level of risk they want to expose the
business to vis-à-vis the profitability of the firm. Reinsuring a potential risk comes with some
implications on the books of the company including lower net premium after reinsurance
premium is ceded and lower underwriting profits leading to lower return on investment and
growth in capital. However minimizing reinsurance can also have negative consequences to
the operations of the company, as risk levels are significantly exposed leading to lower profits
and in some cases insolvency in the event of high claims by the insured.
The use of reinsurance by insurers cannot be over-emphasized. This is because, reinsurance is
used as a risk management tool to reduce exposure to certain types of risk the insurer cannot
fully cover for. Whilst this is the case for most short-term insurance companies in South
Africa according to a research by Plessis, Mostert & Mostert (2010: p. 210), if reinsurance is
properly utilized, it can increase the profitability and capital base of insurers. While generally
reinsurance in Africa is low compared to the rest of the world, reinsurance by short-term
insurers is high. However insurance companies in South Africa patronise reinsurance more,
with rates above the average developed markets cession rate. The total percentage of re-
insurance ceded by insurance companies has a direct impact on the profitability and the
solvency of these companies.
According to Schanz et al. (2017: p. 20), short-term insurance penetration in Africa stood at
0.92% which is lower than the global average of 2.8% in 2016. While cession rate of 8.2% of
short-term insurance premiums to reinsurers was achieved in 2014, total short-term cessions
in Africa stood at an estimated USD 4.9 billion, with South Africa accounting for
approximately 50% of the total in 2014. This increased to USD 5.2bn in 2016 with USD
20.1bn in short-term insurance premiums as Africa recorded a cession rate of 26% in 2016.
Schanz et al. (2017) indicates that “total African life reinsurance cessions in 2014 amounted
to approximately USD 3.3 billion, representing an average cession rate of 7.6%” (p. 24). It
also states that South Africa was the only sizeable and dominant African life reinsurance
market, generating USD 3.1 billion of premiums in 2014. There are only seven other African
markets (Egypt, Kenya, Morocco, Nigeria, Tunisia, Tanzania and Algeria) with an estimated

4
size of more than US$100 million each. Schanz, et al. (2016) is of the view that currently
“Africa has an estimated average cession rate of 24%” (p. 24).
Figure 2: Estimated non-life reinsurance market of selected African markets 2015/2016 ($ mn)
Source: (Dr. Schanz; Alms & Company, 2017)
Oxford Business Group (2016) believes that the South African insurance market will become
more sophisticated with the introduction of Solvency Assessment Management (SAM) which
will demand more reinsurance services in the future.
1.2 Statement of Research Problem
KPMG states that “in a South African context, the outcome of the SAM reinsurance
regulatory review is likely to affect how market participants select their reinsurance partners,
structure their contracts and manage the level and mechanism of risk transfer” (2016: p. 41).
Ceding of insurance premium to reinsurers has two major impacts for most insurers; financial
performance and solvency. Every insurer needs to make positive cash flows and remain
financially stable (i.e. profitable) in order to stay in business. The ability of an insurer to stay
5
afloat requires growth in gross premiums, lower cost and good yields on investments.
However not all insurers are able to make underwriting profit as low retention ratio and high
claims ratio tend to impact the bottom line i.e. profits of the insurer, due to the inability of
underwriters to manage risk exposures. Hence every insurer needs to understand the
importance of managing risk and its impact on the profitability of the business. However,
there are few research focused particularly on the relationship that exist between financial
performance and re-insurance by short-term insurers. This research seeks to provide
information about the relationship between reinsurance and financial performance. It also
gave recommendation to help managers and the risk team of insurance companies in South
Africa as well as policy makers better understand the impact of reinsurance on their bottom
line.
The study of the topic is critical to the industry because the amount of gross premiums ceded
as reinsurance has the potential to reduce the risk exposure of the insurer especially during
financial crises whiles lowering the potential investment returns (Aduloju & Ajemunigbohun,
2015). An understanding of the reinsurance-profitability relationship assists management and
risk managers to better price and determine the ratio of gross premium to be ceded to achieve
target returns. Other researchers have looked at the risk implication of retaining some level of
risk by ceding less premiums without focusing its impact on equity and profitability of the
firm.
A number of researchers (Alhassan, 2016; Bernard & Tian, 2009; Garven, 2003; Plessis et al.,
2010; Sandrock, 1996) have examined re-insurance and risk management by short term
insurers, however very little is available on the financial performance and viability of short-
term insurers via the use of reinsurance in South Africa. The use of reinsurance or ceding part
of gross premium to a reinsurer has been used as a risk management tool for decades. This is
because reinsurance takes away part of the responsibilities of an insurer including claims and
the required solvency capital by regulators. However, little attention has been paid to a firm’s
ability to return more cash and capital to shareholders by optimising reinsurance. This
research seeks to close the gap and introduce knowledge on the impact of reinsurance on the
financial performance of short-term insurers in the South African context.

6
1.3 Statement of Research Objectives and Hypotheses
The main research objective for this study is to examine the relationship between gross
premium ceded and financial performance of short-term insurance companies in South Africa.
The objective below is expected to be derived from this research work:
1. To investigate the relationship between reinsurance and profitability of short-term
insurers
Based on the research objective outlined above, this study seeks to test the following
hypotheses:
H1: Other things equal, ceding a proportion of gross premiums by short-term insurers has no
impact on profitability.
H2: Other things equal, ceding a proportion of gross premiums by short-term insurers has an
impact on profitability.
1.4 Justification of the study
Very little research has been written on the use of reinsurance as a tool by insurance
companies to maximise financial performance. Available research most often focuses on risk
management by insurers. In general little attention has been paid to the insurance industry
compared to other industries in the financial services sector. The study of reinsurance is much
needed, considering the low insurance penetration rate especially in the short term insurance
industry, in a bid to attract new capital and boost awareness and patronage of short term
insurance policies. Although insurance penetration in South Africa is high, the short-term
insurance industry has not grown as much as the long-term insurance market. It is therefore
critical for industry players, regulators, academia and investors to invest more resources and
research into the field. A number of papers have also been written on the topic of risk
management by insurance companies, however attributing financial performance to
reinsurance has seen little studies in South Africa. As such this study hopes to contribute
particularly in the area of reinsurance and its relationship with financial performance in the
short-term insurance industry. This research is expected to guide management of short term
insurers in deciding the right proportion of insurance premium to cede which reduces risk
exposure and maximises underwriting profit. The Financial Services Board (FSB) would also

7
benefit from the study by considering reforms to its policies on ceding gross premiums. The
outcome of the research will assist the regulator in improving the current standard for
reinsurance policies.
1.5 Organization of the study
This research has been structured to have five chapters beginning with this introduction and
background to the insurance industry in South Africa. The second chapter of this piece has a
literature review of relevant information across the continent, other developing and developed
economies. The third chapter is the research methodology followed by the collection of data,
analysis, results and discussion of the findings in the fourth chapter. The fifth and final part of
the study concludes the research and give recommendations based on the outcome of the
methodology. References and appendices gathered from writing this research has be included
at the end of the work.

8
CHAPTER TWO
LITERATURE REVIEW
2.1. Introduction
This section discusses a number of literature that are relevant to the study of the use of
reinsurance by short-term insurers and how it impacts financial performance. It also discusses
the theories related to reinsurance as a risk management tool and empirical literature on
reinsurance and financial performance of short-term insurers. Reinsurance has been used for
decades in South Africa by almost all the short-term insurers as a risk management tool.
There is the need to look at how reinsurance has impacted short term insurers by reviewing
what has been written in the field. Empirical literature that relates to reinsurance and
profitability has been examined to determine what researchers think about the subject.
2.2 Overview of short-term insurance market in South Africa
Insurance in South Africa was introduced in 1826 as British citizens and businesses began
operations in the country. The United Empire and Continental Life Assurance Association,
and the Alliance British and Foreign Fire and Life Insurance Company (all foreign firms)
were the first to open branches in the country. In 1831, the South Africa Life Assurance
Company was established and became the first local insurer. By the late 19th century, more
than 50 foreign insurers were providing coverage for the country (OBG, 2017).
The Short-term insurance Act 53 defines the short term insurance business as “the business of
providing or undertaking to provide policy benefits under short-term policies” (Africa, 1998).
Short term insurance involves taking a policy on assets such as vehicle, house, travel,
business and household contents. Firms who insure inventory, plant and machinery take short
term insurance (FindanAdvisor, 2018). Sandrock (1996) states that providing cover against
damage of property like vehicles, buildings and other physical possessions is called short term
insurance. Hence it is any insurance taken on assets or things other than life insurance. It is
taken only for the period that it is needed for. The short term insurance market is made up of
insurance companies providing the following insurance services; property, motor,
transportation, engineering, miscellaneous, liability, guarantee, accident and health insurance.
As at the end of 2017, there were 88 short term insurance companies in South Africa with 33
typical insurers, 33 niche insurers, 6 cell captive insurers, 8 captive insurers and 8 insurers in
9
run-off according to the regulator i.e. FSB (Financial Services Board, 2017). Over ZAR
118bn worth of insurance premiums were written by short term insurers in South Africa
representing a 3.5% growth in 2017 (Financial Services Board, 2017). However in recent
years, the industry has been impacted by external factors like technology and regulation
which is leading to faster and better services using technology whiles increasing cost (SAIA,
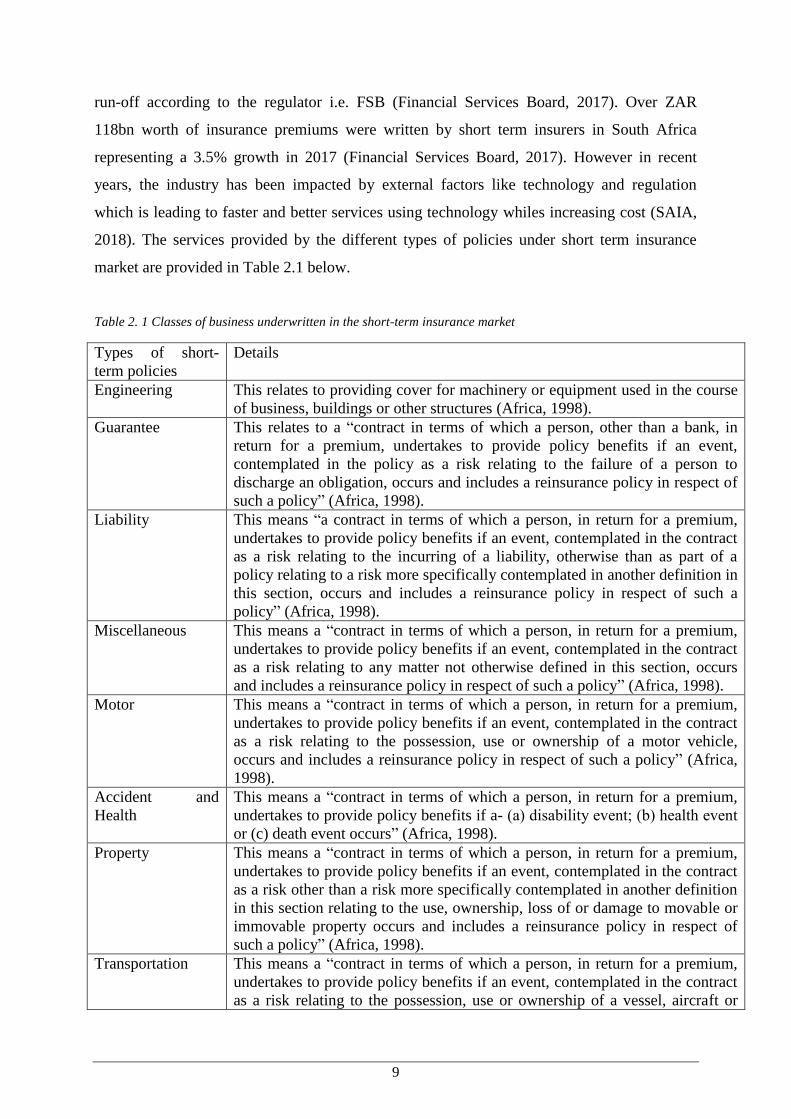
2018). The services provided by the different types of policies under short term insurance
market are provided in Table 2.1 below.
Table 2. 1 Classes of business underwritten in the short-term insurance market
Types of short-
term policies
Details
Engineering This relates to providing cover for machinery or equipment used in the course
of business, buildings or other structures (Africa, 1998).
Guarantee This relates to a “contract in terms of which a person, other than a bank, in
return for a premium, undertakes to provide policy benefits if an event,
contemplated in the policy as a risk relating to the failure of a person to
discharge an obligation, occurs and includes a reinsurance policy in respect of
such a policy” (Africa, 1998).
Liability This means “a contract in terms of which a person, in return for a premium,
undertakes to provide policy benefits if an event, contemplated in the contract
as a risk relating to the incurring of a liability, otherwise than as part of a
policy relating to a risk more specifically contemplated in another definition in
this section, occurs and includes a reinsurance policy in respect of such a
policy” (Africa, 1998).
Miscellaneous This means a “contract in terms of which a person, in return for a premium,
undertakes to provide policy benefits if an event, contemplated in the contract
as a risk relating to any matter not otherwise defined in this section, occurs
and includes a reinsurance policy in respect of such a policy” (Africa, 1998).
Motor This means a “contract in terms of which a person, in return for a premium,
undertakes to provide policy benefits if an event, contemplated in the contract
as a risk relating to the possession, use or ownership of a motor vehicle,
occurs and includes a reinsurance policy in respect of such a policy” (Africa,
1998).
Accident and
Health
This means a “contract in terms of which a person, in return for a premium,
undertakes to provide policy benefits if a- (a) disability event; (b) health event
or (c) death event occurs” (Africa, 1998).
Property This means a “contract in terms of which a person, in return for a premium,
undertakes to provide policy benefits if an event, contemplated in the contract
as a risk other than a risk more specifically contemplated in another definition
in this section relating to the use, ownership, loss of or damage to movable or
immovable property occurs and includes a reinsurance policy in respect of
such a policy” (Africa, 1998).
Transportation This means a “contract in terms of which a person, in return for a premium,
undertakes to provide policy benefits if an event, contemplated in the contract
as a risk relating to the possession, use or ownership of a vessel, aircraft or

10
other craft or for the conveyance of persons or goods by air, space, land or
water, or to the storage, treatment or handling of goods so conveyed or to be
so conveyed, occurs and includes a reinsurance policy in respect of such a
policy” (Africa, 1998). Source: Short-term insurance Act No. 53 of 1998
2.2.1 Premium Development
Over the last 12 months ending 2016, the total gross premium of short term insurers have
increased by 3.2% from ZAR114bn to ZAR118bn. As at the end of 2016, the number of short
term insurers decreased by 1. About 50% of all short term insurers are local with the
remaining being foreign-owned. Gross premium of reinsurance written to short term insurers
also grew by 8.3% from ZAR32bn to ZAR35bn in 2016. The ratio of gross premiums ceded
grew from 28.3% to 29.7% over the same period.
Table 2. 2: Short term premiums written over the last five years
Year Gross Premiums (ZAR) Growth Reinsurance (ZAR) Growth Reinsurance to GP
2012 87,675,000,000 - 22,961,000,000 - 26.2%
2013 96,178,000,000 9.7% 27,556,000,000 20.0% 28.7%
2014 102,833,000,000 6.9% 26,494,000,000 (3.9%) 25.8%
2015 113,909,000,000 10.8% 32,194,000,000 21.5% 28.3%
2016 117,577,000,000 3.2% 34,878,000,000 8.3% 29.7% Source: Financial Services Board
2.2.2 Market Concentration
Below are details of the 10 leading players in the short term insurance space and their market
share as well as reinsurers as at the end of 2016.
Santam leads the market with close to 20% market share with the second biggest insurer
having less than 10% of the market share. The remaining top 10 short-term insurers have a
total of 42% of the market share.
Table 2. 3: Premiums written by the 10 leading short-term insurers in 2016
Primary short term insurers
No. Name of player Total premium (ZAR) Market share (%)
1 Santam 22,469,267,000 19.3
2 Hollard Insurance 10,386,326,000 8.9
3 Mutual & Federal 8,717,615,000 7.5
4 Guardrisk 7,546,973,000 6.5
11
5 Outsurance 7,019,816,000 6.0
6 Bryte Insurance 3,736,734,000 3.2
7 Escap Limited 3,411,047,000 2.9
8 Auto & General 3,033,732,000 2.6
9 Absa 2,638,537,000 2.3
10 Centriq 2,492,324,000 2.1
11. Remaining 45,269,403,000 38.8
Total Industry 116,721,774,000 100.0 Source: Financial Services Board
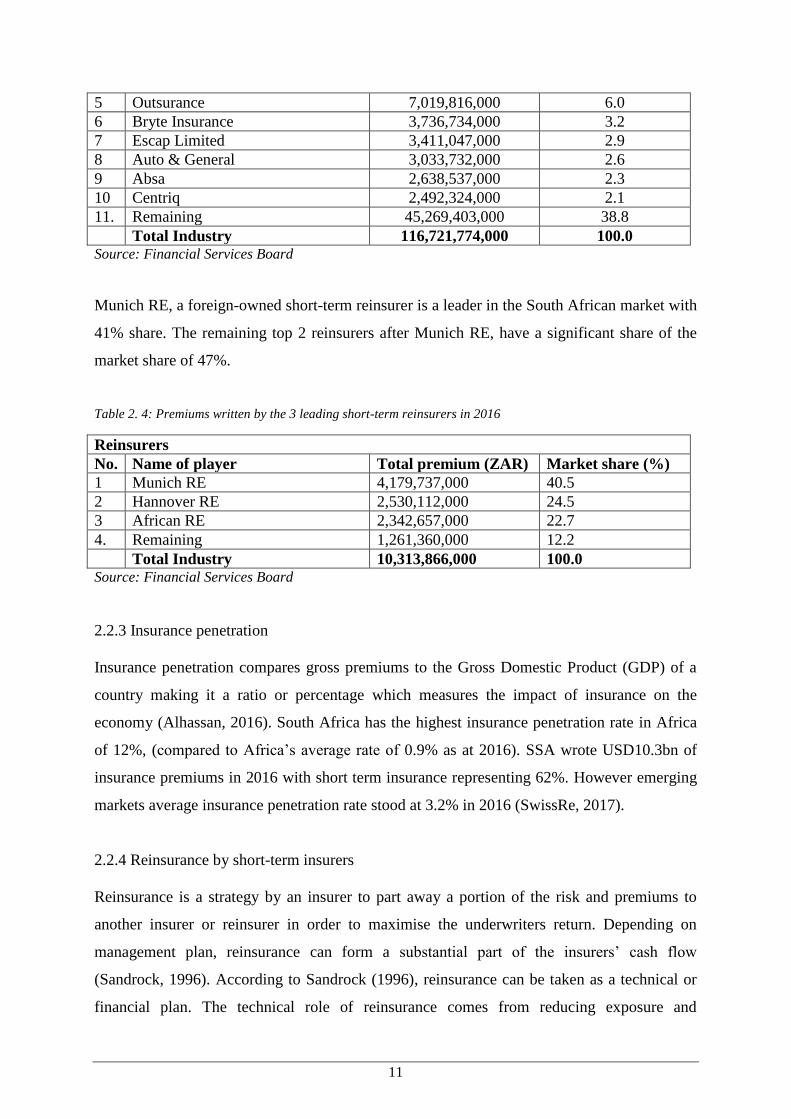
Munich RE, a foreign-owned short-term reinsurer is a leader in the South African market with
41% share. The remaining top 2 reinsurers after Munich RE, have a significant share of the
market share of 47%.
Table 2. 4: Premiums written by the 3 leading short-term reinsurers in 2016
Reinsurers
No. Name of player Total premium (ZAR) Market share (%)
1 Munich RE 4,179,737,000 40.5
2 Hannover RE 2,530,112,000 24.5
3 African RE 2,342,657,000 22.7
4. Remaining 1,261,360,000 12.2
Total Industry 10,313,866,000 100.0 Source: Financial Services Board
2.2.3 Insurance penetration
Insurance penetration compares gross premiums to the Gross Domestic Product (GDP) of a
country making it a ratio or percentage which measures the impact of insurance on the
economy (Alhassan, 2016). South Africa has the highest insurance penetration rate in Africa
of 12%, (compared to Africa’s average rate of 0.9% as at 2016). SSA wrote USD10.3bn of
insurance premiums in 2016 with short term insurance representing 62%. However emerging
markets average insurance penetration rate stood at 3.2% in 2016 (SwissRe, 2017).
2.2.4 Reinsurance by short-term insurers
Reinsurance is a strategy by an insurer to part away a portion of the risk and premiums to
another insurer or reinsurer in order to maximise the underwriters return. Depending on
management plan, reinsurance can form a substantial part of the insurers’ cash flow
(Sandrock, 1996). According to Sandrock (1996), reinsurance can be taken as a technical or
financial plan. The technical role of reinsurance comes from reducing exposure and

12
minimizing risk from large ticket transactions/ deals. Hence reinsurance protects the insurer
against insolvency due to high claims. The financial role of reinsurance can be attributed to
having a better solvency margin and increase its ability to write more premiums or expand its
portfolio.
Most insurance companies in South Africa ceded more than a percentage of their premiums to
reinsurers. The rationale behind most companies’ decision to cede a portion of their
businesses to other insurers or reinsurers can be attributed to risk management measures or
policies. Others do not have the capacity to fully underwrite the risk, whiles some insurers are
complying with regulatory requirements for purposes of solvency capital. A risk manager,
would want to determine the ratio of premiums ceded that will positively impact the viability,
profitability and solvency of the business. According to Alhassan (2016) the ceding of
reinsurance premiums reduces risk exposure and increases capacity.
Currently the short-term insurance market in SA has been hit with high claims and numerous
complaints leading to a gradual increase in the proportion of gross premium ceded to
reinsurers from 25.8% in 2014 to 30.9% at the end of September 2017. This naturally has an
impact on the net premium retained by the insurer and its profitability. This study will help
managers of short-term insurance companies better understand the impact of their decision to
cede more premiums to reinsurers on their financial performance. It will also help regulators
when deciding to fix a cap or floor rate to the reinsurance ratio or solvency margins and also
determine what impact reinsurance has on the financial performance of insurance companies
in South Africa. This research compares key financial indicators like gross profit, net profit,
ROA and ROE to premiums ceded and gross premium.
The Managing Director (MD) of SA Eagle, an insurance company indicates that his business
was faced with the situation of having to lower solvency margins since it was an inefficient
use of capital and less management of risk (Finance Week, 2004). For the short-term
insurance industry to thrive, it is critical to determine the key factors including the use of
reinsurance as a tool to increase leverage whiles increasing value for shareholders. If this
strategy is well implemented, the industry is expected to grow and stay profitable.
13
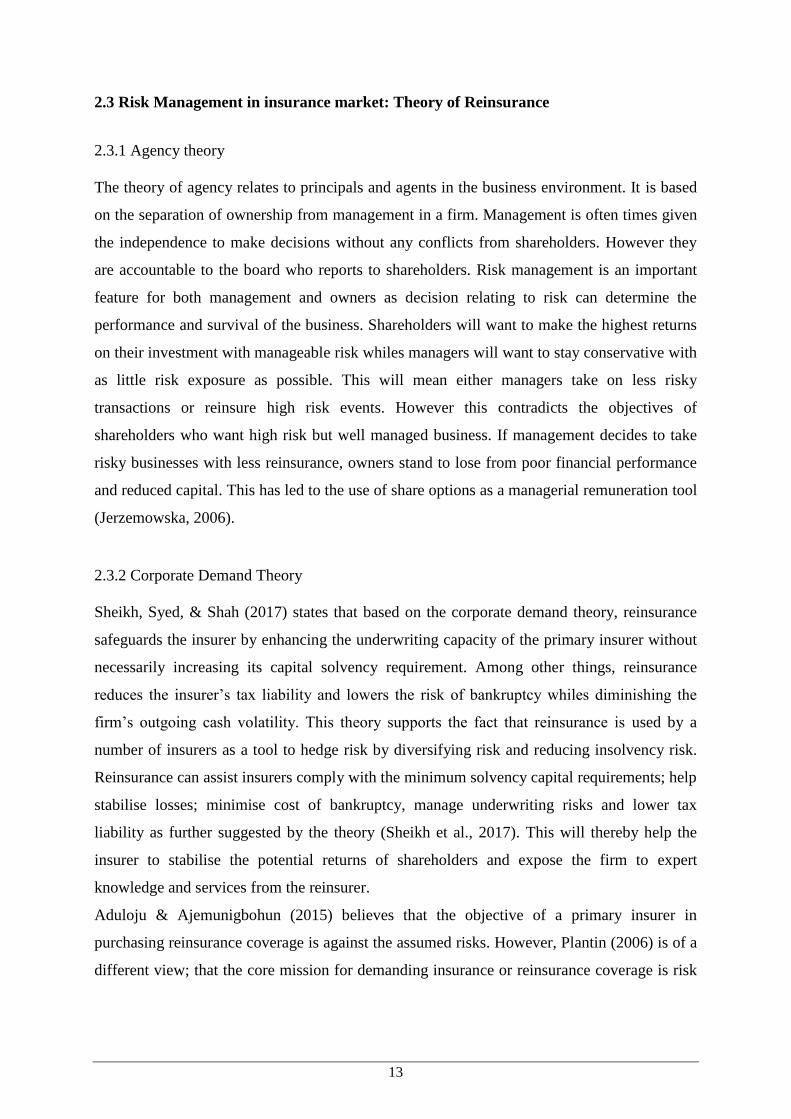
2.3 Risk Management in insurance market: Theory of Reinsurance
2.3.1 Agency theory
The theory of agency relates to principals and agents in the business environment. It is based
on the separation of ownership from management in a firm. Management is often times given
the independence to make decisions without any conflicts from shareholders. However they
are accountable to the board who reports to shareholders. Risk management is an important
feature for both management and owners as decision relating to risk can determine the
performance and survival of the business. Shareholders will want to make the highest returns
on their investment with manageable risk whiles managers will want to stay conservative with
as little risk exposure as possible. This will mean either managers take on less risky
transactions or reinsure high risk events. However this contradicts the objectives of
shareholders who want high risk but well managed business. If management decides to take
risky businesses with less reinsurance, owners stand to lose from poor financial performance
and reduced capital. This has led to the use of share options as a managerial remuneration tool
(Jerzemowska, 2006).
2.3.2 Corporate Demand Theory
Sheikh, Syed, & Shah (2017) states that based on the corporate demand theory, reinsurance
safeguards the insurer by enhancing the underwriting capacity of the primary insurer without
necessarily increasing its capital solvency requirement. Among other things, reinsurance
reduces the insurer’s tax liability and lowers the risk of bankruptcy whiles diminishing the
firm’s outgoing cash volatility. This theory supports the fact that reinsurance is used by a
number of insurers as a tool to hedge risk by diversifying risk and reducing insolvency risk.
Reinsurance can assist insurers comply with the minimum solvency capital requirements; help
stabilise losses; minimise cost of bankruptcy, manage underwriting risks and lower tax
liability as further suggested by the theory (Sheikh et al., 2017). This will thereby help the
insurer to stabilise the potential returns of shareholders and expose the firm to expert
knowledge and services from the reinsurer.
Aduloju & Ajemunigbohun (2015) believes that the objective of a primary insurer in
purchasing reinsurance coverage is against the assumed risks. However, Plantin (2006) is of a
different view; that the core mission for demanding insurance or reinsurance coverage is risk

14
sharing, especially when other studies have proved that sharing risk optimally is not the only
reason for taking reinsurance policies.
2.4 Empirical literature on the relationship between reinsurance and financial
performance
Reinsurance ceded by short-term insurance companies
Sandrock (1996) refers to a reinsurer as a provider of protection to an insurer in a similar way
as an insured is protected from a potential loss. KPMG (2013) has underscored the
importance of using reinsurance in managing liquidity and capital. However, it indicated the
need to have a balance between shareholders’ capital and the use of reinsurance. Ceding
substantial reinsurance affects profitability which impacts the capital base of the company.
Risk managers of insurance companies need to take a critical look on a strategic level at its
reinsurance arrangements/ policies to help fund new business expenses. Reinsurance is an
important risk management tool used within the insurance industry to spread uncertain cost of
risk exposure over a larger capital base. Reinsurance contracts can have various different
characteristics and also the reinsurance market is constantly changing and developing
according to KPMG (2013).
Omasete (2014)’s research on the Kenyan insurance industry was one of the closest to this
study. It considered the impact of risk management on financial performance of short-term
insurance companies in Kenya. The study was open to all the risk management tools that
could be used, compared to this research which is limited to the use of reinsurance only.
Omasete (2014) came to the conclusion that “a unit increase in risk management
implementation and monitoring led to an increase of 0.398 in financial performance” (p. 46).
Reinsurance was considered as one of the risk management tools to utilise among other
factors to manage liquidity risk. The study contacted 150 respondents. The research approach
used by the researcher was descriptive in nature; using data collection instruments like
observations, questionnaires and interviews. In using SPSS version 23, the descriptive and
inferential statistics produced P-value of 0.00 indicating the relevance of the studied
variables. This meant that the studied independent variables which includes liquidity risk
management, operational risk management and enterprise risk management significantly
affect the financial performance of Kenyan insurance companies (Omasete, 2017). Among

15
other things the study recommended that risk sharing between insurance companies and
reinsurance companies will lessen operational risk.
The use of reinsurance has the potential to reduce the unearned premium reserves and write
more business than it could have with no reinsurance according to Sandrock (1996).
However, it was quick to indicate the possibility of an inefficient insurer placing more
business with reinsurers leading to poor financial performance. It concluded by saying that a
balance between cost and probable benefit of the insurance policy should be identified. After
some analysis based on empirical data, Sandrock (1996) concluded that there is a negative
correlation between net income and gross premiums premium ceded. After using 12 years of
data, the percentage of written premium ceded dropped from 30% to 23%, while an analysis
of the data showed that a correlation coefficient of r= 0.0229 meant that there was a negative
but extremely weak relationship between the two variables. It is important to note that
differences in time period i.e. the data was collected from 1981 to 1993 which means
macroeconomic indicators and industry performance would have changed between the period
and now. Sandrock (1996)’s studies on reinsurance by short-term insurers is critical to the
body of work on the industry. He indicates that there should be a balance between the cost
and probable benefit of an insurance policy. Risk managers’ ability to skilfully use the right
proportion of reinsurance ceded to maximise profitability is of importance to both the board
and shareholders of every insurer. With the right understanding of risk, managers should be
able to fairly determine whether a particular client or event is worth reinsuring. If the
probability is highly unlikely then there is no need to reinsure hence gross premium equals net
premium leading to higher profitability and returns to shareholders. Some companies use
proportion reinsurance to automatically transfer risk and premiums to another insurer or
reinsurer once a client is underwritten.
Aduloju & Ajemunigbohun (2015) used structured questionnaires from 246 respondents and
secondary data of 10 insurance companies in Nigeria. The 10 consisted of four long-term and
six short-term insurance firms. “In addition twenty five respondents were selected from each
company giving a sample size of 250” (p. 22). The selected firms represents about 41% of the
premium income market. The select insurers were picked from the regulators’ (NAICOM)
website, which had 56 licensed insurers and 2 reinsurers in the country. This results led to the
view that a positive correlation exist between reinsurance and profitability. The authors
calculated Reinsurance Ceded Ratio (RCR), Return on Asset (ROA), Return on Equity (ROE)
16
as well as the Ratio of Reinsurance Recoverable to Policyholders Surplus (RRPHS) from their
2014 and 2015 financials. Using SPSS, the authors run correlation analysis to test the
relationship between the variables and the results showed a correlation of 0.817 i.e.
reinsurance ceded strongly correlated with gross premium written. Aduloju &
Ajemunigbohun (2015) did another test between reinsurance capacity and underwriting profit,
return on equity and profit after tax, which showed that there were no relationship, moderate
positive correlation and high positive correlation respectively. Their results showed that
reinsurance reduces insolvency by stabilizing loss claims and expanding capacity. Aduloju &
Ajemunigbohun (2015) backed their research with the Corporate Demand Theory; stating that
by subscribing to reinsurance, insurers were sharing risk and more. They also used
(Cummins, Dionne, Gagne, & Nouira, 2008)’s view that purchasing reinsurance was found to
have reduced the “insolvency risk of ceding companies by stabilizing loss experience,
confining liability with respect to specific risks, improving underwriting capacity, and
safeguarding against catastrophes” (p. 19).
An investigation by Garven (2003) led to the conclusion that if demand by insurers for
reinsurance is high, there is likely to be low correlation between investment returns and
claims ratio. The authors explained how the use of firm size, financial leverage, reinsurance,
underwriting risks, liquidity ratio and ROI have a significant influence on firm performance.
A research by Obonyo (2016) looked to assess the impact of reinsurance arrangements on
financial performance of general insurance companies. The analysis led to the conclusion that
there was a positive but insignificant relationship between reinsurance and financial
performance and retention levels were negatively related to underwriting profit ratio. Obonyo
(2016) employed both descriptive and inferential statistics to analyze the secondary data.
Annual financial statements of insurers and Kenya’s insurance industry annual reports from
2013 to 2015 were used to gather gross and net premiums, underwriting profits and
management expenses. The analysis made use of SPSS version 21. The data gathered was
used to calculate net loss ratio, retention ratio, net claims ratio and net commission ratios.
This led to the conclusion that reinsurance positively affects the performance of insurance
companies in Kenya and that the retention ratio has a negative relationship with underwriting
profit ratio.
17
Iqbal & Rehman (2014) reviews the use of reinsurance and how it affects the performance of
non-life direct insurers in Pakistan. The research looks at reinsurance utilization and
dependence and how exposure to reinsurance impacts an insurer’s key performance
indicators. The authors use secondary data from the annual reports of insurance companies
over 10 years from 2002 to 2011 and three econometric models for data regression analysis.
In the end, the authors came to the conclusion that the impact of reinsurance on the
performance of non-life insurers in Pakistan are consistent with previous studies performed in
other parts of the world. The study indicates that reinsurance utilization enhances the
performance of firms while dependence and exposure of reinsurance reduce its performance.
Lee & Lee (2012) contends that the performance of a firm and reinsurance are interdependent.
The researchers investigated this by using panel data from 1999 to 2009 of the property-
liability insurance industry in Taiwan. They discovered that insurers that have high ROA,
purchase less reinsurance policies while high reinsurance dependence tend to be used by
insurers with poor financial performance. This led to their recommendation for management
to balance reducing potential profitability and decreasing insolvency risk. Among other
performance metrics, reinsurance has a significant influence on firm performance according
to Lee & Lee (2012).
Sandrock (1996)’s paper proved that over the past 12 years, the short-term insurance industry
in South Africa has increasingly ceded less written premium to reinsurers. This led to the
author concluding that there is no causal relationship between the percentage of reinsurance
ceded and the financial results of South African short-term insurers. The study also
investigated the impact of reinsurance on the underwriting results of the short-term insurance
industry in South Africa. The result clearly indicated that although reinsurance may affect the
financial results of a short-term insurer, South African short-term insurers continued to have
ceded progressively less gross premium. Insurers with adequate capital resources tend to
command more underwriting risk. Interestingly that was not the case according to Sandrock
(1996) whose study stated that “the underwriting variable is not significantly correlated with
the percentage of premium ceded to reinsurers” (p. 167).
(American Risk and Insurance Association, 2016), in its presentation of reinsurance network
and the performance of insurers observed affiliated and non-affiliated insurers using annual
statements from the National Association of Insurance Commissioners (NAIC) from 2000-
18
2011. The study included total assets, net premiums written and surplus in each of the sample
year, of insurers with positive numbers. Based on the availability of information, (American
Risk and Insurance Association, 2016) tracked “2,901 US P/L insurers and 6,737 non-NAIC
regulated reinsurance counterparties with 419,524 reinsurance transaction relationships” (p.
14). The author used variables like insurer’s loss experience and insurer’s profitability to
measure financial performance. (American Risk and Insurance Association, 2016) states that
“The regression result showed that an “insurer’s performance could possibly affect its
reinsurance strategy and hence its reinsurance network position. (American Risk and
Insurance Association, 2016) also proved that size is negatively related to the combined ratio,
suggesting that larger insurers may enjoy economies of scale in risk diversification which can
lead to better underwriting performance” (p. 22).
In a research looking at the determinants of financial performance in general insurance
companies in Kenya, (Mwangi & Murigu, 2015) stated that high retention ratio combined
with low claims ratio are likely to positively impact on the performance of insurers. Hence
when an insurer is very efficient in its underwriting decisions vis-à-vis a high retention, this
should lead to profitability.
(Cummins et al., 2008) indicates that reinsurance has the potential to reduce an insurer’s risk
of insolvency by stabilizing the potential of losses, improve capacity whiles limiting the
firm’s liability on a particular risk and/or protect against catastrophes. The study also noted
that reinsurance is likely to decrease the incentive conflict that may arise between multiple
parties leading to reduced agency cost. The authors analysed 554 insurers from 1995 to 2003
which resulted in multiple conclusions. (Cummins et al., 2008)’s results showed “that the
coefficient associated with the growth rate of share of premiums ceded to non-affiliates
reinsurers is negative and statistically significant at the 5% level. Hence, ceding a larger share
of written premiums to non-affiliated insurers reduces significantly the volatility of the loss
ratio” (p. 21). (Cummins et al., 2008)however agreed that large insurers that generate
significant outputs “can purchase a larger quantity of reinsurance compared to small insurers
without ceding a higher proportion of the premiums written” (p. 12). The empirical results by
(Cummins et al., 2008) clearly indicate “that reinsurance increases significantly the costs of
producing insurance services and reduces significantly the volatility of the loss ratio. Thus,
insurers purchasing reinsurance accept to pay higher costs for the production of insurance
services to reduce their underwriting risk” (p. 22).

19
An article by (Lo, 2016) “interweaves empirical findings and academic research on the
optimal reinsurance ratio and studies the optimal insurance–reinsurance decisions made by an
insurer in the context of a three-party model comprising a policyholder, insurer and reinsurer.
The analytic results formed the basis for understanding the cost-benefit implications of
insurance and reinsurance for an insurer. The article placed emphasis on how the interplay
between insurance and reinsurance creates value to an insurer”.
(Johnson, 1977) states that if the unusually bad year of 1965 is excluded, primary insurers
were the most profitable. When this on-site study was conducted, nearly every primary
insurer was in the process of increasing its net retentions or its share of the pro-rata treaties.
Many executives had indicated that the largest premium and the largest profit were wrapped
up in the lower levels of coverage and to be profitable one had to retain much of this risk and
premium. A survey of the reinsurance brokers four years later indicates that this trend had
stopped abruptly and in some cases reversed direction.
Meng, Siub, & Yang (2016) discusses “optimal insurance risk control problem; a general
situation where several reinsurance companies enter into a reinsurance treaty with an
insurance company. The reinsurance companies adopt variance premium principles with
different parameters. Dividends with fixed costs and taxes are paid to shareholders of the
insurance company. Under certain conditions, a combined proportional reinsurance treaty is
shown to be optimal in a class of plausible reinsurance treaties. Within the class of combined
proportional reinsurance strategies, analytical expressions for the value function and the
optimal strategies are obtained” (p. 41).
Table 2.5: Premiums written by the 3 leading short-term reinsurers in 2016
Author(s) name Countries Sample
(firms)
Retention
Ratio
Major findings
(Burcă & Bătrînca, 2014) Romania 21 18.9% Negative
(Cummins et al., 2008) United States 554 68% Positive
(Mwangi & Murigu, 2015) Kenya 22 70% Positive
(Chen et al., 2016) United States 2,901 N.A Negative
(Sandrock, 1996) South Africa 34 23% Negative
(Lee & Lee, 2012) Taiwan 15 42% Negative
(Iqbal & Rehman, 2014) Pakistan 22 76% Positive

20
(Obonyo, 2016) Kenya 32 66% Positive
(Garven, 2003) United States 178 27% Positive
(Aduloju & Ajemunigbohun, 2015) Nigeria 10 44% Positive
(Alhassan, 2016) South Africa 80 56% Negative
(Omasete, 2014) Kenya 15 N.A Positive
(Alhassan & Biekpe, 2015) South Africa 441 56% Positive
(Vittas, 2003) Mauritius 17 53% Positive
(Akotey & Abor, 2013) Ghana 23 72% Negative
(Fields, Gupta, & Prakash, 2012) 63 countries 404 77.8% Positive
(Alhassan & Biekpe, 2016) South Africa 80 55.7% Positive
(Sheikh et al., 2017) Pakistan 27 94.4% Negative
(Upreti & Adams, 2015) United Kingdom 863 67% Positive
(Wanjugu, 2012) Kenya 22 70% Positive
Note: Retention ratio is measured as the volume of premiums retained by insurers after reinsurance
contracts to gross premiums
2.5 Summary of the literature
This chapter gave an overview of the insurance industry looking at the history and types of
insurance policies under short-term insurance according to the laws of South Africa. The
chapter then looked at the growth in gross premiums, insurance ceded and the ratio of
reinsurance to gross premium over the last 5 years. The 10 biggest short term insurers and 3
largest reinsurers were profiled. The chapter further discussed into details two theories,
namely agency and corporate demand. The agency theory emphasized the need to separate
ownership from management in a firm. Whiles the corporate demand theory states that,
demanding for insurance or reinsurance coverage is a risk sharing strategy.
The empirical research showed mixed results, i.e. some research indicated the positive impact
of reinsurance on financial performance whiles others stated otherwise. The only similarity in
the results can be attributed to the fact that it established the existence of some relationship
between reinsurance and financial performance. The four studies from South Africa indicated
an equal split on the relationship between reinsurance and financial performance, whiles
majority of developing economies showed a positive relationship between the two variables.
The United States, United Kingdom, Taiwan and Romania representing developed markets
with 6 studies in total showed 3 out of the 6 indicated negative results between the two
variables. In total there were 13 positive outcomes and 7 negative outcomes on the
relationship between reinsurance and financial performance.
21
CHAPTER THREE
RESEARCH METHODOLOGY
3.1 Introduction
This chapter defines the population, sample size and data period for the research. In addition,
the analytical framework in terms of the regression equation and measurement of variables in
the regression model as well as discussion of the estimation technique are explained.
Quantitative research methods were used in carrying out the research. The evaluation that was
carried out used two systems of data collection; techniques and literature review.
3.2. Sample size and data period
The population of this research is all the elements that form part of the universe of data
available in the South African insurance industry. The sample is a portion or section or part of
the population. This study adopted data from the FSB on all the registered short-term
insurance companies in South Africa and the annual reports of the respective companies.
Annual reports from the FSB on the insurance industry and individual company financials
were used to extract information for data analysis. This ensured that the research is
comprehensive and has reliable data. Secondary data was also gathered from the financial
statements of insurance companies which is available on the website of FSB i.e. industry
reports prepared by the FSB. In total 79 insurance companies formed part of the sample size.
The objective was to determine if there is a causative relationship between the data to be
collected. Financial statements and industry performance statistics on short-term insurance
companies available from 2007 – 2014 were used.
3.3 Analytical framework
The study used a panel regression model to examine the effect of reinsurance on financial
performance. It was presented as follows:

22
where refers to the proxies of financial performance measured as net profit; is the
proxy for reinsurance measured as the ratio of reinsurance premiums ceded to gross premiums
underwritten; denotes firm size measured as the natural logarithm of total assets;
represents the proxy for leverage measured as the ratio of debt to total assets; refers to
the proxy for the amount of risk underwritten or to be borne directly by the insurer and
measured by the ratio of net incurred claims to net premiums and; is the proxy for
diversification of investment and measured by the Herfinderahl index for product line
diversification.
3.3.1 Hypotheses Development
The theoretical arguments linking the independent variables and financial performance are
discussed in this section, in addition to the expected outcomes for this dissertation.
3.3.1.1 Reinsurance and Financial Performance
The use of reinsurance as the risk management tool has been widely used across the
world. Reinsurance is used by insurers as a risk mitigation tool, however risk management
can directly impact financial performance (Omasete, 2017). Risk management,
particularly reinsurance and return, have an inverse relationship which would mean that,
the more returns an insurer expects the less risk management policies i.e. reinsurance it
would have put in place as argued by (Obonyo, 2016). This study therefore expects that an
insurer with lower exposure to reinsurance to report better financial performance because
a large chunk of the net premiums will be available to the firm compared to firms that
have high reinsurance exposure. However, the insurer will be exposed to high claims in
the occurrence of the insured event. Insurers with high reinsurance ratios are expected by
the study to report relatively lower financial performance due to low net premiums
resulting in low earnings. In this study, firms with high reinsurance ratio are defined as
firms who have ceded at least 35% or more while firms with low reinsurance ratio have
ceded less than 35% of gross premiums.
: Reinsurance has a significant negative relationship with financial performance of short-term
insurers
23
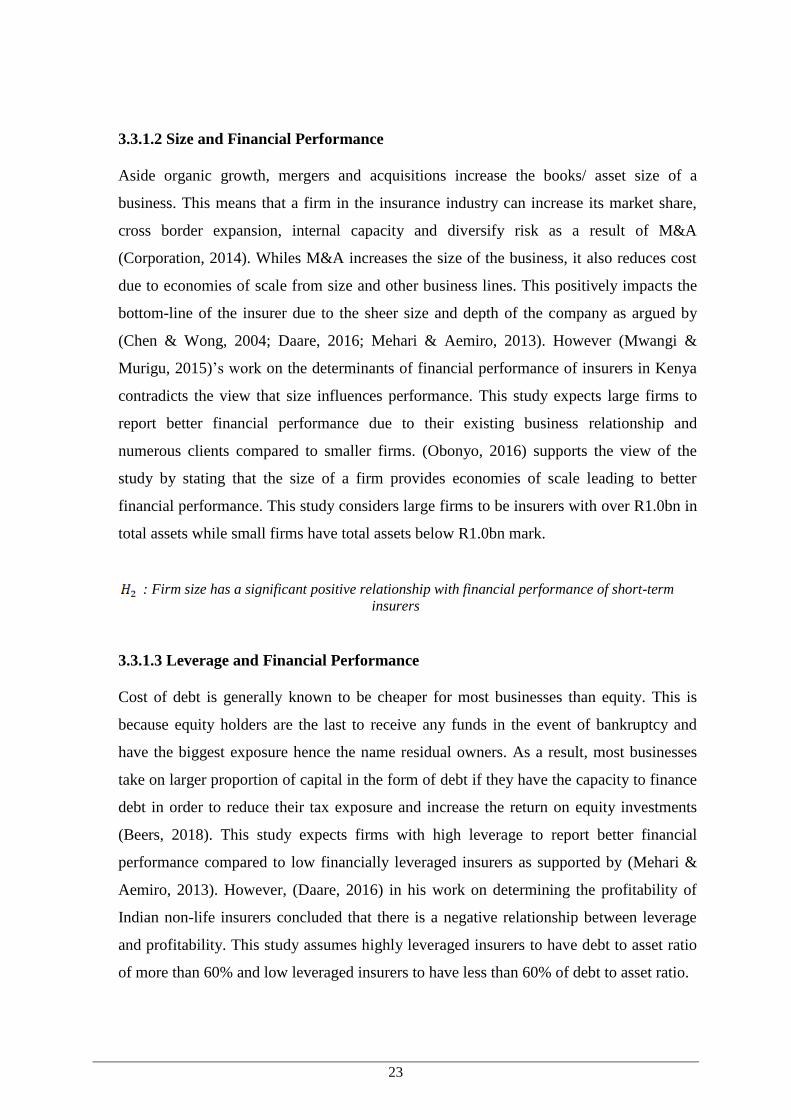
3.3.1.2 Size and Financial Performance
Aside organic growth, mergers and acquisitions increase the books/ asset size of a
business. This means that a firm in the insurance industry can increase its market share,
cross border expansion, internal capacity and diversify risk as a result of M&A
(Corporation, 2014). Whiles M&A increases the size of the business, it also reduces cost
due to economies of scale from size and other business lines. This positively impacts the
bottom-line of the insurer due to the sheer size and depth of the company as argued by
(Chen & Wong, 2004; Daare, 2016; Mehari & Aemiro, 2013). However (Mwangi &
Murigu, 2015)’s work on the determinants of financial performance of insurers in Kenya
contradicts the view that size influences performance. This study expects large firms to
report better financial performance due to their existing business relationship and
numerous clients compared to smaller firms. (Obonyo, 2016) supports the view of the
study by stating that the size of a firm provides economies of scale leading to better
financial performance. This study considers large firms to be insurers with over R1.0bn in
total assets while small firms have total assets below R1.0bn mark.
: Firm size has a significant positive relationship with financial performance of short-term
insurers
3.3.1.3 Leverage and Financial Performance
Cost of debt is generally known to be cheaper for most businesses than equity. This is
because equity holders are the last to receive any funds in the event of bankruptcy and
have the biggest exposure hence the name residual owners. As a result, most businesses
take on larger proportion of capital in the form of debt if they have the capacity to finance
debt in order to reduce their tax exposure and increase the return on equity investments
(Beers, 2018). This study expects firms with high leverage to report better financial
performance compared to low financially leveraged insurers as supported by (Mehari &
Aemiro, 2013). However, (Daare, 2016) in his work on determining the profitability of
Indian non-life insurers concluded that there is a negative relationship between leverage
and profitability. This study assumes highly leveraged insurers to have debt to asset ratio
of more than 60% and low leveraged insurers to have less than 60% of debt to asset ratio.

24
: Leverage has a significant positive relationship with financial performance of short-term
insurers
3.3.1.4 Underwriting risk and Financial Performance
Every insurer needs a good underwriter to accurately assess the risk in order to price in
the form of gross premiums. Sometimes insurance companies are faced with the situation
were claims exceed net earned premiums which then require the insurer to seek
alternatives to paying net claims (Mwangi & Murigu, 2015). Underwriting risk can be
higher than initially anticipated which will require the insurer to use its investments or
reinsurance while insurers with low underwriting risk will have little to pay to clients in
an unforeseen event. This study expects insurers with low underwriting risk to report
better financial performance compared to insurers with high underwriting risk exposure as
supported by (Kaya, 2015). (Kaya, 2015) states that “the results obtained for the loss ratio
variable indicate that non-life insurance companies with low underwriting risk have
higher profitability than non-life insurance companies with high underwriting”. This study
assumes insurers with low underwriting risk to have a combined ratio of less than 100%
and insurers with high underwriting risk to have a combined ratio of 100% and above.
: Underwriting risk has a significant negative relationship with financial performance of short-
term insurers
3.3.1.5 Diversification and Financial Performance
Deciding on the type of insurance policy to underwrite or business lines by the insurer has
an impact on bottom-line. The use of diversification by insurers has the potential to add
on more gross premiums, profits and improve the retention of existing clients due to
discounts from multiple policies with the same insurer. Also having multiple business
lines leads to diversification of revenue income which creates synergies and economies of
scale (Damodaran, 2001). On the cost side, insurers can negotiate for relatively lower cost
due to similar needs from different business lines. This study expects firms with multiple
business lines to report better financial performance compared to single-line insurers as
supported by a study by (Krivokapic, Njegomir, & Stojic, 2017). This study assumes
diversified insurers to have more than one insurance business line.

25
: Diversification has a significant positive relationship with financial performance of short-term
insurers
Table 1. 1: Summary of independent variables
Independent Variable Symbol Measurement Expected Sign
Reinsurance Reins As a proportion of gross premiums ceded
Firm Size Size Natural log of Total assets
Leverage Lev Ratio of total debt to total assets
Underwriting risk Urisk Ratio of incurred claims/Net Premium
Diversification Div An index of gross premiums across
business lines
3.4 Estimation techniques
The research employed statistical analysis tools via the use of regression analysis to test the
relationship between the variables. It also employed the use of fixed and random effects
estimation techniques for purposes of building the model.
3.4.1 Random and Fixed Effects Panel Data Model
Random effects estimation techniques assume “that there are no omitted variables or the
omitted variables are uncorrelated with the explanatory variables that are in the model. It
produces unbiased estimates of the coefficients, use all the data available, and produce the
smallest standard errors” (Williams, 2018). It is being employed to estimate both static and
dynamic panel data models to identify the source of financial performance. The fixed effect
panel data model is used when we are interested in analysing the impact of variables that vary
over time. Fixed effect model removes the effect of those time-invariant characteristics so we
are able to assess the net effect of the predictors on the outcome variable (Torres-Reyna,
2007).
According to (Statalist, 2018), “fixed-effects model represents subject-specific parameters as
fixed, yet unknown and random-effects model represents subject-specific parameters as
random variables”. It further states that the random-effect model (panel data) can be regarded
as two-level mixed model, with the first level representing observations within subjects and
the second level representing subjects. Thus, the random-effect model shows how much
variation is at observation level (within-subject) and how much variation is at subject level

26
(between-subject). Random means each subject has its own intercept and this intercept
involves a random part of the model. In the fixed-effect model however, the unobserved
heterogeneity is wholly absorbed in subject-specific intercepts which are correlated with
explanatory variables, in contrast with the random-effect model that has the unobserved
heterogeneity partly absorbed (thus some portion is left and that is the random effect part of
model).
According to (Wilhelm, 2016), fixed effects can be modelled by fitting a coefficient for each
level of the factor. The particular values of the coefficient of each factor is taken as a
realization of a normal distributed random variable. Therefore, the coefficient and the
corresponding factor are called a "random coefficient" and "random factor", respectively. If
you have missing values for that factor, a fixed representation would require to ignore all the
data where you have missing values for that factor, whereas a random representation allows
you to use all the available data.

27
CHAPTER FOUR
DISCUSSION OF FINDINGS
4.1 Introduction
This chapter discusses the inputs used in determining the relationship between reinsurance
and financial performance of short-term insurers in South Africa. It will proceed to analyse
the data, present analysis and produce findings which will be interpreted in the final sub-
section. Sub-section two of this chapter will provide the results of the analysis on the
variables used in the study whiles the third sub-section will present the results of the
regression analysis. The final sub-section will discuss the findings.
4.2 Descriptive Statistics
Table 4.1 below provides the descriptive statistics on both independent and dependent
variables. The independent variables are reinsurance, firm size, leverage, underwriting risk
and diversification, and the dependent variable is financial performance. The Table below
shows a mean reinsurance (REINS) score of 43.9%, return on equity (ROE) score of 16.6%,
underwriting profit (UPROF) score of 23.8%, return on assets (ROA) score of 9.2%, firm size
(SIZE) score of 13%, leverage (LEV) score of 57%, underwriting risk (URISK) score of 63%
and a diversification (DIV) score of 38%. ROA across the industry ranges from a minimum of
-3.5% to 15%.
The mean REINS of 43.9% is relatively lower than findings from (Lee & Lee, 2012) which
recorded 58% in Taiwan. However this still indicates high usage of reinsurance by short term
insurers in South Africa. (Aduloju & Ajemunigbohun, 2015) and (Vittas, 2003) found the
mean REINS to be 56% and 47% in Nigeria and Mauritius respectively. In South Africa, the
REINS of 77% was extremely high as shown from (Sandrock, 1996)’s finding, which was
identified over 20 years ago. Economic conditions and the development of the insurance
industry have changed now. South Africa has a stronger financial market and economic
situations have improved leading to reduced over-dependence on reinsurers. (Alhassan &
Biekpe, 2016), (Alhassan, 2016) and (Alhassan & Biekpe, 2015) recorded 44% which is close
to this study for the period starting 2007 to 2012. Studies by (Iqbal & Rehman, 2014) and
(Sheikh et al., 2017) which collected data in Pakistan both recorded low REINS of 24% and
6% respectively. This is an indication that Middle Eastern countries rely less on reinsurers.

28
Insurers with low reinsurance ratios and high financial performance are maximizing their net
premiums, have low underwriting risk, high leverage, diversified business lines and large
assets.
Table 4.1: Summary statistics
Mean Median Std. Dev. Min Max N
ROA 0.092 0.044 0.649 -3.504 15.003 582
ROE 0.166 0.132 0.745 -3.977 15.548 582
UPROF 0.238 0.117 0.803 -0.301 18.386 582
REINS 0.439 0.372 0.423 -0.002 4.652 582
SIZE 12.967 12.911 1.612 8.902 16.870 582
LEV 0.571 0.585 0.247 0.007 0.993 582
DIV 0.380 0.462 0.280 -0.232 0.826 585
URISK 0.630 0.560 2.452 -24.769 43.791 564 Notes: ROA=return on assets; ROE=Return on equity; UPROF=Underwriting profits; REINS=Reinsurance ratio;
SIZE=Firm size; LEV=Leverage; DIV=Business line diversification; URISK=Underwriting risk; Source: Authors estimation
from research data
4.2.3 Correlation Results
The correlation coefficients were estimated to examine the strength of the relationship among
the variables. A test of collinearity among the independent variables was conducted using a
correlation matrix. The results of the correlation analysis is presented in Table 4.2 below. The
table shows the correlations among the independent variables are below 0.94. In this case, a
decision has been made to retain all the variables since none of them have a correlation of
more than 0.70. Thus, there is no multicollinearity between the independent variables.
Table 4.2: Correlation Matrix
ROA ROE UPROF REINS SIZE LEV DIV URISK
ROA 1
ROE 0.9353 1
(0.000)
UPROF 0.9375 0.8606 1
(0.000) (0.000)
REINS -0.0492 -0.0677 -0.147 1
(0.2368) (0.1038) (0.0004)
SIZE -0.0736 -0.0195 -0.1093 -0.1341 1
(0.076) (0.6382) (0.0083) 0.0012
LEV -0.1361 -0.1136 -0.2073 0.345 0.3174 1
(0.001) (0.0061) (0.000) (0.000) (0.000)
DIV 0.0269 0.0494 -0.0162 0.182 0.2775 0.3676 1
(0.5193) (0.236) (0.698) (0.000) (0.000) (0.000)
URISK -0.0174 -0.0401 -0.0389 -0.0345 0.004 0.0389 -0.0181 1
(0.6815) (0.3432) (0.3575) (0.4144) (0.9242) (0.3579) (0.6682)
Notes: ROA=return on assets; ROE=Return on equity; UPROF=Underwriting profits; REINS=Reinsurance ratio;
SIZE=Firm size; LEV=Leverage; DIV=Business line diversification; URISK=Underwriting risk; Values in brackets are p-
values. Source: Authors estimation form research data

29
4.3 Regression Results: Reinsurance and Financial Performance
This stage delves into the impact of reinsurance on the financial performance score as
presented in Table 4.3 below. Overall, two Models are estimated under each technique as
explained in the previous chapter. The estimations under Model 1 (REM) and Model 2 (FEM)
includes all five control variables on size, reinsurance, underwriting risk, diversification and
leverage, resulting in five regression outputs. The results of the regression estimations in
Table 4.3 below identifies the determinants of financial performance. The Wald χ2 (P>χ2 of
less than 0.05) for ROA, ROE and UPROF indicate the fitness of the regression models. The
results of the Hausman specification test cannot be rejected at 5% significance level, hence
the REM technique is the efficient estimator and the discussion of the regression analysis is
limited to the REM results.
The reinsurance coefficient is negatively related to ROA, ROE and UPROF in REM at
significance levels of 10%, 5% and 1% respectively. This indicates that short term insurers
who cede more premiums in a bid to diversify their risk portfolio become less profitable. The
loss of investment income from the ceding of insurance premiums to reinsurers which is
associated with usage of reinsurance contracts outweighs the potential benefits of risk
reduction. This partly explains the observed negative relationship. This finding is consistent
with (Soye & Adeyemo, 2017)’s studies that there is no causal relationship between the
percentage of reinsurance ceded and financial performance. The result is also in line with our
hypothesis that reinsurance has significant negative relationship with financial performance of
short-term insurers.
Leverage coefficient exhibits a significant negative relationship with ROA and UPROF in the
preferred model (REM) at significance level of 1%. This suggest that high leverage is likely
to result in a decline in profitability. The burden of huge debts is expected to negatively affect
operations and profit margins. However, the impact of leverage on ROE has a negative but
not significant impact on profitability. This finding is consistent with studies by (Daare, 2016)
which concludes that the profitability of non-life insurers in India has a negative relationship
between their leverage. The result is inconsistent with our hypothesis that leverage has a
positive relationship with financial performance of short-term insurers.
30
The coefficient of product line diversification has a positive relationship with all forms of
profitability, except for ROA which has a negative effect using REM. Also, UPROF using
REM and FEM has significance levels of 10% and 5% respectively. This implies that
insurers’ diversification across multiple product lines increases financial performance. This
arises out of the potential synergies from risk sharing and lower cost across the various
business lines of the insurer. This is in line with studies of (Krivokapic et al., 2017) which
states that firms with multiple business lines report better financial performance compared to
single-line insurers. The result is consistent with our hypothesis that product line
diversification has a positive relationship with financial performance of short-term insurers.
The underwriting risk coefficient has a negative relationship to all variables i.e. ROA, ROE
and URPOF in the FEM model. This test implies that underwriting losses from claims
incurred reduces the profitability of an insurer. This is consistent with (Kaya, 2015)’s study
which expects an insurer with low underwriting risk to report better financial performance
compared to an insurer with high underwriting risk exposure. The result is in line with our
hypothesis that underwriting risk has a significant negative relationship with financial
performance of short-term insurers.

31
Table 4.3: Regression Results
Return on Assets (ROA) Return on Equity (ROE) Underwriting profit (UPROF)
REM FEM REM FEM REM FEM
Coef. p>z Coef. p>t
Coef. p>z Coef. p>t
Coef. p>z Coef. p>t
Constant 0.142***
(0.037)
0.000 0.194***
(0.056)
0.001
0.233***
(0.086)
0.007 0.429***
(0.140)
0.002
0.361***
(0.071)
0.000 0.322***
(0.082)
0.000
REINS -0.024*
(0.014)
0.077 0.000
(0.019)
0.991
-0.083**
(0.032)
0.011 -0.031
(0.047)
0.512
-0.236***
(0.024)
0.000 -0.222***
(0.027)
0.000
SIZE 0.001
(0.003)
0.662 -0.003
(0.004)
0.511
-0.001
(0.007)
0.845 -0.017
(0.011)
0.121
-0.001
(0.006)
0.83 0.001
(0.007)
0.873
LEV -0.134***
(0.017)
0.000 -0.151***
(0.021)
0.000
-0.035
(0.042)
0.407 -0.072
(0.053)
0.176
-0.141***
(0.029)
0.000 -0.145***
(0.031)
0.000
DIV -0.008
(0.015)
0.609 0.000
(0.022)
0.994
0.009
(0.037)
0.813 0.042
(0.054)
0.442
0.054*
(0.028)
0.057 0.065**
(0.032)
0.044
URISK -0.001*
(0.001)
0.087 -0.001
(0.001)
0.161
-0.005**
(0.002)
0.012 -0.005**
(0.002)
0.031
-0.001
(0.001)
0.287 -0.001
(0.001)
0.374
Wald /F (5) 100.17
13.89
17.4
2.7
174.94
26.56
prob > 0.000
0.000
0.0038
0.0205
0.000
0.000
R-squared 0.244
0.1278
0.0576
0.0276
0.3299
0.2189
R Hausman 8.274
9.475
7.573
prob > 0.1418
0.0916
0.1814
Insurers 79
79
79
79
79
79
Observations 558
558
558
558
558
558
Notes: ROA=return on assets; ROE=Return on equity; UPROF=Underwriting profits; REINS=Reinsurance ratio; SIZE=Firm size; LEV=Leverage; DIV=Business line diversification; URISK=Underwriting
risk; Values in brackets are standard errors. REM=Random Effects Model; FEM=Fixed Effects Model. ***, ** and * denotes significance at 1%, 5% and 10% respectively. Source: Authors estimation form
research data
32
CHAPTER FIVE
CONCLUSION AND RECOMMENDATION
5.1 Introduction
The final chapter of this study seeks to provide a summary of the findings in the previous
chapter, conclude on the findings, provide recommendations to stakeholders and highlight the
limitations of the study for further research. Reinsurance as it plays a crucial role in the
insurance industry has a direct relationship with financial performance. The presence or
absence of risk management via ceding of gross premiums can impact the operations of an
insurer. Ceding a high portion of gross premiums can inversely affect financial performance
whiles low exposure to reinsurance increases the risk profile of a firm.
5.2 Summary of findings and conclusion
The study’s objective was to examine the relationship that exist between reinsurance and
financial performance of 79 short-term insurers in South Africa from 2007 to 2014. It went
further to understand the relationship that exist between underwriting risk, firm size, leverage
and diversification.
The findings of this study indicate that there is a negative relationship between reinsurance
and financial performance. 44% of average gross premiums were ceded by short term insurers
to reinsurers. As reinsurance ratio increases, insurers are expected to report lower financial
results due to over-reliance on re-insurance. A positive relationship is likely to exist between
retention ratio and financial performance as high retention means more net premiums
available to be shared to shareholders in the event of low claims by the insured.
A negative relationship was observed between underwriting risk and financial performance of
short term insurers. As underwriting risk exposure increases, insurers are expected to report
lower profitability. The size of a short-term insurer correlates positively with financial
performance. Large insurance corporations in South Africa perform better than smaller sized
insurers. Which means the bigger the better, for short-term insurers. As a result, mergers and

33
acquisitions are recommended for the industry since consolidation will positively impact
bottom-line. The average firm size is 13% for short-term insurers.
The use of leverage positively impacts financial performance of insurers. Average leverage
ratio of short-term insurers is 57% of total assets. This means that more than 50% of assets of
insurance companies are financed with debt. As a result, most insurers in South Africa are
reducing their income tax payable due to interest payment to debt holders. Equity holders
effective profit after tax has been reduced marginally reduced. A positive relationship exist
between diversification of business lines and financial performance.
Insurers that have multiple policies for the respective types of policies under general
insurance; represent over 46% of insurers that are fully diversified based on the different
product types. Diversified insurers increase gross premiums from the same client whiles
reducing cost due to the scale of transactions. Hence diversification has a positive impact on
financial performance of short-term insurers.
The study concludes that the financial performance of short-term insurers in South Africa is
negatively and significantly influenced by the reinsurance ratio. Also underwriting risk
negatively impacts the financial performance of insurers. Diversification and leverage have
positive impact on the financial performance of short-term insurers. The size of a firm will
also have a positive impact on the financial stability of the insurer.
5.4 Recommendation
This study recommends that for short-term insurers to improve their performance on their
ROA, ROE and UPROF, they will have to increase their retention ratio through the reduction
of reinsurance contracts. This will lead to low reinsurance ratios allowing room for net
premiums to be available to the firm. Another way to increase profitability will be to diversify
the business lines of insurers, increase leverage and increase the asset size of the firm.
However, having multiple business lines will require additional set-up and regulatory costs
i.e. capital whiles high leverage has the potential to cripple the business due to high debt cost.
Insurers have to employ strong and experienced underwriters to ensure minimal underwriting
34
risk which has the potential to increase the financial performance of insurers in the short-term
insurance market.
5.5 Recommendations for Future Research
This study looked at the impact of reinsurance on the financial performance of short-term
insurers in South Africa. It also considered four other variables before concluding on their
impact on financial performance. This study therefore recommends that another study should
be conducted which will focus on other factors of reinsurance such as the impact of
reinsurance on solvency, liquidity and capital requirements. Another consideration will be to
conduct a similar study that covers more recent data including 2017 financials of short-term
insurers. The study can be improved by a further research which employs various measures of
financial performance like cash flows, earnings per share and revenue growth.

35
BIBLIOGRAPHY
Aduloju, S. A., & Ajemunigbohun, S. S. (2015). Reinsurance and performance of the ceding
companies: the Nigerian insurance industry experience. Economics and Business, 31(1), 19–29.
https://doi.org/https://doi.org/10.1515/eb-2017-0015
Africa, G. of S. (1998). Short-term insurance Act. Retrieved from
https://www.gov.za/sites/default/files/a53-98.pdf
Akotey, J. O., & Abor, J. (2013). Risk management in the Ghanaian insurance industry. Qualitative
Research in Financial Markets, 5(1), 26–42.
Alhassan, A. L. (2016). Efficiency, competition and risk-taking behaviour in the short term insurance
market in South Africa. Cape Town.
Alhassan, A. L., & Biekpe, N. (2015). Efficiency, productivity and returns to scale economies in the
non-life insurance market in South Africa. The Geneva Papers on Risk and Insurance Issues and
Practice, 1018–5895(15), 1–23. Retrieved from
https://www.researchgate.net/publication/272400991_Efficiency_Productivity_and_Returns_to_
Scale_Economies_in_the_Non-Life_Insurance_Market_in_South_Africa
Alhassan, A. L., & Biekpe, N. (2016). Competition and efficiency in the non-life insurance market in
South Africa. Journal of Economic Studies, 43(6), 882–909.
American Risk and Insurance Association. (2016). Reinsurance Network and the Performance of U.S.
Property-Liability Insurers (pp. 1–33). ARIA. Retrieved from
http://www.aria.org/Annual_Meeting/2016/Papers/Session2/II-E/Reinsurance Network and the
Performance of U.S. Property-Liability Insurers.pdf
Baur, P., & Breutel-O’Donoghue, A. (2004). Understanding reinsurance. Retrieved from
http://www.grahambishop.com/DocumentStore/SwissRe Understanding reinsurance.pdf
Beers, B. (2018). Debt Financing vs Equity Financing - Which is Cheaper?
Bernard, C., & Tian, W. (2009). Optimal reinsurance arrangements under tail risk measures. The
Journal of Risk and Insurance, 76(3), 709–725.
Burcă, A.-M., & Bătrînca, G. (2014). The Demand for Reinsurance in the Romanian Insurance Market
(pp. 1–13). Retrieved from
https://www.researchgate.net/publication/276417168_The_Demand_for_Reinsurance_in_the_Ro
manian_Insurance_Market
Chen, R., & Wong, K. A. (2004). The determinants of financial health of Asian insurance companies.
Journal of Risk and Insurance, 71(3), 469–499. Retrieved from
https://onlinelibrary.wiley.com/doi/pdf/10.1111/j.0022-4367.2004.00099.x
Corporation, A. R. (2014). Mergers and acqusitions within the insurance industry in Africa.
Cummins, J. D., Dionne, G., Gagne, R., & Nouira, A. (2008). The costs and benefits of Reinsurance.
Retrieved from http://www.hec.ca/iea/cahiers/2008/iea0804_rgagne.pdf
36
Daare, W. J. (2016). Determinants of non-life insurance companies profitability: an empirical study in
India. International Journal of Innovative Research and Advanced Studies, 3(13), 6–11.
Retrieved from https://www.researchgate.net/publication/318115984_Determinants_of_Non-
Life_Insurance_Companies_Profitability_An_Empirical_Study_in_India
Damodaran, A. (2001). Acquisitions and Takeovers. In Corporate Finance: Theory and Practice (pp.
702–738).
Dr. Schanz; Alms & Company. (2017). Africa reinsurance pulse 2017. Retrieved from
https://pulse.schanz-
alms.com/files/media.php?folder=files&file=f244ebf7e66248ee4d39a27e2f9ab3d4
Fields, L. P., Gupta, M., & Prakash, P. (2012). Risk Taking and Performance of Public Insurers: An
International Comparison. The Journal of Risk and Insurance, 79(4), 931–962. Retrieved from
http://www.jstor.org/stable/23354953
Finance Week. (2004). Reinsurers sneeze: Underwriters catch pneumonia. Finance Week, p. 48.
Financial Services Board. (2016). 2016 Annual report.
Financial Services Board. (2017). Special report on the results of the short-term insurance industry.
Retrieved from https://www.fsb.co.za/Departments/insurance/Documents/ST-SPECIALR - 30
SEPTEMBER 2017.pdf
FindanAdvisor. (2018). Short Term Insurance. Retrieved from
https://www.findanadvisor.co.za/content_short-term-insurance
Garven, J. R. (2003). The Demand for Reinsurance: Theory and Empirical Tests. Texas.
Iqbal, H. T., & Rehman, M. U. (2014). reinsurance analysis with respect to its impact on the
performance: evidence from non-life insurers in Pakistan. Aestimatio, The IEB International
Journal of Finance, 8(1), 90–113. Retrieved from
https://www.researchgate.net/publication/293782115
Jerzemowska, M. (2006). The main agency problems and their consequences. Acta Oeconomica
Pragensia, 2006(3), 9–17.
Johnson, R. E. (1977). Reinsurance: Theory, the New Applications, and the Future. The Journal of
Risk and Insurance, 44(1), 55–66. Retrieved from https://www-jstor-
org.ezproxy.uct.ac.za/stable/pdf/251856.pdf?refreqid=search%3Aa7ed504df6eadaae7f2b8aa128
ac749c
Kaya, E. Ö. (2015). The effects of firm-specific factors on the profitability of non-life insurance
companies in Turkey. International Journal of Financial Studies, 3, 510–529. Retrieved from
www.mdpi.com/journal/ijfs
KPMG. (2013). The South African insurance industry survey 2013.
KPMG. (2016). Financial Services: the South African insurance industry survey 2016.
Krivokapic, R., Njegomir, V., & Stojic, D. (2017). Effects of corporate diversification on firm
performance: evidence from the Serbian insurance industry. Economic Research-Ekonomska

37
Istraživanja, 30(1), 1224–1236.
Lee, H.-H., & Lee, C.-Y. (2012). An analysis of reinsurance and firm performance: evidence from the
Taiwan property-liability insurance industry. The International Association for the Study of
Insurance Economics, 37(1), 467–484. Retrieved from
https://link.springer.com/article/10.1057/gpp.2012.9
Lo, A. (2016). How Does Reinsurance Create Value to an Insurer? A Cost-Benefit Analysis
Incorporating Default R. Riskks, 4(48), 1–16. Retrieved from www.mdpi.com:8080/2227-
9091/4/4/48/pdf
Mehari, D., & Aemiro, T. (2013). Firm specific factors that determine insurance companies’
performance in Ethiopia. European Scientific Journal, 9(10), 1–11.
Meng, H., Siub, T. K., & Yang, H. (2016). Optimal insurance risk control with multiple reinsurers.
Journal of Computational and Applied Mathematics, 306(1), 40–52. Retrieved from https://ac-
els-cdn-com.ezproxy.uct.ac.za/S0377042716301698/1-s2.0-S0377042716301698-
main.pdf?_tid=9387f8f9-d956-427e-b4d5-
9a60384af746&acdnat=1529969534_79829cdd8c698ef3a88895d316bb750d
Mwangi, M., & Murigu, W. (2015). The determinants of financial performance in general insurance
companies in Kenya. European Scientific Journal, 11(1), 1–10. Retrieved from
http://eujournal.org/index.php/esj/article/viewFile/4953/4715
OBG. (2017). South African insurance sector undergoes a period of transformation. Retrieved from
https://oxfordbusinessgroup.com/overview/opportunity-and-challenge-sector-midst-far-reaching-
transformations
Obonyo, S. N. (2016). The effect of reinsurance programmes on financial performance of general
insurance companies in Kenya. University of Nairobi.
Omasete, C. A. (2014). The effect of risk management on financial performance of insurance
companies in Kenya. Nairobi.
Omasete, C. A. (2017). The effect of risk management on financial performance of insurance
companies in Kenya. Imperial Journal of Interdisciplinary Research, 3(5), 259–282. Retrieved
from https://www.onlinejournal.in/IJIRV3I5/036.pdf
Oxford Business Group. (2016). Insurance, The Report: South Africa 2016. Retrieved from
https://www.oxfordbusinessgroup.com/south-africa-2016/insurance
Plessis, M. du, Mostert, F. J., & Mostert, J. H. (2010). Reinsurance by South African short-term
insurers. Corporate Ownership & Control, 7(3), 210–218.
PwC. (2012). Too important to fail: Insurance company enterprise risk and capital management
capabilities. Retrieved from https://www.pwc.com/us/en/financial-
services/publications/viewpoints/insurance-enterprise-risk-and-capital-management.html
PwC. (2014). Insurance industry analysis. Retrieved from
https://www.pwc.co.za/en/assets/pdf/insurance-industry-analysis-march-2014.pdf

38
SAIA. (2018). SAIA 2017 Annual Review. Retrieved from
https://saia.co.za/assets/ebook/AR2017/mobile/index.html#p=6
Sandrock, G. J. (1996). Critical factors for the financial success of South African short-term insurers.
Sheikh, S., Syed, A. M., & Shah, S. S. A. (2017). Corporate Reinsurance Utilisation and Capital
Structure: Evidence from Pakistan Insurance Industry. The International Association for the
Study of Insurance Economics, 1018–5895(17), 1–35. Retrieved from
www.genevaassociation.org
Soye, Y. A., & Adeyemo, D. L. (2017). Evaluation of impact of reinsurance mechanism on insurance
companies sustainability in Nigeria. International Journal of Research, Innovations and
Sustainable Development, 7(1), 1–14. Retrieved from
https://www.researchgate.net/publication/321396888_EVALUATION_OF_IMPACT_OF_REIN
SURANCE_MECHANISM_ON_INSURANCE_COMPANIES_SUSTAINABILITY_IN_NIGE
RIA
Statalist. (2018). Forums for Discussing Stata. Retrieved September 5, 2018, from
https://www.statalist.org/forums/forum/general-stata-discussion/general/1431151-what-s-
difference-between-fixed-effects-model-random-effects-model-in-panel-data-analysis
SwissRe. (2017). Global insurance review 2017 and outlook 2018 /19. Retrieved from
http://institute.swissre.com/research/library/Global_insurance_review_2017_outlook_2018.html
#inline
Torres-Reyna, O. (2007). Panel Data Analysis Fixed and Random Effects using Stata. Retrieved from
https://www.princeton.edu/~otorres/Panel101.pdf
Upreti, V., & Adams, M. (2015). The strategic role of reinsurance in the United Kingdom’s (UK) non-
life insurance market. Journal of Banking & Finance, 61(1), 206–219. Retrieved from https://ac-
els-cdn-com.ezproxy.uct.ac.za/S037842661500268X/1-s2.0-S037842661500268X-
main.pdf?_tid=09b2ab5b-03d5-4753-b6b9-
144e0334a5e0&acdnat=1529980467_53a0de5ed28a59c99c537058b7fbb24f
Vittas, D. (2003). The Insurance Industry in Mauritius (No. 3034). Washington. Retrieved from
https://openknowledge.worldbank.org/bitstream/handle/10986/18272/multi0page.pdf?sequence=
1&isAllowed=y
Wanjugu, M. J. (2012). The determinants of financial performance in general insurance companies in
Kenya. University of Nairobi.
Wilhelm, J. (2016). What is the difference between fixed effect and random effect in repeated
measures ANOVA? Retrieved from
https://www.researchgate.net/post/What_is_the_difference_between_fixed_effect_and_random_
effect_in_repeated_measures_ANOVA
Williams, R. (2018). Fixed Effects vs Random Effects Models. Retrieved from
https://www3.nd.edu/~rwilliam/stats3/panel04-fixedvsrandom.pdf
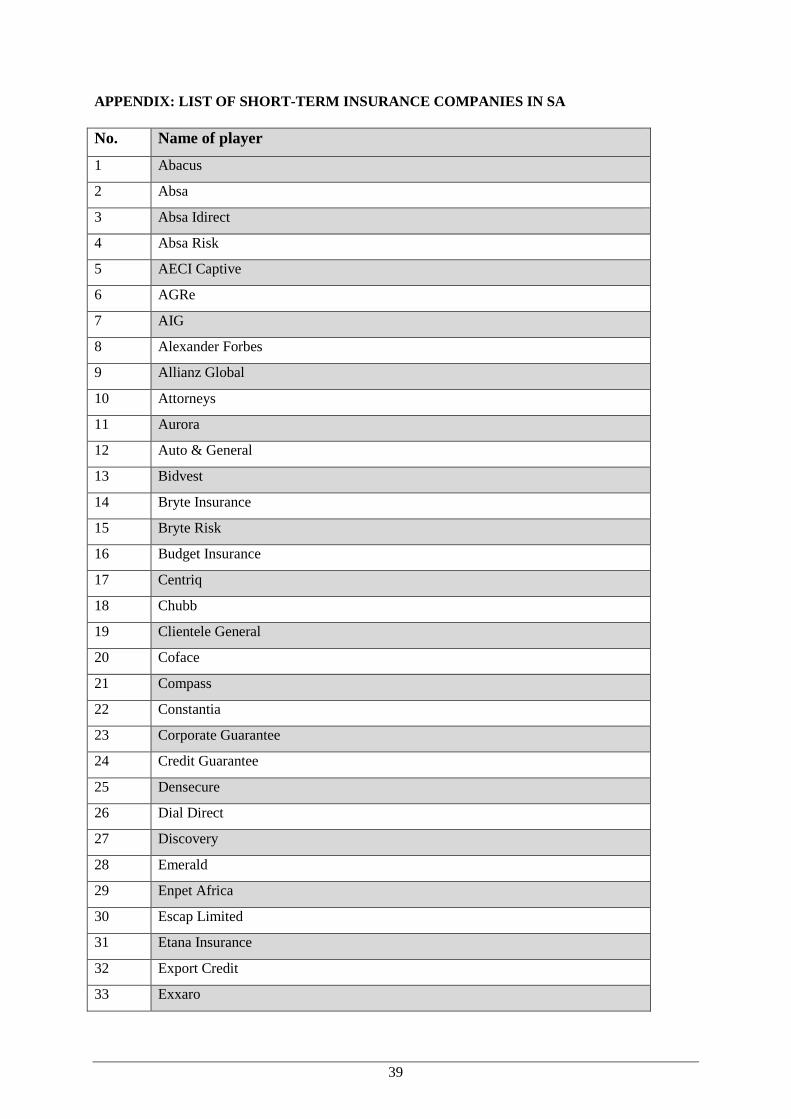
39
APPENDIX: LIST OF SHORT-TERM INSURANCE COMPANIES IN SA
No. Name of player
1 Abacus
2 Absa
3 Absa Idirect
4 Absa Risk
5 AECI Captive
6 AGRe
7 AIG
8 Alexander Forbes
9 Allianz Global
10 Attorneys
11 Aurora
12 Auto & General
13 Bidvest
14 Bryte Insurance
15 Bryte Risk
16 Budget Insurance
17 Centriq
18 Chubb
19 Clientele General
20 Coface
21 Compass
22 Constantia
23 Corporate Guarantee
24 Credit Guarantee
25 Densecure
26 Dial Direct
27 Discovery
28 Emerald
29 Enpet Africa
30 Escap Limited
31 Etana Insurance
32 Export Credit
33 Exxaro
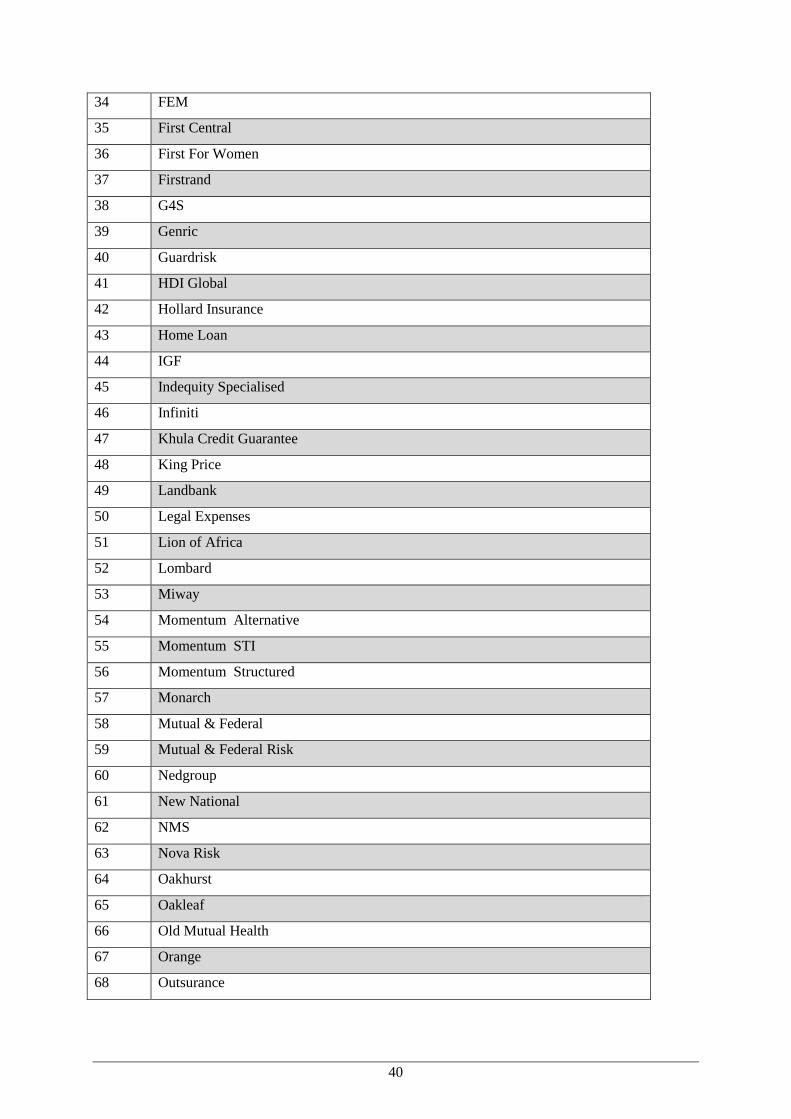
40
34 FEM
35 First Central
36 First For Women
37 Firstrand
38 G4S
39 Genric
40 Guardrisk
41 HDI Global
42 Hollard Insurance
43 Home Loan
44 IGF
45 Indequity Specialised
46 Infiniti
47 Khula Credit Guarantee
48 King Price
49 Landbank
50 Legal Expenses
51 Lion of Africa
52 Lombard
53 Miway
54 Momentum Alternative
55 Momentum STI
56 Momentum Structured
57 Monarch
58 Mutual & Federal
59 Mutual & Federal Risk
60 Nedgroup
61 New National
62 NMS
63 Nova Risk
64 Oakhurst
65 Oakleaf
66 Old Mutual Health
67 Orange
68 Outsurance
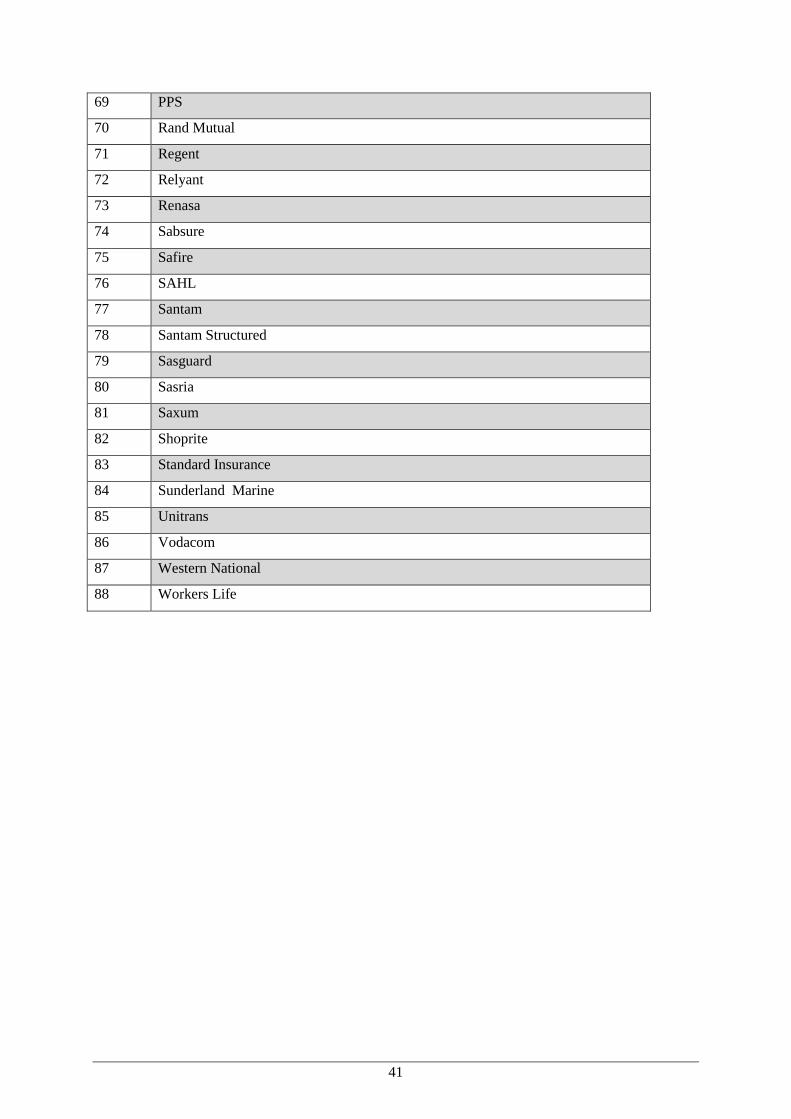
41
69 PPS
70 Rand Mutual
71 Regent
72 Relyant
73 Renasa
74 Sabsure
75 Safire
76 SAHL
77 Santam
78 Santam Structured
79 Sasguard
80 Sasria
81 Saxum
82 Shoprite
83 Standard Insurance
84 Sunderland Marine
85 Unitrans
86 Vodacom
87 Western National
88 Workers Life