reinsurance and corporate taxation in the united kingdom life insurance industry
TRANSCRIPT

Available online at www.sciencedirect.com
www.elsevier.com/locate/jbf
Journal of Banking & Finance 32 (2008) 101–115
Reinsurance and corporate taxation in the United Kingdomlife insurance industry
Mike Adams a,*, Philip Hardwick b,1, Hong Zou c,2
a School of Business and Economics, University of Wales Swansea, Singleton Park, Swansea, SA2 8PP, United Kingdomb Institute of Business and Law, Bournemouth University, Fern Barrow, Poole, BH12 5BB, United Kingdom
c Department of Economics and Finance, City University of Hong Kong, 83 Tat Chee Avenue, Kowloon Tong, Kowloon, Hong Kong, China
Available online 12 September 2007
Abstract
There are two main tax-related arguments regarding the use of reinsurance – the income volatility reduction and the income levelenhancement arguments. The income volatility reduction argument contends that firms facing convex tax schedules have incentivesto hedge in order to reduce the volatility of their annual taxable income and thereby lower expected tax liabilities [Smith, C.W., Stulz,R.M., 1985. Optimal hedging policies. Journal of Financial and Quantitative Analysis 19, 127–140]. The income level enhancementargument, advanced by Adiel [Adiel, R., 1996. Reinsurance and the management of regulatory ratios and taxes in the property–casualtyinsurance industry. Journal of Accounting and Economics 22, 207–240], is more specific to hedging via reinsurance. This perspectiveholds that reinsurance enhances current reported earnings via the receipt of reinsurance commissions and so increases tax liabilities.Consequently, insurance firms with high marginal tax rates should use less reinsurance than those with low marginal tax rates if taxmatters. Prior studies using data on financial derivatives have produced mixed results on the validity of the first argument, while Adiel(1996) finds the second argument insignificant in his study of the use of reinsurance by a sample of United States (US) property-liabilityinsurance firms. This study tests the two tax-related arguments using 1992–2001 data for a sample of United Kingdom (UK) life insur-ance firms. We find that UK life insurers with low before-planning marginal tax rates tend to use more reinsurance; in contrast, taxconvexity is found to have no significant impact on the purchase of reinsurance and so the volatility-reduction argument is notsupported.� 2007 Elsevier B.V. All rights reserved.
JEL classification: G22
Keywords: United Kingdom; Life insurance; Reinsurance; Taxation; Marginal tax rate; Tax convexity
1. Introduction
The management of corporate taxes has been examinedin the banking industry (e.g., Scholes et al., 1990; Beatty
0378-4266/$ - see front matter � 2007 Elsevier B.V. All rights reserved.
doi:10.1016/j.jbankfin.2007.09.006
* Corresponding author. Tel.: +44 (0) 1792 513035; fax: +44 (0) 1792295626.
E-mail addresses: [email protected] (M. Adams), [email protected] (P. Hardwick), [email protected] (H. Zou).
1 Tel.: +44 (0) 1202 965199; fax: +44 (0) 1202 965261.2 Tel.: +852 2194 2439; fax: +852 2788 8842.
et al., 1995; Chen and Daley, 1996) and in the insuranceindustry (e.g., Grace, 1990; Petroni, 1992; Cummins andGrace, 1994). Research in the United States (US) prop-erty–liability insurance industry (e.g., Petroni and Shackel-ford, 1995, 1999; Derrig and Ostaszewski, 1997; Gaver andPaterson, 1999; Ke et al., 2000; Petroni et al., 2000) sug-gests that managers can manage corporate taxes and/ormeet regulatory capital (solvency) requirements throughreserving and asset-liability management. Other researchfinds that these business objectives can also be achievedby transferring underwriting risks to other insurance enti-ties through reinsurance treaties (e.g., see Hoerger et al.,
102 M. Adams et al. / Journal of Banking & Finance 32 (2008) 101–115
1990; Berger et al., 1992; Adiel, 1996).3 Indeed, since rein-surance is an important contingent financing (capacityenhancing) mechanism for primary carriers of insurance(Mayers and Smith, 1990) and taxes are potentially impor-tant determinants of firms’ financing decisions (Graham,1996a, 2003), the reinsurance-tax relation in the insuranceindustry is an important area for empirical research.
The corporate risk management literature (e.g., Smithand Stulz, 1985; Mayers and Smith, 1990; Garven andLouberge, 1996; Garven and Lamm-Tennant, 2003a; Gra-ham and Smith, 1999) reports that if firms face convex(i.e., progressive) tax schedules, then risk management/hedging activities that reduce the variability of taxableincome can help lower the expected net present value offuture taxes (hereafter described as the income volatilityreduction argument). Some studies test the income volatil-ity reduction argument using data on financial derivatives,but produce mixed results.4 For example, Barton (2001)and Dionne and Garand (2003) cite supporting evidence,while Tufano (1996) and Graham and Rogers (2002) findno support for the above view. Not surprisingly, Grahamand Rogers (2002, p. 816) state that ‘‘ . . . (whether)companies can reduce expected tax liabilities by hedgingto reduce taxable income volatility is an important butunresolved hypothesis.’’ In their analysis of the purchaseof reinsurance by a sample of US property-liability insur-ance companies, Mayers and Smith (1990) and Garvenand Lamm-Tennant (2003b) did not test the incomevolatility reduction argument of tax due to datalimitations.
In this study, we test the income volatility reductionargument for corporate hedging using data on reinsurancepurchases for a sample of UK life insurers over the period1992–2001. Reinsurance provides a potentially interesting
3 Traditional risk reinsurance involves a direct insurer ceding all or partof its assumed underwriting risks to another company (the reinsurer) inreturn for a share of the gross premiums written (Berger et al., 1992). Riskreinsurance differs from more recent financial (finite) reinsurance arrange-ments that provide direct insurers with up-front capital representing thepresent value of liabilities with the level of ceded premiums linked tofuture claims and profit emergence. In contrast to risk reinsurance,financial reinsurance also involves very little (if any) transfer of risk fromthe direct insurer to the reinsurance company (Adiel, 1996). However, forour period of analysis (1992–2001) the use of capital support methods,such as financial reinsurance, was not widespread among UK life insurers(Sanders, 2000) and so financial reinsurance is deemed to be outside thescope of this study. Moreover, because we are concerned with the overalllevel of reinsurance in this study we do not distinguish betweenproportional reinsurance (i.e., where the reinsurer shares losses with thedirect insurer on a fixed percentage of risks underwritten – e.g., quotashare treaties) and non-proportional reinsurance (i.e., where a reinsureronly becomes liable for losses above the direct insurer’s retention limit –e.g., excess of loss treaties). Winton (1995) observes that it is proportionalreinsurance treaties that tend to predominate in the life insurance industry.
4 The majority use of data on financial derivatives is due largely to theroutine disclosure of such data in financial reports as well as the difficultyof obtaining data on other forms of corporate risk management (e.g.,insurance purchases).
setting within which to conduct this test for two reasons.First, unlike the use of financial derivatives, reinsurancecannot be used for speculative purposes and so our studyoffers a potentially cleaner empirical test of the income vol-atility reduction argument compared with prior studiesusing data on financial derivatives. Second, the reinsur-ance-tax relation is worth investigating because, in additionto the income volatility reduction effect, there is an alterna-tive tax-related argument for reinsurance purchases –which does not normally exist in other forms of hedging(e.g., using financial derivatives). Specifically, Adiel(1996) points out that the receipt of reinsurance commis-sions increases the current period pre-tax earnings of insur-ers that purchase reinsurance and thereby increases theirexpected tax liabilities. Therefore, insurers facing highbefore-planning marginal tax rates are likely to use lessreinsurance than insurers facing low before-planningmarginal tax rates in order to reduce tax liabilities (hereaf-ter described as the income level enhancement argument).We believe the income volatility reduction and incomeenhancement arguments are not mutually exclusive asreinsurance can affect both the level and variability offuture taxable income. Hence, which tax effect predomi-nates in the reinsurance decisions of insurance companiesshould be an interesting question worthy of empiricalinvestigation.5
Examining the reinsurance-tax relation is important notonly because reinsurance as an important risk managementdecision affects insurers’ financial strength and solvencyability, but also because many industrial companies indi-rectly access reinsurance via captive insurance companies.6
Indeed, Skipper (1998, p. 660) reports that over 90 percentof the top 500 companies in the US and over 80% of thetop 200 companies in the UK have established captiveinsurance operations. Given such a widespread (indirect)use of reinsurance in the general corporate sector throughcaptive insurance subsidiaries, the results of this studycould also be of interest to parties in sectors outside theinsurance industry.
If the income volatility reduction argument dominatesmanagerial decision-making, insurance companies facinga convex tax position are likely to use more reinsurance
5 Graham and Rogers (2002) report that there are tax shield incentivesfor corporations to hedge as more interest tax deductions can arise fromexpanded debt capacity. While such incentives are potentially importantfor industrial firms, they are relatively insignificant for insurers. Forexample, Gaver and Pottier (2005) note that conventional forms ofborrowing (e.g., bank loans and bond issues) are typically very limited forinsurers because under insurance regulations fixed debt contract claims arenearly always subordinate to policyholders’ liabilities.
6 A captive insurance company is an insurance subsidiary of a non-insurance parent company. Captives are often located in tax favorableoffshore domiciles (such as Bermuda) and provide scope for managers ofcorporate groups to engage in transnational tax arbitrage (e.g., see Adamsand Hillier, 2000). Non-insurance companies can access the reinsurancemarket via their captive insurance subsidiaries.

M. Adams et al. / Journal of Banking & Finance 32 (2008) 101–115 103
in order to reduce the expected future tax liabilities thanother insurers, other things being equal. If the income levelenhancement argument is valid, an insurer with a high(before-planning) marginal tax rate is likely to use less rein-surance than an insurer with a low (before-planning) mar-ginal tax rate in order to reduce the expected tax liabilities.Our tests provide support for the income level enhance-ment argument but not for the income volatility reductioneffect. To our knowledge, evidence consistent with theincome level enhancement argument advanced by Adiel(1996) has not previously been reported in the literature.Our finding on the income volatility reduction argumentcorroborates the findings of some prior studies using dataon financial derivatives (e.g., Tufano, 1996; Graham andRogers, 2002), but is different from the findings of Barton(2001) and Dionne and Garand (2003).
One prior study that has a close connection to ours isAdiel (1996). However, several major differences exist.First, Adiel (1996) uses data from US property-liabilityinsurers, while we use data from the UK life insuranceindustry.7 Second, Adiel (1996) examines the relationbetween insurers’ reinsurance purchases and contempora-neous marginal tax rates (to test the income level enhance-ment argument) and finds no significant relation. Instead,he finds that meeting regulatory solvency requirements isan important motivation for the purchase of reinsuranceby his sample of US property-liability insurers. In contrast,our study concomitantly tests both the income volatilityreduction and income enhancement arguments (usingbefore-planning marginal tax rates rather than contempo-raneous rates). Third, our construction of proxies for mar-ginal tax rates is built on recent developments in tax-relatedstudies (e.g., Graham, 1996b; Plesko, 2003).
The remainder of this paper is structured as follows.Section 2 introduces background information on the taxa-tion requirements for UK life insurers. Section 3 developsthe two tax-related arguments concerning the purchase ofreinsurance and discusses other determinants of reinsur-ance. Section 4 describes the research design, includingthe model specification, the measurement of the variablesand data sources. Section 5 discusses the empirical results.Section 6 provides some robustness checks and furthertests, and Section 7 concludes the paper.
8 Shackelford (1996, p. 244) reports that SAP involves both accrual andcash accounting methods and is more conservative than GAAP as it isprimarily concerned with reporting the regulatory capital (solvency)position of insurers. An example of where the SAP basis differs fromGAAP reporting is the treatment of new business acquisition costs. Under
2. Institutional background
The UK life insurance industry currently comprisesabout 250 companies of varying size, ownership structureand product type, generating annual premiums of approx-
7 Property-liability insurers normally underwrite short-term (annualrenewable) insurance business (e.g., automobile insurance), while lifeinsurers engage in long-term (e.g., life and health) insurance business thatrelies on mortality tables. Given their significant difference, academicstudies normally examine life insurance and property-liability insuranceseparately (e.g., see Pottier and Sommer, 1997).
imately £107 billion (US$170 billion) (Association of Brit-ish Insurers, 2001). During the 10-year period of ouranalysis (1992–2001) statutory solvency monitoring andother regulation of UK life insurance companies were gov-erned by various statutes notably the Insurance CompaniesAct (1982) and the Insurance Companies Regulations(1994). These Acts require UK life insurers to prepare bothannual reports based on generally accepted accountingprinciples (GAAP) and annual filings based on statutoryaccounting (solvency) principles (SAP) for the insuranceindustry regulator, currently the Financial ServicesAuthority (FSA). In the UK (as in other jurisdictions, suchas Canada and the US), SAP rules are heavily influencedby actuarial custom and practice (Adams and Scott,1994) and provide the basis for determining the annual tax-able income of insurance companies.8 Therefore, the poten-tially confounding effects of time-related and permanentdifferences that typically exist between accounting earningsand taxable income can be effectively minimized throughthe use of data based on SAP.
The taxation of UK life insurance companies is gov-erned by two main statutes – the Income and CorporationTaxes Act (ICTA) (1988) and the Finance Act (FA) (1989)(plus statutory amendments) (Mehta, 1993; Carter, 1995).For stock life insurers, these statutes prescribe that share-holders’ profits should be assessed according to the sche-dule of general corporate income tax. For mutual lifeinsurers, due to historical reasons, net income attributedto UK policyholders is taxed at the lower basic rate oftaxation (22%).9 However, for both stock and mutual lifeinsurers the schedule of general corporate income taxapplies to other classes of long-term business, such asoverseas life insurance, permanent health policies and sav-ings plans (Sole, 1995). Specifically, the schedule of gen-eral corporate income tax in 2001 was 10% on taxableprofit up to £0.01 million; 20% on taxable profit between£0.01 million and £0.05 million, but with a marginal reliefequal to (£0.05 million – taxable profit) · 1/40; 20% ontaxable profit between £0.05 million and £0.3 million;30% on taxable profit between £0.3 million and £1.5million, but with a marginal relief equal to (£1.5 million –taxable profit) · 1/40; 30% on taxable profit above£1.5 million.10 This means that the taxation of UK life
SAP the costs of new business acquisition (e.g., promotions and salescommissions) are written off against policyholders’ funds when incurred,while under GAAP such acquisition costs are matched against realizedincome over the duration of the contract (Adams and Scott, 1994, p. 446).
9 Such variations are not material and so unlikely to affect the influenceof organizational form on the reinsurance-tax relation (Sole, 1995).10 The top corporate income tax rate was 33% for years 1992–1996, 31%
for years 1997–98 and 30% for years 1999–2001.

104 M. Adams et al. / Journal of Banking & Finance 32 (2008) 101–115
insurers, like other jurisdictions such as Canada and theUS, tends to follow a (non-linear) progressive tax schedulewhereby the marginal rate of taxation is generally increas-ing with the amount of taxable income (e.g., see Garvenand Lamm-Tennant, 2003a). However, note that, com-pared with the US tax code, the convexity range of thecorporate tax schedule appears larger in the UK, whichmay make the UK corporate sector a good setting to testthe income volatility reduction argument for corporatehedging.11
Prior US tax-based research (e.g., Ke et al., 2000) alsonotes that state-based tax regimes can induce managers totake different corporate risk management decisions (e.g.,with regard to the trade-off between commercial insur-ance purchases and captive insurance). However, unlikeits US counterpart, the UK life insurance industry is aunitary regulatory environment for taxation purposes.This means that potentially confounding effects resultingfrom different accounting and tax rules can be avoided.We consider that this institutional attribute is anotherfactor that makes the UK’s life insurance industry aninteresting environment within which to conduct ourresearch.
In determining annual taxable profit of life insurers, UKlegislation follows the so-called I-E basis – i.e., the net fig-ure of qualifying income (I) less deductible business oper-ating expenses (E) (Sole, 1995). Additionally, the UK’stax rules allow direct life insurers to make various adjust-ments for certain chargeable expenses (e.g., legal andclaims’ handling costs) incurred in issuing/administeringlife insurance policies and various tax credits (e.g., forprior-period operating losses) (Mehta, 1993). The FA(1989) prohibits the previous practice of life insurancefirms carrying back net operating losses on ordinary lifeinsurance business to refund prior years’ taxes (Macleodand Levitt, 1999, p. 71). Nonetheless, net operating losseson life insurance business can be carried forward againstfuture annual earnings indefinitely in the tax liability calcu-lation. Therefore, on the one hand, the disallowance oftax-loss carry-backs will increase the tax convexity ofUK life insurers; on the other hand, the indefinite carry-forward relief mitigates, but does not eradicate, the con-vexity of UK life insurers’ tax schedules due to the timevalue of money (see Green and Talmor, 1985, p. 1108).Indeed, Garven and Louberge (1996, p. 91) also reportthat the notion of tax convexity in the insurance industryholds as ‘‘ . . . future gains and losses are uncertain andmust (therefore) be discounted.’’ Therefore, we considerthat, a priori, the tax code applicable to UK life insurersis generally progressive and as such, the UK life insuranceindustry may serve as a good context to test the tax-con-vexity related incentives of hedging.
11 For example, in the US, the tax code introduces a convex tax functionfor low levels of taxable income (typically US$0-100 K) and a linear onefor income onwards (Green and Talmor, 1985).
3. Development of hypotheses
3.1. Reinsurance and tax convexity
The finance and risk management literature (e.g., seeGreen and Talmor, 1985; Smith and Stulz, 1985; Mayersand Smith, 1990; Berger et al., 1992; Garven and Louberge,1996; Doherty, 2000; Graham and Rogers, 2002; Garvenand Lamm-Tennant, 2003a,b) has long argued that forinsurance firms facing convex tax schedules, risk manage-ment (e.g., reinsurance) can be an efficient mechanism fortax management as it helps to mitigate the volatility offuture taxable income and thereby lower expected futuretax liabilities. This is because in the case of a convex taxschedule, reinsurance enables insurance firms to lock intoa certain level of future income that is taxed more favor-ably than would be the case if the direct insurer adopteda risk retention strategy where less tax is paid in the eventof a loss and more tax is paid when there are no losses.12
Graham and Smith (1999) and Graham (2003) argue thattax convexity not only arises from progressivity in statu-tory tax rates but also occurs because of the asymmetrictreatment of profits and losses in the corporate tax code(e.g., with regard to tax-loss carry-forwards and carry-backs), the expected variability of taxable income, andthe discounted effect of the time value of money.
Under a contingent claims framework, Green and Tal-mor (1985) argue that in the presence of asymmetric corpo-rate taxes, the future taxes of a firm can be likened to agovernment-written call option on future income streams,with the strike price equal to the value of tax allowabledeductibles on current (actuarially determined) annual tax-able earnings. Therefore, as the volatility of pre-tax annualearnings increases (e.g., because of higher than anticipatedmortality claims), the value of the call option (and thus theamount of the tax liabilities) concomitantly increases (Gar-ven and Louberge, 1996). This reasoning suggests thatgiven a convex corporate tax function and the probabilityof future losses then, by Jensen’s inequality, stabilizingpre-tax earnings fluctuations via risk management mecha-nisms (such as reinsurance) can help to reduce the expectedtax liabilities of firms (e.g., see Smith and Stulz, 1985; Gra-ham and Rogers, 2002). Doherty (2000, pp. 203–204) fur-ther shows that there is still a tax advantage to hedgingeven in the presence of carry-forward provisions (as is thecase in the UK life insurance industry). Therefore, our firstmain hypothesis is:
H1: Other things being equal, life insurers facing a highlevel of before-planning tax convexity are likely to usemore reinsurance than life insurers facing a low levelof before-planning tax convexity.
12 Interested readers are referred to Smith and Stulz (1985, pp. 393–395)and Doherty (2000, pp. 199–204) for a detailed discussion of this.
M. Adams et al. / Journal of Banking & Finance 32 (2008) 101–115 105
3.2. Reinsurance and marginal taxes
Winton (1995) notes that life reinsurance treaties tend tobe proportional (e.g., quota share) contracts whereby thelife insurer (i.e., the ceding insurer) can transfer a fixed pro-portion of its policy liabilities to a reinsurer in return for aproportion of the premiums received on those policies (seeFootnote 3). Ceding life insurers also receive commissionsfrom reinsurance companies to compensate for the transac-tion costs incurred in acquiring new business. Under SAP,reinsurance commissions are recognized as income by theceding insurer in the period in which they are received,thereby increasing net annual earnings (Adiel, 1996, p.233).13 As discussed in Section 2, the taxable income of lifeinsurers in the UK is determined using SAP rules, so theceding insurer’s expected tax liabilities also increase. Thetransfer of policy liabilities (e.g., unearned premiums) alsostrengthens the ceding insurer’s balance sheet, thus helpingto avoid the potentially non-trivial costs of regulatoryscrutiny.
Shackelford (1996, p. 244) thus states that as a result ofreinsurance ‘‘. . . unearned premiums can be transferred toreinsurers in exchange for immediately recognized commis-sion income without triggering any offsetting expense.’’ Theaccounting effect is that reinsurance can boost life insurers’solvency margins and increase current taxable earnings. It isalso worth noting that in life insurance, new business acqui-sition costs (e.g., sales commissions14) tend to be greaterthan in property-liability insurance. As a result, reinsurancecommissions received and expected tax liabilities under lifereinsurance treaties tend to be higher compared with prop-erty-liability reinsurance treaties, particularly in the case ofsingle insurance premium products where all premiums arepaid up-front in a lump sum. This feature makes the lifeinsurance industry potentially a better setting to test thetax-related income level enhancement argument than theproperty-liability insurance industry. Therefore, managersof life insurance firms with high (before-planning) marginaltax rates could be deterred from purchasing more reinsur-ance in order to reduce their expected tax liabilities, andso our second main hypothesis is:
H2: Other things being equal, life insurers facing a highlevel of before-planning marginal tax rates are likely touse less reinsurance than life insurers facing a low levelof before-planning marginal tax rates.
3.3. Other determinants of reinsurance
Prior research (e.g., Mayers and Smith, 1990; Grahamand Rogers, 2002; Garven and Lamm-Tennant, 2003a,b)indicates that risk management decisions (like reinsurance)
13 However, under GAAP, reinsurance commission receipts should beoffset against capitalized new business acquisition costs.14 For example, sales commission of the first year’s life insurance
premium is normally 50 percent of the premium income.
can be affected by factors other than taxes, such as agencycosts. We consider six more variables that may affect thereinsurance decision of life insurers. These variables areleverage, firm size, product mix, earnings volatility, profit-ability and organizational form. By including these factors,we can minimize the likelihood that tax proxies (e.g., mar-ginal tax rates) pick up other unintended factors (e.g., prof-itability and earnings volatility).
3.3.1. Leverage
Mayers and Smith (1990) report that reinsurance as arisk management mechanism can help direct insurers tolower the expected costs of financial distress. MacMinn(1987) argues that for highly levered insurers, reinsurancecan mitigate the incentives for managers/owners to under-invest in potentially profitable but risky projects after anevent loss by indemnifying them against a reduction in thetraded value of the firm. Adams (1996) contends that thepurchase of reinsurance is particularly attractive when lifeinsurers approach the solvency constraints prescribed byinternal actuarial rules and/or external regulations. This isbecause reinsurance can on the one hand reduce life insur-ers’ liabilities (in the form of unearned premiums), and onthe other hand increase their current earnings (via thereceipt of reinsurance commission) (Adiel, 1996). As aresult, potentially costly regulatory actions can be avoided.In the empirical study below, we use the ‘free assets ratio’ asan inverse measure of leverage. From the arguments set outabove, therefore, we expect to find a negative relationbetween the free assets ratio and reinsurance.
3.3.2. Firm size
Small life insurers are likely to purchase proportion-ately more reinsurance than large life insurers for at leastthree main reasons. First, the direct costs of financial dis-tress are not usually proportional to firm size (Warner,1977). Second, small life insurers are expected to gainmore from reinsurers’ real services (e.g., underwritingadvice and loss control) than large life insurers (Mayersand Smith, 1990). Third, small life insurers tend to facerelatively higher costs of raising capital following higherthan anticipated claims than large life insurance firmsand so the contingent capital provided by reinsurance islikely to be relatively more valuable for small life insurers(Adams, 1996).
3.3.3. Product mixInsurance firms can hedge against business risks through
product diversification (Adams, 1996). Product diversifica-tion can also produce economies of scale and scope for lifeinsurance companies, enabling them to realize cost efficien-cies in their management of asset portfolios, for instance,through lower per unit investment handling charges(Huberman et al., 1983). As a result, the economic benefitsemanating from product diversification are expected toreduce life insurers’ demand for reinsurance. Addition-ally, Mayers and Smith (1990) point out that product
106 M. Adams et al. / Journal of Banking & Finance 32 (2008) 101–115
concentration could, by increasing the cash flow volatilityof insurance firms, increase the risk of bankruptcy. Rein-surance could therefore be a cost-efficient solution to insol-vency risk in life insurance firms with a narrow range ofoutputs. We therefore predict that life insurers with ahigher degree of product concentration are likely to takeout more reinsurance than life insurers with a more diver-sified product-mix.15
3.3.4. Earnings volatility
The impact of earnings volatility on the use of reinsur-ance can be twofold. First, Hoerger et al. (1990) and Frootet al. (1993) argue that insurance/reinsurance is an impor-tant post-loss financing mechanism. Therefore, if direct lifeinsurers can obtain positive and stable cash flows fromtheir underwriting and/or investment activities, they areless likely to use reinsurance. In contrast, the more volatilelife insurers’ income streams, the greater the likelihood thatthey will suffer financial distress and hence require morereinsurance. Second, earnings volatility may affect convex-ity in life insurers’ future tax schedules and thus enablehedging firms to reduce expected tax liabilities (e.g., seeGraham and Smith, 1999). Specifically, Graham and Smith(1999) show that firms with high earnings volatility tend tohave more incentives to hedge because, other things beingequal, the tax saving from hedging will be larger than forfirms with low earnings volatility. In summary, the abovereasoning suggests a positive linkage between earnings vol-atility and reinsurance.16
3.3.5. Profitability
The impact of profitability on the use of reinsurance isalso twofold. On the one hand, highly profitable lifeinsurers are expected to have more resources to counterfinancial risks than life insurers with poorer profitability(Petroni, 1992). Therefore, other things being equal, prof-itable life insurers are less likely to use reinsurance than
15 In earlier tests, we also included variables representing the proportion ofannual premium income from each line of business as additional indepen-dent variables since reinsurance demand may differ according to the mix ofbusiness income. However, their estimated coefficients were insignificant(probably because their effects were captured by the product concentrationvariable) and dropping them did not qualitatively affect the results on othervariables. Therefore, they are not included in the model reported below.16 It is also possible that different forms of managerial compensation may
have differing impacts on corporate hedging. For example, insider shareownership makes managers’ end-of-period wealth a linear function of themarket value of the firm and is therefore likely to motivate managers tohedge against earnings volatility. In contrast, stock options and/or bonusplans can make managers’ compensation a convex function of the value ofthe firm so that risk-averse managers may be induced to hedge less risk.Both Tufano (1996) and Schrand and Unal (1998) find evidence consistentwith the above notions. Our study embraces both stock and mutual lifeinsurers and share ownership plans and stock options do not apply tomutuals. So, in an earlier version of the model, we examined the influenceof managerial bonus plans (used by both mutual and stock life insurers) onthe use of reinsurance. However, the use of bonus plans proved to be aninsignificant determinant of reinsurance and so is not included in themodel reported below.
unprofitable life insurers (e.g., see Garven, 1992). Onthe other hand, there might be important linkagesbetween profitability and tax. For example, profitablefirms may be subject to a high marginal tax rate, andso the tax liabilities induced by the income level enhance-ment effect of reinsurance is likely to be higher. There-fore, if the income level enhancement argument matters,profitable insurers are expected to buy less reinsurancethan less profitable insurers.
3.3.6. Organizational form
Two main forms of organization exist in life insurancemarkets – mutual companies, which are owned by policy-holders, and stock companies, which are owned by share-holders (Adams, 1996). Harrington and Niehaus (2002)consider that because mutual insurers do not have easyaccess to market capital and generally face higher costsof raising new capital, they are less able than stock insur-ers to sustain financial shocks. Harrington and Niehaus(2002) report that mutual insurers tend to hold more cap-ital than stock insurers in the US property and liabilityinsurance industry. Consequently, mutual insurers aremore likely to use reinsurance as a form of contingent-event finance than their stock company counterparts.Indeed, since stock insurance firms are able to spreadbusiness risks over equity capital as well as policyholders’funds, they are likely to be more efficient at risk bearingcompared with mutual insurance firms (MacMinn, 1987).This situation thus obviates the need for stock insurers toreinsure ex-ante.
However, another line of argument is that mutualinsurance firms that integrate the owner-policyholderfunctions are more efficient than stock insurance firmsin controlling agency conflicts, such as the underinvest-ment problem. Adams (1996) also reports that reinsur-ance can help to indemnify shareholders against anyreduction in traded firm value resulting from a severeclaim experience and thereby help to mitigate the under-investment incentive of managers/shareholders. This rea-soning implies that stock life insurers will tend to usemore reinsurance than mutual insurers. Overall, the rela-tion between reinsurance and organizational form is anempirical question.17
17 Following Beatty et al. (2002), who argue that public and privatecompanies may have different financial reporting and tax managementconcerns, it seems plausible that publicly listed UK life insurancecompanies may have stronger incentives to use reinsurance to boostearnings than non-publicly listed life insurers. In an earlier version of thepaper, therefore, we included a dummy variable (LIST), equal to one forpublicly listed life insurers and zero otherwise, in place of organizationalform, as a determinant of reinsurance. However, the estimated coefficientof LIST was insignificant. We also interacted LIST with the marginal taxrate and tax convexity proxies, but the estimated coefficients on theseinteraction terms were also insignificant. In the interests of brevity, theseresults are not reported below.
20
M. Adams et al. / Journal of Banking & Finance 32 (2008) 101–115 107
4. Research design
4.1. Model and variables
In the spirit of Graham (1996b), we use the followingempirical model to test our two tax-related hypotheses (H1and H2) and to investigate the effects of our other indepen-dent variables on a life insurer’s new reinsurance decision.
DREINSit ¼ f ðCONV it�1;MTRit�1;DFARit;DSIZEit;DMIX it;
VOLit�1;DPROF it;OF it; YearDummiesÞ þ ui þ vit:
In the equation, REINS represents reinsurance, CONV
represents tax convexity and MTR represents the marginaltax rate. FAR, SIZE, MIX, VOL, PROF and OF denotethe free assets ratio (an inverse measure of leverage), firmsize, product mix, earnings volatility, profitability andorganizational form, respectively. Both CONV and MTR
are measured in levels because our tax-related hypothesesare about how levels of before-planning tax convexityand marginal tax rates affect new reinsurance purchases.For consistency with the dependent variable (DREINS),the first differences of all metric independent variables(i.e., DFAR, DSIZE, DMIX and DPROF) are used in theregression model (e.g., see Graham, 1996b). Year dummiesare included to control for any time-related effects (e.g.,changes in interest rates and other economic conditions)on the reinsurance decision of life insurance firms. The er-ror term, ui is a firm-specific intercept, and we assume thatui � Nð0; r2
uÞ and that vit � Nð0; r2vÞ.
4.1.1. Measuring the dependent variable
MacKie-Mason (1990) and Graham (1996a) report thatcorporate marginal tax rates18 are relevant to incremental
financial decisions and that the failure of many prior stud-ies (e.g., Titman and Wessels, 1988) to identify a positivelinkage between marginal tax rates and capital structurechoices is due to their examination of cumulative ratherthan incremental financing decisions. The notion of theincremental use of reinsurance is also important in the cur-rent study. This is because, unlike short-term property andliability insurance (which is normally written on an annualrenewable basis), life insurance/reinsurance is usually writ-ten on a multi-year basis, albeit with some scope for rein-surance companies to vary periodically reinsurancepremiums to account for unforeseen claims’ experience(Johnson, 1977; Winton, 1995).19 Therefore, the level of
18 The marginal tax rate is defined as the present value of current andexpected taxes paid on an additional unit (e.g., pound sterling or USdollar) of income earned today. In contrast, an effective tax rate iscalculated as period taxes paid divided by taxable income and hence it isessentially an average tax rate (Plesko, 2003). Finance theory suggests thatit is the marginal rather than the average tax rate, which is relevant inmaking financial decisions, such as hedging (e.g., see Graham, 1996a).19 Note that Adiel (1996) appropriately regresses the level of reinsurance
on marginal tax rate and other explanatory variables in his study ofreinsurance decisions of property and liability insurance where the annuallevel of reinsurance is essentially a kind of new and incremental amount ofreinsurance.
reinsurance in a certain year actually reflects the resultsof both prior years’ reinsurance decisions and reinsurancedecisions made in the current year. Following Graham(1996a), we thus measure the incremental use of reinsur-ance in year t as DREINSit = (the amount of reinsurancepremiums ceded in year t – the amount of reinsurance pre-miums ceded in year t � 1)/gross insurance premiums inyear t � 1 including reinsurance assumed.20 Graham(1996a) uses a similar proxy to measure incremental debtuse and he argues that this incremental measure is betterthan the first difference of simple debt ratios (e.g., totaldebt/total assets). This is because such a measure helpsminimize the undesirable influence of fluctuations inannual total assets (total insurance premiums in our case)on incremental corporate debt (reinsurance) used.21
4.1.2. Measuring tax convexity
In measuring tax convexity (CONV), prior studiesinvariably use a net operating loss (NOL) dummy thattakes the value of 1 if there are NOL carry-forwards atthe beginning of the year and 0 otherwise. However, Gra-ham and Smith (1999) show that such a measure is not ade-quate to capture tax convexity. Using a simulationapproach, Graham and Rogers (2002) measure tax convex-ity as the savings in the marginal tax rate resulting from adecrease in (projected) annual earnings volatility. However,as discussed below, a simulation approach is not used inthe present study due to a lack of data. Instead, we followBarton (2001) and measure a firm/year’s tax convexity asthe excess of the marginal tax rate over the effective tax ratein that year (i.e., CONV = marginal tax rate (MTR) – effec-tive tax rate). Since we use two different measures of themarginal tax rate (see below), this method yields two alter-native measures of tax convexity (denoted by CONV1 andCONV2). The rationale for this approach is that a convexfunction of taxable income implies that marginal tax ratesexceed average tax rates. In the present study, the effectivetax rate is calculated as the ratio of annual tax expenses toannual taxable profits. A larger positive value of the differ-ence indicates higher tax convexity and thus is expected tobe positively related to the incremental reinsurance variableif our H1 is valid (Graham, 2003).22 We recognize that Bar-ton’s (2001) measure of tax convexity is a crude proxy
This treatment results in a loss of one-year’s observations.21 To see this, assume last year’s gross premium income is £10 million and
it is decided that £1 million of the £10 million annual premiums from thismulti-year contract should be reinsured. Suppose this year’s grosspremium income is £13 million (including the £10 million from the oldcontract) and the reinsured amount is still £1 million (that was determinedlast year). Therefore, there is no incremental reinsurance in the currentyear. Graham’s (1996a) measure correctly reflects the current year’sincremental use of reinsurance as (£1 million – £1 million)/£10 mil-lion = 0% while the simple first difference of reinsurance ratio does not.22 In sensitivity tests we also use an indicator variable that takes the value
of one if the difference is positive and zero otherwise. The results aresimilar to those obtained using Barton’s (2001) continuous convexitymeasure – that is, they are all insignificant.
108 M. Adams et al. / Journal of Banking & Finance 32 (2008) 101–115
because it does not directly reflect how much tax can besaved for a given reduction in the volatility of taxable earn-ings income due to hedging via reinsurance.
4.1.3. Measuring the marginal tax rate
In measuring the marginal tax rate, a simulationmethod, pioneered by Shevlin (1990) and later refinedby Graham (1996a), derives the marginal tax rate by fore-casting the future taxable income stream and accountingfor the carry-back and carry-forward tax treatment ofNOL and any other tax credits that are prescribed inthe tax codes. The simulated rates have been demon-strated to be the most accurate proxies of marginal taxrates (Graham, 1996b; Plesko, 2003). However, the simu-lation method is problematic in the present study as itinvolves forecasting taxable income and correspondingtaxes for a considerable length of time.23 We do not usethe simulation method for two main reasons. First, inthe UK, life insurers’ annual losses can be carried forwardindefinitely and there is a lack of historical data for deter-mining the start-up period (in a rolling window frame-work) and hence parameters derived for the stochasticprocess are likely to be unreliable. Second, our data isan unbalanced panel and, in the UK, assumptions aboutthe stochastic process for earnings over future years wouldbe impossible to determine with any degree of precisionbecause stochastic assumptions underpin the actuariallydetermined emergence of annual reported earnings andare specific to each firm/year; such information is notpublicly disclosed.
In the current study, we use two proxy variables that arerecommended in Graham (1996b) and Plesko (2003)respectively. Empirical tests by Graham (1996b) and Ple-sko (2003) suggest that these proxies seem to be reasonablealternatives to simulated rates in measuring marginal taxrates. More importantly, Graham (1996b) reports thatthese simple tax proxies are equally applicable to examin-ing the tax behavior of financial firms (including insurancecompanies). Specifically, MTR1 is the one recommended inPlesko (2003) (= top statutory rate in the year concerned, ifprior year’s NOL = 0 and current year’s taxableincome > 0; = 0 otherwise). MTR2 is a trichotomous vari-able recommended in Graham (1996b) (= top statutoryrate if both taxable income > 0 and prior NOL = 0; = 0if taxable income <= 0 and prior NOL > 0; = half of thetop annual statutory rate otherwise). In addition, Scholeset al. (1990) and Graham et al. (1998) point out the possibleendogeneity problem of corporate tax status with respect tocorporate financing decisions (like reinsurance). These
23 For example, the US tax code for industrial firms allows a three-yearcarry-back and 15-year carry-forward of NOLs. Therefore, the simulationprocedure involves forecasting 18 years of taxable income and billing outtaxes over a 22-year period (three years historical, one year contempo-raneous, and 18 years forecasted). Graham and Smith (1999) use a 17-yearstart-up period and Graham (2000) uses a seven-year start-up period inestimation.
authors further emphasize the importance of using abefore-planning tax rate in examining tax incentives.Therefore, to mitigate the potential endogeneity problem,we follow Graham (1996a) and use the tax position in yeart � 1 as a measure of the before-planning tax rates andregress the incremental reinsurance use in year t on the lev-els of these tax rates.
4.1.4. Measuring the other independent variables
The other six independent variables included in theregression model are measured as follows:
• The free assets ratio (FAR) is measured as total long-term assets � (total long-term reserves + other liabili-ties) – the statutorily required rate of solvency margin,and is used as an inverse measure of leverage. The freeassets ratio is frequently used in the UK by the regula-tory authority (at present, the FSA) to determine thefinancial strength of life insurers.
• Firm size (SIZE) is measured as the natural logarithm ofannual total business income (including premiumincome written and investment proceeds, but beforereinsurance).
• As in Mayers and Smith (1990), product mix (MIX) ismeasured by a Herfindahl concentration index that iscomputed using four major classes of products sold byUK life insurers: life insurance, pensions, permanenthealth insurance and other insurance business. The Her-findahl index is computed for each company asMIX ¼
P4j¼1s2
j , where sj is the amount of annual pre-mium income written in the jth line of insurance dividedby the total value of annual premium income for all fourlines. The closer the Herfindahl index is to one, the moreconcentrated the product function of life insurancefirms.
• Following Graham and Smith (1999) and Graham andRogers (2002), earnings volatility (VOL) is measuredby the absolute value of the coefficient of variation oftaxable incomes. The coefficient of variation is estimatedon a rolling basis using the taxable income data up tothe preceding year in order to avoid the potentially con-founding effects of current-year reinsurance purchases.This treatment results in missing values of VOL forthe first two years of each firm. As some firm/years tendto have a very volatile coefficient of variation, we furthertake the natural logarithm to mitigate possibleheteroscadasticity.24
• Profitability (PROF) is a measured as a return on assets,defined as annual net earnings divided by the start-of-year book value of total assets.
• Organizational form (OF) is a dummy variable labeled 1for a stock life insurer and 0 for a mutual life insurer.
24 Using unlogged VOL as a measure of earnings risk marginallyimproves the statistical significance of most variables.
M. Adams et al. / Journal of Banking & Finance 32 (2008) 101–115 109
As in Graham (1996b), we do not use lagged values ofDFAR, DSIZE, DMIX and DPROF in our main regressionmodel because doing so means one more year’s data haveto be lost.25
4.2. Data
To test our hypotheses, we use data on UK life insur-ance companies from Standard & Poor’s Synthesys Lifedatabase (Thesys Information, 2002) for the 10-years1992–2001 – a period when life insurers were in varyingstates of financial condition. This database is derived fromthe annual statutory returns made by UK life insurancecompanies to the industry regulator and our period repre-sents the earliest and latest years for which complete datafor life insurance firms were available at the time our studywas conducted. The timeframe of our analysis is also cov-ered by the UK’s ICTA (1988) and FA (1989) and so rep-resents a reasonably stable statutory period, therebyavoiding the potentially confounding effects that major leg-islative changes could have on our results.
Our sample includes independently operating andreporting UK-based life insurance companies. In otherwords, our data refer to individual UK insurers, ratherthan insurance groups. This is because the annual statutoryreturns do not provide consolidated financial statements(such as tax figures) for insurance groups and so we cannotconduct tests on a group basis. Reinsurance companies,trust funds and subsidiary companies established to dealwith fund management or the management of pensionsare excluded from the sample because they do not directlywrite much life insurance. Further, we exclude from oursample firms that were involved in mergers or acquisitionsduring the sample period on the grounds that these wouldconfound our results from one year to the next. We alsoexclude 17 firms/years with negative reinsurance premiumsceded given that negative reinsurance premiums ceded onlyoccasionally arise from a return of premiums by the rein-surer (Mayers and Smith, 1990).26
The application of the above criteria results in theselection of 65 primary life insurers that operated in theUK and engaged in reinsurance during all or part of theperiod 1992–2001, giving an unbalanced panel of 578firm/year observations. This sample of firms representsroughly 26% of the total population of UK life insurancefirms operating over the period of analysis. It also
25 Nevertheless, we run a robustness check in Section 6 by using the lagsof f these variables and find similar results on the tax variables, whichsuggests that our results are not sensitive to this choice. Out of the sameconcern for conserving degrees of freedom, we do not take the firstdifference of VOL that has many missing values. Because VOL is neversignificant in our models, we believe that this should not materially affectour results.26 In unreported results, we also include these 17 observations of negative
reinsurance, but find similar results on our hypotheses.
represents about 40% of the total gross annual premiumswritten in 2000 and 2001. Therefore, it appears that oursample firms are on average a little larger in terms of grossannual premiums than an average life insurer in the UK.The sample covers a spread of life insurance firms ofdifferent sizes and organizational forms and includes rela-tively new entrants (like bancassurers) as well as long-established businesses. Of the 578 firm/year observations,405 cases represent stock life insurers and the remaining173 cases are mutual life insurers. Data on organizationalform are taken from the Insurance Post’s directory (PostMagazine Green Book, 2000). To ensure inter-temporalcomparability of figures the financial data are deflated bythe Retail Price Index (RPI) (Office for National Statistics,2002).
5. Results
5.1. Univariate results
Panel A of Table 1 provides the descriptive statistics forthe variables used. The life insurance firms in our samplereinsure an average of 15% of their annual gross premiumincome (though the median is only 4%). This proportion ofreinsurance by UK life insurers is lower than the typicallyreported mean of 27–29% and median of 20–22 percent inshort-term and more risky US property-liability insurancebusiness (e.g., see Adiel, 1996; Garven and Lamm-Ten-nant, 2003b). The lower average proportion of reinsurancereflects to some extent the difference in the nature of busi-ness between life insurance and property-liability insur-ance. The low proportion of reinsurance in our sample ofUK life insurers may to some extent limit the effect of rein-surance in reducing earnings risk and so may render ourtest of the tax convexity argument less powerful. On theother hand, as elaborated in Section 3, the feature of higherlife insurance commissions is likely to increase the power ofour test of the tax-related income level enhancementargument.
The means of the two measures of tax convexity areboth positive and further analysis suggests that about75% of the firm/year observations have positive tax con-vexity figures. The average marginal tax rate for our sam-ple of UK life insurers over the sample period falls in therange of 28–30%, which is slightly below the maximumstatutory tax rate of 33%. The mean value of the free assetsratio (FAR) is quite high (just under 18%), which suggeststhat the sample UK life insurers are mainly financiallystrong firms, though the variable exhibits a high degreeof variability. Additionally, about 70% of our sampleinsurers are stock companies.
Panel B of Table 1 presents a matrix of correlation coef-ficients for the variables included in the regression models.Contrary to the income volatility reduction argument, ourtax convexity measures are not positively correlated withthe incremental use of reinsurance. But consistent withthe income level enhancement argument, the correlation

Table 1Descriptive statistics and correlation coefficients
Mean Median Std. Dev. Min Max No. of Obs.
Panel A: Descriptive statisticsREINS 0.15 0.04 0.36 0.00 2.63 513DREINS 0.03 0.0003 0.31 �0.61 6.03 513CONV1 0.14 0.27 0.53 �8.98 0.33 513CONV2 0.16 0.27 0.52 �8.98 0.33 513MTR1 0.28 0.31 0.11 0.00 0.33 513MTR2 0.30 0.31 0.06 0.00 0.33 513FAR 17.56 11.68 30.66 �3.65 420.55 513SIZE 11.88 12.33 2.39 6.46 15.56 513MIX 0.63 0.54 0.18 0.34 1.00 513VOL 2.35 0.61 10.76 0.01 157.03 448Ln(VOL) �0.35 �0.49 1.06 �4.64 5.06 448PROF 0.09 0.09 0.24 �3.43 1.44 513OF 0.71 1.00 – 0.00 1.00 513
(a) (b) (c) (d) (e) (f) (g) (h) (i) (j)
Panel B: Correlation coefficient matrixDREINS (a) –CONV1 (b) �0.02 –CONV2 (c) �0.01 0.99a –MTR1 (d) �0.09b 0.19a 0.18a –MTR2 (e) �0.10b 0.09b 0.09b 0.98a –DFAR (f) �0.23a �0.02 �0.02 �0.02 �0.02 –DSIZE (g) 0.01 0.05 0.04 0.05 0.05 �0.28a –DMIX (h) �0.03 0.09b 0.09b 0.07 0.08c 0.29a 0.24a –Ln(VOL) (i) 0.21a �0.15a �0.12a �0.46a �0.47a �0.01 0.12a �0.07 –DPROF (j) 0.07 0.05 0.07 �0.15a �0.14a �0.43a 0.51a 0.11b �0.02 –OF (k) 0.04 �0.06 �0.05 �0.05 �0.05 0.01 0.01 �0.02 0.19a �0.03
Panel C: Variance-inflation factorsCONV1 1.04 MTR1 1.38 DFAR 1.22 DSIZE 1.20 DMIX 1.16Ln(VOL) 1.37 DPROF 1.21 OF 1.07
CONV2 1.03 MTR2 1.37 DFAR 1.20 DSIZE 1.20 DMIX 1.17Ln(VOL) 1.39 DPROF 1.20 OF 1.06
Note: REINSit = reinsurance premiums in year t � gross premium income of year t; DREINSit = incremental reinsurance in year t, i.e., the difference inthe annual reinsurance premiums ceded � the annual gross premiums written of year t � 1; CONV1 = tax convexity, i.e., the excess of TAX1 over theannual effective tax rate that is defined as the total tax expense � annual taxable income; CONV2 = tax convexity, i.e., the excess of TAX2 over the annualeffective tax rate; MTR1 = ‘‘pre-planning’’ marginal tax rate (measured in one-period lag), i.e., the rate used in Plesko (2003) (= top rate if prior year’sNOL = 0 and current year’s taxable income > 0; =0 otherwise). MTR2 = ‘‘pre-planning’’ marginal tax rate (measured in one-period lag), a trichotomousvariable used in Graham (1996b) (= top rate if both taxable income > 0 and prior NOL = 0; =0 if taxable income <= 0 and prior NOL > 0; = 0.5*top rateotherwise); FAR = free assets ratio, i.e., total long-term assets � (total long-term reserves + other liabilities) – statutorily required rate of solvency margin;SIZE = natural log of the total annual business income (including premium income and investment proceeds but net of reinsurance); MIX = product mix,measured by a Herfindahl concentration index; VOL = earnings volatility, i.e., the absolute value of the coefficient of variation of taxable income up to thepreceding year; PROF = profitability, i.e., the reported annual net earnings � the book value of total assets at the beginning of the period; OF = 1 forstock life insurers, 0 for mutual life insurers. The correlation coefficients involving non-metric variables (e.g., OF) are computed using the Spearman rankcorrelation procedure; the remainder are Pearson product-moment correlation coefficients.a,b,c = Statistically significant at the 1%, 5% and 10% level (two-tailed).
110 M. Adams et al. / Journal of Banking & Finance 32 (2008) 101–115
between the two proxies of before-planning marginal taxrates and incremental reinsurance are negative and statisti-cally significant. As expected, life insurers with worseningfree assets ratios and high earnings volatility use greateramounts of reinsurance. No other statistically significantassociations are found between our explanatory variablesand the incremental use of reinsurance. It is worth notingthat our two different marginal tax rate proxies recom-mended by Plesko (2003) and Graham (1996b) respectively,are highly correlated (with a correlation coefficient of 0.98).The correlation coefficients between pairs of independentvariables that concomitantly appear in the regression
model are generally modest (with the highest equal to0.51). We also compute variance-inflation factors (VIFs)to test for possible multicollinearity. However, the VIFsare all less than two (reported in Panel C), suggesting thatmulticollinearity is unlikely to be a serious concern in thisstudy (e.g., see Kennedy, 1998, p. 190).
Given that profitability (PROF) may also reflect therelation between tax and reinsurance, we perform addi-tional analysis to examine the effect of profitability on theuse of reinsurance. We divide the sample into four quartilegroups according to the value of PROF. Group 1 containsobservations with PROF below the first quartile (about
M. Adams et al. / Journal of Banking & Finance 32 (2008) 101–115 111
3.4%); group 4 comprises observations above the thirdquartile (about 14.6%). We then compare the mean incre-mental reinsurance between groups 1 and 4. The computedt-statistic is positive and significant (t = 2.27, group 1minus 4) at the 0.05 level (two-tailed). This suggests that,as expected, more profitable life insurers tend to reinsureless than less profitable life insurers.
5.2. Multivariate results
Fixed-effects panel models cannot be used in the currentstudy because of the existence of time-invariant variables
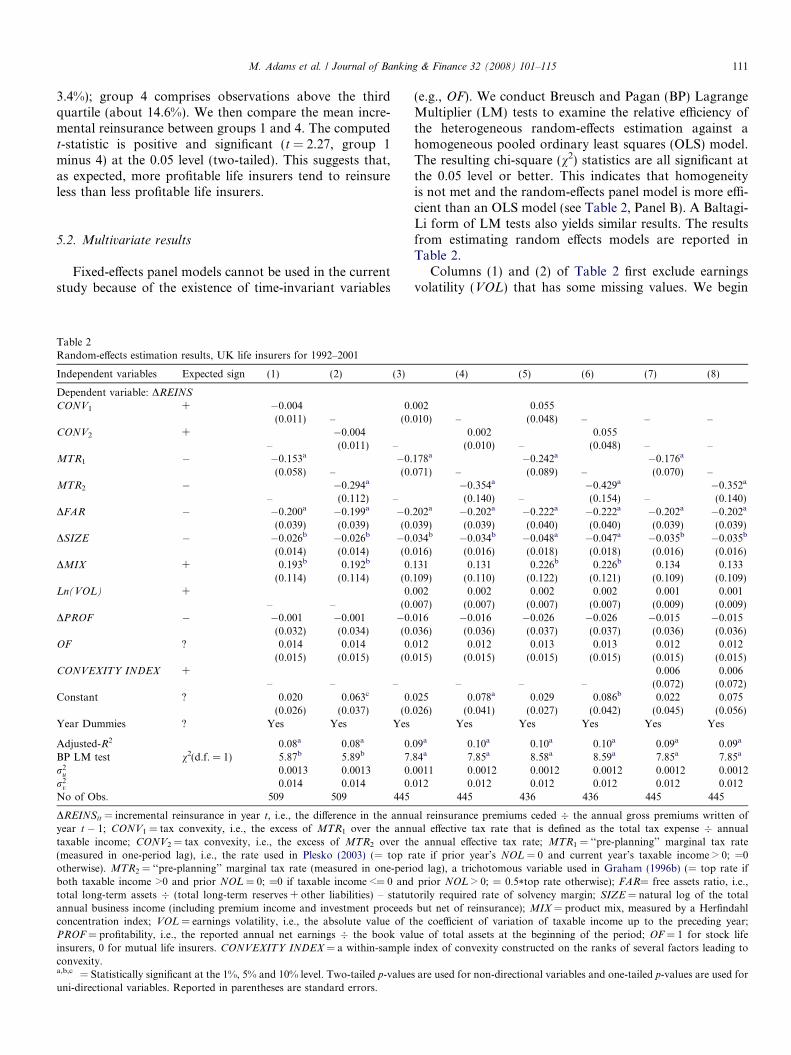
Table 2Random-effects estimation results, UK life insurers for 1992–2001
Independent variables Expected sign (1) (2) (3)
Dependent variable: DREINS
CONV1 + �0.004 0.(0.011) – (0.
CONV2 + �0.004– (0.011) –
MTR1 � �0.153a �0.(0.058) – (0.
MTR2 � �0.294a
– (0.112) –DFAR � �0.200a �0.199a �0.
(0.039) (0.039) (0.DSIZE � �0.026b �0.026b �0.
(0.014) (0.014) (0.DMIX + 0.193b 0.192b 0.
(0.114) (0.114) (0.Ln(VOL) + 0.
– – (0.DPROF � �0.001 �0.001 �0.
(0.032) (0.034) (0.OF ? 0.014 0.014 0.
(0.015) (0.015) (0.CONVEXITY INDEX +
– – –Constant ? 0.020 0.063c 0.
(0.026) (0.037) (0.Year Dummies ? Yes Yes Yes
Adjusted-R2 0.08a 0.08a 0.BP LM test v2(d.f. = 1) 5.87b 5.89b 7.r2
u 0.0013 0.0013 0.r2
v 0.014 0.014 0.No of Obs. 509 509 445
DREINSit = incremental reinsurance in year t, i.e., the difference in the annuyear t � 1; CONV1 = tax convexity, i.e., the excess of MTR1 over the anntaxable income; CONV2 = tax convexity, i.e., the excess of MTR2 over th(measured in one-period lag), i.e., the rate used in Plesko (2003) (= top rotherwise). MTR2 = ‘‘pre-planning’’ marginal tax rate (measured in one-periboth taxable income >0 and prior NOL = 0; =0 if taxable income <= 0 andtotal long-term assets � (total long-term reserves + other liabilities) – statutannual business income (including premium income and investment proceedsconcentration index; VOL = earnings volatility, i.e., the absolute value of tPROF = profitability, i.e., the reported annual net earnings � the book valinsurers, 0 for mutual life insurers. CONVEXITY INDEX = a within-sampleconvexity.a,b,c = Statistically significant at the 1%, 5% and 10% level. Two-tailed p-valuesuni-directional variables. Reported in parentheses are standard errors.
(e.g., OF). We conduct Breusch and Pagan (BP) LagrangeMultiplier (LM) tests to examine the relative efficiency ofthe heterogeneous random-effects estimation against ahomogeneous pooled ordinary least squares (OLS) model.The resulting chi-square (v2) statistics are all significant atthe 0.05 level or better. This indicates that homogeneityis not met and the random-effects panel model is more effi-cient than an OLS model (see Table 2, Panel B). A Baltagi-Li form of LM tests also yields similar results. The resultsfrom estimating random effects models are reported inTable 2.
Columns (1) and (2) of Table 2 first exclude earningsvolatility (VOL) that has some missing values. We begin
(4) (5) (6) (7) (8)
002 0.055010) – (0.048) – – –
0.002 0.055(0.010) – (0.048) – –
178a �0.242a �0.176a
071) – (0.089) – (0.070) –�0.354a �0.429a �0.352a
(0.140) – (0.154) – (0.140)202a �0.202a �0.222a �0.222a �0.202a �0.202a
039) (0.039) (0.040) (0.040) (0.039) (0.039)034b �0.034b �0.048a �0.047a �0.035b �0.035b
016) (0.016) (0.018) (0.018) (0.016) (0.016)131 0.131 0.226b 0.226b 0.134 0.133109) (0.110) (0.122) (0.121) (0.109) (0.109)002 0.002 0.002 0.002 0.001 0.001007) (0.007) (0.007) (0.007) (0.009) (0.009)016 �0.016 �0.026 �0.026 �0.015 �0.015036) (0.036) (0.037) (0.037) (0.036) (0.036)012 0.012 0.013 0.013 0.012 0.012015) (0.015) (0.015) (0.015) (0.015) (0.015)
0.006 0.006– – – (0.072) (0.072)
025 0.078a 0.029 0.086b 0.022 0.075026) (0.041) (0.027) (0.042) (0.045) (0.056)
Yes Yes Yes Yes Yes
09a 0.10a 0.10a 0.10a 0.09a 0.09a
84a 7.85a 8.58a 8.59a 7.85a 7.85a
0011 0.0012 0.0012 0.0012 0.0012 0.0012012 0.012 0.012 0.012 0.012 0.012
445 436 436 445 445
al reinsurance premiums ceded � the annual gross premiums written ofual effective tax rate that is defined as the total tax expense � annuale annual effective tax rate; MTR1 = ‘‘pre-planning’’ marginal tax rateate if prior year’s NOL = 0 and current year’s taxable income > 0; =0od lag), a trichotomous variable used in Graham (1996b) (= top rate if
prior NOL > 0; = 0.5*top rate otherwise); FAR= free assets ratio, i.e.,orily required rate of solvency margin; SIZE = natural log of the totalbut net of reinsurance); MIX = product mix, measured by a Herfindahl
he coefficient of variation of taxable income up to the preceding year;ue of total assets at the beginning of the period; OF = 1 for stock lifeindex of convexity constructed on the ranks of several factors leading to
are used for non-directional variables and one-tailed p-values are used for
112 M. Adams et al. / Journal of Banking & Finance 32 (2008) 101–115
our analysis from column (1),27 where Plesko’s (2003)proxy (i.e., MTR1) is used as a measure of a life insurer’s(before-planning) tax rates. Consistent with the incomelevel enhancement argument (H2), the estimate of the coef-ficient of MTR1 is negative and statistically significant atthe 1% level (one-tailed). This finding supports Adiel’s(1996) view that since reinsurance has an immediateenhancement effect on reported earnings in the current per-iod, insurers with a high (before-planning) marginal taxrate will choose to use less reinsurance in order to avoidhigh expected tax liabilities, while insurers with a low(before-planning) marginal tax rate will choose to use morereinsurance to boost their current earnings. To our knowl-edge, this finding has not been previously reported in theliterature. It is a result which suggests that reinsurancemay be used as an earnings-management device that couldhave implications for bonus-related management compen-sation and (in stock companies) future share prices. Inaddition, it may reflect a desire among UK life insurancecompanies to avoid the potential ‘political costs’ of regula-tory intervention in the industry, which is perceived asbeing more likely when earnings are low (see Adiel, 1996).
The estimated coefficient of tax convexity (CONV1) isnot statistically significant and so there is no support forthe income volatility reduction argument that is widelyreported in the risk management literature (e.g., Smithand Stulz, 1985; Doherty, 2000). As expected, the estimatedcoefficients of DFAR and DSIZE are negative and statisti-cally significant, and the estimated coefficient of DMIX ispositive and statistically significant. These findings are con-sistent with the view that increases in leverage and productconcentration, and decreases in firm size, are likely to leadto more reinsurance in order to control for increased finan-cial risks and mitigate the potential costs of financial dis-tress. However, no other variables are found to havesignificant impacts on the reinsurance decision.
In column (2), we measure the marginal tax rate asMTR2 – the trichotomous variable recommended in Gra-ham (1996b). Comparing the results with those of column(1), we find that the results for the tax variables are virtu-ally the same, and there are no other significant differencesbetween the results reported in columns (1) and (2).
In columns (3) and (4), we control for the effect of VOL.This reduces our sample size from 509 to 445 firms. Werepeat the analysis using the two proxies for the marginaltax rate and tax convexity respectively. As the results show,the estimated coefficients of the marginal tax rates are stillnegative and significant, while the coefficients of the tax
27 Four observations have REINS over one. One case is equal to 6.03 (seeTable 1, Panel A). This observation represents Sterling Life for the year1995 when its gross premium income almost halved (relative to that of1994) and reported an operating loss. We exclude these four observationsfrom the regression in order to help readers better evaluate our results. Asthe estimates of the coefficients of FAR are very small, for convenience, wereport the regression results using FAR/100. Such deflation does notchange the significance of the test but proportionately increases theestimate of the coefficient on the variable (Graham, 1996b).
convexity proxies remain insignificant. However, the esti-mated coefficient of Ln(VOL) is not significant in eithermodel. The results for the other independent variablesare qualitatively similar to those reported in columns (1)and (2), except that the estimated coefficient of DMIX
has become insignificant (with one-tailed p-values around0.12).
Finally, note that the adjusted R2 values in our modelsrange from 0.08 to 0.10, suggesting only limited explana-tory power (though all are significant at 0.01 level, two-tailed). However, these results are comparable to the fig-ures (0.03 to 0.12) reported in Givoly et al. (1992) andthe figures (0.05 to 0.11) derived in Graham (1996a), whoestimates the debt-tax relation in the form of changes. Gra-ham (1996a, p. 69) comments that such low R2 values are inline with results from many other cross-sectional first-dif-ference specifications.
6. Robustness checks and further tests
In this section, we conduct robustness checks to examinethe sensitivity of our results to outliers, the measurement oftax convexity and endogeneity.
6.1. Outliers
Examining the descriptive statistics of CONV1 andCONV2 reveals that there might be some outliers in thetax convexity proxies. We therefore exclude 10 observa-tions with tax convexity proxies lower than �0.4 (roughlythe 1st percentile of CONV1 and CONV2) and rerun theregressions. The results are reported in columns (5) and(6) of Table 2. Comparing the results, the estimated coeffi-cients of CONV1 and CONV2 are still insignificant. Other-wise, the results are qualitatively unaffected.
To address the influence of outliers in tax convexityproxies in another way, we also use an indicator variablethat takes the value of one if the marginal tax rate exceedsthe average tax rate and zero otherwise. We rerun the mod-els and find results similar to those using Barton’s (2001)continuous proxies of tax convexity.28
6.2. Alternative proxy for tax convexity
As mentioned earlier in Section 4, Barton’s (2001) taxconvexity measure is a crude proxy. We therefore use analternative proxy for tax convexity and examine the sensi-tivity of our results. Graham and Smith (1999, p. 2242)report that firms are most likely to face convex tax func-tions when (a) they have near-zero taxable incomes(gains/losses), (b) their incomes are volatile, (c) their tax-able incomes exhibit negative first-order serial correlation,and (d) when they have prior net operating losses (NOL).
28 To save space, these results are not reported but are available from theauthors upon request.
M. Adams et al. / Journal of Banking & Finance 32 (2008) 101–115 113
In the spirit of these findings, we therefore construct awithin-sample index of (before-planning) tax convexityfor our sample of firms.29 In this procedure, we createtwo dummy variables (NZPI and NZNI) to denote near-zero positive and negative taxable income, respectively. Ifa firm/year’s prior year’s taxable income is between zeroand £750,000, NZPI takes the value 1 and 0 otherwise. Ifa firm/year’s prior year’s taxable income is between£750,000 and zero, NZNI takes the value 1 and 0 other-wise. Following Graham and Smith (1999), £750,000 ischosen because it is the approximate mid-point value ofthe progressive taxable income range for our sample ofUK life insurers. The before-planning volatility of taxableincome is measured by VOL. We also calculate the first-order serial correlation of taxable incomes (CORR) up tothe preceding year. We then rank our sample of life insur-ance firms according to their value of NZPI (or NZNI, orVOL, or NOL) on a year-by-year basis, respectively (with 1assigned to the smallest value, as these variables have apositive effect on tax convexity). Additionally, our samplefirms are ranked according to CORR on a year-by-yearbasis (with 1 assigned to the largest value, since CORRhas a negative effect on tax convexity). Fractional individ-ual ranks are then obtained by dividing individual ranks bythe sample size in the year concerned. Following this pro-cess, we compute an equally weighted within-sample con-vexity index for each firm/year by taking the average ofthe ranks on NZPI, NZNI, VOL and NOL.30
Columns (7) and (8) report the regression results ofusing this convexity index in replace of Barton’s (2001)convexity measures, for MTR1 and MTR2 respectively.The results show that the convexity index is not statisticallysignificant, DMIX is marginally significant with p-valuesaround 0.11 (one-tailed) and all other results are qualita-tively unaffected.
6.3. Endogeneity
We have used the one-period lag of marginal tax rates,convexity and earnings volatility measures in our regres-sion in order to mitigate the potential endogeneity of taxwith respect to reinsurance. However, the corporate riskmanagement literature (e.g., Graham and Rogers, 2002)suggests that there can be a two-way causation betweenhedging (reinsurance) and leverage as reinsurance can helpto expand an insurer’s debt capacity. A similar argumentmight apply to profitability. To examine the robustnessof our tax results, we use the one period lag of the changesin all the time-variant explanatory variables (except for
29 We cannot use the regression coefficients provided in Graham andSmith (1999, p. 2256) to estimate convexity because their results are basedon US tax codes pertaining to general industrial firms. In addition,sufficient and necessary time series data (e.g., with regard to investmenttax credits) are not currently available for UK life insurers.30 Gompers et al. (2003) also use this method to construct a corporate
governance index.
VOL) and repeat the analysis. In unreported results, thecoefficients on both MTR1 and MTR2 are negative(�0.172 and �0.342, respectively) and statistically signifi-cant at the 0.05 level (with one-tailed p-value being 0.015and 0.017, respectively). The coefficients of CONV1 andCONV2 remain statistically insignificant. Therefore, ourconclusions on the tax arguments do not change.
7. Conclusions
Using data from a sample of UK life insurance compa-nies, this study tests two tax-related arguments – theincome volatility reduction and the income level enhance-ment arguments – in relation to reinsurance. The formerargues that firms facing convex tax schedules have anincentive to use reinsurance in order to reduce earnings vol-atility and thereby expected tax liabilities. The latter arguesthat reinsurance increases current reported earnings via thereceipt of reinsurance commissions and so life insurancefirms with high (before-planning) marginal tax rates areexpected to use less reinsurance than others if tax matters(Adiel, 1996). The primary merit of using reinsurance, animportant risk management technique for insurers (andindustrial companies owning captive insurance companies),is that unlike derivatives, reinsurance cannot be used forspeculation. We regress incremental reinsurance on twoproxies of before-planning marginal tax rates and tax con-vexities, together with six other independent variables. Wefind that UK life insurers with low (before-planning) mar-ginal tax rates tend to use more reinsurance than insurerswith high (before-planning) marginal tax rates; in contrast,tax convexity does not seem to induce reinsurance, so theincome volatility reduction argument is not supported byour data.
The empirical evidence on the income level enhancementargument advanced by Adiel (1996) is not previouslyreported in the literature. Our results suggest that for cor-porate hedging via reinsurance, tax matters in the sensethat UK life insurers with a high marginal tax rate seemto choose to reinsure less in order to lower expected tax lia-bilities. Graham and Rogers (2002) conjecture that whilehedging can reduce the volatility of taxable income, othermethods (e.g., accounting policies) may also suffice forthe same purpose and so tax convexity may not necessarilyinduce more corporate hedging activities. This is particu-larly the case in the life insurance industry where manag-ers/actuaries have considerable discretion to smoothtaxable income (e.g., through reserving) over a long con-tract term. This also suggests an interesting area for futureresearch – i.e., the interaction between accounting-basedearnings management mechanisms and corporate hedgingpolicies.
We note that our results might be tempered by the datalimitations inherent in the current study and therefore theresults need to be interpreted with some caution. For exam-ple, the proxies that we use to represent tax convexity maybe subject to measurement errors. As a result, further
114 M. Adams et al. / Journal of Banking & Finance 32 (2008) 101–115
research could explore ways of improving the precision ofmarginal tax rate measures, utilizing where possible simula-tion techniques on large cross-sectional/time series datasets. Additionally, the life insurance industry as a researchsetting may increase our ability to test the tax-relatedincome level enhancement argument, given the higher levelof commissions (compared with the property and liabilityinsurance industry). However, this setting potentially limitsour ability to test the tax-related income volatility reduc-tion argument, given the generally lower level of reinsur-ance in life insurance, compared with property-liabilityinsurance. Future studies may thus seek to test furtherthe reinsurance-tax relation in the property and liabilityinsurance industry.
Acknowledgement
The authors are listed alphabetically. We thank twoanonymous referees and Christine Bauman, Mike Buckle,Koon Hung Chan, John Graham, Andrew Gustar, DavidHillier, Mahmud Hossain, Clive Lennox, Terry Reid, TerryShevlin, Damian Ward, Alan Watkins and Steve Youngfor helpful comments. We are also grateful to the Centrefor Risk and Insurance Studies, University of Nottingham,UK for access to their insurance companies’ database.Additionally, the paper benefited from the comments ofdelegates at the 2003 American Accounting Association(AAA) Conference, Hawaii, USA, the 2004 InternationalInsurance Society (IIS) Meeting, London, and participantsof a seminar hosted by the School of Business and Manage-ment, University of Wales, Aberystwyth, UK. Finally, theusual disclaimer applies.
References
Adams, M.B., 1996. The reinsurance decision in life insurance firms: Anempirical test of the risk-bearing hypothesis. Accounting and Finance36, 15–30.
Adams, M.B., Scott, C.N.W., 1994. Realistic reporting of life insurancecompany policy liabilities and profits: Developments in Anglo-Amer-ican countries. Journal of the Institute of Actuaries 121, 441–458.
Adams, M.B., Hillier, D.J., 2000. The effect of captive insurer formationon stock returns: An empirical test from the UK. Journal of Bankingand Finance 24, 1787–1807.
Adiel, R., 1996. Reinsurance and the management of regulatory ratios andtaxes in the property–casualty insurance industry. Journal of Account-ing and Economics 22, 207–240.
Association of British Insurers, 2001. Insurance trends: Quarterly statisticsand research review. ABI: London.
Barton, J., 2001. Does the use of financial derivatives affect earningsmanagement decisions? Accounting Review 76, 1–26.
Beatty, A., Chamberlain, S.L., Maglio, J., 1995. Managing financialreports of commercial banks: The influence of taxes, regulatory capitaland earnings. Journal of Accounting Research 33, 231–261.
Beatty, A., Ke, B., Petroni, K.R., 2002. Earnings management to avoidearnings declines across publicly and privately held banks. AccountingReview 77, 547–570.
Berger, L.A., Cummins, J.D., Tennyson, S., 1992. Reinsurance and theliability insurance crisis. Journal of Risk and Uncertainty 5, 253–272.
Carter, R.L., 1995. Reinsurance. Mercantile and General/ReactionsPublishing, London.
Chen, P., Daley, L., 1996. Regulatory capital and earnings managementeffects on loan loss accruals in the Canadian banking industry.Contemporary Accounting Research 13, 91–128.
Cummins, J.D., Grace, E., 1994. Tax management and investmentstrategies of property-liability insurers. Journal of Banking andFinance 18, 43–72.
Derrig, R.A., Ostaszewski, K.M., 1997. Managing the tax liability of aproperty-liability insurance company. Journal of Risk and Insurance64, 695–711.
Dionne, G., Garand, M., 2003. Risk management determinants affectingfirms’ values in the gold mining industry: new empirical evidence.Economics Letters 79, 43–52.
Doherty, N.A., 2000. Integrated Risk Management. McGraw Hill, NY.Finance Act (UK) 1989. London: HMSO.Froot, K.A., Scharfstein, D.S., Stein, J.C., 1993. Risk management:
Coordinating corporate investment and financing policies. Journal ofFinance 48, 1629–1658.
Garven, J.R., 1992. Limited liability and asymmetric taxes for property-liability insurance companies. Journal of Risk and Insurance 59, 34–56.
Garven, J.R., Louberge, H., 1996. Reinsurance, taxes, and efficiency: Acontingent claims model of insurance market equilibrium. Journal ofFinancial Intermediation 5, 74–93.
Garven, J.R., Lamm-Tennant, J., 2003a. Economic and financial perspec-tives on the demand for reinsurance. In: Golden, N. (Ed.), RationalReinsurance Buying. Risk Publications, London, pp. 163–185 (Chap-ter 10).
Garven, J.R., Lamm-Tennant, J., 2003b. The demand for reinsurance:Theory and empirical tests. Insurance and Risk Management 71, 217–238.
Gaver, J.J., Paterson, J.S., 1999. Managing insurance company financialstatements to meet regulatory and tax reporting goals. ContemporaryAccounting Research 16, 207–241.
Gaver, J.J., Pottier, S.W., 2005. The role of holding company financialinformation in the insurer-rating process: Evidence from the property-liability industry. Journal of Risk and Insurance 72, 77–103.
Givoly, D., Hayn, C., Ofer, A.R., Sarig, O., 1992. Taxes and capitalstructure: Evidence from firms’ response to the Tax Reform Act of1986. Review of Financial Studies 5, 331–355.
Gompers, P., Ishii, J., Metrick, A., 2003. Corporate governance andequity prices. Quarterly Journal of Economics 2, 107–155.
Grace, E.V., 1990. Property-liability reserve errors: A theoretical andempirical analysis. Journal of Risk and Insurance 57, 28–45.
Graham, J.R., 1996a. Debt and the marginal tax rate. Journal of FinancialEconomics 41, 41–75.
Graham, J.R., 1996b. Proxies for the corporate marginal tax rate. Journalof Financial Economics 42, 187–221.
Graham, J.R., 2000. How big are the tax benefits of debt? Journal ofFinance 55, 1901–1941.
Graham, J.R., 2003. Taxes and corporate finance: a review. Review ofFinancial Studies 16, 1075–1129.
Graham, J.R., Lemmon, M.L., Schallheim, J.S., 1998. Debt, leases, taxes,and the endogeneity of corporate tax status. Journal of Finance 53,131–162.
Graham, J.R., Smith, C.W., 1999. Tax incentives to hedge. Journal ofFinance 54, 2241–2262.
Graham, J.R., Rogers, D.A., 2002. Do firms hedge in response to taxincentives? Journal of Finance 57, 815–830.
Green, R.C., Talmor, E., 1985. The structure and incentive effects ofcorporate tax liabilities. Journal of Finance 40, 1095–1114.
Harrington, S.E., Niehaus, G., 2002. Capital structure decisions in theinsurance industry: Stocks versus mutuals. Journal of FinancialServices Research 21, 145–163.
Hoerger, T.J., Sloan, F.A., Hassan, M., 1990. Loss volatility, bankruptcy,and the demand for reinsurance. Journal of Risk and Uncertainty 53,221–245.
Huberman, G., Mayers, D., Smith, C.W., 1983. Optimal insurance policyindemnity schedules. Bell Journal of Economics 14, 425–426.

M. Adams et al. / Journal of Banking & Finance 32 (2008) 101–115 115
Income and Corporation Taxes Act (UK). 1988. London: HMSO.Insurance Companies Act (UK). 1982. London: HMSO.Insurance Companies Regulations (UK). 1994. London: HMSO.Johnson, R.E., 1977. Reinsurance: Theory, the new applications, and the
future. Journal of Risk and Insurance 44, 55–66.Ke, B., Petroni, K.R., Shackelford, D.A., 2000. The impact of state taxes
on self-insurance. Journal of Accounting and Economics 30, 99–122.Kennedy, P., 1998. A Guide to Econometrics. Blackwell, Oxford.MacKie-Mason, J.K., 1990. Do taxes affect corporate financing decisions?
Journal of Finance 45, 1471–1493.Macleod, J.S., Levitt, A., 1999. Taxation of Insurance Business. Butter-
worths, London.MacMinn, R.D., 1987. Insurance and corporate risk management.
Journal of Risk and Insurance 54, 658–677.Mayers, D., Smith, C.W., 1990. On the corporate demand for insurance:
Evidence from the reinsurance market. Journal of Business 63, 19–40.Mehta, S., 1993. Taxation in the assessment of profitability of life
assurance products and of life office appraisal values. Transactions ofthe Faculty of Actuaries 43, 484–553.
Office for National Statistics (UK) 2002. Economic Trends 1999. London:Office for National Statistics.
Petroni, K.R., 1992. Optimistic reporting in the property-liability insur-ance industry. Journal of Accounting and Economics 15, 485–508.
Petroni, K.R., Shackelford, D.A., 1995. Taxation, regulation, and theorganizational structure of property–casualty insurers. Journal ofAccounting and Economics 20, 229–253.
Petroni, K.R., Shackelford, D.A., 1999. Managing annual accountingreports to avoid state taxes: An analysis of property–casualty insurers.Accounting Review 74, 371–393.
Petroni, K.R., Ryan, S.G., Whalen, J.M., 2000. Discretionary and non-discretionary revisions of loss reserves by property–casualty insurers:Differential implications for future profitability, risk and market value.Review of Accounting Studies 5, 95–125.
Plesko, G.A., 2003. An evaluation of alternative measures of corporate taxrates. Journal of Accounting and Economics 25, 201–226.
Post Magazine Green Book. 2000. The Insurance Directory. London:Timothy Benn.
Pottier, S.W., Sommer, D.W., 1997. Agency theory and life insurerownership structure. Journal of Risk and Insurance 64, 529–543.
Sanders, A.J., 2000. Securitization and other financial options available tolife companies. British Actuarial Journal 6, 737–800.
Scholes, M.S., Wilson, G.P., Wolfson, M.A., 1990. Tax planning,regulatory capital planning, and financial reporting strategy forcommercial banks. Review of Financial Studies 3, 625–650.
Schrand, C., Unal, H., 1998. Hedging and coordinated risk manage-ment: Evidence from thrift conversions. Journal of Finance 53,979–1013.
Shackelford, D.A., 1996. Earnings, regulatory capital, and taxmanagement: Comments. Journal of Accounting and Economics 22,241–247.
Shevlin, T., 1990. Estimating corporate marginal tax rates with asymmet-ric tax treatment of gains and losses. Journal of the American TaxationAssociation 12, 51–67.
Skipper, H.D., 1998. International Risk and Insurance: An Environmen-tal-Managerial Approach. Irwin/McGraw–Hill, Boston.
Smith, C.W., Stulz, R.M., 1985. Optimal hedging policies. Journal ofFinancial and Quantitative Analysis 19, 127–140.
Sole, T.C., 1995. The puzzle of life office tax. British Actuarial Journal 1,79–105.
Titman, S., Wessels, R., 1988. The determinants of capital structurechoice. Journal of Finance 43, 1–19.
Thesys Information Ltd. 2002. 2002 Synthesys Life. London: Thesys.Tufano, P., 1996. Who manages risk? An empirical examination of risk
management practices in the gold mining industry. Journal of Finance51, 1097–1137.
Warner, J.B., 1977. Bankruptcy costs: Some evidence. Journal of Finance32, 337–347.
Winton, A., 1995. Costly state verification and multiple investors: The roleof seniority. Review of Financial Studies 8, 91–123.