reinforced plastics handbook || engineering analysis
TRANSCRIPT
Engineering Analysis
Overview
The following information applies the elements of design theory applicable to reinforced plastics (RPs). Fibrous RPs differs from most other engineering materials because they combine two essentially different materials, fibers and plastic (resin), into a single material. In this, they are somewhat analogous to reinforced concrete that combines concrete and steel rods, but in RPs, the fibers are generally much more evenly distributed throughout the mass and the ratio of fibers to resin is much higher than the ratio of steel to concrete.
In their design, it is necessary to take into account the combined action of fiber and resin. Sometimes the combination can be considered to be homogeneous and, therefore, to be similar to engineering materials like metal but in other cases, homogeneity cannot be assumed and it is neces- sary to take into account the fact that two widely dissimilar materials have been combined into a single unit.
In designing these RPs, certain important assumptions are made. The first and most fundamental is that the two materials act together and that the stretching, compression, and twisting of fibers and of resin under load is the same, that is, the strains in fiber and resin are equal. This assumption implies that a good bond exists between fiber and resin to prevent slippage between them and to prevent wrinkling of the fiber.
The second major assumption is that the material is elastic, that is, strains are directly proportional to the stresses applied, and when a load is removed, the deformation disappears.
More or less implicit in the theory of materials of this type is the assumption that all of the fibers are straight and unstressed or that the initial stresses in the individual fibers are essentially equal. In practice it
766 Reinforced Plastics Handbook
is very unlikely that this is true. It is to be expected, therefore, that as the load is increased some fibers reach their breaking points first. As they fail their loads are transferred to other yet unbroken fibers, with the consequence that failure is caused by the successive breaking of fibers rather than by the simultaneous breaking of all of them. The effect is to reduce the overall strength and to reduce the allowable working stresses accordingly, but the design theory is otherwise largely unaffected as long as essentially elastic behavior occurs. The development of higher working stresses is, therefore, largely a question of devising fabrication techniques to make the fibers work together to obtain maximum strength.
Design theory shows that the values of a number of elastic constants must be known in addition to the strength properties of the fibers, resin, and their combination. Reasonable assumptions are made in carrying out designs. In the examples used, more or less arbitrary values of elastic constants and strength values have been chosen to illustrate the theory. Any other values could be used.
As more experience is gained in the design of these materials, and as more complete experimental data are forthcoming, the design procedures will no doubt be modified. This review can be related to the effects of environment.
Stress-Strain Analyses
Any material when stressed stretches or is deformed. If the fiber and resin in RPs are firmly bonded together, the deformation is the same in both. For efficient structural behavior, high strength fibers are employed, but these must be more unyielding than the resin, therefore for a given deformation or strain, a higher stress is developed in the fiber than in the resin. If the stress to strain relationships of fiber and resin are known from their stress-strain diagrams, the stresses developed in each for a given strain can be computed, and their combined action determined.
Basic Design Theories
In designing RPs, as reviewed certain important assumptions are made so that two materials act together and the stretching, compression, twisting of fibers and of plastics under load is the same that is, the strains in fiber and plastic are equal. Another assumption is that the RP is elastic, that is, strains are directly proportional to the stress applied, and when a load is removed, the deformation disappears. In engi- neering terms, the material obeys Hooke's Law (Hooke's law states, it
8 �9 Engineering Analysis 7 6 7
is the ratio of stress to strain). This assumption is a close approximation to the actual behavior in direct stress below the proportional limit, particularly in tension, where the fibers are stiff and elastic in the Hookean sense and carry essentially all of the stress. The assumption is probably less valid in shear where the resin carries a substantial portion of the stress. The resin may undergo plastic flow leading to creep or to relaxation of stress, especially when stresses are high (Chapter 7).
In this analysis, it is assumed that all the glass fibers are straight; however, it is unlikely that this is true, particularly with fabrics. In practice, the load is increased with fibers not necessarily failing at the same time. Values of a number of elastic constants must be known in addition to strength properties of the resins, fibers, and combinations. In this analysis, arbitrary values are used that are low for elastic constants and strength values. Any values can be used; here the theory is illustrated.
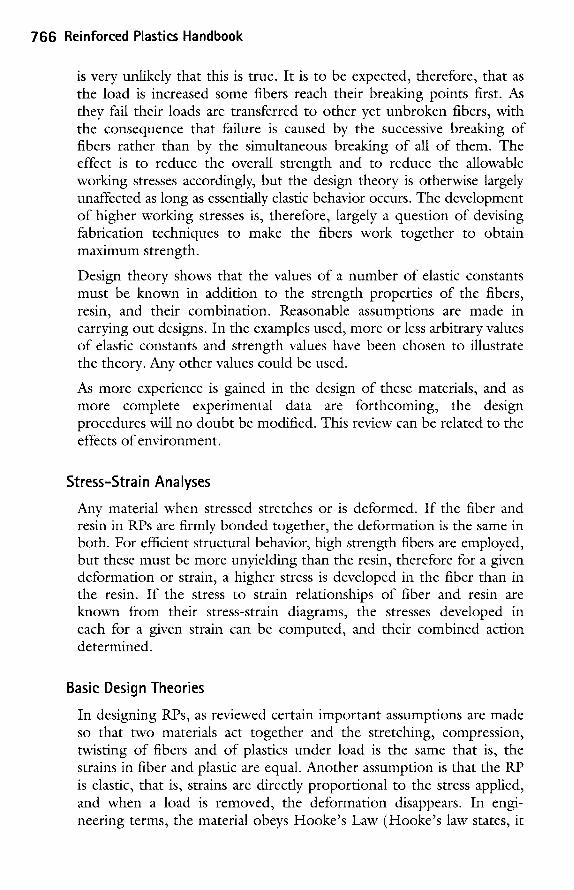
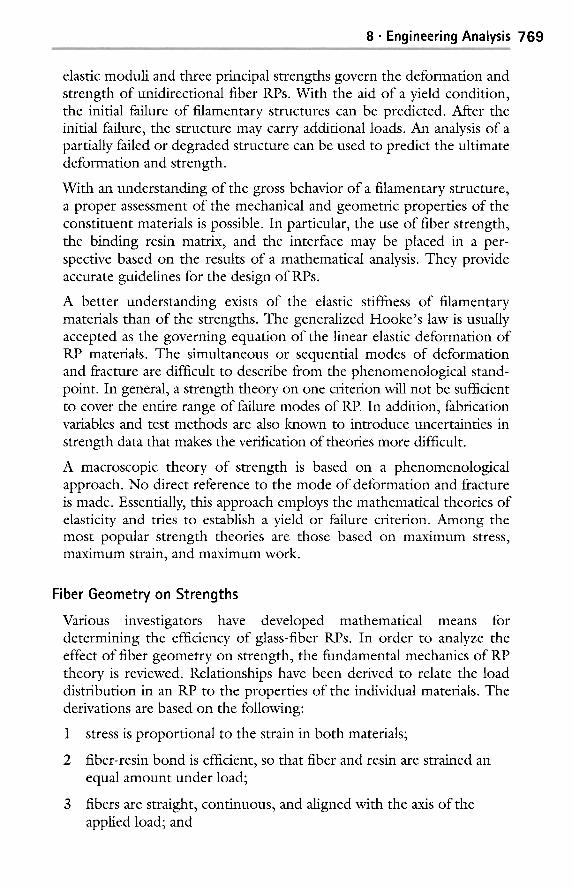
Any material, when stressed, stretches or is otherwise deformed. If the fiber and plastic are firmly bonded together, the deformation is the same. Since the fiber is more unyielding, a higher stress is developed in the glass than the plastic. If the stress-strain relationships of fiber and plastic are known, the stresses developed in each for a given strain can be computed and their combined action determined. Figure 8.1 stress- strain (S-S) diagrams provide the basis for this analysis; it provides related data such as strengths and modulus.
240 60
220
200
180
a. 160 0 o 0 q,-
140 . _
(/} a,1 ~- 120 GO
100
80
60
5 5 " r I / I J /
T] t
/ /
/ /
/ /
B - H o , d resln
T o n g e n ! to C
,~, ,o ~l..y i ' f "
- - , ! - " ' . . . . . .
4o / /
0 0.5 1.0 1.5 2.0 2.5 3.0 0 0.5 1.0 1.5
% strain % strain
Figure 8.1 Analysis of RPs stress-strain curves (courtesy of Plastics FALLO)
50-
~ 4 0
35
30 : / 25 [
.o ~I, I
,;i-.!.o.,!. ,+'1
C �9 I n l e r m e d i a l e
l 'n '~ 2.0
768 Reinforced Plastics Handbook
These stress-strain diagrams curve A, typical of glass, shows that stress and strain are very nearly directly proportional to each other to the breaking point. Stiffness, or modulus of elasticity, as measured by the ratio of stress to strain, is high. Curve B represents a hard resin. Stress is directly proportional to strain when both are low, but stress gradually levels off as strain increases. Stiffness, or modulus of elasticity, is much lower than that of glass. The tangent measures it to the curve, usually at the origin. Curve C represents a softer resin intermediate between the hard resin and the very soft plastics. Stress and strain are again directly proportional at low levels, but not when the strains become large. Modulus of elasticity, as measured by the tangent to the curve, is lower than for the hard resin.
These stress-strain diagrams may be applied, for example, in the investigation of a rod in which half the total volume is glass fiber and half is resin. If the glass fibers are laid parallel to the axis of the rod, at any cross section, half of the total cross-sectional area is glass and half is resin. If the rod is stretched 0.5%, the glass is stressed at an intensity of 345 MPa (50,000 psi) and the resin, if resin B, at 52 MPa (7500 psi), or if resin C, at 17 MPa (2500 psi). If, for example, the rod has a total cross section of one-half square inch, the glass is one-quarter square inch, and the total stress in the glass is 1/4 times 50,000 or 5,675 kg (12,500 lb). Similarly, the stress in the resin, if resin B, is 850 kg (1875 lb), and in resin C is 280 kg (625 lb). The load required to stretch the rod made with resin B is therefore the sum of the stresses in glass and resin, or 6,526 kg (14,375 lb). Similarly, for a rod utilizing resin C, the load is 5,960 kg (13,125 lb). The average stress on the one-half square inch cross section is therefore 198 MPa (28,750 psi) or 180 MPa (26,250 psi), respectively.
An analogous line of reasoning shows that at a strain of 1.25% the stress intensity in the glass is 860 MPa (125,000 psi), and in resins B and C it is 87 and 31 MPa (12,600 and 4,500 psi), respectively. The corres- ponding loads on rods made with resins B and C are 237 and 223 MPa (34,400 and 32,375 lb), respectively.
Fiber Strength Theories
The deformation and strength of filamentary structures subjected to combined loading can be theoretically predicted using experimentally determined intrinsic stiffness and strength of the individual constituent layers. In order to have an integrated material and structure design, the gross properties as functions of the micromechanical parameters represent an important issue on the continuing and expanding use of RPs. It has been established, in both theory and experiment, that four principal
8 �9 Engineering Analysis 769
elastic moduli and three principal strengths govern the deformation and strength of unidirectional fiber RPs. With the aid of a yield condition, the initial failure of filamentary structures can be predicted. After the initial failure, the structure may carry additional loads. An analysis of a partially failed or degraded structure can be used to predict the ultimate deformation and strength.
With an understanding of the gross behavior of a filamentary structure, a proper assessment of the mechanical and geometric properties of the constituent materials is possible. In particular, the use of fiber strength, the binding resin matrix, and the interface may be placed in a per- spective based on the results of a mathematical analysis. They provide accurate guidelines for the design of RPs.
A better understanding exists of the elastic stiffness of filamentary materials than of the strengths. The generalized Hooke's law is usually accepted as the governing equation of the linear elastic deformation of RP materials. The simultaneous or sequential modes of deformation and fracture are difficult to describe from the phenomenological stand- point. In general, a strength theory on one criterion will not be sufficient to cover the entire range of failure modes of RP. In addition, fabrication variables and test methods are also known to introduce uncertainties in strength data that makes the verification of theories more difficult.
A macroscopic theory of strength is based on a phenomenological approach. No direct reference to the mode of deformation and fracture is made. Essentially, this approach employs the mathematical theories of elasticity and tries to establish a yield or failure criterion. Among the most popular strength theories are those based on maximum stress, maximum strain, and maximum work.
Fiber Geometry on Strengths
Various investigators have developed mathematical means for determining the efficiency of glass-fiber RPs. In order to analyze the effect of fiber geometry on strength, the fundamental mechanics of RP theory is reviewed. Relationships have been derived to relate the load distribution in an RP to the properties of the individual materials. The derivations are based on the following:
1 stress is proportional to the strain in both materials;
fiber-resin bond is efficient, so that fiber and resin are strained an equal amount under load;
fibers are straight, continuous, and aligned with the axis of the applied load; and
770 Reinforced Plastics Handbook
material components have isotropic and homogeneous directional properties (Chapter 7).
Stress-Strain" Metal and Plastic
An explanation is reviewed regarding a particular distinction between the mechanical behaviors of metals and unreinforced reinforced plastics (URPs). The typical stress/strain curve for metal exhibits a linear elastic region followed by yield at the yield stress, plastic flow, and ultimately failure at the failure stress [reinforced thermosets (RTSs) have similar behavior]. Yield and failure occur at corresponding strains. Thus, yield and failure can be called the critical strains. However, it is easier in many products to restrict factor to a stress analysis alone.
By comparison, it may appear unjustified to state that plastic failure criteria are usually defined in terms of critical strain (rather than stress), and, by comparison with metal, going from strain to stress may appear to be a limited analysis. This apparent error depends on recognition of the fact that stresses and strains are not as intimately related for URPs as they are for metals. This action is demonstrated by reviewing stress/ strain curves for typical URPs material.
This highlights that stress/strain curves for these types of plastics are not unique, but depend on the loading conditions such as time, frequency, and /or rate. Stress/strain curves obtained at different loading rates for metals would be essentially similar. However, the behavior of URPs can be very different at low- and high rates of testing; there is no unique relationship between stress and strain since this also depends on the loading rate. It is evident from examining curves that characterization of failure through a unique failure strain cannot be valid, in general. However, it can be a good approximation in certain analyses, such as at high rates or under creep conditions.
For RPs, the emphases and difficulty in the design analysis depends on the type of RP. For a reinforced thermoplastic (RTP) with short fibers, the viscoelastic behavior of the TP matrix is important. In addition, there may be a significant degree of anisotropy and/or homogeneity due to processing which could further complicate the analysis if the designer does not understand the influence of processing. (Recognize that with RPs, a material is being produced; metals and other materials do not require the designer to manufacture the material.)
For RTSs with short fibers, such as bulk molding compounds (BMCs), there may be only a low level of viscoelasticity, anisotropy, and inhomogeneity (Chapter 4). However, these RPs with the TS resin
8 �9 Engineering Analysis 771
matrices and long fibers can have a high degree of anisotropy that is taken into account in the design analysis. When TPs are reinforced with long fibers, there may be significant anisotropy and viscoelasticity resulting in a possible complex design analysis. Regardless, in all cases, RP failure characteristics may be specified in terms of a critical strain. This requires the design analysis to be performed on the actual or simulated processing condition for stress and strain. Having processing knowledge and experience in related testing is very useful in these types of analyses.
Long-fiber RPs can often be tailored to the product requirements; materials design and product design analyses interact strongly. If the product design analysis is statically determined (stresses independent of materials properties) then this analysis is carried out first. The next step is designing the RP to carry the stresses. However, if the analysis is not statically determinate, then the component stresses depend on material isotropy, and material and product design have to be carried out and optimized simultaneously. This is also the case if shape is regarded as one of the variable design parameters. Thus, URPs and RPs design analysis follows the same three factors as that for metals, but there are some differences. In particular, factor is usually more substantial for the materials partly because a full-scale stress/strain/deformation analysis is required and partly because of the need to take account of viscoelasticity, nonhomogeneity, and/or anisotropy directional properties. For long-fiber RPs, the component design analysis may need to contain the associated material design analysis.
Metal Design
The mechanical behavior of metals in service can often be assumed to be that of a linear, isotropic, and elastic solid. Thus, design analysis can be based on classical "strength of materials" theory extensively reviewed in textbooks and literature. Practically, results may be used in the form of standard formulae, or design charts for a selected class of applications. Such uses are most appropriate to components of simple geometric shapes for which standard solutions exist, or for more shapes that are complex where they can possibly be used for initial approximate design calculations.
For the more complex, and shapes that do not exist, the solution of the applicable elasticity equations may require some form of numerical pro- cedure, such as finite element analysis (FEA) or finite difference analysis (FDA). If design analysis involves frequent consideration of similar problems, then the burden on the designer can be reduced by generating a set of solutions presented as a set of design charts. An alternative is to
772 Reinforced Plastics Handbook
provide a method in the form of a computer program for which the design analyst requires minimal familiarity with the design method. However, in critical situations, there may be no alternative to a detailed FEA with evaluation of the manufactured product to ensure meeting performance requirements.
Under appropriate conditions, metal design involves plasticity, creep, and geometric nonlinearity. These topics are treated in standard texts and have been put into computer software. However, such complexities are necessarily modeled in a simple technical format.
Spheres Circumferential load in the wall of all the spheres under internal pressure is equal to the pressure times the internal cross-sectional area, and the hoop stress, using the previous engineering assumption, is found to be:
fh = pd /a t
where 3~ = circumferential load, p = pressure, d = diameter, and t =
thickness.
It will readily be seen that no matter which section is chosen, provided the plane of the section passes through the center of the sphere, the condition will be the same, and it can be said that the hoop stress will be the same in all directions based on outside radius (R) and inside radius (r).
When it is assumed that:
( R 2 - r 2) = 2 7 ~ r t
it is determined that for wall thicknesses up to approximately 3 inches, the error is negligible. It can also be determined that the percent of error decreases as the inside radius/thickness ratio r/t increases. Table 8.1 provides size vs. weight of RP spheres.
For a sphere with the stresses uniform in all directions, it follows that the fibers require equal orientation in all directions. The problem of orientation resolves itself purely into one of practical application of the fibers. In the cylinder, the fibers are specifically oriented to meet any condition of stressing. The simplest method of doing this is to employ a single helical pattern.
Theory shows that this is highly sensitive to variations in the longitudinal hoop-stress ratio and also the accuracy of the angle wound.
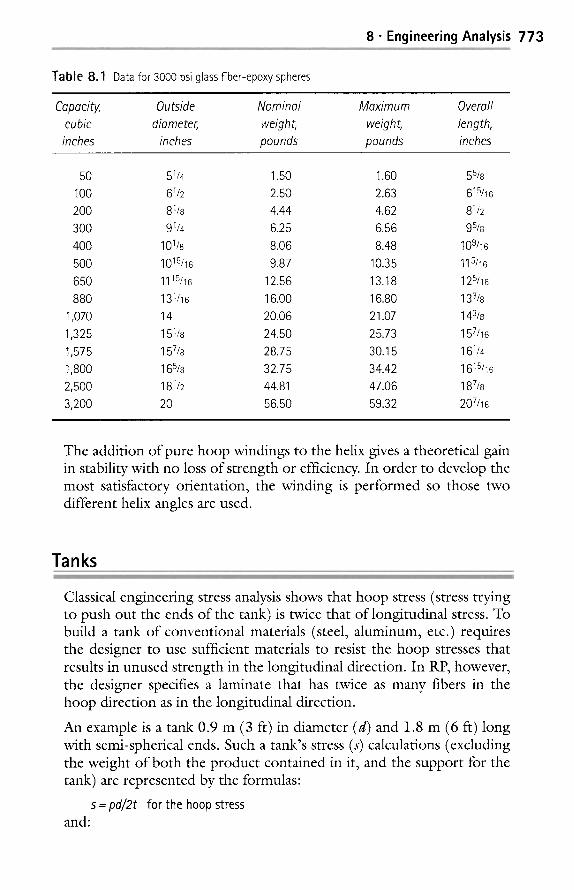
Table 8,1 Data for 3000 psi glass fiber-epoxy spheres
8 �9 Engineering Analysis 7 7 3
Copocity, Outside Nom in o l Moxim u m Overo ll cubic diometer, weight, weight, length, inches inches pounds pounds inches
5O IO0 2OO
3OO
4OO
5OO
65O 88O
1 070
1 325
1 575
1 8O0 2,500
3,200
51/4 1.50 1.60 55/8 61/2 2.50 2.63 615/16
81/8 4.44 4.62 81/2
91/4 6.25 6.56 95/8
101/8 8.06 8.48 109/16
1015/16 9.87 10.35 115/16
1115/16 12.56 13.18 125/16
131/16 16.00 16.80 133/8
14 20.06 21.07 143/8
151/8 24.50 25.73 157/16
157/8 28.75 30.15 161/4 165/8 32.75 34.42 1615/16
181/2 44.81 47.06 187/8
20 56.50 59.32 207/16
The addition of pure hoop windings to the helix gives a theoretical gain in stability with no loss of strength or efficiency. In order to develop the most satisfactory orientation, the winding is performed so those two different helix angles are used.
Tanks
Classical engineering stress analysis shows that hoop stress (stress trying to push out the ends of the tank) is twice that of longitudinal stress. To build a tank of conventional materials (steel, aluminum, etc.) requires the designer to use sufficient materials to resist the hoop stresses that results in unused strength in the longitudinal direction. In RP, however, the designer specifies a laminate that has twice as many fibers in the hoop direction as in the longitudinal direction.
An example is a tank 0.9 m (3 ft) in diameter (d) and 1.8 m (6 ft) long with semi-spherical ends. Such a tank's stress (s) calculations (excluding the weight of both the product contained in it, and the support for the tank) are represented by the formulas:
5 = pd/2t for the hoop stress
and"
774 Reinforced Plastics Handbook
5 = p d / 4 t for the end and longitudinal stresses
Tensile stresses are critical in tank design. The designer can assume the pressure (p) in this application will not exceed 100 psi (700 Pa) and selects a safety factor of 5. The stress must be known so that the thickness (t) can be determined. The stress or the strength of the final laminate is derived from the makeup and proportions of the resin, mat, and continuous fibers in the RP material.
Representative panels must be made and tested, with the developed tensile stress values then used in the formula Thus, the calculated tank thickness and method of lay-up or construction can be determined based on:
t h = pd /2s h or t h = pd /4s h
where
1 0 0 x 3 x 12 th = = 0.450 in.
200 x 103 2 x
5 tl = 112 th = 0.225 in. (or the same thickness with half the load or stress)
th = hoop thickness tl = longitudinal thickness
Sh = hoop stress sl = longitudinal stress Sh = 20 x 103 psi (140 MPa) safety factor = 5 p = 100 psi (700 Pa) d = 3 f t ( O . 9 m )
If the stress values had been developed from a laminate of alternating plies of woven roving and mat, the lay-up plan would include sufficient plies to make 1 cm (0.40 in.) or about four plies of woven roving and three plies of 460 g / m 2 (11/2 oz) mat. However, the laminate would be too strong axially. To achieve a laminate with 2 to 1 hoop to axial strength, one would have to carefully specify the fibers in those two right angle directions, or filament wind the tank so that the vector sum of the helical wraps would give a value of 2 (hoop) and 1 (axial), or wrap of approximately 54 ~ from the axial.
Another alternative would be to select a special fabric whose weave is 2 to 1, wrap to fill, and circumferentially wrap the cylindrical sections to the proper thickness, thus getting the required hoop and axial strengths with no extra, unnecessary strength in the axial (longitudinal) direction, as would inevitably be the case with a homogeneous metal tank.
As can be seen from the above, the design of RP products, while essentially similar to conventional design, does differ in that the materials
8 �9 Engineering Analysis 775
are combined when the product is manufactured. The RP designer must consider how the load-bearing fibers are placed and ensure that they stay in the proper position during fabrication.
Pipes
Thermoplastic Pipes
Extensive amount of URP pipe is used worldwide to move different types of liquids, gases, and solids. With the different properties of plastics (such as corrosion resistance, toughness, and strength), pipes can be fabricated to handle practically any type of material. A major and important market for URPs is in producing pipe (tube) for use such as on the ground, underground, in water, and electrical conduits.
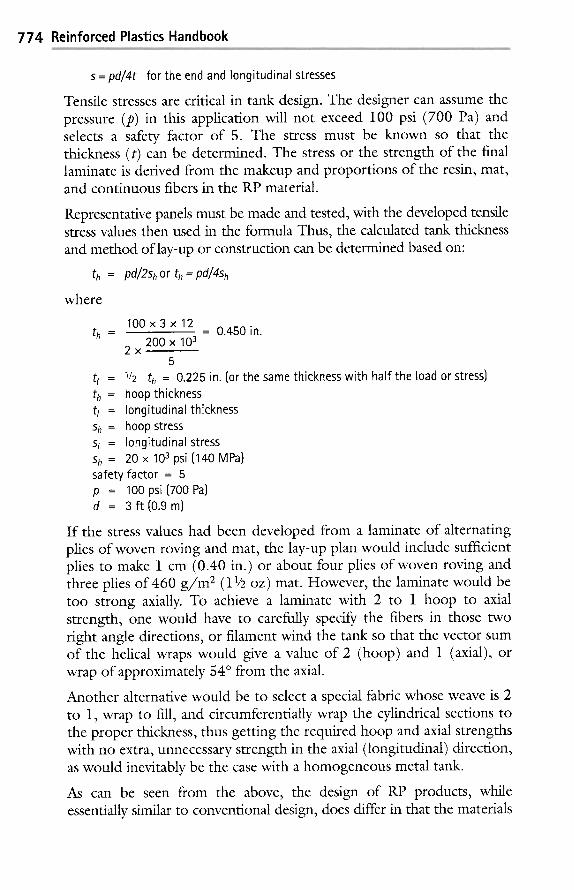
Figure 8.2 provides a method to determine pipe thickness subjected to uniform internal pressure P using the standard engineered thin-wall- tube hoop-stress equation. View (a) provides an equation that is approxi- mately accurate for t (d/10). However when the wall thickness increases the error becomes large. It is useful in determining an approximate wall thickness, even when condition t (d/lO) is not met. View (b) provides an equation for the maximum hoop stress that occurs on the surface of the inside wall of the pipe. After the thin-wall stress equation is applied, the thick-wall stress equation can be used to verify the design.
(a) (b)
HOOP STFI
Figure 8.2 Pipe wall thickness determination based on internal pressure
Pipe's exceptional growth in what was a very competitive market is the result of its outstanding performances to costs (includes handling and installation). The total USA pipe market has been in the order of $5 billion per year. About 10 billion pounds of plastics are consumed with
776 Reinforced Plastics Handbook
72wt% of PVC, 23% HDPE, and others that include LDPE, LLDPE, chlorinated PVC, XLPE (PEX), ABS, and PP. Plastic pipe represents about 30% of the dollar share compared to other materials (iron/steel at 45%, copper at 12%, concrete at 8%, aluminum at 4%, etc.).
While any plastic material, irrespective of its chemical composition and character, may be made into pipe or tubing, by far the greatest amount of pipe is made from thermoplastics (TPs) that are adaptable to extrusion processes (Chapter 5). Specialty pipe is made in small amounts from TS materials such as phenolic and polyester, but very large of commercial pipe is made from polyethylene, polyvinyl chloride, acrylonitrile butadiene copolymers, and acrylonitrile butadiene styrene types of alloys. Specialty tubing in relatively small amounts is made of acrylates and acrylate copolymers, as well as other transparent materials (Chapter 3).
In general, plastic pipe offers advantages over metal pipe because of its resistance to widely varying conditions of environment, lightweight, relatively low cost, ease and economy of installation, self-insulating characteristics, minimum solid deposit tendency, and/or low frictional losses. They provide internal pressure retention capability.
RP Pipes
An important product even though it represents a smaller portion of the market is reinforced TS (RTS) plastic; also called reinforced thermoset resin (RTR) according to ASTM standards. Its major material construction is glass fiber with TS polyester plastic that uses fabricating methods ranging from bag molding to filament winding (Chapter 5). These RTR pipes provide high load performance both internally and externally.
There is large diameter filament-wound pipes (RTRs) used and accepted in underground burial because they provide conditions such as corrosion resistance and installation-cost savings. Pipe design equations have been used that specifically provide useful information to meet internal and/or external pressure loads. More recently finite element analysis (FEA) has been used to design RP pipes and other structural products. These design approaches utilize performance standards based upon internal pressures and pipes' stiffness. Other requirements must be met such as longitudinal effects of internal pressure, temperature gradients, and pipe bridging.
When compared to steel pipes there are similarities and dissimilarities. They both differ from concrete pipe which is a rigid pipe that cannot tolerate bending or deflection to the same extent as RTR and steel pipe. The following review provides information on the design approach and
8 �9 Engineering Analysis 7 7 7
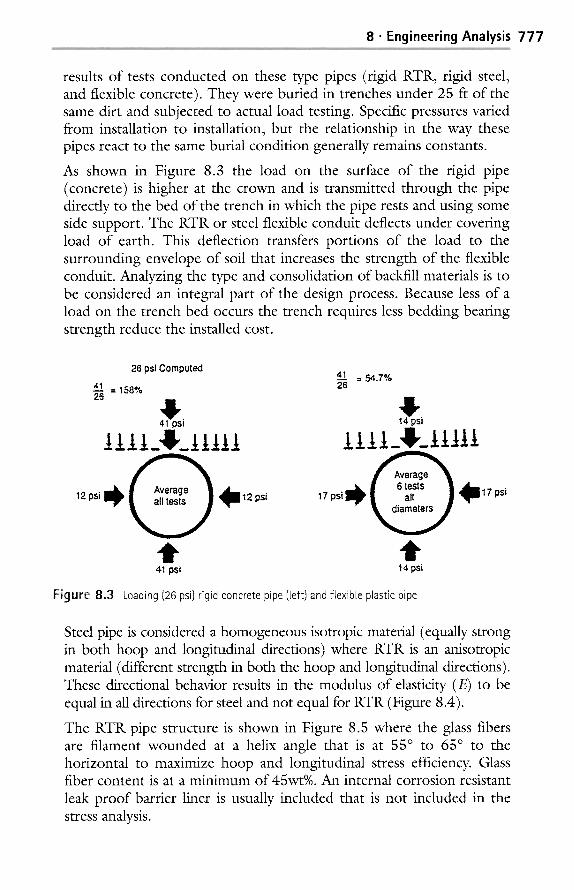
results of tests conducted on these type pipes (rigid RTR, rigid steel, and flexible concrete). They were buried in trenches under 25 ft of the same dirt and subjected to actual load testing. Specific pressures varied from installation to installation, but the relationship in the way these pipes react to the same burial condition generally remains constants.
As shown in Figure 8.3 the load on the surface of the rigid pipe (concrete) is higher at the crown and is transmitted through the pipe directly to the bed of the trench in which the pipe rests and using some side support. The RTR or steel flexible conduit deflects under covering load of earth. This deflection transfers portions of the load to the surrounding envelope of soil that increases the strength of the flexible conduit. Analyzing the type and consolidation of backfill materials is to be considered an integral part of the design process. Because less of a load on the trench bed occurs the trench requires less bedding bearing strength reduce the installed cost.
26 psi Computed
26
12 psi i l ~ ~11112 psi
41 = 54.7% 26
4, 14 psi
ilil_Iklllll
t t 4.1 psi 14 psi
Figure 8.3 Loading (26 psi) rigid concrete pipe (left)and flexible plastic pipe
Steel pipe is considered a homogeneous isotropic material (equally strong in both hoop and longitudinal directions) where RTR is an anisotropic material (different strength in both the hoop and longitudinal directions). These directional behavior results in the modulus of elasticity (E) to be equal in all directions for steel and not equal for RTR (Figure 8.4).
The RTR pipe structure is shown in Figure 8.5 where the glass fibers arc filament wounded at a helix angle that is at 55 ~ to 65 ~ to the horizontal to maximize hoop and longitudinal stress efficiency. Glass fiber content is at a minimum of 45wt%. An internal corrosion resistant leak proof barrier liner is usually included that is not included in the stress analysis.
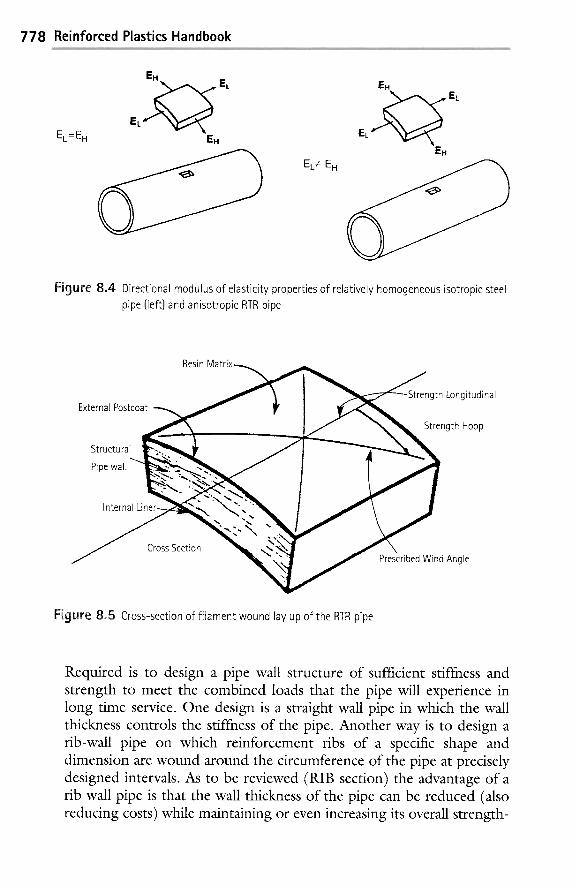
EL=E H
EH
EH EL~ E H
778 Reinforced Plastics Handbook
Figure 8.4 Directional modulus of elasticity properties of relatively homogeneous isotropic steel pipe {left)and anisotropic RTR pipe
External Postcoat
Structural
Pipe wall
Resin
Strength Longitudinal
Strength Hoop
Internal Lin~
Cross Section Prescribed Wind Angle
Figure 8,5 Cross-section of filament wound lay up of the RTR pipe
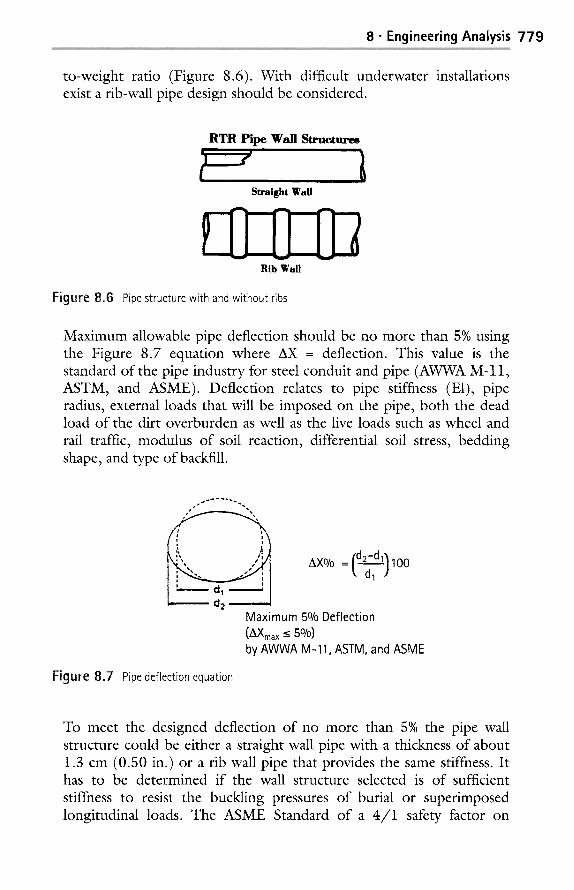
Required is to design a pipe wall structure of sufficient stiffness and strength to meet the combined loads that the pipe will experience in long time service. One design is a straight wall pipe in which the wall thickness controls the stiffness of the pipe. Another way is to design a rib-wall pipe on which reinforcement ribs of a specific shape and dimension arc wound around the circumference of the pipe at precisely designed intervals. As to be reviewed (RIB section) the advantage of a rib wall pipe is that the wall thickness of the pipe can be reduced (also reducing costs) while maintaining or even increasing its overall strength-
8 �9 Engineering Analysis 7 7 9
to-weight ratio (Figure 8.6). With difficult underwater installations exist a rib-wall pipe design should be considered.
RTR Pipe Wall Structures
Straight Wall
Rib Wall
Figure 8.6 Pipe structure with and without ribs
Maximum allowable pipe deflection should be no more than 5% using the Figure 8.7 equation where AX = deflection. This value is the standard of the pipe industry for steel conduit and pipe (AWWA M-11, ASTM, and ASME). Deflection relates to pipe stiffness (El), pipe radius, external loads that will be imposed on the pipe, both the dead load of the dirt overburden as well as the live loads such as wheel and rail traffic, modulus of soil reaction, differential soil stress, bedding shape, and type of backfill.
xo, o _
dl
Maximum 5% Deflection [AXma x ~ SO/o) by AWWA M-11, ASTM, and ASME
Figure 8.7 Pipe deflection equation
To meet the designed deflection of no more than 5% the pipe wall structure could be either a straight wall pipe with a thickness of about 1.3 cm (0.50 in.) or a rib wall pipe that provides the same stiffness. It has to be determined if the wall structure selected is of sufficient stiffness to resist the buckling pressures of burial or superimposed longitudinal loads. The ASME Standard of a 4 / 1 safety factor on
780 Reinforced Plastics Handbook
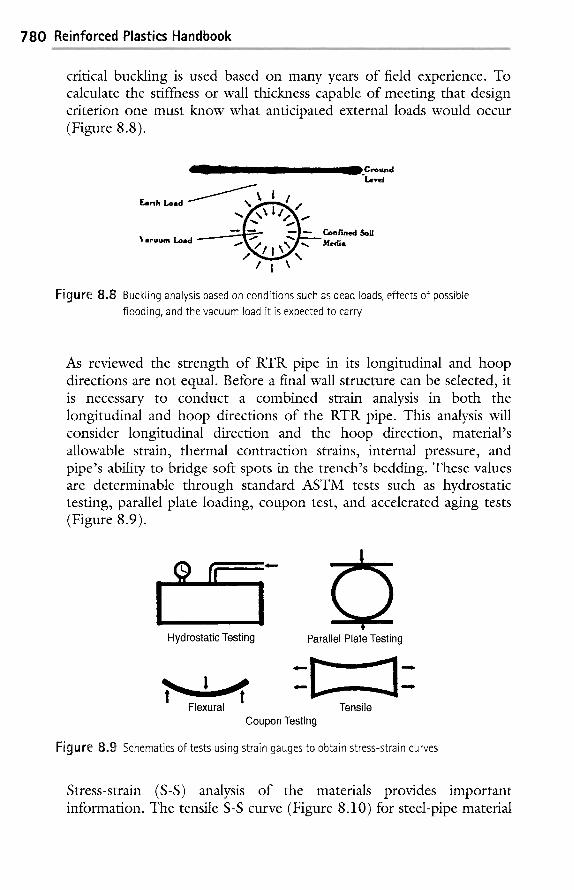
critical buckling is used based on many years of field experience. To calculate the stiffness or wall thickness capable of meeting that design criterion one must know what anticipated external loads would occur (Figure 8.8).
l . e - e l
- " " - - C o n f i n e d So i l Vmeuum L o a d j , ~ M e d i a
Figure 8.8 Buckling analysis based on conditions such as dead loads, effects of possible flooding, and the vacuum load it is expected to carry
As reviewed the strength of RTR pipe in its longitudinal and hoop directions are not equal. Before a final wall structure can be selected, it is necessary to conduct a combined strain analysis in both the longitudinal and hoop directions of the RTR pipe. This analysis will consider longitudinal direction and the hoop direction, material's allowable strain, thermal contraction strains, internal pressure, and pipe's ability to bridge soft spots in the trench's bedding. These values are determinable through standard ASTM tests such as hydrostatic testing, parallel plate loading, coupon test, and accelerated aging tests (Figure 8.9).
Hydrostatic Testing
Flexural
Parallel Plate Testing
-I:::::3- m I
Tensile Coupon Testing
Figure 8.9 Schematics of tests using strain gauges to obtain stress-strain curves
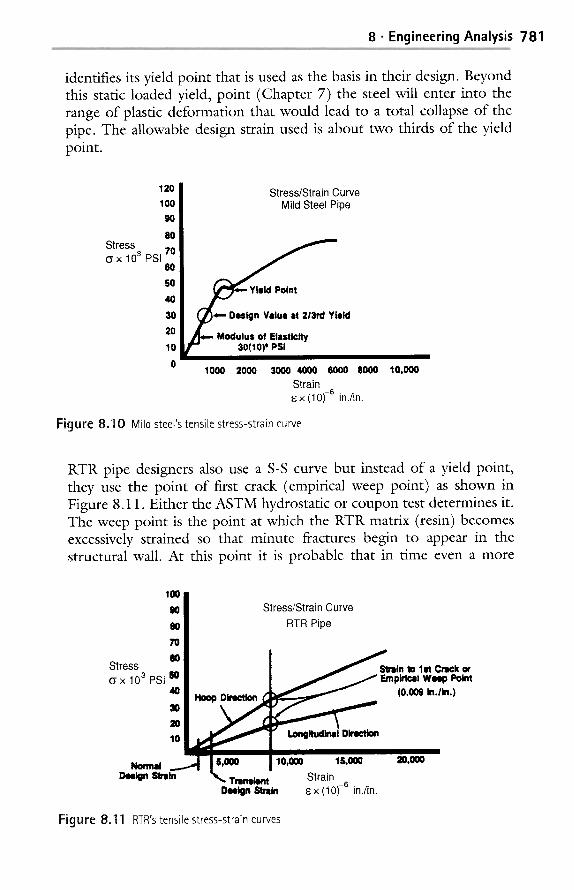
Stress-strain (S-S) analysis of the materials provides important information. The tensile S-S curve (Figure 8.10) for steel-pipe material
8 �9 Engineering Analysis 781
identifies its yield point that is used as the basis in their design. Beyond this static loaded yield, point (Chapter 7) the steel will enter into the range of plastic deformation that would lead to a total collapse of the pipe. The allowable design strain used is about two thirds of the yield point.
120
100
90
80
70
60
SO
40
30
20
10
0
Stress o x 103 PSI
Stress/Strain Curve Mild Steel Pipe
~ *--Oesign Value at 213rd Yield
Modulus of Elasticity F 30(10) ~ PSi
1000 2000 3000 4000 6000 8000 Strain
x (10) -6 in./in.
Figure 8.10 Mild steel's tensile stress-strain curve
10,000
RTR pipe designers also use a S-S curve but instead of a yield point, they use the point of first crack (empirical weep point) as shown in Figure 8.11. Either the ASTM hydrostatic or coupon test determines it. The weep point is the point at which the RTR matrix (resin) becomes excessively strained so that minute fractures begin to appear in the structural wall. At this point it is probable that in time even a more
100 90 Stress/Strain Curve
80 RTR Pipe
70
Stress O0 Slmin to let Crack or (~ x 10 3 PSI SO / Empirical Weep Point
40 Hoop (0.009 in./in.)
10 , Longltudlrml Dlreotlon
Normal ~ /5'000 ~10,000 lS,000 Dqmlgn Slnlin ' ~ . Tmrmkmt Strain
Deellln StnDin ~ x (10) -6 in./in.
20,000
Figure 8.11 RTR's tensile stress-strain curves

782 Reinforced Plastics Handbook
elastic liner on the inner wall will be damaged and allow water or other liquid to weep through the wall. Even with this situation, as is the case with the yield point of steel pipe, reaching the weep point is not catas- trophic. It will continue to withstand additional load before it reaches the point of ultimate strain and failure. By using a more substantial, stronger liner the weep point will be extended on the S-S curve.
The filament-wound pipe weep point is less than 0.009 in./in. The design is at a strain of 0.0018 in./in, providing a 5 to 1 safety factor. For transient design conditions a strain of 0.0030 in./in, is used pro- viding a 3 to 1 safety factor.
Stress or strain analysis in the longitudinal and hoop directions is con- ducted with strain usually used, since it is easily and accurately measured using strain gauges, whereas stresses have to be calculated. From a practical standpoint both the longitudinal and the hoop analysis determine the minimum structural wall thickness of the pipe. However, since the longitudinal strength of RTR pipe is less than it is in the hoop direction, the longitudinal analysis is first conducted that considers the effects of internal pressure, expected temperature gradients, and ability of the pipe to bridge voids in the bedding. Analyzing these factors requires that several equations be superimposed, one on another. All these longitudinal design conditions can be solved simultaneously; the usual approach is to examine each individually.
Poisson's ratio can have an influence since a longitudinal load could exist (Chapter 7). The Poisson's effect must be considered when designing long or short length of pipe. This effect occurs when an open-ended cylinder is subjected to internal pressure. As the diameter of the cylinder expands, it also shortens longitudinally. Since in a buffed pipe movement is resisted by the surrounding soil, a tensile load is produced within the pipe. The internal longitudinal pressure load in the pipe is independent of the length of the pipe.
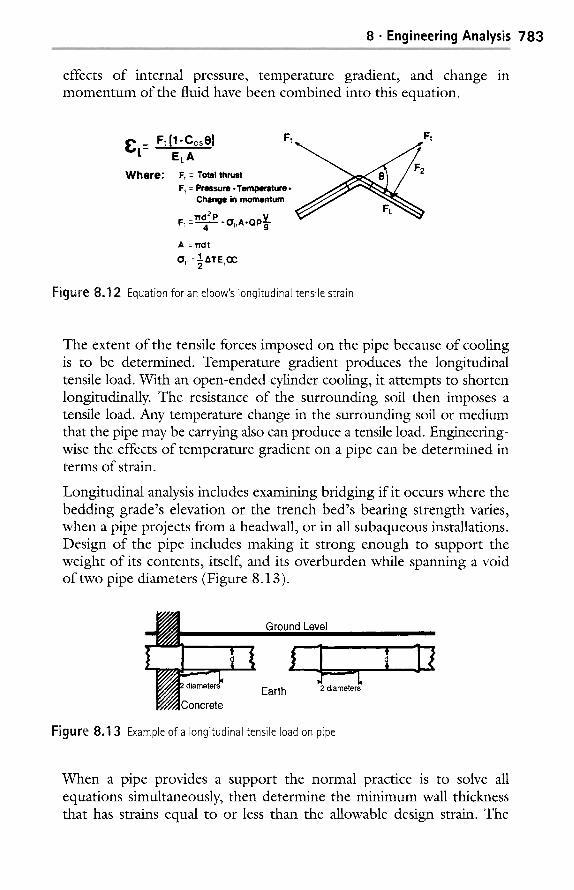
Several equations can be used to calculate the result of Poisson's effect on the pipe in the longitudinal direction in terms of stress or strain. Equation provides a solution for a straight run of pipe in terms of strain. However, where there is a change in direction by pipe bends and thrust blocks are eliminated through the use of harness-welded joints, a different analysis is necessary. Longitudinal load imposed on either side of an elbow is high. This increased load is the result of internal pressure, temperature gradient, and /or change in momentum of the fluid. Because of this increased load, the pipe joint and elbow thickness may have to be increased to avoid overstraining. The equation shown in Figure 8.12 calculates the longitudinal strain in pipe at the elbow. The
8 �9 Engineering Analysis 7 8 3
effects of internal pressure, temperature gradient, and change in momentum of the fluid have been combined into this equation.
I F t [1-CosO] r "t= E,A Where: Ft = Total thrust
F~ = Pressure ~ Temperature § Change in momentum
11'd 2 P . Q p V F: = ~ * O'L,A
A : l'fdt
OL ' : �89 ATELOC
Ft
Figure 8.12 Equation for an elbow's longitudinal tensile strain
The extent of the tensile forces imposed on the pipe because of cooling is to be determined. Temperature gradient produces the longitudinal tensile load. With an open-ended cylinder cooling, it attempts to shorten longitudinally. The resistance of the surrounding soil then imposes a tensile load. Any temperature change in the surrounding soil or medium that the pipe may be carrying also can produce a tensile load. Engineering- wise the effects of temperature gradient on a pipe can be determined in terms of strain.
Longitudinal analysis includes examining bridging if it occurs where the bedding grade's elevation or the trench bed's bearing strength varies, when a pipe projects from a headwall, or in all subaqueous installations. Design of the pipe includes making it strong enough to support the weight of its contents, itself, and its overburden while spanning a void of two pipe diameters (Figure 8.13).
t
Ground Level
Earth
J 2 diameters
Figure 8.13 Example of a longitudinal tensile load on pipe
When a pipe provides a support the normal practice is to solve all equations simultaneously, then determine the minimum wall thickness that has strains equal to or less than the allowable design strain. The
784 Reinforced Plastics Handbook
result is obtaining the minimum structural wall thickness. This approach provides the designer with a minimum wall thickness on which to base the ultimate choice of pipe configuration. As an example, there is the situation of the combined longitudinal analysis requiting a minimum of% in. (1.59 cm) wall thickness when the deflection analysis requires a 1/2 in. (1.27 cm) wall, and the buckling analysis requires a 3/4 in. (1.9 cm) wall. As reviewed the thickness was the 3/4 in. wall. How- ever, with the longitudinal analysis a % in. wall is enough to handle the longitudinal strains likely to be encountered.
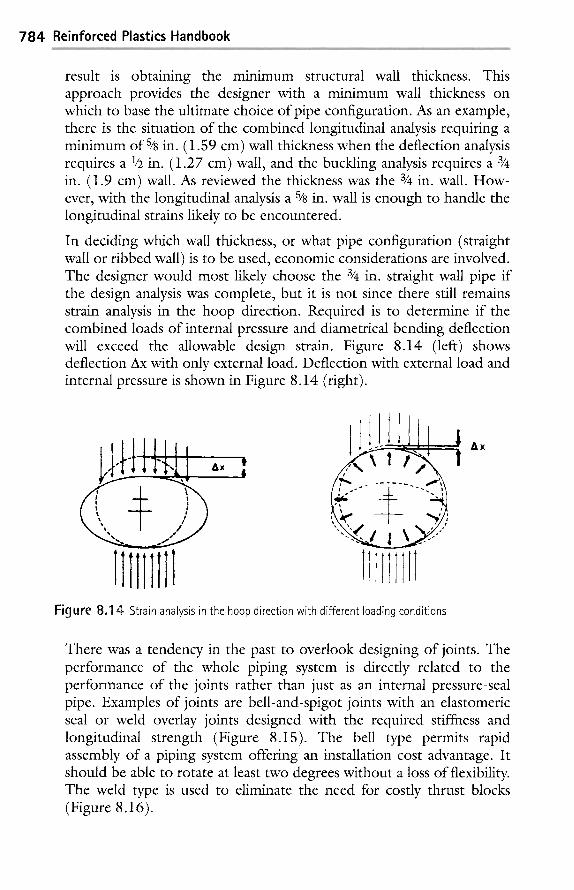
In deciding which wall thickness, or what pipe configuration (straight wall or fibbed wall) is to be used, economic considerations are involved. The designer would most likely choose the 3/4 in. straight wall pipe if the design analysis was complete, but it is not since there still remains strain analysis in the hoop direction. Required is to determine if the combined loads of internal pressure and diametrical bending deflection will exceed the allowable design strain. Figure 8.14 (left) shows deflection Ax with only external load. Deflection with external load and internal pressure is shown in Figure 8.14 (fight).
Lt/I III ,
.kt] l ]'$.1,1
Jill 11
Ax 'It' ,It,
�9 ' , ~ t "e
11 11
1 | Ax
Figure 8.14 Strain analysis in the hoop direction with different loading conditions
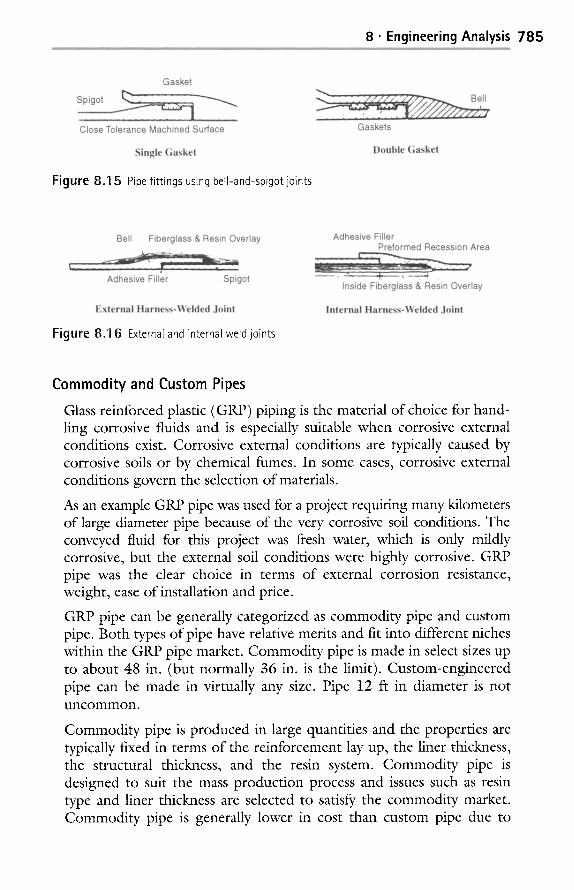
There was a tendency in the past to overlook designing of joints. The performance of the whole piping system is directly related to the performance of the joints rather than just as an internal pressure-seal pipe. Examples of joints are bell-and-spigot joints with an elastomeric seal or weld overlay joints designed with the required stiffness and longitudinal strength (Figure 8.15). The bell type permits rapid assembly of a piping system offering an installation cost advantage. It should be able to rotate at least two degrees without a loss of flexibility. The weld type is used to eliminate the need for costly thrust blocks (Figure 8.16).
8 �9 Engineering Analysis 785
Figure 8,15 Pipe fittings using bell-and-spigot joints
Figure 8,16 External and internal weld joints
Commodity and Custom Pipes
Glass reinforced plastic (GRP) piping is the material of choice for hand- ling corrosive fluids and is especially suitable when corrosive external conditions exist. Corrosive external conditions are typically caused by corrosive soils or by chemical fumes. In some cases, corrosive external conditions govern the selection of materials.
As an example GRP pipe was used for a project requiring many kilometers of large diameter pipe because of the very corrosive soil conditions. The conveyed fluid for this project was flesh water, which is only mildly corrosive, but the external soil conditions were highly corrosive. GRP pipe was the clear choice in terms of external corrosion resistance, weight, ease of installation and price.
GRP pipe can be generally categorized as commodity pipe and custom pipe. Both types of pipe have relative merits and fit into different niches within the GRP pipe market. Commodity pipe is made in select sizes up to about 48 in. (but normally 36 in. is the limit). Custom-engineered pipe can be made in virtually any size. Pipe 12 ft in diameter is not uncommon.
Commodity pipe is produced in large quantities and the properties are typically fixed in terms of the reinforcement lay up, the liner thickness, the structural thickness, and the resin system. Commodity pipe is designed to suit the mass production process and issues such as resin type and liner thickness are selected to satisfy the commodity market. Commodity pipe is generally lower in cost than custom pipe due to
786 Reinforced Plastics Handbook
mass production and commodity pipe is often an off the shelf' product, resulting in shorter delivery lead times.
Custom pipe is custom engineered and custom fabricated for the particular corrosive environment and mechanical and thermal loading. Essential design variables considered during the design of custom pipe are pressure, vacuum, peak temperature, differential temperature, coefficients of expansion, support span, burial conditions (for underground pipe), liner thickness, and resin system(s).
An example of what can happed if the correct pipe is not used relates to a large power plant in the southern part of the USA which some years ago suffered a multi-million dollar loss because commodity GRP pipe had been used without proper attention to the essential design variables listed above. Properly engineered and fabricated custom GRP pipe would have performed very well in this service. In this particular power plant, GRP pipe has been blacklisted, which is unfortunate for the GRP industry as a whole. The engineers at the power plant understand that the failures were not due to the use of GRP but to the use of the incorrect GRP product. However, the company management issued a blanket ban against GRP pipe because of the large monetary loses, preventing the engineering department from specifying GRP pipe of any type. The power plant engineers expressed regret that this had occurred and said it will take years to get the ban lifted. They fully understand that custom- engineered pipe would have performed successfully for many years.
Commodity pipe is typically manufactured either by filament winding or centrifugal casting (Chapter 5). In the case of centrifugal casting, glass fibers are chopped and mixed by various means with resin, and centrifugal force is used to keep the pipe against the inside of the mold until the resin solidifies (TP) or cures (TS). For buried pipe, some manufacturers mix sand into the matrix. Sand is a low cost material that builds up the pipe thickness and reduces cost. Centrifugally cast pipe properties are highly resin dependent due to the short fiber lengths, so the long-term properties are significantly lower than long-term prop- erties of custom-engineered pipe. In addition, the strength and stiffness of short-fiber pipe is more sensitive to temperature. The wall thickness is relatively high because the material strength is relatively low. In the case of sand-filled pipe, mechanical strength is very low but wall thick- ness high because pipe stiffness is proportional to thickness cubed and linear with modulus.
It is important to note there are many ways to do filament winding and the resultant properties can vary greatly. Commodity pipe is typically wound at 5 5 ~ (as measured from the pipe axis). Many have been led to
8 �9 Engineering Analysis 7 8 7
believe 55 ~ is the optimum wind angle for GRP pipe, but this assertion is a half-truth. An angle of 55 ~ is optimum only for pipe subjected to biaxial pressure and manufactured only with single angle helical filament winding reinforcement. A ring joint pipe with thrust blocks is subjected only to hoop pressure while locked joint capped pipe is subjected to biaxial pressure loading. Other winding methods and reinforcement schemes will result in pipe with significantly improved properties over 55 ~ filament wound pipe. However, for commodity pipe, these superior winding techniques are not practical for mass production. The hoop and axial strengths of 55 ~ pipe are dependent to a large degree on the shear strength of the resin. This explains the large ratio of short term to long- term strengths. Long term burst is typically about one-third the short- term burst pressure because of the resin dependent properties.
Another consideration is that winding at 55 ~ is difficult for larger pipe and relatively slow. The carriage speed required for 55 ~ is about four times faster than required for typical custom-engineered pipe. When the carriage speeds become high, the mandrel speed and material application speeds have to be reduced. Turn-around-zones on larger pipe are problematic at 55 ~ in terms of band slippage and the large thickness. Pipe wound at 55 ~ as compared to 65 ~ will result in 4-5 wt% (of the total material weight) extra waste and 25-30% extra winding time. When pipe is wound at high angles, the reduction in waste and improvements in wind time become even more significant.
As reviewed, the mechanical properties of centrifugally molded pipe and 55 ~ filament wound pipe are much more resin dependent than typical custom engineered pipe. With centrifugally cast pipe, the tensile properties are very resin dependent because the fibers are chopped into relatively short lengths. It is subjected to creep and time-loss of mechanical properties. In addition, resin properties drop radically with temperature especially near the glass transition temperature.
With 55 ~ filament wound pipe, the mechanical properties are a function of the shear strength and stiffness of the resin. The small angles with respect to the axis create a 'scissor' action between the layers that puts the resin in shear. Like tensile properties, resin shear properties are subject to creep and a loss of strength and stiffness at elevated temperatures. The properties of well-designed custom pipe are much more glass dependent than resin dependent. Glass fibers are not subject to creep and, for temperatures up to 200C (the upper limit for GRP pipe), glass fibers do not lose strength or stiffness.
By custom designing the pipe laminate, superior axial strength and stiffness can be achieved. This can be used to advantage to increase
788 Reinforced Plastics Handbook
support spans thus reducing costs associated with pipe supports. Custom-engineered pipe can also be designed to be more tolerant of the localized stresses caused by pipe supports. This can be accomplished by the design of the laminate and by the addition of special reinforce- ments in support regions.
Stiffeners are often a very cost effective way to handle load conditions which cause the pipe to buckle and collapse. Examples are vacuum loading, soil loading and traffic loading. Commodity pipe can rarely, if ever, be purchased with stiffeners. However, custom-engineered pipe can be designed and fabricated with stiffeners, taking advantage of the cost savings and better performance that can be realized with stiffeners. The stiffener laminate, the stiffener size, and the stiffener spacing can all be 'fine tuned' for the most efficient and cost effective design.
The corrosion liner in commodity pipe is typically fixed and relatively thin as compared to custom pipe. The corrosion liner of commodity pipe is typically 1.25 mm or less. The corrosion liner of custom pipe is determined by the corrosive environment and is typically 2.5 mm or more. Depending on the performance requirements, some commodity pipe has no corrosion barrier at all.
With some exception, commodity pipe is made with epoxy resin. Epoxy, while having good properties for mechanical strength and for the commodity-manufacturing environment, is inferior to vinyl ester in terms of corrosion resistance. Custom-engineered pipe can be made with a wide range of resins, including fire retardant vinyl esters, epoxy vinyl esters, isophthalic polyesters, halogenated polyesters, etc. This allows custom pipe to handle a wide range of chemical services at competitive prices. Dual resin systems are possible with custom pipe but not possible for commodity pipe. For example, vinyl ester can be used for the corrosion liner and a fire retardant vinyl ester can be used for the structure. This optimizes the performance of the pipe.
The best mechanical properties are found in properly engineered custom pipe. By using large wind angles and axial unidirectional glass, the long-term hoop and axial strengths are significantly higher than either 55 ~ filament wound or centrifugally cast pipe. In addition, the properties are much more a function of the glass reinforcement than the resin. Hence, the pipe properties are much less a function of time under load, cyclic loading, and temperature. The higher and more stable mechanical properties of properly engineered custom pipe typically results in higher design factors. The design factor for commodity pipe is typically 3.0 for internal pressure while it typically ranges from 7 to 10 for custom engineered pipe. Higher design factors result in pipe with greater
8 �9 Engineering Analysis 7 8 9
tolerance of upset conditions and pipe with a longer mechanical service life. Combined with the typically greater liner thicknesses, custom- engineered pipe can be expected to have a much longer and more reliable service life.
Typically, the only advantages of commodity pipe over custom-engineered pipe are cost savings and off-the-shelf availability. In some cases, the cost savings are realized with custom engineered and fabricated pipe. For mildly corrosive applications where mechanical loading is not severe, com- modity pipe is a good choice. However, for corrosion applications where chemical environment, temperature, temperature differential, coefficient of expansion, resin compatibility, available sizes, etc. are important factors, custom engineered and fabricated pipe is the appropriate choice.
Beams
A beam is a bar or structural member subjected to transverse loads that tend to bend it. Any structural members act as a beam if external trans- verse forces induce bending. A simple beam is a horizontal member that rests on two supports at the ends of the beam. All parts between the supports have free movement in a vertical plane under the influence of vertical loads. A fixed beam, constrained beam, or restrained beam is rigidly fixed at both ends or rigidly fixed at one end and simply supported at the other. A continuous beam is a member resting on more than two supports. A cantilever beam is a member with one end projecting beyond the point of support, free to move in a vertical plane under the influence of vertical loads placed between the free end and the support.
When a simple beam bends under its own weight, the plastic or fibers in a plastic on the upper or concave side is shortened with the stress acting on them is compression. The fibers on the under or convex side are lengthened, and the stress acting on them is tension. In addition, shear exists along each cross section, the intensity of which is greatest along the sections at the two supports and zero at the middle section.
When a cantilever beam bends under its own weight, the fibers on the upper or convex side are lengthened under tensile stresses. The fibers on the under or concave side are shortened under compressive stresses, the shear is greatest along the section at the support, and zero at the free end.
The neutral surface is that horizontal section between the concave and convex surfaces of a loaded beam, where there is no change in the
790 Reinforced Plastics Handbook
length of the fibers and no tensile or compressive stresses acting upon them. The neutral axis is the trace of the neutral surface on any cross section of a beam. The elastic curve of a beam is the curve formed by the intersection of the neutral surface with the side of the beam, it being assumed that the longitudinal stresses on the fibers are within the elastic limit.
The reactions, or upward pressures at the points of support, are computed by applying certain conditions necessary for equilibrium of a system of vertical forces in the same plane. They are:
1 the algebraic sum of all vertical forces must equal zero; that is, the sum of the reactions equals the sum of the downward loads, and
2 the algebraic sum of the moments of all the vertical forces must equal zero.
Condition (1) applies to cantilever beams and to simple beams uniformly loaded, or with equal concentrated loads placed at equal distances from the center of the beam. In the cantilever beam, the reaction is the sum of all the vertical forces acting downward, comprising the weight of the beam and the superposed loads. In the simple beam each reaction is equal to one-half the total load, consisting of the weight of the beam and the superposed loads. Condition (2) applies to a simple beam not uniformly loaded. The reactions are computed separately, by determining the moment of the several loads about each support. The sum of the moments of the load around one support is equal to the moment of the reaction of the other support around the first support.
The fundamental laws for the stresses at any cross-section of a beam in equilibrium are:
1 sum of the horizontal tensile stresses equal sum of horizontal compressive stresses,
2 resisting shear equal vertical shear, and
3 resisting moment equal bending moment.
Bending moment at any cross-section of a beam is the algebraic sum of the moments of the external forces acting on either side of the section. It is positive when it causes the beam to bend convex downward, hence causing compression in upper fibers and tension in lower fibers of the beam. When the bending moment is determined from the forces that lie to the left of the section, it is positive if they act in a clockwise direction; if determined from forces on the fight side, it is positive if they act in a counterclockwise direction. If the moments of upward
8 �9 Engineering Analysis 791
forces are given positive signs, and the moments of downward forces are given negative signs, the bending moment will always have the correct sign, whether determined from the right or left side. The bending moment should be determined for the side for which the calculation will be the simplest.
The deflection of a beam as computed by the ordinary formulas is that due to flexural stresses only. The deflection in honeycomb (Chapter 7 Sandwiches) and short beams due to vertical shear can be high, and should always be checked. Because of the nonuniform distribution of the shear over the cross section of the beam, computing the deflection due to shear by exact methods is difficult. It may be approximated by:
Ys = M/AEs
where Ys = deflection, inch, due to shear; M = bending moment, lb-in, at the section where the deflection is calculated; A = area of cross section of beam, square inches; and Es = modulus of elasticity in shear, psi.
For a rectangular section, the ratio of deflection due to shear to the deflection due to bending, will be less than 5% if the depth of the beam is less than one-eighth of the length.
In designing a beam the procedure is:
1 compute reactions;
2 determine position of the dangerous section and the bending moment at that section;
3 divide the maximum bending moment (lb-in) by the allowable unit stress (psi) to obtain the minimum value of the section modulus; and
4 select a beam section with a section modulus equal to or slightly greater than the section modulus required.
Theories
Theorywise in simple beam bending a number of assumptions must be made. They are
1 the beam is initially straight, unstressed, and symmetrical;
2 its proportional limit is not exceeded;
3 the Young's modulus for the material is the same in both tension and compression; and
7 9 2 Reinforced Plastics H a n d b o o k
all deflections are small, so that planar cross- sections remain planar before and after bending.
The maximum stress occurs at the surface of the beam farthest from the neutral surface, as given by the following equation"
o = Mc/ I = M/Z
where M = bending moment in in./lbs., c = distance from the neutral axis to the outer surface where the maximum stress occurs in inches, I = moment of inertia in in. 4, and Z = I / c , the section modulus in in. 3.
This theoretical approach concerns a geometric property. It is not to be confused with the modulus of the material, which is a material property I, c, Z(Chapter 7).
RP B e a m s
The following exercise concerns glass fiber/TS polyester RP beams. They may be homogeneous, isotropic, or nonisotropic depending on their structure. Mat reinforced plates may be considered essentially isotropic and the usual engineering formulas may be applied.
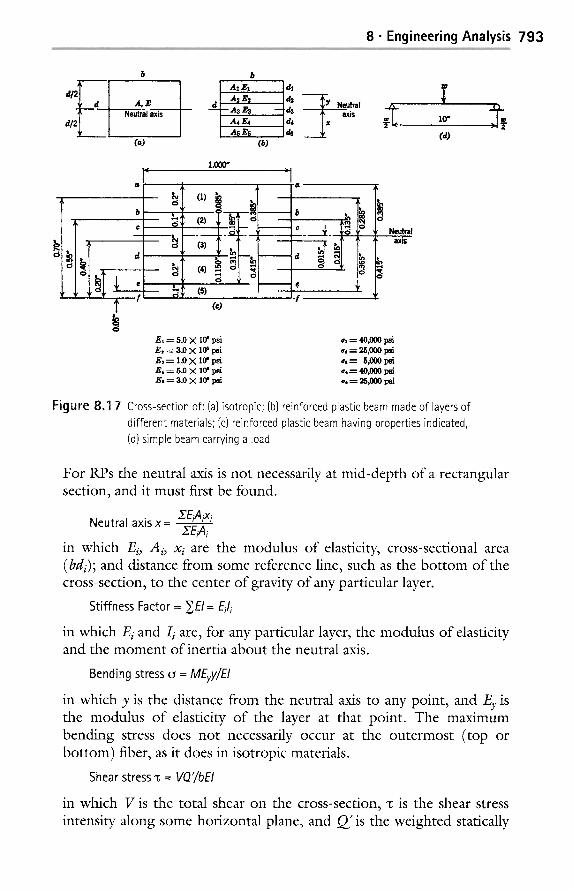
RP/nonisotropic structures require suitable modified formulas but otherwise the procedures for computing bending stresses, stiffness, and bending shear stresses are essentially the same as for isotropic materials. Considering two beams of identical overall dimensions, one isotropic and the other non-isotropic may bring out the differences and similarities. Two such cross-sections are laminated of same materials and laminated of different materials. Two such cross-sections are shown in Figure 8.17, views (a) and (b).
For each cross-section, it is necessary to know the stiffness factor EI to compute deflection, the section modulus to compute bending stresses, and the static moments of portions of the cross-section to compute shear stresses. For isotropic materials (a) the neutral axis of a rectangular cross-section is at mid-depths, and the familiar formulas are:
Moment of inertia I = ~ bd~ , Stiffness factor = El 12
I bd 2 Section modulus . . . . for outermost fiber
y 6
6M Bending stress - o = M - ~ for outermost fiber
VQ 3V Shear stress~ = ~ = for maximum shear at the neutral axis
bl 2bd
8 �9 Engineering Analysis 7 9 3
d / ~ "
b
A, E Neutral axis
b
i" Aa B3 d3 "axis A4 E4 d4 z As Es
Cb)
io
w L IO" [w ~- . ~ - (d)
,F
+ "! t f
E~ -- 5.0 X I(P psi E, -- 3.0 x lO e psi E , - - 1.OX 106 psi E , - - 5.0 X 10" psi E~-- 3.0 X 10⁶ psi
1.00~' "i
(c)
�9 , = 25,(X10 �9 , = 5,(XM) l~ i a4 - " 40,000 l~ i a , = ~,IX)O ~f i
Figure 8.1 7 Cross-section of: (a)isotropic; (b) reinforced plastic beam made of layers of different materials (c) reinforced plastic beam having properties indicated, (d) simple beam carrying a load
For RPs the neutral axis is not necessarily at mid-depth of a rectangular section, and it must first be found.
Neutral a x i s x = ~--~EiAixi XEiAi
in which Ei, Ai, xi are the modulus of elasticity, cross-sectional area (bdi); and distance from some reference line, such as the bottom of the cross-section, to the center of gravity of any particular layer.
Sti f fness Factor = ~,EI= Eili
in which Ei and Ii are, for any particular layer, the modulus of elasticity and the moment of inertia about the neutral axis.
Bending stress o = MEvy/EI
in which y is the distance from the neutral axis to any point, and Ey is the modulus of elasticity of the layer at that point. The maximum bending stress does not necessarily occur at the outermost (top or bottom) fiber, as it does in isotropic materials.
Shear stress 1: = VQ'/bEI
in which V is the total shear on the cross-section, i: is the shear stress intensity along some horizontal plane, and Q ' is the weighted statically
794 Reinforced Plastics Handbook
moment EiAiy' about the neutral axis of the portion of the cross-section between the horizontal plane in question and the outer edge (top or bottom) of the cross-section.
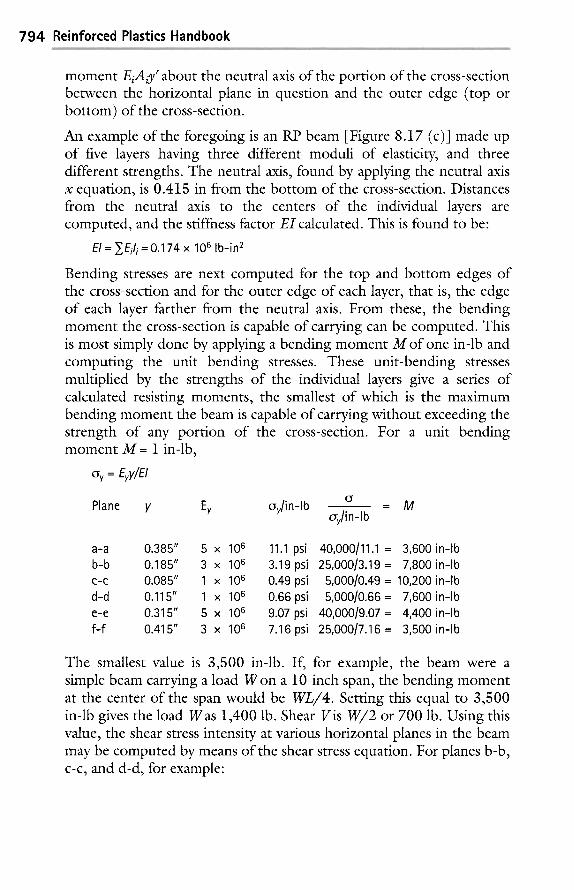
An example of the foregoing is an RP beam [Figure 8.17 (c)] made up of five layers having three different moduli of elasticity, and three different strengths. The neutral axis, found by applying the neutral axis x equation, is 0.415 in from the bottom of the cross-section. Distances from the neutral axis to the centers of the individual layers are computed, and the stiffness factor E1 calculated. This is found to be:
El = ~,Eil i = O. 174 x 106 Ib-in 2
Bending stresses are next computed for the top and bottom edges of the cross-section and for the outer edge of each layer, that is, the edge of each layer farther from the neutral axis. From these, the bending moment the cross-section is capable of carrying can be computed. This is most simply done by applying a bending moment M of one in-lb and computing the unit bending stresses. These unit-bending stresses multiplied by the strengths of the individual layers give a series of calculated resisting moments, the smallest of which is the maximum bending moment the beam is capable of carrying without exceeding the strength of any portion of the cross-section. For a unit bending moment M= 1 in-lb,
% = Eyy/EI
Plane y Ey oy/in-lb o = M oy/in-lb
a-a 0.385" 5 x 10⁶ b-b 0.185" 3 x 10⁶ c-c 0.085" 1 x 10⁶ d-d 0.115" 1 x 10⁶ e - e 0.315" 5 x 10⁶ f - f 0.415" 3 x 10⁶
11.1 psi 40,000/11.1 = 3,600 in-lb 3.19 psi 25,000/3.19 = 7,800 in-lb 0.49 psi 5,000/0.49 = 10,200 in-lb 0.66 psi 5,000/0.66 = 7,600 in-lb 9.07 psi 40,000/9.07 = 4,400 in-lb 7.16 psi 25,000/7.16 = 3,500 in-lb
The smallest value is 3,500 in-lb. If, for example, the beam were a simple beam carrying a load W on a 10-inch span, the bending moment at the center of the span would be WL/4. Setting this equal to 3,500 in-lb gives the load Was 1,400 lb. Shear V is W/2 or 700 lb. Using this value, the shear stress intensity at various horizontal planes in the beam may be computed by means of the shear stress equation. For planes b-b, c-c, and d-d, for example:
8 �9 Engineering Analysis 7 9 5
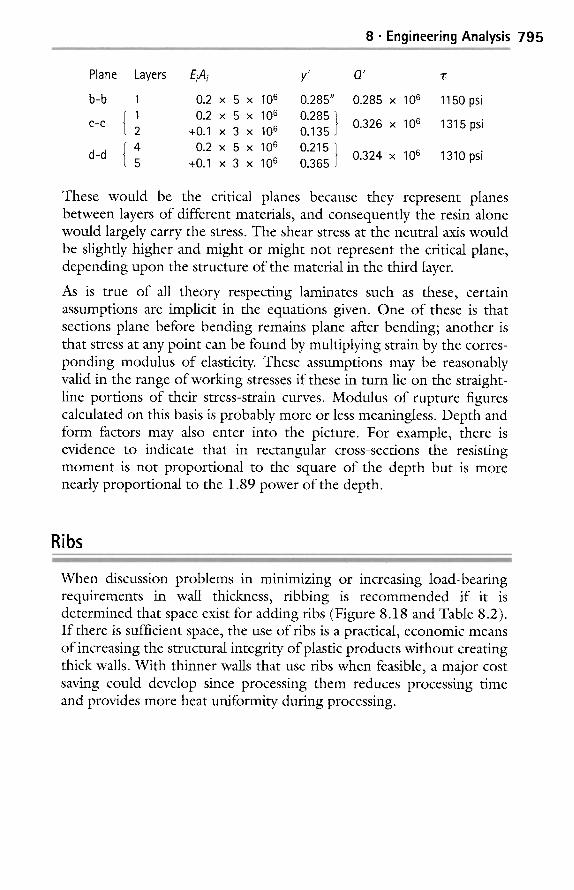
Plane Layers EiAi y' Q' "r
b-b 1 0.2 x 5 x 106 0.285" 0.285 x 10⁶ 1150 psi { 1 0.2 x 5 x 106 0.285} 06
c-c 2 +0.1 x 3 x 106 0.135 0.326 x 1 1315psi
d_d { 4 0.2 x 5 x 106 0.215} 06 5 +0.1 x 3 x 10 6 0.365 0.324 x 1 1310 psi
These would be the critical planes because they represent planes between layers of different materials, and consequently the resin alone would largely carry the stress. The shear stress at the neutral axis would be slightly higher and might or might not represent the critical plane, depending upon the structure of the material in the third layer.
As is true of all theory respecting laminates such as these, certain assumptions are implicit in the equations given. One of these is that sections plane before bending remains plane after bending; another is that stress at any point can be found by multiplying strain by the corres- ponding modulus of elasticity. These assumptions may be reasonably valid in the range of working stresses if these in turn lie on the straight- line portions of their stress-strain curves. Modulus of rupture figures calculated on this basis is probably more or less meaningless. Depth and form factors may also enter into the picture. For example, there is evidence to indicate that in rectangular cross-sections the resisting moment is not proportional to the square of the depth but is more nearly proportional to the 1.89 power of the depth.
Ribs
When discussion problems in minimizing or increasing load-bearing requirements in wall thickness, ribbing is recommended if it is determined that space exist for adding ribs (Figure 8.18 and Table 8.2). If there is sufficient space, the use of ribs is a practical, economic means of increasing the structural integrity of plastic products without creating thick walls. With thinner walls that use ribs when feasible, a major cost saving could develop since processing them reduces processing time and provides more heat uniformity during processing.

7 9 6 Reinforced Plastics Handbook
Table 8.2 Analyzing rib and cross-section designs
Geometry
Cross section area, square inches
(mm 2)
Mximum stress, psi
(mPa)
Maximum deflection, inches (mm)
t ' - -~ fi_L r.~./// / /~...; i OBIGIIVAL SECTION
0.060
0.0600 (38.7)
6,800 (46.9)
0.694 (17.6)
e ~ i ..... T,
0.0615 (39.7)
2,258 (15.6)
0.026 (0.66)
0.1793 (115.7)
2,258 (15.6)
0.026 (0.66)
.457
..... L
T
Aluminum Zinc
E = 10.3 • 106 E = 2.0 x I0
Plastic-PC
E = 1.2 x I0 ~
I = 0.0049 I = 0.0254
\ El = 5.08 x 10⁴ E1 = 5.08 x I0
I = 0.0424
4 4 E1 = 5.08 x 10
Area = 0.283 in. Area = 0.489 Area = 0.170
Wt/in = 0.446 oz. Wt/in = 2.01 oz Wt/in = 0.149 oz
Figure 8.18 Comparing a rib design strength wise and weight wise with other materials
8 �9 Engineering Analysis 7 9 7
Mthough the use of ribs gives the designer great latitude in efficiently tailoring the structural response of a plastic product, fibbing can result in warping and appearance problems. In general, modifying the process and /or redesigning the product eliminate problems.
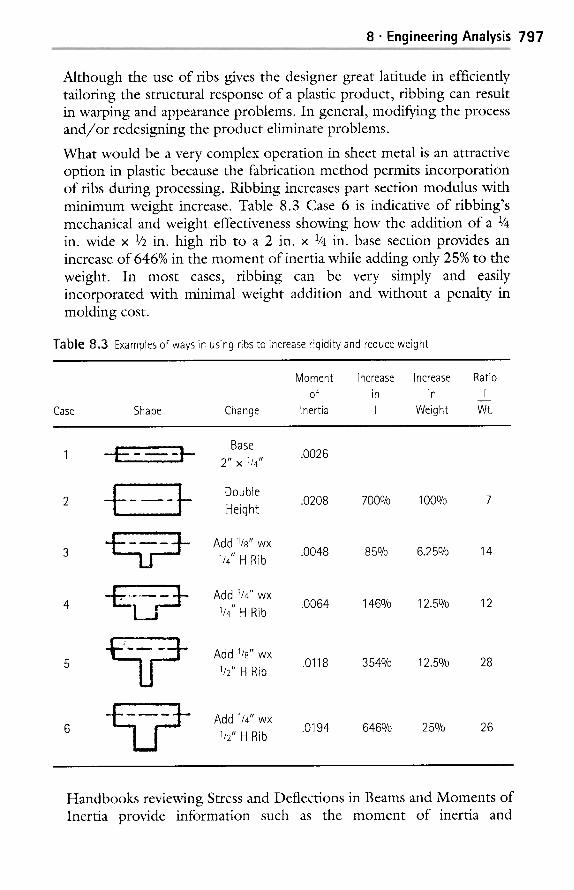
What would be a very complex operation in sheet metal is an attractive option in plastic because the fabrication method permits incorporation of ribs during processing. Ribbing increases part section modulus with minimum weight increase. Table 8.3 Case 6 is indicative of ribbing's mechanical and weight effectiveness showing how the addition of a 1/4 in. wide x 1/2 in. high rib to a 2 in. x 1/4 in. base section provides an increase of 646% in the moment of inertia while adding only 25% to the weight. In most cases, ribbing can be very simply and easily incorporated with minimal weight addition and without a penalty in molding cost.
Table 8,3 Examples of ways in using ribs to increase rigidity and reduce weight
Case Shape Change
Moment Increase Increase Ratio of in in I
Inertia I Weight Wt.
Base - i_ 1 .0026
2 I--- ~ :-~i [ ...1_'_ '-i ;~ ~ Double .0208 7000/0 100O/o 7 . . . . . Height
~ _ ~ - ' ~ Add 1/8" WX 3 1/4" H Rib .0048 850/0 6.25% 14
' i ~ Add 1/4" wx 4 1/4" H Rib .0064 146O/o 12.5O/o 12
Add 1/8" WX 5 1/2" H Rib .0118 354% 12.5% 28
Add 1/4" wx 6 1/2" H Rib .0194 6460/0 250/0 26
Handbooks reviewing Stress and Deflections in Beams and Moments of Inertia provide information such as the moment of inertia and
798 Reinforced Plastics Handbook
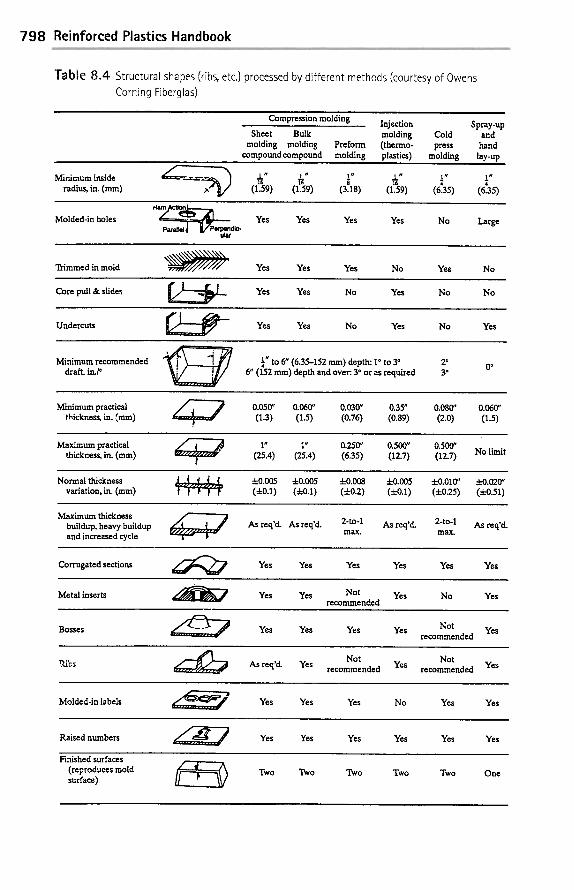
Table 8,4 Structural shapes {ribs, etc.) processed by different methods {courtesy of Owens Corning Fiberglas)
Minimum inside radius, in. (ram)
Compression molding Injection
Sheet Bulk molding Cold molding molding Preform (thermo- press
compound compound molding plastics) molding _ _
tt n I a i n 41#
(1.59) (1.59) (3.18) (1.59) (6.35)
Spray-up and hand lay-up
(6.35)
Molded-in holes Parallel ~ ~/Perpendk:-
ular
Yes Yes Yes ~ s No Large
Trimmed in mold Yes Yes ~s No Yes No
Core pull & slides Yes Yes No ~s No No
Undercuts Yes Yes No Yes No Yes
Minimum recommended ~ ~ draft, in./'
�88 to 6" (6.35-152 mm) depth: 1 ~ to 3" 6" (152 mm) depth and over:. 3 ~ or as required
Minimum practical thickness, in. (mm)
0.05~' o.06e' 0.03~' 0.35- 0.08~' 0.06~' (1.3) (1_5) (0.76) (0.89) (2.0) (1.5)
Maximum practical thickness, in. (mm)
I" 1" 0.250' 0.500' 0_500" (25.4) (25.4) (6.35) (12.7) (12.7) No limit
Normal thickness variation, in. (mm)
~:0.005 ~-0.005 ~:0.008 ~:o.oos 4-0.01~, ~.oa(y' (4=0.1) (4-0.1) (4=0.2) (4-0.1) (+0.25) (4=0.51)
Maximum thickness buildup, heavy buildup and increased cycle
As req'd. As req'd. 2-to-1 As req'd. 2-to-1 m a x . m a x .
As req'd.
Corrugated sections ~ s ~ s ~ s ~ s Yes Yes
Metal inserts Yes Yes Not Yes No recommended
Yes
Bosses Yes Yes Yes Yes Not recommended
Yes
..Ribs Not Not As req'd. Yes Yes
recommended recommended Yes
Molded-in labels ~s ~s ~s No ~s ~s
Raised numbers ~ s ~ s ~ s ~ s ~ s ~ s
Finished surfaces (reproduces mold surface)
Two Two Two Two Two One
8 �9 Engineering Analysis 7 9 9
resistance to deflection that expresses the resistance to stress by the section modulus. By finding a cross section with the two equivalent factors, one ensures equal or better performance. The moment of inertia can be changed substantially by adding ribs and other shapes such as gussets as well as their combinations.
There are available basic engineering rib-design guidelines. The most general approach is to make the rib thickness at its base minimum to one-half the adjacent wall's thickness. With ribs opposite appearance areas, the width should be kept as thin as possible. In areas where structure is more important than appearance, or with very low shrinkage materials, ribs are often 75% or even 100% of the outside wall's thickness. A goal in rib design is to prevent the formation of a heavy mass of material that can result in a sink, void, distortion, long cycle time, or any combination of these problems.
Calculations for engineered proportions/locations of ribs and their cross-sectional shapes are available so that no additional plastic is used. Table 8.4 provides examples of different shapes, including fibbing, applicable to processing RPs.
Over designing with more plastics then required could promote high stresses affecting the parts loading capacity. Lengthy equations for the moment of inertia and for deflection and stress are normally required to determine the effect of ribs on stress. There are also nondimensional curves developed to allow quick determination of proper rib proportions and a corresponding program for a pocket calculator or computer will allow for obtaining greater precision when required.
Reinforced Foamed Plastic
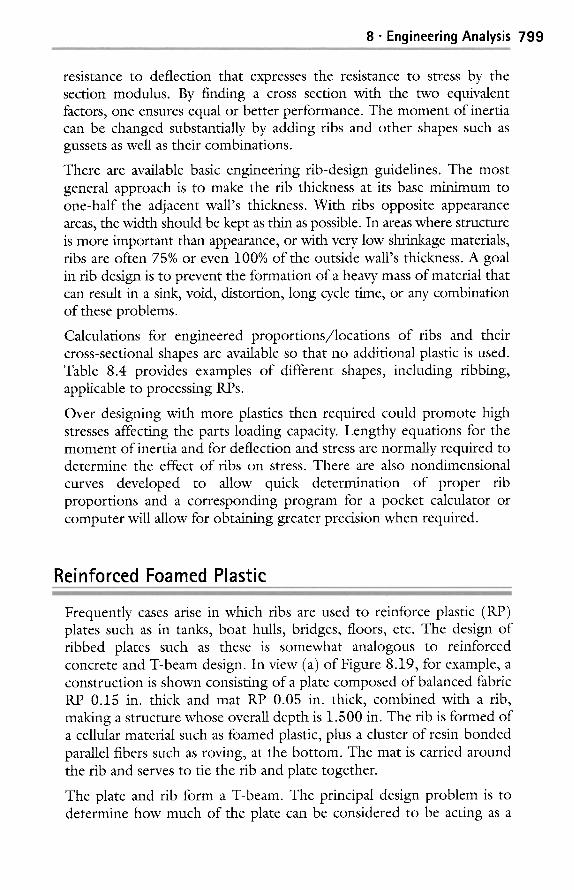
Frequently cases arise in which ribs are used to reinforce plastic (RP) plates such as in tanks, boat hulls, bridges, floors, etc. The design of ribbed plates such as these is somewhat analogous to reinforced concrete and T-beam design. In view (a) of Figure 8.19, for example, a construction is shown consisting of a plate composed of balanced fabric RP 0.15 in. thick and mat RP 0.05 in. thick, combined with a rib, making a structure whose overall depth is 1.500 in. The rib is formed of a cellular material such as foamed plastic, plus a cluster of resin-bonded parallel fibers such as roving, at the bottom. The mat is carried around the rib and serves to tie the rib and plate together.
The plate and rib form a T-beam. The principal design problem is to determine how much of the plate can be considered to be acting as a
8 0 0 Reinforced Plastics Handbook
0:!:r , . , p o - o I - - -
/ " l ! ~ ! fill,,
/Lo.eo'Jl 0.05 " - - ,1 I - -11 ~ 0.0.5"
r . ;o:___.1 o.,,,. (-) o , , , . ' * l ~ ~ " " /-" 2 3 3 o ~ , :;
�9 , J . . . . �9 , . , r
�9 _ . t ~ . . . . - | 1 .285 "-"'7_ ~ - ; , ~ ~ t | ,,I / , i 0.20" ^ . . / 1.on5"1 / I ~ i ~ 179
1 T - k O ' 5 .... . ..... _~ I ~ , J 1' / Strain ~ J 50.000 psi
(b) d;,,,;~.,io, s,,.. (c) d;slribution
A ! : 5 x 0.15 = 0.75 ;n. 2
E I = 3 x 10 6 psi A 2 = 4.2 x 0.05 = 0.21 in. 2
E 2 = 1 x 10 6 psi A:I = 0.2 x b.8 = 0 . 1 6 in. 2
E 3 = $ x 10 6 psi
0"! = 20 .000 psi (T 2 = 5,000 psi 0":3 = 50,000 Psi
F igure 8 . 1 9 C r o s s - s e c t i o n o f a r ib a p p l i e d t o a p l a t e
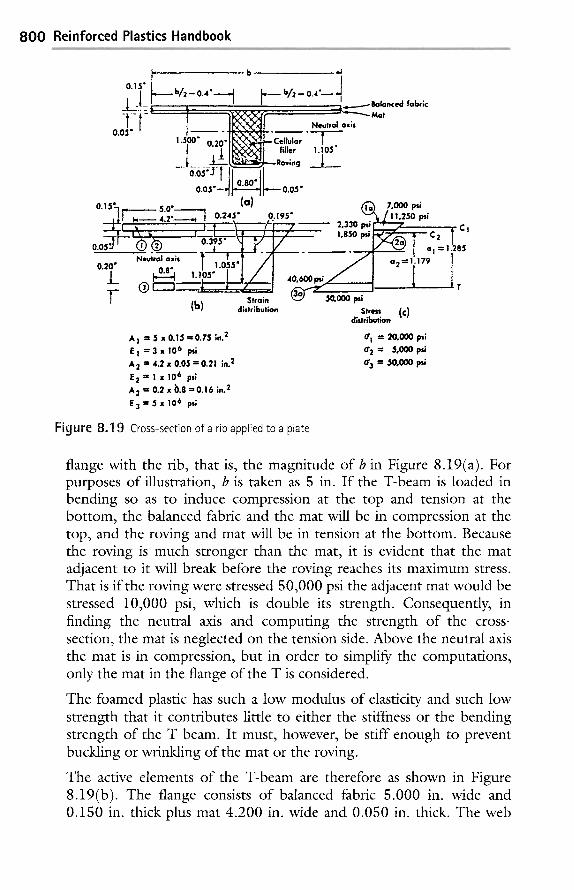
flange with the rib, that is, the magnitude of b in Figure 8.19(a). For purposes of illustration, b is taken as 5 in. If the T-beam is loaded in bending so as to induce compression at the top and tension at the bottom, the balanced fabric and the mat will be in compression at the top, and the roving and mat will be in tension at the bottom. Because the roving is much stronger than the mat, it is evident that the mat adjacent to it will break before the roving reaches its maximum stress. That is if the roving were stressed 50,000 psi the adjacent mat would be stressed 10,000 psi, which is double its strength. Consequently, in finding the neutral axis and computing the strength of the cross- section, the mat is neglected on the tension side. Above the neutral axis the mat is in compression, but in order to simplify the computations, only the mat in the flange of the T is considered.
The foamed plastic has such a low modulus of elasticity and such low strength that it contributes little to either the stiffness or the bending strength of the T beam. It must, however, be stiff enough to prevent buckling or wrinkling of the mat or the roving.
The active elements of the T-beam are therefore as shown in Figure 8.19(b). The flange consists of balanced fabric 5.000 in. wide and 0.150 in. thick plus mat 4.200 in. wide and 0.050 in. thick. The web
8 �9 Engineer ing Analysis 8 0 1
consists of the bundle of roving 0.800 in. wide and 0.200 in. thick. By the application of the appropriate equation, the neutral axis is found to be 1.105 in. from the bottom, or 1.055 in. above the lower edge of the roving.
The basic assumptions discussed in the introduction imply that when this beam is bent, strains at any point in both tension and compression are proportional to the distance from the neutral axis, and that stress is equal to strain multiplied by modulus of elasticity. If, for example, the stress in the lower-most roving fiber is 50,000 psi, the stress in the top- most fiber of the flange is 11,250 psi. Similarly, the stresses in the upper edge of the bundle of rovings, at the lower edge of the balanced fabric, and at the upper and lower edges of the balanced fabric, and at the upper and lower edges of the mat in the flange are as shown in Figure 8.19(c). These are all less than the corresponding values of c% ~2, and ~3 listed.
The internal resisting moment, or resistance to outside bending forces, can be found by computing the total resultant compression C1 in the balanced fabric, total resultant compression C2 in the mat, finding the distances 12/1 and/2/2 between the lines of action of these two resultants and the line of action of the total resultant tension T in the roving, computing the values C1/2/1 and C2lZ12, and adding.
Resultant C1 acts at the centroid of the trapezoidal stress area la, resultant C2 at the centroid of area 2a, and resultant T at the centroid of area 3a. Solving for these centroids, the distance /5/1 is found to be 1.285 in. and distance 12/2 is 1.179 in. These are the internal moment arms of the two resultant compressive forces C1 and C2.
C 1 = [(11250 + 7000) /2 ] [5 .000 x 0.150] = 6840 Ib
C2 = [(2330 + 1850) /2 ] [4 .200 x 0.05] = 440 Ib
Total C = 7280
A check on the accuracy of the computations is afforded by the fact that Tmust equal C.
T = [(40,600 + 50,000)12][0.800 x 0.200] = 7250 Ib
The initial resisting moment is Cll211 + C2~2:
Cl1~ 1 = 6840 x 1.285 = 8790 in-lb C 2 0 2 = 440 x 1.179 = 520
Mres = 9310 in- lb
Evidently, if the mat in the flange had been left out of the computation (C2E12), the error in the calculated result would have been approximately 5 percent. Omitting the mat in the rib between the flange and the neutral axis affected the result much less.
8 0 2 Reinforced Plastics Handbook
If a shear force is imposed on the rib, two critical planes of internal shear stress occur, one at the neutral axis and one at the plane between the mat and the fabric in the flange. Shear stresses are computed,
Q! -~.=
bEI
For example, suppose the T-beam is 30 in. long (L) and carries a uniformly distributed load W. Then M = wL/8 = 9310 in-lb and 147= 2500 lb. The maximum shear Vis half the total load or 1250 lb.
At the neutral axis the statistical moment Q ' is the weighted moment of the flange or of the roving about the neutral axis; El, is the stiffness factor of flange plus roving; and b is the total thickness of the mat at the neutral axis plus the effective thickness of the cellular filler. This effective thickness may be computed in accordance with the principles set forth on combined action. If, for example, the shear modulus of the cellular core is i/is the shear modulus of the mat-reinforced material, the effective width of the core is 0 .8 /15 or 0.053 in. The total effective width of the mat and the care at the neutral axis is therefore 0.05 + 0.05 + 0.053 = 0 .1 53 in.
The computed value of Q ' is 0.725 x 10⁶ lb-in, and the value of El is 0.968 x 10⁶ psi. The shear stress intensity in the mat at the neutral axis is:
1250 x 0.725 ~rm = = 6100 psi
0.153 x 0.968
The shear stress in tens i ty in the cel lu lar core is
Tc = 6100/15 = 410 psi
If either ~7~ or T~ is excessive it is necessary to increase the rib thickness at the neutral axis, probably by increasing the thickness of the mat.
Properties of the cellular core may not be known well enough or may be too low to warrant inclusion with the mat in calculating shear. If the core is not included, the thiclcness at the neutral axis is that of the mat alone, or 0.10 in. The shear stress Vm then becomes 9400 psi instead of 6100 psi.
At the interface between mat and fabric in the flange of the T-beam, the value of Q" is that of the fabric alone. This is found to be 0.720 x 10⁶ psi. The width b is 4.2 in. (neglecting the width of the cellular core). Therefore:
1250 x 0.720 ~: = = 220 psi
4.2 x 0.968
8 �9 Engineering Analysis 8 0 3
In all probability the shear stress intensity is actually higher adjacent to the rib, and lower near the outer ends of the flange, but in any event it is not likely to be excessive.
Cylinders and Ribs
Plastics provides an easy fabricating means to producing cylindrical monocoque constructions without and with ribs such as has been done in different applications that include toys and pipes to automotive bodies, motor trucks, railroad cars, aircraft fuselages and wings, and houses. Its construction is one in which the outer coveting "skin" carries all or a major part of the stresses. The structure can integrate its body and chassis into a single structure. Unreinforced and /o r RPs are used. Consider a cylinder (pipe) of inside radius r, outside radius R, and length L containing a fluid under pressure p. The circumferential or hoopwise load in the wall (t = thickness) is proportional to the pressure times radius = pr, and the hoop stress:
fh = h o o p w i s e load /c ross sec t i ona l area = pr/t or = pd/2t
similarly, the longitudinal stress:
fl = pd/4t
assuming Jr ( R 2 - r 2) - 27Jrrt for a thin-walled tube.
This condition of the hoop stress being twice the longitudinal stress is normal for a cylinder under internal pressure forces only. The load in pounds acts on the tube at a distance from one end and a bending moment M is introduced. This produces a bending stress in the wall of the cylinder of:
f6= My/I
where y = R and I= moment of inertia. For a cylinder with outside diameter (D) and inside diameter (d):
l= ~ (04- d4)/64 in. 4
This stress must then be considered in addition to the longitudinal stress already presented because of internal pressure. If the end closures are in the form of flat plates, bending stresses due to the internal pressure are introduced as:
Fb = 1.25 (pr2/tf)
where te = thickness of end.
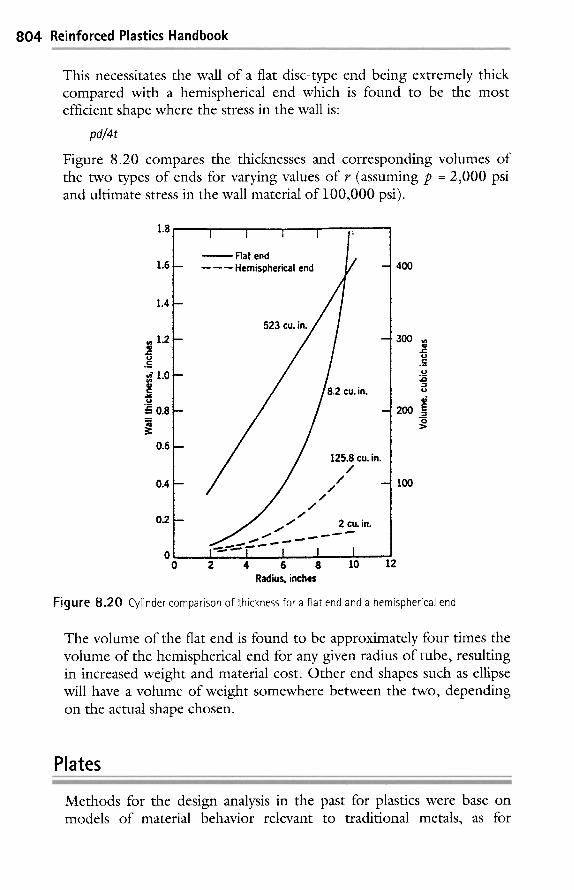
804 Reinforced Plastics Handbook
This necessitates the wall of a flat disc-type end being extremely thick compared with a hemispherical end which is found to be the most efficient shape where the stress in the wall is"
pd/4t
Figure 8.20 compares the thicknesses and corresponding volumes of the two types of ends for varying values of r (assuming p = 2,000 psi and ultimate stress in the wall material of 100,000 psi).
1.8
1.6
1.4
~, 1.2 . c u .c_.
1.0 c
.u_ N 0.8
0.6
0.4
0.2
, Flat end - - - - - - Hemispherical end
523 cu. in.
8.2 cu. in.
125.8 cu. in. /
/ /
/ /
/ 2 cu. in.
0 2 4 6 8 10 12 Radius, inches
400
300 . c u c
.u
. o
u
2OO E
I00
F igure 8 . 2 0 Cylinder comparison of thickness for a flat end and a hemispherical end
The volume of the flat end is found to be approximately four times the volume of the hemispherical end for any given radius of tube, resulting in increased weight and material cost. Other end shapes such as ellipse will have a volume of weight somewhere between the two, depending on the actual shape chosen.
Plates
Methods for the design analysis in the past for plastics were base on models of material behavior relevant to traditional metals, as for
8 �9 Engineering Analysis 8 0 5
example elasticity and plastic yield. These principles were embodied in design formulas, design sheets and charts, and in the modern tech- niques such as those of computer-aided designs (CAD) using finite element analysis (FEA). Design analyst was required only to supply appropriate elastic or plastic constants for the material, and not question the validity of the design methods. Traditional design analysis is thus based on accepted methods and familiar materials, and as a result many designers have little, if any, experience with such other materials as plastics (URPs or RPs), wood, and glass.
Using this approach it is both tempting and common practice for certain designers to treat plastics as though they were traditional materials such as steel and to apply familiar design methods with what seem appropriate materials constants. It must be admitted that this prag- matic approach does often yield acceptable results. However, it should also be recognized that the mechanical characteristics of plastics are different from those of metals, and the validity of this pragmatic approach is often fortuitous and usually uncertain.
It would be more acceptable for the design analysis to be based on methods developed specifically for the materials, but this action will require the designer of metals to accept new ideas. Obviously, this acceptance becomes easier to the degree that the newer methods are presented as far as possible in the form of limitations or modifications to the existing methods discussed in this book. Table 8.5 provides examples of formulas for flat plates.
In this table all dimensions are in inches and all logarithms are to the base e (log~ x = 2.3026 lOgl0 x). Symbols are identified as follows-W = total applied load, lb; w = unit applied load, psi; t = thickness of plate, in.; o = stress at plate surface, psi; y = vertical deflection of plate from original position, in.; E = modulus of elasticity, psi; m = reciprocal of Poisson's ratio; g = any given point on the surface of plate; r = distance of q from the center of a circular plate. Positive sign for o refers to tension at upper surface and equal compression at lower surface; negative o is the reverse condition. Positive sign for y concerns upward deflection, negative y is downward deflection, Subscripts r, t, a, and b for o refer to radial direction, tangential direction, dimension direction (a), and dimensional direction (b), respectively.
Based on the usual data on metals, they are much stiffer and stronger than plastics. This initial evaluation could eliminate the use of plastics in many potential applications, but in practice it is recognized by those familiar with the behavior of plastics that it is the stiffness and strength of the product that is important, not its material properties.
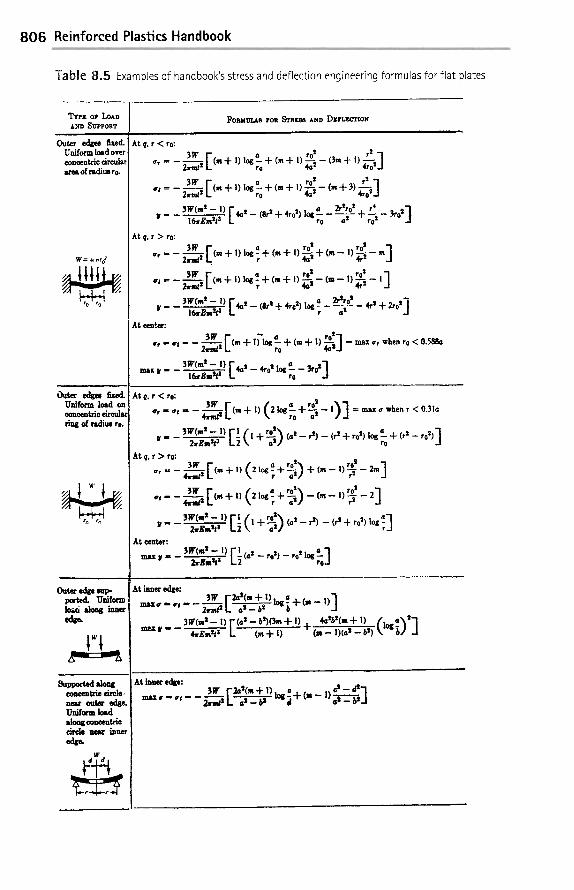
806 Reinforced Plastics Handbook
Table 8,5 Examples of handbook's stress and deflection engineering formulas for flat plates
~'~rlf~ll OF LOAD
&~D SUPPORT , ,,,
Outer edges flied. Uniform load over eoncentric circular arm of radius ro.
W - u.wr /
Uniform load on oo~me~fzi�9 circular r i ~ of radius ro.
ra r e
ported. Uniform
eden.
concenirio ~ , l e - near outer edge. Uniform k i d i l o i i concentric cirde heir inner ed~
FORMULAS FOR 8TRF..88 AND D,qn,zenoN
At q, r < ro:
[ - , ' ] 3W a + ( r e + l ) r~ ( 3 r e + l )
,IV [ ( = . l . i ) lo a + ( m + l ) ro' r ' ] cri --" -- ~ r~ ~ -- ( - "1- 3) 4---to z
E *' l ~lW(m I - I) k i (8r I + 4to l) log a _ 2rZro z + . _ _ 3rol i 16rEtail " - ' ' ' ' - ' T " -- ro a ~ ro i
At q, r > re:
,W E a ro' to' ] " , = - ~ - ~ i (m+l) l ~ - + ( m § 2 4 7 i - m r
,w E ,o' ro' ] u l - - - ~ - ~ ( m + l ) l e g - a + ( m 4 - 1 ) ~ ' i - - ( m - - I ) ~ - ~ - I r
[ , - _ 2r~ro i ,it I + ~01J 3W(m i I ) ~ i (&r t 4- 41"o l) leg a a i i - - - i &rlm~ l
At center:
3W r (m r~ rr " or/-- -- ~ L 4- l)'log o_.. 4 . (m 4- I) -- max ~r when ro < 0.588a ro ~d
3W(m s - !) _ ~o t ] max llt = -- 16rSm~ ~ E ~ l -- 4ro i log a
ro
At l , r < ro: , , [ ( ,o, )] rr=~i=--~ (re+l) 21Og--ro4--~--I =maxawhenr<O.3la
3.(.'-2.,.~, 1) L. ' ( I roi~a./ log a_ r o ' ) ] - F~ + - ~ . (a i - r l) - ( rl + re l) + ( ri - I I l l re
At q, r > re:
_ _ 3w ( 2 ~ 7 ~ i / + ( " - i ) - ~ - ., ~ [ ( . + ,) = +,o'~ ,o' ~ . ]
r~ r~ 2] " - ~ L ( m + i ) - ( m - I ) - ff i
, . _ ,,<., -,.,.~_.____~,> [ ~' ( , + -~'~ <o, _ ,,, _ <,, + ,o,, ,o, ;] At center:
3 w ( m i -- I) [ ~ (ai - r~ - r~ l~ . "l
~At inner edge: a 3w [.~2(=+ t) tog ~ +(m - t)]
[ ~l~'('+') ( ; ) ' ] 3W(~ s - I) (a 2 - bt)(3m + I) + l~i Y ' - - ~rEmil I - ( r e + l ) (m- - I ) ( a i - b l)
*M inner ed~: - - ' - - - , -
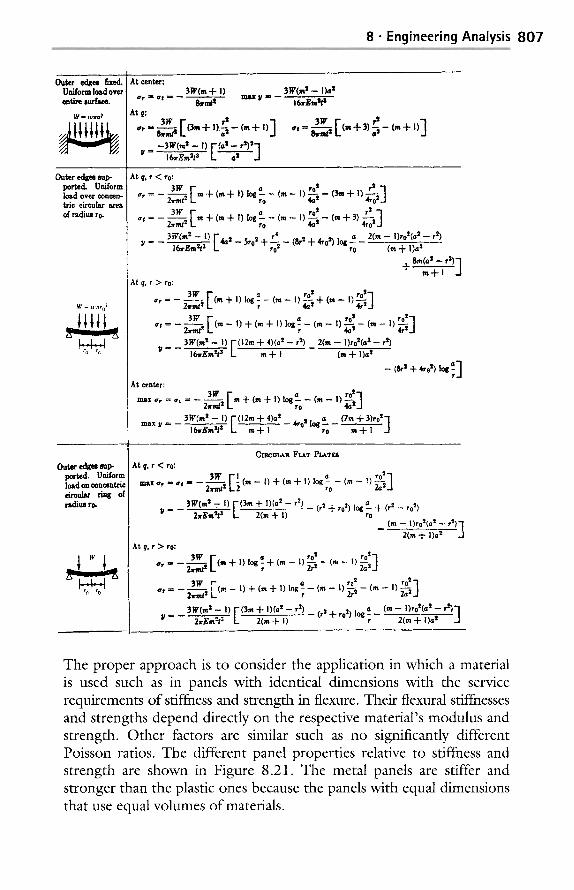
8 �9 Engineering Analysis 8 0 7
Outer edges tixecl. Uniform load over entire eurfae~
W = wwa ~
Outer edges sup ~ r t e & Uniform load over concen- tric circular area of radius ro.
W = wnr0J
r(~ r o
Outer edges s u p ported. Uniform load on concentric cireulsr r i ~ of radius to.
%
At center: 3W(m + I)
Or = fit =' - - 8z . l~ t max It " - -
At g:
3w E O m + l ) ~ _ ( m + n ) ] fit" " ~ - ~
- 3 W ( m t - 1) I-(a 2 - r")= -]
;I = 16,rEmtt ' ' ' ' - - ' ' - - - ~ - - L a'" J
3W(m s - - l )a I
I&rBmSt I
3w E<,,,+$) ~_ c,,, + i) ]
At q, r < r0:
3W E a to ' r ' ~ ~r = -- ~ m -[- (m -!- I) log ro-- -- (m -- I) ~-~ -- (3m -l- I)
3 w E a to ' r ' 3 . , = - ~ m + (m + 1) log-to - (m - I) ~-~ - (m + 3) 4-ro ~
r ' a 2(m -- I)ro2(a * -- r ~) 3W(m ~ -- i) 4a ~ -- 5to ~ -I- --- -- (Sr ~ ~- 4to 2) log -- -- It = - I~rEm~t - ' - ' ' - - T " ro t ro (m + I)a ~
8m(a= - r t) "]
At q, r > ro: 3W [ a ro t ro 2"]
<,r - - ~--x~ i (m -t- I) log- r - (m - !) ~a- i + (m - I) ~-~ . j
3iV [ a ro t ro 2-] a t - - - - ~ ( m - - l ) - I - ( m - t - I ) l o g - r - - ( m - - I ) ~ - - ( m - - I )~r=. j
3W(m 2 - l) E(12m -F 4)(a= - r t) 2(m - I)ro=(a= - r 2) I t - - - I&rEm2t " - - - - - - T -m-+ i - - ( m - I - l)a t
-- (Srt + 4ret) log a ]
At center: 3W E rot ' ] m a x . , = . , = - ~ - ~ m + (m + I) log a_ _ (m - 1) ~ - t j
ro
3]V(m t - !)E(12~n 4-4)a t a__ . - ( 7 . : + 3)ro t ' ] max It ffi -- 16~rEmtt ' ' - - - - ' - - F - - - t - ] -- 4to: log re m -t- 1 _!
CxP.cox~R F ~ T P~Tr.s At q, r < r0:
~ r [ ~ a ( m _ | ) r 0 ' ] max ~ ffi ~, - - ~ (m - l) + (~ + ,) log ~o
3W(m 2 - I) [ ( 3 m + I)(a 2 - r ~) _ (r ~ + ro~) log a + (r= - ro 2) ~ ' - - 2 z E m ~ " - - ' ' - ' ' ~ ' - 2(m + I) ro
(m -- i)ro2(a 2 -- r 2) 1 2(m -~" I)a 2 .]
At q, �9 > ro: 3W [ �9 ro ~ ro 2-]
r ( m - l - I ) l o g - - ] - - ( m - - r I ) 2r2 - - (m - - I) ~ - ~ . j
3W [ a ro 2 ro 2"] f i ! - - - - ~ - ~ ( m - - l ) - ~ - ( m - J - I ) | o g - - - ( m - - r I ) ~ - - ( m - - I) ~--~j
3 ~ ( . ' - ,) [ o . + , ) c . ' - . ' ) _ , . , + . o . ) , o ~ ~ ( - - , ) . o ' ( . ' - ~] 11 = " - 2rEm=t'~'-"-" ~ ~ ' n ~ "1) r -- 2(m -t- I)a s
The proper approach is to consider the application in which a material is used such as in panels with identical dimensions with the service requirements of stiffness and strength in flexure. Their flexural stiffnesses and strengths depend directly on the respective material's modulus and strength. Other factors arc similar such as no significantly different Poisson ratios. The different panel properties relative to stiffness and strength arc shown in Figure 8.21. The metal panels arc stiffer and stronger than the plastic ones because the panels with equal dimensions that use equal volumes of materials.
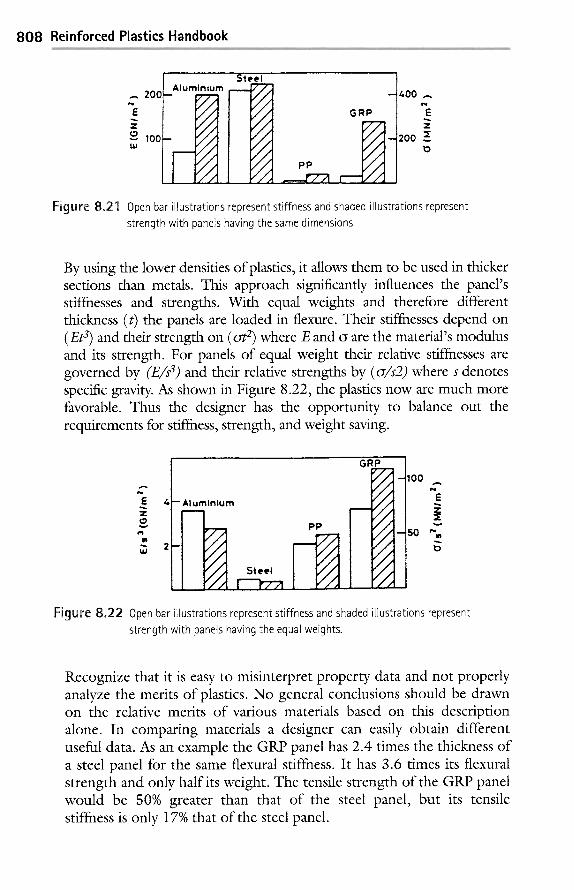
8 0 8 Reinforced Plastics Handbook
A 200 e,e
E z
o 100 LIJ
Steel Aiuminium r ~ ~
I ~ GRP 400
eq
E z
2oo ~_
Figure 8.21 Open bar illustrations represent stiffness and shaded illustrations represent strength with panels having the same dimensions
By using the lower densities of plastics, it allows them to be used in thicker sections than metals. This approach significantly influences the panel's stiffnesses and strengths. With equal weights and therefore different thickness (t) the panels are loaded in flexure. Their stiffnesses depend on (Et 3) and their strength on (o~ 2) where E and o are the material's modulus and its strength. For panels of equal weight their relative stiffnesses are governed by (E/s s) and their relative strengths by (c~/s2) where s denotes specific gravity. As shown in Figure 8.22, the plastics now are much more favorable. Thus the designer has the opportunity to balance out the requirements for stiffness, strength, and weight saving.
e,q E 4 z O v
WI
,,'n 2
GRP
-- A|urntnlum . ~ ~
PP
lOO e,t
E
50 ~ '
Figure 8.22 Open bar illustrations represent stiffness and shaded illustrations represent strength with panels having the equal weights.
Recognize that it is easy to misinterpret property data and not properly analyze the merits of plastics. No general conclusions should be drawn on the relative merits of various materials based on this description alone. In comparing materials a designer can easily obtain different useful data. As an example the GRP panel has 2.4 times the thickness of a steel panel for the same flexural stiffness. It has 3.6 times its flexural strength and only half its weight. The tensile strength of the GRP panel would be 50% greater than that of the steel panel, but its tensile stiffness is only 17% that of the steel panel.
8 �9 Engineering Analysis 8 0 9
Similar remarks could be made with respect to various materials' costs and energy contents, which can also be specified per unit of volume or weight. General statements about energy content or cost per unit of stiffness or strength, as well as other factors, should be treated with caution and applied only where relevant. If these factors are to be treated properly, they too must relate to final product values that include the method of fabrication, expected lifetime, repair record, and in-service use.
RP Isotropic Plates
Fibrous reinforced plates, flat or curved, is commonly made with mat, fabrics, and parallel filaments, either alone or in combination. Mat is usually used for good strength at minimum cost, fabrics for high strength, and parallel filaments for maximum strength in some particular direction.
Because the fibers in mat are randomly oriented, mat-reinforced materials have essentially the same strength and elastic properties in all directions in the plane of the plate, that is, they are essentially isotropic in the plane. Consequently, the usual engineering theories and design methods employed for isotropic engineering materials may be applied. It is only necessary to know strength, modulus of elasticity, shearing modulus, and Poisson's ratio of the combined mat and resin. These can be obtained from standard stress-strain measurements made on specimens of the particular combination of fiber and plastic under consideration.
RP Non-lsotropic Plates
In fabric and roving-reinforced materials, the strength and elastic prop- erties are different in different directions; they are not isotropic. The usually engineering equations must be modified, because fabrics are woven with yams at right angles (warp and fill directions), a single layer of fabric has two major directions that are longitudinal (warp) and transverse (fill) at right angles to each other. This orthotropic structure can also be called aeolotropic (fight-angled directions). Parallel strands of fiber, as in a single layer of roving or unidirectional plates, are also orthotropic with the two principle axes at right-angles. Multi-layer plates, in which layers of fabric or of rovings are laid-up parallel or perpendicular to each other are also orthotropic. If the same number of strands or yams is found in each principal direction (balanced construction), the strength and elastic properties are the same in those directions but not at the intermediate angles. If they are different in the
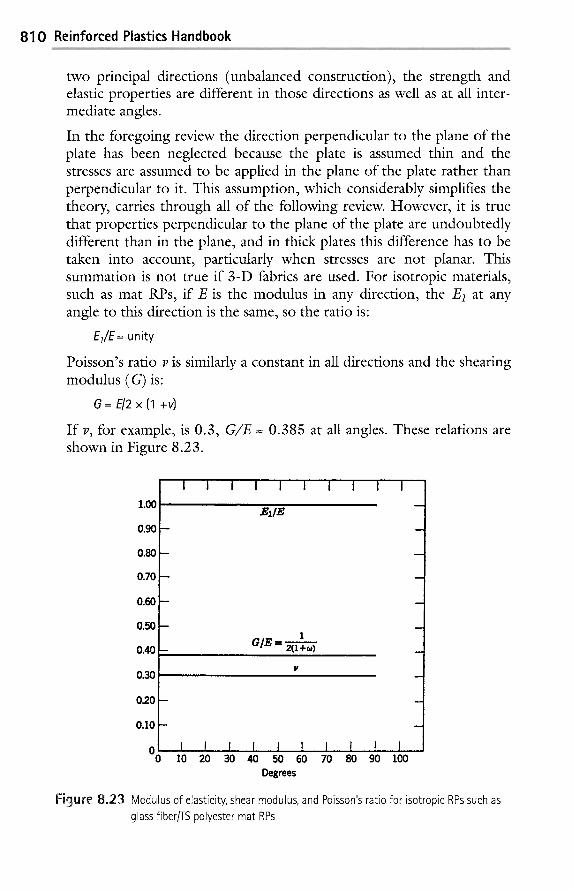
8 1 0 Re in forced Plastics H a n d b o o k
two principal directions (unbalanced construction), the strength and elastic properties are different in those directions as well as at all inter- mediate angles.
In the foregoing review the direction perpendicular to the plane of the plate has been neglected because the plate is assumed thin and the stresses are assumed to be applied in the plane of the plate rather than perpendicular to it. This assumption, which considerably simplifies the theory, carries through all of the following review. However, it is true that properties perpendicular to the plane of the plate are undoubtedly different than in the plane, and in thick plates this difference has to be taken into account, particularly when stresses are not planar. This summation is not true if 3-D fabrics are used. For isotropic materials, such as mat RPs, if E is the modulus in any direction, the E1 at any angle to this direction is the same, so the ratio is:
El~E= unity
Poisson's ratio v is similarly a constant in all directions and the shearing modulus (G) is:
G= EI 2 x (1 +v)
If v, for example, is 0.3, G/E = 0.385 at all angles. These relations are shown in Figure 8.23.
1.00
0 .90 - -
0 . 8 0 - -
0 .70 - -
0 . 6 0 - -
0 .50 -
0 . 4 0 -
0 .30
0 .20 -
0 .10 -
0 0
,,, , ,
I I I I i I I I I I
1 G/E = 2 (1+u ) '
I t
I I I I I , ! I ! ! ! 10 20 30 40 50 60 70 80 90 100
Degrees
Figure 8~ Modulus of elasticity, shear modulus, and Poisson's ratio for isotropic RPs such as glass fiber/TS polyester mat RPs
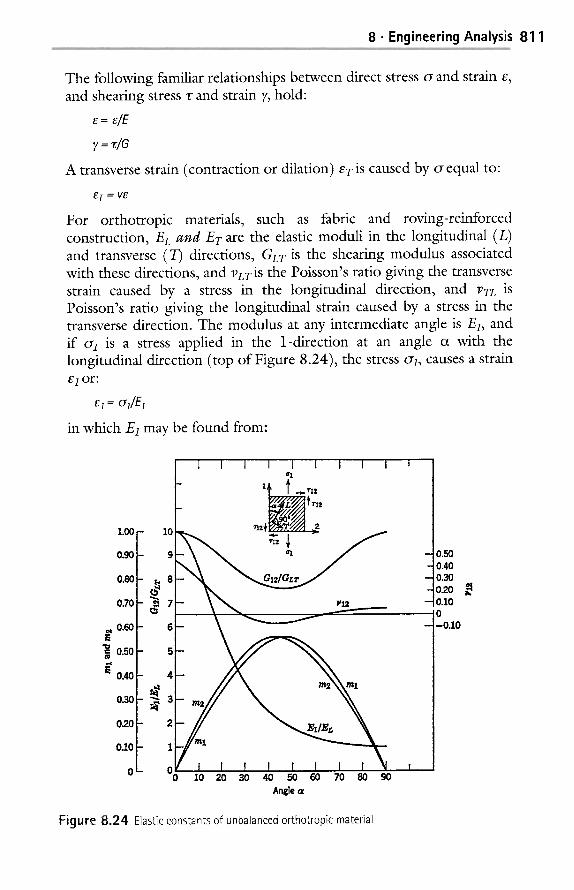
8 �9 Engineering Analysis 81 1
The following familiar relationships between direct stress c~ and strain e, and shearing stress 1: and strain ),, hold:
e = e/E
}' = "dG
A transverse strain (contraction or dilation) sT is caused by o equal to"
's = VE
For orthotropic materials, such as fabric and roving-reinforced construction, EL anti ET are the elastic moduli in the longitudinal (L) and transverse (T) directions, GLT is the shearing modulus associated with these directions, and VLTiS the Poisson's ratio giving the transverse strain caused by a stress in the longitudinal direction, and VTL is Poisson's ratio giving the longitudinal strain caused by a stress in the transverse direction. The modulus at any intermediate angle is El, and if a/ is a stress applied in the 1-direction at an angle c~ with the longitudinal direction (top of Figure 8.24), the stress ~1, causes a strain el or:
81 = CT1/EI
in which E1 may be found from:
1.00
0.90
0.80
0.70
0.60
"U
= 0.50 M
i~ 0.40
0.30
0.20
0.1o
o
I I I I I ,r~ I I I I
! Angle a
- 0.50 - 0.40
- 0.30 - 0.20
- 0 . 1 0 :0
- -0.10
Figure 8.24 Elastic constants of unbalanced orthotropic material
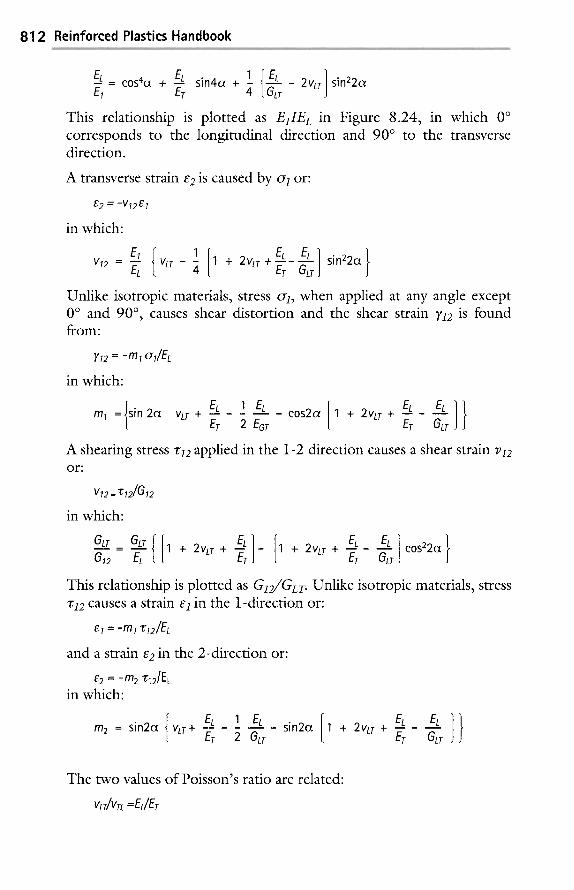
812 Reinforced Plastics Handbook
EL EL 1 _--= cos4ot + --_ sin4a + -
E7 ET 4 E L _ 2 VLT GLT
sin22a
This relationship is plotted as E]IEL in Figure 8.24, in which 0 ~ corresponds to the longitudinal direction and 90 ~ to the transverse direction.
A transverse strain e2 is caused by c~] or:
E, 2 = -V12E 1
in which:
EL EL 1 + 2Vtr + ~ - GL'~T sin22~ }
Unlike isotropic materials, stress c~], when applied at any angle except 0 ~ and 90 ~ causes shear distortion and the shear strain }'12 is found from"
~/12 = -m l (Yl/EL
in which:
=Isin2cz VLT + EL 1 EL ml [ ET 2 EGT cos2ot 1 + 2VLT+
EL EL ET GLT
A shearing stress ~r]2 applied in the 1-2 direction causes a shear strain v]2 or:
V12 = "E12/G 12
in which:
GL._.[. T = GLT G72 EL [
EL 1 + 2VLT+---~T [1 + 2VLT + EL EL [ ET GLT
COS22~ }
This relationship is plot ted as G]2/'GLT. Unlike isotropic materials, stress "g12 causes a strain e] in the 1-direction or:
S 1 = -m 1 "E12/EL
and a strain e2 in the 2-direction or:
e2 =-m2 v~2/EL in which"
f EL I m 2 = sin2(~ ~ VLT+ [ ET 2 GLT
sin2cz 1 + 2VLT+ EL ET GLr
The two values of Poisson's ratio are related:
VLT/VTL =EJET
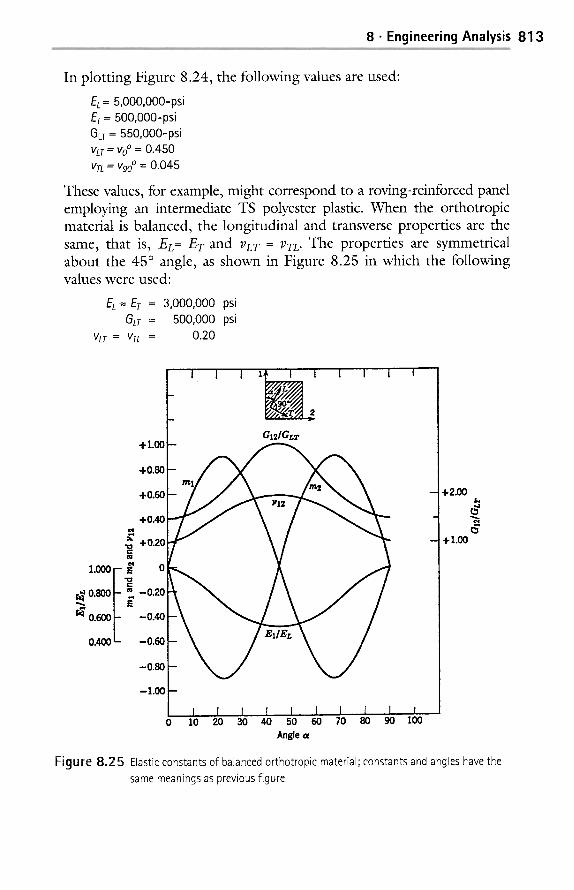
8 �9 Engineer ing Analysis 8 1 3
In plotting Figure 8.24, the following values are used:
EL = 5,000,O00-psi Er- 500,O00-psi GET = 550,O00-psi VLT = VO ~ = 0 .450
VTL -- V90 ~ = 0 . 0 4 5
These values, for example, might correspond to a roving-reinforced panel employing an intermediate TS polyester plastic. When the orthotropic material is balanced, the longitudinal and transverse properties are the same, that is, EL= Er and vLr = vT~. The properties are symmetrical about the 45 ~ angle, as shown in Figure 8.25 in which the following values were used:
EL = Er = 3,000,000 psi GLr = 500,000 psi
VLT = VTL = 0 . 2 0
I I I I ~ I I I I I
OlzlOLr
+0"80 F m
F
y, --0.20 / \ / /
f f o.600 -o.40
0.400 -0.60
-0.80
-1.00 ~-
0 I ! ! ! ! I ,! ! , ! I
10 20 30 40 50 60 70 80 90 100 Angle a
+2.00
+ 1.00
I,,
Figure 8.25 Elastic constants of balanced orthotropic material" constants and angles have the same meanings as previous figure
814 Reinforced Plastics Handbook
These values might correspond, for example, to a square-weave or symmetrical satin-weave fabric-reinforced construction. As an example in the application of the foregoing equations, the tensile stress ~/, acting on the small plate at the top is 10,000 psi, the shear stress x12 is 4000 psi, and the angle ~ is 30 ~ Then from Figure 8.25:
ET/E L = 0.367, or E~ = 0.367 x 5 ,000,000 = 1,830,000 psi
G72/GLT = 0.81, or G12 = 0.81 x 550,000 = 445,000 psi
v72 = -0 .0286 m~ = 4.66 m 2 = 4.98
Then strains caused by c~] are:
e7 = 0 ,000/1 ,830,000 = 5.45 x 10³
E' 2 = - ( - 0 .0286) 5.45 x 10 -3 = 0.16 x 10 -3
v72 = -4 .66 x 10,000/5 ,000,000 = -9.32 x 10 -3
and strains caused by "r]2 are:
v72 = 4,000/550,000 = 7.28 x 10 -3 e7 = -4 .66 x 4 ,000 /5 ,000 ,000 = -3.73 x 10 -3
E' 2 - - ' - - 4 .98 x 4 ,000 /5 ,000,000 = -3 .98 x 10 -3
Total strains, therefore, are:
V12 - - - 2 . 04 x 10 -3
e7 = 1.72 x 10 -3
~e 2 " - 3.82 x 10 -3
Problems involving Figure 8 . 2 5 can be resolved in an analogous manner. It must be kept in mind that equations are valid and useful if the fibers and plastics behave together in accordance with the assumptions upon which their derivation is based. If only the values of EI, ET, G~T, and vLT are available, the intermediate values of Eb G~2, v]2, and the values of m] and m2 can be estimated by means of these equations.
Hybrid RP Plates
Fibrous reinforced plates in practice are often made up of several layers, and the individual layers may be of different construction, such as mat, fabric, or roving. Furthermore, the various layers may be oriented at different angles with respect to each other in order to provide the best combination to resist some particular loading condition. Outside loads or stresses applied to a RP plate of this type result in internal stresses that are different in the individual layers. External direct stresses may result not only in internal direct stresses but in internal shear stresses and external shear stresses may result in internal direct stresses as well as internal shear stresses.
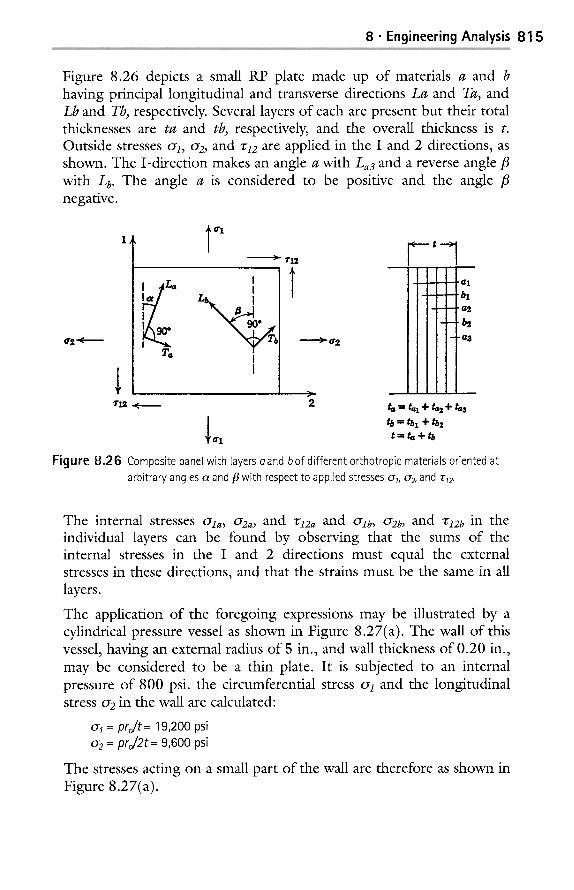
8 �9 Engineering Analysis 81 5
Figure 8.26 depicts a small RP plate made up of materials a and b having principal longitudinal and transverse directions L a and Ta, and Lb and Tb, respectively. Several layers of each are present but their total thicknesses are ta and tb, respectively, and the overall thickness is t. Outside stresses ~1, ~2, and T12 are applied in the I and 2 directions, as shown. The I-direction makes an angle a with La3 and a reverse angle/3 with Lb. The angle a is considered to be positive and the angle /3 negative.
r
1 0"1
!
T . I I
>~ T12
>o'2
~, t - - >
l l l l f i l l
I11i 2 ~ = ta~ + t,, 2 + t.3
tb = tb~ + tb2
0"1 t - - ta + tb
a l
bx a2
, i I 3
Figure 8.26 Composite panel with layers aand bof different orthotropic materials oriented at arbitrary angles a and ,6 with respect to applied stresses ~r 7, 6r 2, and ~:72.
The internal stresses CTla , CT2a , and "u12 a and cqo, o2b, and T12b in the individual layers can be found by observing that the sums of the internal stresses in the I and 2 directions must equal the external stresses in these directions, and that the strains must be the same in all layers.
The application of the foregoing expressions may be illustrated by a cylindrical pressure vessel as shown in Figure 8.27(a). The wall of this vessel, having an external radius of 5 in., and wall thickness of 0.20 in., may be considered to be a thin plate. It is subjected to an internal pressure of 800 psi. the circumferential stress ~1 and the longitudinal stress c~2 in the wall are calculated:
c~7 = pro/ t = 19,200 psi c~2 = p r o / 2 t = 9,600 psi
The stresses acting on a small part of the wall are therefore as shown in Figure 8.27(a).
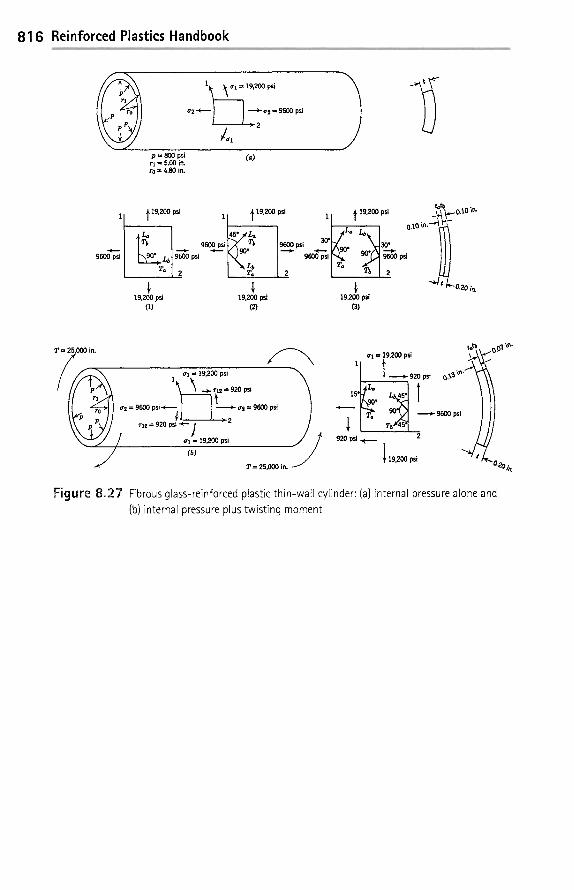
816 Reinforced Plastics Handbook
1 (rl - 19 200 psi
p = 800 psi rt = 5.00 in. ro = 4.80 in.
(.)
t 19,200 psi
t 19,200 psi
(1)
tatb
'1 t ' '~176 ' L / t '"'~176 " ,. . . . . . . o l o ; . . ~
9600 psi psi 30"
"-->" "<'-" " " 90" 9600 9600 psi ps, 0 20
1 1 ,o. 19,200 psi 19,200 psi
(2) (3)
T = 25.000 in. . ~
1 r = 19,200 psi . . . . . . . . .
9 = 9600 psi-<--- J J > (r~ = 9600 psi
r12 = 920 psi ] " P
r = 19,200 psi .
(b)
T = 25,000 in.
r = 19,200 psi t : ~ ~'0"01 \~"
920 psi ~ 2
~ 19,200 psi " ~ / ' L 0 . 2 0 i ~ "
F igure 8.27 Fibrous glass-reinforced plastic thin-wall cylinder" (a) internal pressure alone and (b) internal pressure plus twisting moment