regulatory reform for services of general...
TRANSCRIPT
Coordinating for Cohesion in the Public Sector of the Future – www.cocops.eu
REGULATORY REFORM FOR SERVICES OF
GENERAL INTEREST AND TRENDS IN
CITIZEN SATISFACTION
COCOPS WORK PACKAGE 1 – DELIVERABLE 4.1
Judith Clifton
Daniel Diaz Fuentes
Marcos Fernandez Gutierrez
Oliver James
Sebastian Jilke
Steven Van de Walle
1 March 2012

2
COCOPS Deliverable 4.1
© COCOPS 2011
About COCOPS
The COCOPS project (Coordinating for Cohesion in the Public Sector of the Future) seeks to
comparatively and quantitatively assess the impact of New Public Management-style reforms
in European countries, drawing on a team of European public administration scholars from 11
universities in 10 countries. It will analyse the impact of reforms in public management and
public services that address citizens’ service needs and social cohesion in Europe. It is funded
under the European Commission’s 7th Framework Programme as a Small or Medium-Scale
Focused Research Project (2011-2014).
About the Authors
Judith Clifton is Professor of Applied Economics at the University of Cantabria, Spain
Daniel Díaz-Fuentes is Professor of Applied Economics at the University of Cantabria, Spain
Marcos Fernández-Gutiérrez is Assistant Professor of Applied Economics at the University of
Cantabria, Spain
Oliver James is Professor of Political Science at the University of Exeter, UK
Sebastian Jilke is junior researcher at Erasmus University Rotterdam, The Netherlands
Steven Van de Walle is Professor of Comparative Public Administration at Erasmus
University Rotterdam, The Netherlands
The research leading to these results has received funding from the European Community’s
Seventh Framework Programme under grant agreement No. 266887 (Project COCOPS),
Socio-economic Sciences & Humanities
ISSN 2211-2006

3
COCOPS Deliverable 4.1
REGULATORY REFORM FOR SERVICES OF GENERAL INTEREST AND TRENDS IN
CITIZEN SATISFACTION
Abstract
In the European Union (EU), as in most of the developed and also developing world, reforms
and particularly liberalization of public services were introduced during the last decades,
aiming to increase citizen and consumer satisfaction. However, the reforms have not achieved
all the results that were expected as regards citizens’ behaviour and satisfaction. Regulators
all over the world aim to improve the analysis and understanding of real consumers’ decisions
and perceptions, and incorporating them into regulatory policies. In this context, the main
objective of this report is to analyze longitudinal trends, as well as socio-economic
differences, in citizen satisfaction, perception and reported behaviour toward public services
in the EU. To do so, firstly the main empirical contributions of the existing literature on this
topic are described. Then, based on data from Eurobarometers, trends and differences in
satisfaction and reported behaviour (use, complaining and exercising choice) towards public
services in the EU Member Countries are analyzed. The results obtained reflect the key role
of different socioeconomic characteristics (as sex, age, education, employment and area of
residence) in determining both behaviour and satisfaction towards public services. Some
groups show better results in the use of the services and decision making, are more able to
express voice and exercise choice and, as a result, tend to obtain higher satisfaction. However,
other socioeconomic groups, as the elderly, the lower educated and those unemployed show
worse results both in expressing voice and choice and in maximizing their satisfaction, thus
reflecting their particular vulnerability as consumers of the liberalized public services.
Citizens’ heterogeneity as consumers and aspects conditioning vulnerability are a great
challenge for public services regulation, and should be incorporated into the European
regulatory policies if the achievement of more efficient markets aims to be compatible with
the maintenance of social cohesion.
Keywords: Regulation, services of general interest, public services, citizen and consumer
satisfaction, consumer exit, consumer voice

4
COCOPS Deliverable 4.1
1. Introduction
Public services and, in particular, public infrastructure services, have been subject to
recent large and intensive regulatory reform in the European Union (EU), as in most of other
regions in the world. These reforms have infused market forces and objectives into the
provision of these services alongside major regulatory changes. One of the main objectives of
these reforms was to benefit consumers. Increasing liberalization and deregulation, in some
cases accompanied by privatization, was supposed to lead to increased competition, and
greater consumer choice. Using choice, consumers are supposed to obtain better results in
terms of welfare, which should be reflected in higher satisfaction levels. Nevertheless, some
dynamics of the markets have not worked as expected. In some markets, it seems that a
choice overload have appeared, leading to excess of complexity of information which is
difficult or even unusable for many consumers. Switching is not only rare in some markets,
but even when switching decisions take place, it has been observed that some consumers
worsen their welfare with the new conditions that they choose. A majority of consumers
inhibit their participation and involvement in certain markets, limiting the advances
potentially provided by the dynamics of competition. The scarce empirical research on the
topic at least partially rejects the theoretical benefits of the reforms in terms of consumers’
satisfaction. Many Europeans are dissatisfied with basic aspects of services, notably the
accessibility and affordability of basic and key services which form the core of the analysis
undertaken in this report.
In this context, the regulators all over the world are increasingly looking at the
consumer perspective. The objective is to explore the dynamics, forces and mechanisms
influencing consumers’ real decisions in the markets and how all these aspects influence
consumers’ satisfaction with a particular service or aspect of its provision. Regulatory policies
based on a better understanding of consumers and thus on better understanding the real
dynamics of the markets, aim to increase consumers’ participation and involvement in market
forces and dynamics. These new policies based on the consumer perspective, if appropriate,
could help enable consumers to benefit from the potential of competition and choice more
than at present, and thus can be complementary to more traditional competition policies. As
final goal, regulators considering these questions aim to improve the effectiveness of
regulation, from the point of view of consumers’ welfare and satisfaction, but using the
market dynamics provided by the regulatory paradigms dominant during the last decades.
Regulators from the main developed countries, as well as international institutions, notably
the OECD, have been very active in considering this kind of policies based on new insights
on consumers’ decisions and perceptions. The European Commission (EC) is particularly
5
COCOPS Deliverable 4.1
active in this area and has promoted two specific conferences on consumer behaviour (EC
2008a and 2010) and different initiatives to evaluate consumers’ decision and satisfaction
towards public infrastructure services.
Evaluating satisfaction is crucial in order to consider, design and evaluate these new
policies focusing on consumers. At present, little is known about real consumers’ goals,
motivations and perceptions towards markets as those of public infrastructure services.
Regulators and policy makers need further evidence on this regard, in order to being able to
consider which kind of policies could be applied to improve regulation from the consumer
perspective and which instruments would be appropriate to obtain better results in terms of
consumers’ welfare and satisfaction. Consumers’ satisfaction is a major goal but little is
known about crucial aspects on this regard: how much satisfied are consumers towards key
public infrastructure services, what have been the main effects of regulatory reforms on
satisfaction, which kind of consumers are more satisfied, which elements and actions
influence on satisfaction and how can public policies and regulation contribute to improve
satisfaction. In addition, little is known about how satisfaction may impact on consumers’
decisions and involvement in the markets, affecting the different agents existing in them and
moving towards a situation possibly closer to the social optimum. All these crucial questions
are particularly important given the great relevance of public infrastructure services for daily
life of European citizens, but also for the appropriate functioning of both the European
economy and the European society. The particular characteristics of public infrastructure
services markets, as well as the already existing relative lack of experience and empirical
knowledge of their competitive functioning, are other questions to be taken into account.
This report constitutes a summary of the state of the art of the main empirical research
on evaluating public services from the point of view of consumers’ satisfaction. Key issues
for present and future research and policy are set out. The next, second, section describes the
political and academic interest of analyzing consumers’ satisfaction towards public services,
as well as the main research analyzing trends in consumer satisfaction through time and
across the EU. The third section describes the main trends and insights on consumers’
satisfaction depending on certain socioeconomic characteristics, incorporating also some
empirical evidence for illustrating some key aspects and questions for future research. The
fourth section looks at trends in consumers’ choice and voice, or switching between and
complaining about public services. Finally, some conclusions are drawn and
recommendations made for policy and research with the aim of improving regulation and the
functioning of markets from the consumer’s point of view.

6
COCOPS Deliverable 4.1
2. Trends in satisfaction with public services across time
2.1. Evaluating satisfaction on public services: motivation and sources
During the last years, a great interest has arisen among the European authorities on
the perspective of citizens as consumers of public services. This interest is also very actively
shared by international institutions as the Organization for Economic Cooperation and
Development (OECD 2010) and regulators in other developed countries as the United
Kingdom (Armstrong 2008, Fletcher 2008, Institute for Government 2010), the United States
(Federal Trade Commission 2007, Mulholland 2007, Executive Office of the President 2010)
and Australia (Australian Government 2007 and 2008). Regulators are questioning how any
new essays on consumers’ real behaviour and satisfaction could contribute to improve the
regulatory policies of these services, previously mainly based on the supply-side perspective,
and their effectiveness in terms of the consumer perspective.
In the EU, the White Paper on Services of General Interest (EC 2004a) already
expressed the interest and need to carry out a systematic assessment of markets, to ensure the
maintenance and development of public service obligations. After the process of reforms
experienced by public services in the European countries during the last decades, the need of
establishing channels and mechanisms of evaluation incorporating the perspective of
consumers was shared by most of the EU countries and social agents. However, as described
by Clifton et al. (2005), there were differences regarding the objectives that should be
addressed and the instruments required. Some countries as France and Belgium and social
actors as trade unions and public enterprises aimed that citizens’ rights to public services were
established at the European level. Other countries as the United Kingdom and the
Netherlands, and business sectors showed higher confidence in the functioning of the
markets, although considering the need to establish complementary actions to protect the
interest of consumers, as voice channels to express their opinion and the quantitative
evaluation of the results of regulatory policies. After the institutional European crisis and the
progressive abandon of the aspiration to establish European citizens’ rights to public services,
the EC has increasingly dedicated its efforts to evaluate the Single Market Program, finding
that all the public infrastructure services were among the sectors whose markets show higher
deficiencies (Ilzkovitz et al. 2008). In this light, the EC has begun to recognize the
insufficiencies of the regulation from the supply-side perspective (competition policies) alone,
and is looking for new and complementary ideas based on the consumers’ perspective.
Concretely, the EC is considering if incorporating consumers’ perspective into the design of
the regulation of these services, as proposed by the OECD (2008a), could increase the power,
7
COCOPS Deliverable 4.1
involvement and confidence of consumers in the market, leading to a better exploitation of the
potential benefits of competition (EC 2008b). This addresses the need to evaluate citizens’
decisions and perceptions as consumers of these services, monitoring that the reforms and
their subsequent regulation really impact on improving the provision of services from the
perspective of citizens as consumers, to whom they are addressed both the services and their
regulation. However and despite this political and academic need, citizens’ perspective
towards public services has been, as highlighted by authors such as Fiorio and Florio (2009),
Bourguignon and Sepúlveda (2010) and Clifton and Díaz-Fuentes (2010), insufficiently
analyzed to date.
A key source for evaluating public policies, including regulation of public services,
from the perspective of citizens or consumers are stated preferences. Stated preferences
consist on the individual self-evaluation of satisfaction or subjective happiness. They are
carried out depending on the circumstances, in comparison with other individuals and
considering both past experiences and future expectances (Frey and Stutzer 2002). Stated
preferences enable to analyze directly an indicator (albeit subjective) of individual welfare.
For this reason, their main interest is based on the fact that they enable to empirically analyze
aspects previously evaluated only from a theoretical perspective, which other sources as
revealed preferences does not allow to detect, as the motivations of decisions or their effects
on welfare. Thus, evaluating satisfaction address the need of evaluating the institutional
conditions, the quality of public policies, their net effects in terms of winners and losers and
the dynamics of these effects. Overall, as a result, evaluating satisfaction provides a greater
understanding of the mechanisms that influence subjective well-being, contributing to
improve the quality of institutions and the social capital. Consequently, this approach has
been frequently used for evaluating public policies from the perspective of public
administration and political science (Van Dooren and Van de Walle 2008). Nevertheless,
stated preferences are subject to certain biases, as summed up by Frey and Stutzer (2002),
which should be taken into account in evaluating satisfaction: answers depend on aspects as
how questions are formulated, the context in which they are carried out and the options
available. It is also required to ensure that the interviewees are able or are prone to adequately
answer the questions raised. As a result, although the analysis of citizens’ stated preferences
enables to improve transparency and quality of governance (OECD 2009b), it entails
numerous complexities for regulation: apart from the cost and delays inherent to the process,
biases in answers could imply a distortion of results and it could be possible that the interests
of a group of citizens do not equal the maximization of social welfare, given the “Not in My
Back Yard” principle (Clifton and Díaz-Fuentes 2010). In addition, James (2009) has

8
COCOPS Deliverable 4.1
demonstrated the influence of expectation on satisfaction indicators, which should be also
taken into account when evaluating satisfaction.
In the case of public services, especially given its key economic, social and strategic
role, evaluating citizens’ satisfaction towards them is particularly important. Following
Hirschman’s “exit-voice-loyalty” framework (Hirschman 1970), “exit” is often complex or
impossible for consumers of these services, given their particular characteristics as not
competitive markets but quasi-markets, as described by Costas (2007) and Clifton and Díaz-
Fuentes (2010). If there is dissatisfaction with one of these services, it usually cannot be
returned as a product bought from a shop might be. Unknown effects from the service
reflected in asymmetric information between producers and consumers can also have
irreversible effects. In addition, citizens in many, although not all, cases, cannot easily opt for
another provider, as usually there is not effective competition or the perceived or real costs of
switching are high. In these circumstances, evaluating and understanding “voice” becomes
crucial and stated preferences are important sources of information for citizens, governments,
firms and regulators.
In the EU, there exist interesting sources for evaluating citizens’ satisfaction towards
public services, as the EC has actively promoted their development from the mid 1990s. The
methodology used has been based on standard survey techniques, in addition to “flash”
surveys, as well as focus groups techniques. Particularly, citizens’ satisfaction towards public
services has been evaluated in a series of Eurobarometers published from 1997, which
constitutes the main sources of information on citizens’ stated preferences in the EU. The first
in-depth survey on this topic was Eurobarometer 47.0 (EC 1997). It analyzed how citizens
perceived recent or imminent reform of public services, as liberalization and their recent
experiences with service quality and price, their overall satisfaction with services and their
expectances about minimum services. The analysis, focused on the EU-15 countries, were
broad in terms of the services included, such as gas, water, fixed telephony, postal services,
air, urban, inter-urban coach and rail transport, television, justice, health and road
maintenance. For methodological reasons, this survey cannot be easily compared to those
coming next. However, from 2000 similar methodological approaches were adopted, making
it easier to compare across time data on satisfaction on accessibility, affordability and
perceived quality, information and contract conditions of the following public services:
mobile and fixed telephony, electricity, gas, water, postal services, urban transport and
railways. However, in later surveys Eurobarometer only included service users, while in 2000
all citizens were surveyed as regards services of general interest. In some cases the wording
of questions changed and also the time span (notably asking about periods of 12 months or 24
months).

9
COCOPS Deliverable 4.1
Eurobarometer 53.0 (EC 2000) and Eurobarometer 58.0 (EC 2002) were in depth
surveys dedicated to the analysis of consumers satisfaction with public services in the EU-15,
excluding those citizens not consuming the services. A year after, another survey conducted
in the Candidate Country European Barometer (EC 2003a) used similar methodology
providing data on satisfaction towards public services in the ten countries that soon became
new EU Member States. More recently, Eurobarometer 62.1 (EC 2005a) and Eurobarometer
65.3 (EC 2007), corresponding respectively to the years 2004 and 2006, were produced as
surveys with the same methodology than the previous ones from 2000, and thus comparable
to them, but including information for the whole EU-25. In these surveys, both consumers and
non consumers were included, although these categories were analyzed separately regarding
some issues. EC (2007) included also information on two new sectors as banking and internet.
The EU enlargement supposed also the enlargement of the sample size of the
Eurobarometers, from approximately 16,000 to nearly 25,000 individuals, with a sample of
approximately 1,000 individuals for each EU Member State (except larger samples for
Germany and the United Kingdom and a smaller sample for Luxembourg). Finally and
aiming to complete this availability of information, the EC is currently promoting a new tool
known as the “Consumer Market Scoreboard”, in order to produce highly visible and
accessible information on consumers’ use and satisfaction with products and services across
the EU on an annual basis.
2.2. State of the art
Some key contributions on the analysis and evaluation of trends on citizens’
satisfaction with public services across time based on the Eurobarometers have been
developed by a research group specialized in the topic based in the University of Cantabria
(Spain). In a first paper, Clifton et al. (2005) described and analyzed the results of EC (1997),
EC (2000), EC (2002) and EC (2003a), establishing to what extent European citizens show
growing levels of satisfaction and highlighting country and sectoral trends. Regarding EC
(1997), this paper found striking sectoral differences on satisfaction and also significant
differences among EU-15 countries. This survey also showed that although a significant
percentage of the Europeans considered that the opening to competition was a good reform to
service quality and price, the majority of them had not yet witnessed improvements on this
regard. With respect to EC (2000) and EC (2002), firstly indicators of overall satisfaction
(considering the average on price, quality, information provided and contracts) were
analyzed. The results show that the higher performing service was postal services (75% of
overall satisfaction in 2002), followed by electricity (72%), water (71%), fixed telephony

10
COCOPS Deliverable 4.1
(70%) and gas (69%), whilst the poorest performers were mobile telephony (64%), urban
transportation (60%) and rail transportation (53%). Differences between EC (2000) and EC
(2002) were very low, except the increase (4%) observed in mobile telephony. Overall
satisfaction in acceding countries, reflected in EC (2003a), was very similar. Analyzing
separately satisfaction with price, where differences among services were quite high, postal
services (68% of satisfaction in 2002) performed the best service, followed by water (56%),
electricity (55%), gas (55%) and urban transport (47%), whilst the poorest results were for
mobile telephony (44%) and railways (38%). However, mobile telephony showed the highest
improvements between 2000 and 2002. In the acceding countries (EC, 2003a), satisfaction
with price was significantly lower, representing the main difference between these countries
and those of the EU-15. Regarding satisfaction with quality, it was around 90% for electricity
and fixed telephony and over 80% for the other services, except urban transport (66%) and
railways (61%). As regards satisfaction with information provided, it was around 70% for all
the services, although it was observed a decrease for most of the services between 2000 and
2002. Finally, satisfaction with fairness of contracts was around 70% for all the services, with
the exception of the poorer results for mobile telephony (59%), urban transport (57%) and
railways (51%). Clifton et al. (2005) also analyzed the results of a qualitative study (EC
2003b) whose main aim was to establish the relative importance of aspects of service quality
to consumers, finding that price was more important than quality in those countries with
higher overall satisfaction, and quality was more important in those with lower satisfaction.
These authors concluded that a general trend of decreasing dispersion in satisfaction between
countries and services was observed. Among countries, negative trends in satisfaction were
observed in Germany, Greece, Italy, Spain and Portugal, while satisfaction had improved in
Denmark, Finland, Ireland, Luxembourg, the Netherlands and the UK.
Clifton and Díaz-Fuentes (2010) provided a deeper analysis on this topic, included
also updated information from EC (2005a) and EC (2007). The aspects most suitable for
comparison between these surveys and EC (2000), EC (2002) and EC (2003a) were
satisfaction with access, prices and consumer relations. As regards access, a general
improvement was observed between 2004 and 2006, but after a general decline between 2000
and 2004. The exception was the continuous increase in satisfaction with access to mobile
telephony, as a new technology. Satisfaction with access in 2006 was over 90% for electricity,
water, postal services and fixed telephony and over 80% for mobile telephony and urban
transport, whilst the poorest results were for railways (73%) and gas (72%). Another issue
included in these surveys was satisfaction with price (affordability), where results were
disaggregated between consumers and non-consumers. Satisfaction with the price of
electricity and gas were around 65%, meaning than near 35% of consumers did not consider it

11
COCOPS Deliverable 4.1
affordable, whilst satisfaction with price was around 75% for the other services (except a
higher satisfaction for postal services price). Among non-consumers, satisfaction with the
price of most of the services was no over 50%, being 43% for fixed telephone, 40% for gas
and 37% for mobile telephony. Finally, as regards consumer relations (including a growing
number of issues, such as complains handling and consumer protection), satisfaction was
around 50% for all services in 2006, although from 2004, it has significantly decreased for
gas and electricity and significantly increased for urban transport, railways and postal
services.
Also using data from Eurobarometers, the effects of the reforms of public
infrastructure services on citizens’ satisfaction have been analyzed in several papers
developed by a research group based at the University of Milan (Italy), focusing on certain
services as electricity, gas and fixed telephony. In the first of a series of papers produced on
this topic, Fiorio et al. (2007) evaluated the effect of the regulatory reforms on satisfaction
with access, price and quality of electricity, gas and fixed telephony, for the EU-15 countries
and using data from EC (2000), EC (2002) and EC (2005a). These authors carried out
econometric estimations explaining satisfaction on these aspects by regulatory variables,
taken from the OECD regulatory database (ETCR, formerly REGREF), indicating entry
regulation, public ownership, market structure and vertical integration. In these estimations,
they controlled by individual characteristics, year dummies and country level fixed effects
and macroeconomic variables. Before the estimations, the descriptive analysis of the
evolution of indicators reflect that, between 2000 and 2004, satisfaction with access to these
services experienced a general decrease, whilst satisfaction with price increased and
satisfaction with quality remained quite flat. From their estimations, these authors obtained
striking results differing by service. For fixed telephone, liberalization of entry was related to
higher satisfaction with access, but also to lower satisfaction with prices, the same effect that
was observed regarding privatization. For gas, liberalization in terms of free entry was related
to higher satisfaction with price, although also to lower satisfaction with access; liberalization
in terms of market concentration was observed to imply lower satisfaction with quality;
finally, both vertical disintegration and privatization were related to higher satisfaction with
access, whilst privatization was also related to higher satisfaction with price. As regards
electricity, privatization was related to lower satisfaction with access, price and quality,
liberalization in terms of entry was related to lower satisfaction with quality and vertical
disintegration was related to lower satisfaction with access. This joint evidence partially
questioned the results of the reforms of public infrastructure services in terms of citizens’
satisfaction.

12
COCOPS Deliverable 4.1
Fiorio and Florio (2009) provided a further analysis on this topic, focused on
evaluating the effects of the reforms on satisfaction with price. They also used data from EC
(2000), EC (2002) and EC (2005a), focusing on electricity, gas and fixed telephony. The
analysis, as in the previously described paper, was based on probit estimations on repeated
cross-section data, where the reforms were captured using indicators from the OECD
REGREF database, controlling by individual characteristics, year fixed effects and
macroeconomic variables. In this paper, these estimations were also contrasted with data and
estimations on prices of the services. These authors obtained mixed evidence regarding the
results of the reforms. Globally considered, the reforms appeared positively correlated with
price satisfaction for gas and fixed telephony, but negatively for the case of electricity.
Disaggregating by dimensions of reforms, privatization was related to lower satisfaction with
the price of electricity, and also with the price of gas. On the other hand, evidence was mixed
for the other dimensions of reforms: higher satisfaction with price was achieved via
liberalization of entry in the cases of electricity and gas, unbundling for the case of electricity
and the reduction of market concentration for gas; however, in the rest of cases regulatory
reforms were related to lower satisfaction with price.
In more recent papers, authors from the same research team have developed further
analyses based separately on a particular service. Illustratively, Fiorio and Florio (2011) have
evaluated the effects of regulatory reforms on satisfaction with price, focusing on the case of
electricity. As in the previously described papers, their estimations were based on data from
EC (2000), EC (2002) and EC (2005a), evaluating reforms through the indicators of the
OECD REGREF database and controlling by individual characteristics, year fixed effects and
macroeconomic variables. In this paper, these authors also found evidence partially
questioning some of the results of the reforms. Particularly, they found evidence of negative
effects of privatization of electricity on satisfaction with its price, whilst they obtained
positive effects of liberalization of the service on satisfaction with its price. In another paper
focused on energy, Poggi and Florio (2010) evaluated the effects of energy reforms on the
probability of stating experiencing deprivation with these services. To this aim, they used two
different sets of microdata: eight waves (1994-2001) of the European Community Household
Panel, for seven European countries, and the European Statistics on Income and Living
Conditions (2004-2005), for ten European countries. The reforms were also evaluated through
indicators from OECD REGREF database. As main results, they obtained that both
privatization and vertical disintegration, while not liberalization, increased the probability of
experiencing deprivation with these services, which is consistent with the results obtained by
Fiorio and Florio (2011) for the case of electricity. In a paper analogous to this latter, but
focused on the case of fixed telephony, Bacchiocchi et al. (2011) evaluated the effects of

13
COCOPS Deliverable 4.1
reforms on the quality of the service and on satisfaction with price, also using OECD
REGREF indicators on regulatory reforms and controlling by individual variables,
macroeconomic variables and country and time fixed effects. As main results, they observed
that most of the regulatory variables were not significantly related to satisfaction with price of
fixed telephony. However, higher liberalization in terms both of entry regulation and of
market structure was related to higher satisfaction with the quality of this service, whilst
privatization was not significant on this regard. Finally, Fiorio et al. (2011) have recently
performed a similar analysis focused on the case of local public transport. In this paper, these
authors analyze the relationship between the number of providers of local public transport and
the probability of consumer satisfaction, for 33 European cities, based on data from a Flash
Eurobarometer for the year 2009. The results obtained show that satisfaction is higher where
there is one single provider than where competitive or not integrated structures exist, an
evidence questioning some of the theoretically expected effects of the reform that complete
the results obtained by the previous paper.
3. Satisfaction and its relation with socioeconomic variables
3.1. Citizens’ heterogeneity and vulnerability as public services consumers
One of the main objectives of public infrastructure services’ reforms and their
subsequent regulation was to benefit consumers, improving their welfare and satisfaction.
This approach was based in the neoclassical view of consumption: individuals, as rational and
selfish agents maximizers of their own individual utility (homo oeconomicus), would make an
appropriate use of the possibilities of choice generated by the introduction of competition in
markets, following their privatization and deregulation (EC 2004b, OECD 2009a), thus
leading to both an individual and social better resource allocation and higher consumer
satisfaction. This conventional neoclassical idea of individuals’ absolute rationality and
selfishness, in which deregulating public services is based, has been the dominant economic
paradigm during the last decades. However, neither economic theory nor enough empirical
evidence has proved yet the absolute validity of this approach. In the context of the recent
economic crisis, the realism of the conception of agents’ behaviour derived from this vision
and, thus, its impact in terms of a possible redefinition of public regulatory policies, is in the
centre of the debate. As regards this debate, in which regulators all over the world, including
the EC, are being very active (EC 2008a and 2010), it has also been very influential the
emergence of a new economic discipline: Behavioural Economics. This emerging discipline,
pretended to be complementary to neoclassical economics, focuses on the mechanisms that,

14
COCOPS Deliverable 4.1
through their impact on human behaviour, empirically contradict the assumptions of complete
rationality and selfishness, leading to bounded rationality (for instance: overconfidence,
inertia, extrapolation error, loss aversion and so on) and limited selfishness (for instance:
altruism, cooperation, aversion to inequality and so on) (Kahneman et al. 1991, Mullainathan
and Thaler 2000, Schwartz 2007). In the early development of Behavioural Economics, it had
a great influence a traditional alternative to the neoclassical view of consumption: the
institutionalist school (Hodgson 1998). This view, also of great interest to analyze situations
in which individuals’ decisions do not lead to their own optimal situation, considers that
individuals’ behaviour is prominently influenced by different elements of their social context
and environment. These elements would be derived from those socioeconomic institutions
(understood in a broad sense) in which individuals are embedded, as the interaction of
economic agents, the existent common concepts and habits and the set of values inherent to
the institutions (Wilbur and Harrison 1978, Rutherford 1996).
All these both old and new insights on consumers’ behaviour alternatives and at many
points complementary to the conventional approach has led to a great attention to the
consumer perspective among regulators, included the EC. This is narrowly connected with
their increasing interest in evaluating consumers’ satisfaction, as described in the previous
section. European authorities are questioning how all this new approaches and evidences on
consumers’ motivations and perceptions are able to improve the effectiveness of regulatory
policies. Special attention has begun to be paid to those citizens potentially more vulnerable
as consumers, as recommended by the OECD (2008b). “Vulnerable consumers” have been
defined by Andreasen and Manning (1990) as those who “are at a disadvantage in exchange
relationships where that disadvantage is attributable to characteristics that are largely not
controllable by them”. According to the British Office of Fair Trading (1998), consumers’
vulnerability can be derived from two different reasons, which could appear simultaneously:
on the one hand, to experience higher difficulties to obtain and/or assimilate the information
required for decision making; on the other hand, to be exposed to a higher risk in terms of
their own welfare associated to inadequate consumption decisions. The interest of analyzing
vulnerability is derived from the need of advancing in understanding what vulnerability is, to
which factors it is related and to what sense it could imply acquiring certain disadvantages, in
the current economic, political and social context where globalization and new technologies
are increasing enormously the complexity of goods and services and consumption decisions
(Hogg et al. 2007, Brennan and Coppack 2008). This is a crucial aspect in the case of public
services, given their key social role and the deep reforms they have recently experienced
leading to the introduction of different market oriented mechanisms.

15
COCOPS Deliverable 4.1
However, the causes of vulnerability are not directly observable. For this reason,
vulnerability is usually analyzed through those socioeconomic variables of citizens that may
render them potentially vulnerable as consumers, as done by the Office of Fair Trading (1998)
and the OECD (2008b). Both analyses commonly include as socioeconomic conditions
proxies of potential vulnerability: the age (both the elderly and minors); low income, the
unemployment and to have any disability. In addition, the Office of Fair Trading (1998)
includes those with lack of formal education and those being part of an ethnic minority, whilst
the OECD (2008b) includes those living in rural areas.
3.2. Citizens’ satisfaction towards public services and socioeconomic characteristics:
empirical evidence
The previously described framework leads to an unquestionable political and
academic interest regarding how all these kind of socioeconomic variables are related to
consumers’ satisfaction towards public services and, in case, how new insights derived from
this analysis can be applied to the improvement of regulation. However, until the last years,
papers analyzing these aspects remained extremely scarce. As one of the earlier exceptions,
some of the papers described in the previous section indirectly obtained some interesting
results on the effect of certain socioeconomic characteristics of consumers’ satisfaction
towards public services. Illustratively, Fiorio et al. (2007) obtained that lower satisfaction
with electricity, gas and fixed telephone services were related with the following
socioeconomic groups: women, the elderly, those with lower educational attainment,
unemployed and those with lower income, as well as those with political views closer to the
left. In other paper focused on the case of electricity, Fiorio and Florio (2011) found that
women, those with lower educational attainment and unemployed tended to be less satisfied
with the price of the service. Finally, Clifton and Díaz-Fuentes (2010) found that, breaking
satisfaction with access to services by certain socioeconomic characteristics, much poorer
results were observed for respondents over 55 years old and rural residents regarding access
to mobile telephone, gas and urban transport.
Based on this theoretical and political debate and the previously described empirical
evidence, the analysis of the influence of socioeconomic characteristics on citizens’
consumption decision and satisfaction towards public services was the central objective of the
research work developed by Fernández-Gutiérrez (2011). This research, focusing on the cases
of Italy, Spain and the United Kingdom, was based on econometric estimations using micro
data of EC (2007), also contrasted with data on consumption decisions from Household
Budget Surveys (HBSs). The results obtained showed, first, how individuals’ environment
16
COCOPS Deliverable 4.1
and social context, derived from some of their socioeconomic characteristics, influenced their
decisions towards public services. In addition, it was observed that socioeconomic
characteristics did not influence satisfaction with the price of electricity, whilst certain
socioeconomic characteristics representative of potential vulnerability as consumers
(particularly, the high age, the low educational attainment and the lack of employment) were
related to a significantly lower satisfaction with the price of telecommunications, derived
from different decisions. Thus, certain potentially vulnerable consumers were experiencing
particular problems of participation and/or lack of confidence in the telecommunications
markets, reflected in their different decisions and the lower satisfaction derived from them.
Precisely, telecommunications is the service where regulatory reforms have been generally
the most ambitious in terms of deregulation and introduction of consumer choice. However,
as reflected in this research, not all citizens have the same ability to act as rational consumers,
maximizers of their own welfare and satisfaction, given the influence of the social context and
social environment (reflected in certain socioeconomic characteristics) in both the amount of
available options and the information and dynamics to choose among them in the decision
making process, from which welfare and satisfaction are derived. From these results, this
research recommends that regulatory reforms and their subsequent regulation should
incorporate citizens’ heterogeneity as consumers in their design, implementation and
evaluation, in order to avoid possible harmful effects of market-driven reforms in terms of
equity and social cohesion.
In a further paper following this approach, Clifton et al. (2011a) analyzed the effect
of certain socioeconomic conditions particularly representatives of potential vulnerability on
decisions and satisfaction obtained regarding two public services (electricity and
telecommunications) in two separate large European countries (Spain and the United
Kingdom), contrasting information based on EC (2007) and national HBSs. These authors
found that whilst those citizens potentially more vulnerable as consumers (as those not
working, the elderly and the lower-educated) were more dissatisfied with the price of
telecommunications, no significant relations between those characteristics and satisfaction
with the price of electricity were found. Contrasting these results with data on spending, it
was observed how higher dissatisfaction with telecommunications prices among those not
working and the lower-educated was derived from their lower participation and/or confidence
in the market, whilst the higher dissatisfaction among the elderly was derived from different
and poorer consumption decisions. In a final discussion, these authors explained the
significant differences observed among the results for electricity and telecommunication by
the increasingly complexity for decision making in the latter, due to the combination of more
ambitious and earlier regulatory reform and higher technological innovation. From these

17
COCOPS Deliverable 4.1
results, this paper recommends to go further in the process of incorporating the consumer
perspective to the regulation of public services, by incorporating citizens’ heterogeneity as
consumers, derived from their different capacity or social environment to maximize their
satisfaction. Finally, in a related paper, Clifton et al. (2011b), also contrasting data on EC
(2007) and HBSs, analyzed the regional differences and the differences among urban and
rural areas in the satisfaction with accessibility and affordability of several public services
(electricity, gas, water, fixed telephony, mobile telephony and internet) in three large
European countries: Italy, Spain and the United Kingdom. As main results, they obtained that
residence in a rural area, as factor of potential vulnerability in consumption, was generally
related with a lower satisfaction with accessibility with services as gas and
telecommunications and, in certain cases, also with a lower satisfaction with the affordability
of these services. In addition, significant regional differences in satisfaction with accessibility
and affordability were detected, some of them derived from socioeconomic characteristics as
low population density.
In order to illustrate these aspects, differences among citizens in satisfaction towards
public services by certain socioeconomic characteristics are next analyzed, based on data
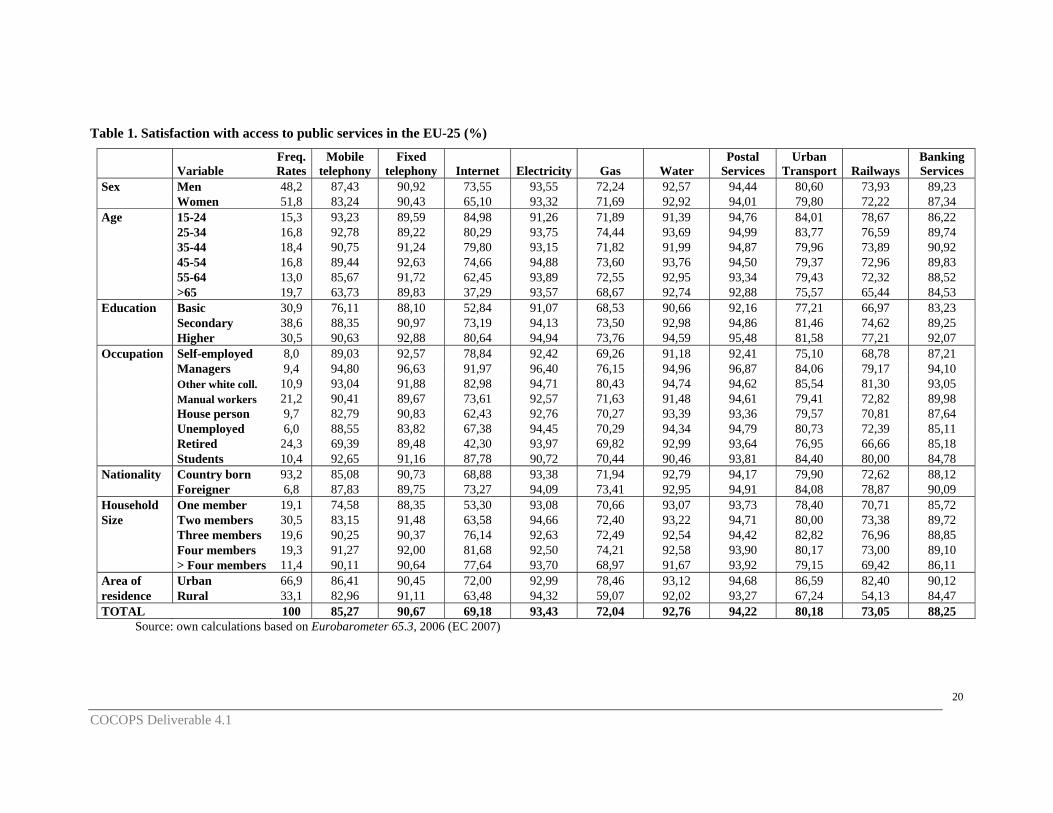
from EC (2007). Table 1 describes percentages of satisfaction with access to several public
services by socioeconomic characteristics, whilst table 2 describes satisfaction with the price
of these services by socioeconomic characteristics. Satisfaction with access is derived when
the respondent states that the access of a service is “easy”, instead of difficult or non-existent.
As observed, satisfaction with access is quite high for all the services, except internet, gas,
railways and, in a minor sense, urban transport, mobile telephony and banking services. On
the other hand, satisfaction with price is derived when the respondent states that the price of a
service is “affordable”, instead of “not affordable” or “excessive”. As observed, satisfaction
with price is generally lower than satisfaction with access. Satisfaction with price is
particularly high for postal services and, in a minor sense, for banking services and water,
whilst it is especially low for gas, internet and, in a minor sense, railways.
As observed, there are not general differences between men and women in
satisfaction with access, with the exception of the new technologies of telecommunications
(mobile telephony and internet), where satisfaction is lower among women. Regarding
satisfaction with price, it is slightly lower for women for several services, as mobile
telephony, internet, electricity, gas and railways. Larger differences are observed with respect
to age: the elderly are quite less satisfied with both the access and the price of services as
mobile telephony and internet and in a minor sense, gas, railways, urban transport and
banking services, whilst hardly differences are observed regarding fixed telephony,
electricity, water and postal services. The habit of consuming a service and the grade of

18
COCOPS Deliverable 4.1
emergence of new technologies, as well as differences in market characteristics and
regulatory policies, appear to influence on these results. Another socioeconomic characteristic
with striking results is the educational attainment. Those with lower education are less
satisfied with both the access and the price of all services under analysis. However, whilst
differences are high regarding the access and price of mobile telephony, internet, railways and
banking services, differences are much lower for the rest of services. Again, educational
attainment shows to be a higher handicap to cope in some markets than in others.
Another interesting socioeconomic characteristic is occupation. Managers and white
collar workers are more satisfied than the average with the access, and especially with the
price of all the services. Self-employed are more satisfied with telecommunications services
(mobile telephony, fixed telephony and internet) and less satisfied with transportation services
(in particular, urban transport). Manual workers are close to the average satisfaction with all
the services, although they are more satisfied with mobile telephony and internet and less
satisfied with the price of urban transport. Householders show also satisfaction generally
close to the average, except their lower satisfaction with new technologies of
telecommunications (internet and mobile telephony). Something similar is observed for the
case of retired, which can be strongly related to the previously described age patterns towards
satisfaction with the services under analysis. Of particular interest is the case of unemployed:
their satisfaction with access to services is close to the average (except their lower satisfaction
with access to fixed telephony and banking services), but their satisfaction with the price of
services is generally much lower than the average. This evidence illustrate that the problems
of this group of citizens are in terms of affordability, becoming particularly striking gaps for
the cases of fixed telephony, gas and banking services. Finally, students reflect a different
pattern than other groups, as they show higher satisfaction with mobile telephony, internet,
urban transport and railways, but lower satisfaction with electricity and banking services.
The next socioeconomic characteristic under analysis is if the individual was born in
the country where he/she lives or not. Surprisingly, satisfaction with access to services is
generally higher among foreigners, especially for internet, urban transport and railways,
which can be related to other factors, as age and occupation. Regarding satisfaction with
price, the evidence is mixed: satisfaction is higher among country born for mobile telephony,
electricity and railways and higher among foreigners for fixed telephony, internet and banking
services. With respect to household size, those individuals living alone show lower
satisfaction with the access and the price of new technologies of telecommunications (mobile
telephony and internet). Finally, residents in rural areas show lower satisfaction with the
access to services as internet, gas, urban transport, railways and, in a minor sense, mobile
telephony and banking services, whilst differences are no significant for other services. At the

19
COCOPS Deliverable 4.1
same time, differences between urban and rural areas regarding satisfaction with the price of
services are reduced, except in the case of gas. Thus, rural residents show particular problems
in accessing some services, but no other, and also some particular (although not so large and
extended) problems in affording some services.
20
COCOPS Deliverable 4.1
Table 1. Satisfaction with access to public services in the EU-25 (%)
Variable Freq. Rates
Mobile telephony
Fixed telephony Internet Electricity Gas Water
Postal Services
Urban Transport Railways
Banking Services
Sex Men 48,2 87,43 90,92 73,55 93,55 72,24 92,57 94,44 80,60 73,93 89,23 Women 51,8 83,24 90,43 65,10 93,32 71,69 92,92 94,01 79,80 72,22 87,34 Age 15-24 15,3 93,23 89,59 84,98 91,26 71,89 91,39 94,76 84,01 78,67 86,22 25-34 16,8 92,78 89,22 80,29 93,75 74,44 93,69 94,99 83,77 76,59 89,74 35-44 18,4 90,75 91,24 79,80 93,15 71,82 91,99 94,87 79,96 73,89 90,92 45-54 16,8 89,44 92,63 74,66 94,88 73,60 93,76 94,50 79,37 72,96 89,83 55-64 13,0 85,67 91,72 62,45 93,89 72,55 92,95 93,34 79,43 72,32 88,52 >65 19,7 63,73 89,83 37,29 93,57 68,67 92,74 92,88 75,57 65,44 84,53 Education Basic 30,9 76,11 88,10 52,84 91,07 68,53 90,66 92,16 77,21 66,97 83,23 Secondary 38,6 88,35 90,97 73,19 94,13 73,50 92,98 94,86 81,46 74,62 89,25 Higher 30,5 90,63 92,88 80,64 94,94 73,76 94,59 95,48 81,58 77,21 92,07 Occupation Self-employed 8,0 89,03 92,57 78,84 92,42 69,26 91,18 92,41 75,10 68,78 87,21 Managers 9,4 94,80 96,63 91,97 96,40 76,15 94,96 96,87 84,06 79,17 94,10 Other white coll. 10,9 93,04 91,88 82,98 94,71 80,43 94,74 94,62 85,54 81,30 93,05 Manual workers 21,2 90,41 89,67 73,61 92,57 71,63 91,48 94,61 79,41 72,82 89,98 House person 9,7 82,79 90,83 62,43 92,76 70,27 93,39 93,36 79,57 70,81 87,64 Unemployed 6,0 88,55 83,82 67,38 94,45 70,29 94,34 94,79 80,73 72,39 85,11 Retired 24,3 69,39 89,48 42,30 93,97 69,82 92,99 93,64 76,95 66,66 85,18 Students 10,4 92,65 91,16 87,78 90,72 70,44 90,46 93,81 84,40 80,00 84,78Nationality Country born 93,2 85,08 90,73 68,88 93,38 71,94 92,79 94,17 79,90 72,62 88,12 Foreigner 6,8 87,83 89,75 73,27 94,09 73,41 92,95 94,91 84,08 78,87 90,09 Household One member 19,1 74,58 88,35 53,30 93,08 70,66 93,07 93,73 78,40 70,71 85,72 Size Two members 30,5 83,15 91,48 63,58 94,66 72,40 93,22 94,71 80,00 73,38 89,72 Three members 19,6 90,25 90,37 76,14 92,63 72,49 92,54 94,42 82,82 76,96 88,85 Four members 19,3 91,27 92,00 81,68 92,50 74,21 92,58 93,90 80,17 73,00 89,10 > Four members 11,4 90,11 90,64 77,64 93,70 68,97 91,67 93,92 79,15 69,42 86,11 Area of Urban 66,9 86,41 90,45 72,00 92,99 78,46 93,12 94,68 86,59 82,40 90,12 residence Rural 33,1 82,96 91,11 63,48 94,32 59,07 92,02 93,27 67,24 54,13 84,47TOTAL 100 85,27 90,67 69,18 93,43 72,04 92,76 94,22 80,18 73,05 88,25
Source: own calculations based on Eurobarometer 65.3, 2006 (EC 2007)

21
COCOPS Deliverable 4.1
Table 2. Satisfaction with price of public services in the EU-25 (%)
Variable Freq. Rates
Mobile telephony
Fixed telephony Internet Electricity Gas Water
Postal Services
Urban Transport Railways
Banking Services
Sex Men 48,2 66,90 67,71 53,91 66,43 49,55 72,88 84,28 66,05 57,18 75,00 Women 51,8 63,85 67,05 45,57 62,26 45,40 70,77 83,48 65,09 54,13 73,75 Age 15-24 15,3 71,51 66,64 62,31 62,73 45,98 68,90 83,64 69,45 59,39 70,99 25-34 16,8 74,76 63,49 59,14 65,46 50,07 73,51 84,66 66,34 57,98 75,75 35-44 18,4 71,48 67,05 61,13 64,22 48,99 73,73 85,67 64,83 57,68 77,04 45-54 16,8 69,00 68,53 54,60 66,25 48,99 72,93 83,11 63,84 55,42 76,03 55-64 13,0 65,32 70,37 43,83 63,02 46,50 70,76 83,40 66,26 56,63 75,75 >65 19,7 43,60 68,55 20,35 63,64 43,96 70,46 82,64 63,54 48,16 70,91 Education Basic 30,9 55,11 64,17 32,15 61,72 45,09 68,82 80,52 63,12 50,47 68,75 Secondary 38,6 69,04 68,56 53,52 64,18 46,73 71,80 85,68 65,38 55,73 75,46 Higher 30,5 70,96 69,09 62,29 66,97 50,59 74,80 84,96 68,24 60,63 78,64 Occupation Self-employed 8,0 70,05 70,82 60,08 63,70 48,13 74,81 84,56 61,71 54,60 74,83 Managers 9,4 79,96 77,60 75,93 72,95 55,75 78,74 89,71 73,66 62,93 83,28 Other white collar 10,9 76,30 70,04 65,60 71,03 57,69 77,33 85,24 68,26 63,89 78,62 Manual workers 21,2 69,97 64,33 51,76 62,81 46,14 69,98 84,81 64,05 55,68 77,08 House person 9,7 63,00 68,01 41,45 65,23 45,79 73,59 84,52 66,09 54,74 73,82 Unemployed 6,0 62,85 55,53 43,48 55,77 37,73 66,01 76,80 58,51 50,00 65,34 Retired 24,3 48,13 66,36 24,73 62,35 44,10 69,42 82,01 63,20 49,16 71,11 Students 10,4 71,29 67,75 65,78 61,28 45,91 68,29 82,51 70,49 59,98 69,23Nationality Country born 93,2 65,54 67,11 49,14 64,39 47,46 71,86 83,86 65,53 55,84 74,08 Foreigner 6,8 62,35 70,93 55,89 62,58 46,53 70,85 84,02 65,85 52,25 78,22 Household One member 19,1 51,81 63,10 35,11 64,79 46,12 73,78 83,60 64,61 52,00 71,57 size Two members 30,5 64,55 70,12 45,29 66,73 48,35 72,52 84,12 65,59 56,58 76,87 Three members 19,6 71,06 66,01 55,41 63,55 47,14 70,84 84,60 65,85 56,10 74,09 Four members 19,3 71,95 69,04 61,78 62,17 49,14 71,25 82,98 66,86 57,29 74,25
> Four members 11,4 69,01 66,68 54,79 61,64 44,52 69,05 83,91 64,32 55,30 72,95
Area of Urban 66,9 66,36 68,16 51,60 64,58 51,64 72,42 83,77 68,75 59,61 74,54residence Rural 33,1 63,24 65,76 45,54 63,65 38,83 70,51 84,06 59,09 47,50 73,99 TOTAL 100 65,32 67,37 49,60 64,27 47,40 71,79 83,87 65,55 55,60 74,36
Source: own calculations based on Eurobarometer 65.3, 2006 (EC 2007)

22
COCOPS Deliverable 4.1
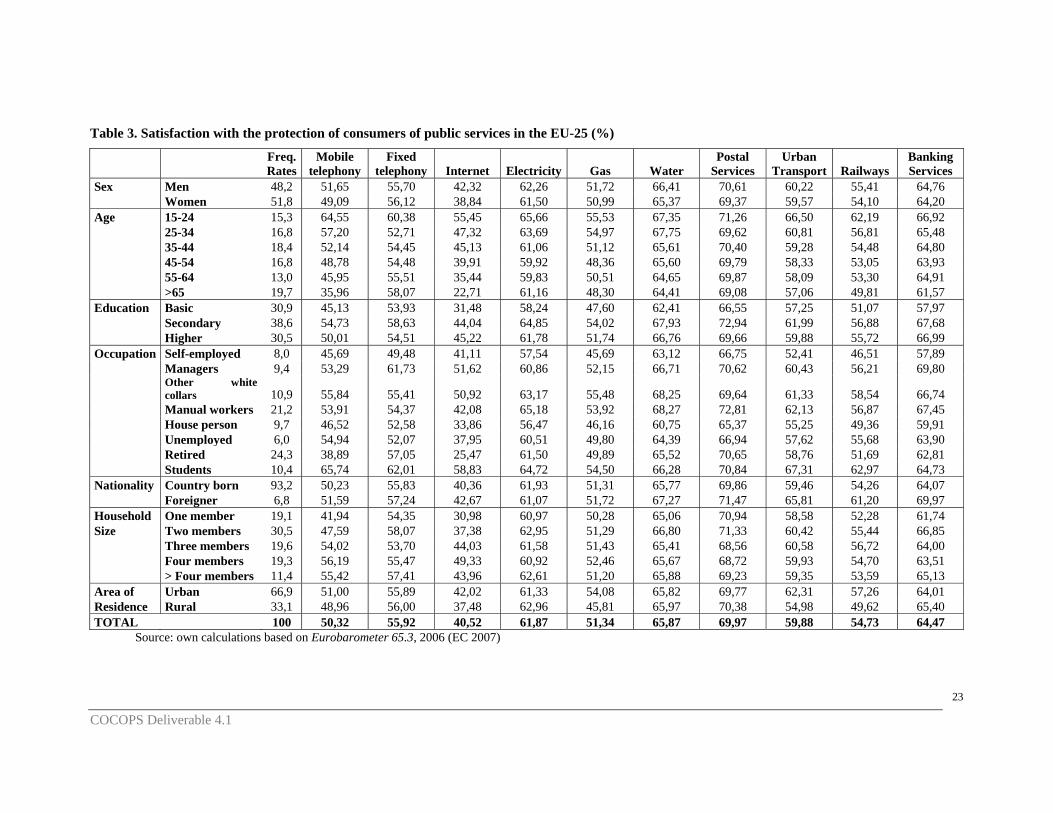
Results on consumers’ satisfaction by socioeconomic characteristics are further explored in
table 3, which describes the perception of the grade of consumer protection. Satisfaction on this
regard is derived when the respondent states that the consumers’ interests are protected “very well” or
“fairly well”, instead of “fairly badly” or “very badly”. As observed, those services where satisfaction
with consumers’ protection is higher are postal services, water, banking services and electricity,
whilst the lower satisfaction is for internet and in a minor sense, mobile telephony and gas. As with
respect to satisfaction with access, there are not significant differences among men and women,
except in the case of new technologies of communication, particularly internet. Similarly than with
respect to the previous indicators, the elderly are quite less satisfied with consumers’ protection for
some services as mobile telephony, internet and, in a minor sense, railways, whilst they are slightly
less satisfied in the rest of cases (except for fixed telephony). Educational attainment shows particular
results: those with secondary education are more satisfied than those with basic education with the
grade of consumers’ protection in all the services (particularly, internet, banking services and mobile
telephony), although those with higher education are slightly less satisfied in most of the cases,
possibly because their exigencies on this regard are higher. Regarding occupation, students, managers,
white collars and also manual workers are generally more satisfied with consumers’ protection, whilst
self-employed, house persons, unemployed and retired are less satisfied with most of the services.
Satisfaction with consumers’ protection is quite similar between country born individuals and
foreigners, although satisfaction is higher among the latter in the cases of urban transport, railways
and banking services. In addition, those living alone show lower satisfaction in the cases of new
technologies of communication (mobile telephony and internet), as observed with respect to the
previous indicators of satisfaction. Finally, those living in rural areas are less satisfied with the grade
of consumers’ protection in the cases of gas, transport services (urban transport and railways) and new
technologies of communication (mobile telephony and internet), more or less the same where they
experience access problems. Summing up, indicators on satisfaction reveal to be quite sensitive to the
exact dimension for which respondents are being questioned, as illustrated by the results on
accessibility, affordability and grade of consumers’ perceived protection. As observed, many of the
patterns regarding different indicators are closely related. However, other patterns differ from one
indicator to another, reflecting this sensitiveness. In any case, all these results described in tables 1, 2
and 3 reflect the importance of consumers’ heterogeneity, represented by certain socioeconomic
variables, on satisfaction indicators.
23
COCOPS Deliverable 4.1
Table 3. Satisfaction with the protection of consumers of public services in the EU-25 (%)
Freq. Rates
Mobile telephony
Fixed telephony Internet Electricity Gas Water
Postal Services
Urban Transport Railways
Banking Services
Sex Men 48,2 51,65 55,70 42,32 62,26 51,72 66,41 70,61 60,22 55,41 64,76 Women 51,8 49,09 56,12 38,84 61,50 50,99 65,37 69,37 59,57 54,10 64,20 Age 15-24 15,3 64,55 60,38 55,45 65,66 55,53 67,35 71,26 66,50 62,19 66,92 25-34 16,8 57,20 52,71 47,32 63,69 54,97 67,75 69,62 60,81 56,81 65,48 35-44 18,4 52,14 54,45 45,13 61,06 51,12 65,61 70,40 59,28 54,48 64,80 45-54 16,8 48,78 54,48 39,91 59,92 48,36 65,60 69,79 58,33 53,05 63,93 55-64 13,0 45,95 55,51 35,44 59,83 50,51 64,65 69,87 58,09 53,30 64,91 >65 19,7 35,96 58,07 22,71 61,16 48,30 64,41 69,08 57,06 49,81 61,57 Education Basic 30,9 45,13 53,93 31,48 58,24 47,60 62,41 66,55 57,25 51,07 57,97 Secondary 38,6 54,73 58,63 44,04 64,85 54,02 67,93 72,94 61,99 56,88 67,68 Higher 30,5 50,01 54,51 45,22 61,78 51,74 66,76 69,66 59,88 55,72 66,99 Occupation Self-employed 8,0 45,69 49,48 41,11 57,54 45,69 63,12 66,75 52,41 46,51 57,89 Managers 9,4 53,29 61,73 51,62 60,86 52,15 66,71 70,62 60,43 56,21 69,80
Other white collars 10,9 55,84 55,41 50,92 63,17 55,48 68,25 69,64 61,33 58,54 66,74
Manual workers 21,2 53,91 54,37 42,08 65,18 53,92 68,27 72,81 62,13 56,87 67,45 House person 9,7 46,52 52,58 33,86 56,47 46,16 60,75 65,37 55,25 49,36 59,91 Unemployed 6,0 54,94 52,07 37,95 60,51 49,80 64,39 66,94 57,62 55,68 63,90 Retired 24,3 38,89 57,05 25,47 61,50 49,89 65,52 70,65 58,76 51,69 62,81 Students 10,4 65,74 62,01 58,83 64,72 54,50 66,28 70,84 67,31 62,97 64,73 Nationality Country born 93,2 50,23 55,83 40,36 61,93 51,31 65,77 69,86 59,46 54,26 64,07 Foreigner 6,8 51,59 57,24 42,67 61,07 51,72 67,27 71,47 65,81 61,20 69,97 Household One member 19,1 41,94 54,35 30,98 60,97 50,28 65,06 70,94 58,58 52,28 61,74 Size Two members 30,5 47,59 58,07 37,38 62,95 51,29 66,80 71,33 60,42 55,44 66,85 Three members 19,6 54,02 53,70 44,03 61,58 51,43 65,41 68,56 60,58 56,72 64,00 Four members 19,3 56,19 55,47 49,33 60,92 52,46 65,67 68,72 59,93 54,70 63,51 > Four members 11,4 55,42 57,41 43,96 62,61 51,20 65,88 69,23 59,35 53,59 65,13 Area of Urban 66,9 51,00 55,89 42,02 61,33 54,08 65,82 69,77 62,31 57,26 64,01 Residence Rural 33,1 48,96 56,00 37,48 62,96 45,81 65,97 70,38 54,98 49,62 65,40 TOTAL 100 50,32 55,92 40,52 61,87 51,34 65,87 69,97 59,88 54,73 64,47
Source: own calculations based on Eurobarometer 65.3, 2006 (EC 2007)

24
COCOPS Deliverable 4.1
Satisfaction is closely related to consumers’ decisions and behaviour in the market, including
their grade of participation and involvement. This relation is illustrated by the results described in
table 4, on the use of the services under analysis. The stated use reflects quite well the grade of
extension of each service. Despite the existence of some biases in the responses that should be taken
into account (as those derived from lack of cooperation or unreal answers related to strong
dissatisfaction), electricity, water and postal services appear to be practically universally used.
Banking services, fixed telephony and mobile telephony show also high use, although quite far from
universality. Urban transport and gas, however, show a use around 60%, whilst the use of internet and
railways is under 50%. Men use more than women new technologies of telecommunications (mobile
telephony and internet) and banking services, where their satisfaction were higher. However, women
use more urban transport services, where no differences in satisfaction were observed, illustrating that
there are other aspects further that satisfaction that can influence on use and consumption decisions.
With respect to the age, the elderly show lower use of mobile telephony and internet, where they were
less satisfied, whilst they show higher use of fixed telephony, where no significant differences in
satisfaction with access and price were observed (although the elderly felt higher protection). The
elderly also show lower use of other two services where their satisfaction with access and price was
lower: urban transport and railways. In the case of those with lower educational attainment, their use
of most of the services is generally lower, although the higher gaps with respect to those with higher
education are for internet, mobile telephony, railways and banking services, which in all cases is
consistent with gaps in satisfaction.
Another variable of interest is occupation. As it is observed, managers and white collars,
which were more satisfied with services, show also higher use of them. Self-employed show also
higher use of those services where their satisfaction was higher (new technologies of communication)
and lower use of those where their satisfaction was lower (transport services). Regarding new
technologies of communication, exactly the opposite is observed for house persons and retired.
Unemployed, despite their stated problems of affordability of the services, show a use close to the
average, which could imply a higher relative economic effort. Finally, students show higher use of
those services where their satisfaction was also higher (new technologies of telecommunications and
transport services), whilst their use of the other services is close to the average. As regards nationality,
foreigners show higher use of transport services and banking services, whilst no other significant
differences are observed. Those living alone, which were less satisfied with new technologies of
communication, show also lower use of these services. Last but not least, those living in rural areas
show lower use of internet, gas, urban transport and railways, where their satisfaction (in particular,
with access) was quite lower. The overall analysis of these results shows the strong relationship
among satisfaction and use of the services, as captured by differences among certain socioeconomic

25
COCOPS Deliverable 4.1
groups. In many cases, there could be a problem as lack of good access, lack of affordability or poor
quality of provision, influencing both satisfaction and consumption decisions and reflected
simultaneously in both indicators. As illustrated by data, consumers’ heterogeneity is crucial in terms
of explaining these aspects. In the next section, further results related to this point are explaining as
regards voice and choice behaviour.
Summing up, the empirical evidence obtained in the already scarce literature on public
services from the citizens/consumers perspective, as illustrated with these results previously
described, show the importance of certain socioeconomic characteristics for citizens’ needs, abilities,
decisions and perceptions towards the consumption of public services. Citizens are heterogeneous as
consumers, and this fact is reflected in their different behaviour in the markets, their differences in
terms of participation and involvement and, closely related to all this facts, their differences in
satisfaction. This heterogeneity is a relevant circumstance that needs to be taken into account for
providers, but also for regulators in their tasks of policy design, implementation and evaluation.

26
COCOPS Deliverable 4.1
Table 4. Stated use of public services in the EU-25 (%)
Freq. Rates
Mobile telephony
Fixed telephony Internet Electricity Gas Water
Postal Services
Urban Transport Railways
Banking Services
Sex Men 48,2 82,99 78,56 52,51 94,35 60,46 92,89 91,04 58,08 47,58 85,56 Women 51,8 75,26 80,44 43,37 94,78 60,31 93,46 92,44 64,16 47,94 83,96 Age 15-24 15,3 94,44 68,97 64,85 91,51 59,23 90,36 88,51 75,14 55,10 73,22 25-34 16,8 93,77 70,43 58,40 94,64 61,05 94,05 91,84 59,53 49,26 86,87 35-44 18,4 90,38 79,89 60,59 95,58 60,84 93,44 92,87 59,87 46,88 89,32 45-54 16,8 83,61 84,55 54,55 95,76 62,60 94,22 92,78 57,76 46,92 89,33 55-64 13,0 73,65 85,84 38,11 95,63 61,62 93,88 93,32 58,85 48,19 86,80 >65 19,7 43,35 86,67 14,09 94,24 57,57 93,05 91,28 57,69 42,10 82,23 Education Basic 30,9 63,31 77,74 26,47 92,25 57,27 90,97 87,77 59,00 40,36 76,28 Secondary 38,6 84,21 77,53 50,76 95,22 61,58 93,73 92,62 61,93 48,13 86,17 Higher 30,5 88,25 83,89 65,58 96,10 62,03 94,73 94,72 62,60 54,81 91,47 Occupation Self-employed 8,0 88,93 87,22 63,50 93,52 60,25 91,52 91,20 48,68 42,10 90,20 Managers 9,4 94,68 89,72 82,88 97,63 62,51 96,14 96,05 62,99 56,89 95,62
Other white collars 10,9 91,99 81,18 64,88 96,62 69,59 96,48 95,78 63,05 55,36 92,71
Manual workers 21,2 88,97 72,72 46,67 94,61 59,95 92,55 90,89 57,67 43,94 87,80 House person 9,7 69,58 79,07 32,44 94,40 57,23 94,42 89,55 63,38 42,29 83,87 Unemployed 6,0 82,76 62,48 39,54 94,03 57,85 92,78 91,34 62,61 48,88 75,59 Retired 24,3 51,61 84,88 19,13 94,92 58,79 93,03 92,19 58,02 42,91 82,07 Students 10,4 93,82 74,33 74,23 90,07 57,97 89,11 87,21 79,32 59,54 68,38 Nationality Country born 93,2 78,79 79,37 47,41 94,59 60,54 93,16 91,66 60,68 47,47 84,44 Foreigner 6,8 81,69 81,85 52,87 94,31 58,32 93,48 93,22 68,72 51,81 88,75 Household One member 19,1 63,59 73,28 28,91 94,28 59,85 92,81 91,10 59,63 46,93 83,08 Size Two members 30,5 73,49 82,32 41,30 95,53 59,57 94,10 92,79 59,71 48,59 88,32 Three members 19,6 86,71 76,90 53,34 94,05 62,19 92,78 90,71 60,73 48,17 84,02 Four members 19,3 90,12 83,64 64,92 94,36 62,44 93,05 91,48 63,02 47,33 84,35 > Four members 11,4 87,40 80,13 58,13 93,78 56,89 92,29 92,42 65,77 47,03 79,78 Area of Urban 66,9 80,65 79,20 50,20 93,90 67,70 93,70 91,56 67,59 55,20 85,12 Residence Rural 33,1 75,64 80,22 42,87 95,94 45,60 92,14 92,16 48,37 32,75 83,94 TOTAL 100 78,99 79,53 47,78 94,57 60,39 93,19 91,76 61,23 47,77 84,73
Source: own calculations based on Eurobarometer 65.3, 2006 (EC 2007)

27
COCOPS Deliverable 4.1
4. Voice and choice in services of general interest
4.1 The importance of voice and choice
In this section we will look at citizens’ voice and choice behaviour towards services
of general interest. With voice we refer to citizens’ complaint behaviour, while choice refers
to switching between service providers. Greater opportunities for citizens’ voice and choice,
and more specifically the so called ‘choice-agenda’ have been forwarded especially by the
Labour government in the UK as the new public sector ‘mantra’. It is no surprise that most
academic attention and the debate on its (dis)advantages are mainly concentrated in the UK (6
2003, Clarke and Newman 2007, Clarke et al. 2007, House of Commons 2005, Le Grand
2007, Needham 2007, Powell et al. 2009, Powell 1995). Moreover, scholars have been
investigating the issue mainly from a national perspective which results in a relatively low
amount of comparative lessons-learned. In our view, the debate does suffer from three
deficiencies, as (1) there are only a limited number of empirical studies that look into the
effects of greater choice and voice from a cross-national perspective; (2) works that explicitly
link the discussion on conflicting values within the liberalization of European public services
and the debate on greater choice and voice are rare; and (3) available studies rather examine
the role of choice and often overlook citizens’ voice.
During the process of service liberalization, citizens, now perceived as consumers, are
put into the drivers’ seat and given greater freedom to choose among several service
providers. The notion of choice, however, can be interpreted differently (Lent and Arend
2004). According to Dowding and John (2008), there are three different ways: physical
relocation, switching from private to public providers, and choice between different public
providers. Within the ‘choice-debate’, the term is mainly differentiated into where (choice of
provider), who (choice of professional), what (choice of different kinds of service) and when
(choice of time) to make choices (Le Grand 2007). We will use the term choice in a way of
switching among any kind of service providers, focussing on the “where” element.
Another important means for improving the responsiveness and subsequently the
quality of (public) services is voice. It can be defined as “[…] any attempt at all to change,
rather than to escape from, an objectionable state of affairs, whether through individual or
collective petition to the management in charge, through appeal to a higher authority with the
intention of forcing a change in management […]” (Hirschman 1970: 30). Albert
Hirschman’s broad definition of voice may also include more informal ways of complaints as
well as electoral voting. Recent studies (Dowding and John 2008, Salucci and Bickers 2011)
have exemplified the importance of differentiating between different types of voice, such as

28
COCOPS Deliverable 4.1
individual and collective voice. While the first form is mainly composed of complaining
about a received service or good, the second form can either be through voting or through
other joint forms such as signing a petition or participating in public campaigns. Research so
far has often concentrated on the later (Boyne et al. 2009, Lyons and Lowery 1989, James and
John 2007). In the following section we will focus on the formalized individual elements of
voice within the service delivery cycle, what Dowding et al. (2000) call individual voice,
namely complaining about any aspects of used services.
A number of studies on choice and voice towards public services have highlighted
their potential effect on equity. Yet most works in this context are mainly focusing on the
choice aspect of (public) services, however, identified mechanisms may also apply to voice.
In this regard, commentators argue (Needham 2007, Appleby et al. 2003) that a greater
possibility in choosing a certain service provider has mainly benefited the middle-class, those
with sharper elbows who have already considerable advantages in leaving poor services. In
this view, poor and less educated citizens – those who are potentially vulnerable - can barely
make use of greater opportunities to choose among different providers, which is mainly
because of the relatively high transaction costs it would bring to them. Thus disadvantaged
and vulnerable citizens, such as the less educated and the poor are left behind and hence
already existing inequalities have been widened. Others, such as Ayeni (2000), argue more or
less similarly by stating that extending opportunities for choice and voice brings greater
influence along to citizens, but in accordance to their socio-economic status. This is because
they are in a better position to utilize those greater opportunities, as information is more easily
available to these groups and the capacity of interpreting information is varying tremendously
among higher and lower educated. In contrast, most proponents of the choice-agenda claim
that enhancing choice does actually benefit those who are worse off, since exit-options have
always been available to those with more socio-economic power (Giddens 2003, Le Grand
2005, Le Grand 2007). This means that wealthier citizens always had the chance to leave poor
performing services to the private sector, which is an inequality in itself. Greater choice does
now provide opportunities to potentially vulnerable citizens which their counterparts always
had. Thus in this view, increasing choice does actually reduce inequalities among higher and
lower socio-economic status groups, as it offers equal choices to all layers of society. In this
regard, authors (such as Le Grand 2005) may recognize the need to support less capable
citizens in making those choices by providing support in doing so. This, however, is an
additional policy challenge and does not jeopardize the concept behind the so called ‘choice-
agenda’.

29
COCOPS Deliverable 4.1
4.2 Data
The European Commission commissions Eurobarometer public opinion surveys
twice a year since 1973. Between 1997 and 2008, in addition to six Eurobarometer rounds
devoted to citizens’ perceptions on services of general interest (47.0 in 1997; 53.0 in 2000;
58.0 in 2002; 62.1 in 2004; 63.1 in 2005; 65.3 in 2006) (EC 1997, 2000, 2002, 2005a, 2005b
and 2007), two flash surveys have been devoted to this topic - one on service quality (flash
150) in 2003 (EC 2003c) and one on switching service providers (flash 243) in 2008 (EC
2009).
EC (2000) dataset is the first Eurobarometer round that contains information whether
respondents have actually submitted a complaint by asking “In the last twelve months, have
you personally made a complaint, either to any complaint-handling body (ombudsman,
regulator, consumer association, industry body, etc…) or the service provider about any
aspect of…?”. This item has been incorporated in the same way repeatedly until EC (2005a).
In 2006 (EC 2007) the question was asked in a more fragmented manner, as it was changed
from a binary answer to four answer possibilities, probing for different kinds of institutions
complaints could be submitted to. This affects comparability negatively, as it reduces the
overall probability in selecting “no” as an answer by decreasing the share of the “no” category
from 50% to 25%. Furthermore, in 2006 the time span was extended to 24 months. Another
difference which was observed between the Eurobarometer rounds in 2000 (EC 2000) and
2004 (EC 2005a), was that in 2004 the question on voice was asked exclusively to service
users (those respondents that had stated that they actually use the service and have access to
it), while in 2000 all respondents were included. We will subsequently present trends in voice
behaviour from 2000 to 2004. In order to reduce the effect the difference in data collection
might have on the results obtained, we filtered those respondents in 2000 that had not stated
that they have access to the respective service – figures on service use were not available at
that time.
As regards citizens’ choice behaviour, items on switching providers have been
incorporated in 1998, 2005, 2006 and 2008. Subsequently, we draw upon the latest switching
data from Eurobarometer Flash 243 (EC 2009) on switching service providers for the
following services of general interest: fixed and mobile telephony, electricity, gas, so as for
banking, insurance and internet services. See also Jilke and Van de Walle (2012) for a more
detailed treatment.

30
COCOPS Deliverable 4.1
4.3 Evidence of citizens’ voice
As regards citizens’ voice behaviour, firstly data on relative frequency of complaining
are described (table 5), based on information collected in EC (2007). As observed, this
behaviour has been more frequent in the cases of telephony (both mobile and fixed telephony)
and, in a minor sense, internet, electricity, banking services and postal services, whilst
complaining is much more rare in the rest of services under analysis. Complaining is more
frequent among men than among women in most of the services, especially in the cases of
new technologies of communications. Complaining is also particularly less frequent among
the elderly. Interestingly, the gap is also even greater in some services where the elderly were
particularly less satisfied, as mobile telephony and internet, and also large in others as gas,
urban transport, railways and banking services. As regards educational attainment,
complaining is more frequent among those with higher education. As an additional apparent
paradox, among those services with higher gaps in complaining behaviour they are also those
services with higher differences in satisfaction in favour of better educated individuals.
Interestingly, those with higher education appear simultaneously to show higher satisfaction
and more activity in complaining, which could be generated by higher involvement in the
market and voice in service provision.
Complaining is also a relatively frequent behaviour among white collar workers and,
especially, among managers (those generally more satisfied with the services under analysis).
It is also a relatively frequent behaviour among self-employed, especially in those services
where they are particularly satisfied: new technologies of communications (mobile telephony
and internet). The opposite is observed for house persons and retired. Complaining is also
relatively frequent among students in those services where their satisfaction is relatively high
(new technologies of communication and transportation), and relatively less frequent in the
others. Thus, results in complaining by occupation show a close relationship between this
behaviour and satisfaction, confirming the previously apparent contradictory evidence. With
respect to nationality, complaining is relatively more frequent among foreigners in most of
the cases. Complaining, however, is less frequent among those living alone as regards new
technologies of communications, where they were particularly less satisfied. Finally,
complaining is more frequent among urban residents in most of the services. However, the
gap is particularly high in those services where there is also a gap in satisfaction in favour of
urban residents. All these results reflect that, in many cases, those socioeconomic
characteristics related to a more active behaviour in terms of complaining as regards a
particular service, are also related to higher satisfaction with key elements of the service, as
access or price. A more active behaviour in complaining appears to be not among those less
satisfied, but precisely among those with higher satisfaction, and precisely in those services

31
COCOPS Deliverable 4.1
where they show higher relative satisfaction. Lower satisfaction is not only frequently related
to total or partial exclusion in terms of use and consumption, as derived from results
described in the previous section. It appears also to be often related to lack of involvement in
service provision, improvement and regulation, as reflected in the apparent association
between satisfaction and voice.

32
COCOPS Deliverable 4.1
Table 5. Complaints with public services in the EU-25 during the last two years (%)
Freq. Rates
Mobile telephony
Fixed telephony Internet Electricity Gas Water
Postal Services
Urban Transport Railways
Banking Services
Sex Men 48,2 10,32 9,13 7,98 5,55 2,80 2,78 5,16 2,40 2,36 6,16 Women 51,8 8,33 8,97 4,95 5,37 3,13 2,58 4,70 2,62 2,27 4,47 Age 15-24 15,3 14,05 6,05 9,33 4,60 2,78 2,11 4,35 4,35 2,91 4,36 25-34 16,8 13,39 9,49 8,99 6,32 3,50 3,01 6,14 2,74 3,40 5,78 35-44 18,4 11,76 12,04 7,29 7,17 3,70 3,59 5,60 2,94 2,54 7,90 45-54 16,8 8,89 11,79 7,68 5,19 3,19 2,25 5,53 2,29 2,40 5,72 55-64 13,0 6,35 9,48 4,31 5,52 2,65 2,79 5,00 1,47 2,14 4,89 >65 19,7 2,11 5,57 1,44 3,97 2,02 2,28 3,13 1,38 0,76 3,00 Education Basic 30,9 5,48 6,94 3,40 4,29 2,27 2,03 3,06 1,92 1,15 3,23 Secondary 38,6 10,78 7,91 6,20 5,71 3,16 3,20 5,14 2,53 1,97 5,54 Higher 30,5 11,27 12,62 9,73 6,32 3,44 2,68 6,54 3,09 3,93 7,03 Occupation Self-employed 8,0 15,74 16,70 10,49 6,23 3,15 3,36 6,34 2,59 3,22 9,13 Managers 9,4 15,29 15,65 13,28 8,98 6,13 2,92 8,87 3,70 4,95 10,11
Other white collars 10,9 11,82 9,57 6,93 5,40 3,36 2,74 5,17 2,95 3,36 6,51
Manual workers 21,2 9,17 8,65 5,72 6,14 3,26 2,81 4,45 2,01 1,67 5,78 House person 9,7 6,31 6,47 3,40 4,47 2,62 2,51 4,56 2,12 1,17 3,15 Unemployed 6,0 9,13 6,69 5,96 6,17 2,82 3,20 5,51 2,36 1,45 3,33 Retired 24,3 3,63 6,85 2,08 4,55 2,24 2,60 3,47 1,50 1,23 3,42 Students 10,4 12,61 6,33 11,10 2,97 1,10 1,64 4,35 4,78 3,53 3,11 Nationality Country born 93,2 9,09 8,84 6,24 5,43 3,02 2,69 4,83 2,48 2,32 5,21 Foreigner 6,8 12,15 11,90 8,81 5,83 2,30 2,52 6,23 3,00 2,16 6,33 Household One member 19,1 7,83 7,19 3,90 5,34 3,32 2,44 4,35 2,14 2,77 5,30Size Two members 30,5 7,94 9,05 5,48 5,18 2,86 2,75 5,00 2,15 2,06 5,16 Three members 19,6 9,86 9,10 6,69 4,72 2,89 2,88 4,91 2,42 2,10 5,75 Four members 19,3 10,99 9,62 9,14 6,66 3,04 2,30 5,37 3,14 2,34 5,37 > Four members 11,4 11,51 11,10 8,02 5,61 2,69 3,16 4,92 3,22 2,56 4,61 Area of Urban 66,9 9,83 9,32 6,87 5,48 3,43 2,62 5,40 2,81 2,69 5,82 Residence Rural 33,1 8,20 8,50 5,49 5,41 2,05 2,80 3,97 1,92 1,55 4,19 TOTAL 100 9,29 9,05 6,41 5,46 2,97 2,68 4,92 2,51 2,31 5,28
Source: own calculations based on Eurobarometer 65.3, 2006 (EC 2007)

33
COCOPS Deliverable 4.1
Then, we perform further analysis of developments over time for the share of respondents that
have actually submitted a complaint for all available service sectors in the EU15 (figure 1), based on
comparison of data from EC (2000) and EC (2005a). Here an increase in complaints – indeed, in
different degrees – was apparent in all service sectors. However, we can identify differences across
sectors. While there has been a rather strong increase in complaints in the telephony and rail sectors,
the remaining sectors experienced only some minor changes of less than two percentage points
between the years.
Figure 1. Complaints made in the last 12 months, EU-15
2,5% 2,5%
5,0%
3,0% 2,8%
6,2%
15,0%
3,4%2,6%2,9%2,5%
5,6%
3,3%
8,0%
5,0% 4,4%
8,4%
19,3%
0%
5%
10%
15%
20%
All services Fixedtelephony
Rail Mobiletelephnoy
Postal Electricity Gas Water Localtransport
2000 2004
Source: Own calculations based on Eurobarometer 53.0, 2000 (EC 2000); Eurobarometer 62.1, 2004 (EC
2005a).
As regards the heterogeneity of complainers, in the following we present an overview of
complainers stratified by key socio-economic characteristics, such as gender, age, and education.
When looking at table 6, a pattern emerges. We can see, as regards gender, that there are no great
differences when it comes to submitting a complaint. However, in terms of age, there are strong
discrepancies. Overall, those respondents in the middle categories are more likely to complain when
compared to the young and elderly. However, minor differences across sectors are apparent. As
regards educational status, those respondents who have finished basic or no education are the group
which complaints less frequently when compared to those who have exited formal education at a later
stage. This provides some evidence that those service users who are comparatively low educated, the
young and the elderly are the least frequently complaining groups. Comparing the results with those
from section three, this is surprising since especially these potential vulnerable groups are less

34
COCOPS Deliverable 4.1
satisfied with price and access of those services. Hence one would expect them to complain more
frequently.
Further evidence on the observed equality gap in citizens’ voice behaviour towards services of
general interest has been provided by Jilke and Van de Walle (2012). Performing logistical regression
analysis on the introduced data for an aggregated measure of voice (all sectors combined), they do
find that an equality gap between different layers of society when it comes to submitting a complaint
– while controlling for service satisfaction. More precisely, their results suggest that lower educated
citizens are less likely to submit a complaint when compared to those with a higher education. Age
has a considerably weaker effect on the likelihood of complaining, but is still apparent. Furthermore,
they provide first support for the assumption that the gap between the young and the elderly does
increase over time. Education, however, did not have a similar effect. In contrary, being lower
educated increases the likelihood of submitting a complaint between 2000 and 2004, which suggest
that the gap between different educational groups is decreasing. In this regard, we have to keep in
mind that these are only overall tendencies that do not necessarily reflect sectoral developments which
might vary considerably.

35
COCOPS Deliverable 4.1
Table 6. Citizens’ complaint behaviour towards services of general interest in the EU-15 (%)
Variable Freq. Rates
Mobile telephony
Fixed telephony Electricity Gas Water Postal
Services Urban
Transport Railways
Sex Men 44,4 49,1 47,1 46,7 43 43,8 45,3 41,6 47,7 Women 55,6 50,9 52,9 53,3 57 56,2 54,7 58,4 52,3
Age 15-24 12,6 21,8 8,9 8,3 10,3 7,3 9,3 25,4 22,4 25-39 25,4 37,1 31,3 34,1 29,1 33,7 28,6 28,4 32,5 40-54 25,7 25,8 31,3 28,5 30,3 27,5 30,4 23,5 25,2 >55 36,2 15,3 28,5 29,1 30,3 31,5 31,7 22,7 19,9
Education Basic 22,7 8,9 17,3 18,7 17,2 20,8 14,7 13,7 8,8 Secondary 43,3 44,2 40,2 42,5 47,3 45,5 42,3 40,6 35,3 Higher 32,3 46,9 42,5 38,8 35,4 33,6 43 45,7 55,9
Source: Own calculations based on Eurobarometer 62.1, 2004 (EC 2005a)

36
COCOPS Deliverable 4.1
4.4 Evidence on citizens’ choice and switching
Concerning citizens’ switching behaviour, we present results from Eurobarometer flash 243
“Consumers’ views on switching service providers” (EC 2009) for the following services: Internet,
mobile telephony, fixed phone telephony, gas and electricity. Figure 2 presents the overall percentage
of citizens that have switched their service providers in the last two years for the EU27. We can
clearly see that citizens’ choice has been more frequently exercised in the telecommunication sector.
Roughly every fifth telecommunication user has switched their service provider in the last 24 months.
In the energy sector, figures range between 8 and 7 per cent. The telecommunication sector is
traditionally weaker regulated then the energy sector (Conway and Nicoletti 2006), which might be
one explanation in this regard.
Figure 2. Citizens’ switching behaviour in the last 24 months, EU-27
0%
5%
10%
15%
20%
25%
Al l services Internet Mobi lePhone
FixedTelephony
Electrici ty Gas
Source: Figures taken from Eurobarometer flash 243, 2008 (EC 2009)
Looking at figures within single service sectors, stratified by key socio demographic
characteristics (gender, age, education), at table 7 we can identify a strong pattern. As regards gender,
there are only minor differences across all services. However, as regards age, it is evident that the
young and the elderly are the groups which switch the least – except for mobile services, where the
young are the group which exercises choice most frequently. However, in this regard need to be
noted, that the young, in this sample, refers to those respondents 21-24 years. No respondent younger
than 21 was included in the original Eurobarometer sample. As regards educational status, strong
differences between different socio-educational groups can be observed. The later a respondent exited
formal education (i.e. the higher educated), the more likely he or she is to switch a service provider.
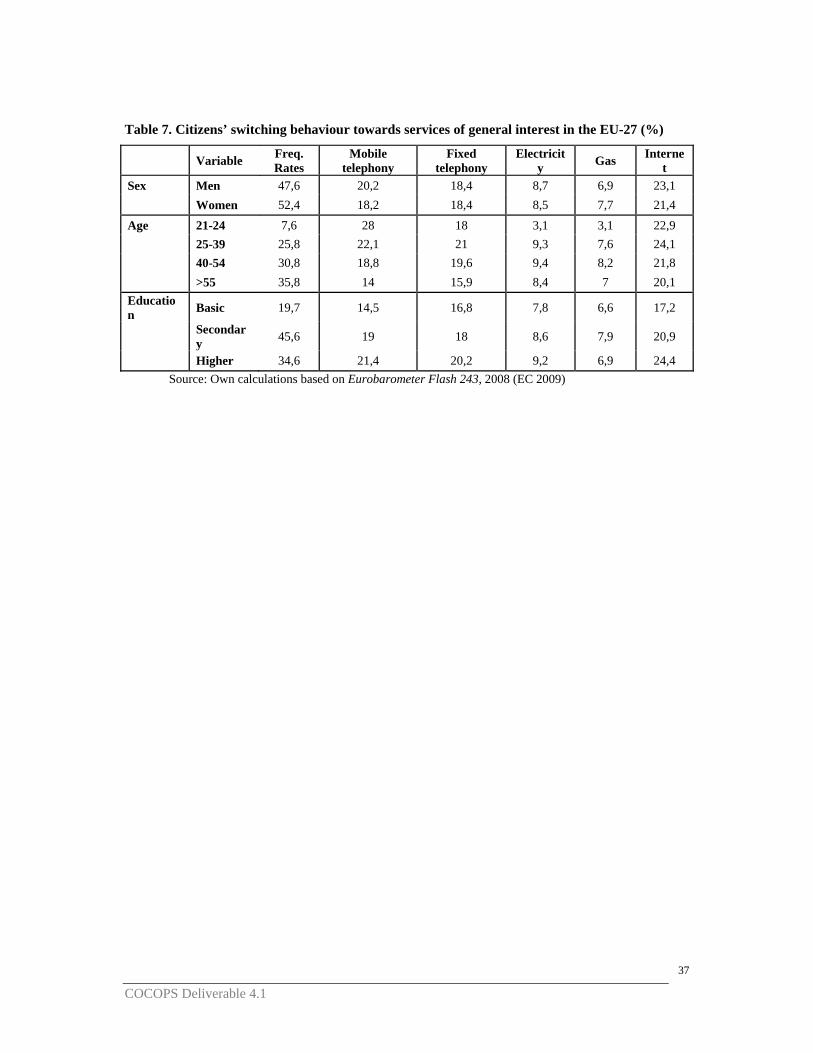
37
COCOPS Deliverable 4.1
Table 7. Citizens’ switching behaviour towards services of general interest in the EU-27 (%)
Variable Freq. Rates
Mobile telephony
Fixed telephony
Electricity Gas Interne
t Sex Men 47,6 20,2 18,4 8,7 6,9 23,1 Women 52,4 18,2 18,4 8,5 7,7 21,4
Age 21-24 7,6 28 18 3,1 3,1 22,9 25-39 25,8 22,1 21 9,3 7,6 24,1 40-54 30,8 18,8 19,6 9,4 8,2 21,8 >55 35,8 14 15,9 8,4 7 20,1 Education Basic 19,7 14,5 16,8 7,8 6,6 17,2
Secondary 45,6 19 18 8,6 7,9 20,9
Higher 34,6 21,4 20,2 9,2 6,9 24,4 Source: Own calculations based on Eurobarometer Flash 243, 2008 (EC 2009)

Coordinating for Cohesion in the Public Sector of the Future – www.cocops.eu
5. Conclusions
In the last few years, efforts to improve public infrastructure services in terms of
consumers welfare and satisfaction has led to a direct interest in the consumer perspective
among regulators all over the world, but particularly by the European Commission (EC). In
this effort, the EC has promoted certain tools for evaluating consumers’ satisfaction, mainly
the Eurobarometers. Based mainly on these sources, some papers have evaluated public
infrastructure services provision and regulation from the perspective of consumers’
satisfaction. Nevertheless, evidence is still extremely scarce and further research will be
required, as our review of the state of the art shows.
We note the existence of significant differences among EU countries and services in
terms of consumers’ satisfaction, although some of these differences appear to have
progressively decreased. Results and trends also depend on the dimension of satisfaction
which is considered: accessibility, affordability, quality of provision and so on. Nevertheless,
with the existing sources, most of trends in satisfaction across time are not easy to be
analyzed and further comparable Eurobarometers or similar surveys should be developed in
the future. Current Eurobarometer gives an incomplete picture of consumer satisfaction, and
frequent changes in the questionnaire and gaps in data coverage make longitudinal analysis
difficult, if not impossible.
With the existent evidence, some papers partially reject the theoretical benefits of the
regulatory reforms of public infrastructure services in terms of consumers’ satisfaction,
although also differentiating by distinct dimensions of the reforms. Another question of great
importance is citizens’ heterogeneity as consumers of public infrastructure services.
Consumers’ different backgrounds, networks and abilities have been ignored until recently in
regulatory design and evaluation, although both policy-makers and enterprises have
incorporated certain particular isolated policies for particular groups of consumers. Research
has clearly shown that there is considerable heterogeneity between different groups of
consumers of public infrastructure services. This heterogeneity involves citizens being
potentially more vulnerable as consumers than others. Some consumers, including the elderly,
those not employed or those with lower educational attainment are taking different decisions
in markets such as telecommunications, and as a result they obtain lower levels of
satisfaction. Illustratively, some empirical information on this regard is analyzed in this
report. Some socioeconomic characteristics, including being a woman, high age, having low
educational attainment, being unemployed, living alone or living in a rural area are associate
with lower probability of experiencing certain dimensions of satisfaction, notably satisfaction
with access, with price or with perceived consumer protection. It is also interesting to observe

COCOPS Deliverable 4.1 39
how certain patterns are sensitive to the dimension of satisfaction which is under analysis, for
instance, unemployed are particularly dissatisfied with services’ affordability, but not with
services accessibility, reflecting that satisfaction is an appropriate and scientifically useful
indicator of wellbeing and regulatory evaluation. Apart from this, patterns of satisfaction
among different dimensions, socioeconomic characteristics and services are highly consistent,
reinforcing this interest and utility. All this insights are also corroborated after comparing
patterns on satisfaction with patterns on decisions and behaviour. In general terms, higher
satisfaction is often associated with higher use of the services, meaning higher consumption
and participation in the market. In addition, and maybe paradoxically, higher satisfaction is
often related with a more active behaviour in terms of complaining, reflected again the closed
positive relation between voice, involvement, participation, consumption and satisfaction. A
more in-depth looks into how satisfaction, voice and choice are empirically related requires
more detailed and longitudinal data which Eurobarometer currently does not provide.

COCOPS Deliverable 4.1 40
6. References
6, Perri (2003): "Giving consumers of British public services more Choice: What can be learned from recent
history?", The Journal of Social Policy 32 (2), pp 239‐70.
Andreasen A. R. and Manning J. (1990): "The dissatisfaction and complaining behaviour of vulnerable
consumers", Journal of Consumer Satisfaction, Dissatisfaction and Complaining Behaviour, vol. 3, pp. 12–
20.
Appleby, J., Harrison, A. and Devlin, N. J. (2003): What is the Real Cost of More Patient Choice?, London: King's
Fund.
Armstrong, M. (2008): Interactions between competition and consumer policy, London: Office for Fair Trading.
Australian Government (2007): Behavioural Economics and Public Policy, Australian Government, Productivity
Commission, Melbourne (Australia), 8-9th August.
Australian Government (2008): Productivity Commission Inquiry into Australia’s Consumer Policy Framework,
URL: http://www.treasurer.gov.au.
Ayeni, V. (2000): Empowering the customer: the citizen in public sector reform, London: Commonwealth
Secretariat.
Bacchiocchi, E., Florio, M. and Gambaro, M. (2011): "Telecom reforms in the EU: prices and consumers'
satisfaction", Telecommunications Policy, vol. 35 (4), pp. 382‐396.
Bourguignon, F. and Sepúlveda, C. (2010): “Privatization in Development. Some lessons from experience”, Policy
Research Working Paper 5131, The World Bank.
Boyne, G. A., James, O., John, P. and Petrovsky, N. (2009): "Democracy and Government Performance: Holding
Incumbents Accountable in English Local Governments", The Journal of Politics, vol. 71 (4), pp 1273‐1284.
Brennan, C. and Coppack, M. (2008): “Consumer empowerment: global context, UK strategies and vulnerable
consumers”, International Journal of Consumer Studies, vol. 32 (4), pp. 306-313.
Clarke, J. and Newman, J. (2007): "What’s in a name? New labour’s citizen‐consumer and the remaking of public
services", Cultural Studies 21 (4‐5), pp 738–57.
Clarke, J., Newman, J., Smith, N., Vidler, E. and Westmarland, L. (2007): Creating citizen‐consumers: changing
publics and changing public services, London: Sage Publications.
Clifton, J., Comín, F. and Díaz-Fuentes, D. (2005): “Empowering Europe´s Citizens? On the prospects for the
Charter of Services of General Interest”, Public Management Review, vol. 7 (3), pp. 417-443.
Clifton, J. and Díaz-Fuentes, D. (2010): “Evaluating EU policies on public services: a citizens’ perspective”,
Annals of Public and Cooperative Economics, vol. 81 (2), pp. 281-311.
Clifton, J., Díaz-Fuentes, D., Fernández-Gutiérrez, M. and Revuelta, J. (2011a): "Is market-oriented reform
producing a "Two-track" Europe? Evidence for electricity and telecommunications", Annals of Public and
Cooperative Economics, vol. 82 (4), pp. 495-513.

COCOPS Deliverable 4.1 41
Clifton, J., Díaz-Fuentes, D., Fernández-Gutiérrez, M. and Revuelta, J. (2011b): "The new regulation of public
infrastructure services in the European Union. Challenges for territorial cohesion", European Regional
Science Association Congress, Barcelona (Spain), 31th August.
Conway, P. and Nicoletti, G. (2006): "Product Market Regulation in the Non‐Manufacturing Sectors of OECD
Countries: Measurement and Highlights", Economics Department Working Papers No.530, Paris: OECD.
Costas, A. (2007): “De consumidor a ciudadano: el papel de la satisfacción del ciudadano en la sostenibilidad de
los mercados de servicios públicos”, Información Comercial Española, vol. 836, pp. 33-50.
Dowding, K. and John, P. (2008): "The three exit, three voice and loyalty framework: a test with survey data on
local services", Political Studies 56 (2), pp 288‐311.
Dowding, K., John, P., Mergoupis, T. and Van Vugt, M. (2000): "Exit, voice and loyalty: Analytic and empirical
developments", European Journal of Political Research, vol. 37 (4) pp 469‐495.
EC (European Commission) (1997): Eurobarometer 47.0: L´Europe des Consommateurs, Les Citoyens face à
l´ouverture à la concurrence des monopoles de services publics, Brussels: EC.
EC (European Commission) (2000): Eurobarometer 53.0: Les Européens et les services d´intérêt généraux,
Brussels: EC.
EC (European Commission) (2002): Eurobarometer 58.0: Consumers´ opinions on Services of General Interest in
the EU 15, Brussels: EC.
EC (European Commission) (2003a): CCEB Eurobarometer: Consumers' opinions on services of general interest
in the New Member States, Brussels: EC.
EC (European Commission) (2003b): European consumers and services of general interest in the EU 25, Brussels:
EC.
EC (European Commission) (2003c): Flash Eurobarometer 150 (Quality of Services), Brussels: EC.
EC (European Commission) (2004a): White Paper on Services of General Interest, COM (2004) 374, Brussels:
EC.
EC (European Commission) (2004b): EU competition policy and the consumer, Luxembourg: Office for Official
Publications of the European Communities.
EC (European Commission) (2005a): Eurobarometer 62.1: Consumers opinions on Services of General Interest,
Brussels: EC.
EC (European Commission) (2005b): Eurobarometer 63.1: Science and Technology, Social Values and Services of
General Interest, Brussels: EC.
EC (European Commission) (2007): Eurobarometer 65.3: Consumers opinions on Services of General Interest,
Brussels: EC.
EC (European Commission) (2008a): How Can Behavioural Economics Improve Policies Affecting Consumers?,
DG Health and Consumer Protection, Brussels (Belgium), 28th November.
EC (European Commission) (2008b): Questions and Answers on Behavioural Economics, MEMO/08/748,
Brussels: EC.

COCOPS Deliverable 4.1 42
EC (European Commission) (2009): Flash Eurobarometer 243: Consumers' views on swithching service
providers, Brussels: EC.
EC (European Commission) (2010): Behavioural economics, so what: should policy makers care?, DG Health and
Consumers, Brussels (Belgium), 22th November.
Executive Office of the President (2010): Disclosure and Simplification as Regulatory Tools, Memorandum for the
Heads of Executive Departments and Agencies, Washington: Executive Office of the President, URL:
http://www.whitehouse.gov.
Federal Trade Commission (2007): Behavioral Economics and Consumer Policy, New Jersey (USA), 14th
September.
Fiorio, C. V., Florio, M., Salini, S. and Ferrari, P. (2007): “European Consumers’s Attitudes on Services of
General Interest: Accessibility, Price and Quality”, DEAS Working Papers, 2007-04, Dipartimento di
Scienze Economiche Aziendali e Statistiche, Universitá degli Studi di Milano.
Fernández-Gutiérrez, M. (2011): Contributions to the Economic Analysis and Evaluation of Public Services in the
European Union from the Perspective of Citizens as Consumers, Thesis presented at the Department of
Economics of the University of Cantabria.
Fiorio, C. V. and Florio, M. (2009): “The reform of Network Industries, Privatization and Consumers’ Welfare:
Evidence from the EU15”, DEAS Working Papers, 2009-41, Dipartimento di Scienze Economiche
Aziendali e Statistiche, Universitá degli Studi di Milano.
Fiorio, C. V. and Florio, M. (2011): ""Would you say that the price you pay for electricity is fair?". Consumers'
satisfaction and utility reforms in the EU15", Energy Economics, vol. 33, pp. 178-187.
Fiorio, C. V., Florio, M. and Perucca, G. (2011): “Consumers' Satisfaction and Regulation of Local Public
Transport: Evidence from European Cities, DEAS Working Papers, 2011-26, Dipartimento di Scienze
Economiche Aziendali e Statistiche, Universitá degli Studi di Milano.
Fletcher, A. (2008): “What do policy-makers need from behavioural economists?”, How Can Behavioural
Economics Improve Policies Affecting Consumers?, Brussels (Belgium), 28th November.
Frey, B. S. and Stutzer, A. (2002): “What Can Economists Learn from Happiness Research?”, Journal of
Economic Literature, vol. XL, pp. 402-435.
Hirschman, A.O. (1970): Exit, voice, and loyalty: responses to decline in firms, organizations, and states,
Cambridge: Harvard University Press.
Hodgson, G. M. (1998): “The approach of institutional economics”, Journal of Economic Literature, vol. 36 (1),
pp. 166-192.
Hogg, M. K., Howells, G. and Milman, D. (2007): “Consumers in the Knowledge-Based Economy (KBE): What
creates and/or constitutes consumer vulnerability in the KBE?”, Journal of Consumer Policy, vol. 30 (2),
pp. 151-158.
House of Commons Public Administration Select committee (2005): Choice, voice and public services: Volume I,
London.
Ilzkovitz, F., Dierx, A. and Sousa, N. (2008): An analysis of the possible causes of product market malfunctioning
in the EU: First results for manufacturing and service sectors, Economic Papers 336, European
Commission.

COCOPS Deliverable 4.1 43
Institute for Government (2010): Mindspace. Influencing behaviour through public policy, London: Institute for
Government, Cabinet Office.
James, O. (2009): "Evaluating the Expectations Disconfirmation and Expectations Anchoring Approaches to
Citizen Satisfaction with Local Public Services", Journal of Public Administration Research and Theory,
vol. 19 (1), pp. 107-123.
James, O. and John, P. (2007): "Public Management at the Ballot Box: Performance Information and Electoral
Support for Incumbent English Local Governments", Journal of Public Administration Research and
Theory, vol. 17 (4), pp 567‐580.
Jilke, S. and Van de Walle, S. (2012): ‘Two-Track public services? Citizens’ voice behavior towards liberalized
services in the EU15’, Public Management Review (forthcoming).
Le Grand, J. (2007): The other invisible hand: delivering public services through choice and competition, Princeton:
Princeton University Press.
Lent, A. and Arend, N. (2004): Making choices: How can choice improve local public services?, London: New Local
Government Network.
Lyons, W. E. and Lowery, D. (1989): "Citizen Responses to Dissatisfaction in Urban Communities: A Partial Test of
a General Model", The Journal of Politics, vol. 51 (4), pp 841‐868.
Kahneman, D., Knetsch, J. L. and Thaler, R. H. (1991): “Anomalies: The Endowment Effect, Loss Aversion and
Status Quo Bias”, Journal of Economic Perspectives, vol. 5 (1), pp. 193-206.
Mohan, J. (2003): Reconciling equity and choice? Foundation hospitals and the future of the NHS, London:
Catalyst.
Mullainathan, S. and Thaler, R. (2000): “Behavioural economics”, Working Paper Series, 00-27, Department of
Economics, Massachusetts Institute of Technology.
Mulholland, J. P. (2007): “Behavioural economics and the Federal Trade Commission”, Behavioural Economics
and Public Policy, Melbourne (Australia), 8-9th August.
Needham, C. (2007): The reform of public services under New Labour: narratives of consumerism, New York:
Palgrave Macmillan.
OECD (Organization for Economic Co-Operation and Development) (2008a): Racionalidad económica de las
políticas de competencia y del consumidor, Paris: OECD.
OECD (Organization for Economic Co-Operation and Development) (2008b): Enhancing Competition in
Telecommunications: Protecting and Empowering Consumers, París: OECD.
OECD (Organization for Economic Co-Operation and Development) (2009a): Privatisation in the 21st Century:
Recent Experiences of OECD Countries Report on Good Practices, Paris: OECD.
OECD (Organization for Economic Co-Operation and Development) (2009b): Focus on Citizens. Public
Engagement for Better Policy and Public Services, Paris: OECD.
OECD (Organization for Economic Co-Operation and Development) (2010): Consumer policy toolkit, Paris:
OECD.

COCOPS Deliverable 4.1 44
Office for Fair Trading (1998): Vulnerable consumer groups: quantification and analysis, London, Office of Fair
Trading.
Poggi, A. and Florio, M. (2010): “Energy deprivation dynamics and regulatory reforms in Europe: Evidence from
household panel data”, Energy Policy, vol. 38, pp. 253-264.
Powell, M. (1995): "The strategy of equality revisited", Journal of Social Policy 24 (2), pp 163‐185.
Powell, M., Doheny, S., Greener, I. and Mills, N. (2009): "Introduction: managing the 'unmanageable consumer'"
in R. Simmons, M. Powell and I. Greener (eds.), The consumer in public services: Choice, values and
differences, Bristol: Policy Press, pp 1‐17.
Rutherford, M. (1996): Institutions in economics. The Old and the New Institutionalism, Cambridge: Cambridge
University Press.
Salucci, L. and Bickers, K. (2011): "Exit, voice, and electoral turnover", Urban Affairs Review, 47 (2), pp 155-182.
Schwartz, H. (2007): “A Introduction to Behavioral Economics: The Complicating but Sometimes Critical
Considerations”, 25th Anniversary Conference of the Society for the Advancement of Behavioural
Economics, New York (USA), 15-18th May.
Van Dooren, W. and Van de Walle, S. (2008): “Reality is merely an illusion, albeit a persistent one: introduction
to the performance measurement symposium”, International Review of Administrative Sciences, vol. 74,
pp. 531-534.
Wilbur, C. K. and Harrison, R. S. (1978): “The methodological basis of institutional economics: pattern model,
storytelling, and holism”, Journal of Economic Issues, vol. 12 (1), pp. 61-89.

COCOPS Deliverable 4.1 45