regulatory impact review, regulatory …archive.gulfcouncil.org/beta/gmfmcweb/downloads/bb … ·...
TRANSCRIPT

Tab E, No. 6(b)
REGULATORY IMPACT REVIEW, REGULATORY FLEXIBILITY ACT ANALYSIS, AND SOCIAL IMPACT ASSESSMENT FOR THE PROPOSED RULE TO MODIFY THE
LIST OF ALLOWABLE BYCATCH REDUCTION DEVICES FOR USE IN THE SOUTHEASTERN SHRIMP FISHERY
MARCH 2007
1.0 Regulatory Impact Review
1.1 Introduction
The National Marine Fisheries Service (NOAA Fisheries Service) requires a Regulatory Impact Review (RIR) for all regulatory actions that are of public interest. The RIR: (1) provides a comprehensive review of the incidence and level of impacts associated with a proposed or final regulatory action; (2) provides a review of the problems and the policy objectives prompting the regulatory proposals and an evaluation of the major alternatives that could be used to solve the problem; and (3) ensures that the regulatory agency systematically and comprehensively considers all available alternatives so that the public welfare can be enhanced in the most efficient and cost-effective way.
The RIR provides the information needed to determine if the proposed regulations constitute a significant regulatory action under Executive Order 12866 and serves as the basis for determining if the action will have a significant economic impact on a substantial number of small entities as per the requirements of the Regulatory Flexibility Act (RFA). This RIR analyzes the expected economic consequences of the proposed rule to modify the list of allowable bycatch reduction devices (BRDs) for use in the Southeastern shrimp fishery. NOAA Fisheries Service proposes to restrict the allowable placement of the Fisheye BRD and decertify the use of the Expanded Mesh BRD for the Gulf of Mexico shrimp fishery. Additionally, with the implementation of the proposed placement of the Fisheye BRD, there would be no need to identify the Gulf Fisheye BRD as a separate configuration, and the Gulf Fisheye BRD would be removed from the list of allowable BRDs.
The two configurations of the Fisheye BRDs are the industry standard throughout the Gulf of Mexico shrimp fishery. The Expanded Mesh BRD, certified only off parts of the west Florida coastline, is used by a very limited number of vessels. Currently, the Fisheye BRD may be placed as much as 12.5 feet from the cod end tie-off rings. NOAA Fisheries Service is proposing in this rule to revise the allowable placement to be no farther forward than 9.0 feet from the cod-end tie-off rings.
1.2 Problems and Issues
The fishery for shrimp in the exclusive economic zone (EEZ) of the Gulf of Mexico is managed under the shrimp FMP prepared by the Gulf of Mexico Fishery Management Council (Gulf

Council). The fishery for shrimp in the EEZ of the South Atlantic is managed under the shrimp FMP prepared by the South Atlantic Fishery Management Council (South Atlantic Council). The FMPs are implemented under the authority of the Magnuson-Stevens Fishery Conservation and Management Act (Magnuson-Stevens Act) by regulations at 50 CFR part 622.
Regulations implementing Amendment 2 to the South Atlantic shrimp FMP (62 FR 18536, April 16, 1997), required the use of BRDs in the South Atlantic penaeid shrimp fishery, and established descriptions of BRD designs and configurations allowed for use in the fishery. The final rule implementing Amendment 6 to the South Atlantic Council’s shrimp FMP (70 FR 73383, December 12, 2005) expanded the BRD requirement to include the rock shrimp fishery.
Regulations implementing Amendment 9 to the FMP were published April 14, 1998 (63 FR 18139). The final rule established a requirement, with limited exceptions, for the use of certified BRDs in shrimp trawls towed in the Gulf of Mexico EEZ shoreward of the 100-fm (183-m) depth contour west of 85 ̊30' W. longitude (western Gulf), the approximate longitude of Cape San Blas, FL. The rule established descriptions of BRD designs and configurations allowed for use in the western Gulf shrimp fishery. Specifically, BRDs reducing bycatch mortality of juvenile red snapper by a minimum of 44 percent from the average level of mortality on these age-0 and age-1 groups during the years 1984-1989 would be certified for use in the western Gulf shrimp trawl fishery.
Two Fisheye configurations were two of the three BRD designs certified for use in the western Gulf. The Fisheye BRD was certified in the final rule implementing Amendment 9 to the FMP. The Gulf Fisheye BRD was initially certified for time-limited use by interim rule (63 FR 27499, May 19, 1998; 63 FR 64430, November 20, 1998), and subsequently certified for use through a final rule published July 13, 1999 (64 FR 37690). These two BRD configurations met the existing bycatch reduction certification criterion listed above.
To better address the requirements of national standard 9 of the Magnuson-Stevens Act, regulations implementing Amendment 10 to the FMP (69 FR 1538, January 9, 2004) required BRDs in shrimp trawls fished in the EEZ east of 85 ̊30' W. longitude (eastern Gulf). To be certified for use in the EEZ of the eastern Gulf, a BRD has to reduce finfish bycatch by at least 30 percent, by weight. The Council established a new criterion because juvenile red snapper are not common in the eastern Gulf. The Expanded Mesh BRD did not meet the bycatch reduction certification criterion for the western Gulf of Mexico, but did meet the certification criterion for the eastern Gulf of Mexico.
In 2006, the GMFMC developed a regulatory Amendment to modify the bycatch reduction certification criterion for the western Gulf of Mexico to be consistent with the criteria identified for the eastern Gulf of Mexico and the South Atlantic region: a 30-percent reduction in finfish biomass. This action is being undertaken through separate rulemaking. The Council prepared an Environmental Impact Statement (EIS) in conjunction with Amendment 9; an Environmental Assessment (EA) in conjunction with Amendment 10, and an EA in conjunction with its 2006 regulatory amendment establishing a single BRD certification criterion. The following findings regarding the impacts of the proposed action to revise the allowable list of BRDs for use in the Gulf of Mexico shrimp fishery are based on discussions, analyses, and conclusions of the EA for the 2006 regulatory amendment.
2

Currently, the Fisheye BRD and Gulf Fisheye BRD are certified for use throughout the Gulf of Mexico and South Atlantic regions. The two nominal BRDs are the same device; the distinction between them is related to their position within the cod end of the trawl. The existing regulations require the Fisheye BRD to be placed along the top center of the cod end of a shrimp trawl no further forward than 11 ft (3.4 m) from the cod end tie-off rings. Subsequent tests of the Fisheye BRD in slightly different configurations led to the certification of the Gulf Fisheye BRD. In this configuration, the Fisheye may be placed 15 meshes on either side of top center, between 8.5 ft (2.6 m) and 12.5 ft (3.8 m) from the cod end tie-off rings, thus expanding the allowable configuration of the device itself.
As already noted and in accordance with the BRD framework procedures of the Gulf shrimp FMP, the Gulf Council recently proposed to modify the existing BRD certification criterion for the western Gulf to be consistent with the criterion for the eastern Gulf and the criterion for the South Atlantic region. Assuming this new criterion is implemented through final rulemaking, a BRD would have to demonstrate at least a 30-percent reduction in the weight of finfish bycatch to be certified for use in either the Gulf of Mexico or South Atlantic shrimp fisheries. In this same rulemaking, NMFS is also proposing a new “provisional” certification criterion. To be provisionally certified, for a time-limited use in the southeastern shrimp fishery, a BRD would have to demonstrate at least a 25-percent reduction in the weight of finfish bycatch.
Because of the simplistic design and low cost of the Fisheye BRDs, they became the industry standard. The most commonly used configuration in the Gulf shrimp fishery has the BRD placed 10.5 ft (3.2 m) to 12.5 ft (3.8 m) forward of the cod end tie-off rings. Based on recent observer data collected aboard shrimp vessels fishing in the Gulf of Mexico, NMFS’ Southeast Fisheries Science Center (SEFSC) estimates that the Fisheye BRDs in this configuration are achieving between 11- and 25-percent reductions in fishing mortality on juvenile red snapper and a 13- to 23-percent reduction in finfish bycatch by weight. Thus, they do not meet the original criterion based on red snapper mortality reductions, the proposed 30-percent finfish reduction criterion, or the 25-percent finfish bycatch reduction criterion to be provisionally certified.
However, placed farther back in the cod end, the Fisheye BRD is more effective. When placed no farther forward than 9 feet (2.7 m) (102-105 meshes) from the tie-off rings, the Fisheye BRD achieves a 37 percent reduction in total finfish bycatch by weight. There is a 98 percent probability the true reduction rate of the Fisheye BRD in this placement meets the proposed certification criterion.
Similarly, recent data indicate the efficiency of the Expanded Mesh BRD, currently certified for use in the eastern Gulf and South Atlantic, has decreased. During the original tests of the Expanded Mesh BRD in the mid-1990s, it achieved between a 30- and 35-percent reduction in total finfish. Recent tests of the Expanded Mesh BRD in the Gulf of Mexico indicate it is only achieving about a 17-percent reduction in total finfish. Thus, it does not meet the criteria to be certified or provisionally certified.
For the Fisheye BRDs and the Expanded Mesh BRD, the potential of the BRDs has not changed. But it appears fishing behavior, or some other factor, in the fleet has changed. Actions to maximize
3

shrimp retention, without concurrently maintaining fish reductions, have diminished the BRDs' effectiveness to reduce bycatch. There have been numerous technological changes to the overall construction of shrimp trawl gear, such as new turtle excluder devices and longer nets. In addition, there have been changes in fishing practices to help increase shrimp retention, such as faster towing speeds and modified retrieval procedures. Although the exact reasons for the BRDs’ change in efficiency are not known, in practice, the Fisheye BRDs in their most commonly used configurations and the Expanded Mesh BRD do not appear to be meeting the current or proposed reduction criterion.
1.3 Objectives
This proposed rule aims to further reduce total finfish bycatch, including juvenile red snapper, in the Gulf of Mexico shrimp fishery by modifying the list of allowable BRDs for use in the Southeast shrimp fishery in order to better address the requirements of National Standard 9 and aid in the rebuilding of the Gulf of Mexico’s overfished red snapper stock. The proposed rule will also eliminate nomenclature confusion regarding allowable types of BRDs in both the South Atlantic and Gulf of Mexico shrimp fisheries.
1.4 Description of the Fishery
1.4.1 General Description
The Final Environmental Impact Statement (FEIS) for the original Shrimp FMP and the FMP as revised in 1981 contain a description of the Gulf shrimp fishery (GMFMC 1981). This material is incorporated by reference and is not repeated here in detail. Amendment 9 (GMFMC 1997) with an SEIS and Amendment 13 (GMFMC 2005) with an EA updated this information along with that of Habitats, Distribution, and Incidental Capture of Sea Turtles. A Biological Opinion (NMFS 2002a) further updated the description of shrimp trawling interactions with endangered and threatened sea turtles, and an additional Biological Opinion (NMFS 2006) incorporated descriptions of interactions with the newly listed smalltooth sawfish.
As an overview, the management unit of this FMP consists of brown, white, pink, and royal red shrimp. Seabobs and rock shrimp occur as incidental catch in the fishery. GMFMC (1997) described a number of additional species of primarily vertebrate finfish and invertebrates that are taken as bycatch. The current ratio of shrimp to bycatch in the overall penaeid shrimp fishery is approximately 1:4.
Brown shrimp is the most important species in the U.S. Gulf fishery with principal catches made from June through October. Annual commercial landings in recent years range from approximately 61 to 103 million pounds of tails depending on environmental factors that influence natural mortality. The fishery extends offshore to about 40 fathoms.
White shrimp, second in value, are found in near shore waters to about 20 fathoms from Texas through Alabama. There is a small spring and summer fishery for overwintering individuals, but
4

the majority are taken from August through December. Recent annual commercial landings range from approximately 36 to 71 million pounds of tails.
Pink shrimp are found off all Gulf states but are most abundant off Florida's west coast and particularly in the Tortugas grounds off the Florida Keys. Most landings are made from October through May with annual commercial landings range from approximately 6 to 19 million pounds of tails. In the northern and western Gulf states, pink shrimp are landed mixed with brown shrimp and are usually counted as browns. Most catches are made within 30 fathoms.
The commercial fishery for royal red shrimp has expanded in recent years with the development of local markets. This deep-water species is most abundant on the continental shelf from about 140 to 275 fathoms east of the Mississippi River. Thus far, landings have not reached the MSY, OY, and TAC estimate of 392,000 pounds of tails in any year and have varied from approximately 200,000 to 300,000 pounds from a high of approximately 336,000 pounds in 1994.
The three principal species (penaeids) are short-lived and provide annual crops; however, royal red shrimp live longer, and several year classes may occur on the grounds at one time. The condition of each shrimp stock is monitored annually, and none has been classified as being overfished for over 40 years.
Brown, white, and pink shrimp are subjected to fishing from inland waters and estuaries, through the state-regulated territorial seas, and into federal waters of the EEZ. Royal red shrimp occur only in the EEZ. Management measures implemented under the M-SFCMA apply only to federal waters in the EEZ. Cooperative management occurs when state and federal regulations are consistent. Examples are the seasonal closure off Texas, the Tortugas Shrimp Sanctuary, and the shrimp/stone crab seasonally closed zones off Florida.
NOAA Fisheries Service has classified commercial shrimp vessels comprising the near shore and offshore fleet into size categories from under 25 feet to over 85 feet. More than half fall into a size range from 56 to 75 feet.
Federal permits for shrimp vessels are currently required, and state license requirements vary. Many vessels maintain licenses in several states because of their migratory fishing strategy. The number of vessels in the fishery at any one time varies due to economic factors such as the price and availability of shrimp and cost of fuel. In addition to the federal shrimp vessel permits, the NOAA Fisheries Service maintains two types of vessel files, both of which are largely dependent on port agent records. One is for vessels that are recorded as landing shrimp, the Shrimp Landings File (SLF); the other is the Vessel Operating Units File (VOUF) that lists vessels observed at ports. The number of commercial vessels participating in the Gulf shrimp fishery is not known but approximately 2,951 vessels obtained a permit sometime within the period from implementation of Amendment 11 (December 2002) and May 5, 2005, and previous estimates from the SLF and VOUF indicated approximately 4,000 vessels. NOAA Fisheries Service estimates fishing effort independently from the number of vessels fishing. NOAA Fisheries Service uses the number of hours actually spent fishing from interview data with vessel captains to develop reports as 24-hour days fished. These estimates have been controversial and not well understood because the effort reported does not necessarily reflect the number of active vessels in the fleet.
5

A recreational shrimp trawl fishery occurs seasonally and almost entirely in the inside waters of the states. There are about 8,000 small boats participating using trawls up to 16 feet in width. About half the boats are licensed in Louisiana.
Bait landings of juvenile brown, pink, and white shrimp, occur in all states and are not routinely included in the NOAA Fisheries Service statistics. Estimates from the original FMP suggest landings of about 5 MP (whole weight) in 1980.
Various types of gear are used to capture shrimp including but not limited to cast nets, haul seines, stationary butterfly nets, wing nets, skimmer nets, traps, and beam trawls. The otter trawl with various modifications, is the dominant gear used in offshore waters. A basic otter trawl consists of a heavy mesh bag with wings on each side designed to funnel the shrimp into the cod-end or tail. A pair of otter boards or trawl doors positioned at the end of each wing holds the mouth of the net open by exerting a downward and outward force at towing speed.
The two basic otter-trawl designs used by the Gulf shrimp fleet are the flat and the semi-balloon trawls (Klima and Ford 1970). The mouth of the flat trawl is rectangular in shape, whereas the mouth of the semi-balloon design forms a pronounced arch when in operation.
Try nets are small otter trawls about 12 to 16 feet in width that are used to test areas for shrimp concentrations. These nets are towed during regular trawling operations and lifted periodically to allow the fishermen to assess the amount of shrimp and other fish and shellfish being caught. These amounts in turn determine the length of time the large trawls will remain set or whether more favorable locations will be selected.
Until the late 1950s, most shrimp vessels pulled single otter trawls ranging from 80 to 100 feet in width (Idyll 1963). Double-rig trawling was introduced into the shrimp fleet during the late 1950s. The single large trawl was replaced by two smaller trawls, each 40 to 50 feet in width, towed simultaneously from stoutly constructed outriggers located on the port and starboard sides of the vessels. The port trawl was towed about 150 feet in back of the starboard trawl to prevent fouling. The advantages of double-rig trawling include: (1) increased catch per unit of effort, (2) fewer handling problems with the smaller nets, (3) lower initial gear costs, (4) a reduction in the costs associated with damage or loss of the nets, and (5) greater crew safety (Idyll, 1963).
In 1972, the quad rig was introduced in the shrimp fishery, and by 1976 it became widely used in the EEZ of the western Gulf. The quad rig consists of a twin trawl pulled from each outrigger. One twin trawl typically consists of two 40-foot trawls connected to a center sled and spread by two outside trawl doors. Thus, the quad rig with two twin trawls has a total spread of 160 feet versus the total spread of 110 feet in the old double rig of two 55-foot trawls. The quad rig has less drag and is more fuel efficient. For some designs, a lower opening reduces fish bycatch (David Harrington, personal communication).
Although the industry continuously works to develop more efficient gear designs and fishing methods, the quad rig is still the primary gear used in federal waters. In recent years, the skimmer trawl has become a major gear in the inshore shrimp fishery in the northern Gulf.
6
1.4.2 Economic Description of the Fishery
A general description of the fishery was presented in the previous section. This section presents additional detailed information considered to be important to a thorough understanding of the economic aspects of the fishery, and thus to the analysis of the management alternatives being considered in this proposed rule. The descriptive information presented in the sections below are with regard to conditions as they existed in 2005, since this is the most recent year for which complete data are available to generate the necessary information.
As with any commercial fishery, the Gulf of Mexico commercial shrimp fishery has three primary sectors: the harvesting sector (i.e. vessels), dealers/wholesalers, and processors.1 The harvesting sector is the focus of the following description and analysis given that it is the sector most directly affected by management measures. However, that sector has multiple components as well. For example, and as reflected in the current management structure, a subset of vessels focuses some or most of its harvesting activities on royal red shrimp. Although royal red shrimp landings are a relatively minor component of the overall fishery, they are important to a small subset of vessels within the commercial fishery. In addition, though the shrimp fishery is dominated by the use of otter trawls, butterfly and skimmer nets are also important. In particular, skimmer nets have become increasingly important in Louisiana’s inshore fishery, and their use is spreading in other inshore areas of the northern and eastern Gulf.2 Finally, though most shrimp in the Gulf are harvested for consumptive purposes, a commercial bait shrimp fishery does exist. Texas likely accounts for the highest percentage of these landings. However, vessel and trip level data on bait shrimp landings are not currently collected in Texas and thus it is not possible to ascertain or account for their importance to individual vessels in the shrimp fishery. Bait shrimp landings also occur in Alabama and Mississippi. However, due to regulations in those states, vessels may only possess a food or a bait shrimp license at any given point in time and thus those landings are not considered in the following analyses. Conversely, vessels in Texas may harvest shrimp for both food and bait purposes if they possess the proper licenses, which need not be possessed only on an “either/or” basis in that state. Vessels in Louisiana and on Florida’s Gulf coast may also harvest shrimp for either food or bait purposes, though no specific licenses are required to do so as in Texas. Bait shrimp landings from west Florida and Louisiana are accounted for in the following analyses.
Multiple databases exist by which to gauge participation and conditions in the Gulf shrimp fishery. Historically, NMFS’ Gulf Shrimp Landings File (SLF) has been the primary source of landings data. The Vessel Operating Units File (VOUF) has been another source of information regarding the participation of vessels in the fishery. The weaknesses of these two data sources were previously outlined in Amendment 11 (GMFMC 2001). In general, the SLF provides an incomplete picture of vessel participation due to the practice of consolidating trips in such a manner that the landing vessel’s identity is sometimes suppressed.3 The VOUF’s primary weakness is its
1 Some companies operate as both dealer/wholesalers and processors.
2 Skimmer nets are illegal in Texas.
3 See Kazmierczak et al. (2003) for the potential analytical repercussions of this practice.7

reliance on the dockside observation of vessels and their gear for purposes of determining current participation in the fishery, though it is also hampered by the fact that it only tracks Coast Guard documented vessels (i.e. state registered boats are not taken into account). These weaknesses partly precipitated the desire for a federal permit, so as to better identify and characterize the universe of participants in the EEZ component of the fishery. However, since the permit is only required for vessels operating in federal waters, permit data cannot be used to assess participation throughout all waters of the Gulf of Mexico. The ability to assess such participation has been recently improved by the implementation of trip ticket programs in Louisiana and Alabama, and the required reporting of vessel identification numbers in Florida’s trip ticket program. Data from the Louisiana and Alabama programs began to be directly incorporated into the SLF in 2002. Finally, possession of a permit does not necessitate actual participation in the fishery (i.e. some vessel permits may be “latent” or inactive as a result of an owner’s temporary loss of a vessel, a decision to use the vessel in another fishery, or speculation). Therefore, a composite of all these data sources has been used to generate information regarding participation in the entire fishery, though the focus will be on federal Gulf shrimp permit holders and their activities.
3.5.1.1 The Gulf Shrimp Fishery
In 2005, at least 5,322 vessels (including Coast Guard documented vessels and state registered boats) were active in the commercial Gulf shrimp fishery.4 This figure represents a decrease of 2,161 vessels, or approximately 28.9%, since 2002. Of these 5,322 vessels, 3,516 are not expected to qualify for federal Gulf shrimp permits under the moratorium proposed in Amendment 13. The other 1,806 active vessels are expected to qualify for moratorium permits. Thus, of the 2,666 vessels expected to qualify for moratorium permits, 860 vessels were not active (i.e. had no Gulf food shrimp landings) in 2005. These figures compare to 2,264 active qualifying vessels and 458 inactive qualifying vessels in 2002, which indicates a decrease of 458 vessels (approximately 20.2%) in the number of active, qualifying vessels between 2002 and 2005.
Total food shrimp landings and revenues were 134.56 million pounds (tails) and $347.34 million, respectively. Those landings and revenues can be broken down further into the following general categories: landings and revenues to qualifying vessels, to non-qualifying vessels, to large as opposed to small vessels,5 and to unknown vessels. It is important to remember that “known” vessels includes all qualifying vessels (active and inactive) and all active, non-qualifying vessels. This breakdown and related statistics are presented in Tables 12 and 13. Table 14 presents statistics for known, active vessels only and thus removes the effect of inactive, qualifying vessels on average food shrimp landings and revenues per vessel. By comparing the information in Tables 12 and 14, it can be seen that removal of inactive qualifying vessels from the analysis of identifiable vessels increases average shrimp landings and revenues per vessel, particularly for large vessels.
Small vessels are more numerous than large vessels within the fishery as a whole and within the universe of non-qualifying vessels. However, as would be expected, large vessels dominate the universe of qualifying vessels. Large vessels also account for a much higher percentage of landings
4 For present purposes, “active” is defined as having any identifiable landings in the Gulf food shrimp fishery.
5 Large vessels are those greater than or equal to 60 feet in length, while small vessels are less than 60 feet.8
and revenues than their smaller counterparts within the fishery as a whole (i.e. they account for 78.6% of revenues to known vessels in the fishery), and even more so within the universe of qualifying vessels (93.6%). Conversely, because small vessels are dominate within the non-qualifying universe (i.e. they outnumber large vessels nearly 28 to 1), they account for a much higher percentage of landings and revenues (approximately 85.4%) within that particular group. In comparing information in Tables 13 and 15, it can again be seen that the removal of inactive vessels from the analysis of qualifying vessels increases average landings and revenues significantly for both large and small vessels.
With respect to comparisons between the total universe and qualifying universe, average landings and revenues are very similar for large vessels. This finding is expected since it would be very difficult for large vessels to economically survive without operating in the EEZ, and thus most would need a federal permit. This expectation is reflected by the relatively small level of food shrimp landings by large, non-qualifying vessels. Conversely, small qualifying vessels attain much higher levels of food shrimp landings and revenues on average relative to all small vessels. This finding reflects the fact that small qualifying vessels, which are more active than their non-qualifying small vessel counterparts (i.e. they spend more time operating in the Gulf food shrimp fishery), represent a much smaller percentage of the small vessel universe relative to the proportion that large qualifying vessels represent within the large vessel universe. Put alternatively, proportionally more large vessels than small vessels operate on a full-time basis and large vessels are more dependent than small vessels on the EEZ component of the fishery.
A few more observations about the non-qualifying vessels are worth noting before specifically analyzing the activities of qualifying vessels. For example, a much wider range of Gulf shrimp landings and revenues exists within that group than what would be expected, given the federal permit requirement in EEZ waters. Landings ranged from 1 to over 134,000 pounds and revenues from $3 to nearly $479,000 in 2005. Breaking down the gross revenues for these vessels into reasonable groupings, of the 3,516 non-qualifying vessels, the vast majority (2,145) grossed less than $10,000 in food shrimp revenues in 2005. Another 1,028 vessels had gross revenues between $10,000 and $50,000 and 249 vessels had gross revenues between $50,000 and $100,000. These revenue levels are to be expected for vessels that do not operate in EEZ waters and would thus not need to have a federal permit. However, 58 non-qualifying vessels had revenues between $100,000 and $150,000, 15 vessels had revenues between $150,000 and $200,000, and another 21 vessels exceeded $200,000. It is doubtful that these vessels, particularly those generating more than $150,000 in shrimp revenues, could achieve such levels of revenue generation without venturing into federal waters. In order to continue present operations, these 36 vessels will likely need to acquire a transferable federal permit once the moratorium is implemented. This figure is less than what was projected in the Amendment 13 analysis, which is undoubtedly due to the exit of vessels from the fishery in recent years; exit which is most likely the result of deteriorating economic conditions.
3.5.1.2 The Gulf Shrimp EEZ Fishery
The Gulf shrimp EEZ fishery can be examined from at least two different perspectives: either in terms of the entire universe of qualifying vessels or only those that are presently active in the
9

fishery. The analytically appropriate choice depends on the nature of the management alternatives under consideration. That is, some alternatives could directly or indirectly affect all qualifying vessels, regardless of whether they are currently active in the fishery, while others would only affect active, qualifying vessels.
A detailed statistical description of the universe of qualifying vessels and the sub-component of active qualifying vessels is presented in Tables 16 through 33. The descriptive statistics examine the distribution of these vessels’ revenues across different fisheries/species and thereby provide insight into these vessels’ dependency on each fishery. For current purposes, the considered fisheries/species are grouped as follows: Gulf food shrimp, Gulf bait shrimp, South Atlantic shrimp (all components), Gulf non-shrimp, and East Coast non-shrimp. Dependency on the Gulf food shrimp fishery is considered most important for current purposes, as that component of the fishery is the focal point of management. Physical characteristics are also examined. The data on the distribution of vessels’ revenues and their physical characteristics are broken down further according to vessel size category (i.e. “large” versus “small” vessels). The purpose of examining the data by vessel size is to gain a better understanding of fishery participants, their activities and behavior, and the roles they respectively play in the fishery as a whole.
With respect to statistics regarding the distribution of revenues for the qualifying universe of vessels (Table 16), the fact that the standard deviations are consistently close to or larger than the mean values indicates a high degree of heterogeneity within this group. That is, the amount of revenue earned in total and within each fishery differs considerably between vessels. Many qualifying vessels, though certainly not all, have a relatively high degree of dependency on the Gulf food shrimp fishery. Inactive vessels are not are not at all dependent on landings from the fishery, which is why the average percentage of revenue from the fishery is lower (66.4%) than what might be expected. If inactive vessels are removed from the analysis, the percentage increases to 87%. Between 2002 and 2005, the sources of these vessels’ commercial fishing revenues have remained relatively the same. As in 2002, approximately 5-6% of the qualifying vessels’ revenues come from Gulf bait shrimp, South Atlantic shrimp, and Gulf non-shrimp fisheries. However, the most notable change is the significant increase in revenues from non-shrimp fisheries on the U.S. east coast, which now represent more than 8% of these vessels’ total revenues compared to only .2% in 2002. Current data suggests that the majority of this increase is due to the exit of vessels from the Gulf shrimp fishery into the mid-Atlantic/New England scallop fishery, which has been one of the more lucrative commercial fisheries in recent years.
Relative to landings and revenues, the fleet of qualifying vessels is much more homogeneous with respect to physical characteristics (Tables 17 and 18), though some differences do exist. The average qualifying vessel is approximately 22 years old and 66 feet in length, with a gross tonnage, horsepower, hold capacity, and fuel capacity of 103 tons, 480, 34,000 pounds, and 11,440 gallons respectively. This vessel typically has 3 crew and uses between two and four 50 foot otter trawl nets. More than two-thirds of these vessels have steel hulls and approximately half have on-board freezing capacity.
The characteristics of active qualifying vessels in the Gulf food shrimp fishery differ from that of the entire universe of qualifying vessels. Most notably, active vessels in the fishery are far more dependent on Gulf food shrimp landings and revenues. Practically all (98% on average) of the
10

active qualifying vessels’ revenues come from Gulf food shrimp landings (Table 19). Also, active vessels are comparatively larger in terms of length, tonnage, and fuel capacity and more powerful in terms of horsepower (Table 20). Relatively more of the active vessels have steel hulls and on-board freezing capacity (Table 21). These findings are suggestive of the types of vessels that have been able to continue operating in the fishery in spite of recent and current adverse economic conditions.
In addition to whether or not qualifying vessels are active in the fishery, another primary source of heterogeneity is vessel size. As would be expected, small qualifying vessels generate lower levels of landings and revenues on average relative to their larger counterparts (Tables 22 and 28). Most interesting is the difference between large and small qualifying vessels with respect to their dependency on the Gulf food shrimp fishery. The percentage of revenues arising from food shrimp landings is 73% for large qualifying vessels, but only 49% for small qualifying vessels. Thus, on average, large qualifying vessels are more dependent on the Gulf food shrimp fishery than their smaller counterparts. Put alternatively, small vessels are more diverse and flexible than large vessels with respect to their operations, in general and across fisheries. This finding is consistent with results reported in Funk (1998). For large qualifying vessels, the primary source of other commercial fishing revenue is non-shrimp revenues from east coast fisheries, particularly the scallop fishery. For small qualifying vessels, approximately 21% of their total revenues comes from the Gulf bait shrimp fishery and Gulf non-shrimp fisheries.
However, it is also the case that dependency on Gulf food shrimp landings is much more variable within the small vessel sector than the large vessel sector. That is, many small vessels are quite dependent on food shrimp landings, while many others illustrate little if any dependency. To understand this difference, it is necessary to look at the distribution of active versus inactive (i.e. “latent”) vessels in the Gulf food shrimp fishery. As previously noted ,the data indicate that, of the 2,666 qualifying vessels, 860 did not have any verifiable Gulf shrimp landings in 2005 while 1,806 vessels did. Large and small vessels comprised approximately 79% and 21% of the active qualifying vessels, respectively. However, for inactive qualifying vessels, small vessels represent a relatively higher percentage of that group (41%) while large vessels represent a relatively smaller percentage (59%). In general, a vessel could be considered inactive for a variety of reasons, including permit speculation, participation in other fisheries during the selected time period, or the vessel being sunk or otherwise inoperable. It is also possible that a vessel’s landings were not identified because of the previously noted data recording and management issues. This fact is important to bear in mind because it is much more likely that a small vessel’s landings would have been missed than a large vessel’s landings, due to the consolidation of landings and suppression of vessel identifiers in the SLF, particularly if the former was in fact a state registered boat, and even more so if that boat were operating out of Texas and Mississippi, where trip ticket programs covering the food shrimp fishery are not in operation.
An examination of the geographic distribution of inactive qualifying vessel owners sheds some light onto this issue. Specifically, 32% of the inactive vessels’ owners are from Texas, 30.6% are from Florida (including the east coast), 14.9% are from Louisiana, 9.5% are from Alabama, 7% are from Mississippi and the remaining 6% are from non-Gulf states. It is quite likely that some of the alleged “latent” qualifying vessels in Texas and Mississippi may in fact be active, but their landings cannot be specifically identified given current data collection practices. For the other areas, the likely explanation is a combination of permit speculation and the flexible operations of those
11

vessels, particularly those that are small. However, this question can only be answered with certainty upon changes in current data collection practices (e.g. not consolidating landings of small vessels and suppressing their vessel identifiers in the SLF) and/or the implementation of trip ticket programs for the food shrimp fishery in Texas and Mississippi.
Regardless, according to available information, comparing statistics between all qualifying vessels as opposed to active qualifying vessels only by size category generates the following results. For large vessels, dependency on Gulf food shrimp revenues increases from the previously noted 73% to nearly 99% when only active vessels are considered (Table 25). Consistent with the above discussion, the change in dependency is even more dramatic for small vessels, which increases from the previously noted 49% to nearly 95% when only active vessels are considered (Table 31). Thus, when only considering active vessels in the Gulf food shrimp fishery, small vessels are almost equally dependent as their larger counterparts on revenues from the Gulf food shrimp fishery.
Also, on average, small qualifying vessels are also “smaller” in regards to almost all of their physical attributes relative to large qualifying vessels (Tables 23, 24, 29, and 30). For example, they use smaller crews, fewer and significantly smaller nets, have less engine horsepower, and significantly lower fuel and hold capacities. Small qualifying vessels are also older on average, indicating the trend towards the building and acquisition of larger vessels in the fishery during the past decade or so. Large qualifying vessels also tend to be steel-hulled. Fiberglass hulls are most prominent among small qualifying vessels, though steel and wood hulls are also common. Nearly two-thirds of the large qualifying vessels have on-board freezing capabilities while few small qualifying vessels have such equipment. Small vessels still rely on ice for refrigeration and storage, though more than one-third of large vessels also depend on ice. Some of the qualifying vessels are so small that they rely on live wells for storage.
Comparing information in Tables 23 and 24 to that in Tables 26 and 27, the physical characteristics of large qualifying vessels and active large qualifying vessels differ little. However, in comparing information regarding small qualifying vessels in Tables 29 and 30 with active small qualifying vessels in Tables 32 and 33, some differences exist. Specifically, the active vessels have larger fuel capacities, slightly greater hold capacity, horsepower and tonnage. A significantly higher percentage of the active vessels also have steel hulls, while fiberglass hulls are much less prevalent. Again, these findings are suggestive of the types of vessels that have been able to continue operating in the Gulf food shrimp fishery in spite of recent and current economic conditions.
3.5.1.3 Historical and Current Economic Status of the Gulf Shrimp Fishery’s Harvesting Sector
As has been noted in various publications and the media coverage, the Gulf shrimp fishery has been in economic decline for approximately the past four years. Travis and Griffin (2004) discuss this decline and its causes in detail, the highlights of which follow.
According to Funk (1998), which examined fleet profitability during the 1965 through 1995 time period, the average annual rate of return (net revenue or profit as a percentage of revenue) for the fishery as a whole was 12.5%, which is a respectable figure for capital investors. Given the
12

inherent variability in shrimp stock conditions from year to year and, thus, landings and revenues, it is not surprising that profitability was also quite volatile from year to year, with the industry experiencing exceptionally high profits in some years and very low or negative profits (losses) in other years. In addition to the annual variability in abundance, economic performance appeared to be largely driven by changes in fuel prices, with changes in crew share expenses playing a secondary role. Several researchers have noted that fuel costs have and continue to represent a significant portion of the industry’s operating costs (Haby et al. 2003; Ward et al. 1995). Thus, fluctuations in fuel prices can significantly impact the industry’s economic performance.
In addition to variability over time, Funk’s (1998) analysis also indicated that economic performance varied by vessel size. In general, rates of return tend to be higher on average for smaller vessels than for larger vessels, even though revenues and aggregate profits tend to be higher for the larger vessels. This result indicates that the costs of operating larger vessels also tend to be relatively higher, both in the aggregate and on a per unit basis, than those of smaller vessels. However, Funk (1998) hypothesized that ownership status and level of participation in the fishery were two of the most important factors explaining this variation in profitability. That is, smaller vessels tend to be predominantly operated by their owners, but only participate in the shrimp fishery on a part-time basis. These factors increase the flexibility of these vessels’ operations. In general, these vessels will only participate in the fishery when revenue and/or profit per unit of effort are relatively high. When low or negative profits are being earned, these vessels and their owners will allocate their time to other fisheries and endeavors. Conversely, the larger vessels are more frequently operated by hired captains, and participate in the fishery on a full-time basis. In addition to the fact that these captains must be paid, as well as the crew, these vessels have much less flexibility with respect to when they participate in the fishery. Good captains must be retained, lest they be lost to other owners, and bills for relatively high “fixed” costs, such as insurance, mortgage payments, etc., must still be paid regardless of whether the vessel fishes or not. Furthermore, many of these larger vessels are part of a vertically integrated operation (i.e. they are owned by processing firms). In such instances, the goal of the owner is likely to maximize profits for the entire operation as opposed to the individual vessel. A stable supply of shrimp is critical to the profitable operation of processing plants. All of these factors will cause these larger vessels to continue operating in the shrimp fishery, even when profits are low or negative. Therefore, on average and over time, a lower rate of return should be expected for larger vessels relative to smaller vessels in this fishery. Funk’s (1998) results confirm this expectation. Nonetheless, overall, this industry was historically profitable during this time period.
According to a subsequent analysis whose primary purpose was to analyze the impacts of the recent changes in TED regulations (NMFS 2002b), the large vessel component of the fishery was profitable to highly profitable between 1998 and 2000. Nominal shrimp prices were relatively stable, fuel prices were relatively low by historical standards, and abundance tended to be higher than historical averages. Undoubtedly, strong conditions at the macroeconomic level created relatively high levels of consumer demand for shrimp, which in turn engendered strong economic performance in the shrimp industry.
However, economic conditions took an abrupt turn in the latter half of 2001. Current evidence indicates that as imports surged, macroeconomic conditions deteriorated, and when the post-September 11, 2001 era began, the industry was hit by sharply declining prices and higher insurance
13

premiums.6 At least for the large vessel sector, profits turned into losses by the end of 2001. The deteriorating trend appears to have continued through 2002 and 2003, exacerbated by increases in fuel prices that began in the latter part of 2002 and continued through 2003. According to average price data reported by the Bureau of Labor Statistics (BLS), from 2002 to 2003, fuel prices increased between 21% and 29%, depending on the selected fuel price index.7 Regardless of which index is used, fuel prices increased significantly which, in turn, significantly increased shrimp vessels’ operating costs.
By 2002, as indicated in the economic analysis of the 2003 Texas Closure policy (Travis and Griffin, 2003) and the supplemental economic analysis of Amendment 10 to the Shrimp Fishery Management Plan (NMFS 2003), economic conditions deteriorated to the point where all sectors of the Gulf shrimp fishery, regardless of vessel size, state, or gear, were facing negative profits (losses) on average by the end of 2002. According to the Texas Closure analysis, for the fishery as a whole in 2002, the average rate of return (profits or losses as a percentage of revenue) was expected to be approximately -41%, with lower loss rates being experienced for the small vessel sector (-30%) relative to the large vessel sector (-45%). Regardless of whether the Texas Closure policy was continued or not, projections for 2003 indicated that these economic losses would persist under existing conditions at the time.
These analyses clearly indicated that rapidly declining prices were the primary source of the recent deterioration in the industry’s economic condition. In the aggregate, the average nominal price of shrimp in the Gulf decreased by approximately 28% between 2000 and 2002. Revenues decreased even more as a result of relatively lower shrimp abundance and, therefore, landings in 2001 and 2002 relative to 2000. The magnitude of the price decline varied by shrimp size category, with the under 15 count (“jumbo”) and 68 and over count (“small”) size categories seeing the smallest declines (approximately 23%) and the 31-40 and 41-50 count (“large” and “medium”) size categories seeing the largest declines (approximately 35%). Due to inflation, these price declines were even larger in real terms.
According to Haby et al. (2003), increases in shrimp imports have been the primary cause of the recent decline in U.S. shrimp prices. A complete discussion of the factors contributing to the increase in imports can be found in Haby et al. (2003). In general, recent surges in imports have been caused by increases in the production of foreign, farm-raised shrimp. More specifically, increased competition from shrimp imports has been due to three primary factors: 1) changes in product form due to relatively lower wages in the exporting countries, 2) shifts in production to larger count sizes, and 3) tariff and exchange rate conditions which have been favorable to shrimp imports into the U.S. With respect to the first factor, lower wage rates have allowed major shrimp exporters (e.g. Thailand) to increase production of more convenient and higher value product forms, such as hand-peeled raw and cooked shrimp. With respect to the second factor, changes in farming technology and species have allowed production of foreign product to shift towards larger, more
6 Increases in vessel insurance premiums were documented at that time in a Commercial Fisheries News article, a reprint of which can be found at http://www.fishresearch.org/Articles/2002/10/insurance.asp.
7 According to information posted to http://data.bls.gov on February 17, 2004, the Consumer Price Index’s average price data for fuel oil, Series APU00007251, indicated that fuel prices increased by 21% between 2002 and 2003. However, the PPI’s data on average prices for #2 diesel fuel, Series WPU057303, indicated that fuel prices increased by 29% during this time.
14

valuable sizes. As a result of these factors, imports are more directly competing with the product traditionally harvested by the domestic industry, thereby reducing the latter’s historical comparative advantage with respect to these product forms and sizes. Finally, with respect to the third factor, the lack of duties on shrimp imports into the U.S., the presence of relatively significant duties on shrimp imports into the European Union (E.U.), and the recent strength of the U.S. dollar relative to foreign currencies have created favorable conditions for countries exporting products to the U.S.
As Haby et. al.(2003) note, the increase in imports caused the domestic industry’s share of the U.S. shrimp market to decrease from 44.6% to 14.8% between 1980 and 2001. While the growth in imports was relatively steady throughout most of this time period (for e.g., 4% to 5% in the late 1990's), shrimp imports surged by 16% in 2001. Since 2001, which is the last year accounted for in their analysis, shrimp imports have continued to rise. Although the increase in 2002 was a modest 7.2%, relative to the increase in 2001, a significant increase of 19.1% occurred in 2003 according to the most recently available data.8 These increases led to further erosion in the domestic industry’s market share and additional price declines.
In order to further investigate changes to the industry’s economic status, a new economic analysis was conducted (Travis and Griffin, 2004). This updated analysis revealed that, on average, vessels were not even able to cover their variable costs in 2002. Preliminary information at the time indicated that domestic shrimp prices had continued to decline in 2003,9 which would lead to the expectation that the vessels’ inability to cover their variable costs would continue in 2003 and probably beyond. If vessels cannot cover their variable costs, they will be forced to cease operations (i.e. exit the fishery), at least until conditions change.
Projections of fleet size, as measured by full-time equivalent vessels (FTEVs), and nominal effort were updated and extended farther into the future (20 years, or through 2021) to determine how long it would take for the fishery to reach an equilibrium state, assuming no changes in external factors (e.g. imports, regulations, etc.). In general, equilibrium occurs once economic losses are no longer being incurred (i.e. economic profits are zero) and fleet size is stable (i.e. fleet size has reached its minimum level).
According to the updated projections, the average rate of return in the fishery for 2002 was projected to have been approximately -33%, slightly better than initial projections, and the difference between the rates of return in the small vessel sector and large vessel sector also narrowed to a small degree (-27% and -36%, respectively). Economic losses were forecasted to continue throughout the fishery on average until 2012, ceteris paribus. As would be expected, these losses cause vessels to continue exiting from the fishery during this time. The size of the large vessel sector and level of associated fishing activity decline continuously, in terms of FTEVs and nominal effort, through 2012 and were expected to have decreased by 39% and 34%, respectively, relative to 2002 levels. However, only the large vessel sector reached equilibrium by 2012. Although the number of FTEVs and nominal effort are expected to decrease in the small
8 Shrimp import data can be found at http://www.st.nmfs.gov/st1/trade/trade_prdct_cntry.html
9Available data at that time indicated that the decline in nominal prices from 2000 to 2003 was 36% across all size categories. Depending on the size category, the declines ranged from 27% to 40%.
15
vessel sector by approximately 29% by 2012, the small vessel sector continued to decrease in size and effort throughout the entire twenty-year simulation. The logic behind this differential result between the large and small vessel sectors is fairly straightforward. Specifically, as large vessels, which predominately operate in offshore waters, exit the fishery, their departure leads to an improvement in the economic performance of the large vessels that remain in the fishery, primarily as a result of increases in CPUE in offshore waters. However, given the migration pattern of shrimp from inshore to offshore waters, the departure of large vessels does not generally increase CPUE in inshore waters where the smaller vessels tend to operate. Conversely, the departure of small vessels improves the economic performance of both small and large vessels by removing competition in inshore waters and by allowing more shrimp to escape into offshore waters (i.e., CPUE should increase in both inshore and offshore waters). Although the economic performance of large vessels was projected to improve more quickly than that of small vessels, ceteris paribus, it must be emphasized that, under 2002 conditions, economic recovery even in the large vessel sector is not expected for several years.
It is important to note that these projections assumed that external factors such as imports, fuel prices, and other costs remain unchanged from their 2002 status. That is, information regarding increases in fuel prices, insurance premiums, and imports, and further declines in shrimp prices since 2002 was not incorporated into the model and analysis since final data were not yet available at that time. Since these changes would be expected to further erode the harvesting sector’s economic performance, the projections of economic losses, decreases in fleet size and effort, and the period of time before the large vessel sector stabilizes are likely underestimated. Thus, unless other factors change in a manner that would contravene these adverse impacts, these projections of fleet size and effort reductions should be considered conservative. Such contravening factors would include those which could be reasonably expected to increase prices, such as improvements in product quality and successful marketing programs that promote domestic, wild food shrimp, both of which would be expected to increase the demand for domestically produced shrimp. In theory, tariffs and other import restrictions (e.g. more stringent standards on the presence of antibiotics in farmed shrimp) could also lead to price increases.
Since the time of this analysis, many changes have continued to occur that would likely affect the economic status of the Gulf shrimp harvesting sector. Most of these changes would be expected to adversely affect the industry’s economic status. For example, fuel prices have risen significantly since 2002. Probably the best proxy to use for fuel prices paid by commercial shrimpers (or commercial fishermen in general) is the diesel fuel price paid by farmers, statistics for which are generated by the USDA. This price is more appropriate than the diesel fuel price "paid on the street," which is typically generated by the BLS, because it removes fuel excise taxes, which neither commercial fishermen nor farmers pay. The diesel fuel price per gallon paid by farmers changed as follows between 2002 and 2005: $.96, $1.24, $1.31, and $1.97.10 Although annual data is not yet available for 2006, the USDA reported that the diesel fuel price paid by farmers had increased to $2.28 per gallon as of April, 2006.11 This represents a price increase of nearly 138% between 2002 and April 2006, with the largest increases occurring in 2003, 2005, and early 2006.
10 See http://www.nass.usda.gov/pa/annsum05/pricespaid.pdf
11 See http://www.nass.usda.gov/ks/prices/2006/pricemay.pdf16
To provide some context, it is helpful to think of how these fuel price increases translate into increases in a typical vessel’s fuel expenses. With respect to the cost of filling up a shrimp vessel, the average fuel capacity of an active, qualifying vessel is approximately 13,000 gallons (see Table 20). Thus, between 2002 and April 2006, the cost of filling up an "average" active, qualifying shrimp vessel rose from approximately $12,500 to nearly $30,000. However, these costs differ considerably between large and small active, qualifying vessels. For large vessels with an average fuel capacity of approximately 16,000 gallons (Table 26), the fuel price increases cause the cost of filling up the vessel to increase from slightly more than $15,000 to more than $36,000. For small vessels, which only have an average fuel capacity of approximately 2,000 gallons (Table 32), the cost of filling up a vessel has increased from about $2,000 to nearly $4,600. In any case, again, the cost of filling up a shrimp vessel with fuel increased nearly 138% between 2002 and April 2006.
With respect to domestic shrimp prices, Table 43 presents information on changes in prices per pound by size count from 2000 through 2006. These prices are tail or heads-off prices, not heads-on prices, and smaller counts indicate larger shrimp. The information in this table suggests that the largest price declines were in 2001, 2002, and 2003, which is consistent with information in the previously discussed analyses. Domestic shrimp prices generally stabilized and in fact recovered to some extent in 2004 and 2005 prior to Hurricanes Katrina and Rita. However, those gains have largely been eliminated in the post-hurricane months of 2005 and early 2006, as prices are once more in decline. Although the recent price declines have occurred in the post-hurricane time frame, it should not be concluded that they are directly due to the hurricanes. Rather, as a result of declining participation and therefore effort in the fishery, which is partly due to the hurricanes, but also due to the adverse economic condition of the fishery, the average size of harvested shrimp has increased and landings have increased in the larger shrimp size categories (i.e. 15-20 and 21-25 count), which in turn has caused prices to decrease for those size categories. Second, and likely most important, the price gains that occurred in 2004 and the pre-hurricane months of 2005 were undoubtedly due to the impact of duties imposed on imported shrimp and the relative stabilization in the volume of imports coming into the U.S. In 2004, shrimp imports increased by 12.7% over their 2003 level. While still significant, it was less than the increase in 2003 and much of it was in the early part of the year. In 2005, shrimp imports increased by only 2.2% over their 2004 level. However, shrimp imports have once more been surging into the U.S. market in the past several months, and this is more than likely the primary cause of general (i.e. across all size counts) price decreases for domestic shrimp during that time. Specifically, from January through June 2006, shrimp imports were approximately 15.2% higher than they were during those same months in 2005.12
In sum, depending on the size, Gulf shrimp prices declined between 30% and 43% from 2000 to May 2006, with most of the declines occurring between 2001 and 2003. Between 2003 and May 2006, prices stabilized or increased in 2004 and 2005 before hurricanes Katrina and Rita. However, prices have declined since that time. Between 2003 and May 2006, prices increased between 2% and 22% for the smallest shrimp, basically remained stable for the "jumbo" size shrimp (under 15 count), but have decreased between 3% and 17% for most size categories. The declines have been greatest for the "large" shrimp (15-20 and 21-25 count), which have also become the predominant size counts in the domestic landings and thus what the offshore fleet has become most dependent on to generate revenues.
12 See http://www.st.nmfs.gov/st1/market_news/doc45.txt17

With respect to catch rates (catch per unit of effort or CPUE, as measured by pounds of shrimp tails landed per day fished, where a day fished equals 24 hours of trawl time), the most reliable data to use in this case is information pertaining to the offshore component of the fishery. Between 1990 and 2002, catch rates in the offshore fishery varied from 418 pounds per day fished to 593 pounds per day fished, and averaged 487 pounds per day fished. From 2003 to 2005, pounds per day fished increased to 615, 621, and 833 respectively. These increases in offshore CPUE are directly caused by the concomitant declines in offshore effort (by more than 49%) since 2002. The value of 833 pounds per day fished in 2005 represents an increase of 71% over the 1990-2002 average, and is second only to the value of 856 pounds per day fished that was seen back in 1960 (the first year for which this data was tracked).
Thus, since the time period considered in Travis and Griffin’s analysis (i.e. 2002), fuel prices have increased significantly, shrimp prices have declined, but catch rates have increased. The first two changes would be expected to worsen the economic performance of the Gulf shrimp harvesting sector. Increased fuel prices cause fuel expenses to increase and lower shrimp prices cause revenues to fall, both of which will lead to lower profits or higher losses. Conversely, increases in catch rates will increase revenue per unit of effort (or, alternatively, decrease cost per pound), which should improve the offshore fleet’s economic performance. However, it is highly likely that the combined effects of the fuel price increase and shrimp price decrease outweigh the effect of the higher catch rates. Therefore, it is also highly likely that the offshore fleet’s economic performance was worse in 2005 than in 2002. This conclusion is supported by the fact that the actual decline in effort between 2002 and 2005 was greater than Travis and Griffin’s projections (i.e. vessels are exiting the fishery more quickly than forecasted). As such, it is reasonable to conclude that, not only will effort and fleet size continue to decline for the foreseeable future, but the equilibrium level of effort and fleet size will be lower than originally forecasted and thus the reductions in effort and fleet size at the new equilibrium will be larger than predicted. Whether the new equilibrium will be attained sooner, later, or at the same time as initially projected is currently unknown.
3.5.1.4 Gulf Shrimp Dealer/Wholesaler Sector
In addition to the harvesting sector, dealers/wholesalers play an important role in the Gulf shrimp industry. Unfortunately, no studies have been done to specifically examine their current economic performance. However, given the documented declines in the harvesting sector and the processing sector, and also given the fact that many dealers are also harvesters or processors, it is logical to conclude that this sector is also experiencing adverse economic conditions for the same reasons.
This sector is generally characterized in Table 34. In 2005, 609 dealers were identified in the SLF data. This figure compares to 626 dealers in 2002 and 745 dealers in 2004. Therefore, the number of dealers in 2005 is less than in 2002 and considerably less than in 2004, which is generally consistent with the hypothesis that this sector, like the harvesting sector, experienced a significant economic decline in 2005. However, all of these figures are considerably higher than in previous, recent years. For example, between 1999 and 2001, the number of dealers ranged 310 to 320. Such a dramatic increase is inconsistent with the hypothesis that this sector has also been experiencing adverse economic conditions. However, the answer to this apparent mystery lies primarily in
18

certain harvesters’ responses to the poor economic conditions.13 Specifically, in their attempts to reduce costs and obtain higher prices for their product, it appears that many harvesters decided to remove one of the so-called “middlemen” by obtaining dealer licenses themselves in order to sell directly to the public. An in-depth examination of the data appears to support this conclusion. The statistics in Table 34 suggest that considerable heterogeneity exists within this sector with respect to individual dealers’ volume and sales. The data indicate that, of the 608 dealers reporting sales figures, 70% (426) reported food shrimp sales of less than $100,000. Of these, over 71% (304) reported sales of less than $10,000. It is highly likely that the vast majority of these dealers are in fact harvesters who decided to obtain a dealer license and sell their own product rather than sell through a traditional dealer/wholesaler. If these “dealers” are factored out, these figures indicate that only 183 dealers sold more than $100,000 of food shrimp. Given that the number of dealers with sales over $100,000 was 228 in 2002, this figure is closer to what would be expected given numbers from previous years and prevailing economic conditions. These firms are likely the traditional dealers that have dockside businesses/facilities. Of these 183 dealers, 102 had food shrimp sales volumes between $100,000 and $1.0 million, while the remaining 83 had sales exceeding $1.0 million. Many of these 83 dealers are also processing firms. Two firms had sales exceeding $10.0 million.
Finally, with respect to the significant decrease in the number of dealers between 2004 and 2005, it appears that this decline is almost entirely attributable to the decline in the number of harvesters between those two years. In 2004, there were 193 dealers that sold more than $100,000 of food shrimp. Thus, the number of traditional dealers decreased by approximately 10 firms in 2005, suggesting that the decline in this sector primarily occurred in 2003 and 2004. On the other hand, the number of dealers with sales of less than $100,000 was 550 and the number with less than $10,000 was 396 in 2004. Compared to the 2005 figures, the significant decrease in “dealers” that occurred in 2005 was in the group with sales between $10,000 and $100,000, which in turn likely represents harvesters with dealer licenses that exited the fishery.
3.5.1.5 Gulf Shrimp Processing Sector
With respect to the processing sector, descriptive statistics regarding employment, overall volume and sales, and food shrimp volume and sales for 2005 are presented in Table 35. As with the harvesting and dealer sectors, there is considerable heterogeneity within the processing sector regarding employment, volume, and sales. In 2005, the data indicate that 18 processors had less than $1.0 million in food shrimp production, 14 had between $1.0 and $5.0 million, 10 had between $5.0 and $10.0 million, 9 had between $10.0 and $20.0 million, and the remaining 10 exceeded $20.0 million. Back in 2002, the data indicated that 21 processors had less than $1.0 million in food shrimp production, 22 had between $1.0 and $5.0 million, 9 had between $5.0 and $10.0 million, 11 had between $10.0 and $20.0 million, and the remaining 11 exceeded $20.0 million. Along with the statistics in Table 35, this information indicates that the number of firms has
13 Improved identification of dealers also plays a role, though it appears not a significant one.19

decreased from 74 to 60 between 2002 and 2005, reflecting additional consolidation in the Gulf shrimp processing sector. The data also indicates that the surviving firms have expanded their production (i.e. average production per firm has increased), which has helped to maintain the value of their production in the fact of declining prices (i.e. processed value per firm has remained relatively stable). Also, in general, the firms that have exited the industry in the last few years are the smaller processors (i.e. those with less than $5 million of processed shrimp value).
The data also indicates that a majority of these firms are highly dependent on the processing of food shrimp. Unfortunately, it is not been historically possible to determine with certainty how much of the shrimp being processed is domestic as opposed to imported by using the NMFS processor data. However, by cross-referencing multiple data sources, Keithly et al. (2005) attempted to approximate this figure.14 According to their findings, use of imports by domestic processors increased steadily through the 1980's and for example, in 1986, accounted for about one-third of production. Between 1992 and 1994, which was apparently the peak period, domestic and imported product accounted for nearly equal proportions of total processed shrimp products in the Southeast region. Even though, as noted previously, imports have continued to increase since then, Southeast shrimp processing activities have not increased proportionately as a result.
Keithly et al. (2005) hypothesized that this outcome is a direct result of a significant and steady decrease in the deflated price of processed shrimp from over $7.00/pound in the early 1980's to less than $4.00/pound in recent years. This decline has also precipitated a decline in processors’ marketing margins (i.e. per unit profitability). As a result of the declining margins, some processors have adjusted by increasing output in order to compensate; but many have been unable to make such an adjustment, and thus have been forced to exit the industry. This is illustrated by the fact that the number of Gulf shrimp processors fell from 124 to 72 between 1980 and 2001. Thus, the situation illustrates the classic case of an industry in economic decline, wherein the number of firms falls, and those who remain become larger in size (as measured by output). That is, the industry has become more concentrated. Moreover, Keithly et al. (2005) concluded that, if production of farm-raised shrimp continues to increase and a substantial portion of that production enters the U.S. market, the price of processed shrimp will continue to decline; margins will continue to narrow; and consolidation will continue to occur as additional firms exit and remaining firms attempt to compensate by increasing their output.
A more recent study by Keithly, Diop, Kazmierczak, and Travis (2006) supports many of the conclusions and hypotheses offered in Keithly, et al. (2005), and also helps to explain the changes that have occurred in this sector between 2002 and 2004, as noted above. In the recent study, Keithly, et al. (2006) conducted a survey of shrimp processors in order to better estimate their marketing margins and their dependency on domestic as opposed to imported product. The survey information was combined with data from the NMFS processor database for analysis. A critical finding of this study is that shrimp processors’ marketing margins have continued to decrease in recent years because the price of processed shrimp has been declining at a faster rate than the price of raw product. The decrease in the price of processed shrimp has been caused by increased imports of value-added product that directly compete with the domestic processors’ product. The
14 The one weakness with their approach is the assumption that all domestic production is utilized by the processing sector. While this assumption would be plausible under stable economic conditions, it is less reasonable in dire economic times when harvesters shift from traditional sales channels and instead sell directly to the public.
20

price decline has caused marketing margins to decrease, which in turn has forced firms to either exit the industry or increase their production. In general, smaller processors have exited while medium to larger sized processors have expanded, probably due to differences in their respective access to financial capital (i.e. smaller firms likely have less access to financial capital than their larger counterparts).
In addition, the study found that, in recent years, domestic processors have used a very limited amount of imported, raw product and instead are heavily dependent on domestically harvested product, contrary to popular belief. As such, the health of the processing sector is heavily dependent on domestic harvesting production. Keithly, et al. (2006) note that the remaining firms’ ability to maintain operations is dependent on their ability to expand, assuming processed shrimp prices continue to decline, which would be the case if imports of value-added product continue to increase. Therefore, if domestic harvesting production decreases, processors will be constrained in their ability to expand production, and additional consolidation of the industry will be likely. The decrease in Gulf shrimp landings in 2005 may have exacerbated the decline in the economic health of the Gulf shrimp processing sector. On the other hand, preliminary landings data indicate that domestic landings have rebounded significantly in 2006, which would help stabilize the processing sector. Though 2006 processor data is not yet available, various reports also indicate that the processing sector was significantly impacted by Hurricane Katrina, either directly as a result of wind/storm surge damage or indirectly as a result of population shifts/displacement which in turn created labor shortages. Processors located in Biloxi, D’iberville, and Ocean Springs, Mississippi as well as in New Orleans and Violet, Louisiana were particularly hard hit (IAI, 2007).
1.5 Analysis of Alternative Management Measures
1.5.1 Proposed Action - Modify the list of allowable bycatch reduction devices (BRDs) for use in the Southeastern shrimp fishery
Alternative 1: Status quo - Do not modify the list of allowable bycatch reduction devices (BRDs) for use in the Southeastern shrimp fishery. Since the status quo would not change the existing list of allowable BRDs in the Southeastern shrimp fishery, there would be no new impacts associated with this action. Currently, the Fisheye BRD may be placed as much as 12.5 feet from the cod end tie-off rings, and the industry standard is to place it greater than 10.5 feet from the trawl cod end’s tie-off. However, as previously stated, new information collected between 2001 and 2003 indicate that the Expanded Mesh, the Gulf Fisheye, and the Fisheye BRD in its standard configuration, as used in the Gulf of Mexico shrimp fishery, do not meet the 30-percent finfish
21

reduction criterion. According to SEFSC estimates (see Table 1), the Fisheye BRD, depending on its placement in the cod end of the trawl, achieves between 13- to 23-percent reductions in finfish biomass and the Expanded Mesh BRD achieves a 17-percent reduction in finfish biomass. Since these BRDs are not achieving the level of finfish bycatch reduction specified under certification criterion then, by definition, they cannot be legally used in the Southeastern shrimp fishery. Therefore, at least in their currently used configurations, these BRDs must be removed from the list of allowable BRDs.
Alternative 2: Preferred Alternative - Modify the list of allowable bycatch reduction devices (BRDs) for use in the Southeastern shrimp fishery. Under this alternative, the following changes would be made. First, the Expanded Mesh BRD would be decertified for use in the Gulf of Mexico shrimp fishery. New information collected aboard Gulf of Mexico shrimp trawlers on the Expanded Mesh BRD, certified for use in the eastern Gulf of Mexico and South Atlantic, indicates it no longer meets the proposed certification criterion to be used in the Gulf of Mexico shrimp fishery. During the original tests of the Expanded Mesh BRD in the mid-1990s, it achieved between 30- and 35-percent reductions in the total weight of finfish. Recent tests of the Expanded Mesh BRD in the Gulf of Mexico indicate it is only achieving about a 17-percent reduction in total finfish.
Second, the allowable placement of the Fisheye BRD would be restricted to no farther forward than 9.0 feet from the cod-end tie-off rings. When the Fisheye BRD is placed no farther forward than 9 feet (102-105 meshes) from the tie-off rings, it has been shown to achieve a 37 percent reduction in total finfish reduction by weight when used by Gulf of Mexico shrimp vessels (Table 1). There is a 98 percent probability the true reduction rate of the Fisheye BRD in this placement meets the proposed certification criterion.
Third, with the proposed restriction in the allowable placement of the Fisheye BRD, the forward placement represented by the nominal Gulf Fisheye BRD would no longer be allowed, and the Gulf Fisheye BRD would be removed from the list of allowable BRDs for use in the Gulf of Mexico and South Atlantic shrimp fisheries. From an end-user standpoint, there would be no changes to the allowable BRDs in the South Atlantic. However, with implementation of the proposed rule, and the removal of the Gulf Fisheye BRD from the allowable gear for the Gulf of Mexico, the Gulf Fisheye BRD would only be certified for use in the South Atlantic region. To reduce nomenclatural confusion, and to simplify the regulations, the description of the Fisheye BRD for the South Atlantic region would be revised to encompass both configurations. For the South Atlantic, the Fisheye BRD installation configuration would be revised to allow the BRD to be placed along the top center of the cod end as far forward as 8.5 feet. From 8.5 feet to 12.5 feet forward of the tie-off rings, the Fisheye BRD may be placed no more than 15 meshes off-center from the top center of the cod end. This revised description of the Fisheye BRD would negate the need for a separate designation of a Gulf Fisheye BRD, and the Gulf Fisheye BRD would be removed from the list of allowable BRDs for use in the South Atlantic shrimp fishery as well.
The shrimp fishery in the South Atlantic tends to operate in shallower water and has a different species composition to its bycatch. The new information on the Fisheye BRD and Expanded Mesh BRD was all collected in the Gulf of Mexico; there are no new data collected from the South Atlantic fishery to indicate the BRDs are not meeting bycatch reduction targets. NOAA Fisheries
22

Service intends to investigate the efficacy of these BRDs in the South Atlantic fishery before making additional decisions regarding the status of the Fisheye BRD and Expanded Mesh BRD for use in the South Atlantic fishery.
In separate rulemaking, NOAA Fisheries Service is adding several other BRDs to the list of allowed BRD gear for the southeastern shrimp fishery. Requiring more efficient BRDs to be used in the Gulf of Mexico shrimp fishery would better reduce bycatch of red snapper and achieve recovery goals of this overfished stock, better reduce overall finfish bycatch and meet the requirements of National Standard 9 of the Magnuson-Stevens Fishery Conservation and Management Act (Magnuson-Stevens Act), and improve shrimp retention for a more efficient fishery under current economic conditions. Additionally, as BRDs may have different capabilities under different fishing conditions, having a wider variety of more efficient BRDs for use in the fishery would allow fishermen to choose the most effective BRD for the specific local fishing conditions.
Table 1. Performance and Cost of Bycatch Reduction Devices Tested in the Gulf of Mexico
BRD TypePercent Reduction in
Total Finfish Bycatch (by weight)
Shrimp loss percent (by weight)
Cost per BRD ($)
Fisheye < 9’ from tie-off 37.0 (30.6-43.3) 10.4 (6.2-14.6) $45
Fisheye 9-10’ from tie-off 16.0 (09.3-22.8) 3.9 (-1.3 – 9.1) $45Fisheye > 10’ from tie-off 11.7 (09.4-14.1) 1.6 (-0.3 - 3.5) $45Fisheye – All 17.0 (16.1-17.9) 1.2 (0.4 - 2.1) $45Jones Davis 58.0 (53.0–63.0) 4.0 (0.0 – 9.0) $425Modified Jones Davis 33.1 (30.3-36.0) 3.2 (1.4 - 4.9) $200Extended Funnel 26.6 (21.7-31.6) 2.2 (-1.7 – 6.0) $350Expanded Mesh 17.0 (10.1-23.8) -4.6 (-11.1 -
2.0)$100
Composite Panel 25.1 (20.9-29.4) 5.4 (01.7 - 9.1) $150Source: NOAA Fisheries Service, Pascagoula. Negative value represents a gain.
For the purpose of the economic impacts analysis, it is assumed the only vessels that will be directly impacted by the proposed action are the 1,806 vessels expected to qualify for federal Gulf shrimp moratorium permits that were also active in the fishery during 2005. Of these 1,806 vessels, 1,430 vessels are large while the other 376 vessels are small. Vessels not expected to qualify for moratorium permits would not be impacted by the proposed action because they will not be able to legally operate in the EEZ component of the fishery where this action would apply. However, since the moratorium permits will be fully transferable, non-qualifying vessels that want to operate in the EEZ could be impacted in the future if they are able to purchase a moratorium permit. At this time, it is not possible to predict how many or which vessels might fall into this set of circumstances. With respect to the 860 inactive qualifying vessels, since they are not presently operating in the fishery, they would not be forced to change their BRDs due to their inactivity in the fishery (i.e. it is not necessary for a vessel to alter gear it is not presently using). It is possible that these inactive
23

qualifying vessels could be indirectly impacted by the proposed action should they decide to become active in the fishery at some point in the future. However, it should be noted that participation in the fishery by qualifying vessels has steadily declined in each of the last four years, and thus it is logical to assume that potentially even fewer vessels will be directly impacted, particularly given that the impacts of the 2005 hurricanes cannot, as of yet, be fully accounted for in this analysis.
Even within the group of 1,806 active qualifying vessels, not all are expected to be impacted, directly or indirectly, by the proposed action. Specifically, vessels already using BRDs that would still be legal under the proposed action would not be forced to switch to a different BRD and thus would not be impacted. Thus, it is necessary to determine how many vessels are currently using BRDs that would be deemed legal or illegal under the modified list of allowable BRDs. Further, for those currently using BRDs that would be illegal under the modified list, it is necessary to determine which BRDs they are presently using and which BRDs they are most likely to switch to under the new regulations. This information will be used to estimate the magnitude, if any, of losses that will be imposed on these shrimp vessels as a result of being forced to purchase more expensive BRDs and/or BRDs that generate a higher loss of shrimp on average based on current estimates.15 Finally, it is expected that the relative magnitude of the potential losses will differ depending on the type of vessels (i.e. large or small) being impacted.
From an economic impacts perspective, the proposed action has three components that would directly impact certain vessels by forcing them to change the type of BRD they use. First, vessels currently using an Expanded Mesh BRD would be forced to switch to another type of BRD. Second, vessels currently using the Gulf Fisheye BRD, assumed to be those placing the Fisheye BRD farther forward than 11 feet from the cod-end tie-off rings in this analysis, would be forced to switch to a different BRD or alter its placement within their nets to the proposed position. Third, vessels placing their Fisheye BRDs farther forward than the proposed 9 feet from the cod-end tie-off rings but no more than 11 feet forward (i.e. between 9 and 11 feet), would also have to move their BRDs to a legal position or switch to a different BRD.
One of the reporting requirements implemented under Amendment 13 to the Gulf Shrimp FMP was the filing of a complete Gulf shrimp vessel and gear characterization form by moratorium permit applicants/holders. Two pieces of critical information for current purposes are being collected on this form: 1) type of BRD used by the vessel and 2) placement of the Fisheye BRD relative to the cod-end tie-off rings. At this time, forms have been received from 708 vessels, with 655 vessels providing at least some information relevant to the type and placement of BRDs.16 Thus, depending on how sample size is estimated, the approximate sample size is between 27% (708 respondents of the 2,666 vessels expected to qualify) and 36% (655 vessels that could provide the requested information out of the 1,806 active qualifying vessels). Regardless, this sample size should be more 15 It is acknowledged that, from a statistical perspective, the estimates of shrimp loss associated with the different types of BRDs are not significantly different from each other and often not significantly different from zero. The lone but important exception being the shrimp loss associated with the proposed legal position for the Fisheye BRD, which is clearly significantly higher on average compared to the other BRDs and, statistically speaking, is statistically higher than for other BRDs and greater than zero. 16 For the vast majority of the non-responsive vessels, these particular questions were not relevant to their operations because: 1) they were operating exclusively in states’ waters where BRDs are not required, 2) they were using non-trawl gear that are exempt from the BRD requirement, and/or 3) they were not active in the fishery. A few vessels simply did not provide the requested information.
24

than sufficient to extrapolate to the fleet as a whole. For current purposes, the responses from the 655 vessels are assumed to be representative of the 1,806 active qualifying vessels.
Within the group of 655 responding vessels, 558 were large vessels while the other 97 were small. With respect to type of BRD, 9 vessels (7 large, 2 small) indicated they use and Extended Funnel BRD, 3 vessels (all large) indicated they use an Expanded Mesh BRD, 20 vessels (13 large, 7 small) indicated they use a Jones-Davis BRD, and the other 623 vessels (535 large, 88 small) indicated they use some type of Fisheye BRD. These findings support the previously noted claims that few Gulf shrimp vessels use the Expanded Mesh BRD and that the Fisheye BRD is used by most vessels. Extrapolating these numbers to the active qualifying fleet generates the following estimates: 18 large and 8 small vessels use the Extended Funnel BRD, 8 large vessels use the Expanded Mesh BRD, 33 large and 27 small vessels use the Jones-Davis BRD, while 1,371 large and 341 small vessels use some type of Fisheye BRD. Since the Extended Funnel and Jones-Davis BRDs will still be on the list of allowable BRDs, the 86 vessels estimated to be using these BRDs would not be forced to switch from their current BRDs and thus would not be directly impacted by the proposed action. These vessels are not considered further in the impacts analysis below.
Based on their responses regarding the type of BRD they use and where they reported their BRD is placed in the net, some Gulf shrimpers are apparently confused by the technical difference between a “Gulf Fisheye” and a “Fisheye” BRD. Thus, the determination of whether they used a Gulf Fisheye or Fisheye BRD was made based on where they indicated their BRD was placed in the net. This data yielded the following results.
For large vessels, 13.5% of their Fisheye BRDs are in a position that would still be legal under the proposed action (i.e. less than or equal to 9 feet from the cod-end tie-off rings), 56.5% of their Fisheye BRDs are between 9 and 11 feet from the cod-end tie-off rings, and 30% of their Fisheye BRDs are more than 11 feet from the cod-end tie-off rings. For small vessels, 62.5% of their Fisheye BRDs are in a position that would still be legal under the proposed action (i.e. less than or equal to 9 feet from the cod-end tie-off rings), 22.7% of their Fisheye BRDs are between 9 and 11 feet from the cod-end tie-off rings, and 14.8% of their Fisheye BRDs are more than 11 feet from the cod-end tie-off rings. These percentages lead to the following estimates of the number of vessels falling into each group. For large vessels, 185 vessels are estimated to be using a Fisheye BRD that is placed in a position that would still be legal under the proposed action, 411 vessels are estimated to be using a Gulf Fisheye BRD, and 775 vessels are estimated to be using a Fisheye BRD in a position that would not be allowable under the proposed action. For small vessels, 213 vessels are estimated to be using a Fisheye BRD that is placed in a position that would still be legal under the proposed action, 51 vessels are estimated to be using a Gulf Fisheye BRD, and 77 vessels are estimated to be using a Fisheye BRD in a position that would not be allowable under the proposed action. Since the Fisheye BRD placed 9 feet or less from the cod-end tie-off rings will still be on the list of allowable BRDs, the 398 vessels estimated to be using this BRD would not be forced to switch from their current BRDs or alter its current placement in their nets and thus would not be directly impacted by the proposed action. These vessels are not considered further in the impacts analysis below.
However, for the 462 vessels estimated to currently be using Gulf Fisheye BRDs and the 853 vessels estimated to be using Fisheye BRDs in placements that would no longer be allowable, they
25
would be forced to either switch to a different type of BRD or change the placement of the Fisheye BRD in their nets. The former could increase the cost of purchasing BRDs and lead to either a higher or lower shrimp loss on average per tow. The latter would not affect the cost of purchasing BRDs, as they would be using the same BRD. But, it would lead to a significantly higher loss of shrimp per tow on average. In the following analysis, it is assumed that: 1) the purchase of BRDs is a recurring annual expense and 2) the difference in the average percentage shrimp loss across BRD types represents an equal percentage difference in a vessel’s annual Gulf shrimp landings and thus Gulf shrimp revenues. Current information suggests that large vessels most typically tow four nets while small vessels typically tow two nets. Each vessel is assumed to carry one set of spare nets, all of which would also have to be fitted with a legal BRD. Therefore, it is further assumed that, on average, large vessels would have to replace eight BRDs per vessel while small vessels would have to replace four BRDs if they switch to another type of BRD.
As already indicated, the eight large vessels estimated to be currently using Expanded Mesh BRDs would be forced to switch to another type of BRD. According to information in Table 1, these BRDs have a relatively low cost ($100), though not as low as the Fisheye BRD ($45), and actually lead to a higher level of shrimp retention on average (i.e. a gain in shrimp catch) relative to nets with no BRDs.17 For these vessels, they basically have five BRD options to choose from under the proposed action: a legal Fisheye BRD, Jones-Davis BRD, Modified Jones-Davis BRD, Extended Funnel BRD, and Composite Panel BRD. These options and their respective impacts are presented in Table 2. For example, while switching to the legal Fisheye would decrease their per BRD purchase price by $55, it would also lead to a shrimp loss of 15% on average from what they currently experience (a 4.6% gain to a 10.4% loss). So, although their annual BRD costs would decrease by $440, their loss in annual shrimp revenues would be $26,436, leading to an annual average loss of $25,996. Given that the average annual for a large vessel is $179,625, of which $176,243 comes from Gulf shrimp landings, such a loss would represent a 14.5% loss in annual revenue to these vessels. Such a loss, particularly under current economic conditions, would be extreme and likely lead the vessels to cease operations. However, it is unlikely these vessels would choose this option because the losses associated with the other four options are considerably less, though still quite high.
Table 2. Costs per Vessel of Switching from the Expanded Mesh BRDType of
BRDChange in Cost per BRD (- is a
reduction)
Change in Shrimp Loss (- is a gain)
Change in Annual BRD costs (- is a reduction)
Change in Annual Shrimp revenue (- is a
gain)
Total Annual
Loss
Legal Fisheye
$-55 15% $-440 $26,436 $25,996
Jones-Davis $325 8.6% $2,600 $15,157 $17,757Modified Jones-Davis
$100 7.8% $800 $13,747 $14,547
Extended Funnel
$250 6.8% $2,000 $11,985 $13,985
Composite $50 10% $400 $17,624 $18,024
17 From the perspective of economic rationality, it is rather curious that more vessels have not used this type of BRD in the past given its price and shrimp loss characteristics.
26

Panel
Switching to one of the other four allowable BRD types would lead to the impacts specified in Table 2. Clearly, any of these other four options would be preferable, with a change to either the Modified Jones-Davis BRD or the Extended Funnel BRD being the most economically preferable (i.e. generating the least adverse economic impacts). Still, even if these vessels switched to the Extended Funnel BRD, this would generate a relatively high 7.8% loss in annual revenue, which could be sufficient to force these eight large vessels out of the fishery.
For vessels currently using a Gulf Fisheye BRD, the costs of switching to another BRD or placing the Fisheye BRD in a legal position are provided in Tables 3 and 4 for large and small vessels respectively. According to information in Table 1, the cost of a Gulf Fisheye BRD is $45 and the approximate shrimp loss is 1.6%. For vessels currently using a Fisheye BRD in what would be an illegal position under the proposed action, the costs of switching to another BRD or placing the Fisheye BRD in a legal position are provided in Tables 5 and 6 for large and small vessels respectively. According to information in Table 1, the cost of a Fisheye BRD is $45 and the approximate shrimp loss for a Fisheye BRD in an illegal position is approximately 3.9%.
Table 3. Costs per Vessel of Switching from a Gulf Fisheye BRD (Large Vessels)Type of
BRDChange in Cost per BRD (- is a
reduction)
Change in Shrimp Loss (- is a gain)
Change in Annual BRD costs (- is a reduction)
Change in Annual Shrimp revenue (- is a
gain)
Total Annual
Loss
Legal Fisheye
$0 8.8% $0 $15,509 $15,509
Jones-Davis $380 2.4% $3,040 $4,230 $7,270Modified Jones-Davis
$155 1.6% $1,240 $2,820 $4,060
Extended Funnel
$305 .6% $2,440 $1,057 $3,497
Composite Panel
$105 3.8% $840 $6,697 $7,537
Table 4. Costs per Vessel of Switching from a Gulf Fisheye BRD (Small Vessels)
Type of Change in Cost Change in Change in Annual Change in Total
27

BRD per BRD (- is a reduction)
Shrimp Loss (- is a gain)
BRD costs (- is a reduction)
Annual Shrimp revenue (- is a
gain)
Annual Loss
Legal Fisheye
$0 8.8% $0 $4,032 $4,032
Jones-Davis $380 2.4% $1,520 $1,100 $2,620Modified Jones-Davis
$155 1.6% $620 $733 $1,353
Extended Funnel
$305 .6% $1,220 $275 $1,495
Composite Panel
$105 3.8% $420 $1,741 $2,161
Table 5. Costs per Vessel of Switching from an Illegal Fisheye BRD (Large Vessels)Type of
BRDChange in Cost per BRD (- is a
reduction)
Change in Shrimp Loss (- is a gain)
Change in Annual BRD costs (- is a reduction)
Change in Annual Shrimp revenue (- is a
gain)
Total Annual
Loss
Legal Fisheye
$0 6.5% $0 $11,456 $11,456
Jones-Davis $380 .1% $3,040 $176 $3,216Modified Jones-Davis
$155 -.7% $1,240 -$1,234 $6
Extended Funnel
$305 -1.7% $2,440 -$2,996 -$556
Composite Panel
$105 1.5% $840 $2,643 $3,483
Table 6. Costs of Switching from an Illegal Fisheye BRD (Small Vessels)Type of
BRDChange in Cost per BRD (- is a
reduction)
Change in Shrimp Loss (- is a gain)
Change in Annual BRD costs (- is a
reduction)
Change in Annual Shrimp revenue (- is a
gain)
Total Annual
Loss
Legal Fisheye
$0 6.5% $0 $2,978 $2,978
Jones-Davis $380 .1% $1,520 $46 $1,566Modified Jones-Davis
$155 -.7% $620 -$321 $299
Extended Funnel
$305 -1.7% $1,220 -$779 $441
Composite Panel
$105 1.5% $420 $687 $1,107
28

According to the information in Tables 3 through 6, several findings are critical with respect to potential impacts from the proposed action. First, it is clear that, regardless of vessel size or what type of Fisheye BRD these vessels are currently using, the most economically preferred options (i.e. those that would lead to the least adverse economic impact) would be for vessels to switch to either the Modified Jones-Davis BRD or the Extended Funnel BRD. Second, though the differences are not large, the Extended Funnel BRD would be slightly more preferable than the Modified Jones-Davis for large vessels, while the opposite is true for small vessels. Specifically, for large vessels switching from the Fisheye BRD in what would be an illegal position under the proposed action, there is basically no impact from switching to the Modified Jones-Davis and even a slight benefit (.3% gain in annual revenues) from switching to the Extended Funnel BRD. These results are due to the better performance of these BRDs in terms of average shrimp loss relative to the current Fisheye BRDs being used by these vessels, which offsets the cost of purchasing these more expensive BRDs. Similarly, the adverse economic impact on small vessels from switching to either of these two BRDs is minimal; specifically, less than a 1% loss in annual revenues (.6% for the Modified Jones-Davis and .9% for the Extended Funnel). Thus, for the owners of these vessels (775 large vessel owners and 77 small vessel owners), the impacts arising from the proposed action would likely not be considered overly burdensome.
For vessels switching from the Gulf Fisheye BRD, the adverse economic impacts of switching to other BRDs are more pronounced, not just because they have to purchase more expensive BRDs, but primarily because the average shrimp loss from these alternative BRDs is clearly higher than for the Gulf Fisheye BRD. Specifically, for large vessels, the percentage loss in annual revenues is approximately 2% if they switch to either the Modified Jones-Davis BRD or Extended Funnel BRD, while the percentage loss for small vessels is slightly higher at approximately 3%. Under normal circumstances, where the industry would be at least earning normal profits, these losses might not be considered significant. However, under current economic conditions where the average vessel is not even able to cover variable costs, these losses would likely be considered overly burdensome by the owners of these impacted vessels (i.e. these impacts could force some of these vessels to exit the fishery), of which 51 are small vessel owners and 411 are large vessel owners.
Further, it is equally clear that the least preferable option for all vessels currently using some type of Fisheye BRD would be to continue using the Fisheye BRD but move it into the proposed required position within the net. Even though vessel owners would not have to purchase different and more expensive BRDs, the average shrimp loss associated with Fisheye BRDs in the proposed position is significantly greater than the shrimp loss with the Fisheye/Gulf Fisheye BRDs in their present positions. In fact, the impacts range from a 6.2% loss in annual revenues for small vessels switching from illegal Fisheye BRDs to 8.6% for large vessels switching from the Gulf Fisheye BRD. Under current economic conditions, there is little doubt that impacts of this magnitude would force many if not most of these 1,314 vessels out of the fishery.
These findings suggest that vessels will either switch to the Extended Funnel or Modified Jones-Davis BRDs, or continue using the Fisheye BRD, but in a legal position under the proposed action. That is, from this point forward, the analysis assumes that vessels would not switch to either the Jones-Davis BRD or Composite Panel BRD because there are clearly preferable options to which they can switch.
29

As to whether vessels will switch to the economically preferable options or continue using the Fisheye BRD in the new allowable position, a critical factor will be the amount of time they have to make the potential change to a different BRD. In general, the less time these vessels have to switch to other BRDs, the more likely they will be forced to continue using the Fisheye BRD. Conversely, the more time they have to make the change, the less likely they will continue using the Fisheye and the more likely they will switch to the Modified Jones-Davis or Extended Funnel BRD. Although vessel owners may desire to immediately switch to the economically preferable BRDs, that option may not be available to them, at least not all of them, in the short-term. Specifically, it is important to keep in mind that approximately 1,322 vessels are estimated to be in a situation where they would potentially need or want to switch to other BRDs under the proposed action. Each of these vessels would need between four and eight new BRDs per vessel once the rule becomes effective. This would require net shops around the Gulf of Mexico to produce over 10,000 new BRDs, noting that these BRDs are currently used little or not at all (and thus not currently being produced in any great numbers), in a potentially short period of time. Existing evidence suggests that the combination of the adverse economic conditions in the industry and the impacts from recent hurricanes has reduce the number of net shops around the Gulf of Mexico, particularly in the northern Gulf States, has decreased considerably in the last few years. Therefore, it is highly unlikely that the potentially required number of new BRDs could be produced in a relatively short period of time. And although it is currently unknown how long it would take for the remaining net shops to produce this quantity of new BRDs, it is obvious that a longer period of time would be preferable to a shorter period of time in this respect.
At present, the proposed action does not specify the period of time shrimp vessel owners will be given to potentially change to new BRDs. Thus, at this time, the analysis can only indicate a range of potential impacts in the aggregate. The actual impacts will more closely approximate the lower end of the range if vessel owners are given relatively more time to change their BRDs, while a shorter period of time would cause the actual impact to be on the higher end of the range since owners would not have time to switch BRDs and would thus have to move their Fisheye BRDs into a position that leads to a much higher level of shrimp loss.
Specifically, if vessels currently using BRDs that would not be allowable under the proposed action all switched to an Extended Funnel BRD, the estimated loss to the harvesting sector (vessel owners) would be approximately $1.23 million. If these vessels all switched to the Modified Jones-Davis BRD, the estimated loss to the harvesting sector (vessel owners) would be approximately $1.89 million. In the aggregate and on average per vessel, these losses do not appear to be substantial. However, it should be kept in mind that these losses would be almost entirely imposed on the 470 vessels switching from the Gulf Fisheye and Expanded Mesh BRDs. These results represent the minimum expected economic impact under the proposed action, and thus assume that vessel owners would have sufficient time to switch to the most economically preferable BRDs.
Conversely, if vessel owners are not given sufficient time to switch to new BRDs, they would be forced to continue using their Fisheye BRDs, but in the allowed position under the proposed action, which would lead to an estimated loss to the harvesting sector (vessel owners) of approximately $15.9 million. These impacts would be spread across the estimated 1,322 vessels that would prefer to switch to the economically preferable BRDs under the proposed action. For an industry that has
30

been experiencing adverse economically conditions for the past five years, an additional economic impact of this magnitude could have a crippling effect on the harvesting sector (i.e. many if not most vessels would be forced out of the industry), which of course would spread to the onshore sectors of the industry as well.
Giving vessel owners more time to switch would potentially help to lessen the impact of the proposed action in other ways. For example, vessel owners would have additional time to experiment with these new BRDs and thereby determine which is best for their particular vessel’s operations. Further, during this additional period of time, currently ongoing research could lead to the discovery and certification of new BRDs that might perform better, in terms of shrimp loss, than the BRDs considered in this analysis. In fact, that is one of the expected benefits of the aforementioned proposed rule that would change the certification criterion and the process by which BRDs become certified. On the other hand, it should also be noted that a learning curve is almost always associated with this type of mandatory gear change. That is, it may take some time for vessel captains to learn how to re-configure their gear so that the gear and gear modifications (BRDs and TEDs) operate in an optimal manner with respect to shrimp retention. Additional costs may be incurred during this adjustment period, as vessel captains adjust to the new BRDs, but they are not quantifiable and could be associated with any change, whether the change is to a completely different BRD or the placement of the Fisheye BRD. With respect to indirect impacts on the onshore sector of the Gulf shrimp industry, the dealer/wholesaler sector would be impacted to the extent that shrimp landings and revenues are reduced as a result of vessels switching to BRDs that generate a higher shrimp loss. The magnitude of the indirect impacts on this sector would be less than the direct impacts on the harvesting sector since impacts on the latter arising from the need to potentially change to more expensive BRDs would not be passed along to the dealer/wholesaler sector. The same reasoning would apply to indirect impacts on the processing sector.
As with the harvesting sector, the magnitude and even the direction of these indirect impacts is dependent on which BRDs are adopted by harvesters. Specifically, if all vessels that would have to change their BRDs under the proposed action switched to the Extended Funnel BRD, such a change would actually indirectly benefit the dealer/wholesaler sector as annual shrimp revenues are estimated to increase by approximately $1.84 million. This outcome is due to the improved shrimp loss performance of the Extended Funnel BRD relative to BRDs the potentially impacted vessels are currently using. This aggregate result does not mean that all dealers would benefit from the change. Since the number of vessels currently using each type of BRD was estimated, it cannot be determined which particular dealers would benefit and which would be adversely impacted. At most, it can be stated that dealers who purchase their shrimp from vessels currently using the Fisheye BRD would benefit from the change, while those who purchase shrimp from vessels currently using the Expanded Mesh BRD or Gulf Fisheye BRD would be adversely impacted. Since there are many more vessels using the former than the latter, this results in an overall benefit to the dealer/wholesaler sector. On average, there would be an estimated gain of $3,017 to Gulf shrimp dealers, or approximately .5% of average annual Gulf shrimp sales.
However, if all vessels switched to the Modified Jones-Davis BRD, the loss to the dealer/wholesaler sector would be approximately $325,312, resulting in an average loss per dealer
31

of $534, or approximately .1% of average annual sales. In the aggregate and for the average dealer, this impact would likely be imperceptible. However, the adverse economic impacts would be imposed almost entirely dealers that purchase their shrimp from large vessels that currently use Gulf Fisheye BRDs. Conversely, a nearly equal benefit would accrue to dealers that purchase their shrimp from large vessels currently using the Fisheye BRD. These juxtaposing impacts are why the overall impact to this sector is negligible.
As was true for the harvesting sector, the indirect impacts on the dealer/wholesaler sector are considerably more adverse if vessels have insufficient time to switch to a different BRD and continue to use the Fisheye BRD, but in the restricted position required by the proposed action. In this case, the total impacts estimated for the dealer sector would be equivalent to those for the harvesting sector since they result only from the much higher shrimp loss associated with the Fisheye BRD in the more restricted position. Thus, indirect impacts to the dealer/wholesaler sector would be approximately $15.9 million in the aggregate. For the average dealer, this outcome would result in an average annual loss of $26,101, or approximately 4.6% of average annual sales. Even though the impact is indirect, that does not make it any less significant and, as with the harvesting sector, an adverse impact of this magnitude would likely be sufficient to force many dealer/wholesalers out of the industry under current economic conditions.
For the shrimp processing sector, the indirect impacts are more difficult to gauge, not only because it is unknown which processors obtain their shrimp indirectly from particular vessels, and because all of the impacted vessels’ identities are not known in any case, but also because they have at least some ability to substitute imported product for lost domestic product. However, as previously noted, their ability to make such substitutions has been curtailed in recent years for a variety of reasons (i.e. many processors are highly if not completely dependent on domestic product). Given the results noted above, if vessels that must change their BRDs switch to either the Extended Funnel BRD or Modified Jones-Davis BRD, any impacts to the processing sector would most likely be imperceptible both in the aggregate and for the average individual processor. Conversely, if vessels simply move their Fisheye BRDs to the required position, again, the previously noted impacts in the harvesting and dealer/wholesaler sectors would spread to the processing sector. In particular, those processors that indirectly obtain their domestic product from large shrimp vessels would bear the brunt of these impacts. On average, the average loss in the value of processed shrimp per processor would be approximately $264,925, or approximately 2.6% of their average total processed product value.18 As with the other sectors, such losses would be sufficient to create additional economic hardship on a sector of the industry that has already contracted considerably in recent years due to adverse economic conditions. Some processors, particularly small processors already operating at small profit margins as a result of relatively low production levels, could be forced to exit the industry.
1.6 Private and Public Costs
18 This estimate is likely an underestimate of the true loss to the processing sector since the estimated losses to the harvesting and dealer/wholesaler sectors use ex-vessel value. The true loss to the processing sector would be the processed value of the lost product, which is always higher than the ex-vessel value. However, the difference between the two values is unknown.
32

The preparation, implementation, enforcement, and monitoring of this or any federal action involves the expenditure of public and private resources that can be expressed as costs associated with the regulations. Costs associated with this specific action will include:
Council costs of document preparation,meetings, public hearings, and informationdissemination................................................................................................$10,000
NMFS administrative costs of documentpreparation, meetings, and review................................................................$35,000
Industry cost for purchasing new BRDs..................................................$3,052,000
Law enforcement costs..........................................................................................$0
TOTAL $3,097,000
The Council and Federal costs of document preparation are based on staff time, travel, printing, and any other relevant items where funds were expended directly for this specific action. There are no permit requirements in this proposed rule. The industry cost for purchasing new BRDs is a maximum estimate as it assumes the 1,322 vessels forced to change their BRDs will switch to the more expensive Extended Funnel BRD. To the extent there are no quota closures proposed in this rule or other regulatory measures, except the requirement for some vessels to change the types of BRDs they use or where those BRDs are placed in the net, which enforcement officials already check when vessels are boarded, no additional enforcement activity is anticipated.
1.7 Determination of a Significant Regulatory Action
Pursuant to E.O. 12866, a regulation is considered a "significant regulatory action" if it is likely to result in: (a) an annual effect on the economy of $100 million or more; (b) a major increase in costs or prices for consumers, individual industries, Federal, State, or local government agencies, or geographic regions; (c) significant adverse effects on competition, employment, investment, productivity, innovation, or on the ability of United States-based enterprises to compete with foreign-based enterprises in domestic or export markets, or (d) raise novel legal or policy issues arising from legal mandates, the President’s priorities, or the principles set forth in the Executive Order.
The direct economic impact of the proposed action will be dependent on which BRDs vessel owners switch to under the revised allowable list of BRDs, which in turn will be dependent on the ability of net shops to mass produce alternative BRDs (i.e. BRDs other than the predominantly used Fisheye), both of which are dependent on the length of time these groups are given to produce the BRDs and make the change. As previously discussed, should the vessel owners not have sufficient time to switch to other, more economically preferable BRDs, they would be forced to continue using the Fisheye BRD, but in the restricted placement. Under this most onerous scenario, and even
33

though the vast majority (except the eight vessels currently using the Expanded Mesh BRD) would not be forced to purchase different types of BRDs, the maximum direct economic impact to the harvesting sector would be approximately $15.9 million. Even if additional multiplier effects (i.e. indirect and induced impacts) result from these direct impacts, assuming an output multiplier of 2.7, as has been assumed in previous regulatory impact analyses for this fishery, the maximum impact to the economy would be approximately $42.9 million.
Therefore, it is not reasonable to expect that an annual economic impact of $100 million can be forecast if the rule is implemented. Thus, the action in this proposed rule would not be expected to substantially impact the economy, a sector of the economy, productivity, competition or jobs.
Additionally, measures in this proposed rule do not adversely affect the environment, public health or safety, or state, local, or tribal governments or communities, nor do they interfere or create inconsistencies with any action of another agency, including state fishing agencies. No effects on the budgetary impact of entitlements, grants, user fees, or loan programs or the rights and obligations of recipients thereof have been identified. Measures in the proposed rule represent normal management options or practices and, therefore, do not raise novel legal or policy issues. Since the proposed rule will not meet any of the conditions noted above, it is determined that this proposed rule, if implemented, would not constitute a “significant regulatory action” under E.O. 12866.
2.0 Regulatory Flexibility Act Analysis
Introduction: The purpose of the Regulatory Flexibility Act (RFA) is to establish a principle of regulatory issuance that agencies shall endeavor, consistent with the objectives of the rule and of applicable statutes, to fit regulatory and informational requirements to the scale of businesses, organizations, and governmental jurisdictions subject to regulation. To achieve this principle, agencies are required to solicit and consider flexible regulatory proposals and to explain the rationale for their actions to assure that such proposals are given serious consideration. The RFA does not contain any decision criteria; instead the purpose of the RFA is to inform the agency, as well as the public, of the expected economic impacts of various alternatives contained in the FMP or amendment (including framework management measures and other regulatory actions) and to ensure that the agency considers alternatives that minimize the expected impacts while meeting the goals and objectives of the FMP and applicable statutes.
With certain exceptions, the RFA requires agencies to conduct an Initial Regulatory Flexibility Analysis (IRFA) for each proposed rule. The IRFA is designed to assess the impacts various regulatory alternatives would have on small entities, including small businesses, and to determine ways to minimize those impacts. In addition to analyses conducted for the Regulatory Impact Review (RIR), the IRFA provides: (1) a description of the reasons why action by the agency is being considered; (2) a succinct statement of the objectives of, and legal basis for, the proposed rule; (3) a description and, where feasible, an estimate of the number of small entities to which the proposed rule will apply; (4) a description of the projected reporting, record-keeping, and other compliance requirements of the proposed rule, including an estimate of the classes of small entities which will be subject to the requirements of the report or record; and, (5) an identification, to the
34

extent practicable, of all relevant Federal rules, which may duplicate, overlap, or conflict with the proposed rule.
The following analysis is conducted to determine whether the proposed action would have a "significant economic impact on a substantial number of small entities."
Description of the reasons why action by the agency is being considered: The proposed rule would modify the list of allowable BRDs for use in the Gulf and South Atlantic EEZ commercial shrimp fisheries. The purpose and need for the action recommended in this proposed rule are set forth in Section 1.2 of this document. In general, problems and issues include the following. The Gulf Council recently proposed to modify the existing BRD certification criterion for the western Gulf to be consistent with the criterion for the eastern Gulf and the criterion for the South Atlantic region. Assuming this new criterion is implemented through final rulemaking, a BRD would have to demonstrate at least a 30-percent reduction in the weight of finfish bycatch to be certified for use in either the Gulf of Mexico or South Atlantic shrimp fisheries.
Because of the simplistic design and low cost of the Fisheye BRDs, they became the industry standard. The most commonly used configuration in the Gulf shrimp fishery has the BRD placed 10.5 ft (3.2 m) to 12.5 ft (3.8 m) forward of the cod end tie-off rings. Based on recent observer data collected aboard shrimp vessels fishing in the Gulf of Mexico, NMFS’ Southeast Fisheries Science Center (SEFSC) estimates that the Fisheye BRDs in this configuration are achieving between 11- and 25-percent reductions in fishing mortality on juvenile red snapper and a 13- to 23-percent reduction in finfish bycatch by weight. Thus, they do not meet the original criterion based on red snapper mortality reductions, the proposed 30-percent finfish reduction criterion, or the 25-percent finfish bycatch reduction criterion to be provisionally certified. However, when the Fisheye BRD is placed no farther forward than 9 feet (2.7 m) (102-105 meshes) from the tie-off rings, it achieves a 37 percent reduction in total finfish bycatch by weight. Similarly, recent data indicate the efficiency of the Expanded Mesh BRD, currently certified for use in the eastern Gulf and South Atlantic, has decreased. Recent tests of the Expanded Mesh BRD in the Gulf of Mexico indicate it is only achieving about a 17-percent reduction in total finfish. Thus, it does not meet the criteria to be certified or provisionally certified.
Actions to maximize shrimp retention, without concurrently maintaining fish reductions, have diminished the BRDs' effectiveness to reduce bycatch. There have been numerous technological changes to the overall construction of shrimp trawl gear, such as new turtle excluder devices and longer nets. In addition, there have been changes in fishing practices to help increase shrimp retention, such as faster towing speeds and modified retrieval procedures. Although the exact reasons for the BRDs’ change in efficiency are not known, in practice, the Fisheye BRDs in their most commonly used configurations and the Expanded Mesh BRD do not appear to be meeting the current or proposed reduction criterion.
This proposed rule aims to further total finfish bycatch, including juvenile red snapper, in the Gulf of Mexico shrimp fishery by modifying the list of allowable BRDs for use in the Southeast shrimp fishery in order to better address the requirements of National Standard 9 and aid in the rebuilding of the Gulf of Mexico’s overfished red snapper stock. The proposed rule will also eliminate
35
nomenclature confusion regarding allowable types of BRDs in both the South Atlantic and Gulf of Mexico shrimp fisheries.
Statement of the objectives of, and legal basis for, the proposed rule: The specific objectives of the proposed actions are found in Section 1.3 of this document and are incorporated herein by reference. The objectives are basically the same as the purpose as stated above, and the legal basis for the rule is the M-SFCMA, particularly Sections 303 (a)(3) and 303 (a)(10), as well as regulations under 50 CFR 600.310.
Description and estimate of the number of small entities to which the proposed rule will apply: The Small Business Administration (SBA) defines a small business in the commercial fishing activity as an entity that is independently owned and operated, is not dominant in its field of operation (including its affiliates), and has combined annual receipts not in excess of $4.0 million annually (NAICS codes 114111 and 114112, finfish and shellfish fishing).
Beginning on March 26, 2007, a moratorium permit will be required to shrimp in the Gulf EEZ. Although it is unknown how many eligible applicants will apply for a moratorium permit, 2,666 vessels would qualify for the permit. However, of these vessels, only 1,806 were active in the fishery during 2005 (i.e. 860 of these qualifying vessels are not currently active in the fishery). Since these 860 vessels are not currently using BRDs, they would not be potentially forced to change their current BRDs and therefore would not be directly impacted by the proposed action. These vessels could be indirectly impacted if they became active in the fishery in the future. However, it should be noted that participation in the fishery has continually declined over the past four years and this trend is expected to continue for the foreseeable future, particularly given the likely impacts of the 2005 hurricanes.
Furthermore, the analysis in the RIR indicated that approximately 484 of the 1,806 active qualifying vessels are using BRDs that would still be allowable under the proposed action. These vessels would not be required to switch to new BRDs or change the placement of their Fisheye BRD. Only the other 1,322 vessels presently using BRDs that would not be allowable under the proposed action would have change or move their BRDs. Thus, for current purposes, it is estimated that 1,322 vessels would be impacted by the proposed action. Analyses of the distribution annual revenues for active vessels qualifying for moratorium permits indicate that average annual gross revenues per vessel were $152,190 in 2005. Moreover, the maximum annual gross revenue reported by an active qualifying vessel in 2005 was $757,104.
An evaluation of the distribution of annual revenues in 2005 by vessel size indicates substantial differences between large (at least 60 feet in length) and small active qualifying shrimping vessels in the Gulf. For the large vessel group, average annual revenues per vessel approximated $179,625 in 2005. For small active qualifying vessels, average annual revenues per vessel were about $47,859 in 2005. The distribution of annual revenues for small vessels is considerably more heterogeneous than for large vessels reflecting the fact that the vast majority of large vessels operate on a full-time basis while, for small vessels, some operate on a full-time basis and others only on a part-time basis.
36

On average, “small” active qualifying vessels are also “smaller” in regards to almost all of their physical attributes (e.g. they use smaller crews, fewer and smaller nets, have less engine horsepower and fuel capacity, etc.). Small vessels are also older on average. Almost all large vessels are steel-hulled. Steel hulls are most prominent among small vessels, but more than 50 percent of these vessels have fiberglass and wood hulls. More than two-thirds of the large vessels have freezing capabilities while few small vessels have such equipment. Small vessels still rely on ice for refrigeration and storage, though slightly less than one-third of large vessels also rely on ice. A few of the small vessels are so small that they rely on live wells for storage.
With respect to their dependency on the Gulf food shrimp fishery, both large and small active qualifying Gulf shrimping vessels are highly dependent on Gulf food shrimp landings and revenues. In 2005, the percentage of revenues arising from food shrimp landings was 98.7 percent for large vessels 95.5 percent for small vessels. As a result of this high level of dependency, both groups of vessels would be highly susceptible to losses in Gulf food shrimp landings and revenues or increased operating costs.
Finally, according to the most recent projections, on average, both small and large Gulf shrimping vessels are experiencing significant economic losses, ranging from a -27 percent rate of return in the small vessel sector to a -36 percent rate of return in the large vessel sector (-33 percent on average for the fishery as a whole). Therefore, almost any but the most minor additional financial burden would be expected to generate a significant adverse impact on affected vessels and potentially hasten additional exit from the fishery.
Description of the projected reporting, record-keeping and other compliance requirements of the proposed rule, including an estimate of the classes of small entities which will be subject to the requirement and the type of professional skills necessary for the preparation of the report or records: Management measures considered in this proposed rule do not affect the reporting or record-keeping requirements for shrimp vessels. This proposed action, which only modifies the performance standards used in BRD certification, does not require additional records or report preparation.
Identification of all relevant Federal rules, which may duplicate, overlap or conflict with the proposed rule: No duplicative, overlapping, or conflicting Federal actions have been identified. This proposed rule is similar in most respects to those considered or completed for other fisheries in the Gulf.
Substantial Number of Small Entities Criterion: Of the 2,666 vessels expected to qualify for moratorium permits, 1,806 vessels are currently active in the Gulf shrimp fishery. Of these 1,806 active vessels, 1,322 are estimated to currently be using BRDs that would no longer be on the list of allowable BRDs as a result of the proposed action. This number represents approximately 50 percent of the qualifying vessels and, more importantly, over 73 percent of the active qualifying vessels. Given that none of the active qualifying shrimp vessels have annual revenues which exceed the $4.0 million threshold, all shrimp vessels expected to be directly impacted by the proposed action are determined to be small entities for the purpose of this analysis. Thus, it is determined that this action will affect a substantial number of small entities.
37

Significant Economic Impact Criterion: The outcome of “significant economic impact” can be ascertained by examining two issues: disproportionality and profitability.
Disproportionality: Do the regulations place a substantial number of small entities at a significant competitive disadvantage to large entities? Adverse direct effects expected as a result of the proposed action would only accrue to certain vessels in the Gulf EEZ commercial shrimp fishery. Given that none of these vessels have annual revenues which exceed the $4.0 million threshold, all impacted vessels have been determined to be small business entities. Hence, the issue of disproportionality does not apply to this action.
Profitability: Do the regulations significantly reduce profit for a substantial number of small entities? Adverse direct effects expected as a result of the proposed action would only accrue to certain vessels in the Gulf shrimp EEZ fishery. To what extent particular small entities’ profits will be reduced by the proposed action is critically dependent on whether the 1,322 potentially impacted shrimp vessel owners decide to employ the predominantly used and produced Fisheye BRD in the proposed allowable position, or switch to the economically preferable BRDs (i.e. the Modified Jones-Davis BRD or particularly the Extended Funnel BRD). In turn, their ability to switch to these other BRDs will be dependent on how long it will take net shops in the Gulf region to mass produce these other BRDs and how long NMFS allows the affected shrimp vessels to change their BRDs.
To illustrate, it is known with a high degree of certainty that the estimated eight large vessels currently using the Expanded Mesh BRD would experience a substantial loss as a result of the proposed action. Even if they are able to switch to the Extended Funnel BRD or Modified Jones-Davis BRD, these vessels would experience an estimated annual loss of around $14,000 per vessel, or approximately 8 percent of their average annual gross revenues, as a result of higher costs associated with these relatively more expensive BRDs and reduced revenues as a result of their higher shrimp loss. Such a loss would certainly be sufficient to cause many of theses vessels to exit the industry. At worst, if they switch to the Fisheye BRD in its proposed allowable placement, even though the cost of purchasing this BRD would be less, the higher shrimp loss associated with the allowable Fisheye BRD would result in significantly lower annual revenues and therefore a much higher estimated annual loss of approximately $26,000, or more than 14 percent of their average annual gross revenues. Such a loss would certainly be sufficient to force all eight vessels to leave the industry.
For the estimated 77 small and 775 large vessels currently using the Fisheye BRD in the 9 to 11 foot position, the impacts are far less clear. Specifically, for the 77 small vessels, if they can switch to the Extended Funnel BRD or Modified Jones-Davis BRD, even though their operating costs would increase because these BRDs are relatively more expensive, the shrimp loss from these alternative BRDs is relatively lower which would in turn result in higher annual revenues. As a result, their estimated annual loss would only be between $300 and $450, or less than 1 percent of their average annual gross revenues. Such a loss would probably not cause these vessels to leave the industry. On the other hand, if they are unable to make this change and instead move their Fisheye BRDs to the proposed allowable position, their estimated annual loss would be approximately $3,000, or more than 6 percent of average annual gross revenues. Even though these vessels’ operating costs would remain unchanged, their annual revenues would decrease as a result
38

of the much higher level of shrimp loss associated with the allowable Fisheye BRD. Such a loss would certainly be sufficient to cause many if not most of these vessels to exit the industry.
For the 775 large vessels, if they can switch to the Extended Funnel BRD, they would experience an annual gain of $556, representing a benefit of approximately .3 percent of average annual revenues. Even though their operating costs would increase as a result of purchasing these relatively more expensive BRDs, the shrimp loss associated with this BRD is sufficiently lower so as to cause annual revenues to increase by more than the increase in operating costs, thereby resulting in a net gain. If these vessels can switch to the Modified Jones-Davis BRD, since the higher costs associated with purchasing this more expensive BRD are almost identical to the increase in revenues resulting from its relatively lower shrimp loss, they would experience an imperceptible annual loss of $6. On the other hand, if they are unable to make this change and instead move their Fisheye BRDs to the proposed allowable position, their estimated annual loss increases significantly to more than $11,400, or approximately 6.4 percent of average annual gross revenues. Even though these vessels’ operating costs would remain unchanged, their annual revenues would decrease as a result of the much higher level of shrimp loss associated with the allowable Fisheye BRD. Such a loss would certainly be sufficient to cause many of these vessels to exit the industry.
For the estimated 51 small and 411 large vessels currently using the Gulf Fisheye BRD, the impacts are also somewhat unclear. But, these vessels are more likely to experience higher annual losses than the vessels currently using the Fisheye BRD in the 9 to 11 foot position.
Specifically, for the 51 small vessels, if they can switch to the Extended Funnel BRD or Modified Jones-Davis BRD, their estimated annual loss would be approximately $1,400, or about 3 percent of their average annual gross revenues. This annual loss would be due to both an increase in operating costs, as these BRDs are relatively more expensive, and a decrease in annual revenues, since they also have a relatively higher shrimp loss. Under current economic conditions, such a loss could certainly lead some of these vessels to leave the industry. Moreover, if they are unable to make this change and instead move their Fisheye BRDs to the proposed allowable position, the estimated annual loss increases significantly to approximately $4,000, or more than 8 percent of average annual gross revenues. Even though these vessels’ operating costs would remain unchanged, their annual revenues would decrease as a result of the much higher level of shrimp loss associated with the allowable Fisheye BRD. Such a loss would certainly be sufficient to cause many if not most of these vessels to leave the industry.
For the 411 large vessels, if they can switch to the Extended Funnel BRD or Modified Jones-Davis BRD, their estimated annual loss would be between $3,500 and $4,000, or about 2 percent of their average annual gross revenues. This annual loss would be due to both an increase in operating costs, as these BRDs are relatively more expensive, and a decrease in annual revenues, since they also have a higher shrimp loss. Under current economic conditions, such a loss could cause some of these vessels to exit the industry. Moreover, if they are unable to make this change and instead move their Fisheye BRDs to the proposed allowable position, the estimated annual loss increases significantly to more than $15,500, or 8.6 percent of average annual gross revenues. Even though these vessels’ operating costs would remain unchanged, annual revenues would decrease as a result of the much higher level of shrimp loss associated with the allowable Fisheye BRD. Such a loss would certainly be sufficient to cause many if not most of these vessels to exit the industry.
39

In conclusion, it is highly likely that the estimated eight vessels currently using the Expanded Mesh BRD would experience a relatively substantial loss as a result of the proposed action and thereby be forced to leave the industry. It is somewhat likely that the 462 vessels currently using the Gulf Fisheye BRD would experience a relatively substantial loss as a result of the proposed action and thereby be forced to leave the industry. Finally, it is at least possible that all 1,322 vessels currently using BRDs that would not be allowable under the proposed action would experience a substantial loss and thereby potentially be forced to exit the industry.
Description of significant alternatives to the proposed rule and discussion of how the alternatives attempt to minimize economic impacts on small entities: The only alternative considered to the proposed action is the status quo, or no action. Since the status quo would not change the existing list of allowable BRDs in the Southeastern shrimp fishery, there would be no new impacts associated with this action. However, new information collected between 2001 and 2003 indicate that the Expanded Mesh, the Gulf Fisheye, and the Fisheye BRD in its standard configuration, as used in the Gulf of Mexico shrimp fishery, do not meet the 30-percent finfish reduction criterion being proposed in separate rulemaking. According to SEFSC estimates, the Fisheye BRD, depending on its placement in the cod end of the trawl, achieves between 13- to 23-percent reductions in finfish biomass and the Expanded Mesh BRD achieves a 17-percent reduction in finfish biomass. Since these BRDs are not achieving the level of finfish bycatch reduction specified by the proposed certification criterion then, by definition, their use will not be considered legal in the Southeastern shrimp fishery. Therefore, these BRDs must be removed from the list of allowable BRDs, at least in some of their currently used configurations.
Allowing for the provisional certification of BRDs achieving a 25 percent reduction in finfish biomass under separate rulemaking could significantly reduce the potential adverse economic impacts of this proposed action on small entities since it would allow for the temporary certification of the Extended Funnel BRD. Relative to the BRDs that meet the 30 percent finfish reduction criterion, the Extended Funnel BRD’s average shrimp loss is considerably lower and thus so are the economic impacts potentially resulting from this action if shrimp vessel owners switch to this particular BRD. Whether or not shrimp vessel owners have the ability to switch to this particular BRD is critically dependent on how long they are given to make the change. The more time they are given to switch to this BRD or even the Modified Jones-Davis BRD, the much less adverse the economic impacts of the proposed action will be.
3.0 Social Impact Assessment
3.1 Social Environment
When examining the Gulf shrimp fishery’s social as opposed to economic environment, the focus of the discussion shifts primarily from vessels and firms to people and places (i.e. communities), though obviously vessels and firms are a part of those communities. There is little data to adequately describe the affected environment for communities dependent on the shrimp fisheries. In order to understand the impact that any new rules and regulations will have on participants in the fishery, in-depth community profiles need to be developed that will aid in the description of communities involved in this fishery, both present and historical. Such research is currently being
40

conducted by NMFS in communities in the Gulf of Mexico. This research is being at least partly guided by research conducted under contract with Impact Assessment, Inc. (IAI) (IAI 2005 a,b,c,d). The purpose of this initial phase of the research was to compile baseline information regarding communities in each Gulf state which were believed to have some level of association with marine fisheries. That is, based on a full range of descriptive information and analyses, IAI developed a basic typology of the study communities and their involvement with marine fisheries and related industries. This information can be used in determining which communities are “fishing communities,” as per the meaning of the term under National Standard 8. In general, “fishing communities” are communities which are “substantially dependent on or substantially engaged in” fishing or fishing related activities. However, until in-depth community profiles are developed for at least a representative sample of the potentially affected communities, it is not possible to fully describe the possible impacts of any change in federal fishing regulations in the federal Gulf shrimp fishery.
Further, as discussed in the RIR, recent hurricane seasons have fundamentally affected the shrimp fishery, its supporting infrastructure, and communities. Although studies regarding the impacts of the hurricanes continue, a complete picture of how the fishing industry in the Gulf of Mexico has changed is still unavailable at this time. For example, it is still unknown how many shrimp boats were lost, and how many fishermen are out of the fishery now and may not return. Fishing infrastructure is being rebuilt, boats are being salvaged and repaired, fishermen are fishing again, and communities are picking up the pieces. Even though social and economic assessments of the nature and magnitude of these impacts are ongoing and not yet complete, limited information is available on fishermen, fishing-dependent businesses, or communities that depend on the Gulf shrimp fishery.
Even before hurricanes Katrina and Rita, fishermen in the shrimp industry were already having a difficult time making a living in the shrimp fishery due to the high cost of fuel and the low price paid at the docks for shrimp, and the overcapitalization of the shrimp fishery. Many shrimp fishermen had dropped the insurance on their boats and reduced the number of crew on their boats to increase profits. Big shrimp boats were being repossessed at an increasing rate, and fishermen were exiting the shrimp fishery.
The hurricanes of 2005 brought massive disruptions to the fishing industry across the northern Gulf of Mexico. Docks, marinas, fuel sources, and icehouses were heavily damaged or destroyed. Some fishermen with operable boats have moved, at least temporarily, to other locations to fish, and may unload in an area that is different than where they unloaded before the hurricanes. A year after the storm several communities were still struggling to get back on their feet and recover their shrimp fishing industry. In 2004, Louisiana, Mississippi, and Alabama accounted for almost half of the shrimp harvested in the nation. In Louisiana, 66% of the shrimp fishermen live in areas affected by hurricane Katrina. Eighty-three percent of Louisiana’s seafood processors and all eight of seafood canning factories were also located in these areas. Two of the largest shrimp processors in Louisiana, Bumble Bee Cannery in Violet, Louisiana and Piazza Seafoods in New Orleans, were left inoperable. Bumble Bee is not planning to reopen (Impact Assessment, Inc. 2007).
Boats and fishing infrastructure were lost to the hurricane and fishing dependent communities were totally disrupted. In the case of lower Plaquemines Parrish and St. Bernard Parrish, most of the
41

fishing infrastructure was completely destroyed. The Empire/Venice area of Plaquemines Parish was one of the top areas for landings of shrimp in the Gulf of Mexico prior to the storm. In October 2005, two-thirds of the shrimp fleet was out of commission (Impact Assessment, Inc. 2007).
Communities are still rebuilding their fishing dependent businesses and fishermen are trying to repair or replace damaged or destroyed boats. Many shrimp fishermen along the northern coast of the GOM are living in FEMA trailers or with friends and relatives in other locations. As of August 2006, some were still waiting to obtain a FEMA trailer so they can move back to their communities. Some shrimpers will never return to their communities and will rebuild their lives elsewhere.
Recent fieldwork in lower Plaquemines Parish revealed that there are many boats still in need of salvaging. Some are stranded along roadways and in marshes as owners wait to see if they can get help from the government to remove their boats and return them to the water. One fisherman said he has a 40-foot shrimp boat that appears to have received minor damage but is stranded in the marsh. He had received an estimate of $40,000 to remove his boat from the marsh and get it back into the water, less than a half of mile away. Others who lost their shrimp boats do not have insurance to replace them. A shrimp dock in Buras, Louisiana reopened in May 2006 and the owner said he had half of the number of shrimp boats landing shrimp in July 2006 as he had at the same time in 2005 (Ingles, personal communication 2006).
Grand Isle, Louisiana had two shrimp docks with icehouses and fuel before the storm. Both of these docks were left in ruins after the storm passed. One shrimp dock reopened in November 2005, the other opened in April 2006. In July 2006, the number of shrimpers unloading shrimp in Grand Isle was less than it was a year ago (Ingles, personal communication 2006).
In 2005, the Louisiana Department of Fish and Wildlife estimated that at one year out, there would be an economic loss of over $538,000,000 to the shrimp industry. Even as infrastructure is rebuilt and some shrimp fishermen go back to shrimping, there are still many challenges ahead. Currently, there are still not enough processors in business to process all of the shrimp that is coming in, causing bottle necks in the processing. Louisiana had a reported loss of 35-40% of the labor pool they had before the hurricane in jobs dependent on the fishing industry. Many workers relocated to other areas after the hurricane and have not returned. In Plaquemines Parish, the number of commercial fishing licenses was down 38% in 2006 from the number of licenses in 2004-2005. The number of commercial fishing licenses St. Bernard Parish was down 43% for the same time frame (Impact Assessment, Inc. 2007).
Many of the shrimp boats in Bayou La Batre, Mississippi were lost or stranded in the marsh due to hurricane Katrina. Sixty percent of the commercial shrimp boats in Bayou La Batre were destroyed (Impact Assessment, Inc. 2007). Even before the storm, many of the boats in Bayou La Batre were tied up at the docks and had been repossessed.
The shrimp industry in Mississippi also suffered great losses from hurricane Katrina. Many boats were damaged or destroyed and most of the infrastructure for the shrimp industry in Gulfport and Biloxi was destroyed. At the start of the shrimp season in May 2006, 15% of the shrimp fleet that had been in place pre-Katrina went out to fish. Aerial surveys done in June 2006 of shrimp boats
42

along the Mississippi coast revealed 306 boats, which were down from the 603 observed in June 2005 (Impact Assessment, Inc., 2007).
The Gulf of Mexico shrimp industry faces many challenges ahead. Some of the challenges are created due to the low prices paid at the docks for shrimp due to the competition from the price paid for imported shrimp and the high cost of fuel. Other challenges were created by hurricane Katrina. Many fishermen are still displaced, and do not have homes to return to in their communities. There is still a need for funding to help rebuild the infrastructure that supported the shrimp industry prior to the storm. Shrimp boats are still in need of repair and salvaging. There are not enough processors, commercial marinas, icehouses, and fuel docks to service the shrimp fishery in the Gulf of Mexico as it rebuilds. Some of the land that was occupied by infrastructure that supported the shrimp industry before hurricane Katrina is being bought up and converted to other uses such as space for condominiums and casinos. As the price of water front property continues to increase as a result the higher demand by other industries, it is becoming more common in many communities for fishermen and others working in fishing dependent businesses to live inland, away from the water. This compounds the problem of trying to identify fishing communities as a certain location where people dependent on marine resources live and work. In some areas, fishermen who used to live in one community may now be dispersed in several outlying communities with more affordable housing. Simply put, communities along the Gulf coast are changing rapidly, and a variety of natural, economic, and social forces are accelerating this rate of change.. With respect to secondary information, data on the distribution of Gulf shrimp landings and revenues, qualifying and active shrimp vessels/permit holders, shrimp dealers/wholesalers, and shrimp processors across communities is available for 2005. Such information should be useful in gauging the shrimp fishery’s importance to particular communities, and the importance of certain communities to the fishery. In turn, these data can be analyzed and used as a starting point to identify some of the communities that may be affected by changes in federal fishing regulations.
However, as previously noted, there is not enough ethnographic research on individual communities involved with this fishery to know the status of race or income among people who rely on the shrimp industry. Therefore, it is not possible to definitively know if the actions in this proposed rule would have any disproportionately high and adverse effects on minority or low-income populations. However, by comparing basic demographic information of communities associated with the Gulf shrimp fishery to national averages, it should be possible to discern whether any of these communities are socio-economically disadvantaged, and thus whether impacts on them should be given special consideration, as per Executive Order 12898. E.O. 12898 requires fisheries managers to address environmental justice in minority and low-income populations regarding the proposed actions. Data from the 1990 and 2000 Census were used for the descriptions in this document so that it is possible to see changes in the communities in those ten years.
Unfortunately, the census data offers its own set of problems when trying to identify the number of people who are dependent on fishing resources in a given community. First, the census is only conducted every ten years. In the span of ten years, much can change in a coastal community due to the increasing pressure to develop waterfront property. Second, people who work seasonally in fishing dependent areas may or may not be counted in a particular community that is dependent on fishing, depending if they are residing in that community at the time of the census. A third problem is that in the census fishing is lumped together with farming and forestry occupations under the
43

occupation category and with agriculture, forestry, and hunting under the industry category. Therefore, it is impossible to discern how many people are actually dependent on fishing from the other occupations fishing is lumped with. Further, people who rely on other supplemental work outside of fishing related occupations may report their occupation under another category.
Thus, as illustrated above, much more time and money need to be invested in conducting community research if the dynamics of fishing dependency within individual communities are to be understood, which in turn would create the ability to competently describe the social impacts of any changes in federal fishing regulations. As more community profiles are developed in the future, it may be possible to better describe specific social impacts of fishing regulations on some communities. Until that time, secondary data will be used as a starting point, but it may not allow for a complete and accurate assessment of the social impacts arising from new regulations.
3.1.1 Distribution of Federal Gulf Shrimp Permit Owners by Community
As can be seen in Table 36, permit owners are geographically distributed across 332 different communities. Though the vast majority of permit owners reside in Gulf States, a fair number live in many other states, ranging from the South and Mid-Atlantic States and even the west coast of the U.S. The geographic distribution of permit and vessel ownership is important since, when federal regulations are imposed on permitted vessels which experience adverse impacts, it can generally be assumed that they will be most keenly felt in the communities with the largest number of permit owners. The data indicate that the Texas communities of Port Isabel, Brownsville, Palacios, and Port Arthur are home to more than 16% of the federal permit owners. Other Texas communities where permit ownership is relatively important are Freeport, Port Lavaca, and Aransas Pass. In Louisiana, permit ownership is prevalent in the communities of Cut Off, Chauvin, New Orleans, Abbeville, and Houma.25 In Mississippi, Biloxi and Ocean Springs are the primary hubs of permit ownership. In Alabama, permit ownership is concentrated in Bayou La Batre. And in Florida, Fort Myers Beach is clearly the dominant community with respect to permit ownership, particularly if Fort Myers is included.
However, it should be pointed out that the information in Table 36 also shows that many of these permit owners and their vessels were not active in the Gulf shrimp fishery in 2005. This lack of activity is undoubtedly due to the adverse economic conditions in the fishery and, at least for the latter part of the year, possibly due to the impacts of hurricanes Katrina and Rita. Changing perspective to only those permit owners/vessels active in 2005 does not significantly change the identities of communities with the greatest concentration of ownership, though the top four previously mentioned communities in Texas now account for nearly 19% of the active permits. In general, most of the predominant communities in terms of permit ownership have seen, on average, about 25% of their permitted vessels become inactive. However, within this group of communities, the percentage of inactive permits is considerably higher in Bayou La Batre. Nearly 50% of the permit owners’ vessels in this community were not active in 2005, indicating that Bayou La Batre has been particularly hard hit by the adverse economic conditions in the fishery.
5 25According to IAI’s research, New Orleans should likely not be considered a single community, but rather a “supra” community composed of several “sub-communities.” This issue deserves further research.
44

3.1.2 Distribution of Gulf Shrimp Dealers, Landings, and Sales by Community
The information presented in Table 37 regarding the distribution of food shrimp dealers, landings, and sales by community provides insights into the importance of the shrimp fishery to particular communities, and their importance to the fishery. The information in Table 37 pertains to all Gulf food shrimp landings, regardless of whether they came from federal or state waters. All but two of the communities (Bayou La Batre and Palacios) with ten or more dealers are located in Louisiana. However, the top three communities in terms of Gulf food shrimp sales are all in Texas and include Port Arthur, Palacios, and Brownsville. Of the additional communities with at least $10 million in shrimp sales, five are located in Louisiana (Dulac, Abbeville, Golden Meadow, Chauvin, Grand Isle); two in Texas (Port Isabel, Port Bolivar); one in each of the remaining Gulf states (Bayou La Batre, Alabama, Biloxi, Mississippi, and Fort Myers Beach, Florida). For those communities considered, per dealer shrimp sales by community range from a minimum of $51,118 recorded in Fulton, Texas to a maximum of $5,655,322 in Port Arthur, Texas. These findings illustrate that fishing vessel owners do not always live where their product is being bought and sold.26
3.1.3 Distribution of Supplying Gulf Shrimp Vessels by Community
Though shrimp sales and landings volume are potentially important indicators of a community’s ties to the fishery, also of interest is the number of vessels that supply shrimp to dealers in each community. More so than volume and sales, number of vessels is indicative of how many fishermen and fishing households have a relationship with a particular community. This information is presented in Table 38. Note that, in this case, all known Gulf shrimp vessels are taken into account. In Table 39, only Gulf shrimp vessels eligible for a moratorium permit are considered. There are significant differences between the two, which in turn reflect differences between communities and their relationship with harvesters whose activities predominantly take place in the EEZ as opposed to state waters.
For example, when taking all vessels that supply shrimp into account, communities in Louisiana occupy the top six and eight of the top ten spots within the ranking (Dulac, Grand Isle, Lafitte, Golden Meadow, Chauvin, Empire, Venice, and Montegut) with Bayou La Batre and Port Arthur being the only non-Louisiana communities in that group. Conversely, when only looking at federally permitted vessels that supply shrimp, five communities in Texas (Port Arthur, Brownsville, Palacios, Freeport, and Port Bolivar) and four communities in Louisiana (Dulac, Grand Isle, Abbeville, and Golden Meadow) rank in the top ten, along with Bayou La Batre. In general, it is fairly clear that many communities in Louisiana have stronger ties to vessels that operate in state waters, while several communities in Texas are more closely aligned with federally permitted vessels. For example, Lafitte, Chauvin, Empire, Venice, and Montegut apparently have much stronger relationships with vessels that operate in state as opposed to federal waters, while the opposite is true for Port Arthur, Brownsville, Palacios, Freeport, and Port Bolivar.
6 26Note that the information in this table was compiled according to where the shrimp were bought and sold, which is oftentimes different from the port of landing (i.e. where the shrimp cross the dock) since product is often trucked from a port to a dealer that may be in a different community. For this analysis, vessel counts were not presented according to port of landing since, within the SLF, the “port” code is oftentimes a county or parish, which does not allow the analyst to determine the specific community where the vessel is docked.
45

3.1.4 Distribution of Gulf Shrimp Processors by Community
Because of the decline in the number of shrimp processors and the resulting fact that most communities only have one or two shrimp processors, and the “rule of three” which requires NOAA Fisheries Service to protect businesses’ confidential information, very little detailed information regarding processing activities can be revealed at the community level. Nonetheless, the ranking should provide some insights into approximately how important shrimp processing activities are to the 31 communities listed in Table 40. Some additional observations are worth noting.
First, the processors in Lakeland and Dover, Florida are obviously very important within the industry. However, given their inland locations and the fact that no domestic shrimp dealers are located in these communities, it is quite likely that these processors rely mostly if not entirely on imported product.27 Most of the other communities appear to have a very strong or at least some relationship with domestic harvesters and dealer/wholesalers. Further, with the exceptions of processors in Dallas, Kemah, Seadrift, and Port O’Connor, Texas, and two additional processors in Saraland, Alabama and Panacea, Florida, the other processors and thus their communities rely heavily if not entirely on shrimp with respect to their processing activities. Again, how much of that shrimp comes from domestic production cannot be known with certainty, though Keithly et. al’s (2005) analysis suggests a likely estimate of 60%. Communities that appear to have a very strong relationship with shrimp processing activities, though not nearly as much so with harvesting and wholesaling activities, would include Delcambre, Louisiana, Tampa, Florida, D’Iberville, Mississippi, and Bon Secour, Alabama. Undoubtedly, many of the processors in these communities receive product from nearby communities that have closer ties to harvesters and dealers. For example, recent field research suggests a strong relationship between dealer/wholesalers and vessel owners in Abbeville, Louisiana, who also have a strong relationship with vessels ported in Intracoastal City, Louisiana, and with processors in Delcambre, Louisiana.
3.1.5 An Overall Assessment of Community Relationships with theGulf Shrimp Fishery
Upon taking into account all of the presented placed-based information regarding the Gulf shrimp fishery, some ranking of communities according to the strength of their relationship with the fishery should be possible. Although this ranking is somewhat subjective, it does take into account all of the place-based factors that have been discussed, both in terms of how high each community ranked and how many factors for which it was highly ranked. Some emphasis has been placed on factors that are specific to the EEZ component of the fishery, and thus this ranking should be seen in this light. Rankings presented in Table 41 indicate that most of the top ten communities with strong ties to the shrimp fishery are located in Texas (Port Arthur, Brownsville, Palacios, Port Isabel) and Louisiana (Dulac, Chauvin, and Abbeville). The other three Gulf states each had one community ranked in the top ten (Bayou La Batre, AL, Biloxi, MS, and Fort Myers Beach, FL respectively). In addition, community involvement in fishing related activities was evaluated in recent research completed by Impact Assessment Inc. (2005 a,b,c,d), in collaboration with NOAA Fisheries
7 27This hypothesis has in fact been confirmed by several industry representatives.46

Service. In this evaluation, a wide set of attributes was used to characterize fishing communities throughout the Gulf. Fishing communities are defined under National Standard 8 as communities which are “substantially dependent on or substantially engaged in” fishing or fishing related activities. Fishing–specific attributes considered in this recent research include commercial permits and licenses (federal and state), for-hire and other recreational permits, seafood landings and retail markets, processing facilities, recreational tournaments, commercial and recreational docking facilities, and other seafood/fishing related parameters. A summary index derived from the presence or absence of these fishing-specific attributes was used to provide a preliminary characterization of “fishing-oriented” communities in the Gulf States. Communities are categorized as “primarily-involved,” “secondarily-involved” or, “tangentially-involved” based on their level of involvement in fishing-related activities. For each Gulf state, summary tables listing communities and their preliminary categorization are presented in the reports. As expected, communities with strong ties to the shrimp industry are classified as “primarily involved” communities, e.g., Dulac, Abbeville, and Chauvin in Louisiana, Bayou La Batre in Alabama, Fort Myers Beach in Florida, Biloxi in Mississippi, and, Port Arthur, Brownsville, Palacios, and Port Isabel in Texas.
3.1.6 Assessment of Community Resiliency
In addition to the place-based fishery data above, additional information can be gleaned by looking at the socio-demographic composition of these communities. As per Executive Order 12898, of specific interest are communities that have relatively high percentages of minorities; communities which are lower than average with respect to important socioeconomic factors, such as level of education, average household income, and poverty rates; and communities which have a relatively strong economic dependence on the fishing industry in general. These factors would be evaluated relative to national averages. For example, nationally, slightly more than 29 percent of the population is composed of minorities: Blacks/African Americans (12.3 percent), American Indians/Native Alaskans (0.9 percent), Asians (3.6 percent), and Hispanics/Latinos (12.5 percent). Average household income is $41,994 and 12.4 percent of the population lives in poverty. Over 80.4 percent of the population have a high school education or better, while 24.4 percent have a bachelor’s degree or higher. This information generally comes from the Census Bureau (2000). Upon an analysis of the Census data for each community, many communities (24) appear to be relatively vulnerable to social and economic impacts as a result of adverse management changes, or adverse changes due to other factors. That is, these communities would find it more difficult to adjust to or “absorb” adverse impacts because, relative to other communities, they lack the sufficient human, physical, and financial capital to do so. From a social justice perspective, the impacts of Gulf shrimp fishery management changes on these communities should be given additional consideration. More specifically, the 24 communities can be subjectively broken into two groups: (1) communities which reflect all five of the attributes noted above and/or reflect at least four of the attributes above and additionally appear to have been significantly impacted by the 2005 hurricanes (Group 1), and (2) communities which indicate four of the attributes noted above and/or reflect at least three of the attributes above and additionally appear to have been significantly impacted by the 2005 hurricanes (Group 2). Within each of those groups, there are 11 and 13 communities, respectively. Communities falling into each group are listed in Table 42. Communities in the first group would be the most vulnerable, i.e., least able to adapt, to adverse
47
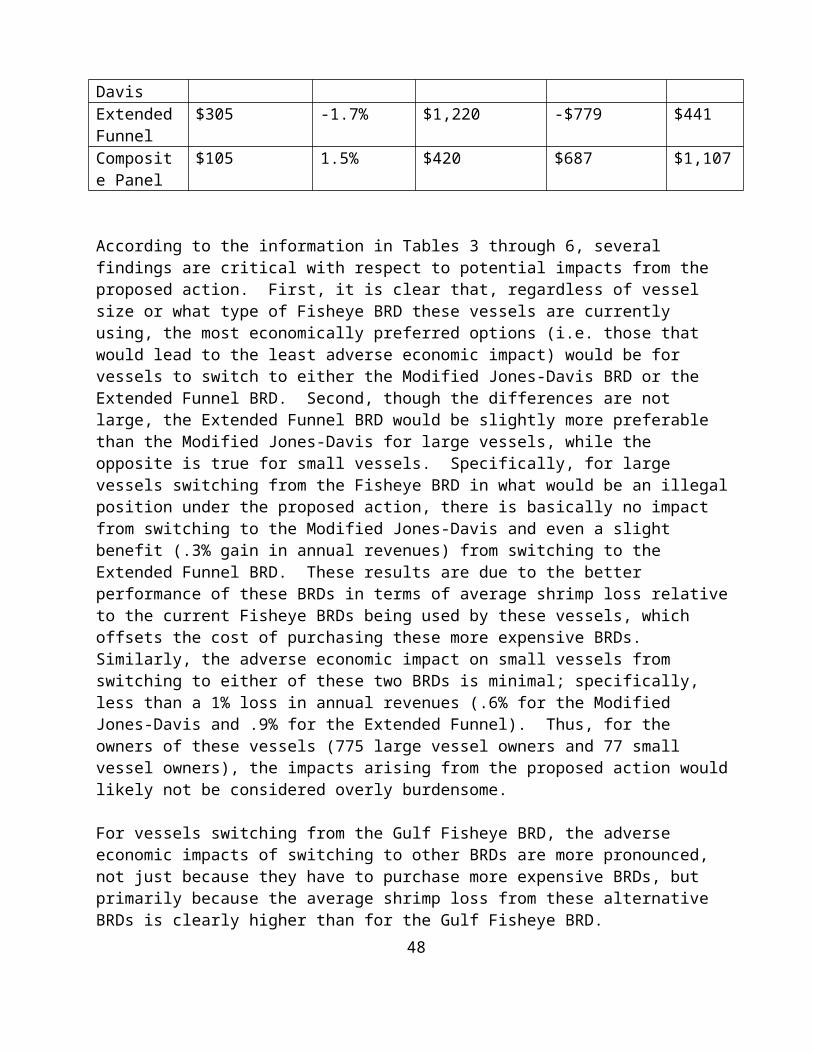
impacts from additional federal regulations. Within these two groups of communities, according to IAI (2005 a,b,c,d), the following communities were determined to be primarily involved with marine fisheries: Dulac, Empire, Abbeville, Golden Meadow, Venice, Chauvin, Cameron, Montegut, Houma, and Delcambre in Louisiana; Palacios, Port Isabel, Port Arthur, Freeport, Aransas Pass, Brownsville, and Port Lavaca in Texas; Bayou La Batre and Coden in Alabama; and Apalachicola in Florida. Thus, the vast majority of these socio-economically vulnerable communities are also highly dependent on fishing.
3.1.7 Descriptions of Select Communities with Strong Relationships to the Gulf Shrimp Fishery
As mentioned above, there is still much uncertainty in the shrimp fishery as some communities that were heavily damaged by the hurricanes of 2005, such as Biloxi, Mississippi; Bayou La Batre, Alabama; and Venice, Louisiana, rebuild their fishing infrastructure. Some of the shrimpers unloaded in different ports than where they unloaded before the hurricanes, shifting the distribution of landings, vessels, and therefore revenue and income across communities. For the purpose of further describing a few communities that are most likely to be impacted by new regulations on the shrimp fishery, additional basic information, including demographics, is provided for Brownsville, Port Arthur, and Palacios Texas; Bayou La Batre, Alabama, and Dulac, Louisiana, given that these five communities have the strongest relationship with the Gulf shrimp fishery. These community descriptions are based on information found in IAI’s community profiling reports (IAI 2005 a,b,c,d).
Brownsville, Texas
Brownsville is the seat of government of Cameron County. The area is a major port of entry to Mexico, and is the sixth fastest growing manufacturing region in the nation. Agriculture, petrochemicals, and shrimp harvesting and processing are vital components of the Brownsville economy. Brownsville is located 25 miles west of the Gulf of Mexico. The Brownville ship channel provides direct access to the Gulf via Port Isabel.
Originally part of Mexico, Brownsville was established in 1846 as “Fort Brown” by U.S. troops seeking to define the Texas national boundary. However, Mexico protested this demarcation and the U.S.-Mexico War (1846-1848) ensued. Brownsville officially became part of the State of Texas following the signing of the Treaty of Guadalupe Hildago in 1848. Soon thereafter, the city developed as a center of commerce for northern Mexico. It was incorporated in 1853. The town grew slowly until the arrival of the St. Louis, Brownsville and Mexico Railway in the early 1900s.
Brownsville developed as the shipping center for the lower Rio Grande Valley and northeastern Mexico after the Port of Brownsville (located in the Brownsville Ship Channel) opened in 1936. With its Gulf location and easy access to shrimp, Brownsville soon became one of the nation’s leading shrimp exporters.
The Industrial Development Council and the Border Industrialization Program were established in the 1960s to encourage American industries and Mexican businesses and laborers to locate in Brownsville and along the border area. More than 100 industrial firms offering in excess of 13,600
48

jobs came to Brownsville between 1966 and 1978 as a result of these programs. Various manufacturing and petrochemical industries provided new sources of employment in the 1990s.
Brownsville grew by 41 percent between 1990 and 2000. The city was home to 98,962 persons in 1990 and 139,722 in 2000 (Table 7). Some 28 percent of the workforce in Brownsville claimed management, professional, and related occupations in 2000; 27 percent reported holding sales and office positions. One percent of residents reported farming, fishing, or forestry as their primary occupation, with fishing as the leading employment sector in this category. Of the community’s working population, only four percent held positions outside their county of residence. Average reported commute time was 20 minutes.
There are numerous established fishing-related businesses in Brownsville, including a large shrimp trawl fleet and associated support services. The latter include various fishing gear suppliers, electronic retailers, welding and other repair shops, ten net makers, two fish processing and wholesale fish houses, two boat yards, and a seafood trucking operation. Most shrimp boats moor at the Port of Brownsville, while the smaller commercial pelagic fleet typically operates from Port Isabel.
Port Arthur, Texas
Port Arthur is located along the Intracoastal Waterway and Sabine Lake in eastern Jefferson County. It is approximately 90 miles east of Houston and 15 miles southwest of Beaumont. The area is a popular year-round fishing destination for recreational anglers, and a productive commercial fleet is based here. From its location on the western shores of Sabine Lake, Port Arthur is about 14 miles north of the Gulf of Mexico. The Gulfgate Bridge connects Port Arthur with Pleasure Island and provides access to the Sabine Lake Causeway.
The Atakapas tribes were the earliest known inhabitants of the Port Arthur area Spanish, French, and English explorers began arriving in the late 1700s. Sabine Lake was an established trade route by the 1800s. The town of Port Arthur was founded in the late 1800s by railroad pioneer Arthur E. Stilwell, with financial support from Dutch investors. Growth occurred in the early 1900s after the port opened for shipping. Economic prosperity was closely tied to the Spindletop oil field in nearby Beaumont. The Gulf Oil Corporation and Texaco established refineries in Port Arthur. By 1957, Port Arthur employed some 12,000 workers and was regarded as an important center of oil refining. During the late 1990s, an average of 23,000,000 cargo tons of crude oil per year was exported from Port Arthur.
The year 2000 census reported a population of 57,755 persons, a loss of 969 from 1990 (Table 8). In 2000, 1.1 percent of the population listed their occupation under the farming, fishing, and forestry category. A drop from the 2.0 percent listed in the category in 1990. There was also a drop in the number of people in the agriculture, forestry, fishing and hunting category of industry from 1990 which showed 2.1 percent of the population, to 2000 which showed 1.3 percent of the population under that category. Extensive fishing-related infrastructure is in place here, including numerous boat builders and brokers, marinas, processors, and retail and wholesale seafood dealers. A fleet of charter vessels is also based here. A relatively large fleet of trawlers is based here as well.
Palacios, Texas
49

Palacios is small town located in the extreme southwest portion of Matagorda County. Houston is 90 miles northeast, Victoria is 45 miles northwest, and Bay City is 30 miles northeast. Matagorda is about 14 miles east by air, but the trip by road or water would require a more lengthy andcircuitous trip.
Palacios was built along the banks of Tres Palacios Bay, and its residents have long been involved in commercial shrimp trawling and various types of fishing. Although the South Texas Project Nuclear Operating Company and Formosa Plastic are now the area’s two largest employers, the town is home to the second largest commercial fishing fleet in Texas, and the eleventh largest in the United States. In 2000, the Port of Palacios was also the state’s largest producer of shrimp. The Matagorda County Navigation District Number One facilities are also located here. These facilities housed 380 boats and 16 seafood businesses in 1990. Palacios vessels typically access the Gulf of Mexico via a 14-mile voyage through Matagorda Bay to Matagorda Ship Channel.
Palacios was established in the early 1900s. Fishing and oyster harvesting quickly became, and remain, significant aspects of the local economy. Other early forms of enterprise included cotton, rice, and fruit and vegetable production. Petrochemical manufacturing and nuclear energy production facilities in the region led to increased economic opportunity and growth in Palacios in the 1960s. Jobs in manufacturing, agriculture, aquaculture, and marine fisheries helped offset employment losses when the nuclear power facility shifted from construction to operation during the 1990s.
The year 2000 population of Palacios was 4,207 persons, an increase of eight percent above the 1990 figure of 3,904 (Table 9). Many residents work in seafood related businesses. As noted above, employment opportunities at the nuclear power facility near Bay City and at petrochemical facilities in the region are also significant. Nearly 20 percent of persons in the local workforce commute to jobs outside of Matagorda County.
There are numerous well-established fishing-related businesses and services in Palacios. The majority are associated with the shrimp harvesting, processing, and distribution sectors. Commercial docking facilities accommodate a large and productive trawl fleet. Persons of Vietnamese ancestry have, over recent decades, complemented local seafood operations with highly successful efforts of their own. Unfortunately, marketing challenges have reportedly led to numerous layoffs across the fleet, and many vessels were sitting idle at the time of this study. The fleet here is quite large. Numerous fishing piers, public boat ramps, bait and tackle shops, and other businesses wholesale fish houses/processors also served residents in recent years.
Bayou La Batre, Alabama
Bayou La Batre is located along State Highway 188 in southern Mobile County. It is adjacent to the body of water of the same name. The bayou empties into Mississippi Sound, providing easy access to several major ship channels and the Gulf of Mexico. Bayou La Batre is some 25 miles south of Mobile and approximately 22 miles east of the Pascagoula-Moss Point, Mississippi Metro area. The Gulf of Mexico is about 17 miles south, accessible via Portersville Bay and the Mississippi Sound.
50

Bayou La Batre was founded in the 1780’s by a Frenchman named Joseph Bosarge. "La Batre" refers to a strategic battery built by the French during that period. Following the introduction of rail service in the late 1800s, the area developed as a resort town. A hurricane so devastated the area in 1906 that commercial fishing became the only source of income. Residents subsequently established a lengthy history of involvement in the harvest, processing, and distribution of seafood.
The year 2000 census enumerated 2,313 persons in Bayou La Batre, a decline from the 1990 count of 2,456 (Table 10). Most residents were employed in manufacturing industries or sales occupations in 2000.
The commercial fishing and processing industries are vital to the local economy. Shrimp, oysters, crabs, and finfish are primary products. The commercial fishing industry here reportedly generates direct and indirect revenue of nearly $80 million per year, with an approximate annual ex-vessel value of nearly $30 million. Bayou La Batre was ranked 10th in value of landings for all U.S. ports in 2000. Fishery participants from Bayou La Batre also produce the majority of Alabama seafood landings; shrimp accounts for 90 percent of landed seafood value. Crews for hundreds of shrimp vessels work out of and deliver product to Bayou La Batre. Local processing activities include cleaning, heading, picking, shucking, grading, breading, packaging, frozen storage, and transportation. Much of the seafood processed in Bayou La Batre’s processing plants is trucked in from out-of-state. These plants employ approximately 1,500 year-round workers and 800 seasonal workers. An additional number of packing houses and wholesale seafood dealers employ many year-round and seasonal workers. There are also at least a dozen marine supply shops and marine electronics firms in Bayou La Batre.
Shipbuilding is Bayou La Batre’s other major industry. Oil supply boats, work boats, barges, shrimp boats, tugs, cruisers, and casino boats are among the vessels built in Bayou La Batre.
There is a small downtown business district at the intersection of Shell Belt Road and State Road 188. Shell Belt Road is the address of many fishing-related industries, such as seafood processors, fish houses, and boat building yards. Numerous shrimp vessels are docked nearby. There are no bars, hotels, or non-fishing related businesses located on the bayou. A NMFS port agent has an office in town.
A population of persons of Vietnamese ancestry is involved in all facets of the local seafood industry. Many settled in the community with the help of the Catholic Church after the end of the Vietnam War.
The local fishing fleet here ranges from small bay boats that fish for shrimp and finfish to large Gulf vessels (called “steel slabs”) that make extended trips throughout the Gulf of Mexico and Southeast Atlantic. There are small seafood dealers that handle shrimp, crab, oysters, and finfish and large-scale processors that ship specialty products worldwide. All types of support businesses from net manufacturers to marine electronics dealers are located here. A blessing of the fleet” and a “Miss Seafood Contest” are held here each year.
According to one fishery specialist, the recent rise in fuel prices and the increase in imports and subsequent drop in price for domestic shrimp have forced Alabama shrimp fishermen to adjust their
51

annual fishing pattern. In the past, fishing trips would be made during the off-season even though shrimp were not as abundant since the trips were still economically feasible. That is no longer the case, and many vessels remain tied to the dock during the off-season - returns can no longer cover operating costs.
In 2000, 24 processors were located in Bayou La Batre. An average of 30 employees was employed by each that year. Some 36 million pounds of seafood valued at over $123 million were produced that year. A large federally-permitted shrimp fleet is based in Bayou La Batre, and many vessels from around the region are moored here.
Dulac, Louisiana
Dulac is one of the many small towns, located on the “five fingers” south of Houma, experiencing coastal erosion and saltwater intrusion. With easy access to Timbalier Bay and the Gulf of Mexico via the Houma Navigational Canal, many Dulac residents are deeply involved in commercial fishing, and many recreational fishers from Houma and even faraway Lafayette have camps in this area. The Houma Indian Center is here and numerous Houma Indians call Dulac home. The Houma are not a federally-recognized tribe, but continue to seek tribal status.
Dulac had a year 2000 population of 2,458 persons, a decrease of 815 from 1990 (Table 11). Many residents claim fishing as their primary occupation. One informant indicated that there was little else to do in Dulac but fish. Most residents are involved in some aspect of the shrimp industry that, in turn, supports many local businesses. Several stores sell fishing supplies, gas, and ice, and there are various boat ramps here. Shrimp, crab, and oyster are the primary species for the Dulac commercial fleet, with small quantities of pelagic species taken via three active federal permits. Local processors employed an average of 31 persons in 1980, 20 in 1990, and an undisclosed number in 2000.
Dulac’s shrimp industry is reportedly in decline due to marketing challenges. Some local commercial shrimpers explain that they do not want to eliminate the foreign market, since the American market for shrimp exceeds the ability to supply it locally, but want legislation to prohibit the flooding of the market with foreign shrimp and significant loss of value to the domestic product. Informants also complain that new quality standards- requiring more rigorous use of ice- are driving up costs without due compensation. Boat builders in Dulac report a decline in sales, explaining that under current challenging conditions, fewer commercial fishermen are in the market for new boats. Informants suggest that the region’s oil industry offers some possibilities for alternative employment, and that, for instance, more of Dulac’s shipyard’s business now comes from the oil industry than the local commercial fishing fleet.
52

Table 7. Brownsville, Texas Demographics (U.S. Census Bureau, 2000)Factor 1990 2000
Total population 98,962 139,722Gender Ratio M/F (Number) 46,714/52,248 65,783/73,939
Age (Percent of total population)Under 18 years of age 36.5% 34.6%18 to 64 years of age 54.8% 55.9%65 years and over 8.7% 9.5%
Ethnicity or Race (Number)White 83,895 114,083Black or African American 193 575American Indian and Alaskan Native 140 580Asian 301 752Native Hawaiian and other Pacific Islander N/A 46Some other race 14,433 20,486Two or more races N/A 3,200Hispanic or Latino (any race) 89,206 127,535
Educational Attainment ( Population 25 and over)Percent with less than 9th grade 40.2% 31.8%Percent high school graduate or higher 45.5% 51.7%Percent with a Bachelor’s degree or higher 12.2% 13.4%
Language Spoken at Home (Population 5 years and over)Percent who speak a language other than English at home 87.3% 87.2%And Percent who speak English less than very well 47.2% 42.0%
Household income (Median $) $15,890 $24,468Poverty Status (Percent of population with income below poverty line) 43.8% 36.0%Percent female headed household 20.2% 20.9%
53

Home Ownership (Number)Owner occupied 14,681 23,361Renter occupied 11,641 14,813
Value Owner-occupied Housing (Median $) $39,000 $53,000Monthly Contract Rent (Median $) $236 $405
Employment Status (Population 16 yrs and over)Percent in the labor force 55.9% 52.4%Percent of civilian labor force unemployed 15.3% 13.0%
Occupation** (Percent in workforce) Management, professional, and related occupations N/A 27.6%Service occupations N/A 18.5%Sales and office occupations N/A 26.7%Farming, fishing, and forestry occupations 2.3% 1.0%Construction, extraction, and maintenance occupations N/A 9.4%Production, transportation, and material moving occupations N/A 16.9%
Industry** (Percent in workforce)Agriculture, forestry, fishing and hunting 2.3% 1.3 %Mining (includes the offshore oil/gas industry workforce) 0.0% 0.2%Manufacturing 14.1% 12.2%Percent government workers 21.6% 19.5%
Table 8. Port Arthur, Texas Demographics (U.S. Census Bureau, 2000)Factor 1990 2000
Total population 58,724 57,755Gender Ratio M/F (Number) 27,697/31,027 27,525/30,230
Age (Percent of total population)Under 18 years of age 28.2% 28.7%18 to 64 years of age 54.8% 55.8%65 years and over 17.0% 15.5%
Ethnicity or Race (Number)White 28,955 22,528Black or African American 24,778 25,240American Indian and Alaskan Native 147 260Asian 2,825 3,404Native Hawaiian and other Pacific Islander N/A 9Some other race 2,019 5,127Two or more races N/A 1,187Hispanic or Latino (any race) 4,829 10,081
Educational Attainment ( Population 25 and over)Percent with less than 9th grade 16.6% 14.4%Percent high school graduate or higher 65.5% 69.7%Percent with a Bachelor’s degree or higher 10.0% 9.3%
Language Spoken at Home (Population 5 years and over)Percent who speak a language other than English at home 15.6% 23.2%And Percent who speak English less than very well 7.2% 12.7%
Household income (Median $) $18,548 $26,455Poverty Status (Percent of population with income below poverty line) 28.1% 25.2%
54

Percent female headed household 17.2% 19.7%Home Ownership (Number)
Owner occupied 14,515 13,578Renter occupied 7,811 8,261
Value Owner-occupied Housing (Median $) $30,400 $35,900Monthly Contract Rent (Median $) $226 $405
Employment Status (Population 16 yrs and over)Percent in the labor force 54.3% 52.8%Percent of civilian labor force unemployed 6.9% 7.0%
Occupation** (Percent in workforce) Management, professional, and related occupations N/A 20.8%Service occupations N/A 23.2%Sales and office occupations N/A 23.8%Farming, fishing, and forestry occupations 2.0% 1.1%Construction, extraction, and maintenance occupations N/A 12.2%Production, transportation, and material moving occupations N/A 18.8%
Industry** (Percent in workforce)Agriculture, forestry, fishing and hunting 2.1% 1.3%Mining (includes the offshore oil/gas industry workforce) 0.7% 1.6%Manufacturing 17.6% 13.1%Percent government workers 13.4% 17.0%
Table 9. Palacios, Texas Demographics (U.S. Census Bureau, 2000) Factor 1990 2000
Total population 3,904 4,207Gender Ratio M/F (Number) 1,948/1956 2,111/2,096
Age (Percent of total population)Under 18 years of age 35.1% 34.8%18 to 64 years of age 51.9% 60.7%65 years and over 13.0% 4.5%
Ethnicity or Race (Number)White 2,708 2,475Black or African American 252 214American Indian and Alaskan Native 4 33Asian 257 289Native Hawaiian and other Pacific Islander N/A 0Some other race 683 1,064Two or more races N/A 132Hispanic or Latino (any race) 1,836 2,342
Educational Attainment ( Population 25 and over)Percent with less than 9th grade 23.0% 26.3%Percent high school graduate or higher 40.9% 55.9%Percent with a Bachelor’s degree or higher 11.8% 12.5%
Language Spoken at Home (Population 5 years and over)Percent who speak a language other than English at home 43.6% 43.5%And Percent who speak English less than very well 14.5% 19.1%
Household income (Median $) $25,833 $28,350
55

Poverty Status (Percent of population with income below poverty line) 32.9% 23.2%Percent female headed household 14.8% 13.9%
Home Ownership (Number)Owner occupied 848 948Renter occupied 403 438
Value Owner-occupied Housing (Median $) $40,700 $43,750Monthly Contract Rent (Median $) $231 $289
Employment Status (Population 16 yrs and over)Percent in the labor force 58.7% 51.2%Percent of civilian labor force unemployed 13.0% 9.5%
Occupation** (Percent in workforce) Management, professional, and related occupations N/A 22.6%Service occupations N/A 11.5%Sales and office occupations N/A 24.3%Farming, fishing, and forestry occupations 9.0% 9.1%Construction, extraction, and maintenance occupations N/A 8.5%Production, transportation, and material moving occupations N/A 16.6%
Industry** (Percent in workforce)Agriculture, forestry, fishing and hunting 10.2% 12.2%Mining (includes the offshore oil/gas industry workforce) 0.0% 0.4%Manufacturing 10.4% 12.6%Percent government workers 20.1% 19.8%
Table 10. Bayou La Batre, Alabama Demographics (U.S. Census Bureau, 2000)Factor 1990 2000
Total population 2,456 2,313Gender Ratio M/F (Number) 1,201/1,255 1,159/1,154
Age (Percent of total population)Under 18 years of age 34.3% 29.9%18 to 64 years of age 54.7% 59.0%65 years and over 11.0% 11.2%
Ethnicity or Race (Number)White 1,605 1,213Black or African American 250 237American Indian and Alaskan Native 3 6Asian 595 770Native Hawaiian and other Pacific Islander N/A 10Some other race 3 22Two or more races N/A 55Hispanic or Latino (any race) 67 44
Educational Attainment ( Population 25 and over)Percent with less than 9th grade 30.0% 24.0%Percent high school graduate or higher 45.2% 54.9%Percent with a Bachelor’s degree or higher 6.0% 7.4%
Language Spoken at Home (Population 5 years and over)Percent who speak a language other than English at home 26.3% 29.1%And Percent who speak English less than very well 18.0% 15.8%
56
Household income (Median $) $15,775 $24,539Poverty Status (Percent of population with income below poverty line) 36.1% 28.2%Percent female headed household 15.6% 17.6% Home Ownership (Number)
Owner occupied 537 501Renter occupied 234 268
Value Owner-occupied Housing (Median $) $35,200 $45,800Monthly Contract Rent (Median $) $164 $366
Employment Status (Population 16 yrs and over)Percent in the labor force 54.2% 53.7%Percent of civilian labor force unemployed 9.7% 11.1%
Occupation** (Percent in workforce)Management, professional, and related occupations N/A 14.1%Service occupations N/A 18.3%Sales and office occupations N/A 20.7%Farming, fishing, and forestry occupations 8.6% 5.2%Construction, extraction, and maintenance occupations N/A 10.8%Production, transportation, and material moving occupations N/A 30.9%
Industry** (Percent in workforce)Agriculture, forestry, fishing and hunting 11.1% 4.4%Mining (includes the offshore oil/gas industry workforce) 1.3% 0.8%Manufacturing 23.4% 21.9%Percent government workers 9.0% 7.7%
Table 11. Dulac, Louisiana Demographics (U.S. Census Bureau, 2000)Factor 1990 2000
Total population 3,273 2,458Gender Ratio M/F (Number) 1,620/1,653 1,229/1,229
Age (Percent of total population)Under 18 years of age 36.9 31.418 to 64 years of age 56.0 58.765 years and over 7.1 9.8
Ethnicity or Race (Number)White 1,603 1,327Black or African American 77 61American Indian and Alaskan Native 1,568 969Asian 14 12Native Hawaiian and other Pacific Islander N/A 0Some other race 11 12Two or more races N/A 77Hispanic or Latino (any race) 66 42
Educational Attainment ( Population 25 and over)Percent with less than 9th grade 55.5 38.1Percent high school graduate or higher 27.1 39.9Percent with a Bachelor’s degree or higher 1.9 3.9
Language Spoken at Home (Population 5 years and over)Percent who speak a language other than English at home 50.0 37.4
57
And Percent who speak English less than very well 14.5 10.8Household income (Median $) 12,653 22,900Poverty Status (Percent of population with income below poverty line) 49.3 30.9Percent female headed household 14.9 14.2
Home Ownership (Number)Owner occupied 729 609Renter occupied 181 159
Value Owner-occupied Housing (Median $) 28,700 54,700Monthly Contract Rent (Median $) 179 407
Employment Status (Population 16 yrs and over)Percent in the labor force 45.8 44.9Percent of civilian labor force unemployed 8.0 6.7
Occupation** (Percent in workforce)Management, professional, and related occupations N/A 12.4Service occupations N/A 12.7Sales and office occupations N/A 17.7Farming, fishing, and forestry occupations 17.1 15.9Construction, extraction, and maintenance occupations N/A 12.0Production, transportation, and material moving occupations N/A 29.4
Industry** (Percent in workforce)Agriculture, forestry, fishing and hunting 19.6 19.7Mining (includes the offshore oil/gas industry workforce) 4.0 6.1Manufacturing 14.0 10.0Percent government workers 9.0 6.0
3.2 Direct and Indirect Effects on the Social Environment
Contrary to the economic analysis, the analysis of impacts on the social environment focus on community level impacts as well as less quantifiable impacts that are reflected by how potentially impacted individuals feel about the proposed action and its impacts on them (i.e. attitudes and perceptions). As noted in the RIR, direct and indirect impacts to the social environment are particularly dependent on the ability of harvesters to shift to different BRDs, and to do so in a relatively seamless manner. To reiterate the findings in the RIR, if vessel owners have sufficient time to switch to either the Extended Funnel BRD or the Modified Jones-Davis BRD, direct and indirect adverse impacts to most communities associated with the Gulf shrimp industry would likely be minimal. However, this general finding must be qualified since particular vessels were shown to be adversely affected even under these scenarios. Specifically, large vessels forced to shift away from using the Gulf Fisheye BRD would face the most significant impacts. Should any communities be disproportionately served by these 411 vessels, they would similarly incur a disproportionate share of the adverse impacts that would take place. Unfortunately, since it is not possible to identify these specific vessels, it is also not possible to make a definitive determination of whether any particular communities would be disproportionately impacted or which communities they might be.
On the other hand, if vessel owners have insufficient time to switch to different BRDs and must instead simply change the placement of their Fisheye BRDs, significant impacts would very likely accrue to at least some communities. Because of the data limitations noted above, it cannot be known with certainty which communities would face the greatest impacts. However, it is logical to conclude that communities with the strongest relationships to the Gulf shrimp industry would be
58

most likely to face the most adverse impacts, particularly those communities that are highly ranked with respect to Gulf shrimp landings and revenues and the number of active qualifying vessels supplying shrimp to that community. On this basis, it is assumed that the following communities would be the most adversely impacted under this scenario: Port Arthur, Palacios, and Brownsville, Texas; Bayou La Batre, Alabama; and Dulac, Louisiana.
Again, the exact distribution of these impacts across communities cannot be known with a relatively high degree of certainty. However, if the distribution of the impacts closely approximates the distribution of Gulf shrimp revenues across communities, then it is likely that the five aforementioned communities would experience direct losses of between $1 million in Bayou La Batre, Alabama and $1.55 million in Port Arthur, Texas. With direct impacts of this magnitude, additional indirect and induced impacts would undoubtedly result as these losses in output and income spread to a variety of related sectors and industries within these communities. As previously noted, with the exception of Brownsville, these other communities were determined to be some of the most socio-economically disadvantaged communities in the region, and thus highly vulnerable to any additional adverse economic impacts. All of these communities were also determined to be primarily involved with and thus relatively dependent on the fishing industry. As a result, the impacts on these communities are even more significant, relatively speaking, than if they took place in other communities with a stronger socio-economic base or are less dependent on the fishing industry.
In addition to these types of impacts, less quantifiable impacts must also be considered. Specifically, from the perspective of industry participants, the proposed action would be yet another regulatory change and burden in a relatively long list of regulatory changes imposed on this industry at both the federal and state levels. In recent years, the industry has been forced to accept changes in the TED requirements, a federal permit requirement, additional closures in Texas’ state waters, mandatory electronic logbooks, mandatory observers, additional data reporting requirements, new state trip ticket programs, and potentially even more time/area closures as a result of a new Council Amendment to the Gulf Shrimp FMP (Amendment 14). Given the fact that the industry has been besieged by adverse economic conditions for the past five years as a result of, among other factors, higher fuel prices and cost and greater competition from imports which has led to considerably lower shrimp prices, the proposed action would only add to the ever-increasing complex, burdensome, and ever-changing economic and regulatory environment faced by this industry. Many people and businesses that have been involved in the industry for years, if not decades, have already been forced to leave the industry as a result of these forces. Another change like the proposed action would undoubtedly be considered akin to kicking a man when he is already down, particularly since many participants were also significantly affected by hurricanes Katrina and Rita in 2005, and would therefore be highly resented by industry participants.
And in this case, the level of resentment would be even greater because of the rationale for the proposed action. Specifically, industry participants are well aware that the proposed action is largely motivated by a desire to decrease the bycatch of juvenile red snapper and thereby increase the size of the red snapper stock, which has been determined to be overfished. From the perspective of Gulf shrimp industry participants, they believe they have already contributed more than their fair share in aiding the recovery of red snapper via the significant reduction in the size of the Gulf shrimp fleet and the concomitant significant reduction in shrimp trawl effort that has occurred in
59

recent years. From their perspective, the directed red snapper fishery needs to assume more of a burden in achieving recovery of the red snapper stock.
60

REFERENCES
Funk, R. D. 1998. Economic impacts of license limitation and buyback on the Texas Bay shrimp fishery. Ph. D. Dissertation, Department of Agricultural Economics, Texas A&M University, College Station, Texas, December 1998. 97 pp.
GMFMC. 1981. Fishery Management Plan for the Shrimp Fishery of the Gulf, United States Waters. Gulf Fishery Management Council, 3018 U.S. Highway 301 N., Suite 1000, Tampa, FL 33619.
GMFMC. 1997. Amendment 9 to the Fishery Management Plan for the Shrimp Fishery of the Gulf, Including a Final Supplemental Environmental Impact Statement and Regulatory Impact Review and Social Impact Assessment. Gulf Fishery Management Council, 3018 U.S. Highway 301 North, Suite 1000, Tampa, FL 33619, 153 p.
GMFMC. 2001. Amendment 11 to the Fishery Management Plan for the Shrimp Fishery of the Gulf, U.S. Waters with Environmental Assessment, Regulatory Impact Review, Initial Regulatory Flexibility Analysis and Social Impact Assessment. Gulf Fishery Management Council, 3018 U.S. Highway 301 North, Suite 1000, Tampa, FL 33619, 41 p. + appendix.
GMFMC. 2003. Amendment 10 to the Fishery Management Plan for the Shrimp Fishery of the Gulf, U.S. Waters with Environmental Assessment, Regulatory Impact Review, Initial Regulatory Flexibility Analysis and Social Impact Assessment. Gulf Fishery Management Council, 3018 U.S. Highway 301 North, Suite 1000, Tampa, FL 33619, 128 pp + appendices.
GMFMC. 2004. Final Amendment 22 to the Reef Fish Fishery Management Plan to set red snapper Sustainable Fisheries Act targets and thresholds, set a rebuilding plan, and establish bycatch reporting methodologies for the reef fish fishery. Gulf Fishery Management Council, 3018 U.S. Highway 301 North, Suite 1000, Tampa, Florida 33619-2266. 221 pp.
GMFMC. 2005. Final Amendment 13 to the Fishery Management Plan for the Shrimp Fishery of the Gulf with Environmental Assessment, Regulatory Impact Review and Regulatory Flexibility Act Analysis. Gulf Fishery Management Council, 2203 N. Lois Ave, Tampa, Florida 33607 217 pp + appendices
Haby, M. G., R. J. Miget, L. L Falconer, and G. L. Graham. 2003. A review of current conditions in the Texas shrimp industry, an examination of contributing factors, and suggestions for remaining competitive in the global shrimp market. Texas Cooperative Extension Sea Grant College Program, TAMU_SG_03_701, January 2003, 26 pp.
Harrington, D. Personal communication. University of Georgia. Athens, Georgia (deceased).
Idyll, C.P. 1963. The Shrimp Fishery. Pages 160-182. In: M.E. Stansby (editor), Industrial Fishery Technology. Reinhold Publishing Co., New York. 393 pp.
61
Impact Assessment Inc. 2005 a. Identifying Fishing Communities Associated with the Fishing Industry along the Florida Gulf Coast. Prepared for the U.S. Department of Commerce, NMFS, Southeast Regional Office, 9721 Executive Center Drive, St. Petersburg, Florida 33702. (Volumes 1-3). Contract number WC133F-03-SE-0603.
Impact Assessment Inc. 2005b. Identifying Communities Associated with the Fishing Industry in Louisiana. Prepared for the U.S. Department of Commerce, NMFS, Southeast Regional Office, 9721 Executive Center Drive, St. Petersburg, Florida 33702. (Volumes 1-3) Contract number WC133F-03-SE-0603
Impact Assessment Inc. 2005c. Identifying Fishing Communities Associated with the Fishing Industry in Alabama and Mississippi. Prepared for the U.S. Department of Commerce, NMFS, Southeast Regional Office, 9721 Executive Center Drive, St. Petersburg, Florida 33702, Contract number WC133F-03-SE-0603
Impact Assessment Inc. 2005d . Identifying Fishing Communities Associated with the Fishing Industry in Texas. Prepared for the U.S. Department of Commerce, NMFS, Southeast Regional Office, 9721 Executive Center Drive, St. Petersburg, Florida 33702. Contract number WC133F-03-SE-0603.
Impact Assessment Inc. 2007. Preliminary Assessment of the Impacts of Hurricane Katrina on Gulf of Mexico Coastal Fishing Communities. Prepared for the U.S. Department of Commerce, NMFS, Southeast Regional Office, 263 13th Ave. South, St. Petersburg, Florida 33701. Contract number WC 133F-06-CN-0003.
Ingles, P. 2006. Personal communication. NMFS, Southeast Regional Office, 263 13th Avenue South, St. Petersburg, Florida 33702.
Keithly, W. R., D. Hamady, R. F. Kazmierczak, and M. D. Travis. 2006. The Impacts of Imports, Particularly Farm-Raised Product, on the Southeast U.S. Shrimp Processing Sector. Report to the Gulf and South Atlantic Fisheries Foundation. 50 pp.
Keithly, W. R., D. Hamady, R. F. Kazmierczak, and M. D. Travis. 2005. An economic analysis of the Southeast U.S. shrimp processing industry, responses to an increasing import base. In: Reconciling Fisheries with Conservation: The Challenge of Managing Aquatic Ecosystems. In press.
Klima, E.F., and R.S. Ford. 1970. Gear and Techniques in the Gulf Shrimp Fishery. Conference on the Canadian Shrimp Fishery. 26 pp.
Nance, J., W. Keithly, Jr., C. Caillouet, Jr., J. Cole, W. Gaidry, B. Gallaway, W. Griffin, R. Hart, and M. Travis. 2006. Estimation of effort, Maximum Sustainable Yield, and Maximum Economic Yield in the shrimp fishery of the Gulf of Mexico. Report of the Ad Hoc Shrimp Effort Working Group to the Gulf of Mexico Fishery Management Council, 85 pp.
62
NMFS. 2002a. Endangered Species Act section 7 consultation on shrimp trawling in the southeastern United States, under the sea turtle conservation regulations an as managed by the fishery management plans for shrimp in the South Atlantic and Gulf. Biological Opinion. December 2, 2002. 95 pp.
NMFS. 2002b. Regulatory Impact Review and Regulatory Flexibility Act Analysis for Making Technical Changes to TEDs to Enhance Turtle Protection in the Southeastern United States Under Sea Turtle Conservation Regulations. National Marine Fisheries Service, 9721 Executive Center Drive North, St. Petersburg, FL 33702. 55 pp.
NMFS. 2003. Supplemental economic analysis for Amendment 10 to the Fishery Management Plan for the Shrimp Fishery of the Gulf, U.S. Waters. National Marine Fisheries Service, Southeast Regional Office, 263 13th Avenue, South, St. Petersburg, Florida 33701. 28 pp.
NMFS. 2006. Endangered Species Act section 7 consultation on the continued authorization of shrimp trawling as managed under the Fishery Management Plan (FMP) for the shrimp fishery of the Gulf (effects on smalltooth sawfish). Biological Opinion. January 13, 2006. 23 pp.
Travis, M. D. and W. L. Griffin. 2003. Economic analysis of the Texas Closure for 2003. Presentation to the Gulf Fishery Management Council, January 13, 2003.
Travis, M. D. and W. L. Griffin. 2004. Update on the economic status of the Gulf commercial shrimp fishery. SERO-ECON-04-01. NMFS, Southeast Regional Office, 9721 Executive Center Drive, North, St. Petersburg, Florida 33702. 10 pp.
Ward, J. M., T. Ozuna, and W. Griffin. 1995. Cost and revenues in the Gulf shrimp fishery. NOAA Technical Memorandum NMFS_SEFSC_371. National Marine Fisheries Service, Southeast Fisheries Science Center, 75 Virginia Beach Drive, Miami, Florida 33149. 76 pp.
63
Table 12. Distribution of Food Shrimp Landings and Revenues for Unknown and Known Vessels (Including Inactive Qualifiers) by Known Vessel Size Category, 2005.
Landings (millions of
pounds, tails)
Revenues (millions)
Number of vessels
Mean landings per
vessel
Mean revenue per
vessel
Unknown 7.07 $15.04 N/A N/A N/A
Known 127.49 $332.30 6,182 20,623 $53,754
Large 87.62 $261.24 2,034 43,078 $128,437
Small 39.87 $71.06 4,138 9,635 $17,173
Total 134.56 $347.34 N/A N/A N/A
Table 13. Distribution of Food Shrimp Landings and Revenues for Qualifying (Including Inactive Qualifiers) and Non-Qualifying Vessels by Vessel Size Category, 2005.
Landings (millions of
pounds, tails)
Revenues (millions)
Number of vessels
Mean landings per
vessel
Mean revenue per
vessel
Qualifying 93.41 $269.25 2,666 37,509 $100,994
Large 84.10 $252.02 1,934 43,485 $130,310
Small 9.31 $17.23 732 12,719 $23,538
Non-Qualifying
34.08 $63.05 3,516 9,690 $17,932
Large 3.52 $9.22 123 28,618 $74,959
Small 30.56 $53.83 3,393 9,007 $15,865
Total Known 127.49 $332.30 6,182 20,623 $53,754
64

Table 14. Distribution of Food Shrimp Landings and Revenues for Known Active Vessels by Vessel Size Category, 2005.
Landings (millions of
pounds, tails)
Revenues (millions)
Number of vessels
Mean landings per
vessel
Mean revenue per
vessel
Known 127.49 $332.30 5,322 23,955 $62,439
Large 87.62 $261.24 1,553 56,420 $168,216
Small 39.87 $71.06 3,769 10,578 $18,854
Table 15. Distribution of Food Shrimp Landings and Revenues for Qualifying Active Vessels by Vessel Size Category, 2005.
Landings (millions of
pounds, tails)
Revenues (millions)
Number of vessels
Mean landings per
vessel
Mean revenue per
vessel
Qualifying 93.41 $269.25 1,806 51,722 $149,086
Large 84.10 $252.02 1,430 58,811 $176,238
Small 9.31 $17.23 376 24,760 $45,824
65

Table 16. Distribution of Revenues and Selected Statistics for All Qualifying (Including Inactive) Vessels, 2005.
Gulf Food Shrimp
Landings
Gulf Food Shrimp
Revenues
Gulf Bait Shrimp
Revenues
S. Atlantic Shrimp
Revenues
East Coast Non-Shrimp
Revenues
Gulf Non-Shrimp
Revenues
Total Shrimp Revenues
Total Revenues
Percentage of Revenue from Gulf
Food ShrimpNumber of vessels 2,666 2,666 2,666 2,666 2,666 2,666 2,666 2,666 2,666Minimum 0 $0 $0 $0 $0 $0 $0 $0 0Maximum 306,389 $757,104 $129,600 $498,711 $1,889,660 $410,589 $757,104 $1,889,660 100Total 93,409,641 $269,256,689 $2,306,245 $8,209,486 $25,233,396 $4,493,347 $279,772,420 $309,499,163 N/AMean 35,037 $100,997 $865 $3,079 $9,465 $1,685 $104,941 $116,091 66.4Standard Dev 42,713 $126,593 $8,188 $24,857 $91,226 $17,487 $126,493 $149,995 46.8
66

Table 17. Physical Characteristics and Selected Statistics for All Qualifying (Including Inactive) Vessels.19
Crew Size Number of Nets
Net Size (feet)
Vessel Age
Length (feet)
Horsepower Fuel Capacity (gallons)
Gross Tons Hold Capacity
(tons)Number of vessels 1,955 1,934 1,933 2,663 2,666 2,666 2,664 2,464 1,421Minimum 1 1 8 3 11 8 10 5 0.25Maximum 7 4 87 106 131 3,412 80,000 770 240Total 6,405.1 6,700.8 96,940.3 57,949.0 174,989.5 1,277,733.0 30,484,267.0 253,898.0 24,293.1Mean 3.3 3.5 50.2 21.8 65.6 479.3 11,443.0 103.0 17.1Standard Dev 0.8 0.9 18.3 11.8 16.3 257.4 10,142.1 49.2 15.6
Table 18. Distribution of Additional Physical Characteristics for All Qualifying (Including Inactive) Vessels.
Hull Type Percent Refrigeration Percent Gear Percent
Steel 68.8 Freezer 49.2 Otter Trawl 99.2
Fiberglass 15.2 Ice 49.2 Skimmer Net 0.3
Wood 14.9 Live Well 1.6 Other 0.5
Other 1.1Table 19. Distribution of Revenues and Selected Statistics for Active Qualifying Vessels, 2005.
19 ?The 2004 Vessel Operating Units File (VOUF) was the source of data for hull type, crew size, number of nets, and net size. The Gulf Shrimp Permits database is the source of data for all other characteristics. Characteristics data was not available for every qualifying vessel for a variety of reasons. For example, a vessel may not have been found in the VOUF (which only tracks active Coast Guard documented vessels), the data may not have been provided by the permit owner, or the data is not applicable to particular vessels, as is the case with state registered boats and tonnage.
67

Gulf Food Shrimp
Landings
Gulf Food Shrimp
Revenues
Gulf Bait Shrimp
Revenues
S. Atlantic Shrimp
Revenues
East Coast Non-Shrimp
Revenues
Gulf Non-Shrimp
Revenues
Total Shrimp Revenues
Total Revenues
Percentage of Revenue from Gulf
Food ShrimpNumber of vessels 1,806 1,806 1,806 1,806 1,806 1,806 1,806 1,806 1,806Minimum 38 $103 $0 $0 $0 $0 $103 $103 .2Maximum 306,389 $757,104 $11,370 $405,198 $570,725 $190,643 $757,104 $757,104 100Total 93,409,641 $269,256,689 $14,625 $1,906,863 $2,392,107 $1,284,446 $271,178,177 $274,854,730 N/AMean 51,722 $149,090 $8 $1,056 $1,325 $711 $150,154 $152,190 98.0Standard Dev 42,781 $128,403 $271 $15,045 $21,263 $7,084 $128,572 $129,082 11.3
Table 20. Physical Characteristics and Selected Statistics for Active Qualifying Vessels.
Crew Size Number of Nets
Net Size (feet)
Vessel Age
Length (feet)
Horsepower Fuel Capacity (gallons)
Gross Tons Hold Capacity
(tons)Number of vessels 1,598 1,597 1,597 1,806 1,806 1,806 1,804 1,728 970Minimum 1 1 8 3 18 8 55 6 0.5Maximum 7 4 87 106 130.6 3,412 80,000 770 240Total 5,291.7 5,602.8 82,117.7 37,214.0 124,032.0 920,537.0 23,369,162.0 187,999.0 17,122.7Mean 3.3 3.5 51.4 20.6 68.7 509.7 12,954.1 108.8 17.7Standard Dev 0.8 0.9 17.7 11.7 14.2 277.3 10,331.8 47.7 15.9Table 21. Distribution of Additional Physical Characteristics for Active Qualifying Vessels.
68

Hull Type Percent Refrigeration Percent Gear Percent
Steel 77.2 Freezer 55.0 Otter Trawl 99.3
Wood 11.5 Ice 44.9 Skimmer Net 0.4
Fiberglass 10.6 Live Well .1 Other 0.3
Other .7
Table 22. Distribution of Revenues and Selected Statistics for Large Qualifying (Including Inactive) Vessels, 2005.
Gulf Food Shrimp
Landings
Gulf Food Shrimp
Revenues
Gulf Bait Shrimp
Revenues
S. Atlantic Shrimp
Revenues
East Coast Non-Shrimp
Revenues
Gulf Non-Shrimp
Revenues
Total Shrimp Revenues
Total Revenues
Percentage of Revenue from Gulf
Food Shrimp
Number of Vessels 1,934 1,934 1,934 1,934 1,934 1,934 1,934 1,934 1,934Minimum 0 $0 $0 $0 $0 $0 $0 $0 0Maximum 306,389 $757,104 $0 $498,711 $1,889,660 $410,589 $757,104 $1,889,660 100Total 84,095,709 $252,028,154 $0 $7,893,302 $25,214,107 $2,073,756 $259,921,456 $287,209,319 N/AMean 43,483 $130,314 $0 $4,081 $13,037 $1,072 $134,396 $148,505 73.0Standard Dev 45,393 $135,457 $0 $28,936 $106,897 $16,113 $135,082 $162,535 44.1
69

Table 23. Physical Characteristics and Selected Statistics for Large Qualifying (Including Inactive) Vessels.
Crew Size Number of Nets
Net Size (feet)
Vessel Age
Length Horsepower Fuel Capacity (gallons)
Gross Tons Hold Capacity
(tons)Number of vessels 1,565 1,559 1,559 1,931 1,934 1,934 1,932 1,934 1,066Minimum 1 1 8 3 60 8 1000 32 0.5Maximum 7 4 87 55 131 3,412 80,000 770 240Total 5,493.8 5,840.6 88,185.8 38,749.0 143,174.3 1,056,819.0 29,358,873.0 235,183.0 21583.7Mean 3.5 3.7 56.6 20.1 74.0 546.4 15,196.1 121.6 20.2Standard Dev 0.6 0.6 12.7 11.1 8.4 259.1 9,458.6 36.9 16.4
Table 24. Distribution of Additional Physical Characteristics for Large Qualifying (Including Inactive) Vessels.
Hull Type Percent Refrigeration Percent Gear Percent
Steel 82.9 Freezer 65.1 Otter Trawl 99.7
Wood 9.9 Ice 34.9 Other 0.3
Fiberglass 7.0
Other 0.2
70
Table 25. Distribution of Revenues and Selected Statistics for Large Qualifying Active Vessels, 2005.
Gulf Food Shrimp
Landings
Gulf Food Shrimp
Revenues
Gulf Bait Shrimp
Revenues
S. Atlantic Shrimp
Revenues
East Coast Non-Shrimp
Revenues
Gulf Non-Shrimp
Revenues
Total Shrimp Revenues
Total Revenues
Percentage of Revenue from Gulf
Food Shrimp
Number of Vessels 1,430 1,430 1,430 1,430 1,430 1,430 1,430 1,430 1,430Minimum 177 $574 $0 $0 $0 $0 $574 $574 .2Maximum 306,389 $757,104 $0 $405,198 $570,725 $190,643 $757,104 $757,104 100Total 84,095,709 $252,028,154 $0 $1,906,863 $2,392,107 $536,348 $253,935,017 $256,863,472 N/AMean 58,808 $176,243 $0 $1,333 $1,673 $375 $177,577 $179,625 98.7Standard Dev 43,421 $129,304 $0 $16,898 $23,885 $5,560 $129,247 $129,790 9.7
Table 26. Physical Characteristics and Selected Statistics for Large Qualifying Active Vessels.
Crew Size Number of Nets
Net Size (feet)
Vessel Age
Length Horsepower Fuel Capacity (gallons)
Gross Tons Hold Capacity
(tons)Number of vessels 1,330 1,330 1,330 1,430 1,430 1,430 1,428 1,430 771Minimum 1 1 8 3 60 8 1000 40 0.5Maximum 7 4 87 55 131 3412 80000 770 240Total 4,674.4 5,005.6 75,815.0 27,446.0 106,491.6 799,295.0 22,632,394.0 176,592.0 15,425.4Mean 3.5 3.8 57.0 19.2 74.5 558.9 15,849.0 123.5 20.0Standard Dev 0.6 0.6 12.4 10.8 8.5 280.6 9,688.3 38.1 16.6
71

Table 27. Distribution of Additional Physical Characteristics for Large Qualifying Active Vessels.
Hull Type Percent Refrigeration Percent Gear Percent
Steel 86.0 Freezer 67.8 Otter Trawl 99.7
Wood 7.0 Ice 32.2 Other 0.3
Fiberglass 6.9
Other 0.1
Table 28. Distribution of Revenues and Selected Statistics for Small Qualifying (Including Inactive) Vessels, 2005.
Gulf Food Shrimp
Landings
Gulf Food Shrimp
Revenues
Gulf Bait Shrimp
Revenues
S. Atlantic Shrimp
Revenues
East Coast Non-Shrimp
Revenues
Gulf Non-Shrimp
Revenues
Total Shrimp Revenues
Total Revenues
Percentage of Revenue from Gulf
Food Shrimp
Number of vessels 732 732 732 732 732 732 732 732 732Minimum 0 $0 $0 $0 $0 $0 $0 $0 0Maximum 196,942 $300,383 $129,600 $97,668 $12,883 $312,616 $300,383 $312,616 100Total 9,313,932 $17,228,535 $2,306,245 $316,184 $19,289 $2,419,591 $19,850,964 $22,289,845 N/AMean 12,724 $23,536 $3,151 $432 $26 $3,305 $27,119 $30,451 49.0Standard Dev 22,697 $40,293 $15,402 $5,366 $512 $20,608 $41,485 $45,188 49.1
72

Table 29. Physical Characteristics and Selected Statistics for Small Qualifying (Including Inactive) Vessels.
Crew Size
Number of Nets
Net Size (feet)
Vessel Age
Length Horsepower Fuel Capacity (gallons)
Gross Tons
Hold Capacity
(tons)Number of vessels 390 375 374 732 732 732 732 530 355Minimum 1 1 8 3 11 10 10 5 0.25Maximum 6 4 80 106 59 1,271 15,000 330 50Total 911.3 860.2 8,754.5 19,200.0 31,815.2 220,914.0 1,125,394.0 18,715.0 2709.4Mean 2.3 2.3 23.4 26.2 43.5 301.8 1,537.4 35.3 7.6Standard Dev 0.6 0.8 13.2 12.7 10.2 143.3 1,707.4 21.0 6.7
Table 30. Distribution of Additional Physical Characteristics for Small Qualifying (Including Inactive) Vessels.
Hull Type Percent Refrigeration Percent Gear Percent
Fiberglass 36.9 Ice 86.9 Otter Trawl 98.0
Steel 31.6 Freezer 7.1 Skimmer Net 1.0
Wood 28.0 Live Well 6.0 Other 1.0
Other 3.5
73

Table 31. Distribution of Revenues and Selected Statistics for Small Qualifying Active Vessels, 2005.
Gulf Food Shrimp
Landings
Gulf Food Shrimp
Revenues
Gulf Bait Shrimp
Revenues
S. Atlantic Shrimp
Revenues
East Coast Non-Shrimp
Revenues
Gulf Non-Shrimp
Revenues
Total Shrimp Revenues
Total Revenues
Percentage of Revenue from Gulf
Food Shrimp
Number of vessels 376 376 376 376 376 376 376 376 376Minimum 38 $103 $0 $0 $0 $0 $103 $103 1.1Maximum 196,942 $300,383 $11,370 $0 $0 $181,937 $300,383 $300,942 100Total 9,313,932 $17,228,535 $14,625 $0 $0 $748,099 $17,243,160 $17,991,259 N/AMean 24,771 $45,821 $39 $0 $0 $1,990 $45,859 $47,849 95.5Standard Dev 26,552 $46,272 $594 $0 $0 $11,030 $46,238 $47,144 15.9
Table 32. Physical Characteristics and Selected Statistics for Small Qualifying Active Vessels.
Crew Size
Number of Nets
Net Size (feet)
Vessel Age
Length Horsepower Fuel Capacity (gallons)
Gross Tons
Hold Capacity
(tons)Number of vessels 268 267 267 376 376 376 376 298 199Minimum 1 1 8 3 18 55 55 6 0.5Maximum 4 4 80 106 59 1,271 10,000 130 50Total 617.3 597.2 6,302.7 9,768.0 17,540.4 121,242.0 736,768.0 11,407.0 1,697.4Mean 2.3 2.2 23.6 26.0 46.7 322.5 1,959.5 38.3 8.5Standard Dev 0.5 0.7 13.7 13.5 8.8 159.8 1,715.4 15.7 7.1
74

Table 33. Distribution of Additional Physical Characteristics for Small Qualifying Active Vessels.
Hull Type Percent Refrigeration Percent Gear Percent
Steel 43.9 Ice 93.4 Otter Trawl 97.6
Wood 28.2 Freezer 6.4 Skimmer Net 1.9
Fiberglass 24.7 Live Well .3 Other .5
Other 3.2
Table 34. Selected Statistics for Gulf Food Shrimp Dealers in 2005.
Gulf Food Shrimp
Landings
Gulf Food Shrimp Sales
Number of dealers 609 60820
Minimum 1 $4Maximum 7,402,272 $26,274,180
Total 134,557,315 $347,344,190Mean 220,948 $571,290
Standard Dev 595,791 $1,756,763
Table 35. Employment, Production and Value in the Gulf Shrimp Processing Sector, 2005.
Number of Employees
Total Pounds
Total Product Value
Shrimp Pounds
Value of Shrimp
Shrimp As Percent of
Total Product Value
Number of Processors 60 60 60 60 60 60Minimum 2 766 $5,362 125 $756 0.3Maximum 353 32,420,000 $82,795,705 32,420,000 $64,471,208 100Total 3,381 219,428,486 $600,199,583 202,240,611 $548,060,139 N/AMean 56 3,657,141 $10,003,326 3,370,677 $9,134,336 88.6Standard Dev 76 5,688,090 $13,950,347 5,387,083 $12,245,836 26.7
20 One dealer reported its purchases of Gulf food shrimp landings, but did not report the sales value.75

Table 36. Number of Primary Permit Owners, Active Permits, Inactive Permits, and Percent of Permits Inactive by Community, 2005.
CITY STATE
Number of Permit Owners
Number of Active Permits
Inactive Permits
Percent of Permits Inactive
PORT ISABEL TX 141 111 30 21.3BROWNSVILLE TX 139 105 34 24.5PALACIOS TX 91 68 23 25.3PORT ARTHUR TX 86 55 31 36.0BILOXI MS 73 60 13 17.8CUT OFF LA 73 57 16 21.9BAYOU LA BATRE AL 65 33 32 49.2FREEPORT TX 64 46 18 28.1PORT LAVACA TX 60 53 7 11.7FORT MYERS BCH FL 57 49 8 14.0CHAUVIN LA 54 42 12 22.2ARANSAS PASS TX 45 28 17 37.8NEW ORLEANS LA 45 34 11 24.4ABBEVILLE LA 44 35 9 20.5HOUMA LA 39 31 8 20.5OCEAN SPRINGS MS 38 30 8 21.1IRVINGTON AL 36 25 11 30.6HOUSTON TX 33 25 8 24.2PENSACOLA FL 32 20 12 37.5PANAMA CITY FL 31 17 14 45.2GRAND ISLE LA 26 24 2 7.7LAFAYETTE LA 25 22 3 12.0NEDERLAND TX 25 22 3 12.0GALLIANO LA 24 21 3 12.5CODEN AL 23 13 10 43.5D'IBERVILLE MS 23 17 6 26.1HARVEY LA 23 21 2 8.7HUDSON FL 23 0 23 100.0TAMPA FL 23 18 5 21.7DULAC LA 22 18 4 18.2GALVESTON TX 22 12 10 45.5KEY WEST FL 22 17 5 22.7PASS CHRISTIAN MS 22 15 7 31.8CAMERON LA 21 16 5 23.8FORT MYERS FL 18 13 5 27.8MOBILE AL 18 11 7 38.9SPRING HILL FL 18 0 18 100.0BEAUMONT TX 17 12 5 29.4ERATH LA 16 15 1 6.3GROVES TX 16 10 6 37.5GULFPORT MS 16 8 8 50.0JACKSONVILLE FL 16 2 14 87.5
76

DICKINSON TX 15 11 4 26.7LAFITTE LA 14 11 3 21.4LEAGUE CITY TX 14 12 2 14.3BON SECOUR AL 13 8 5 38.5MARRERO LA 13 10 3 23.1MONTEGUT LA 13 8 5 38.5THEODORE AL 13 10 3 23.1APALACHICOLA FL 12 11 1 8.3AVONDALE LA 12 10 2 16.7BACLIFF TX 12 7 5 41.7BURAS LA 12 9 3 25.0PASCAGOULA MS 12 10 2 16.7ROCKPORT TX 12 6 6 50.0FAIRHOPE AL 11 9 2 18.2GRAND BAY AL 11 8 3 27.3GRETNA LA 11 11 0 0.0NEW PORT RICHEY FL 11 7 4 36.4PEARLAND TX 11 10 1 9.1TARPON SPRINGS FL 11 6 5 45.5CARRABELLE FL 10 8 2 20.0FERNANDINA BCH FL 10 2 8 80.0GOLDEN MEADOW LA 10 10 0 0.0LAROSE LA 10 9 1 10.0BARATARIA LA 9 7 2 22.2BAY ST. LOUIS MS 9 5 4 44.4FOLEY AL 9 7 2 22.2LONG BEACH MS 9 7 2 22.2PORT NECHES TX 9 6 3 33.3PORT O'CONNOR TX 9 1 8 88.9PORT RICHEY FL 9 3 6 66.7BELLE CHASSE LA 8 8 0 0.0BOOTHVILLE LA 8 8 0 0.0BROOKSVILLE FL 8 0 8 100.0CRYSTAL RIVER FL 8 2 6 75.0MIAMI FL 8 0 8 100.0ST. PETERSBURG FL 8 2 6 75.0SUGAR LAND TX 8 7 1 12.5SULPHUR LA 8 4 4 50.0VENICE LA 8 7 1 12.5YOUNGSVILLE LA 8 7 1 12.5BATON ROUGE LA 7 7 0 0.0LOCKPORT LA 7 4 3 42.9NEWPORT NEWS VA 7 1 6 85.7NICEVILLE FL 7 5 2 28.6ORANGE TX 7 4 3 42.9ATLANTIC BEACH FL 6 1 5 83.3BOURG LA 6 5 1 16.7CARROLLTON TX 6 5 1 16.7
77

DUNNELLON FL 6 1 5 83.3EASTPOINT FL 6 3 3 50.0HERNANDO BEACH FL 6 0 6 100.0KAPLAN LA 6 5 1 16.7LAGUNA VISTA TX 6 4 2 33.3LOS FRESNOS TX 6 6 0 0.0METAIRIE LA 6 2 4 66.7MORGAN CITY LA 6 6 0 0.0OLMITO TX 6 6 0 0.0ORIENTAL NC 6 2 4 66.7SOUTHPORT FL 6 2 4 66.7WAVELAND MS 6 5 1 16.7WESTWEGO LA 6 6 0 0.0DAUPHIN ISLAND AL 5 3 2 40.0EMPIRE LA 5 5 0 0.0FRIENDSWOOD TX 5 3 2 40.0GULF SHORES AL 5 2 3 60.0LAKE CHARLES LA 5 3 2 40.0MATAGORDA TX 5 4 1 20.0NEW IBERIA LA 5 5 0 0.0PANACEA FL 5 0 5 100.0ROBERTSDALE AL 5 5 0 0.0SEADRIFT TX 5 0 5 100.0SLIDELL LA 5 2 3 60.0SNEADS FERRY NC 5 0 5 100.0AUSTIN TX 4 2 2 50.0BOKEELIA FL 4 0 4 100.0BRADENTON FL 4 0 4 100.0BRUNSWICK GA 4 1 3 75.0CORPUS CHRISTI TX 4 2 2 50.0CRYSTAL BEACH TX 4 3 1 25.0INGLIS FL 4 2 2 50.0LAKE ARTHUR LA 4 4 0 0.0LAKE JACKSON TX 4 3 1 25.0ODESSA FL 4 0 4 100.0PASADENA TX 4 4 0 0.0SHALLOTTE NC 4 0 4 100.0SUPPLY NC 4 2 2 50.0VICTORIA TX 4 4 0 0.0AMELIA LA 3 3 0 0.0ANAHUAC TX 3 0 3 100.0BRAZORIA TX 3 1 2 66.7BREAUX BRIDGE LA 3 1 2 66.7CHALMETTE LA 3 1 2 66.7CLUTE TX 3 3 0 0.0CORTEZ FL 3 1 2 66.7CRAWFORDVILLE FL 3 3 0 0.0FORT WORTH TX 3 2 1 33.3
78

GARLAND TX 3 3 0 0.0GAUTIER MS 3 2 1 33.3GLOUCESTER MA 3 0 3 100.0HITCHCOCK TX 3 2 1 33.3HOMOSASSA FL 3 0 3 100.0KEMAH TX 3 3 0 0.0LITHIA FL 3 3 0 0.0LOWLAND NC 3 1 2 66.7LYNN HAVEN FL 3 3 0 0.0MAYPORT FL 3 0 3 100.0MERRITT ISLAND FL 3 0 3 100.0NEW BERN NC 3 0 3 100.0NORTH PORT FL 3 2 1 33.3PUNTA GORDA FL 3 1 2 66.7RICHMOND TX 3 3 0 0.0RIVERVIEW FL 3 2 1 33.3SEABROOK TX 3 2 1 33.3ST. BERNARD LA 3 2 1 33.3ST. JAMES CITY FL 3 1 2 66.7THIBODAUX LA 3 3 0 0.0ALVIN TX 2 1 1 50.0AMA LA 2 2 0 0.0AURORA NC 2 0 2 100.0BELHAVEN NC 2 2 0 0.0BRIDGE CITY TX 2 2 0 0.0CANTONMENT FL 2 0 2 100.0CAPE CANAVERAL FL 2 2 0 0.0CEDAR LANE TX 2 1 1 50.0CHANNELVIEW TX 2 0 2 100.0CLEVELAND TX 2 0 2 100.0COCOA BEACH FL 2 0 2 100.0CRESCENT GA 2 0 2 100.0ESTERO FL 2 1 1 50.0FULTON TX 2 1 1 50.0FULTONDALE AL 2 2 0 0.0GIBSON LA 2 2 0 0.0GRANTSBORO NC 2 1 1 50.0HOLIDAY FL 2 1 1 50.0HORSESHOE BEACH FL 2 0 2 100.0HUMBLE TX 2 2 0 0.0INVERNESS FL 2 0 2 100.0KILN MS 2 1 1 50.0KINDER LA 2 2 0 0.0LEHIGH ACRES FL 2 1 1 50.0LIBERTY TX 2 0 2 100.0MADEIRA BEACH FL 2 0 2 100.0MATLACHA FL 2 1 1 50.0MCCLELLANVILLE SC 2 0 2 100.0
79

MIDWAY GA 2 0 2 100.0MISSOURI CITY TX 2 2 0 0.0MOUNT PLEASANT SC 2 0 2 100.0NEW SMYRNA BEACH FL 2 0 2 100.0PLAQUEMINE LA 2 2 0 0.0PORT ARANSAS TX 2 1 1 50.0RICHMOND HILL GA 2 1 1 50.0SABINE PASS TX 2 1 1 50.0SAN LEON TX 2 1 1 50.0SAUCIER MS 2 0 2 100.0SOPCHOPPY FL 2 1 1 50.0VANCLEAVE MS 2 1 1 50.0YANKEETOWN FL 2 1 1 50.0YULEE FL 2 0 2 100.0ADDIS LA 1 1 0 0.0ALISO VIEJO CA 1 1 0 0.0ANAHEIM CA 1 1 0 0.0ARCADIA FL 1 0 1 100.0ARLINGTON TX 1 1 0 0.0BALDWIN LA 1 1 0 0.0BAY CITY TX 1 0 1 100.0BAYTOWN TX 1 0 1 100.0BERWICK LA 1 0 1 100.0BONITA SPRINGS FL 1 1 0 0.0BRANDON FL 1 1 0 0.0BROOKFIELD IL 1 1 0 0.0BRUCE FL 1 0 1 100.0CAPE MAY NJ 1 0 1 100.0CHANTILLY VA 1 1 0 0.0CHARENTON LA 1 1 0 0.0CHARLOTTE NC 1 1 0 0.0CHICAGO IL 1 0 1 100.0CITRONELLE AL 1 1 0 0.0CLAXTON GA 1 1 0 0.0CLERMONT FL 1 1 0 0.0COCONUT CREEK FL 1 0 1 100.0COUSHATTA LA 1 0 1 100.0CREOLE LA 1 1 0 0.0DALLAS TX 1 0 1 100.0DAPHNE AL 1 0 1 100.0DELCAMBRE LA 1 0 1 100.0DENTON TX 1 1 0 0.0DIAMOND HEAD MS 1 0 1 100.0DONALDSONVILLE LA 1 1 0 0.0DUNEDIN FL 1 1 0 0.0EAST KINGSTON NH 1 0 1 100.0EDMOND OK 1 1 0 0.0
80
ELBERTA AL 1 0 1 100.0ENGLEWOOD FL 1 0 1 100.0EUTIS FL 1 0 1 100.0FOLSOM LA 1 0 1 100.0FORT LAUDERDALE FL 1 1 0 0.0FORT WALTON BCH FL 1 0 1 100.0FORT WHITE FL 1 0 1 100.0FRANKLIN LA 1 1 0 0.0FREDRICKSBURG TX 1 1 0 0.0GOLIAD TX 1 0 1 100.0GRAMERCY LA 1 1 0 0.0GRAND CHENIER LA 1 1 0 0.0GRAND PRAIRIE TX 1 1 0 0.0GRAY LA 1 1 0 0.0GUEYDAN LA 1 1 0 0.0HAYESVILLE NC 1 1 0 0.0HIGH ISLAND TX 1 1 0 0.0HOBUCKEN NC 1 0 1 100.0HORTENSE GA 1 0 1 100.0INDIANOLA MS 1 1 0 0.0INGLESIDE TX 1 0 1 100.0IOWA LA 1 1 0 0.0IRVING TX 1 1 0 0.0JAYESS MS 1 1 0 0.0JEANERETTE LA 1 0 1 100.0KATY TX 1 0 1 100.0KENNER LA 1 0 1 100.0LA MARQUE TX 1 0 1 100.0LAUDERHILL FL 1 0 1 100.0LECANTO FL 1 0 1 100.0LONG BEACH CA 1 1 0 0.0LOXLEY AL 1 1 0 0.0LULING LA 1 0 1 100.0LUTZ FL 1 0 1 100.0LYONS GA 1 0 1 100.0METAIRE LA 1 1 0 0.0MIMS FL 1 0 1 100.0MONTICELLO MS 1 1 0 0.0MORRISTON FL 1 0 1 100.0MOSS POINT MS 1 0 1 100.0NACOGDOCHES TX 1 1 0 0.0NAPLES FL 1 0 1 100.0NEPTUNE BEACH FL 1 0 1 100.0NORTH MIAMI FL 1 0 1 100.0NORTH RICHLAND TX 1 1 0 0.0OCALA FL 1 0 1 100.0OLD OCEAN TX 1 0 1 100.0OPELOUSAS LA 1 1 0 0.0
81

ORANGE BEACH AL 1 1 0 0.0ORLANDO FL 1 0 1 100.0PATTERSON LA 1 1 0 0.0PETAL MS 1 0 1 100.0PICAYUNE MS 1 0 1 100.0PIERRE PART LA 1 1 0 0.0PLANT CITY FL 1 1 0 0.0PORT BOLIVAR TX 1 1 0 0.0PORT CHARLOTTE FL 1 0 1 100.0PORT ORANGE FL 1 0 1 100.0PORTLAND TX 1 0 1 100.0QUITMAN MS 1 1 0 0.0ROCKWALL TX 1 1 0 0.0ROSHARON TX 1 0 1 100.0ROUND ROCK TX 1 1 0 0.0RUTH MS 1 1 0 0.0SAN BENITO TX 1 1 0 0.0SAN DEIGO CA 1 1 0 0.0SARALAND AL 1 0 1 100.0SILVER SPRING FL 1 0 1 100.0SILVERHILL AL 1 1 0 0.0SOUR LAKE TX 1 0 1 100.0SOUTH PADRE TX 1 0 1 100.0SOUTHBEND WA 1 1 0 0.0SPANISH FORT AL 1 1 0 0.0ST. AUGUSTINE FL 1 0 1 100.0STEINHATCHEE FL 1 0 1 100.0SUWANNEE FL 1 0 1 100.0SWEENY TX 1 1 0 0.0TERRYTOWN LA 1 1 0 0.0TEXAS CITY TX 1 1 0 0.0TORRANCE CA 1 1 0 0.0TOWNSEND GA 1 0 1 100.0VALRICO FL 1 1 0 0.0VENICE FL 1 0 1 100.0VINTON LA 1 1 0 0.0VIOLET LA 1 1 0 0.0WADMALAW ISLAND SC 1 0 1 100.0WADSWORTH TX 1 0 1 100.0WANCHESE NC 1 1 0 0.0WEBSTER TX 1 1 0 0.0WELSH LA 1 1 0 0.0WEST COLUMBIA TX 1 1 0 0.0WEWAHITCHKA FL 1 1 0 0.0WILMINGTON DE 1 1 0 0.0WINNIE TX 1 1 0 0.0
82

Table 37. Gulf Food Shrimp Landings, Sales, and Number of Dealers by Select Communities, Ranked by Sales in 200521
City StateGulf Food Shrimp
LandingsGulf Food Shrimp
Sales Number of DealersPORT ARTHUR TX 10,356,766 $33,931,933 6PALACIOS TX 8,778,959 $28,280,168 13BROWNSVILLE TX 7,402,272 $26,274,180 UNKDULAC LA 10,557,448 $23,398,055 14BAYOU LA BATRE AL 7,231,942 $21,993,433 11ABBEVILLE LA 7,343,199 $19,603,253 11PORT ISABEL TX 4,359,018 $15,935,891 9GOLDEN MEADOW LA 5,788,934 $12,925,081 14BILOXI MS 4,238,124 $12,255,039 6CHAUVIN LA 6,955,645 $12,141,876 26FT MYERS BEACH FL 3,355,467 $11,208,159 4PORT BOLIVAR TX 3,631,662 $10,832,920 5GRAND ISLE LA 5,726,732 $10,217,558 8LAFITTE LA 4,794,645 $9,542,357 11CUT OFF LA 2,514,991 $6,706,646 13FREEPORT TX 2,044,158 $6,284,408 3BON SECOUR AL 1,661,125 $6,235,378 7VENICE LA 3,318,664 $6,146,924 3EMPIRE LA 2,763,166 $4,701,122 11GALVESTON TX 1,513,876 $4,696,202 4BOOTHVILLE LA 1,984,358 $4,242,576 3ARANSAS PASS TX 1,331,701 $4,074,451 8KEY WEST FL 1,731,059 $3,947,430 3TAMPA FL 1,194,154 $3,759,880 3PORT ST JOE FL *** *** 1DELCAMBRE LA 1,908,189 $3,243,822 10THERIOT LA 2,180,607 $3,212,594 6MONTEGUT LA 1,716,148 $3,140,727 8MORGAN CITY LA 940,064 $2,235,909 13LOCKPORT LA 1,052,305 $2,195,130 3APALACHICOLA FL 940,776 $2,102,312 5CROWN POINT LA *** *** 2TARPON SPRINGS FL 663,518 $1,845,417 3BELLE CHASSE LA 938,989 $1,778,136 5SABINE PASS TX *** *** 2HOUMA LA 943,886 $1,451,230 12
21 ?For communities where the number of dealers is less than three, landings and sales are suppressed to protect firms’ confidential data. For Brownsville, even though several shrimp dealers purchase shrimp in the community, all dealer data is reported under a single code and thus the exact number of dealers is unknown. Only communities with more than $300,000 in landings were selected for presentation.
83

DICKINSON TX 633,205 $1,382,023 3CAMERON LA 885,122 $1,351,238 25SEABROOK TX *** *** 2IRVINGTON AL 356,980 $1,019,190 3SAN LEON TX 509,252 $959,347 6CODEN AL 249,916 $872,384 6PORT SULPHUR LA *** *** 2HACKBERRY LA 674,106 $818,213 5PORT LAVACA TX 375,165 $792,047 4THEODORE AL 325,192 $698,473 4CRYSTAL BEACH TX 208,944 $577,115 3YSCLOSKEY LA 319,695 $494,129 3INGLIS FL *** *** 1NEW ORLEANS LA 217,014 $463,542 8KEMAH TX *** *** 1PASCAGOULA MS 178,463 $418,792 3GULFPORT MS *** *** 2PASS CHRISTIAN MS *** *** 2FULTON TX 157,128 $357,825 7BAYTOWN TX *** *** 2OAK ISLAND TX 183,608 $335,179 3ST BERNARD LA 183,714 $315,947 6GRAND BAY AL *** *** 1
Table 38. Number of Vessels Supplying Shrimp to Selected Communities, 2005.
City State Number of VesselsDULAC LA 612GRAND ISLE LA 543LAFITTE LA 528
84

GOLDEN MEADOW LA 517CHAUVIN LA 431EMPIRE LA 326VENICE LA 274BAYOU LA BATRE AL 235PORT ARTHUR TX 220MONTEGUT LA 198ABBEVILLE LA 195BOOTHVILLE LA 184DELCAMBRE LA 174PORT SULPHUR LA 164LOCKPORT LA 163BROWNSVILLE TX 159BILOXI MS 155CROWN POINT LA 140PALACIOS TX 140THERIOT LA 136PORT BOLIVAR TX 129CUT OFF LA 123FREEPORT TX 108FT MYERS BEACH FL 107CAMERON LA 105KEY WEST FL 99NEW ORLEANS LA 99PORT ISABEL TX 95ARANSAS PASS TX 92BELLE CHASSE LA 90
Table 39. Number of Qualifying Vessels Supplying Shrimp to Selected Communities, 2005.
City State Number of Qualifying VesselsPORT ARTHUR TX 197DULAC LA 182
85
BAYOU LA BATRE AL 174BROWNSVILLE TX 149GRAND ISLE LA 144PALACIOS TX 135ABBEVILLE LA 129GOLDEN MEADOW LA 121FREEPORT TX 104PORT BOLIVAR TX 103FT MYERS BEACH FL 101PORT ISABEL TX 94BILOXI MS 91KEY WEST FL 90ARANSAS PASS TX 79CHAUVIN LA 75DELCAMBRE LA 72BOOTHVILLE LA 69CUT OFF LA 66GALVESTON TX 63VENICE LA 61EMPIRE LA 51SABINE PASS TX 46CAMERON LA 41LOCKPORT LA 39LAFITTE LA 36BON SECOUR AL 33TAMPA FL 30MORGAN CITY LA 27APALACHICOLA FL 26BELLE CHASSE LA 25PORT ST JOE FL 23
86
Table 40. Processed Pounds, Value, and Employment of Gulf Shrimp Processors by Community in 2005, Ranked by Processed Shrimp Value.22
City State
Number of Shrimp Processors Total Processed Pounds Total Processed Value Processed Shrimp Pounds Processed Shrimp Value Employment
Shrimp as Percent of
Processed ValueDELCAMBRE LA 4 21,115,149 $66,330,738 21,115,149 $66,330,738 170 100.0LAKELAND FL 1 *** *** *** *** *** 77.9BAYOU LA BATRE AL 8 21,336,661 $62,527,413 16,495,961 $55,227,198 231 88.3BILOXI MS 7 19,708,834 $42,225,235 19,482,121 $42,108,637 296 99.7BROWNSVILLE TX 2 *** *** *** *** *** 100.0DULAC LA 5 15,011,516 $38,837,889 15,004,076 $38,822,265 155 100.0PORT ISABEL TX 1 *** *** *** *** *** 100.0TAMPA FL 1 *** *** *** *** *** 81.8NEW ORLEANS LA 1 *** *** *** *** *** 100.0PORT ARTHUR TX 1 *** *** *** *** *** 100.0SAN BENITO TX 1 *** *** *** *** *** 100.0DOVER FL 1 *** *** *** *** *** 78.0BON SECOUR AL 2 *** *** *** *** *** 79.9D'IBERVILLE MS 1 *** *** *** *** *** 100.0PALACIOS TX 1 *** *** *** *** *** 100.0BEAUMONT TX 1 *** *** *** *** *** 100.0PORT SAINT JOE FL 1 *** *** *** *** *** 100.0ST PETERSBURG FL 1 *** *** *** *** *** 49.2APALACHICOLA FL 3 1,645,000 $6,779,225 1,645,000 $6,779,225 12 100.0MOBILE AL 1 *** *** *** *** *** 100.0CHAUVIN LA 5 1,398,309 $4,620,674 1,398,309 $4,620,674 65 100.0VIOLET LA 1 *** *** *** *** *** 100.0GOLDEN MEADOW LA 2 *** *** *** *** *** 100.0KEMAH TX 1 *** *** *** *** *** 29.1HARAHAN LA 1 *** *** *** *** *** 100.0
22 For communities where the number of processors is less than three, information regarding processed pounds, value, and employment are suppressed to protect firms’ confidential data. However, dependency on the value of processed shrimp is reported for all communities with shrimp processors.
87

OCEAN SPRINGS MS 1 *** *** *** *** *** 99.9THERIOT LA 1 *** *** *** *** *** 100.0PASCAGOULA MS 1 *** *** *** *** *** 100.0CARRABELLE FL 1 *** *** *** *** *** 100.0HOUMA LA 1 *** *** *** *** *** 0.3SEADRIFT TX 1 *** *** *** *** *** 13.5
88

Table 41. Ranking of Communities in 2005 Based on Strength of Relationship to the Gulf Shrimp Fishery with Special Emphasis on the EEZ Fishery.
Rank City State1 PORT ARTHUR TX2 BROWNSVILLE TX3 BAYOU LA BATRE AL4 DULAC LA5 PALACIOS TX6 BILOXI MS7 PORT ISABEL TX8 CHAUVIN LA9 ABBEVILLE LA10 FT MYERS BEACH FL11 GRAND ISLE LA12 GOLDEN MEADOW LA13 FREEPORT TX14 CUT OFF LA15 DELCAMBRE LA16 ARANSAS PASS TX17 LAFITTE LA18 TAMPA FL19 KEY WEST FL20 PORT BOLIVAR TX21 VENICE LA22 EMPIRE LA23 NEW ORLEANS LA24 BOOTHVILLE LA25 GALVESTON TX26 BON SECOUR AL27 HOUMA LA28 PORT LAVACA TX29 CAMERON LA30 APALACHICOLA FL31 LOCKPORT LA32 MONTEGUT LA33 IRVINGTON AL34 PORT ST JOE FL35 THERIOT LA
89

90

Table 42. Communities Determined to be Vulnerable Based on Socioeconomic Attributes, as Modified by Information Regarding Impacts of the 2005 Hurricanes
Group 1 Group 2
Palacios Abbeville
Dulac Golden Meadow
Bayou La Batre Freeport
Port Isabel Lafitte
Empire Aransas Pass
Boothville Chauvin
Coden Apalachicola
Venice Montegut
Cameron Brownsville
Port Arthur Port Lavaca
Grand Isle Houma
Galveston
Delcambre
91

Table 43. Changes in Nominal Shrimp Prices, 2000 through May 2006.
Size 2000 2001 2002 2003 2004 2005 PreKatrina 2005 Post-Katrina May 2006 Change 2000 to May 2006Percent change 2000 to May 2006
Under 15 $9.06 $8.39 $6.96 $5.91 $6.34 $6.56 $6.46 $5.95 -$3.11 -34.3%15-20 $7.10 $6.51 $5.45 $4.95 $5.26 $4.75 $4.22 $4.10 -$3.00 -42.2%21-25 $5.72 $5.24 $4.23 $3.99 $4.32 $3.98 $3.52 $3.40 -$2.32 -40.5%26-30 $5.08 $4.76 $3.51 $3.52 $3.34 $3.18 $3.12 $3.18 -$1.90 -37.4%31-40 $4.47 $3.74 $2.91 $2.82 $2.59 $2.67 $2.61 $2.63 -$1.84 -41.1%41-50 $3.92 $2.95 $2.58 $2.31 $2.14 $2.37 $2.30 $2.24 -$1.68 -42.8%51-67 $3.44 $2.59 $2.31 $2.00 $1.84 $2.17 $2.11 $2.04 -$1.40 -40.7%>67 $2.16 $1.95 $1.60 $1.23 $1.11 $1.58 $1.61 $1.51 -$0.65 -30.1%
92

93