regulation of denitrification using continually measured ...regulation of denitrification using...
TRANSCRIPT
Regulation of Denitrification Using Continually Measured ORP and pH Signal
M. DRTIL, P. NÉMETH, J. BUDAY, I. BODÍK, and M. HUTŇAN
Department of Environmental Science, Faculty of Chemical Technology, Slovak University of Technology, SK-812 37 Bratislava
Received 7 April 1998
The use of pH and oxidation-reduction potential (ORP) as control parameters for the nitrification-denitrification process is compared and discussed. The signals were measured in a sequencing batch reactor activated sludge system and in a completely mixed activated sludge reactor. The termination of denitrification was clearly identified not only by an ORP signal, but also by a pH signal. However, in some cases the ORP measurement failed (e.g. in the case of high organic substrate concentrations in the system). pH measurement failed in the case of low substrate concentration or under the conditions of endogenous denitrification. The combined measurement of pH and ORP signals is proposed to indicate the end of denitrification as a result.
A biological nitrogen removal from the waste water depends on the formation of optimal conditions for nitrification and denitrification. Both of these biochemical processes require specific conditions. In particular, concerning the requirements for the presence of the oxidation agent they are contradictory. Nitrification requires dissolved oxygen (DO), while denitrification ceases in the presence of oxygen. It is therefore obvious that optimal nitrogen removal by the combination of nitrification and denitrification will depend on the exact set up of oxic and anoxic conditions in the reactor. Operationally proved processes are among others:
- set up of oxic and anoxic periods by a timer [1], - regulation by continuously measured NH 4 —N
and NO3—N concentrations [2], - regulation according to the oxidation reduction
potential (ORP) signal [2—4], - regulation according to the current respiration
rate [5, 6]. The above-mentioned system of the continuously
measured ORP signal seems to be both economically and operationally effective. One of the possibilities to use the ORP for regulation is based on the fact that the ORP value is decreasing during the denitrification process, while after its completion the ORP record shows a break and the decrease rate speeds up. This mathematically treatable break is proved to be appropriate for the aeration equipment control, i.e. after the completion of denitrification and the ORP break the aeration equipment starts to work creating thus oxic conditions necessary for nitrification. Termination of nitrification is set up either by a timer, or for its identification, a set up ORP value or the stabilization of the ORP in the reactor is used. Given systems were used in several waste water treatment plants, how
ever, there are some examples where the ORP signal utilization has failed.
The advantage of the ORP signal is its simple application and low investment costs for the technical part. However, these facts apply also to another continually measured signal, pH. As it resulted from previous works [7—11], after the completion of denitrification the OH~ ions production ceased, which was shown by a more or less significant break on the pH curve.
The objective of this work was to verify the utilization of the above-mentioned signals to regulate denitrification processes in different activated sludge systems and with different types of waste water.
E X P E R I M E N T A L
The ORP and pH regulation signals were tested in activated sludge process laboratory models (V = 5 dm3) that simulated real operating systems with biological nitrogen removal. These were respectively (Table 1):
Activated sludge system 1 with semicontinuous regime both in input and output (the sequencing batch reactor (SBR) system), while the influent waste water was pumped by shock in certain intervals. Feeding of the waste water started anoxic conditions which were followed by oxic conditions for a set time period. The waste water filled the reactor in steps. Once the reactor became full, the aeration or stirring equipment was turned off, the activated mixture settled, and a part of the treated water was pumped by shock to the effluent (activated sludge system without separate settling tank).
Activated sludge system 2 with continuous input
Chem. Papers 53 (1)75—81 (1999) 75
M. DRTIL, P. NEMETH, J. BUDAY, I. BODIK, M. HUTNAN
T a b l e 1. Technological Parameters of Activated Sludge Systems and Waste Water Composition
Technological parameters System 1 System 2 System 3
B v / C k g m ^ d - 1 ) * SRT/d X/(g d m " 3 ) Substrate additions c
Wh tD/h
e/°c
0.55b
20 2.1 3
3 x 4.5 3 x 3.0
22.0
0.4b
10 1.0
2.0 4.0
22.0
0.48Ď
10 0.7
2.25 3.75 22.0
Substrate parameters (average values) System 1 System 2 System 3
p(sewage)/(mg d m - 3 ) p(glucose)/(mg d m - 3 ) p(ethanol)/(mg d m - 3 ) p(glycerine)/(mg d m - 3 ) p(peptone)/(mg d m - 3 ) p ( N H 4 — N d ) / ( m g d m " 3 ) p ( N 0 3 — N ) / ( m g d m " 3 ) p ( N 0 2 — N ) / ( m g d m " 3 ) Acidity^s/(mmol d m - 3 )
110a
350a
350a
350a
35 0 0
18е
220 a
100a
100a
75 a
41 0 0
10е
600 a
24 0 0
10е
pH 7.4 7.3 7.7
a) As chemical oxygen demand (COD), 6) average value, actual value was influenced by municipal waste water quality, c) additions per day (applied at the beginning of denitrification periods), d) complete nitrification in all systems, e) increased values after NaHCOß addition to evaluate the influence of the acidity on the pH signal, Bw - volumetric loading, fa - nitrification period, t^-denitrification period, SRT - sludge age, X - activated sludge concentration.
and semicontinuous output. This system was similar to the first one, but the waste water entered the system continuously and oxic or anoxic conditions changed independently on the input. The reactor was filled gradually and the treated water was removed by the same way as in the first case.
Activated sludge system 3 with continuous input and output, i.e. the classic system with a settling tank and activated sludge recycling. Oxic and anoxic conditions were changed in the activation reactor by turning on and off the aeration equipment.
As for the hydraulic conditions, the activated sludge system 1 was a reactor with a substrate concentration gradient, the other two systems were completely mixed reactors. (In reactor 2 in difference to reactor 3 the reactor volume and activated sludge concentration were gradually changing.) In all models during the anoxic period the activated sludge was mixed with a mechanic stirrer and during the oxic period it was aerated by a fine bubble aeration.
Tested waste waters were municipal waste water from the Bratislava sewage system, or municipal waste water with addition of chosen organic substrates (more detailed characteristics of the waste water and individual parameters of the activated sludge systems are described in Table 1).
The signals were measured continuously directly in the activated sludge systems using pH and ORP probes. Platinum electrode (with a silver/silver chloride reference electrode) was used for the ORP mea
surement. The ORP measuring apparatus was calibrated using a Fe(NH4)2(S04)2/Fe(NH4)(S04)2 solution [12].
Individual records of pH and ORP were evaluated by the computer. Analyses were carried out according to the Standard Methods [12].
RESULTS A N D DISCUSSION
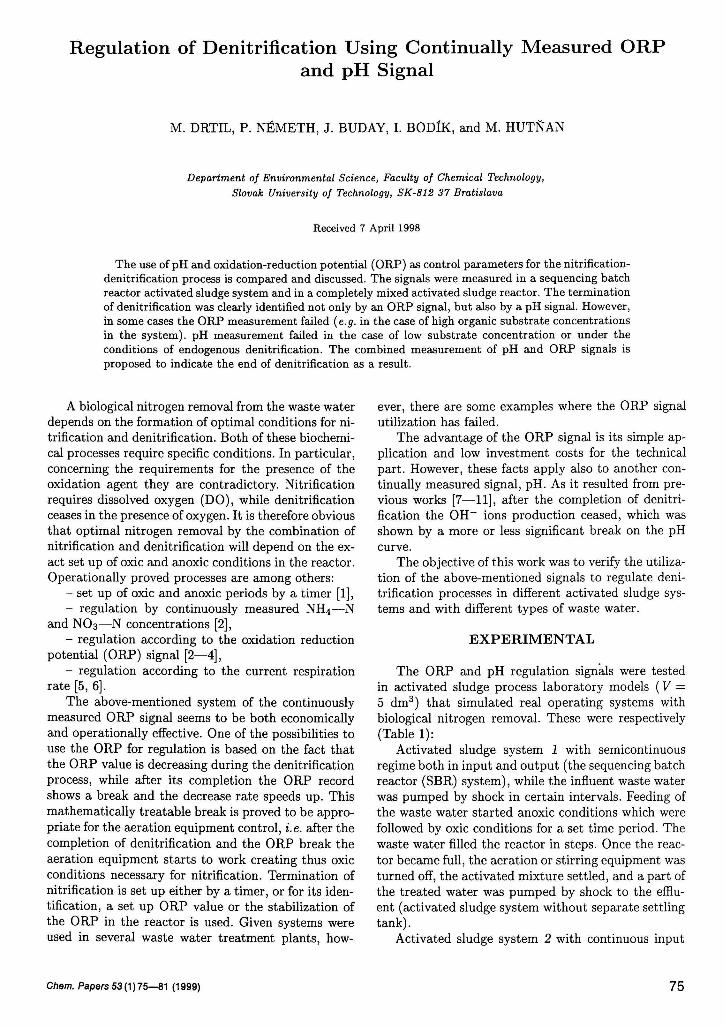
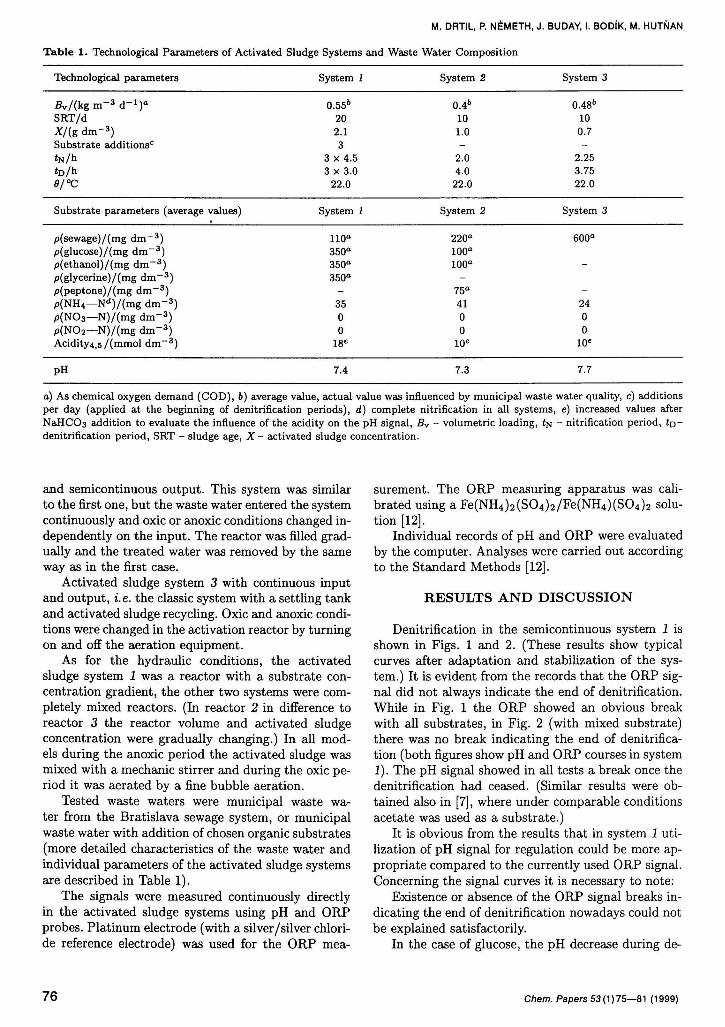
Denitrification in the semicontinuous system 1 is shown in Figs. 1 and 2. (These results show typical curves after adaptation and stabilization of the system.) It is evident from the records that the ORP signal did not always indicate the end of denitrification. While in Fig. 1 the ORP showed an obvious break with all substrates, in Fig. 2 (with mixed substrate) there was no break indicating the end of denitrification (both figures show pH and ORP courses in system 1). The pH signal showed in all tests a break once the denitrification had ceased. (Similar results were obtained also in [7], where under comparable conditions acetate was used as a substrate.)
It is obvious from the results that in system 1 utilization of pH signal for regulation could be more appropriate compared to the currently used ORP signal. Concerning the signal curves it is necessary to note:
Existence or absence of the ORP signal breaks indicating the end of denitrification nowadays could not be explained satisfactorily.
In the case of glucose, the pH decrease during de-
76 Chem. Papers 53 (1)75—81 (1999)
REGULATION OF DENITRIFICATION
200 8.00
ORP/mV
p(N)/(mgdnrT)
Fig . 1. ORP and pH signal course during denitrification in the activated sludge system 1. A - mixed substrate, В - glycerine, С -ethanol, D - glucose; the mixed substrate is a mixture as described in Table 1; other signals represent denitrification with individual substrates separately (total COD and system loading were kept constant); the arrows show the break indicating the end of denitrification (A N 0 3 — N , O N 0 2 — N ).
200
ORP/mV
100 -
-100
-200
-300
8.50
p(N)/(mgdrTT)
50 100 150
pH
8.25
8.00
7.75
7.50
200
200
Fig . 2. ORP and pH signal course during denitrification with the mixed substrate in the system 1. The arrow shows the break indicating the end of denitrification (Á NO3—N ).
nitrification was related to the more significant CO2 production compared to the OH~ ions production (all acid-base balances were discussed in detail in [8]). NO3—N and NO2—N removal was connected with a break downwards and a more rapid pH decrease.
In the case of glycerine, the pH decrease was related to the increased CO2 production as a result of the partial denitrification of N03—N to N02—N. Following pH increase resulted from the denitrification of the produced NO2—N (NO3—N were removed al-
Chem. Papers 53 (1)75—81 (1999) 77
M. DRTIL, P. NÉMETH, J. BUDAY, I. BODÍK, M. HUTŇAN
200
ORP/mV
100
-100
-200
/?(N)/(mgdnO
100 200
100 „ . 200 ŕ/mm
10.00
7.00 300
300
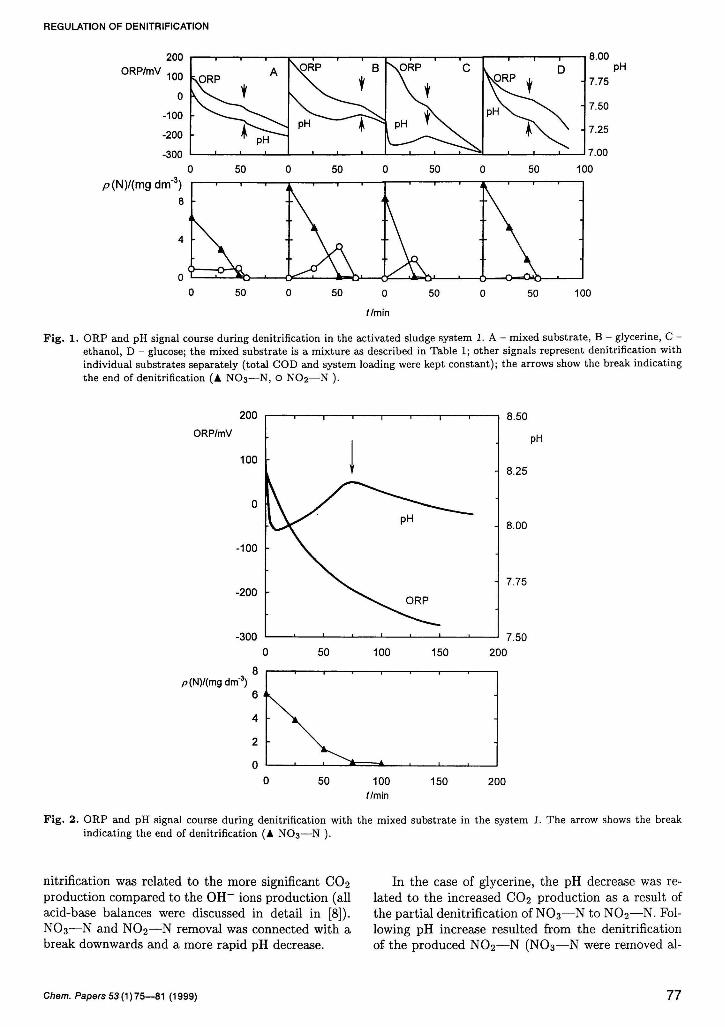
Fig . 3. ORP and pH signal course during endogenous denitrification. The arrow shows the break indicating the end of denitrification (A NO3—N, O N 0 2 — N ).
ORP/mV
-200 -
-400 -
-600
-800
8.75
8.50
8.25
PH
7.25 200 400 600
ŕ/min
800 1000
Fig . 4. ORP and pH signal course during denitrification and nitrification in the activated sludge system 2. The arrows show the break indicating the end of denitrification.
ready). A significant decrease of pH occurred after the CO2 production after the denitrification termination N 0 2 — N was removed [8]. [8].
In the case of ethanol, the pH increase was related Despite the more complicated course of the pH sig-to the denitrification and the pH decrease to anaerobic nal during denitrification, the end of this process was
78 Chem. Papers 53 (1)75—81 (1999)
REGULATION OF DENITRIFICATION
200
ORP/mV
-200 -
-400
-600
-800
1 1
1 1
V ]
^^
tö
. 1 1 1 1 I
j ORP
V 1 рн
i /
if .
1 1 ^N i . i . i i 1
1 " t
\ j 1
чЛ -
to
8.75
-I 8.50
8.25
8.00
7.75
-\ 7.50
7.25
pH
0 100 200 300 400 500
ŕ/min
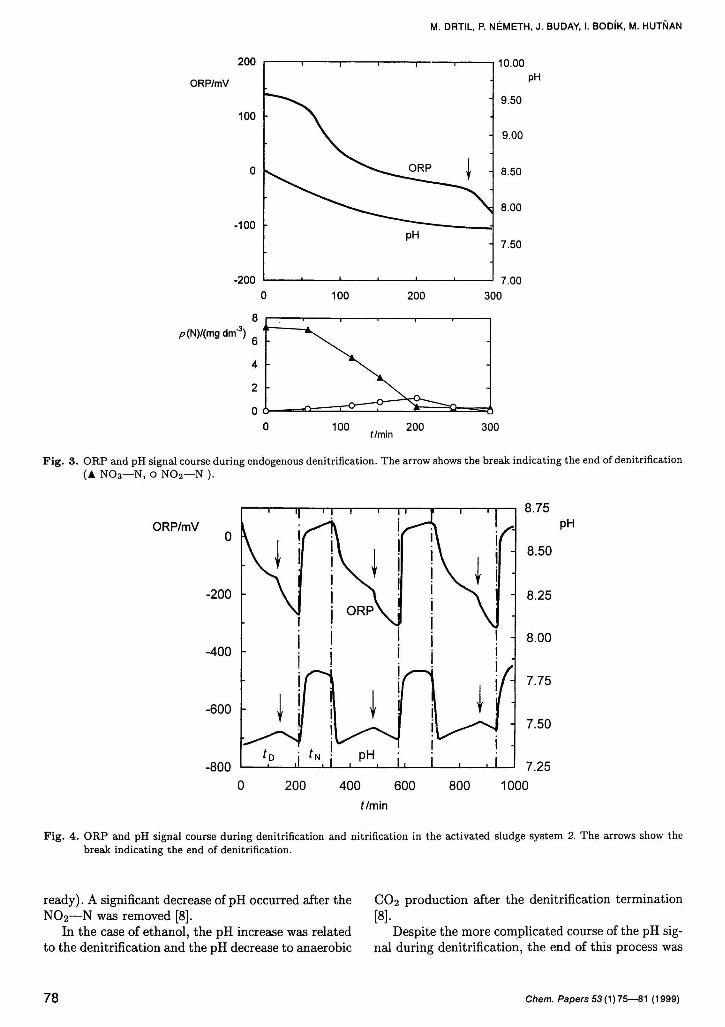
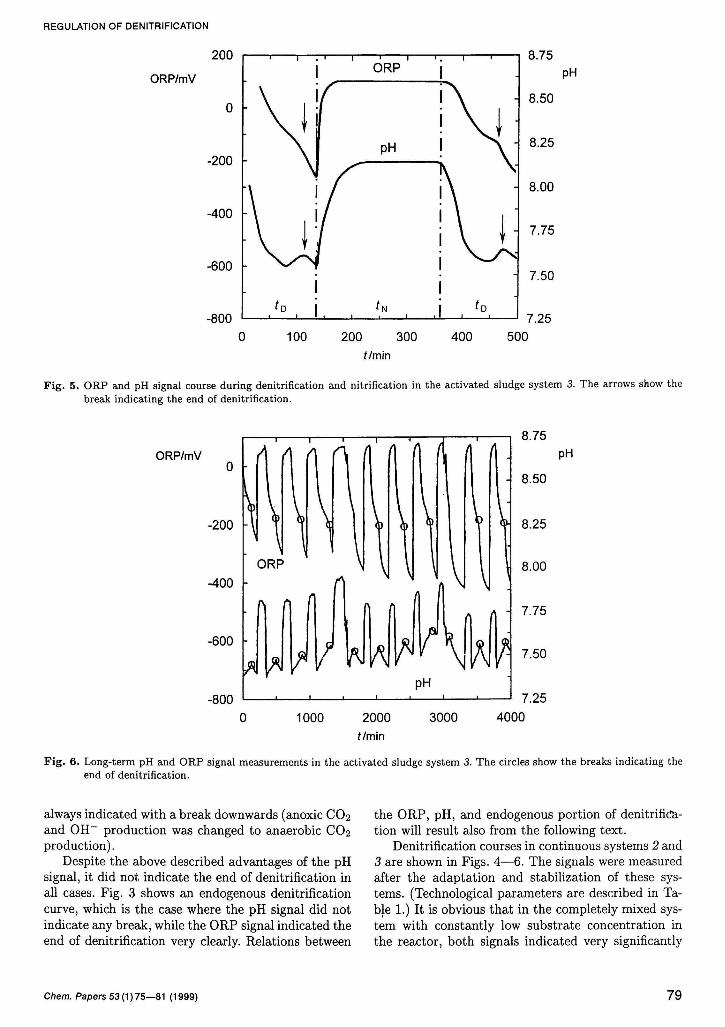
Fig . 5. ORP and pH signal course during denitrification and nitrification in the activated sludge system 3. The arrows show the break indicating the end of denitrification.
8.75
ORP/mV
-200
-400
-600
-800
pH
7.25
0 1000 2000 3000 4000
ŕ/min
Fig . 6. Long-term pH and ORP signal measurements in the activated sludge system 3. The circles show the breaks indicating the end of denitrification.
always indicated with a break downwards (anoxic CO2 and OH~ production was changed to anaerobic CO2 production).
Despite the above described advantages of the pH signal, it did not indicate the end of denitrification in all cases. Fig. 3 shows an endogenous denitrification curve, which is the case where the pH signal did not indicate any break, while the ORP signal indicated the end of denitrification very clearly. Relations between
the ORP, pH, and endogenous portion of denitrification will result also from the following text.
Denitrification courses in continuous systems 2 and 3 are shown in Figs. 4—6. The signals were measured after the adaptation and stabilization of these systems. (Technological parameters are described in Table 1.) It is obvious that in the completely mixed system with constantly low substrate concentration in the reactor, both signals indicated very significantly
Chem. Papers 53 (1) 75—81 (1999) 79
M. DRTIL, P. NÉMETH, J. BUDAY, I. BODÍK, M. HUTŇAN
10.00 ORP/mV
-200
-400
-600
-800
100 200 ŕ/min
pH
7.00 300
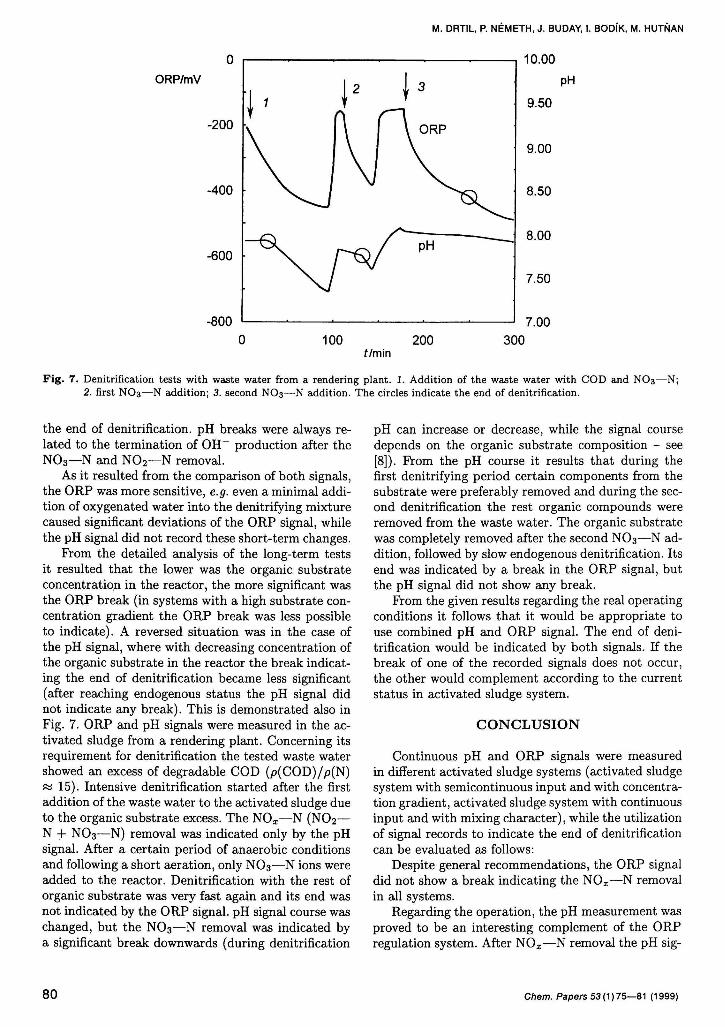
F i g . 7. Denitrification tests with waste water from a rendering plant. 1. Addition of the waste water with COD and NO3—N; 2. first NO3—N addition; 3. second NO3—N addition. The circles indicate the end of denitrification.
the end of denitrification. pH breaks were always related to the termination of OH~ production after the N 0 3 — N and N 0 2 — N removal.
As it resulted from the comparison of both signals, the ORP was more sensitive, e.g. even a minimal addition of oxygenated water into the denitrifying mixture caused significant deviations of the ORP signal, while the pH signal did not record these short-term changes.
From the detailed analysis of the long-term tests it resulted that the lower was the organic substrate concentration in the reactor, the more significant was the ORP break (in systems with a high substrate concentration gradient the ORP break was less possible to indicate). A reversed situation was in the case of the pH signal, where with decreasing concentration of the organic substrate in the reactor the break indicating the end of denitrification became less significant (after reaching endogenous status the pH signal did not indicate any break). This is demonstrated also in Fig. 7. ORP and pH signals were measured in the activated sludge from a rendering plant. Concerning its requirement for denitrification the tested waste water showed an excess of degradable COD (p(COD)/p(N) « 15). Intensive denitrification started after the first addition of the waste water to the activated sludge due to the organic substrate excess. The NO x —N (NO2— N + NO3—N) removal was indicated only by the pH signal. After a certain period of anaerobic conditions and following a short aeration, only NO3—N ions were added to the reactor. Denitrification with the rest of organic substrate was very fast again and its end was not indicated by the ORP signal. pH signal course was changed, but the NO3—N removal was indicated by a significant break downwards (during denitrification
pH can increase or decrease, while the signal course depends on the organic substrate composition - see [8]). From the pH course it results that during the first denitrifying period certain components from the substrate were preferably removed and during the second denitrification the rest organic compounds were removed from the waste water. The organic substrate was completely removed after the second NO3—N addition, followed by slow endogenous denitrification. Its end was indicated by a break in the ORP signal, but the pH signal did not show any break.
From the given results regarding the real operating conditions it follows that it would be appropriate to use combined pH and ORP signal. The end of denitrification would be indicated by both signals. If the break of one of the recorded signals does not occur, the other would complement according to the current status in activated sludge system.
C O N C L U S I O N
Continuous pH and ORP signals were measured in different activated sludge systems (activated sludge system with semicontinuous input and with concentration gradient, activated sludge system with continuous input and with mixing character), while the utilization of signal records to indicate the end of denitrification can be evaluated as follows:
Despite general recommendations, the ORP signal did not show a break indicating the NO x —N removal in all systems.
Regarding the operation, the pH measurement was proved to be an interesting complement of the ORP regulation system. After NO^—N removal the pH sig-
80 Chem. Papers 53 (1)75—61 (1999)
REGULATION OF DENITRIFICATION
nal showed a significant break downwards resulting from the termination of production of OH~ ions during denitrification.
pH signal, similarly to the ORP signal, did not indicate the end of denitrification in all tests. It could be concluded that the higher was the organic substrate concentration in the activation tank, the more significant was the pH break, and the lower was its concentration, the less significant was this break (in the activated sludge system under endogenous conditions the pH signal did not show any break).
Exactly the contrary is valid for the relation of ORP signal and the actual substrate concentration.
The optimal regulation system should simultaneously record both signals, while the end of denitrification should be indicated by both signals together, or at least by one of them.
Both the ORP and pH signals significantly depend on the waste water composition, the quality of which might differ from day to day. As the regulation is not based on the evaluation of absolute values of these parameters but on their time course, both signals can be recommended for regulation of denitrification in the waste water treatment processes.
R E F E R E N C E S
1. Rheinheimer, G., Hegemann, W., Raff, J., and Se-koulov, L, Stickstoffkreislauf im Wasser. R. Olden-bourg Verlag, München, 1988.
2. Ermel, G., Stickstoffentfernung in einstufigen Belebungsanlagen zur Steuerung der Denitrifikation. Veröffentlichung des Instituts für Stadtbauwesen, Heft 35, TU Braunschweig, 1983.
3. Charpentier, J., Godart, H., Martin, H., and Mogno, Y., Water Sei. Technol. 21, 1209 (1989).
4. Moriyama, K., in Proc. of the 15th Bienal IAWPRC, Water Pollution Research and Control, Kyoto, VNO. 2—VNO. 3, pp. 13, 493 (1990).
5. V. d. Emde, W., Österr. Abwasserrundschau Jubiläumsausgabe X, 73 (1975).
6. Kayser, R., Regelung der Belüftung von Belebungsanlagen zur Stickst о ff elimination. Veröffentlichung des Instituts für Stadtbauwesen, Heft 42, TU Braunschweig, 1987.
7. Drtil, M., Németh, P., Hucíková, L., and Bodík, I., Water Manage. Rep. 37, 12 (1994).
8. Drtil, M., Németh, P., Kucman, K., Bodík, L, and Kašperek, V., Water Res. 29, 1353 (1995).
9. Al-Ghusain, I. A., Huang, J., Hao, O. J., and Lim, В. S., Water Sei. Technol. 30, 159 (1994).
10. Al-Ghusain, I. A. and Hao, O. J., J. Environ. Eng. Div. (Am. Soc. Civ. Eng.) 120, 111 (1995).
11. Chang, Ch. H. and Hao, O. J., J. Chem. Technol. Biotechnol. 67, 27 (1996).
12. Standard Methods for the Examination of Water and Wastewater, 17th Edition. APHA, Washington DC, 1989.
Chem. Papers 53 (1) 75—81 (1999) 81