regulation, market structure, and hospital … · regulation, market structure, and hospital costs:...
TRANSCRIPT

WORKING PAPERS
REGULATION, MARKET STRUCTURE, AND
HOSPITAL COSTS: A COMMENT ON THE
WORK OF MAYO AND MCFARLAND
Keith B. Anderson
WORKING PAPER NO. 173
May 1989
FfC Bureau of Ecooomics working papers are preliminary materials circulated to stimulate discussion and critical commenL All data cootained in them are in the public domain. This includes information obtained by the Commi~oo which has become part of public record. The analyses and conclusions set forth are those of the authors and do not necessarily reflect the views of other members of the Bureau of Economics, other Commissioo staff, or the Commissiou itself. Upon request, single copies of the paper will be provided. References iu publications to FfC Bureau of Ecooomics working papers by FfC economists (other than acknowledgement by a writer that he has access to soch unpublished materials) should be cleared with the author to protect the tentative character of these papers.
BUREAU OF ECONOMICS FEDERAL TRADE COMMISSION
WASIllNGTON, DC 20580
Regulation, Market Structure, and Hospital Costs:
A Comment on the Work of Mayo and McFarland
by
Keith B. Anderson*
April 1989
* The author is Special Assistant to the Director, Bureau of Economics, Federal Trade Commission. I would like to thank John Howell, Alan Mathios, Paul Pautler, Mike Vita, and John Woodbury for helpful comments. The views expressed here are those of the author and do not necessarily reflect the views of the Federal Trade Commission, any of the Commissioners, or other Commission staff members.


I. Introduction
In a recent paper in the Southern Journal of Economics, Mayo and
McFarland [12 J claim to have shown that Certificate of Need (CON)
regulation has successfully reduced both the number of hospital beds
and hospital costs in recent years. If correct, this finding would be
significant news. Over the past fifteen years, at least fifteen other
studies have examined the effects of Certificate of Need regulation. 2
While a few of these studies have found that CON regulation has reduced
the number of hospital beds, none has found that CON regulation was
effective in reducing the costs of health care. 3 Indeed, the evidence
that CON has not been effective is so pervasive that even proponents of
health planning have begun to admit that CON has not reduced costs.4
Mayo and McFarland suggest that they are making two contributions
to the analysis of the effects of CON regulation. First, they claim to
have used a more general model of the effects of these regulations.
2 These studies are (1) Anderson and Kass [2 J, (2) -Coelen and Sullivan [3J, (3) Cohodes [4J, (4) Eastaugh [5J, (5) Farley and Kelly [6J, (6) Hellinger [7J, (7) Joskow [8J, (8) Joskow [9J, (9) Lee, Birnbaum, and Bishop [l1J, (10) Noether [13J and [14J, (11) Policy Analysis, Inc., and Urban Systems Research and Engineering, Inc. [15J, (12) Salkever and Bice [16J and [17J, (13) Sherman [18J, (14) Sloan [20 J, and (15) Sloan and Steinwald [21 J and [22 J. (Where the same research is reported in two places, I have counted this as a single study. )
3 Studies finding a reduction in hospital beds include Salkever and Bice [16J and [17J and Joskow [8J. Sloan and Steinwald «(2lJ and (22 J ) on the other hand found that CON regulation resulted in an increase in the number of hospital beds, particularly during the period between enactment of the regulations and when they became effective.
4 See Kimmey [101.
1

Second, they claim to have developed a novel dataset. In fact, the
model used by Mayo and McFarland precludes the kinds of effects found
by other researchers. Further, there are a number of problems with the
dataset they use in their work. When these problems are corrected, we
find results consistent with those reported by other researchers: CON
regulation leads to an increase in costs, not a decrease.
In the next section, we discuss the problems with the Mayo-
McFarland approach in greater detail. In section III, we present the
results of our own estimation of the effect of CON regulation on
hospital costs. Our conclusions are found in section IV.
II. Problems with the Model and Data Used by Mayo and McFarland
Because the hospital industry has not been in long run equilibrium
in recent years, Mayo and McFarland use a two-equation model to
estimate the effects of CON regulation, rather than estimating a long-
run hospital cost function. Their model consists of a short-run cost
function and a second equation, based on a queuing theory model, that
explains the quantity of beds a hospital will operate. 5 The model they
estimate is
5 One of the key variables in determining the number of beds a hospital will choose to operate is the average daily census of the hospital. Mayo and McFarland appear to use a hospital's current average daily census in estimating this equation. However, if the hospital industry is not in long-run equilibrium, current data on average daily census will not be equal to the average daily census for which the hospital was designed. As a result, there may be problems in the estimation of the beds equation similar to those that would result in estimating a long run cost function.
2
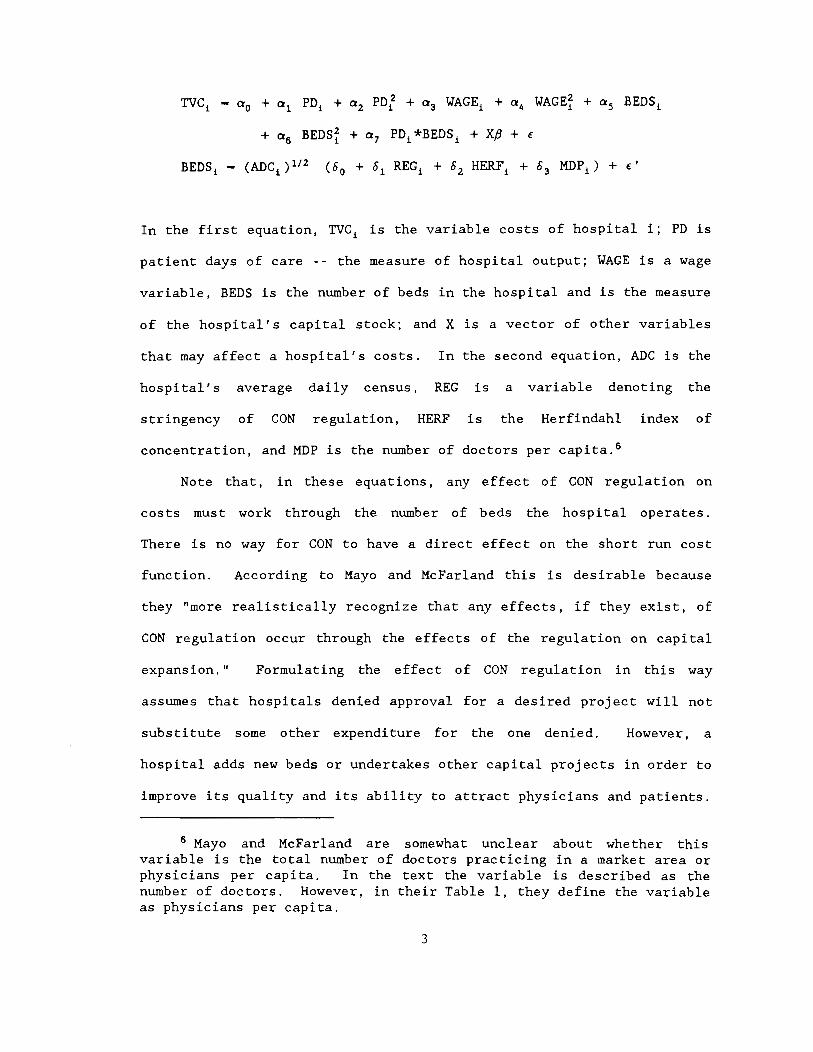
TVC! - a o + a 1 PO! + a 2 PDf + a 3 WAGE! + a 4 WAGEf + a 5 BEDSi
+ as BEDSf + a 7 PDi*BEDS i + Xp + €
BEDS! - (ADCi )1/2 (00 + 01 REGi + 02 HERFi + 03 MOP i ) + €'
In the first equation, TVCi is the variable costs of hospital i; PO is
patient days of care -- the measure of hospital output; WAGE is a wage
variable, BEDS is the number of beds in the hospital and is the measure
of the hospital's capital stock; and X is a vector of other variables
that may affect a hospital's costs. In the second equation, ADC is the
hospital's average daily census, REG is a variable denoting the
stringency of CON regulation, HERF is the Herfindahl index of
concentration, and MOP is the number of doctors per capita. s
Note that, in these equations, any effect of CON regulation on
costs must work through the number of beds the hospital operates.
There is no way for CON to have a direct effect on the short run cost
function. According to Mayo and McFarland this is desirable because
they "more realistically recognize that any effects, if they exist, of
CON regulation occur through the effects of the regulation on capital
expansion." Formulating the effect of CON regulation in this way
assumes that hospitals denied approval for a desired project will not
substitute some other expenditure for the one denied. However, a
hospital adds new beds or undertakes other capital projects in order to
improve its quality and its ability to attract physicians and patients.
s Mayo and McFarland are somewhat unclear about whether this variable is the total number of doctors practicing in a market area or physicians per capita. In the text the variable is described as the number of doctors. However, in their Table 1, they define the variable as physicians per capita.
3
If the hospital finds it is not possible to improve its quality by
undertaking certain projects because of CON constraints, they may seek
other, perhaps more expensive or less effective, ways of achieving the
same end. 7
Certificate of Need regulation may also force hospitals to expend
resources in complying with regulatory requirements in order to obtain
project approvals. This could also affect a hospital's costs.
Finally, if CON regulation reduces the competitive pressure on
incumbent hospitals, some of these hospitals may not operate as
efficiently as possible. Clearly, therefore, any study that hopes to
capture the real effects of CON regulation needs to allow for the
possibility that the costs of providing hospital care are affected in
ways other than just through an effect on the number of beds.
Mayo and McFarland's measure of the stringency of Certificate of
Need regulation poses another problem. Their stringency variable is
based on the share of applications that are approved by the CON
authorities. Such a measure would be useful if the total number of
applications filed could be assumed to be ex~genous. Unfortunately,
this is not the case; the number of applications filed can be affected
7 Indeed, previous studies of CON regulation have found evidence consistent with the existence of such substitutions. Salkever and Bice ([16] and [17]) found no significant relationship between total hospital assets and the presence of CON regulation. However, they found that CON was associated with lower levels of new bed construction and higher rates of investment in assets per bed. On net, this suggests a substitution from beds to other forms of capital. Sloan and Steinwald ([21] and [22]) found that hospitals subject to CON regulation tended to have higher employment levels than comparable unregulated hospitals, suggesting a substitution of labor inputs for restricted capital. Similarly, Sherman [18] found that variable costs were significantly higher where CON regulation was more stringent, while CON stringency had no significant effect on total costs.
4

by the CON review process. If hospitals realize that they are unlikely
to receive approval, they may abandon a desirable project even before
filing for CON approval or may withdraw plans prior to a final
decision. Alternatively, an applicant may continually resubmit denied
applications in the hope that the application eventually will be
approved. a Several firms may also file competing applications where
everyone knows that only one project will be approved, or even that the
market can support only one project. When a regulatory system like CON
means that the successful applicant will be able to earn rents -- or
receive a "franchise value" from the project, it would not be
surprising to see competition for project approvals. 9
That Mayo and McFarland only consider hospitals in the State of
Tennessee may create a related problem. Variation in the stringency of
Certificate of Need is obtained by looking at the rate of proj ect
approvals in different health service areas (HSAs) in the state, as
well as looking at variations across time. However, it is not clear
that differences across HSAs in a state are indications of differences
in regulatory stringency. All areas of the state are covered by the
same state CON statute and indeed all CON approvals are made by the
same state agency -- the Tennessee Health Facilities Commission (THFC).
Further, the decisions of the THFC can be appealed in the courts,
a See Joskow [9], p. 98.
9 See In the Matter of Hospital Corporation of America, Opinion of the Federal Trade Commission, 106 F.T.C. 361 at 495 (1985).
5

requiring that the THFC make decisions in a consistent fashion if they
wish to avoid being overturned. 10 • 11
III. Respecification and Reestimation of the Mayo and McFarland model
In this section, we report the results of reestimating the Mayo-
McFarland model allowing for the possibility that hospitals substitute
other expenditures when the CON authority disallows a project. We use
the same model as Mayo and McFarland, except where differences are
10 For a brief discussion of the CON approval process in Tennessee, see In the Matter of Hospital Corporation of America, Opinion of the Federal Trade Commission, 106 F.T.C. 361 at 490 (1985).
It is possible that local boards within each HSA made recommendations concerning project approvals to the THFC during part of the period covered by Mayo and McFarland's data. While neither the current Tennessee CON statute nor the statute in place in 1985 appear to provide a role for such local boards (106 F.T.C. 361 at 490 (1985) and Tenn. Code Annotated 68-11-101 to 111 (1987», the federal statute mandating CON appears to have required such boards. (Joskow [9], p. 80) However, since final decisions were made by state agencies and were subj ect to court review, it is unlikely that the presence of these boards should have caused significant regional differences in final decisions.
11 Another, less serious, problem results from the approach used by Mayo and McFarland to account for changes in hospital -utilization that resulted from the adoption of a prospective payment system (PPS) for hospital payments under Medicare in 1983. Mayo and McFarland introduce a dummy variable (DRG) into their short-run cost equation that shifts the total variable costs of each hospital by a constant amount. According to their estimated cost equation, the costs of each hospital increased by $1.7 million after the PPS system was introduced. However, it seems unlikely that the effect of such a change was independent of hospital size or the number of patients treated. Indeed, the evidence suggests that the greatest impact of the shift to PPS was a reduction in the average length of stay in the hospital. (See American Hospital Association [1]) Since patients probably require more intensive, and therefore more costly, care during the first days of hospitalization, the best way to treat the effect of PPS on hospital cost is to interact the dummy variable with the days of care provided. At a minimum, one should differentiate the effect based on the size of the hospital -- i.e., the number of beds in the hospital.
6

noted. 12 The most important difference is that we allow the short run
cost function to be affected by CON regulation. Further, we examine
the effects of CON using variations across states, where variations can
clearly occur, and using a variable of CON stringency which avoids the
problem of the endogeneity of the number of applications filed.
The cost data used here are for 3,680 short- term general acute
care hospitals for the 12 month period ending September 1984. 13 Our
measure of CON stringency is the number of years that CON had been in
place in a state. 14 This variable is denoted CONAGE. We would readily
admit that this measure does not capture all of the variation in the
effects of CON across states. However, it does capture one important
aspect of stringency: If CON regulation is restricting hospital
behavior we would expect the effect to increase the longer the
12 In particular, we follow their practice of using only a single measure of hospital outputs. This is done for consistency with their work rather than because we necessarily believe it is the appropriate way to measure hospital outputs.
13 The dataset was developed by Sherman for his study of the effects of CON [18]. There were 3,716 hospitals included in the Sherman dataset. However, on examination, it appeared that data for a few hospitals was either misreported or miscoded. (Similar errors seem to arise in Mayo and McFarland's data, though nothing appears to have been done about the problem. Mayo and McFarland report the minimum value for their WAGE variable as $122.88, hardly a plausible value for an average annual wage.) Because such errors appeared to be present, we eliminated a few observations. Specifically, we eliminated hospitals where the reported average annual salary for nurses was less than $7,000 or more than $50,000. Similarly, we deleted observations where average variable cost per patient day was less than $100 or more than $900. Our results, however, would not have differed in any significant way if these observations had not been eliminated.
14 This data is taken from Simpson [19]. While Idaho and New Mexico ended CON regulation of hospitals during 1983, the measure of CON stringency for hospitals in these states does not reflect this change since any repeal in CON laws would take several years to affect hospital performance.
7

regulations have been in effect. Further, our measure avoids the
problems with the Mayo and McFarland measure discussed above.
We enter the effect of CON regulation into our cost function both
linearly and mUltiplied by the number of patient days of care provided.
It seems reasonable to assume that any effect of CON will be greater in
larger hospitals. This formulation allows for such an effect.
Other variables in our model are generally defined similarly to
those used by Mayo and McFarland, though they differ in minor ways.
Our wage variable is the average wage of nurses in a particular
institution, rather than the average wage of all employees .15 By
reducing the types of employees included in the wage measure, we should
reduce the amount of variation resulting because different hospitals
use types of employees in different proportions. Our beds variable is
the average number of beds set up and staffed, rather than the number
of licensed beds. Our variables differentiating types of hospitals
follow Sherman [18] and differ from those used by Mayo and McFarland.
These variables -- PROFIT, NONFED, TEACH1, TEACH2, and TEACH3 -- are
defined, along with the other variables in our model in Table 1.
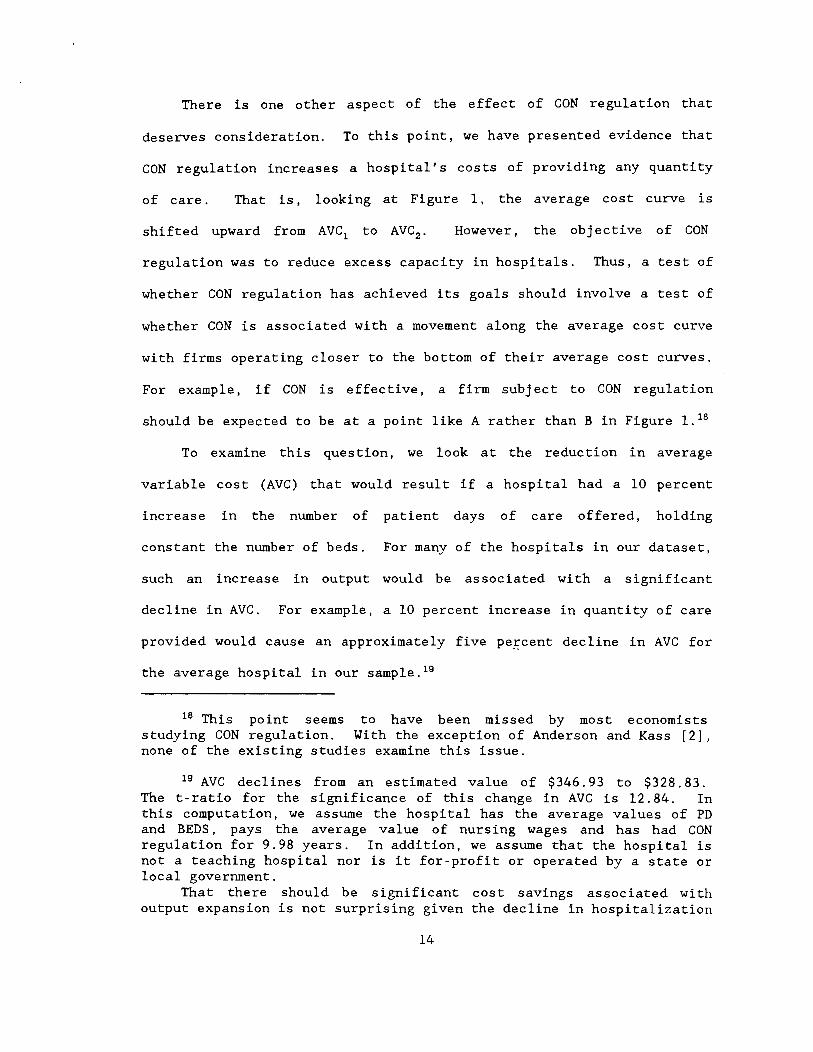
Our results are reported in Table 2 for the cost equation and in
Table 3 for the beds equation. Looking first at the cost equation, CON
regulation is found to have a significant effect on hospital variable
costs. Variable costs are increased by more than $175,000 plus about
15 Our wage variable is calculated as total nursing wages paid by the hospital divided by the sum of full time equivalent registered nurses (RNs) plus full time equivalent licensed practical nurses (LPNs). Full time equivalents are equal to the sum of full time nurses plus one-half of part time nurses.
8

Table 1
Description of Variables
Variable Description
ADC Average daily census of the hospital.
BEDS The average number of beds staffed and
operated by the hospital.
CONAGE The number of years since a state enacted
its first CON statute.
HERF The Herfindahl measure of concentration
in a Health Service Area (HSA) , based on
the average number of beds set up and
staffed during the year.
MOP
NONFED
PD
PROFIT
TEACH 1
TEACH2
Physicians per capita.
A variable equal to one if a hospital is
operated by a state or local government;
otherwise equal to zero.
Adjusted patient days of care provided by
the hospital.
A variable equal to one if a hospital is
operated by a for-profit firm; otherwise
equal to zero.
A variable equal to one if a hospital has
an approved residency program but is not
affiliated with a medical school;
otherwise equal to zero.
A variable equal to one if a hospital is
associated with a medical school but is
not a member of the Council of Teaching
Hospitals (COTH); otherwise equal to zero.
tl!!!!
125.80
183.21
9.98
0.1137
0.0019
0.2696
53926.33
0.1196
0.0144
0.0927
9
Standard
~ Maximum Deviation
2 1306 143.22
6 1846 179.03
0 20 4.13
0.0228 1.0000 0.0739
0.0011 0.0056 0.0005
721 54117 61028.77
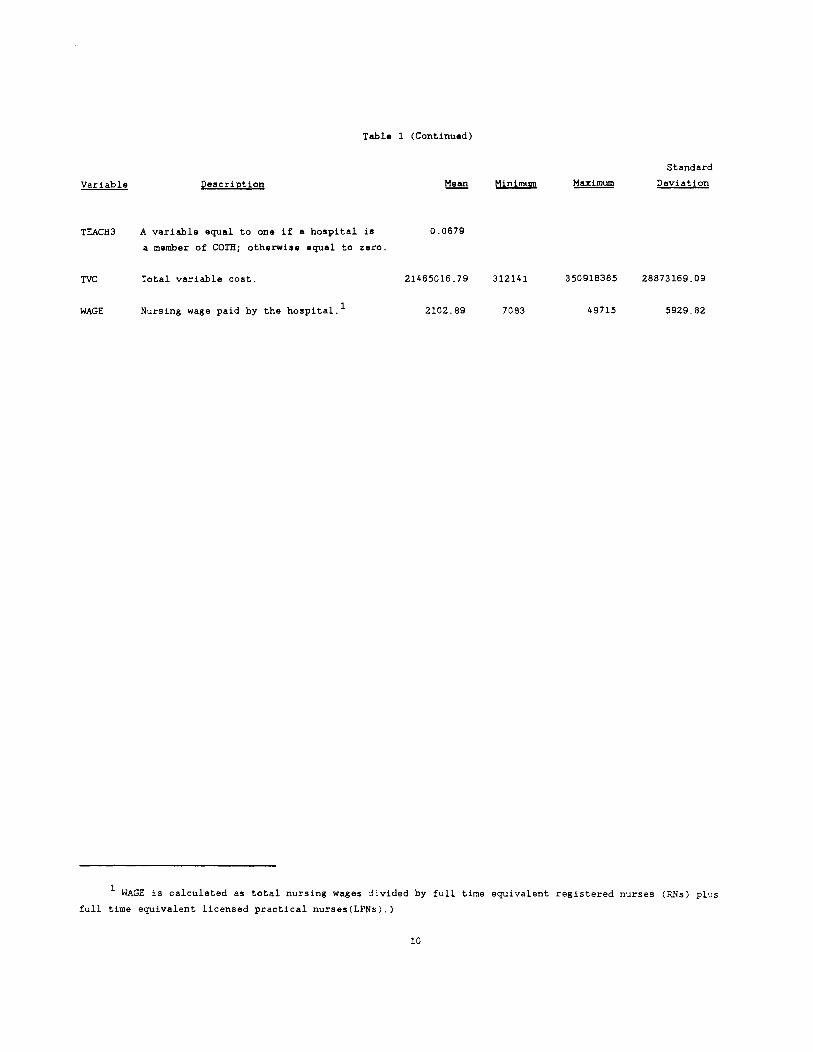
Table 1 (Continued)
Standard
Variable Description t:1!!!l Minimum Maximum Deviation
TEACH3 A variable equal to one if a hospital is 0.0679
a member of COTH; otherwise equal to zero.
TIC Total variable cost. 21465016.79 312141 350918385 28873169.09
WAGE NurSing wage paid by the hospital. 1 2102.89 7083 49715 5929.82
1 WAGE is calculated as total nursing wages divided by full time equivalent registered nurses (RNs) plus
full time equivalent licensed practical nurses(LPNs).)
10
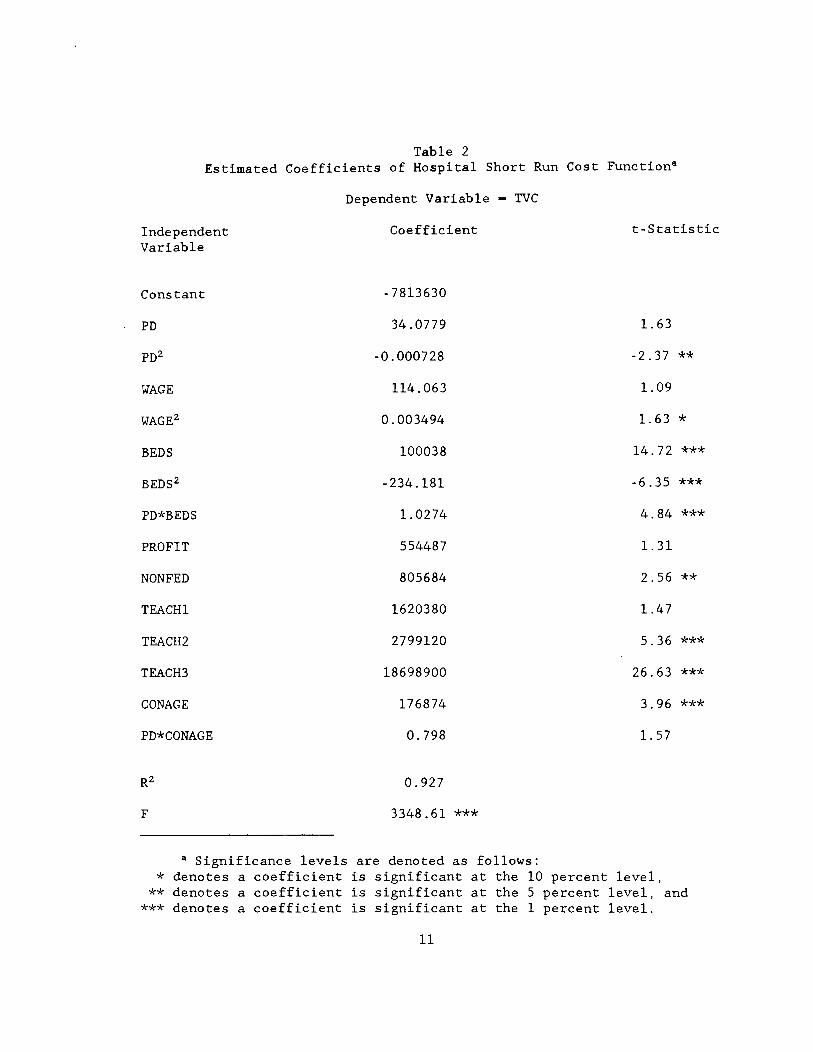
Table 2 Estimated Coefficients of Hospital Short Run Cost Functiona
Independent Variable
Constant
PD
"WAGE
BEDS
PD*BEDS
PROFIT
NONFED
TEACHl
TEACH2
TEACH3
CONAGE
PD*CONAGE
F
Dependent Variable - TVC
Coefficient
- 7813630
34.0779
-0.000728
114.063
0.003494
100038
-234.181
1. 0274
554487
805684
1620380
2799120
18698900
176874
0.798
0.927
3348.61 ***
a Significance levels are denoted as follows:
t-Statistic
1. 63
-2.37 **
1.09
1. 63 *
14.72 ***
-6.35 ***
4.84 ***
1. 31
2.56 **
1.47
5.36 ***
26.63 ***
3.96 ***
1. 57
* denotes a coefficient is significant at the 10 percent level, ** denotes a coefficient is significant at the 5 percent level, and
*** denotes a coefficient is significant at the 1 percent level.
11
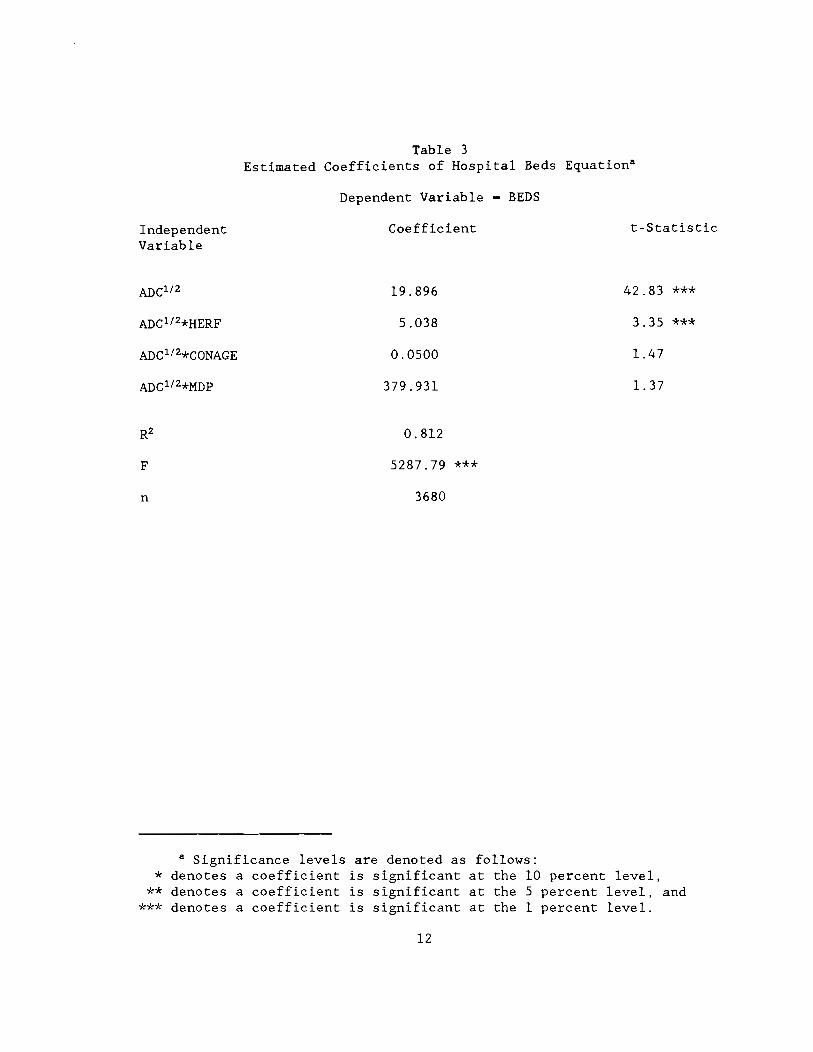
Table 3 Estimated Coefficients of Hospital Beds EquationS
Dependent Variable - BEDS
Independent Variable
Coefficient t-Statistic
19.896 42.83 ***
5.038 3.35 ***
0.0500 1.47
379.931 1. 37
0.812
F 5287.79 ***
n 3680
a Significance levels are denoted as follows: * denotes a coefficient is significant at the 10 percent level,
** denotes a coefficient is significant at the 5 percent level, and *** denotes a coefficient is significant at the 1 percent level.
12
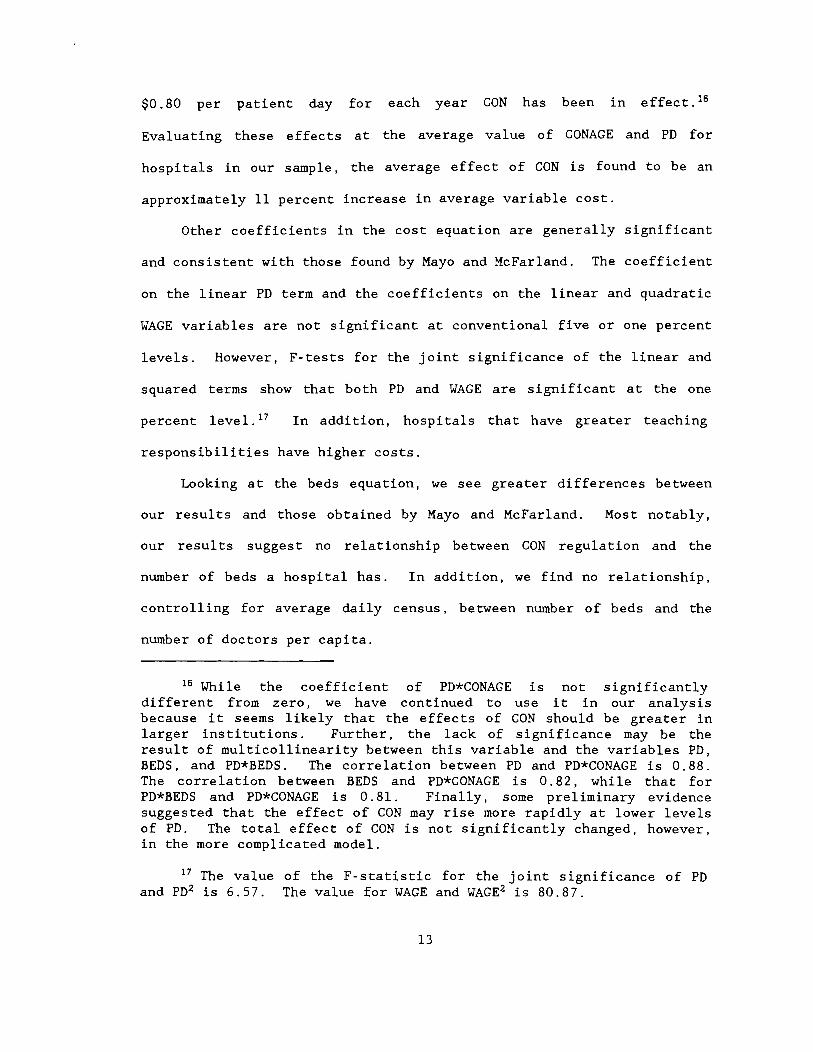
$0.80 per patient day for each year CON has been in effect. 16
Evaluating these effects at the average value of CONAGE and PD for
hospitals in our sample, the average effect of CON is found to be an
approximately 11 percent increase in average variable cost.
Other coefficients in the cost equation are generally significant
and consistent with those found by Mayo and McFarland. The coefficient
on the linear PD term and the coefficients on the linear and quadratic
WAGE variables are not significant at conventional five or one percent
levels. However, F-tests for the joint significance of the linear and
squared terms show that both PD and WAGE are significant at the one
percent level. 17 In addition, hospitals that have greater teaching
responsibilities have higher costs.
Looking at the beds equation, we see greater differences between
our results and those obtained by Mayo and McFarland. Most notably,
our results suggest no relationship between CON regulation and the
number of beds a hospital has. In addition, we find no relationship,
controlling for average daily census, between number of beds and the
number of doctors per capita.
16 While the coefficient of PD*CONAGE is not significantly different from zero, we have continued to use it in our analysis because it seems likely that the effects of CON should be greater in larger institutions. Further, the lack of significance may be the result of multicollinearity between this variable and the variables PD, BEDS, and PD*BEDS. The correlation between PD and PD*CONAGE is 0.88. The correlation between BEDS and PD*CONAGE is 0.82, while that for PD*BEDS and PD*CONAGE is 0.81. Finally, some preliminary evidence suggested that the effect of CON may rise more rapidly at lower levels of PD. The total effect of CON is not significantly changed, however, in the more complicated model.
17 The value of the F-statistic for the joint significance of PD and PD2 is 6.57. The value for WAGE and WAGE2 is 80.87.
13
There is one other aspect of the effect of CON regulation that
deserves consideration. To this point, we have presented evidence that
CON regulation increases a hospital's costs of providing any quantity
of care. That is, looking at Figure 1, the average cost curve is
shifted upward from AVC1 to AVC2 • However, the obj ective of CON
regulation was to reduce excess capacity in hospitals. Thus, a test of
whether CON regulation has achieved its goals should involve a test of
whether CON is associated with a movement along the average cost curve
with firms operating closer to the bottom of their average cost curves.
For example, if CON is effective, a firm subj ect to CON regulation
should be expected to be at a point like A rather than B in Figure 1.18
To examine this question, we look at the reduction in average
variable cost (AVC) that would result if a hospital had a 10 percent
increase in the number of patient days of care offered, holding
constant the number of beds. For many of the hospitals in our dataset,
such an increase in output would be associated with a significant
decline in AVC. For example, a 10 percent increase in quantity of care
provided would cause an approximately five pe~cent decline in AVC for
the average hospital in our sample. 19
18 This point seems to have been missed by most economists studying CON regulation. With the exception of Anderson and Kass [2], none of the existing studies examine this issue.
19 AVC declines from an estimated value of $346.93 to $328.83. The t-ratio for the significance of this change in Ave is 12.84. In this computation, we assume the hospital has the average values of PD and BEDS, pays the average value of nursing wages and has had CON regulation for 9.98 years. In addition, we assume that the hospital is not a teaching hospital nor is it for-profit or operated by a state or local government.
That there should be significant cost savings associated with output expansion is not surprising given the decline in hospitalization
14

Figure 1
Average Variable Cost
----------~-. ---------------"..>-
PD
15

To determine whether more stringent eON regulation is associated
with hospitals operating at a more efficient point on their Ave curve,
we estimated the change in predicted AVe that would result from a 10
percent increase in output for each hospital in the sample (dAve).
These estimated changes were then correlated with our measure of eON
stringency (eONAGE). If eON is effective in inducing hospitals to
operate at a more efficient point on their AVe curves, there should be
a significant negative correlation between eONAGE and dAVe, as
hospitals that had been subject to eON regulation for a longer period
of time would have smaller gains from increases in output. However,
the correlation between eONAGE and dAVe is a positive 0.163. On
average, hospitals in states that have had eON laws longer would gain
more, not less, from an increase in the number of patient days of care
provided. Thus, our data provides no support for the hypothesis that
stringent eON regulation is effective in achieving more of available
short run economies of scale in hospitals.
in the United States in the last ten years. Between 1975 and 1986, per capita days of hospital care fell by more than one-third. As a result, hospital occupancy rates are quite low. The average occupancy rate for the hospitals in our sample is only 59.1 percent. Less than two percent of the hospitals were operating at more than 90 percent of capacity.
The low occupancy rates may be responsible for one strange attribute of our estimated cost function. Because of the negative sign on the coefficient of the square of patient days, the estimated cost function has no minimum value. Rather, it continues to fall as output rises. (The cost function estimated by Mayo and McFarland also has a negative coefficient on this parameter.) The failure to estimate a function with a minimum may be the result of the few observations in the range where capacity constraints would cause average variable costs to turn upward.
16
IV. Conclusion
In this paper, we have pointed out several problems with the
approach used by Mayo and McFarland in attempting to estimate the
effectiveness of Certificate of Need regulation. When we attempt to
rectify these problems and reestimate the effects of these regulations,
we get results that differ substantially from those reported by Mayo
and McFarland: Rather than finding that CON is effective in containing
health care costs, we find that costs are higher where CON is more
stringent. Further, we find no evidence that more stringent CON
regulation is associated with greater realization of available
economies of scale.
Our finding that variable costs are higher where CON regulation is
more stringent is consistent with earlier findings and therefore we
have no reason to doubt the correctness of this result. On the other
hand, there may be some reason to question our finding that CON has not
been effective in reducing the number of hospital beds. As we noted,
hospitalization rates have fallen dramatically in recent years and
therefore hospital occupancy rates are generally quite low. In such an
environment, it is unlikely that the maj ori ty of hospitals would be
seeking approval to add new capacity. Thus, while CON may be limiting
bed construction in particular areas where hospitals wish to undertake
new construction, there may be no general effect detectable with a
cross-sectional regression analysis. This may explain why we find no
effect of CON stringency on the quantity of beds, whereas earlier
researchers have found that CON may be effective in this area.
17

Bibliography
l. American Hospital Association, "Statement of the American Hospital Association before the Subcommittee on Health of the Committee on Ways and Means of the United States House of Representatives on Medicare Capital Payments," March 13, 1989.
2. Anderson, Keith B., and David 1. Kass, Certificate of Need Regulation of Entry into Home Health Care: A Multi-product Cost Function Analysis, Bureau of Economics Staff Report to the Federal Trade Commission, January 1986.
3. Coelen, Craig, and Daniel Sullivan (1981), "An Analysis of the Effects of Prospective Reimbursement Programs on Hospital Expenditures," Health Care Financing Review, Winter 1981, pp. 1-40.
4. Cohodes, D.R., Institutional Response to Certificate of Need and Hospitals, Unpublished PhD Harvard University School of Public Health, January 1980.
Regulation: Dissertation,
5. Eastaugh, Steven, (1982), "The Effectiveness of Community-based Hospital Planning: Some Recent Evidence," Applied Economics, October 1982, pp. 475-490.
6. Farley, Dean A., and Joyce V. Hospitals' Financial Positions, National Research, 1985.
Kelly, Center
The Determinants of for Health Services
7. Hellinger, F.J., "The Effect of Certificate-of-Need Legislation on Hospital Investment," Inquiry, June 1976, pp. 187-193.
8. Joskow, Paul L., "The Effects of Competition and Regulation on Hospital Bed Supply and the Reservation Quality of the Hospital," The Bell Journal of Economics, Autumn 1980, pp. 421-447
9. , Controlling Hospital Costs: The Role of Government Regulation, MIT Press, 1981.
10. Kimmey, James R., "Capital Expenditure Regulation Under Medicare," Testimony Before the Health Subcommittee of the Ways and Means Committee of the U.S. House of Representatives, March 13, 1989.
1l. Lee, A. James, Howard Birnbaum, and Christine Bishop, "How Nursing Homes Behave: A Multi-Equation Model of Nursing Home Behavior," Social Science and Medicine, 1983, pp. 1897-1906.
12. Mayo, John W., and Deborah A. McFarland, "Regulation, Market Structure, and Hospital Costs," Southern Economic Journal, January 1989, pp. 559-569.
18
13. Noether, Monica, Competition Among Hospitals, Federal Trade Commission, Bureau of Economics Staff Report, 1987.
14. "Competition Among Hospitals," Journal of Health Economics, 1988, pp. 259-284.
15. Policy Analysis, Inc., and Urban Systems Research and Engineering, Inc., Evaluation of the Effects of Certificate of Need Programs, HRA #231-77-0144, Department of Health and Human Services, 1980.
16. Salkever, David S. and T.W. Bice, "The Impact of Certificate of Need Controls on Hospital Investment," Milbank Memorial Fund Quarterly, Spring 1976, pp. 185-214.
17. Hospital Certificate of Need Controls: Impact on Investment, Costs, and Use, American Enterprise Institute, 1979.
18. Sherman, Daniel, The Effect of State Certificate-of-Need Laws on Hospital Costs: An Economic Policy Analysis, Bureau of Economics, Federal Trade Commission, January 1988.
19. Simpson, James B., "Full Circle: The Return of Certificate of Need Regulation of Health Facilities to State Control," Indiana Law Review, 1986, pp. 1025-1127.
20. Sloan, Frank A., "Regulation and the Rising Cost of Hospital Care," Review of Economics and Statistics, November 1981, pp. 479-487.
21. Sloan, Frank A., and Bruce Steinwald, "Effects of Regulation on Hospital Costs and Input Use," Journal of Law and Economics, April 1980, pp. 81-109.
22. ~ ______ ' Insurance, Regulation, and ijpspital Costs, Lexington Books, 1980.
19