regulated emissions of a euro 5 passenger car measured ...€¦ · european commission joint...
TRANSCRIPT

EUROPEAN COMMISSION JOINT RESEARCH CENTRE Institute for Environment and Sustainability
Regulated emissions of a Euro 5 passenger car measured over
different driving cycles

Table of contents
1 EXECUTIVE SUMMARY ........................................................................................ 3
1.1 Rationale and objectives ................................................................................... 3
1.2 Experimental set-up .......................................................................................... 3
1.3 Results............................................................................................................... 4
2 EXPERIMENTAL SET-UP ....................................................................................... 5 2.1 Test vehicle ....................................................................................................... 5
2.2 Emissions measurement.................................................................................... 6
2.3 Test fuel ............................................................................................................ 7
2.4 Driving cycles ................................................................................................... 8
2.5 Test sequence .................................................................................................. 11
2.6 Fuel consumption measurement ..................................................................... 11
3 RESULTS ................................................................................................................. 12 3.1 Results by CVS ............................................................................................... 12
3.2 Second-by-second (modal) data...................................................................... 15
4 CONCLUSIONS ...................................................................................................... 22

1 EXECUTIVE SUMMARY
1.1 Rationale and objectives
This testing matrix was conducted in order to investigate if a faster / alternative method can be found to establish a common global vehicle test speed trace for the WLTP emission laboratory test cycle. An investigation was carried out with a modern passenger car, propelled with a PI internal combustion engines, that was tested over three different test cycle.. The primary objectives of the experimental activity described in this report were:
• To identify worst case conditions (highest contribution to cumulative emissions) within the different test cycles: the contribution of dynamics (accelerations, decelerations, steady states, idle), cold start, maximum tested steady state vehicle speed etc.
• To investigate if it would be possible to use an existing international agreed testing cycle
like the WMTC as starting point for the WLTP as alternative to start developing this new test cycle for passenger cars by collecting data in different global regions under random traffic conditions.
1.2 Experimental set-up
The tests were performed in an emission test facility consisting of a climatic chamber, a “chassis dynamometer” and an emission measuring system complying with the European legislative requirements for type approval of passenger cars.
The test vehicle was a recent passenger cars complying with the Euro 5 emission standards.
The methodology followed to measure the exhaust emissions and fuel consumption was based on the current legislative procedure for type approval of passenger cars.
Three different test cycles were used in this investigation:
o New European Driving Cycle (NEDC)for passenger cars
o European Driving Cycle (EDC) for motorcycles
o Worldwide harmonized test cycle for motorcycles (WMTC)
1.3 Results
The results have shown that in general the cold start and the high speed sections of the investigated cycles represent the most critical part for the gaseous pollutants. In particular, HC emissions are dominated by the cold start while for CO and NOx also the high speed sections provide important contributions. NOx emissions may be created during sharp accelerations as engine load and combustion temperatures are high.
The distance specific emissions measured over the NEDC and EDC cycles were very similar, while the emission levels for HC, CO and NOx measured over the WMTC resulted to be different (significantly lower HC, comparable NOx and CO). CO2 emissions were instead similar for all the cycles.
In assessing the results obtained over the WMTC cycle in terms of distance specific emissions it has to be taken into account that the distance covered running this cycle is significantly longer than the other two cycles. This compensates, at least partially, the higher emissions in terms of mass.

2 EXPERIMENTAL SET-UP
The emission tests were carried out following the general principles of the type approval procedure for passenger cars as prescribed by the European legislation on emissions. An emission test facility fully complying with the requirements set by the regulation for type approval was used. The facility consists of a climatic chamber, a roller bench and the equipment for emission measurement. The details of the experiment are given in the following chapters.
2.1 Test vehicle
The test vehicle was a passenger car complying with the Euro 5 emission standards. The main data of the vehicle are listed here below (Table 1).Table 1 : Test vehicle
Table 1 : Test vehicle Vehicle Type Passenger car 1 Emission level Euro 5 Engine Petrol Category M1 Displacement (cm3) 1242 Max. Power (kW) 51 Inertia Class (kg) 1020 Cylinder 4 Aspiration Naturally Aspirated Combustion Type Homogeneous
stoichiometric Injection System MPI After-treatment device Three Way Catalyst Year (registration date) 2009 Odometer reading (km) 13501

2.2 Emissions measurement
The facility used in this study complies with the requirement of the emission legislation for passenger car type approval and is equipped with a Constant Volume Sampling (CVS) system (a schematic layout of the emission test facilities is illustrated in Figure 1). According to the principle of the CVS system the exhaust gas is conveyed into a dilution tunnel and diluted with fresh air properly treated (in order to control its temforature and humidity and to reduce the background level of contaminants). The dilution air treatment unit comprises three filters (Absolute filter + activated carbon scrub + Hepa filter) and an air conditioning unit. The total flow of diluted exhaust in the dilution tunnel is kept to a constant level by means of a critical flow Venturi. The flow can be adjusted within a certain range depending on the flow of the exhaust and the emission levels of the vehicle. For petrol vehicles the regulated gaseous emissions (HC, CO and NOx) were measured using the bags as prescribed by the legislation. This means that a constant volume sample of the exhaust is collected in “Tedlar” bags during the test and the concentration of each pollutant measured inside these bags at the end of the test. The background level is determined by analyzing a sample of the dilution air collected in other bags. For the diesel vehicle, in agreement with the legislative procedure, the HC emissions were measured using an on-line heated FID analyzer sampling directly from the dilution tunnel. The concentration of the gaseous pollutants inside the bags was measured using the following analyzers calibrated daily:
- CO: IR analyser.
- NOx: chemiluminescence analyser.
- HC: FID analyser (heated on-line FID for the diesel vehicle)
- CO2: IR analyser
In addition to the bag measurements the pollutant concentration in the raw exhaust was also continuously measured by means of dedicated analyzers. For this purpose the exhaust pipe was fitted with a sampling probe in order to take a small sample of the exhaust gas and to perform the second-by-second measurement. The second-by-second concentration values of each pollutant can be then used to calculate its total mass over the whole test if the exhaust flow rate is known. In this facility 1 the exhaust flow rate is instead calculated by subtracting the second-by-second flow rate of the dilution air (measured by means of a flowmeter) from the second-by-second total flow in the dilution tunnel. The roller bench was of the single roller type and the dynamometer settings were adjusted following the procedure prescribed by the legislation. To ensure consistent performance across all tests, the driver was assisted by a driver aid system.
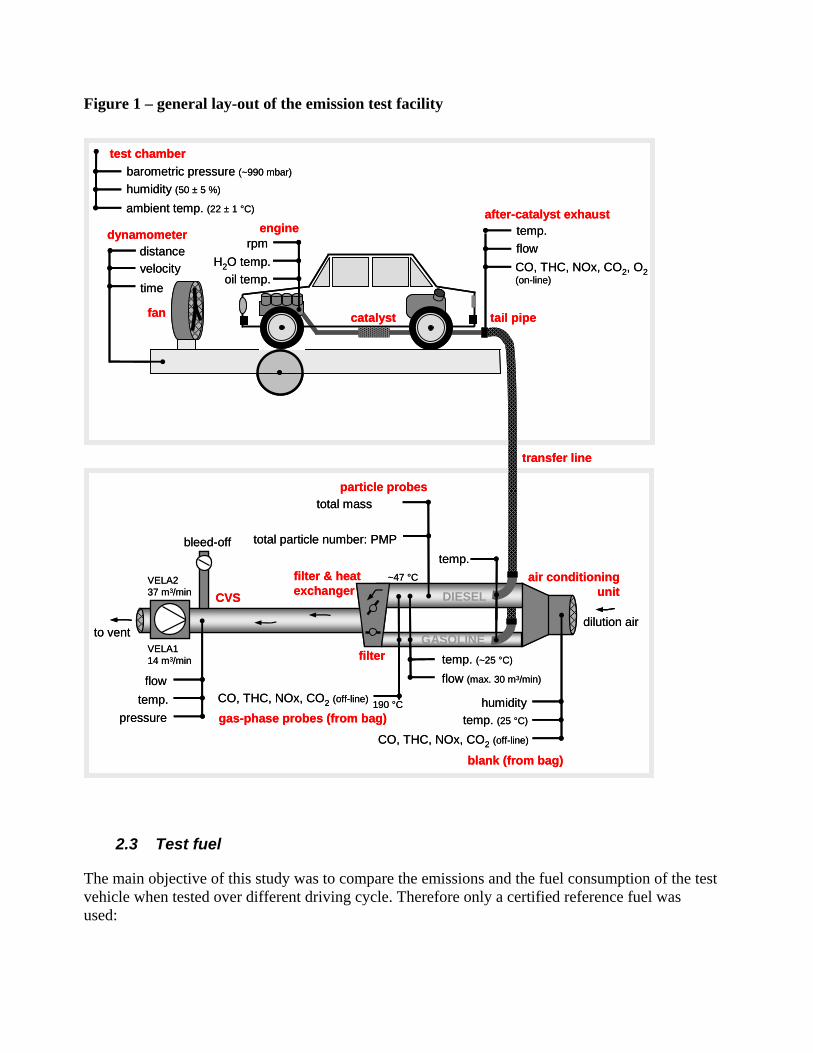
Figure 1 – general lay-out of the emission test facility
air conditioningunit
filter & heat exchanger
dilution air
fan
dynamometer
transfer line
particle probes
velocitytime
temp.flow
catalyst
CO, THC, NOx, CO2, O2(on-line)
ambient temp. (22 ± 1 °C)
engine
oil temp.H2O temp.
after-catalyst exhaust
tail pipe
temp. (~25 °C)
total mass
VELA237 m3/min
to vent
CVS
gas-phase probes (from bag)
bleed-off
flow (max. 30 m3/min)
CO, THC, NOx, CO2 (off-line)
temp. (25 °C)
humidityCO, THC, NOx, CO2 (off-line)
total particle number: PMP
rpm
humidity (50 ± 5 %)
barometric pressure (~990 mbar)
test chamber
VELA114 m3/min
~47 °C
blank (from bag)
temp.
190 °C
filter
DIESEL
GASOLINE
distance
pressuretemp.
flow
2.3 Test fuel
The main objective of this study was to compare the emissions and the fuel consumption of the test vehicle when tested over different driving cycle. Therefore only a certified reference fuel was used:

1. CEC RF-02-99 Gasoline Reference fuel
The main properties of the test fuel are described in Error! Reference source not found.4.
Table 2 : Test fuel
Property Unit Petrol CEC RF-02-99
Density @ 15 C kg/l 0.7592
Sulphur Content Mg/kg <10
Octane Number RON 99.2
Octane Number MON 87.5
DVPE kPa 59.8
Distillation Initial Boiling Point ° C 35.5
Evaporated @ 100 ° C % vol 51.6
Evaporated @ 150 ° C % vol 84.8
Final Boiling Point ° C 193.5
Aromatics % v/v 29.6
Olefins % v/v 4.2
Benzene % v/v 0.2
Oxygenates % v/v 4.9
Oxygen content % m/m 0.9
2.4 Driving cycles
The vehicle was tested over three different driving cycles: − New European Driving Cycle (NEDC)for passenger cars
− European Driving Cycle (EDC) for motorcycles
− Worldwide harmonized test cycle (WMTC)

The NEDC test is the standard emissions test in the EU which is used to determine whether a new model of light duty vehicle meets applicable EC environmental regulations. The NEDC cycle (2) is divided into two parts, the first part (Part 1 or ECE15) simulates the driving conditions in an urban area. The second part (Phase 2 or EUDC) simulates the driving conditions in extra-urban areas. The second part of the test commences after 780 seconds.
The EDC cycle (Figure 3) is one of the possible European legislative test cycles prescribed for motorcycle type approval, alternatively the WMTC may be used. It differs from the NEDC only for the length of the Part 1 of the cycle simulating urban driving conditions. In the NEDC cycle the base ECE15 cycle is repeated four times while in the EDC there are six repetitions of the ECE15 cycle (compare Figure 2 and Figure 3).
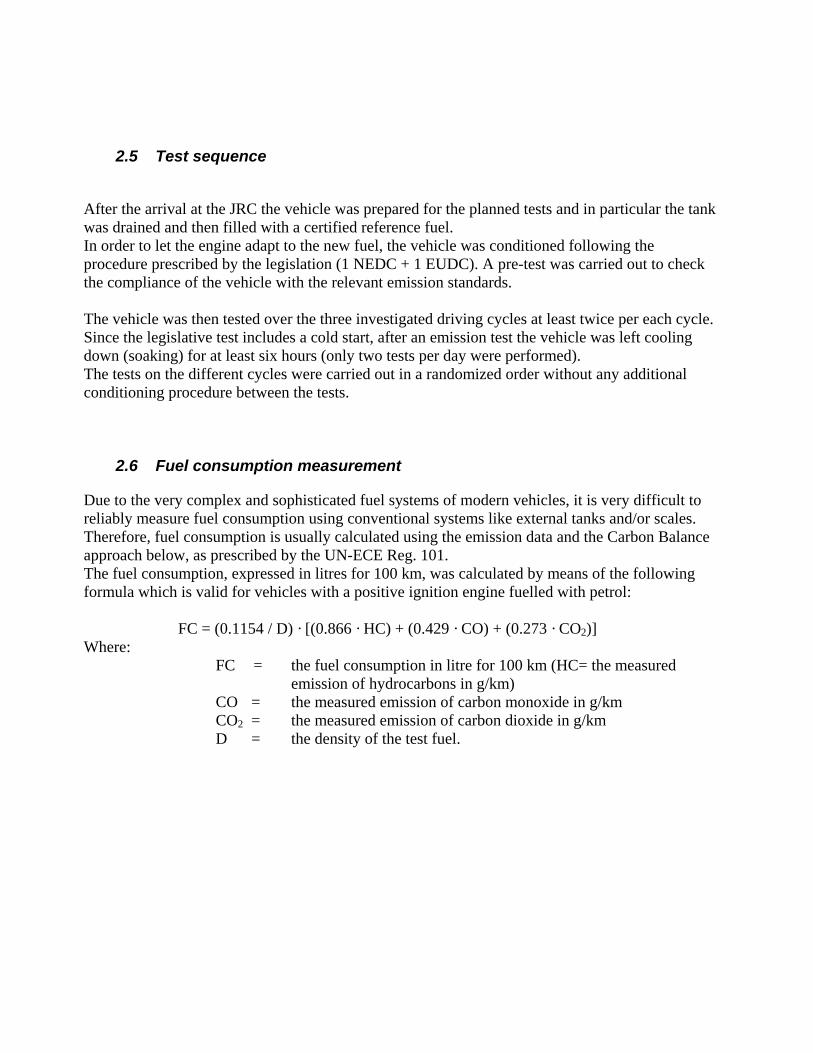
Finally, the WMTC cycle (Figure 4) has been developed in the framework of the legislative process aiming at the global harmonization of emission legislation. It is completely different from the other two cycles used in this study and in particular is much more dynamic.
In these tests it was decided to split each cycle into two or three phases as shown in the relevant figure. The distance specific emissions were measured separately for each phase by using dedicated bags.
Figure 2 – NEDC cycle
NEDC Cycle - Phases
0
20
40
60
80
100
120
140
0 200 400 600 800 1000 1200Time (s)
Spee
d (k
m/h
)
PHASE 1 PHASE 2
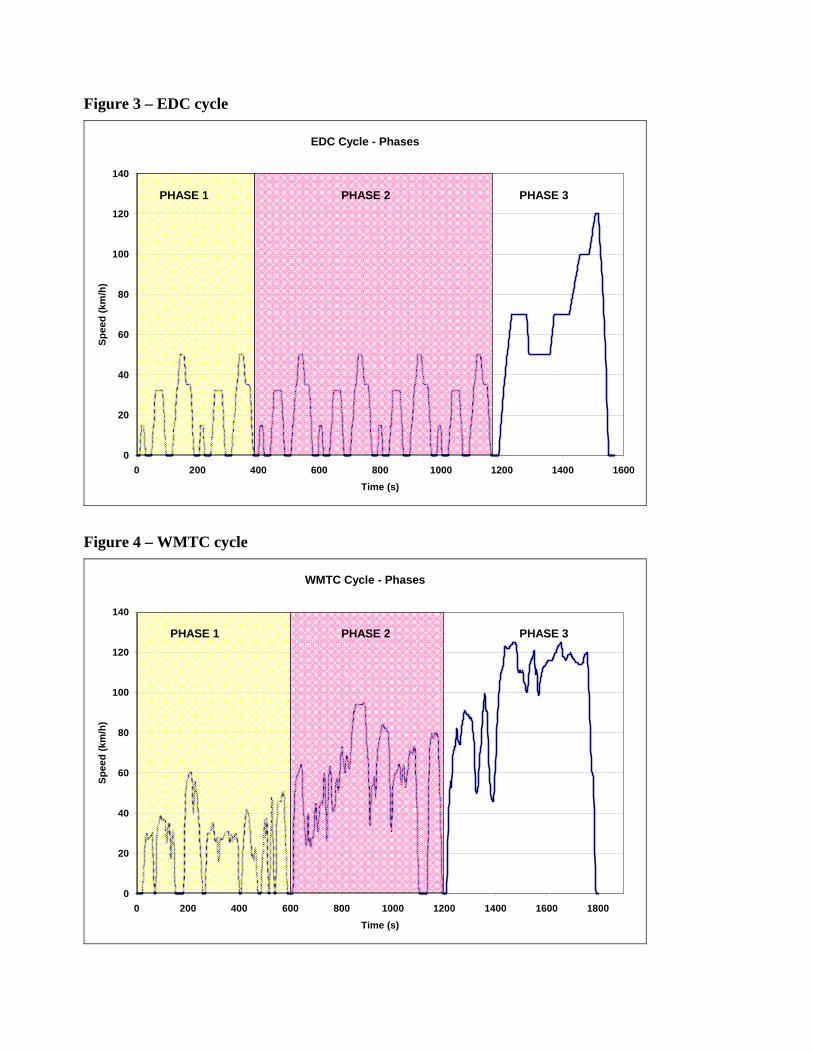
Figure 3 – EDC cycle
EDC Cycle - Phases
0
20
40
60
80
100
120
140
0 200 400 600 800 1000 1200 1400 1600Time (s)
Spee
d (k
m/h
)
PHASE 1 PHASE 2 PHASE 3
Figure 4 – WMTC cycle
WMTC Cycle - Phases
0
20
40
60
80
100
120
140
0 200 400 600 800 1000 1200 1400 1600 1800Time (s)
Spee
d (k
m/h
)
PHASE 1 PHASE 2 PHASE 3
2.5 Test sequence
After the arrival at the JRC the vehicle was prepared for the planned tests and in particular the tank was drained and then filled with a certified reference fuel. In order to let the engine adapt to the new fuel, the vehicle was conditioned following the procedure prescribed by the legislation (1 NEDC + 1 EUDC). A pre-test was carried out to check the compliance of the vehicle with the relevant emission standards. The vehicle was then tested over the three investigated driving cycles at least twice per each cycle. Since the legislative test includes a cold start, after an emission test the vehicle was left cooling down (soaking) for at least six hours (only two tests per day were performed). The tests on the different cycles were carried out in a randomized order without any additional conditioning procedure between the tests.
2.6 Fuel consumption measurement
Due to the very complex and sophisticated fuel systems of modern vehicles, it is very difficult to reliably measure fuel consumption using conventional systems like external tanks and/or scales. Therefore, fuel consumption is usually calculated using the emission data and the Carbon Balance approach below, as prescribed by the UN-ECE Reg. 101. The fuel consumption, expressed in litres for 100 km, was calculated by means of the following formula which is valid for vehicles with a positive ignition engine fuelled with petrol: FC = (0.1154 / D) · [(0.866 · HC) + (0.429 · CO) + (0.273 · CO2)] Where: FC = the fuel consumption in litre for 100 km (HC= the measured
emission of hydrocarbons in g/km) CO = the measured emission of carbon monoxide in g/km CO2 = the measured emission of carbon dioxide in g/km D = the density of the test fuel.

3 RESULTS
3.1 Results by CVS
The average emissions measured with the test car over the three different driving cycles are given in Table 3. The summary figures below include samples collected from tailpipe exhaust using the constant volume sampling method. Three or four different values are given for each cycle: the distance specific emissions measured over the two or three phases in which the cycles were split into and the value for the whole cycle (Combined value). The latter value corresponds to the sum, weighed on the distance, of the emissions measured over the two or three phases of the cycle. In addition to the distance specific emissions, the average mass of the pollutants expressed in grams is given as well for each phase.
Table 3: Passenger car 1 (Petrol): Distance specific emissions and emission mass measured over the three different cycles (average of two tests)
NEDC EDC WMTC
Phase 1 Average Mass (g)
Average distance specific
emissions (mg/km)
Pollutants as
percent. of CO2 (=100%)
Average Mass (g)
Average distance specific
emissions (mg/km)
Pollutants as
percent. of CO2 (=100%)
Average Mass (g)
Average distance specific
emissions (mg/km)
Pollutants as
percent. of CO2 (=100%)
HC 0.39 96.5 0.06% 0.41 207.0 0.12% 0.41 101.0 0.07% CO 2.01 502.5 0.30% 1.80 901.5 0.50% 1.90 463.5 0.32% NOx 0.11 26.5 0.02% 0.10 50.0 0.03% 0.26 63.0 0.04%
CO2 667.4 166.8 g/km 100% 358.3 179.1
g/km 100% 599.3 146.2 g/km 100%
FC l/100km 7.05 7.61 6.18 Phase 2
HC - - 0.01 3.0 0.002% 0.01 1.0 0.001% CO - - 0.19 47.5 0.031% 1.79 196.5 0.16% NOx - - 0.05 13.5 0.01% 0.18 19.5 0.016%
CO2 - - 621.4 155.3 g/km 100% 1088.3 119.6
g/km 100% l/100km - - 6.53 5.04
Phase 3 HC 0.01 2.0 0.002% 0.02 2.5 0.002% 0.05 3.0 0.002% CO 3.15 450.5 0.37% 0.72 103.5 0.085% 15.67 998.0 0.64% NOx 0.04 5.0 0.004% 0.03 4.5 0.004% 0.11 7.0 0.004%
CO2 856.4 122.3 g/km 100% 849.3 121.3
g/km 100% 2453.3 156.3 g/km 100%
FC l/100km 5.17 5.10 6.63 Combined
HC 0.40 37.5 0.027% 0.44 34.5 0.024% 0.47 16.0 0.011% CO 5.16 470.0 0.34% 2.72 210.5 0.15% 19.36 670.5 0.47% NOx 0.14 13.0 0.009% 0.19 15.0 0.011% 0.55 19.0 0.013%
CO2 1523.8 138.9 g/km 100% 1829.0 141.0
g/km 100% 4140.8 143.3 g/km 100%
FC l/100km 5.87 5.94 6.07
Moreover, the distance specific emissions of regulated pollutants measured over each cycle are expressed as percentage of the Euro 5 limits in Table 4. The test vehicle is well below the applicable emission standards even changing the driving cycle.
Table 4: Distance specific emissions (combined values) as percentage of the Euro 5 emission limits NEDC EDC WMTC HC 38% 35% 16% CO 47% 21% 67% NOx 22% 25% 32%
The Table 3 shows very clearly that the mass of pollutants (HC, CO and NOx) emitted during the Phase 1 is almost identical for the NEDC cycle and the EDC cycle despite the fact that the Phase 1 of the NEDC is shorter (two ECE15 cycles) than the Phase 1 of the EDC (four ECE 15 cycles). This implies that the additional ECE 15 cycles run in the Phase 1 of the EDC provides a very small contribution to the mass emissions of CO, NOx and HC. This is confirmed by the very low emission levels measured over the Phase 2 of the EDC. The longer distance covered over the EDC (13 km vs 11 km), result in lower CO distance specific emissions while very similar values are obtained for the other pollutants (see Table 5). As far the WMTC cycle is concerned, the emissions in terms of mass/test resulted to be much higher than those measured over the other two cycles. However, in terms of distance specific emissions, the values measured over the WMTC results are quite close or even lower than for the EDC (see Table 5) and NEDC cycles. This is mainly due to the much longer distance covered over the WMTC.
Table 5: Relative distance specific emissions considering the NEDC as base (NEDC=100%) NEDC EDC WMTC Combined Combined Combined HC 100% 92% 43% CO 100% 45% 143% NOx 100% 115% 146% CO2 100% 102% 103%
The comparison among the distance specific emissions measured over the three cycles is visualized also in Figure 5.

Figure 5 – Relative distance specific emissions considering NEDC as base (=100%)
Relative distanze specific emissions (NEDC=100%)
0%
20%
40%
60%
80%
100%
120%
140%
160%
NEDC EDC WMTC
HCCONOxCO2
A more detailed analysis of the weight of each phase on the test results is provided in Table 6 where the percentage contribution of each phase to the total emissions is shown. These values have been calculated from the mass emissions given in Table 3. The distance specific emissions measured over each phase are also plotted
Table 6: Percentage contribution of each phase to the total mass (grams) emissions
NEDC EDC WMTC
Phase 1 Phase 2 Phase 3 Phase 1 Phase 2 Phase 3 Phase 1 Phase 2 Phase 3HC 96.5% 3.5% 93% 3% 4% 88% 2% 10%CO 39% 61% 66% 7% 27% 10% 9% 81%CO2 44% 56% 20% 34% 46% 14% 26% 59%
PC 1
NOx 75% 25% 54% 29% 17% 47% 33% 20%

3.2 Second-by-second (modal) data
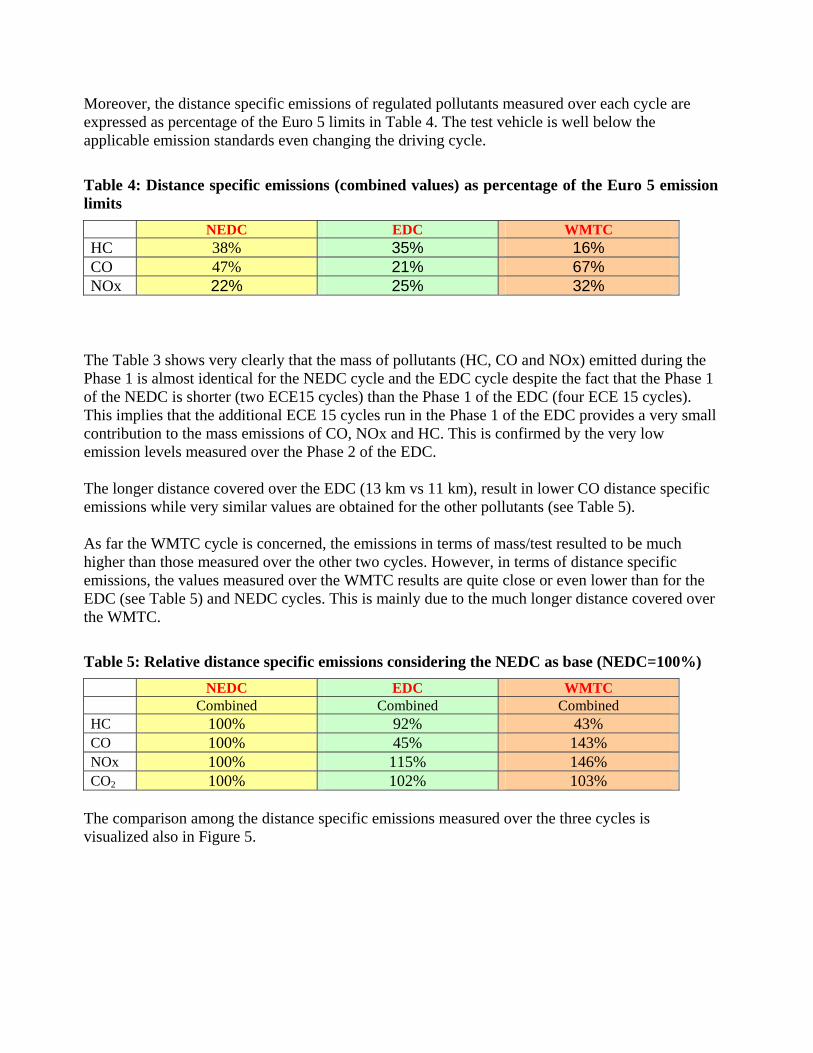
As explained in Chapter 2.2, in parallel with the bag measurements, the second-by-second emission data were recorded throughout the test. From the second-by-second concentration data and exhaust flow rate it was possible to calculate the second-by-second mass emissions for each pollutant and the cumulative mass emissions expressed in grams. The cumulative emission profile of each pollutant together with the Lambda profile recorded over each driving cycle is plotted in Figure 6 - Figure 8. In order to show all the cumulative emission curves in one plot per each cycle, in one case the actual values have been scaled by a suitable factor. In addition, the emission profile curves for each pollutant measured over the different driving cycles are compared in the Figure 9 - Figure 11. These plots clearly show that for the all the driving cycles investigated in this study the HC emissions during the cold start are the highest. Once the catalyst has reached the light-off temperature the HC emission level is greatly reduced and therefore the cumulative emission curve becomes basically flat until for the rest of the cycle. As far as CO emissions are concerned, the cold start provides a very important contribution like for HC emissions but in addition the high speed sections of the cycles contribute significantly to the total emissions as well. This is particularly true for the WMTC cycle in which the high speed section is responsible for the majority of the emissions reaching a contribution of 88% (see Table 6). Finally regarding NOx emissions the cumulative emission curve after the cold start recorded over the NEDC and EDC cycles seems to slightly rise at a constant rate suggesting that the catalyst works quite efficiently on this pollutant. Over the extra-urban part of the cycle the slope of the curve is just slightly steeper. The NOx cumulative emission curve for the WMTC is instead quite different (Figure 8). While there is still an important contribution of the cold start, after the first 100 seconds the slope of the curve is steeper than for the other two cycles. It seems that significant amount of NOx emissions are emitted during the sharp accelerations present in this cycle. This is confirmed by the Figure 13 showing the emissions over the WMTC cycle and the corresponding accelerations. Finally, from the modal data it was possible to calculate the contribution of each elementary cycle for the NEDC and the EDC cycles. The results are plotted in Figure 14 - Figure 17.

Figure 6 – Cumulative emissions and Lambda over the NEDC cycle
NEDC - Cumulative Emissions
0
0.2
0.4
0.6
0.8
1
1.2
1.4
1.6
1.8
2
0 200 400 600 800 1000 1200Time (sec)
Cum
ulat
ive
Emis
sion
s (g
)
0
20
40
60
80
100
120
Spee
d (k
m/h
)
NOx - Average of 2 testsHC - Average of 2 testsCO - Average of 2 testsLambdaNEDC Cycle
Figure 7 – Cumulative emissions and Lambda over the EDC cycle
EDC - Cumulative Emissions
0
0.2
0.4
0.6
0.8
1
1.2
1.4
1.6
1.8
2
0 200 400 600 800 1000 1200 1400 1600Time (sec)
Cum
ulat
ive
Emis
sion
s (g
)
0
20
40
60
80
100
120Sp
eed
(km
/h)
NOx - Average of 2 testsHC - Average of 2 testsCO - Average of 2 testsLambdaEDC Cycle

Figure 8 – Cumulative emissions and Lambda over the WMTC cycle
WMTC - Cumulative Emissions
0.0
0.2
0.4
0.6
0.8
1.0
1.2
1.4
1.6
1.8
2.0
0 200 400 600 800 1000 1200 1400 1600 1800Time (sec)
Cum
ulat
ive
Emis
sion
s (g
)
0
20
40
60
80
100
120
Spee
d (k
m/h
)
NOx - Average of 2 testsHC - Average of 2 testsCO / 6 - Average of 2 testsLambdaWMTC Cycle
Figure 9 – Comparison of HC cumulative emissions over the different cycles
HC - Cumulative Emissions
0
0.05
0.1
0.15
0.2
0.25
0.3
0.35
0.4
0.45
0.5
0 200 400 600 800 1000 1200 1400 1600 1800 2000Time (sec)
Cum
ulat
ive
Emis
sion
s (g
)
NEDC - Average of 2 testsEDC - Average of 2 testsWMTC - Average of 2 tests

Figure 10 – Comparison of CO cumulative emissions over the different cycles
CO - Cumulative Emissions
0
1
2
3
4
5
6
7
8
0 200 400 600 800 1000 1200 1400 1600 1800 2000Time (sec)
Cum
ulat
ive
Emis
sion
s (g
)
NEDC - Average of 2 testsEDC - Average of 2 testsWMTC - Average of 2 tests
Figure 11 – Comparison of CO cumulative emissions over the different cycles
NOx - Cumulative Emissions
0
0.1
0.2
0.3
0.4
0.5
0.6
0 200 400 600 800 1000 1200 1400 1600 1800 2000Time (sec)
Cum
ulat
ive
Emis
sion
s (g
)
NEDC - Average of 2 testsEDC - Average of 2 testsWMTC - Average of 2 tests

Figure 12 – Cumulative emissions over the NEDC cycle compared to accelerations
NEDC - Emissions vs. accelerations
0
0.1
0.2
0.3
0.4
0.5
0.6
0.7
0.8
0 200 400 600 800 1000 1200
Time (sec)
Cum
ulat
ive
Emis
sion
s (g
)
-2
-1
0
1
2
3
4
5
Acc
eler
atio
ns (m
/sec
^2)
NOxHCCOAcceleration
Figure 13 – Cumulative emissions over the WMTC cycle compared to accelerations
WMTC - Emissions vs. accelerations
0
0.2
0.4
0.6
0.8
1
1.2
1.4
1.6
1.8
2
0 200 400 600 800 1000 1200 1400 1600 1800
Time (sec)
Cum
ulat
ive
Emis
sion
s (g
)
-3
-2
-1
0
1
2
3
4
5
Acc
eler
atio
ns (m
/sec
^2)
NOxHCCOAcceleration

Figure 14 – HC distance specific emissions of each elementary cycle of the NEDC and EDC
HC- Distance specific emissionsContribution of each elementary cycle
0
0.05
0.1
0.15
0.2
0.25
0.3
0.35
0.4
0.45
ECE 1 ECE 2 ECE 3 ECE 4 ECE 5 ECE 6 EUDCCycle
Emis
sion
s (g
/km
)
NEDCEDC
Figure 15 – CO distance specific emissions of each elementary cycle of the NEDC and EDC
CO- Distance specific emissionsContribution of each elementary cycle
0
0.1
0.2
0.3
0.4
0.5
0.6
ECE 1 ECE 2 ECE 3 ECE 4 ECE 5 ECE 6 EUDCCycle
Emis
sion
s (g
/km
)
NEDCEDC
The bars are not visible because of the low levels
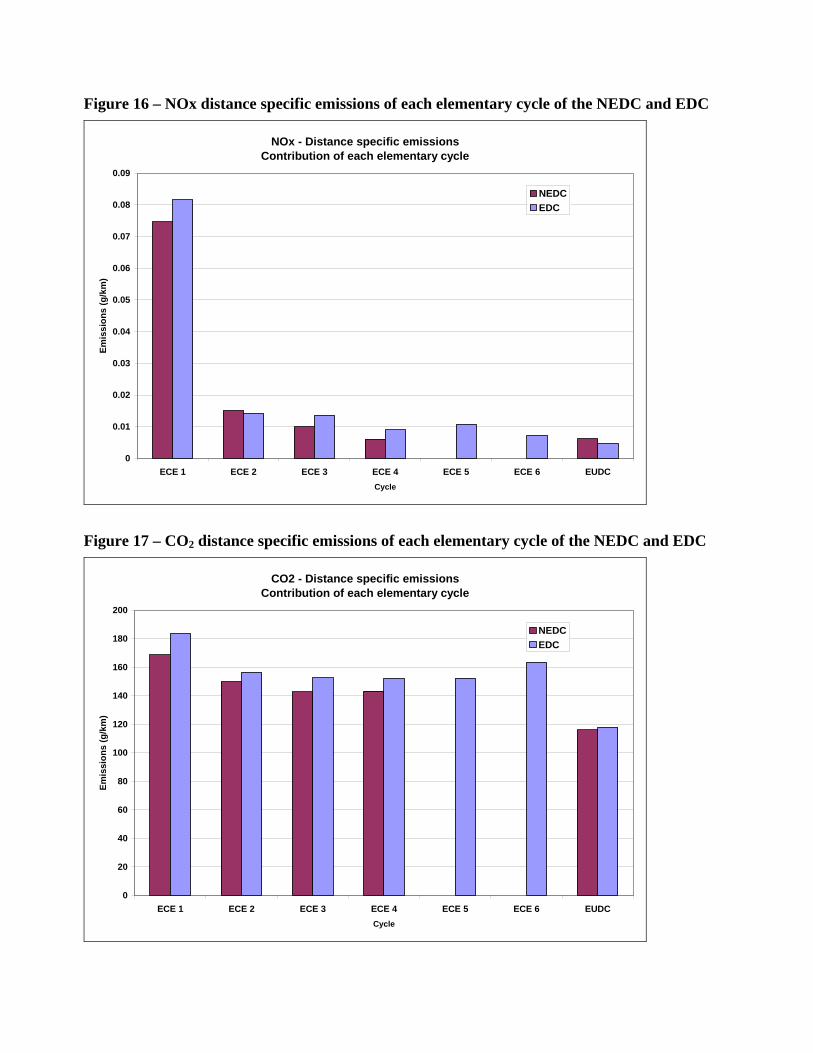
Figure 16 – NOx distance specific emissions of each elementary cycle of the NEDC and EDC
NOx - Distance specific emissionsContribution of each elementary cycle
0
0.01
0.02
0.03
0.04
0.05
0.06
0.07
0.08
0.09
ECE 1 ECE 2 ECE 3 ECE 4 ECE 5 ECE 6 EUDCCycle
Emis
sion
s (g
/km
)
NEDCEDC
Figure 17 – CO2 distance specific emissions of each elementary cycle of the NEDC and EDC
CO2 - Distance specific emissionsContribution of each elementary cycle
0
20
40
60
80
100
120
140
160
180
200
ECE 1 ECE 2 ECE 3 ECE 4 ECE 5 ECE 6 EUDCCycle
Emis
sion
s (g
/km
)
NEDCEDC

4 CONCLUSIONS
A Euro 5 small passenger car was tested over three different cycles: − New European Driving Cycle (NEDC)for passenger cars
− European Driving Cycle (EDC) for motorcycles
− Worldwide harmonized test cycle for motorcycles (WMTC)
The emissions were measured following the legislative procedure for type approval of passenger cars. In addition to the bag values also second-by-second emissions were recorded. The results have shown that in general the cold start and the high speed sections of the investigated cycles represent the most critical part for the gaseous pollutants for this vehicle. In particular, HC emissions are dominated by the cold start while for CO and NOx also the high speed sections provide important contributions. Although the vehicle was calibrated for the NEDC, it showed a quite consistent behaviour over the different test cycles. Nevertheless, it is very likely that if the vehicle was re-calibrated for each cycle by optimizing the combustion strategy, at least for some pollutants (mainly NOx and CO) lower emissions levels than those measured in this study should be expected. The distance specific emissions measured over the NEDC and EDC cycles were very similar, while for the WMTC cycle the emission levels for HC, CO and NOx were different (significantly lower HC, comparable NOx and CO). CO2 emissions were instead very similar for all the cycles. In assessing the results obtained over the WMTC cycle in terms of distance specific emissions it has to be taken into account that the distance covered running this cycle is significantly longer than the other two cycles and this compensate, at least partially, the higher emissions in terms of mass. Other conclusions are the following: • The results obtained over the urban part of the NEDC and EDC cycles, which differ in the
number of elementary ECE 15 cycles (respectively four and six), showed that the contribution of the first elementary cycle is by far the most important. This is due to the cold start and the time needed by the catalyst to reach the light -off temperature. The following elementary ECE 15 cycles are run with a fully efficient catalyst thus providing much more limited contributions to the total emissions.
• The contribution of the extra-urban part of the NEDC and EDC cycles to HC emissions is almost negligible accounting only for about 3-4% of the total emissions in terms of mass (grams). The contribution of EUDC to NOx total mass emissions is still quite limited (about 17-25%) while is more important for CO (about 61% for the NEDC and 27% for the EDC).

• As far as the WMTC cycle is concerned, HC emissions shows the same pattern as for the NEDC/EDC cycles being dominated by the cold start. The contributions of the high speed sections and of the accelerations to CO and NOx emissions appear instead to be more important than for the other two cycles. In particular NOx emissions seem to be very much linked to the accelerations while CO is especially emitted at the highest speed reached during the cycle.