regular meeting city of rialto transportation commission...
TRANSCRIPT
Regular Transportation Commission Meeting – Wednesday, February 1, 2017, 6:00 p.m. Page 1
REGULAR MEETING CITY OF RIALTO
TRANSPORTATION COMMISSION
AGENDA
Civic Center Council Chambers 150 South Palm Avenue Rialto, CA 92376
Wednesday February 1, 2017
6:00 p.m.
In compliance with the Americans with Disabilities Act, if you need special assistance to participate in this meeting, please contact the Public Works Department at (909) 421-7279. Notification 48-hours prior to the meeting will enable the City to make reasonable arrangements to ensure accessibility to this meeting [28 CFR 35.102-35.104 ADA Title II].
Members of the public are given an opportunity to speak on any listed agenda items. Please notify the Public Works Department if you wish to do so. All agendas are posted in the City Hall Administration Building (150 South Palm Avenue, Rialto, CA 92376) at least 72-hours in advance of the meeting. Copies of the staff reports relating to each item on the agenda are on file in the Public Works Department. Please call (909) 421-7279 to inquire about any items described on the agenda.
Based upon the open meeting laws (the Brown Act), additional items may be added to the agenda and acted upon by the Transportation Commission only if it is considered to be a “subsequent need” or “emergency item” and is added by a two-thirds vote. Matters raised under Oral Communications may not be acted upon at that meeting other than as provided above.
CALL TO ORDER Time:
ROLL CALL Present Absent
Chairperson Dennis Barton
Vice-Chairperson Allan Kirst
Commissioner Stephanie Lewis
Commissioner Kelvin Moore
Commissioner Raymond Onochie
Commissioner John Plasencia
Commissioner Max Tidler
Mayor – Deborah Robertson
MOMENT OF SILENCE / INVOCATION
PLEDGE OF ALLEGIANCE
APPROVAL OF MINUTES Regular Meeting – January 4, 2017
ACTION Motion
Second
Vote

Regular Transportation Commission Meeting – Wednesday, February 1, 2017, 6:00 p.m. Page 2
ORAL COMMUNICATIONS
POLICE DEPARTMENT LIAISON REPORT ITEM 1
RIALTO UNIFIED SCHOOL DISTRICT LIAISON REPORT ITEM 2
Transportation/Traffic Impact Fee Nexus Study ITEM 3
(Iteris) ACTION Motion
Second
Action Item Vote
Traffic Signal Prioritization Update ITEM 4
(Gene Klatt, P.E., Lockwood Engineering) ACTION Motion
Second
Action Item Vote
ENGINEER’S REPORT ITEM 5
FUTURE AGENDA ITEMS ITEM 6
1. Discussion on Identifying a Plan for Improvements South of the I-10 Freeway 2. Transportation Planning/Funding Major Improvements 3. Cactus/I-10 Crossing 4. Pepper Avenue Interchange Project 5. Information on Regional Discussions 6. Transportation Plan as it Relates to Active Transportation 7. Local Fees for Transportation Improvements 8. Signal Prioritization Plan 9. Future Improvements to Riverside Avenue, Sierra Avenue and the 1-15 Junction 10. Riverside Avenue Bridge Widening Over the UPRR 11. Discussion of Updating Bike Paths 12. Alder Avenue/SR-210 – Proposed Feasibility Study
COMMISSIONER REPORTS ITEM 7
ADJOURNMENT Motion
Second
Vote
Time
Regular Transportation Commission Meeting – Wednesday, February 1, 2017, 6:00 p.m. Page 3
ATTACHMENTS/HANDOUTS
1. January 4, 2017 Meeting Minutes 2. Transportation/Traffic Impact Fee Nexus Study 3. Staff Report: Traffic Signal Prioritization Update 4. Alder Distribution Facility TIA (To be reviewed at the March 1st Meeting) 5. Cedarhill Plaza TIA (To be reviewed at the March 1st Meeting)
CITY STAFF
Robert G. Eisenbeisz, P.E. Public Works Director/City Engineer Corporal Ron Russo, Rialto Police Department Azzam Jabsheh, P.E., Traffic Engineer Michele Aguirre, Commission Clerk
NOTES
Regular Transportation Commission Meeting Minutes – January 4, 2017 Page 1
REGULAR MEETING of the
TRANSPORTATION COMMISSION
MINUTES January 4, 2017
The regular meeting of the Transportation Commission of the City of Rialto was held in the City Council Chambers located at 150 South Palm Avenue, Rialto, California 92376, on Wednesday, January 4, 2017.
o0o
CALL TO ORDER Chairperson Dennis Barton called the meeting to order at 6:06 p.m.
ROLL CALL The roll was called and the following Commissioners were present: Dennis Barton, Allan Kirst, Stephanie Lewis, and John Plasencia. Michele Aguirre advised the Commission that she received notification that both Commissioners Tidler and Moore would not be present at the meeting. City Staff/Liaisons present: Robert Eisenbeisz, Public Works Director/City Engineer, Robb Steel, Assistant CA/Development Services Director, Gina Gibson, Planning Manager, Azzam Jabsheh, Traffic Engineer, and Michele Aguirre, Commission Clerk.
o0o
APPROVAL OF MINUTES The minutes from the November 2nd meeting were reviewed by the Commission and approved as written.
Commissioner Lewis moved to approve the minutes from the November 2nd meeting as written.
Commissioner Kirst seconded the motion.
The motion was carried to approve the minutes of the November 2, 2016 meeting as written.
o0o
APPROVAL OF MINUTES The minutes from the December 7th meeting were reviewed by the Commission and approved as written.
Commissioner Kirst moved to approve the minutes from the December 7th meeting as written.
Commissioner Lewis seconded the motion.
The motion was carried to approve the minutes of the December 7, 2016 meeting as written.
o0o
ORAL COMMUNICATIONS None
o0o
POLICE DEPARTMENT LIAISON REPORT
Corporal Ron Russo reported on the following: OTS Grant for 15/16 ended. Almost all of the funding received was
spent. Events held by the Police Department

Regular Transportation Commission Meeting Minutes – January 4, 2017 Page 2
School Safety Sweeps Fatality Stats Enforcement Goals Trainings Being Held Addition of a Drug Recognition Enforcement Experts
Chairperson Barton asked, with the Safe Routes to Schools project, if the 4 Rialto schools that are not within the City’s boundaries (Morris Elementary, Garcia Elementary, Jehue Middle School and Rialto High School) are also being swept and requested to have PD contact the appropriate jurisdiction to have them swept as well.
Commission Kirst asked about his issue from the previous meeting regarding schools buses stopping between two signalized intersections and putting out their stop signs which gives children the false idea that it is okay to cross the street. Cpl. Russo advised that he would get the appropriate vehicle code for that. Robert Eisenbeisz added that this issue may require to have the bus stops looked at.
o0o
RUSD LIAISON REPORT No report.
o0o
REGULAR ITEMS
Review of Modification to TIA – Renaissance Specific Plan Amendment Project Specific TIA – PA 108 Warehouse
Gene Klatt reviewed the staff report and requested recommendations on the item.
Questions & Comments
Klatt, Glen Crosby, Lewis Management Corp., and Eisenbeisz answered questions and responded to comments from the Commission with regard to: How much PCE Trips was left over for Building 6. The fact that there was nothing in the report about paying fair share
fees and if that was based on the last action that was taken. Crosby provided an explanation of what the expectation would
be for each applicant. He advised that he would work with staff to review the fair share.
Discussion ensued regarding the fair share for this project.
Concerns
Chairperson Barton advised that he was not comfortable with just asking for the fair share information.
Suggestions, Requests & Recommendations
Chairperson Barton advised that he would like to see: Something in a development agreement that looks at things post
development to verify the numbers. Something in the post development agreement or in the MMRP that
includes post traffic counts to verify mitigation. Crosby advised that Lewis Management Corp would be okay with the 50%.
Regular Transportation Commission Meeting Minutes – January 4, 2017 Page 3
Chairperson Barton requested that something be included in the conditions of approval that has post development traffic counting and suggested adding that to the MMRP. Gina Gibson advised that this items could not be included in the MMRP as it had already gone to City Council for approval. She suggested including those items in the conditions of approval.
Eisenbeisz suggested receiving the verification after Building 5 and again after Building 6. Chairperson Barton and the Commission agreed to take action individually after Building 5 and Building 6.
Action
Commissioner Kirst moved to approve staff’s recommendations with addition of including post counts and the 50% fee as part of the conditions of approval.
Commissioner Plasencia seconded the motion.
All voted in favor of approving staff’s recommendations with addition of including post counts and the 50% fee as part of the conditions of approval.
o0o
ENGINEER’S REPORT Robert Eisenbeisz reported on and answered questions on the following items: Renaissance Parkway Water Line Project Street Closure Metrolink Building Project Agua Mansa Area
Chairperson Barton requested to have something planned internally before scheduling a meeting with other agencies.
Pepper Avenue Interchange Azzam Jabsheh is working on the follow up items.
o0o
FUTURE AGENDA ITEMS Remove Metrolink Parking Log Expansion Project.
o0o
COMMISSIONER REPORTS Commissioner Plasencia – No Report
Commissioner Lewis – No Report
Commissioner Kirst reported that he worked with Jabsheh and Klatt in December to help select candidates for the On-Call Traffic Engineering Services Request for Proposal.
Chairperson Barton reported that the Safe Routes to School Task Force will be meeting on January 12th. He stated that he believed all of the schools have been assessed and that the program is making good progress.
o0o
ADJOURNMENT Commissioner Kirst made a motion to adjourn the meeting.
Commissioner Plasencia seconded the motion.
The motion was carried and the meeting adjourned at 6:52 p.m.
CITY OF RIALTO TRANSPORTATION/TRAFFIC IMPACT FEE Nexus Study
Submitted to:
City of Rialto
November 2016
17J14‐1737
Submitted by:
Agenda item No. 3
TrafficImpactFeeNexusStudyDraftReport
Page i City of Rialto
TABLE OF CONTENTS
Table of Contents .................................................................................................................................. i
Appendices ........................................................................................................................................... i
List of Tables ........................................................................................................................................ ii
List of Figures ....................................................................................................................................... ii
Executive Summary ............................................................................................................................. 3
1.0 Introduction ............................................................................................................................. 3
1.1 BACKGROUND ................................................................................................................................... 4 1.2 CALIFORNIA MITIGATION FEE ACT ........................................................................................................ 4
2.0 Travel Demand Forecasting ....................................................................................................... 5
2.1 FUTURE VOLUME DEVELOPMENT ......................................................................................................... 6
3.0 Traffic Analysis Methodology .................................................................................................... 6
4.0 Existing Conditions ................................................................................................................... 8
5.0 Future Year 2040 Conditions ................................................................................................... 15
6.0 Traffic Impact Fee Project List ................................................................................................. 21
7.0 Project Cost Estimates ............................................................................................................ 25
7.1 INTERSECTION IMPROVEMENT COST ESTIMATES ................................................................................... 25 7.2 CORRIDOR IMPROVEMENT COST ESTIMATES ........................................................................................ 26
8.0 Traffic Impact Fee Calculation ................................................................................................. 27
8.1 FEE SCHEDULE ................................................................................................................................ 28 8.2 COST INCREASES OVER TIME ............................................................................................................. 28
9.0 Comparison With Other Jurisdictions ...................................................................................... 29
10.0 Mitigation Fee Act Findings ..................................................................................................... 29
APPENDICES
Appendix A: Mitigation Fee Act Appendix B: Traffic Volumes Appendix C: Intersection LOS Calculation Sheets Appendix D: Improvement Cost Estimates Appendix E: Fair Share Calculation Sheets
Agenda item No. 3
TrafficImpactFeeNexusStudyDraftReport
Page ii City of Rialto
LIST OF TABLES
Table 1: Total Generated Trips...................................................................................................................... 6 Table 2: Signalized Intersection Level of Service Definitions ........................................................................ 7 Table 3: Unsignalized Intersection Level of Service Definitions ................................................................... 7 Table 4: Existing Conditions ‐ Intersection LOS ........................................................................................... 10 Table 5: Existing Conditions – Roadway Segment LOS ............................................................................... 13 Table 6: Future Year 2040 Conditions ‐ Intersection LOS ........................................................................... 16 Table 7: Future Year 2040 Conditions – Roadway Segment LOS ................................................................ 18 Table 8: Intersection Improvement Project List ......................................................................................... 23 Table 9: Roadway Segment Improvement Project List ............................................................................... 24 Table 10: Intersection Improvement Project Costs .................................................................................... 25 Table 11: Roadway Segment Improvement Project Costs .......................................................................... 26 Table 12: Total Transportation Improvement Costs ................................................................................... 27 Table 13: Traffic Impact Fee Schedule Per Land Use Categories ................................................................ 28 Table 14: Traffic Impact Fee Comparison ................................................................................................... 29
LIST OF FIGURES
Figure 1: Study Intersection Locations .......................................................................................................... 9 Figure 2: Improvement Locations ............................................................................................................... 22
Agenda item No. 3
TrafficImpactFeeNexusStudyDraftReport
Page 3 City of Rialto
EXECUTIVE SUMMARY
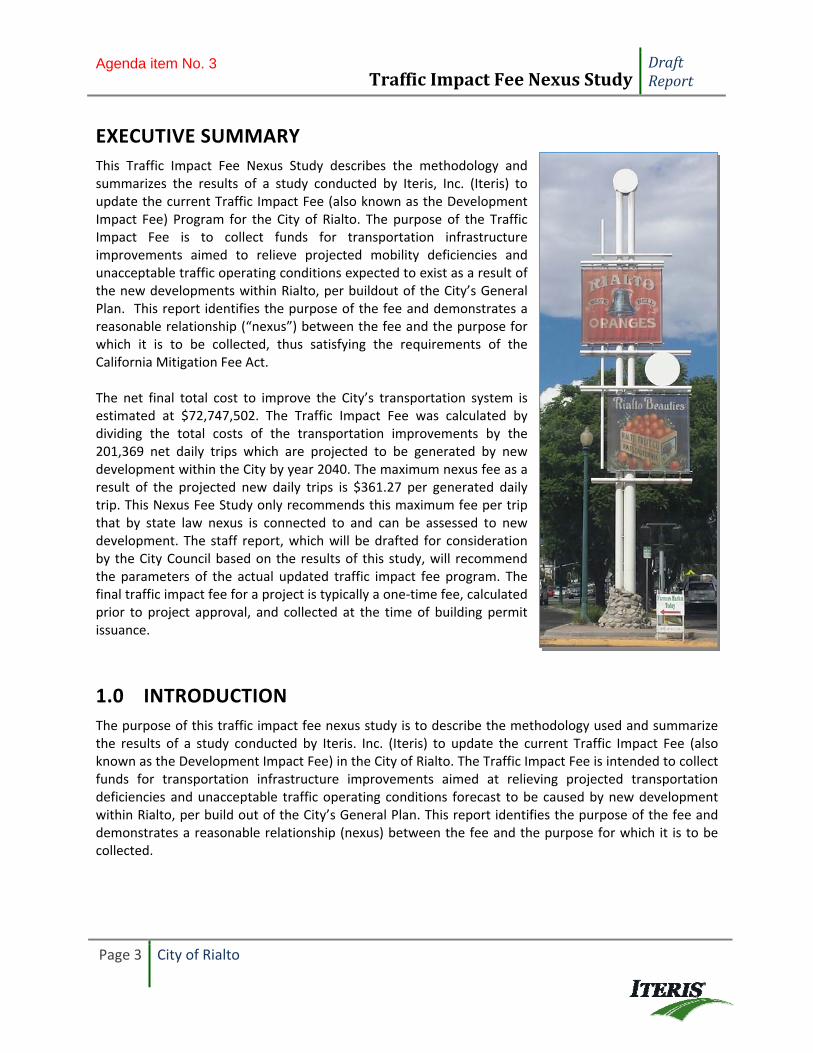
This Traffic Impact Fee Nexus Study describes the methodology and summarizes the results of a study conducted by Iteris, Inc. (Iteris) to update the current Traffic Impact Fee (also known as the Development Impact Fee) Program for the City of Rialto. The purpose of the Traffic Impact Fee is to collect funds for transportation infrastructure improvements aimed to relieve projected mobility deficiencies and unacceptable traffic operating conditions expected to exist as a result of the new developments within Rialto, per buildout of the City’s General Plan. This report identifies the purpose of the fee and demonstrates a reasonable relationship (“nexus”) between the fee and the purpose for which it is to be collected, thus satisfying the requirements of the California Mitigation Fee Act. The net final total cost to improve the City’s transportation system is estimated at $72,747,502. The Traffic Impact Fee was calculated by dividing the total costs of the transportation improvements by the 201,369 net daily trips which are projected to be generated by new development within the City by year 2040. The maximum nexus fee as a result of the projected new daily trips is $361.27 per generated daily trip. This Nexus Fee Study only recommends this maximum fee per trip that by state law nexus is connected to and can be assessed to new development. The staff report, which will be drafted for consideration by the City Council based on the results of this study, will recommend the parameters of the actual updated traffic impact fee program. The final traffic impact fee for a project is typically a one‐time fee, calculated prior to project approval, and collected at the time of building permit issuance.
1.0 INTRODUCTION
The purpose of this traffic impact fee nexus study is to describe the methodology used and summarize the results of a study conducted by Iteris. Inc. (Iteris) to update the current Traffic Impact Fee (also known as the Development Impact Fee) in the City of Rialto. The Traffic Impact Fee is intended to collect funds for transportation infrastructure improvements aimed at relieving projected transportation deficiencies and unacceptable traffic operating conditions forecast to be caused by new development within Rialto, per build out of the City’s General Plan. This report identifies the purpose of the fee and demonstrates a reasonable relationship (nexus) between the fee and the purpose for which it is to be collected.
Agenda item No. 3

TrafficImpactFeeNexusStudyDraftReport
Page 4 City of Rialto
1.1 BACKGROUND
The City of Rialto currently administers a regional traffic impact development fee, which was established as part of Resolution 5427, Ordinance 1532. The current fees are as follows:
Single‐family Residential ‐ $3,533 per dwelling unit
Multi‐family Residential ‐ $2,448 per dwelling unit
Retail ‐ $8.08 per square foot
Office ‐ $4.87 per square foot
Industrial ‐ $2.80 per square foot The City must comply with California Government Code Section 66000 and as part of the code, the City is required to make certain findings via a nexus study in order to establish a valid local traffic impact fee.
1.2 CALIFORNIA MITIGATION FEE ACT
New development lays the groundwork for population increases and job opportunities within the City. However, as population and employment increase, the need for planning and implementing circulation system improvements also increases. California Government Code Section 66000 et seq. enables local agencies to charge a mitigation fee. A mitigation fee, also known as a development impact fee, is a monetary exaction imposed by a government agency upon an applicant seeking approval for a development project. The fee is applied towards the cost of traffic‐related public infrastructure improvements within the jurisdiction, and is not a tax or special assessment. The fee is to be used to finance only those circulation system improvements which are related to the type of development that will generate an increase in traffic. The Mitigation Fee Act requirements in California Government Code Section 66001 require specific nexus requirements to be satisfied for fees related to traffic mitigation improvements. These requirements include: 66001. (a) In any action establishing, increasing, or imposing a fee as a condition of approval of a
development project by a local agency, the local agency shall do all of the following: (1) Identify the purpose of the fee. (2) Identify the use to which the fee is to be put. If the use is financing public facilities, the facilities shall be identified. That identification may, but need not, be made by reference to a capital improvement plan as specified in Section 65403 or 66002, may be made in applicable general or specific plan requirements, or may be made in other public documents that identify the public facilities for which the fee is charged. (3) Determine how there is a reasonable relationship between the fee's use and the type of development project on which the fee is imposed. (4) Determine how there is a reasonable relationship between the need for the public facility and the type of development project on which the fee is imposed.
Agenda item No. 3
TrafficImpactFeeNexusStudyDraftReport
Page 5 City of Rialto
Appendix A includes a complete version of California Government Code Section 66000‐66008.
2.0 TRAVEL DEMAND FORECASTING
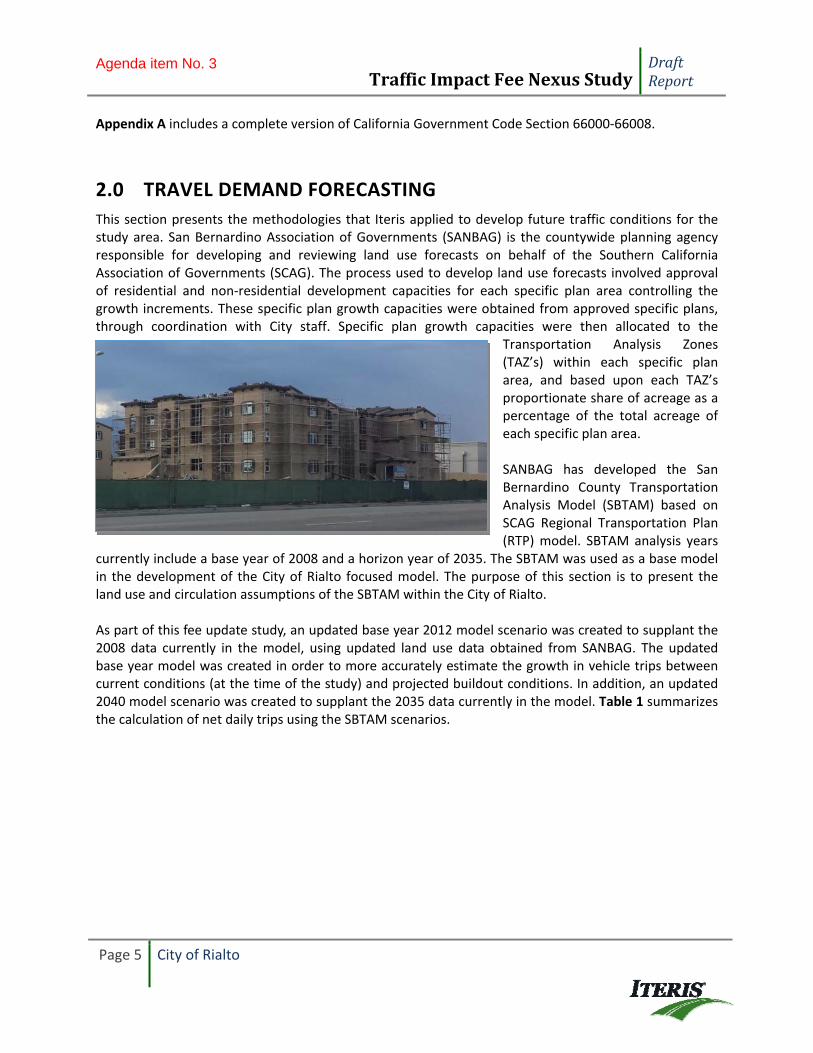
This section presents the methodologies that Iteris applied to develop future traffic conditions for the study area. San Bernardino Association of Governments (SANBAG) is the countywide planning agency responsible for developing and reviewing land use forecasts on behalf of the Southern California Association of Governments (SCAG). The process used to develop land use forecasts involved approval of residential and non‐residential development capacities for each specific plan area controlling the growth increments. These specific plan growth capacities were obtained from approved specific plans, through coordination with City staff. Specific plan growth capacities were then allocated to the
Transportation Analysis Zones (TAZ’s) within each specific plan area, and based upon each TAZ’s proportionate share of acreage as a percentage of the total acreage of each specific plan area. SANBAG has developed the San Bernardino County Transportation Analysis Model (SBTAM) based on SCAG Regional Transportation Plan (RTP) model. SBTAM analysis years
currently include a base year of 2008 and a horizon year of 2035. The SBTAM was used as a base model in the development of the City of Rialto focused model. The purpose of this section is to present the land use and circulation assumptions of the SBTAM within the City of Rialto. As part of this fee update study, an updated base year 2012 model scenario was created to supplant the 2008 data currently in the model, using updated land use data obtained from SANBAG. The updated base year model was created in order to more accurately estimate the growth in vehicle trips between current conditions (at the time of the study) and projected buildout conditions. In addition, an updated 2040 model scenario was created to supplant the 2035 data currently in the model. Table 1 summarizes the calculation of net daily trips using the SBTAM scenarios.
Agenda item No. 3

TrafficImpactFeeNexusStudyDraftReport
Page 6 City of Rialto
TABLE 1: TOTAL GENERATED TRIPS
Year Total Daily Trips
(All uses) Total Daily Trips
(Non‐exempt uses)
Base Year 2012 365,686 323,311
Future Year 2040 589,403 524,680
Net Growth 223,717 201,369
As shown in Table 1, the projected total increase in daily trips as a result of new development in the City of Rialto between model years 2012 and 2040 is estimated at 223,717 daily trips. This number represents the total trip difference between City TAZs in the two model year scenarios, and includes contributions from all land uses. Of the net new daily trips, approximately 10% are attributable to public schools (K through 12, and college) which are typically considered exempt from local planning regulations, and thus exempt from paying their share of the traffic impact fee. It is assumed that their share of the fee would be endured by new development. Based on the trips generated by non‐exempt uses only, the net projected increase in daily trips to be used in the final trip fee calculation would be reduced to 201,369 daily trips.
2.1 FUTURE VOLUME DEVELOPMENT
Future year forecast volumes, both daily and peak hour, were post‐processed consistent with standard methodology applied for forecast volumes obtained from various travel demand models throughout Caltrans District 8. The post‐processing methodology compares the existing base year model and future year model forecast volumes and applies the ratio or incremental difference between the forecasts to the existing traffic count volume. This methodology is consistent with methodologies applied by SCAG and other applications of the SCAG regional model.
3.0 TRAFFIC ANALYSIS METHODOLOGY
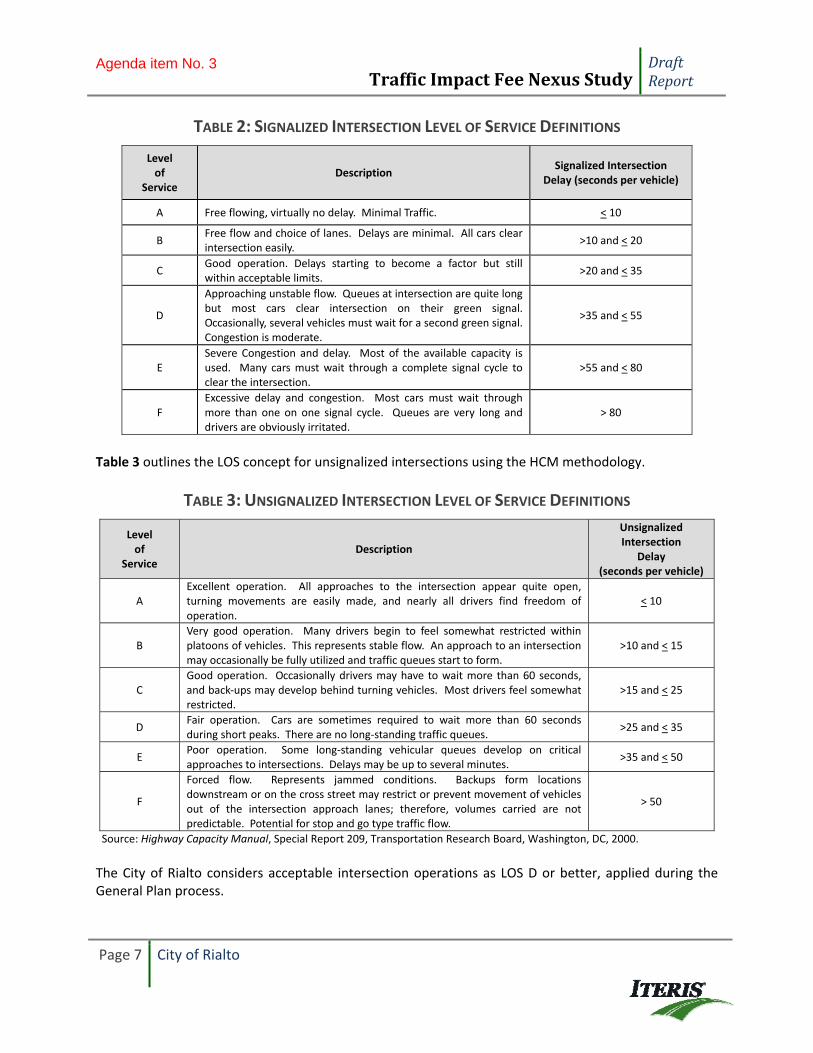
Intersections are typically considered to represent the most critical locations for traffic flow bottlenecks and general congestion on roadways. Conflicting traffic movements are created at intersections since the right‐of‐way must be shared by opposing traffic streams. For purposes of this study, intersection level of service (LOS) is measured to determine the peak hour operating conditions at the study intersections. Table 2 outlines the LOS concept for signalized intersections using the Highway Capacity Manual (HCM) delay methodology, which is described in the Highway Capacity Manual, Special Report 209 (Transportation Research Board, Washington, D.C., 2000). Under the HCM methodology, LOS at signalized intersections is based on the average delay experienced by vehicles traveling through an intersection. The analysis incorporates the effects of the lane geometry and signal phasing (e.g., protected or permitted left turns) at the intersection.
Agenda item No. 3
TrafficImpactFeeNexusStudyDraftReport
Page 7 City of Rialto
TABLE 2: SIGNALIZED INTERSECTION LEVEL OF SERVICE DEFINITIONS
Level of
Service Description
Signalized Intersection Delay (seconds per vehicle)
A Free flowing, virtually no delay. Minimal Traffic. < 10
B Free flow and choice of lanes. Delays are minimal. All cars clear intersection easily.
>10 and < 20
C Good operation. Delays starting to become a factor but still within acceptable limits.
>20 and < 35
D
Approaching unstable flow. Queues at intersection are quite long but most cars clear intersection on their green signal. Occasionally, several vehicles must wait for a second green signal. Congestion is moderate.
>35 and < 55
E Severe Congestion and delay. Most of the available capacity is used. Many cars must wait through a complete signal cycle to clear the intersection.
>55 and < 80
F Excessive delay and congestion. Most cars must wait through more than one on one signal cycle. Queues are very long and drivers are obviously irritated.
> 80
Table 3 outlines the LOS concept for unsignalized intersections using the HCM methodology.
TABLE 3: UNSIGNALIZED INTERSECTION LEVEL OF SERVICE DEFINITIONS
Level of
Service Description
Unsignalized Intersection
Delay (seconds per vehicle)
A Excellent operation. All approaches to the intersection appear quite open, turning movements are easily made, and nearly all drivers find freedom of operation.
< 10
B Very good operation. Many drivers begin to feel somewhat restricted within platoons of vehicles. This represents stable flow. An approach to an intersection may occasionally be fully utilized and traffic queues start to form.
>10 and < 15
C Good operation. Occasionally drivers may have to wait more than 60 seconds, and back‐ups may develop behind turning vehicles. Most drivers feel somewhat restricted.
>15 and < 25
D Fair operation. Cars are sometimes required to wait more than 60 seconds during short peaks. There are no long‐standing traffic queues.
>25 and < 35
E Poor operation. Some long‐standing vehicular queues develop on critical approaches to intersections. Delays may be up to several minutes.
>35 and < 50
F
Forced flow. Represents jammed conditions. Backups form locations downstream or on the cross street may restrict or prevent movement of vehicles out of the intersection approach lanes; therefore, volumes carried are not predictable. Potential for stop and go type traffic flow.
> 50
Source: Highway Capacity Manual, Special Report 209, Transportation Research Board, Washington, DC, 2000.
The City of Rialto considers acceptable intersection operations as LOS D or better, applied during the General Plan process.
Agenda item No. 3
TrafficImpactFeeNexusStudyDraftReport
Page 8 City of Rialto
4.0 EXISTING CONDITIONS
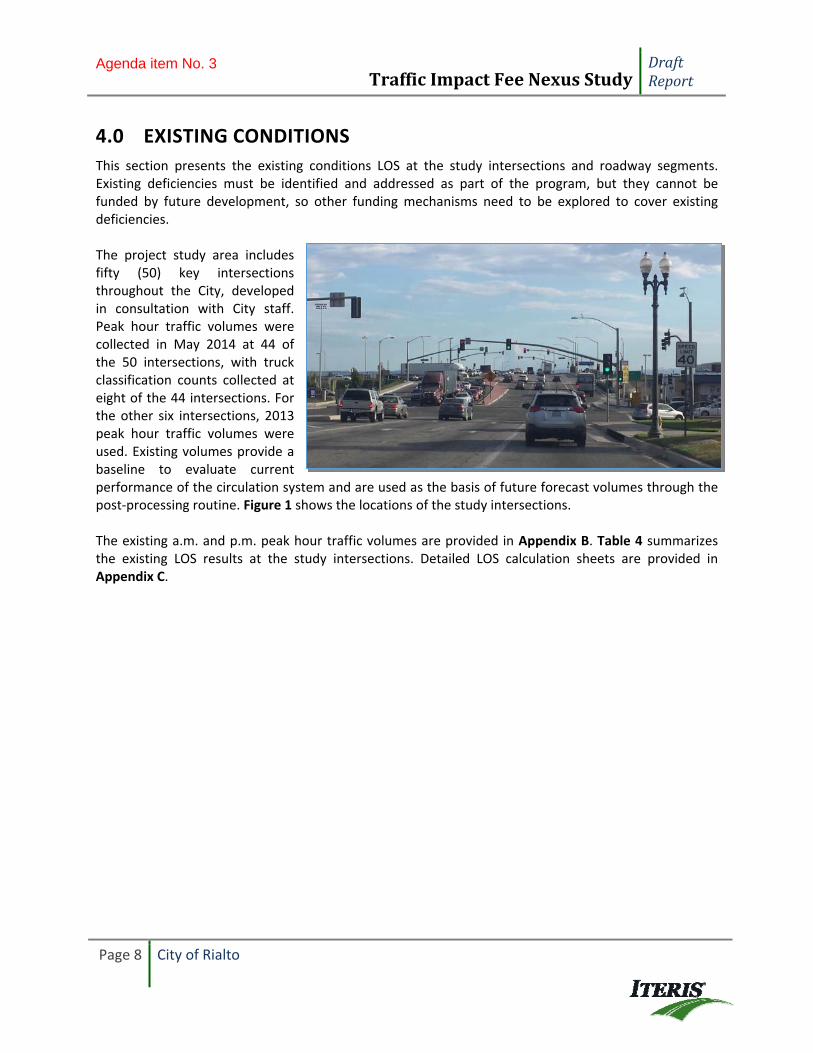
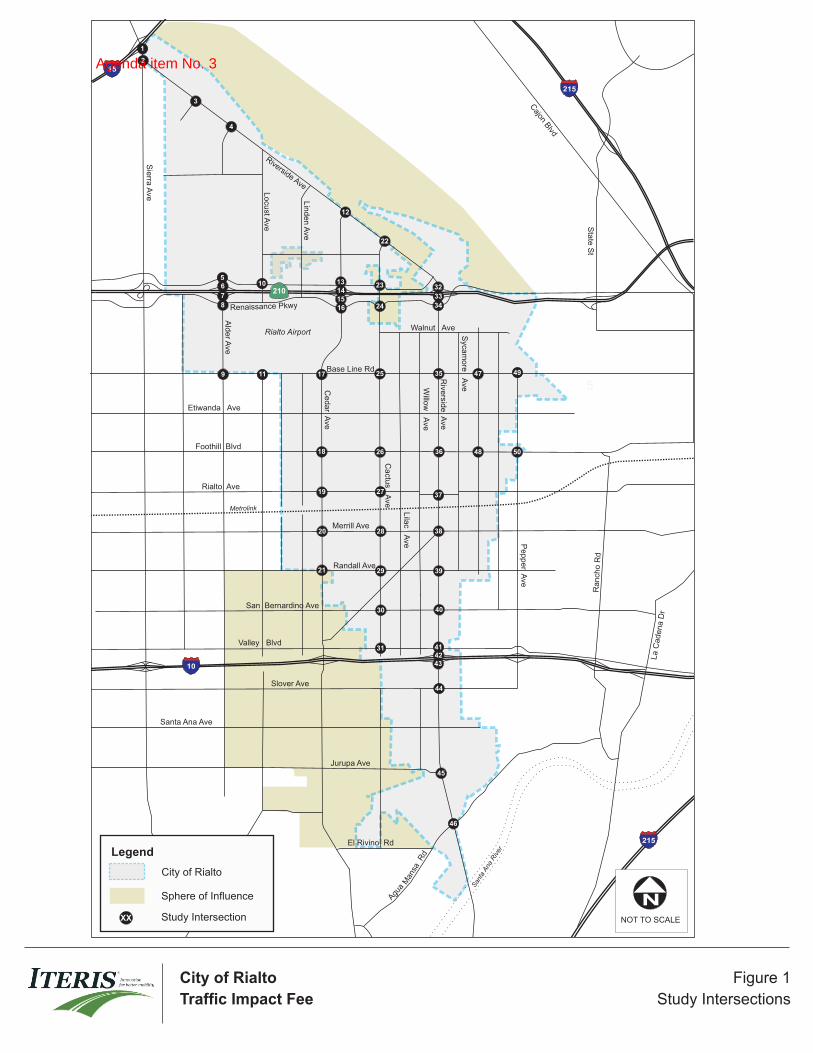
This section presents the existing conditions LOS at the study intersections and roadway segments. Existing deficiencies must be identified and addressed as part of the program, but they cannot be funded by future development, so other funding mechanisms need to be explored to cover existing deficiencies. The project study area includes fifty (50) key intersections throughout the City, developed in consultation with City staff. Peak hour traffic volumes were collected in May 2014 at 44 of the 50 intersections, with truck classification counts collected at eight of the 44 intersections. For the other six intersections, 2013 peak hour traffic volumes were used. Existing volumes provide a baseline to evaluate current performance of the circulation system and are used as the basis of future forecast volumes through the post‐processing routine. Figure 1 shows the locations of the study intersections. The existing a.m. and p.m. peak hour traffic volumes are provided in Appendix B. Table 4 summarizes the existing LOS results at the study intersections. Detailed LOS calculation sheets are provided in Appendix C.
Agenda item No. 3
City of Rialto
Traffic Impact Fee
Figure 1 Study Intersections
NNOT TO SCALE
Legend
City of Rialto
Sphere of Influence
Study IntersectionXX
El Rivino Rd
5Agu
aM
ansa
Rd
210
Syca
more
Ave
Riverside Ave
Willo
w A
ve
Rialto Ave
Merrill Ave
Randall Ave
San Bernardino Ave
Locu
st Ave
Lin
den A
ve
Cedar A
ve
Foothill Blvd
Base Line Rd
Valley Blvd
Ald
er A
ve
10
Pepper A
ve
Walnut Ave
Santa Ana Ave
215
15
Rive
rside A
ve
Rialto Airport
San
ta A
na R
iver
215
Sta
te S
t
Cajon B
lvd
Slover Ave
Jurupa Ave
Sie
rra A
ve
Cactu
s Ave
Lila
c Ave
Etiwanda Ave
Renaissance Pkwy
Ranch
o R
d
La C
adena D
r
Metrolink
1
2
3
4
56
7
8
9 11
10
20
12
13141516
18
23
22
24
25
26
27
31
32
33
35
36
38
414243
44
46
49
50
17
19
28
34
47
37
40
39
45
21 29
30
48
Volumes have been rounded to the nearest 5 trips and balanced between the two intersections
Note:
Agenda item No. 3

TrafficImpactFeeNexusStudyDraftReport
Page 10
City of Rialto
TABLE 4: EXISTING CONDITIONS ‐ INTERSECTION LOS
Intersection Traffic Control AM Peak Hour PM Peak Hour
Delay (sec)
LOS Delay (sec)
LOS
1 Sierra Ave/I‐15 NB Ramps Stop‐controlled 22.1 C 22.1 C
2 Sierra Ave/Riverside Ave Stop‐controlled 22.0 C 28.3 D
3 Live Oak Ave/Riverside Ave Signal 13.0 B 9.1 A
4 Alder Ave/Riverside Ave Signal 5.1 A 3.7 A
5 Alder Ave/Sierra Lakes Pkwy Signal 10.7 B 8.4 A
6 Alder Ave/SR‐210 WB Ramps Signal 19.0 B 14.1 B
7 Alder Ave/SR‐210 EB Ramps Signal 12.7 B 16.2 B
8 Alder Ave/Renaissance Pkwy Signal 18.2 B 16.3 B
9 Alder Ave/Base Line Rd Signal 57.0 E 39.8 D
10 Locust Ave/Sierra Lakes Pkwy Signal 14.4 B 19.5 B
11 Locust Ave/Base Line Rd Stop‐controlled 8.9 A 9.7 A
12 Ayala Dr/Riverside Ave* Signal 9.1 A 7.6 A
13 Ayala Dr/Casmalia St Signal 10.0 A 6.0 A
14 Ayala Dr/SR‐210 WB Ramps Signal 38.9 D 16.3 B
15 Ayala Dr/SR‐210 EB Ramps Signal 15.5 B 16.4 B
16 Ayala Dr/Renaissance Pkwy Signal 21.5 C 22.0 C
17 Cedar Ave/Base Line Rd* Signal 29.4 C 29.7 C
18 Cedar Ave/Foothill Blvd Signal 30.4 C 33.6 C
19 Cedar Ave/Rialto Ave* Signal 32.6 C 23.5 C
20 Cedar Ave/Merrill Ave Signal 20.2 C 17.5 B
21 Cedar Ave/Randall Ave Signal 10.5 B 11.1 B
22 Cactus Ave/Riverside Ave* Signal 15.6 B 7.4 A
23 Cactus Ave/Casmalia St Signal 14.7 B 8.4 A
24 Cactus Ave/Easton St Stop‐controlled 20.1 C 10.4 A
25 Cactus Ave/Base Line Rd* Signal 45.4 D 26.5 C
26 Cactus Ave/Foothill Blvd Signal 21.9 C 21.3 C
27 Cactus Ave/Rialto Ave Signal 13.5 B 6.4 A
28 Cactus Ave/Merrill Ave Signal 11.9 B 11.0 B
29 Cactus Ave/Randall Ave Signal 11.8 B 10.7 B
30 Cactus Ave/San Bernardino Ave Signal 19.5 C 10.8 B
31 Cactus Ave/Valley Blvd Signal 12.9 B 7.9 A
32 Riverside Ave/SR‐210 WB Ramps Signal 30.5 C 21.7 C
33 Riverside Ave/SR‐210 EB Ramps Signal 17.7 B 18.8 B
34 Riverside Ave/Easton St Signal 48.9 D 33.2 C
35 Riverside Ave/Base Line Rd* Signal 36.9 D 36.4 D
36 Riverside Ave/Foothill Blvd Signal 27.7 C 33.2 C
Agenda item No. 3
TrafficImpactFeeNexusStudyDraftReport
Page 11
City of Rialto
Intersection Traffic Control
AM Peak Hour PM Peak Hour
Delay (sec)
LOS Delay (sec)
LOS
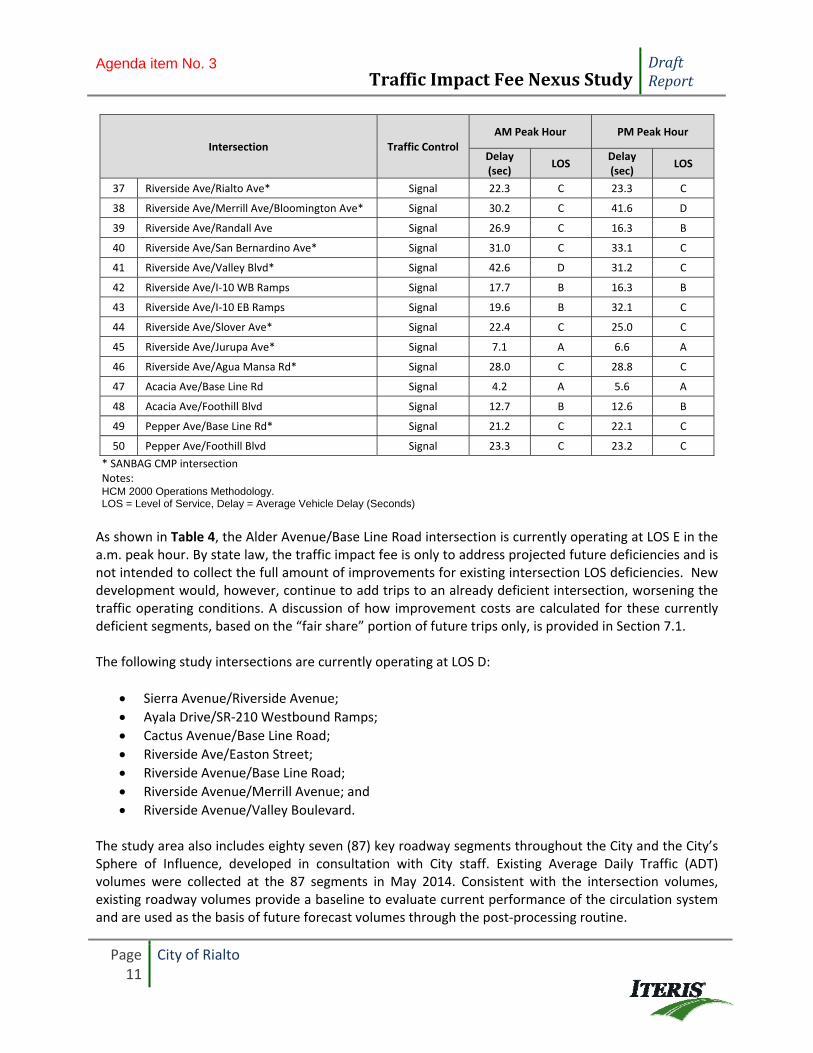
37 Riverside Ave/Rialto Ave* Signal 22.3 C 23.3 C
38 Riverside Ave/Merrill Ave/Bloomington Ave* Signal 30.2 C 41.6 D
39 Riverside Ave/Randall Ave Signal 26.9 C 16.3 B
40 Riverside Ave/San Bernardino Ave* Signal 31.0 C 33.1 C
41 Riverside Ave/Valley Blvd* Signal 42.6 D 31.2 C
42 Riverside Ave/I‐10 WB Ramps Signal 17.7 B 16.3 B
43 Riverside Ave/I‐10 EB Ramps Signal 19.6 B 32.1 C
44 Riverside Ave/Slover Ave* Signal 22.4 C 25.0 C
45 Riverside Ave/Jurupa Ave* Signal 7.1 A 6.6 A
46 Riverside Ave/Agua Mansa Rd* Signal 28.0 C 28.8 C
47 Acacia Ave/Base Line Rd Signal 4.2 A 5.6 A
48 Acacia Ave/Foothill Blvd Signal 12.7 B 12.6 B
49 Pepper Ave/Base Line Rd* Signal 21.2 C 22.1 C
50 Pepper Ave/Foothill Blvd Signal 23.3 C 23.2 C
* SANBAG CMP intersection Notes: HCM 2000 Operations Methodology. LOS = Level of Service, Delay = Average Vehicle Delay (Seconds)
As shown in Table 4, the Alder Avenue/Base Line Road intersection is currently operating at LOS E in the a.m. peak hour. By state law, the traffic impact fee is only to address projected future deficiencies and is not intended to collect the full amount of improvements for existing intersection LOS deficiencies. New development would, however, continue to add trips to an already deficient intersection, worsening the traffic operating conditions. A discussion of how improvement costs are calculated for these currently deficient segments, based on the “fair share” portion of future trips only, is provided in Section 7.1. The following study intersections are currently operating at LOS D:
Sierra Avenue/Riverside Avenue;
Ayala Drive/SR‐210 Westbound Ramps;
Cactus Avenue/Base Line Road;
Riverside Ave/Easton Street;
Riverside Avenue/Base Line Road;
Riverside Avenue/Merrill Avenue; and
Riverside Avenue/Valley Boulevard. The study area also includes eighty seven (87) key roadway segments throughout the City and the City’s Sphere of Influence, developed in consultation with City staff. Existing Average Daily Traffic (ADT) volumes were collected at the 87 segments in May 2014. Consistent with the intersection volumes, existing roadway volumes provide a baseline to evaluate current performance of the circulation system and are used as the basis of future forecast volumes through the post‐processing routine.
Agenda item No. 3
TrafficImpactFeeNexusStudyDraftReport
Page 12
City of Rialto
Since theoretical daily roadway segment capacities can vary between local jurisdictions, the values used in this analysis were developed by comparing capacities in several jurisdictions and using a rounded average value. The following capacities are used in this analysis for City of Rialto segments:
2‐lane Undivided Roadway (2U) – 13,000 vehicles/day
2‐lane Divided Roadway (2D) – 17,500 vehicles/day
4‐lane Undivided Roadway (4U) – 25,500 vehicles/day
4‐lane Divided Roadway (4D) – 35,000 vehicles/day
6‐lane Divided Roadway (6D) – 56,000 vehicles/day
Using these theoretical capacities, the existing Volume‐to‐Capacity (V/C) ratios were evaluated in order to identify deficiencies in the roadway network. For purposes of this analysis, a segment was considered deficient having a V/C ratio of 1.00 or greater. Table 5 summarizes the existing Volume‐to‐Capacity (V/C) ratios at the roadway segments.
Agenda item No. 3

TrafficImpactFeeNexusStudyDraftReport
Page 13
City of Rialto
TABLE 5: EXISTING CONDITIONS – ROADWAY SEGMENT LOS
Intersection Location V/C
1 Sierra Ave Between Riverside Ave and I‐15 NB Ramps 0.57
2 Riverside Ave Between Alder Ave and Amberwood Ave 0.25
3 Riverside Ave Between Alder Ave and Locust Ave 0.28
4 Riverside Ave Between Ayala Dr and Peach St 0.38
5 Riverside Ave East of Ayala Dr 0.40
6 Riverside Ave Between Cactus Ave/Country Club and Casmalia St 0.56
7 Alder Ave South of Riverside Ave 0.13
8 Ayala Dr South of Riverside Ave 0.14
9 Cactus Ave South of Riverside Ave 0.10
10 Alder Ave North of Casmalia St/ Sierra Lakes Pkwy 0.16
11 Locust Ave North of Casmalia St/ Sierra Lakes Pkwy 0.72
12 Ayala Dr North of Casmalia St/ Sierra Lakes Pkwy 0.26
13 Casmalia St/ Sierra Lakes Pkwy Between Alder Ave and Sierra Ave 0.29
14 Casmalia St/ Sierra Lakes Pkwy Between Alder Ave and Locust Ave 0.70
15 Casmalia St/ Sierra Lakes Pkwy Between Linden Ave and Cedar Ave 0.22
16 Casmalia St/ Sierra Lakes Pkwy Between Ayala Dr and Spruce Ave 0.19
17 Easton St Between Alder Ave and Palmetto Ave 0.10
18 Easton St / Renaissance Pkwy Between Locust Ave and Linden Ave 0.10
19 Renaissance Pkwy East of Ayala Dr 0.37
20 Easton St Between Alice Ave and Riverside Ave 0.48
21 Easton St Between Riverside Ave and Highland Ave 0.39
22 Alder Ave Between Renaissance Pkwy and Base Line Rd 1.02
23 Locust Ave South of Casmalia St/ Sierra Lakes Pkwy 0.10
24 Ayala Dr Between Renaissance Pkwy and Base Line Rd 1.00
25 Cactus Ave Between Renaissance Pkwy and Base Line Rd 0.28
26 Riverside Ave Between Easton St and Base Line Rd 0.97
27 Pepper Ave Between Base Line Rd and Mariposa Ave 0.14
28 Base Line Rd Between Alder Ave and Tamarind Ave 0.69
29 Base Line Rd Between Alder Ave and Laurel Ave 0.60
30 Base Line Rd Between Linden Ave and Ayala Dr 0.40
31 Base Line Rd West of Cactus Ave 0.44
32 Base Line Rd Between Lilac Ave and Willow Ave 0.53
33 Base Line Rd Between Sycamore Ave and Acacia Ave 0.56
34 Base Line Rd East of Pepper Ave 0.44
35 Ayala Dr / Cedar Ave Between Etiwanda Ave and Holly St 0.58
36 Cactus Ave Between Etiwanda Ave and Valencia St 0.31
37 Riverside Ave Between Etiwanda Ave and Valencia St 0.66
38 Pepper Ave Between Etiwanda Ave and Valencia St 0.31
Agenda item No. 3

TrafficImpactFeeNexusStudyDraftReport
Page 14
City of Rialto
Intersection Location V/C
39 Foothill Blvd Between Cedar Ave and Linden Ave 0.44
40 Foothill Blvd Between Larch Ave and Spruce Ave 0.48
41 Foothill Blvd Between Lilac Ave and Millard Ave 0.59
42 Foothill Blvd Between Sycamore Ave and Acacia Ave 0.62
43 Foothill Blvd East of Pepper Ave 0.63
44 Cedar Ave South of Foothill Blvd 0.69
45 Cactus Ave South of Foothill Blvd 0.48
46 Riverside Ave South of Foothill Blvd 0.62
47 Pepper Ave South of Foothill Blvd 0.74
48 Rialto Ave Between Cedar Ave and Linden Ave 0.36
49 Rialto Ave Between Larch Ave and Spruce Ave 0.29
50 Rialto Ave Between Lilac Ave and Willow Ave 0.23
51 Cedar Ave South of Rialto Ave 0.83
52 Cactus Ave South of Rialto Ave 0.35
53 Riverside Ave South of Rialto Ave 0.63
54 Merrill Ave Between Linden Ave and Cedar Ave 0.45
55 Merrill Ave Between Cedar Ave and Cactus Ave 0.41
56 Merrill Ave Between Willow Ave and Riverside Ave 0.30
57 Merrill Ave Between Riverside Ave and Sycamore Ave 0.37
58 Riverside Ave South of Merrill Ave 0.67
59 Bloomington Ave Between Merrill Ave and Willow Ave 0.16
60 Bloomington Ave Between Cactus Ave and Lilac Ave 0.20
61 Bloomington Ave Between Cactus Ave and San Bernardino Ave 0.28
62 Cactus Ave North of Randall Ave 0.30
63 Cactus Ave Between Bloomington Ave and Woodcrest St 0.21
64 Alder Ave North of Valley Blvd 0.54
65 Cedar Ave North of Bloomington Ave 0.85
66 Cactus Ave North of Valley Blvd 0.42
67 Cactus Ave North of Santa Ana Ave 0.08
68 Riverside Ave North of Valley Blvd 0.74
69 Valley Blvd Between Locust Ave and Linden Ave 0.57
70 Valley Blvd Between Cedar Ave and Church St 0.52
71 Valley Blvd Between Cactus Ave and Spruce Ave 0.40
72 Valley Blvd Between Lilac Ave and Willow Ave 0.49
73 Valley Blvd Between Riverside Ave and Sycamore Ave 0.34
74 Cedar Ave Between Orange St and Slover Ave 0.85
75 Riverside Ave Between Cameron Way and Slover Ave 0.98
76 Slover Ave Between Locust Ave and Maple Ave 0.33
77 Slover Ave Between Cactus Ave and Spruce Ave 0.19
Agenda item No. 3

TrafficImpactFeeNexusStudyDraftReport
Page 15
City of Rialto
Intersection Location V/C
78 Cedar Ave Between Santa Ana Ave and Slover Ave 0.73
79 Santa Ana Ave Between Cedar Ave and Linden Ave 0.38
80 Santa Ana Ave Between Cedar Ave and Olive St 0.28
81 Alder Ave Between Maywood St and Santa Ana Ave 0.16
82 Riverside Ave North of Jurupa Ave 0.91
83 Jurupa Ave Between Cedar Ave and Oak St 0.22
84 Jurupa Ave Between Cedar Ave and Pepper St 0.29
85 Jurupa Ave Between Riverside Ave and Willow Ave 0.11
86 Riverside Ave Between Jurupa Ave and Resource Dr 0.90
87 Agua Mansa Rd Between Riverside Ave and Enterprise Dr 0.43
Notes: V/C = Volume-to-Capacity ratio
As shown in Table 5, the following roadway corridors are currently operating above their theoretical capacities, with a V/C ratio equal to or greater than 1.00:
Alder Avenue just south of Easton Street/Renaissance Parkway; and
Ayala Avenue just south of Easton Street/Renaissance Parkway. Similar to the intersections, by State law, the traffic impact fee is only to address projected future deficiencies and is not intended to be collected to improve any existing roadway capacity deficiencies. New development would, however, continue to add trips to the already deficient segments, worsening the traffic operating conditions. A discussion of how improvement costs are calculated for these currently deficient segments, based on the “fair share” portion of future trips only, is provided in Section 7.2.
5.0 FUTURE YEAR 2040 CONDITIONS
This section presents the future year 2040 conditions LOS at the study intersections and roadways. As part of this scenario, the forecast future year 2040 traffic conditions were evaluated by analyzing 2040 volumes on the current intersection and roadway configurations in order to determine the deficiencies that are directly attributable to new development. Thus, no future circulation improvements have been assumed in the future year 2040 conditions LOS analysis. The future year 2040 traffic volumes were developed using the SBTAM, as described in Section 2.1. The future year 2040 conditions a.m. and p.m. peak hour intersection traffic volumes are provided in Appendix B. Table 6 summarizes the future year 2040 LOS results at the study intersection. Detailed LOS calculation sheets are provided in Appendix C.
Agenda item No. 3

TrafficImpactFeeNexusStudyDraftReport
Page 16
City of Rialto
TABLE 6: FUTURE YEAR 2040 CONDITIONS ‐ INTERSECTION LOS
Intersection Traffic Control AM Peak Hour PM Peak Hour
Delay (sec)
LOS Delay (sec)
LOS
1 Sierra Ave/I‐15 NB Ramps Stop‐controlled 64.5 F 56.4 F
2 Sierra Ave/Riverside Ave Stop‐controlled 66.6 F 70.5 F
3 Live Oak Ave/Riverside Ave Signal 19.7 B 9.1 A
4 Alder Ave/Riverside Ave Signal 10.2 B 7.3 A
5 Alder Ave/Sierra Lakes Pkwy Signal 19.3 B 21.5 C
6 Alder Ave/SR‐210 WB Ramps Signal 65.2 E 56.8 E
7 Alder Ave/SR‐210 EB Ramps Signal 59.6 E 33.6 C
8 Alder Ave/Renaissance Pkwy Signal 71.4 E 43.6 D
9 Alder Ave/Base Line Rd Signal 330.0 F 301.1 F
10 Locust Ave/Sierra Lakes Pkwy Signal 16.5 B 23.3 C
11 Locust Ave/Base Line Rd Stop‐controlled 16.4 B 16.9 B
12 Ayala Dr/Riverside Ave* Signal 13.0 B 15.0 B
13 Ayala Dr/Casmalia St Signal 17.7 B 7.7 A
14 Ayala Dr/SR‐210 WB Ramps Signal 79.1 E 23.0 C
15 Ayala Dr/SR‐210 EB Ramps Signal 18.2 B 19.7 B
16 Ayala Dr/Renaissance Pkwy Signal 47.0 D 83.9 F
17 Cedar Ave/Base Line Rd* Signal 112.5 F 70.5 E
18 Cedar Ave/Foothill Blvd Signal 49.8 D 62.1 E
19 Cedar Ave/Rialto Ave* Signal 59.1 E 34.3 C
20 Cedar Ave/Merrill Ave Signal 29.9 C 30.9 C
21 Cedar Ave/Randall Ave Signal 11.5 B 14.4 B
22 Cactus Ave/Riverside Ave* Signal 24.0 C 11.2 B
23 Cactus Ave/Casmalia St Signal 26.4 D 9.8 A
24 Cactus Ave/Easton St Stop‐controlled 46.3 E 17.9 C
25 Cactus Ave/Base Line Rd* Signal 123.0 F 54.5 D
26 Cactus Ave/Foothill Blvd Signal 39.7 D 43.2 D
27 Cactus Ave/Rialto Ave Signal 41.6 D 8.9 A
28 Cactus Ave/Merrill Ave Signal 19.2 B 16.5 B
29 Cactus Ave/Randall Ave Signal 11.8 B 9.4 A
30 Cactus Ave/San Bernardino Ave Signal 60.5 F 51.7 F
31 Cactus Ave/Valley Blvd Signal 46.7 D 15.8 B
32 Riverside Ave/SR‐210 WB Ramps Signal 24.7 C 20.8 C
33 Riverside Ave/SR‐210 EB Ramps Signal 16.8 B 17.6 B
34 Riverside Ave/Easton St Signal 58.3 E 34.5 C
35 Riverside Ave/Base Line Rd* Signal 55.7 E 47.5 D
36 Riverside Ave/Foothill Blvd Signal 40.1 D 43.8 D
Agenda item No. 3

TrafficImpactFeeNexusStudyDraftReport
Page 17
City of Rialto
Intersection Traffic Control
AM Peak Hour PM Peak Hour
Delay (sec)
LOS Delay (sec)
LOS
37 Riverside Ave/Rialto Ave* Signal 30.3 C 32.8 C
38 Riverside Ave/Merrill Ave/Bloomington Ave* Signal 41.4 D 54.7 D
39 Riverside Ave/Randall Ave Signal 30.3 C 23.4 C
40 Riverside Ave/San Bernardino Ave* Signal 57.3 E 74.2 E
41 Riverside Ave/Valley Blvd* Signal 188.8 F 50.9 D
42 Riverside Ave/I‐10 WB Ramps Signal 31.6 C 22.8 C
43 Riverside Ave/I‐10 EB Ramps Signal 80.2 F 129.7 F
44 Riverside Ave/Slover Ave* Signal 183.3 F 118.7 F
45 Riverside Ave/Jurupa Ave* Signal 63.8 E 13.4 B
46 Riverside Ave/Agua Mansa Rd* Signal 167.6 F 229.4 F
47 Acacia Ave/Base Line Rd Signal 7.4 A 8.2 A
48 Acacia Ave/Foothill Blvd Signal 20.3 C 17.3 B
49 Pepper Ave/Base Line Rd* Signal 34.9 C 45.6 D
50 Pepper Ave/Foothill Blvd Signal 43.1 D 45.5 D
* SANBAG CMP intersection Notes: HCM 2000 Operations Methodology. LOS = Level of Service, Delay = Average Vehicle Delay (Seconds)
As shown in Table 6, the following study intersections are forecast to operate at LOS E or worse in future year 2040:
Sierra Avenue/I‐15 Northbound Ramps;
Sierra Avenue/Riverside Avenue;
Alder Avenue/SR‐210 Westbound Ramps;
Alder Avenue/SR‐210 Eastbound Ramps;
Alder Avenue/Renaissance Parkway;
Alder Avenue/Base Line Road;
Ayala Drive/I‐210 Westbound Ramps;
Ayala Drive/Renaissance Parkway;
Cedar Avenue/Base Line Road;
Cedar Avenue/Foothill Boulevard;
Cedar Avenue/Rialto Avenue;
Cactus Avenue/Base Line Road;
Cactus Avenue/San Bernardino Avenue;
Riverside Ave/Easton Street;
Riverside Avenue/Base Line Road;
Riverside Avenue/San Bernardino Avenue;
Riverside Avenue/Valley Boulevard;
Riverside Avenue/I‐10 Eastbound Ramps;
Riverside Avenue/Slover Avenue;
Agenda item No. 3

TrafficImpactFeeNexusStudyDraftReport
Page 18
City of Rialto
Riverside Avenue/Jurupa Avenue; and
Riverside Avenue/Agua Mansa Road. Using the same theoretical roadway capacities used for existing conditions, the future year 2040 V/C ratios were evaluated in order to identify future deficiencies in the roadway network. Table 7 summarizes the future year 2040 V/C ratios at the roadway segments.
TABLE 7: FUTURE YEAR 2040 CONDITIONS – ROADWAY SEGMENT LOS
Intersection Location V/C
1 Sierra Ave Between Riverside Ave and I‐15 NB Ramps 1.18
2 Riverside Ave Between Alder Ave and Amberwood Ave 0.68
3 Riverside Ave Between Alder Ave and Locust Ave 0.61
4 Riverside Ave Between Ayala Dr and Peach St 0.57
5 Riverside Ave East of Ayala Dr 0.65
6 Riverside Ave Between Cactus Ave/Country Club and Casmalia St 0.82
7 Alder Ave South of Riverside Ave 0.26
8 Ayala Dr South of Riverside Ave 0.25
9 Cactus Ave South of Riverside Ave 0.16
10 Alder Ave North of Casmalia St/ Sierra Lakes Pkwy 0.31
11 Locust Ave North of Casmalia St/ Sierra Lakes Pkwy 0.95
12 Ayala Dr North of Casmalia St/ Sierra Lakes Pkwy 0.40
13 Casmalia St/ Sierra Lakes Pkwy Between Alder Ave and Sierra Ave 0.31
14 Casmalia St/ Sierra Lakes Pkwy Between Alder Ave and Locust Ave 0.79
15 Casmalia St/ Sierra Lakes Pkwy Between Linden Ave and Cedar Ave 0.33
16 Casmalia St/ Sierra Lakes Pkwy Between Ayala Dr and Spruce Ave 0.25
17 Easton St Between Alder Ave and Palmetto Ave 0.25
18 Easton St / Renaissance Pkwy Between Locust Ave and Linden Ave 0.29
19 Renaissance Pkwy East of Ayala Dr 0.54
20 Easton St Between Alice Ave and Riverside Ave 0.54
21 Easton St Between Riverside Ave and Highland Ave 0.42
22 Alder Ave Between Renaissance Pkwy and Base Line Rd 1.32
23 Locust Ave South of Casmalia St/ Sierra Lakes Pkwy 0.25
24 Ayala Dr Between Renaissance Pkwy and Base Line Rd 1.08
25 Cactus Ave Between Renaissance Pkwy and Base Line Rd 0.39
26 Riverside Ave Between Easton St and Base Line Rd 0.89
27 Pepper Ave Between Base Line Rd and Mariposa Ave 1.52
28 Base Line Rd Between Tamarind Ave and Alder Ave 1.78
29 Base Line Rd Between Alder Ave and Laurel Ave 1.05
30 Base Line Rd Between Linden Ave and Ayala Dr 0.88
31 Base Line Rd West of Cactus Ave 0.74
Agenda item No. 3

TrafficImpactFeeNexusStudyDraftReport
Page 19
City of Rialto
Intersection Location V/C
32 Base Line Rd Between Lilac Ave and Willow Ave 0.73
33 Base Line Rd Between Sycamore Ave and Acacia Ave 0.71
34 Base Line Rd East of Pepper Ave 0.48
35 Ayala Dr / Cedar Ave Between Etiwanda Ave and Holly St 0.74
36 Cactus Ave Between Etiwanda Ave and Valencia St 0.60
37 Riverside Ave Between Etiwanda Ave and Valencia St 0.72
38 Pepper Ave Between Etiwanda Ave and Valencia St 0.59
39 Foothill Blvd Between Cedar Ave and Linden Ave 0.61
40 Foothill Blvd Between Larch Ave and Spruce Ave 0.66
41 Foothill Blvd Between Lilac Ave and Millard Ave 0.74
42 Foothill Blvd Between Sycamore Ave and Acacia Ave 0.80
43 Foothill Blvd East of Pepper Ave 0.79
44 Cedar Ave South of Foothill Blvd 0.85
45 Cactus Ave South of Foothill Blvd 0.88
46 Riverside Ave South of Foothill Blvd 0.76
47 Pepper Ave South of Foothill Blvd 1.04
48 Rialto Ave Between Cedar Ave and Linden Ave 0.34
49 Rialto Ave Between Larch Ave and Spruce Ave 0.35
50 Rialto Ave Between Lilac Ave and Willow Ave 0.28
51 Cedar Ave South of Rialto Ave 1.05
52 Cactus Ave South of Rialto Ave 0.60
53 Riverside Ave South of Rialto Ave 0.77
54 Merrill Ave Between Linden Ave and Cedar Ave 0.40
55 Merrill Ave Between Cedar Ave and Cactus Ave 0.48
56 Merrill Ave Between Willow Ave and Riverside Ave 0.34
57 Merrill Ave Between Riverside Ave and Sycamore Ave 0.47
58 Riverside Ave South of Merrill Ave 0.75
59 Bloomington Ave Between Merrill Ave and Willow Ave 0.35
60 Bloomington Ave Between Cactus Ave and Lilac Ave 0.41
61 Bloomington Ave Between Cactus Ave and San Bernardino Ave 0.55
62 Cactus Ave North of Randall Ave 0.55
63 Cactus Ave Between Bloomington Ave and Woodcrest St 0.40
64 Alder Ave North of Valley Blvd 1.38
65 Cedar Ave North of Bloomington Ave 0.87
66 Cactus Ave North of Valley Blvd 0.65
67 Cactus Ave North of Santa Ana Ave 0.11
68 Riverside Ave North of Valley Blvd 0.85
69 Valley Blvd Between Locust Ave and Linden Ave 0.50
70 Valley Blvd Between Cedar Ave and Church St 0.61
Agenda item No. 3
TrafficImpactFeeNexusStudyDraftReport
Page 20
City of Rialto
Intersection Location V/C
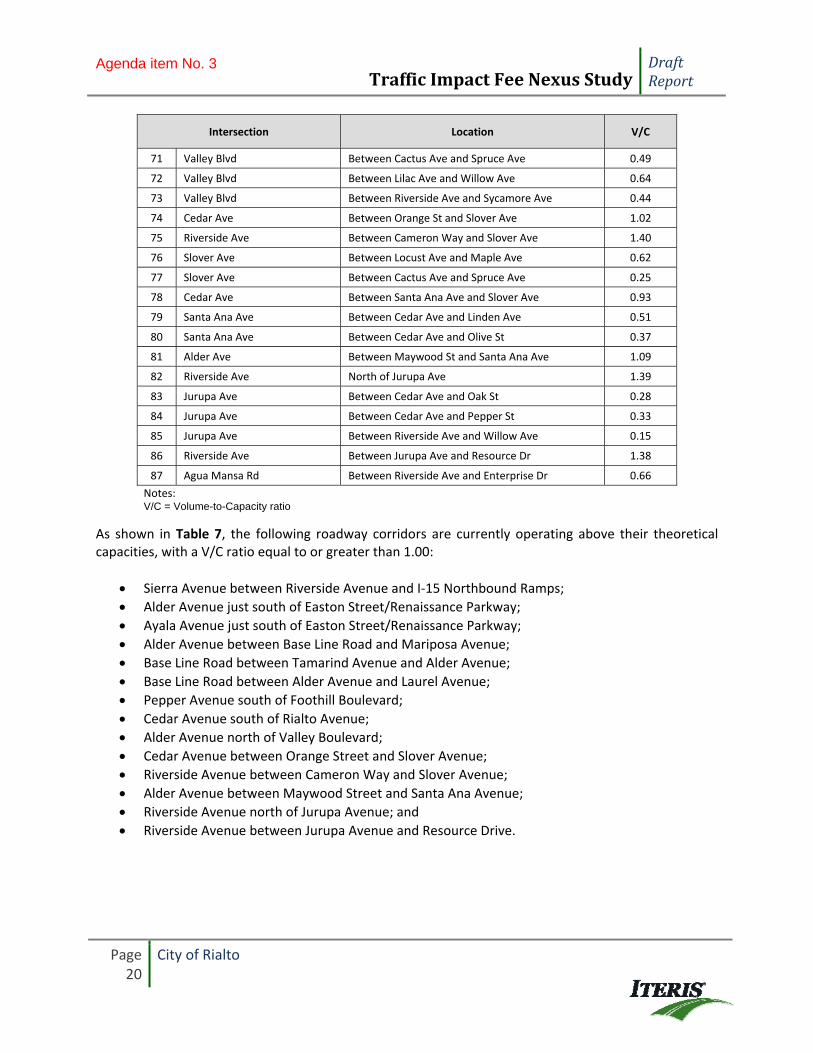
71 Valley Blvd Between Cactus Ave and Spruce Ave 0.49
72 Valley Blvd Between Lilac Ave and Willow Ave 0.64
73 Valley Blvd Between Riverside Ave and Sycamore Ave 0.44
74 Cedar Ave Between Orange St and Slover Ave 1.02
75 Riverside Ave Between Cameron Way and Slover Ave 1.40
76 Slover Ave Between Locust Ave and Maple Ave 0.62
77 Slover Ave Between Cactus Ave and Spruce Ave 0.25
78 Cedar Ave Between Santa Ana Ave and Slover Ave 0.93
79 Santa Ana Ave Between Cedar Ave and Linden Ave 0.51
80 Santa Ana Ave Between Cedar Ave and Olive St 0.37
81 Alder Ave Between Maywood St and Santa Ana Ave 1.09
82 Riverside Ave North of Jurupa Ave 1.39
83 Jurupa Ave Between Cedar Ave and Oak St 0.28
84 Jurupa Ave Between Cedar Ave and Pepper St 0.33
85 Jurupa Ave Between Riverside Ave and Willow Ave 0.15
86 Riverside Ave Between Jurupa Ave and Resource Dr 1.38
87 Agua Mansa Rd Between Riverside Ave and Enterprise Dr 0.66
Notes: V/C = Volume-to-Capacity ratio
As shown in Table 7, the following roadway corridors are currently operating above their theoretical capacities, with a V/C ratio equal to or greater than 1.00:
Sierra Avenue between Riverside Avenue and I‐15 Northbound Ramps;
Alder Avenue just south of Easton Street/Renaissance Parkway;
Ayala Avenue just south of Easton Street/Renaissance Parkway;
Alder Avenue between Base Line Road and Mariposa Avenue;
Base Line Road between Tamarind Avenue and Alder Avenue;
Base Line Road between Alder Avenue and Laurel Avenue;
Pepper Avenue south of Foothill Boulevard;
Cedar Avenue south of Rialto Avenue;
Alder Avenue north of Valley Boulevard;
Cedar Avenue between Orange Street and Slover Avenue;
Riverside Avenue between Cameron Way and Slover Avenue;
Alder Avenue between Maywood Street and Santa Ana Avenue;
Riverside Avenue north of Jurupa Avenue; and
Riverside Avenue between Jurupa Avenue and Resource Drive.
Agenda item No. 3
TrafficImpactFeeNexusStudyDraftReport
Page 21
City of Rialto
6.0 TRAFFIC IMPACT FEE PROJECT LIST
The objective of the traffic impact fee is to fund traffic improvements that are needed as a result of new development within the City. The intersection and corridor improvements range from items such as smaller re‐striping of intersection approaches to modifying the lane usage and modifications to traffic signals to more significant street widening and new traffic signal construction and installations. Iteris worked closely with City staff in identifying the need and consistency with the circulation network, analyzing the results, and verifying the needed improvements. The final list of improvements was reviewed and approved by City staff. Figure 2 shows the locations of the intersections and roadway segments for which improvements are recommended in the impact program. Table 8 summarizes the list of intersection improvements that are recommended as part of this impact fee program.
Agenda item No. 3

City of Rialto
Traffic Impact Fee
Figure 2Impact Fee Improvements
Intersection and Roadway Locations
NNOT TO SCALE
Legend
City of Rialto
Sphere of Influence
Study Intersection#
Intersection Improvement#
Roadway ImprovementXX
Future RoadwayXX
El Rivino Rd
Agua
Man
sa R
d
210
Syca
more
Ave
Riverside Ave
Willo
w A
ve
Rialto Ave
Merrill Ave
Randall Ave
San Bernardino Ave
Locu
st Ave
Lin
den A
ve
Cedar A
ve
Foothill Blvd
Base Line Rd
Valley Blvd
Ald
er A
ve
10
Pepper A
ve
Walnut Ave
Santa Ana Ave
215
15
Rive
rside A
ve
Rialto Airport
San
ta A
na R
iver
215
Sta
te S
t
Cajon B
lvd
Slover Ave
Jurupa Ave
Sie
rra A
ve
Cactu
s Ave
Lila
c Ave
Etiwanda Ave
Renaissance Pkwy
Ranch
o R
d
La C
adena D
r
Metrolink
1
2
3
4
56
7
8
9 11
10
20
12
13141516
18
23
22
24
25
26
27
31
32
33
35
36
38
414243
44
46
49
50
17
19
28
34
47
37
40
39
45
21 29
30
48
Volumes have been rounded to the nearest 5 trips and balanced between the two intersections
Note:
Agenda item No. 3

TrafficImpactFeeNexusStudyDraftReport
Page 23
City of Rialto
TABLE 8: INTERSECTION IMPROVEMENT PROJECT LIST
Intersection Improvement
1 Sierra Ave/I‐15 NB Ramps Install a traffic signal and some civil improvements. No civil improvements in City of Fontana ROW
2 Sierra Ave/Riverside Ave Install a traffic signal. Add a dedicated WB right‐turn lane.
6 Alder Ave/SR‐210 WB Ramps Add a 2nd NB left‐turn lane by re‐striping the #1 through lane. Add 3rd lane on WB on‐ramp (1 lane must be HOV)
7 Alder Ave/SR‐210 EB Ramps Addition of dedicated NB right‐turn lane
8 Alder Ave/Renaissance Pkwy Add a 2nd SB left‐turn lane and Re‐stripe the SB right‐turn lane to a shared through/right‐turn lane.
9 Alder Ave/Base Line Rd* Add a 2nd EB through lane with a dedicated right‐turn lane. Add a 2nd WB through lane with a dedicated right‐turn lane.
14 Ayala Ave/SR‐210 WB Ramps Widen the SB approach to add a dedicated right‐turn lane
16 Ayala Ave/Renaissance Pkwy/Easton Add a 2nd EB left‐turn lane.
17 Ayala Ave/Base Line Rd Re‐stripe the NB right‐turn lane to a shared through/right‐turn lane. Add a 2nd EB left‐turn lane
18 Cedar Ave/Foothill Blvd Add a 2nd NB left‐turn lane. Add a 2nd SB left‐turn lane.
19 Cedar Ave/Rialto Ave Add a dedicated NB right‐turn lane.
24 Cactus Ave/Easton Install a traffic signal. A precise HCM‐based LOS is not available due to number of lanes.
25 Cactus Ave/Base Line Rd Add a 2nd NB left‐turn lane. Add a dedicated NB right‐turn lane. Add a 2nd EB left‐turn lane. Add a 2nd WB left‐turn lane. Add a dedicated WB right‐turn lane.
30 Cactus Ave/San Bernardino Ave Install a traffic signal. A precise HCM‐based LOS is not available due to number of lanes.
34 Riverside Ave/Easton Modify traffic signal to include a WB right‐turn overlap phase.
35 Riverside Ave/Base Line Rd Add a dedicated EB right‐turn lane
41 Riverside Ave/Valley Blvd Add a 2nd WB left‐turn lane. Restripe the number two EB through lane to a shared through/right‐ turn lane
Agenda item No. 3
TrafficImpactFeeNexusStudyDraftReport
Page 24
City of Rialto
Intersection Improvement
43 Riverside Ave/I‐10 EB Ramps Add a dedicated NB right‐turn lane. Add a 3rd SB through lane.
44 Riverside Ave/Slover Ave Add a 3rd NB through lane and a 3rd SB through lane
45 Riverside Ave/Jurupa Ave Add a 3rd SB through lane
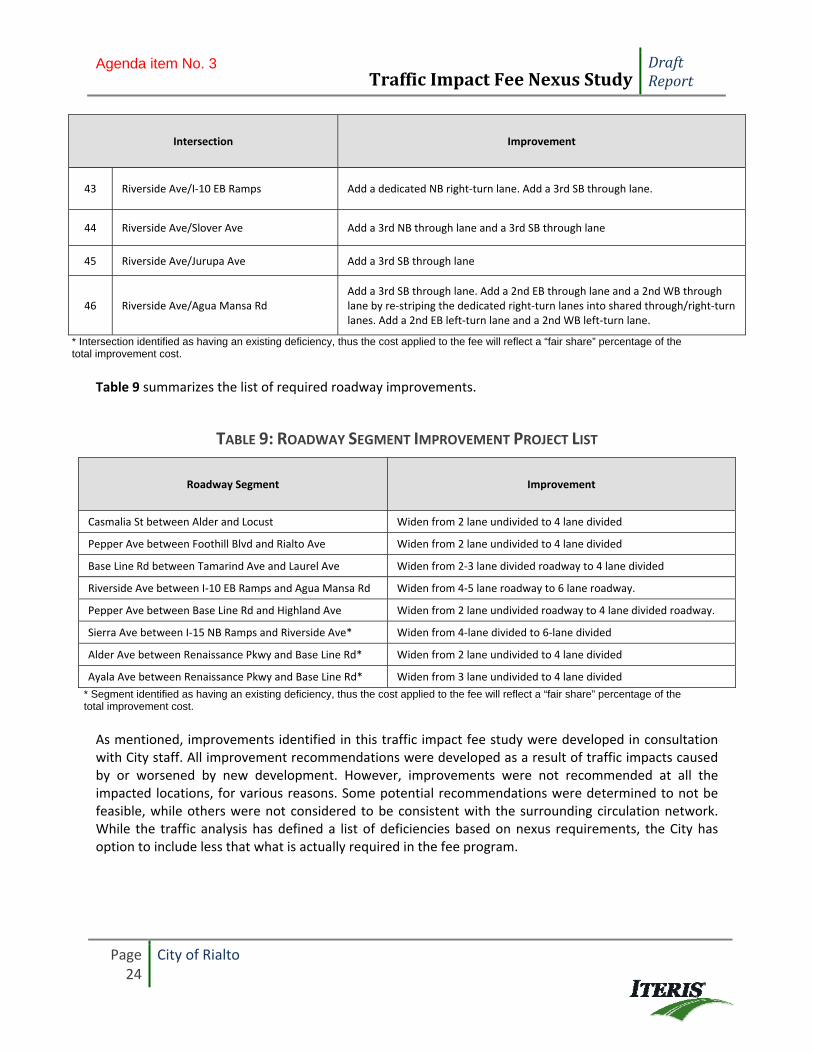
46 Riverside Ave/Agua Mansa Rd Add a 3rd SB through lane. Add a 2nd EB through lane and a 2nd WB through lane by re‐striping the dedicated right‐turn lanes into shared through/right‐turn lanes. Add a 2nd EB left‐turn lane and a 2nd WB left‐turn lane.
* Intersection identified as having an existing deficiency, thus the cost applied to the fee will reflect a “fair share” percentage of the total improvement cost.
Table 9 summarizes the list of required roadway improvements.
TABLE 9: ROADWAY SEGMENT IMPROVEMENT PROJECT LIST
Roadway Segment Improvement
Casmalia St between Alder and Locust Widen from 2 lane undivided to 4 lane divided
Pepper Ave between Foothill Blvd and Rialto Ave Widen from 2 lane undivided to 4 lane divided
Base Line Rd between Tamarind Ave and Laurel Ave Widen from 2‐3 lane divided roadway to 4 lane divided
Riverside Ave between I‐10 EB Ramps and Agua Mansa Rd Widen from 4‐5 lane roadway to 6 lane roadway.
Pepper Ave between Base Line Rd and Highland Ave Widen from 2 lane undivided roadway to 4 lane divided roadway.
Sierra Ave between I‐15 NB Ramps and Riverside Ave* Widen from 4‐lane divided to 6‐lane divided
Alder Ave between Renaissance Pkwy and Base Line Rd* Widen from 2 lane undivided to 4 lane divided
Ayala Ave between Renaissance Pkwy and Base Line Rd* Widen from 3 lane undivided to 4 lane divided
* Segment identified as having an existing deficiency, thus the cost applied to the fee will reflect a “fair share” percentage of the total improvement cost.
As mentioned, improvements identified in this traffic impact fee study were developed in consultation with City staff. All improvement recommendations were developed as a result of traffic impacts caused by or worsened by new development. However, improvements were not recommended at all the impacted locations, for various reasons. Some potential recommendations were determined to not be feasible, while others were not considered to be consistent with the surrounding circulation network. While the traffic analysis has defined a list of deficiencies based on nexus requirements, the City has option to include less that what is actually required in the fee program.
Agenda item No. 3

TrafficImpactFeeNexusStudyDraftReport
Page 25
City of Rialto
7.0 PROJECT COST ESTIMATES
This section describes the methodology used to estimate the total cost of the intersection and roadway improvement projects described in Section 6. The improvement costs were reviewed and approved by City staff. It should be noted that the cost estimates are intended to be “planning level” estimates consistent with the intent of estimated long‐range improvement costs, including appropriate levels of contingency and soft costs, which are calculated prior to availability of design details or documents related to these improvements.
7.1 INTERSECTION IMPROVEMENT COST ESTIMATES
The total intersection improvement costs are summarized in Table 10. These costs included construction, design, and right‐of‐way (if necessary). A detailed breakdown illustrating the details of the cost elements at each intersection is provided in Appendix D.
TABLE 10: INTERSECTION IMPROVEMENT PROJECT COSTS
Intersection Initial Cost Estimate
Reduction due to SANBAG funding (60% reimbursed)
Final Cost Estimate
1 Sierra Ave/I‐15 NB Ramps $440,400 $0 $440,400
2 Sierra Ave/Riverside Ave $532,800 $0 $532,800
6 Alder Ave/SR‐210 WB Ramps $127,800 $0 $127,800
7 Alder Ave/SR‐210 EB Ramps $300,000 $0 $300,000
8 Alder Ave/Renaissance Pkwy $337,200 $0 $337,200
9 Alder Ave/Base Line Rd* $293,263 $0 $293,263
14 Ayala Ave/SR‐210 WB Ramps $169,200 $0 $169,200
16 Ayala Ave/Renaissance Pkwy $236,400 $0 $236,400
17 Ayala Ave/Base Line Rd $270,000 $0 $270,000
18 Cedar Ave/Foothill Blvd $669,600 $0 $669,600
19 Cedar Ave/Rialto Ave $162,000 $0 $162,000
24 Cactus Ave/Easton St $360,000 $0 $360,000
25 Cactus Ave/Base Line Rd $1,376,400 $0 $1,376,400
30 Cactus Ave/San Bernardino Ave $370,800 $0 $370,800
34 Riverside Ave/Easton St $14,400 $0 $14,400
35 Riverside Ave/Base Line Rd $300,000 $0 $300,000
41 Riverside Ave/Valley Blvd $561,600 $0 $561,600
43 Riverside Ave/I‐10 EB Ramps $20,191,700 $0 $20,191,700
44 Riverside Ave/Slover Ave $355,200 $0 $355,200
45 Riverside Ave/Jurupa Ave $122,400 $0 $122,400
Agenda item No. 3
TrafficImpactFeeNexusStudyDraftReport
Page 26
City of Rialto
Intersection Initial Cost Estimate
Reduction due to SANBAG funding (60% reimbursed)
Final Cost Estimate
46 Riverside Ave/Agua Mansa Rd $616,800 ‐$410,200 $206,600
Total $27,807,963 ‐$410,200 $27,397,763
* Intersection identified as having an existing deficiency, thus the cost applied to the fee (as shown) reflects a “fair share” percentage of the total improvement cost.
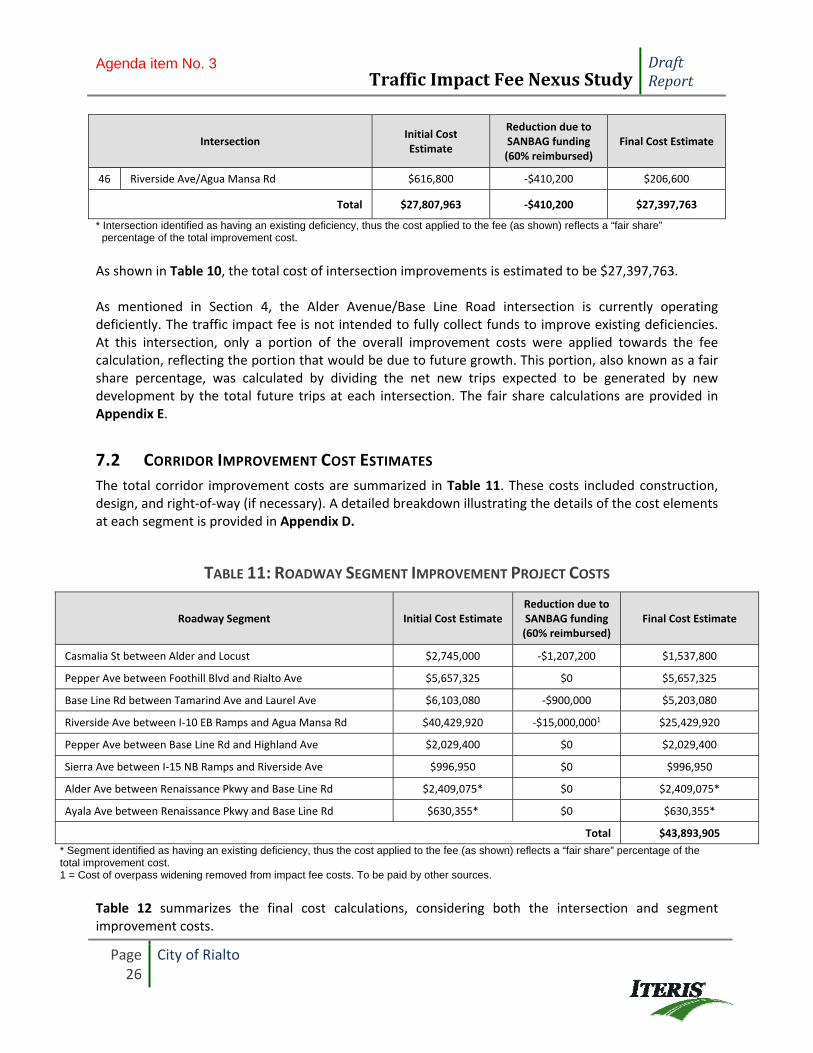
As shown in Table 10, the total cost of intersection improvements is estimated to be $27,397,763. As mentioned in Section 4, the Alder Avenue/Base Line Road intersection is currently operating deficiently. The traffic impact fee is not intended to fully collect funds to improve existing deficiencies. At this intersection, only a portion of the overall improvement costs were applied towards the fee calculation, reflecting the portion that would be due to future growth. This portion, also known as a fair share percentage, was calculated by dividing the net new trips expected to be generated by new development by the total future trips at each intersection. The fair share calculations are provided in Appendix E.
7.2 CORRIDOR IMPROVEMENT COST ESTIMATES
The total corridor improvement costs are summarized in Table 11. These costs included construction, design, and right‐of‐way (if necessary). A detailed breakdown illustrating the details of the cost elements at each segment is provided in Appendix D.
TABLE 11: ROADWAY SEGMENT IMPROVEMENT PROJECT COSTS
Roadway Segment Initial Cost Estimate Reduction due to SANBAG funding (60% reimbursed)
Final Cost Estimate
Casmalia St between Alder and Locust $2,745,000 ‐$1,207,200 $1,537,800
Pepper Ave between Foothill Blvd and Rialto Ave $5,657,325 $0 $5,657,325
Base Line Rd between Tamarind Ave and Laurel Ave $6,103,080 ‐$900,000 $5,203,080
Riverside Ave between I‐10 EB Ramps and Agua Mansa Rd $40,429,920 ‐$15,000,0001 $25,429,920
Pepper Ave between Base Line Rd and Highland Ave $2,029,400 $0 $2,029,400
Sierra Ave between I‐15 NB Ramps and Riverside Ave $996,950 $0 $996,950
Alder Ave between Renaissance Pkwy and Base Line Rd $2,409,075* $0 $2,409,075*
Ayala Ave between Renaissance Pkwy and Base Line Rd $630,355* $0 $630,355*
Total $43,893,905
* Segment identified as having an existing deficiency, thus the cost applied to the fee (as shown) reflects a “fair share” percentage of the total improvement cost. 1 = Cost of overpass widening removed from impact fee costs. To be paid by other sources.
Table 12 summarizes the final cost calculations, considering both the intersection and segment improvement costs.
Agenda item No. 3
TrafficImpactFeeNexusStudyDraftReport
Page 27
City of Rialto
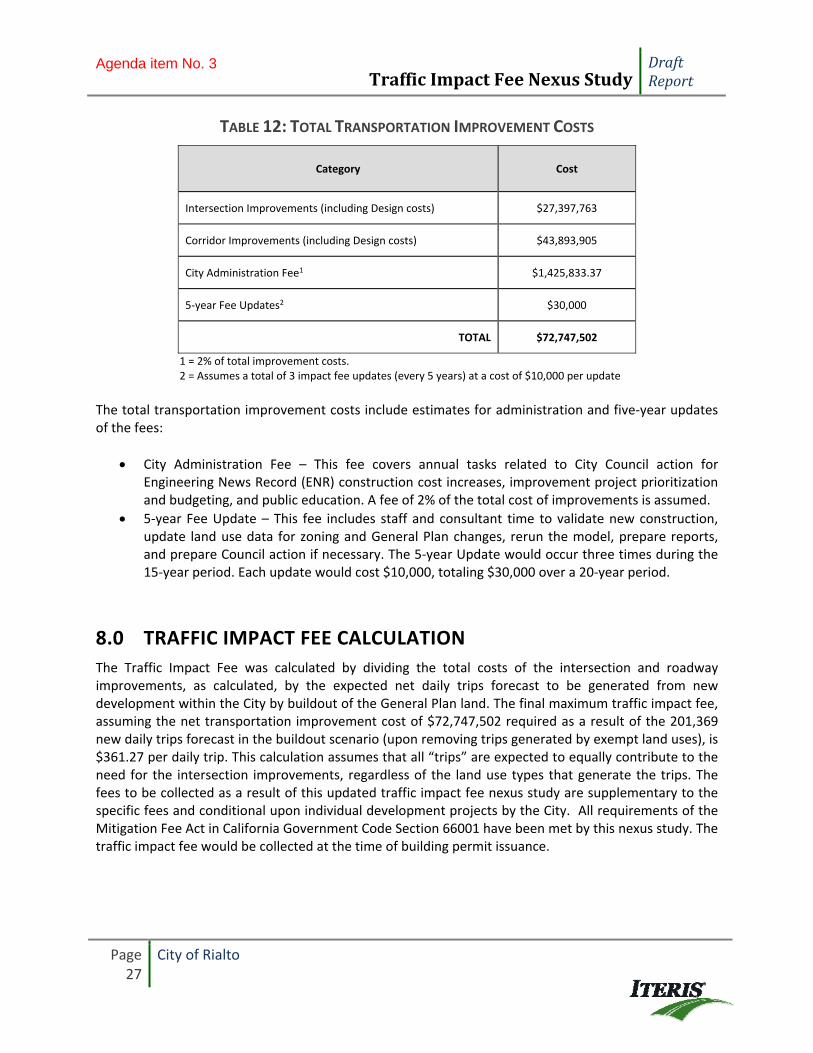
TABLE 12: TOTAL TRANSPORTATION IMPROVEMENT COSTS
Category Cost
Intersection Improvements (including Design costs) $27,397,763
Corridor Improvements (including Design costs) $43,893,905
City Administration Fee1 $1,425,833.37
5‐year Fee Updates2 $30,000
TOTAL $72,747,502
1 = 2% of total improvement costs. 2 = Assumes a total of 3 impact fee updates (every 5 years) at a cost of $10,000 per update
The total transportation improvement costs include estimates for administration and five‐year updates of the fees:
City Administration Fee – This fee covers annual tasks related to City Council action for Engineering News Record (ENR) construction cost increases, improvement project prioritization and budgeting, and public education. A fee of 2% of the total cost of improvements is assumed.
5‐year Fee Update – This fee includes staff and consultant time to validate new construction, update land use data for zoning and General Plan changes, rerun the model, prepare reports, and prepare Council action if necessary. The 5‐year Update would occur three times during the 15‐year period. Each update would cost $10,000, totaling $30,000 over a 20‐year period.
8.0 TRAFFIC IMPACT FEE CALCULATION
The Traffic Impact Fee was calculated by dividing the total costs of the intersection and roadway improvements, as calculated, by the expected net daily trips forecast to be generated from new development within the City by buildout of the General Plan land. The final maximum traffic impact fee, assuming the net transportation improvement cost of $72,747,502 required as a result of the 201,369 new daily trips forecast in the buildout scenario (upon removing trips generated by exempt land uses), is $361.27 per daily trip. This calculation assumes that all “trips” are expected to equally contribute to the need for the intersection improvements, regardless of the land use types that generate the trips. The fees to be collected as a result of this updated traffic impact fee nexus study are supplementary to the specific fees and conditional upon individual development projects by the City. All requirements of the Mitigation Fee Act in California Government Code Section 66001 have been met by this nexus study. The traffic impact fee would be collected at the time of building permit issuance.
Agenda item No. 3
TrafficImpactFeeNexusStudyDraftReport
Page 28
City of Rialto
8.1 FEE SCHEDULE
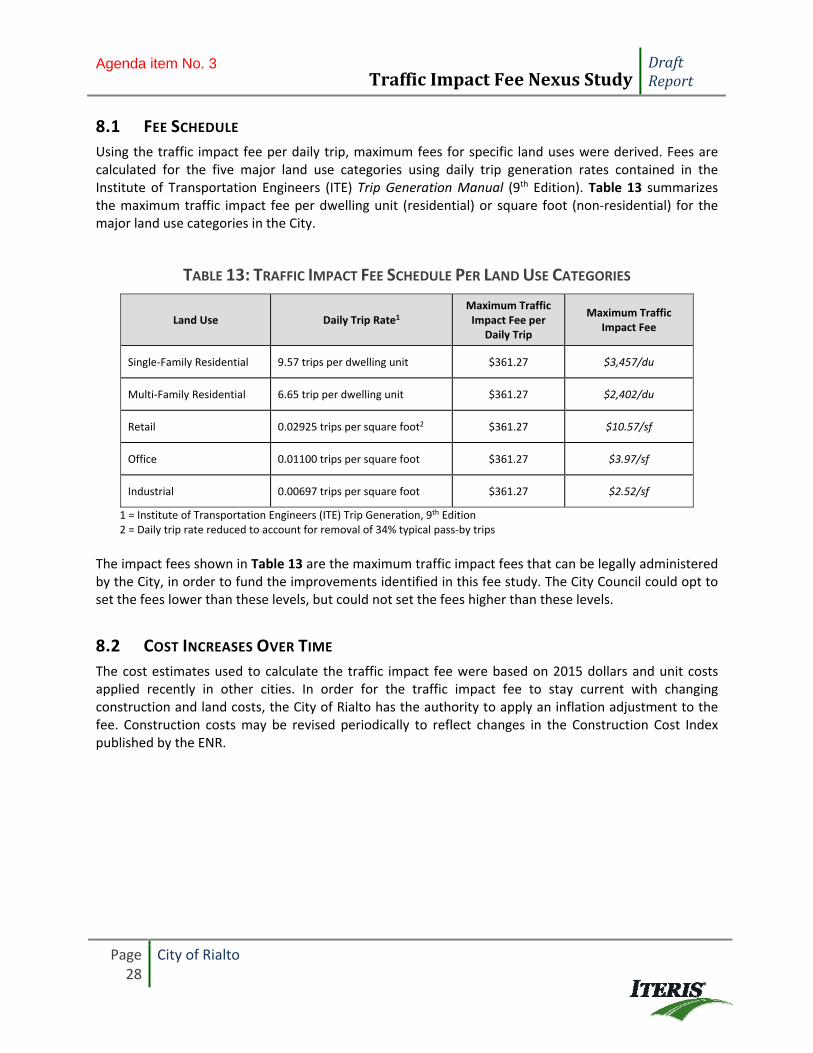
Using the traffic impact fee per daily trip, maximum fees for specific land uses were derived. Fees are calculated for the five major land use categories using daily trip generation rates contained in the Institute of Transportation Engineers (ITE) Trip Generation Manual (9th Edition). Table 13 summarizes the maximum traffic impact fee per dwelling unit (residential) or square foot (non‐residential) for the major land use categories in the City.
TABLE 13: TRAFFIC IMPACT FEE SCHEDULE PER LAND USE CATEGORIES
Land Use Daily Trip Rate1 Maximum Traffic Impact Fee per
Daily Trip
Maximum Traffic Impact Fee
Single‐Family Residential 9.57 trips per dwelling unit $361.27 $3,457/du
Multi‐Family Residential 6.65 trip per dwelling unit $361.27 $2,402/du
Retail 0.02925 trips per square foot2 $361.27 $10.57/sf
Office 0.01100 trips per square foot $361.27 $3.97/sf
Industrial 0.00697 trips per square foot $361.27 $2.52/sf
1 = Institute of Transportation Engineers (ITE) Trip Generation, 9th Edition 2 = Daily trip rate reduced to account for removal of 34% typical pass‐by trips
The impact fees shown in Table 13 are the maximum traffic impact fees that can be legally administered by the City, in order to fund the improvements identified in this fee study. The City Council could opt to set the fees lower than these levels, but could not set the fees higher than these levels.
8.2 COST INCREASES OVER TIME
The cost estimates used to calculate the traffic impact fee were based on 2015 dollars and unit costs applied recently in other cities. In order for the traffic impact fee to stay current with changing construction and land costs, the City of Rialto has the authority to apply an inflation adjustment to the fee. Construction costs may be revised periodically to reflect changes in the Construction Cost Index published by the ENR.
Agenda item No. 3

TrafficImpactFeeNexusStudyDraftReport
Page 29
City of Rialto
9.0 COMPARISON WITH OTHER JURISDICTIONS
The traffic impact fees in similar jurisdictions within San Bernardino County, for the major land use categories, were reviewed in order to provide a comparison to the proposed City of Rialto traffic impact fees. Table 14 summarizes the fees in other jurisdictions, where available.
TABLE 14: TRAFFIC IMPACT FEE COMPARISON
Jurisdiction
Traffic Impact Fee Per Development Type
Single‐Family Residential (per du)
Multi‐Family Residential (per du)
Retail/ Commercial (per sq ft)
Office (per sq ft)
Industrial (per sq ft)
Rialto (proposed max) $3,457 $2,402 $10.57 $3.97 $2.52
Fontana $5,734 $3,509 $8.61 $6.96 $3.51
Rancho Cucamonga $9,002 $5,401 $13.50 $10.80 $5.40
SB County (Rialto Sphere) $7,895 $5,486 $17.02 $10.90 $6.01
As shown in Table 14, fees vary between jurisdictions. The proposed maximum City of Rialto fees are generally lower than fees imposed in Fontana and Rancho Cucamonga. Fees within the unincorporated San Bernardino County area adjacent to the City of Rialto (i.e. Rialto Sphere) are considerably higher than the proposed maximum Rialto fees.
10.0 MITIGATION FEE ACT FINDINGS
Development impact fees were enacted under Assembly Bill 1600 by the California Legislature in 1987 and codified under California Government Code Section 66000 et seq., also referred to as the Mitigation Fee Act (the “Act” or “AB 1600”), and are one authorized method of financing the public facilities necessary to mitigate the effects of new development. The Act requires that all public agencies satisfy the following requirements when establishing, increasing, or imposing a fee as a condition of new development:
A. Identify the Purpose of the Fee (Government Code Section 66001(A)(1)) The purpose of the impact fee is to finance the public transportation improvements needed to mitigate the traffic impacts of future development. These improvements and traffic impacts of future development are quantified in a Transportation/Traffic Impact Fee Nexus Study prepared by Iteris. Based on the traffic model prepared by Iteris in connection with the Transportation/Traffic Impact Fee Nexus Study, the average daily number of trips within the City is forecast to increase
Agenda item No. 3

TrafficImpactFeeNexusStudyDraftReport
Page 30
City of Rialto
by 201,369 by 2040 (i.e., from 323,311 daily trips in 2012 to 524,680 daily trips in 2040). This figure (201,369) represents approximately 62% growth in daily trips over a 28‐year time period. This growth in daily trips will create a demand for additional transportation improvements and facilities that existing facilities cannot accommodate. In order to accommodate new development in an orderly manner, while maintaining the current level of service in the City, the transportation improvements on the Project List will need to be constructed. It is the projected that the direct and cumulative effect of future development has required the preparation of this Transportation/Traffic Impact Fee Nexus Study. Each new development either creates a direct impact on the City's transportation system and/or contributes to the cumulative impact on the transportation system over time. Generally, without future development, the improvements on the Project List would not be necessary, as the existing facilities are adequate for the City’s present population.
B. Identify the Use to which the Fee is to be Put (Government Code Section 66001(A)(2))
The impact fee will be used for and provide a source of revenue to the City for the design, acquisition, installation, and construction of the roadway, intersection, corridor, and other improvements identified on the Project List to mitigate the direct and cumulative impact of new development. These Improvements will in turn preserve the quality of life in the City and protect the health, safety, and welfare of future residents and employees.
C. Determine that there is a Reasonable Relationship between the Fee’s Use and the Type of
Development Project upon which the Fee is Imposed (“Benefit Relationship”) (Government Code Section 66001(A)(3)) As discussed in Section A above, the projected direct and cumulative effects of future development have prompted the City to update its impact fee program. Each new development (including both “in fill” and “greenfield” projects) will contribute to the need for new transportation improvements. Generally, without future development, the City would have no need to acquire, construct, and/or install additional transportation facilities on the Project List. Even “in fill” development projects located adjacent to existing facilities will utilize and benefit from public facilities on the Project List. However, as part of the proposed impact fee, new development will be charged a “fair share” of the costs of certain improvements that are needed to accommodate the needs of existing as well as future development. The fair‐share percentage is calculated by taking the ratio of trips for future development to the total trips for the facility in question (i.e., at an intersection or for a roadway segment with peak hour trips used for intersections and average daily trips (ADT) used for roadway segments) and multiplying it by the total improvement cost. There are three roadway segments and one intersection that fit the criteria of applying fair‐share costs. As set forth in this Transportation/Traffic Impact Fee Nexus Study, the development impact fees will be expended for the design, acquisition, installation, and construction of the transportation improvements identified on the Project List, as that is the purpose for which the development impact fees are collected. As previously stated, all new development creates either a direct
Agenda item No. 3
TrafficImpactFeeNexusStudyDraftReport
Page 31
City of Rialto
impact on or contributes to the cumulative impact of new development on the City's transportation system. For the foregoing reasons, there is a reasonable relationship between the design, acquisition, construction, and installation of the transportation facilities on the Project List and new development as required under Section 66001(a)(3) of the Mitigation Fee Act.
D. Determine that there is a Reasonable Relationship between the Need for the Public Facility
and the Type of Development Project upon which the Fee is Imposed (“Impact Relationship”) (Government Code Section 66001(A)(4)) As previously stated, all new development within the City, irrespective of location, contributes to the direct and cumulative impact of development on the City's transportation system and creates a need for new transportation infrastructure to accommodate growth. With the exception noted above, the improvements identified on the Project List would not be necessary without future development. These improvements are needed to mitigate the effects of new development and maintain an adequate level of service for the community. For the reasons presented herein, there is a reasonable relationship between the need for the transportation facilities included on the Project List and all new development within the City as required under Section 66001(a)(4) of the Mitigation Fee Act.
E. Discuss how there is a Reasonable Relationship between the Amount of the Fee and the Cost
of the Public Facilities Attributable to the Development upon which the Fee is Imposed (“Rough Proportionality Relationship”) (Government Code 66001(A)) As set forth above, all new development in the City impacts the transportation system. Moreover, each individual development project and its related increase in population and employment and corresponding increase in traffic, along with the cumulative impacts of all development in the City, will adversely impact, directly and cumulatively, existing facilities. The method utilized in calculating impact fees for different types of development, which employs Institute of Transportation Engineers (ITE) trip rates, results in a reasonable proportionality relationship between the amount of the fee and the facility cost attributable to the new development project on which the fee is imposed. More specifically, the maximum traffic impact fee per daily trip, generated by the traffic model prepared by Iteris, is applied to five major land use categories (Single‐Family Residential, Multi‐Family Residential, Retail, Office, and Industrial) to determine a maximum fee per dwelling unit or building square foot. Note that for Retail, the trip rate is reduced to account for pass‐by trips (i.e., roughly 34% of Retail trips as estimated by the ITE). Thus, the proposed fee amounts are roughly proportional to the impact resulting from new development, and there is a reasonable relationship between the amount of the fee and the portion of cost of the facilities attributable to new development.
Agenda item No. 3
CITY OF RIALTO TRANSPORTATION/TRAFFIC IMPACT FEE Nexus Study Technical Appendix
Submitted to:
City of Rialto
17J14‐1737
Submitted by:
Agenda item No. 3

Appendix
APPENDIX A: MITIGATION FEE ACT
Agenda item No. 3
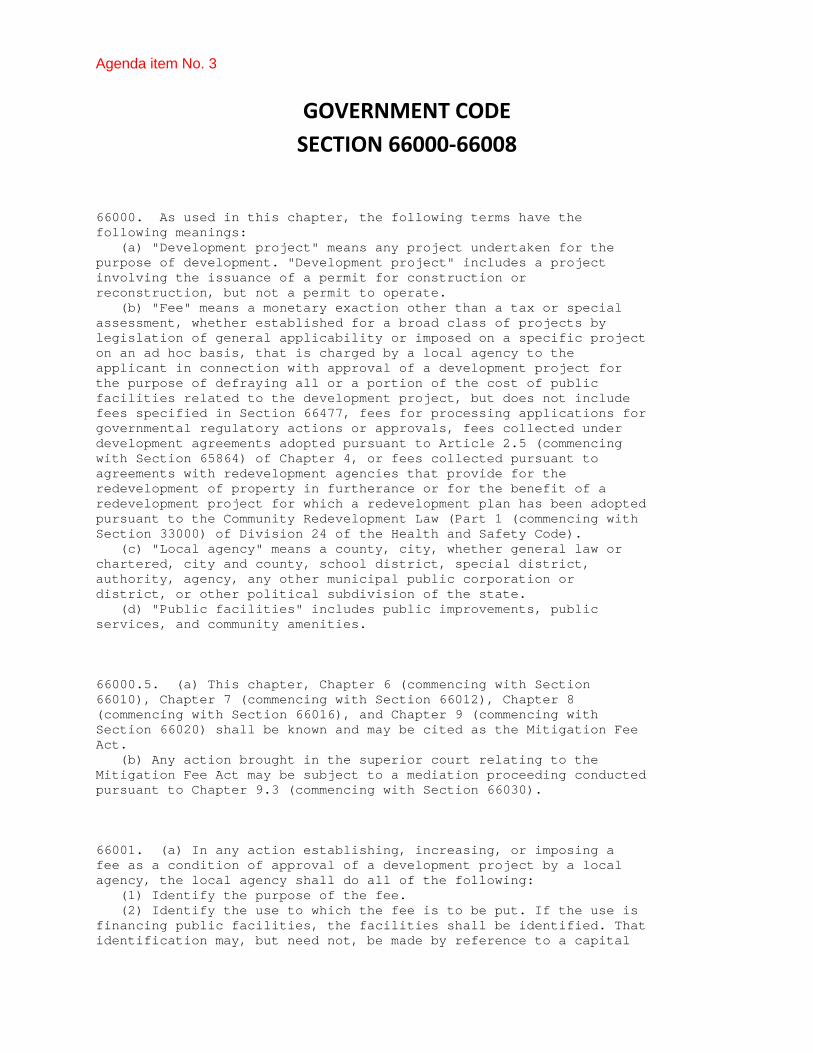
GOVERNMENT CODE SECTION 66000‐66008
66000. As used in this chapter, the following terms have the following meanings: (a) "Development project" means any project undertaken for the purpose of development. "Development project" includes a project involving the issuance of a permit for construction or reconstruction, but not a permit to operate. (b) "Fee" means a monetary exaction other than a tax or special assessment, whether established for a broad class of projects by legislation of general applicability or imposed on a specific project on an ad hoc basis, that is charged by a local agency to the applicant in connection with approval of a development project for the purpose of defraying all or a portion of the cost of public facilities related to the development project, but does not include fees specified in Section 66477, fees for processing applications for governmental regulatory actions or approvals, fees collected under development agreements adopted pursuant to Article 2.5 (commencing with Section 65864) of Chapter 4, or fees collected pursuant to agreements with redevelopment agencies that provide for the redevelopment of property in furtherance or for the benefit of a redevelopment project for which a redevelopment plan has been adopted pursuant to the Community Redevelopment Law (Part 1 (commencing with Section 33000) of Division 24 of the Health and Safety Code). (c) "Local agency" means a county, city, whether general law or chartered, city and county, school district, special district, authority, agency, any other municipal public corporation or district, or other political subdivision of the state. (d) "Public facilities" includes public improvements, public services, and community amenities. 66000.5. (a) This chapter, Chapter 6 (commencing with Section 66010), Chapter 7 (commencing with Section 66012), Chapter 8 (commencing with Section 66016), and Chapter 9 (commencing with Section 66020) shall be known and may be cited as the Mitigation Fee Act. (b) Any action brought in the superior court relating to the Mitigation Fee Act may be subject to a mediation proceeding conducted pursuant to Chapter 9.3 (commencing with Section 66030). 66001. (a) In any action establishing, increasing, or imposing a fee as a condition of approval of a development project by a local agency, the local agency shall do all of the following: (1) Identify the purpose of the fee. (2) Identify the use to which the fee is to be put. If the use is financing public facilities, the facilities shall be identified. That identification may, but need not, be made by reference to a capital
Agenda item No. 3

improvement plan as specified in Section 65403 or 66002, may be made in applicable general or specific plan requirements, or may be made in other public documents that identify the public facilities for which the fee is charged. (3) Determine how there is a reasonable relationship between the fee's use and the type of development project on which the fee is imposed. (4) Determine how there is a reasonable relationship between the need for the public facility and the type of development project on which the fee is imposed. (b) In any action imposing a fee as a condition of approval of a development project by a local agency, the local agency shall determine how there is a reasonable relationship between the amount of the fee and the cost of the public facility or portion of the public facility attributable to the development on which the fee is imposed. (c) Upon receipt of a fee subject to this section, the local agency shall deposit, invest, account for, and expend the fees pursuant to Section 66006. (d) (1) For the fifth fiscal year following the first deposit into the account or fund, and every five years thereafter, the local agency shall make all of the following findings with respect to that portion of the account or fund remaining unexpended, whether committed or uncommitted: (A) Identify the purpose to which the fee is to be put. (B) Demonstrate a reasonable relationship between the fee and the purpose for which it is charged. (C) Identify all sources and amounts of funding anticipated to complete financing in incomplete improvements identified in paragraph (2) of subdivision (a). (D) Designate the approximate dates on which the funding referred to in subparagraph (C) is expected to be deposited into the appropriate account or fund. (2) When findings are required by this subdivision, they shall be made in connection with the public information required by subdivision (b) of Section 66006. The findings required by this subdivision need only be made for moneys in possession of the local agency, and need not be made with respect to letters of credit, bonds, or other instruments taken to secure payment of the fee at a future date. If the findings are not made as required by this subdivision, the local agency shall refund the moneys in the account or fund as provided in subdivision (e). (e) Except as provided in subdivision (f), when sufficient funds have been collected, as determined pursuant to subparagraph (F) of paragraph (1) of subdivision (b) of Section 66006, to complete financing on incomplete public improvements identified in paragraph (2) of subdivision (a), and the public improvements remain incomplete, the local agency shall identify, within 180 days of the determination that sufficient funds have been collected, an approximate date by which the construction of the public improvement will be commenced, or shall refund to the then current record owner or owners of the lots or units, as identified on the last equalized assessment roll, of the development project or projects on a prorated basis, the unexpended portion of the fee, and any interest accrued thereon. By means consistent with the intent of this section, a local agency may refund the unexpended revenues by direct payment, by providing a temporary suspension of fees, or by any other reasonable
Agenda item No. 3
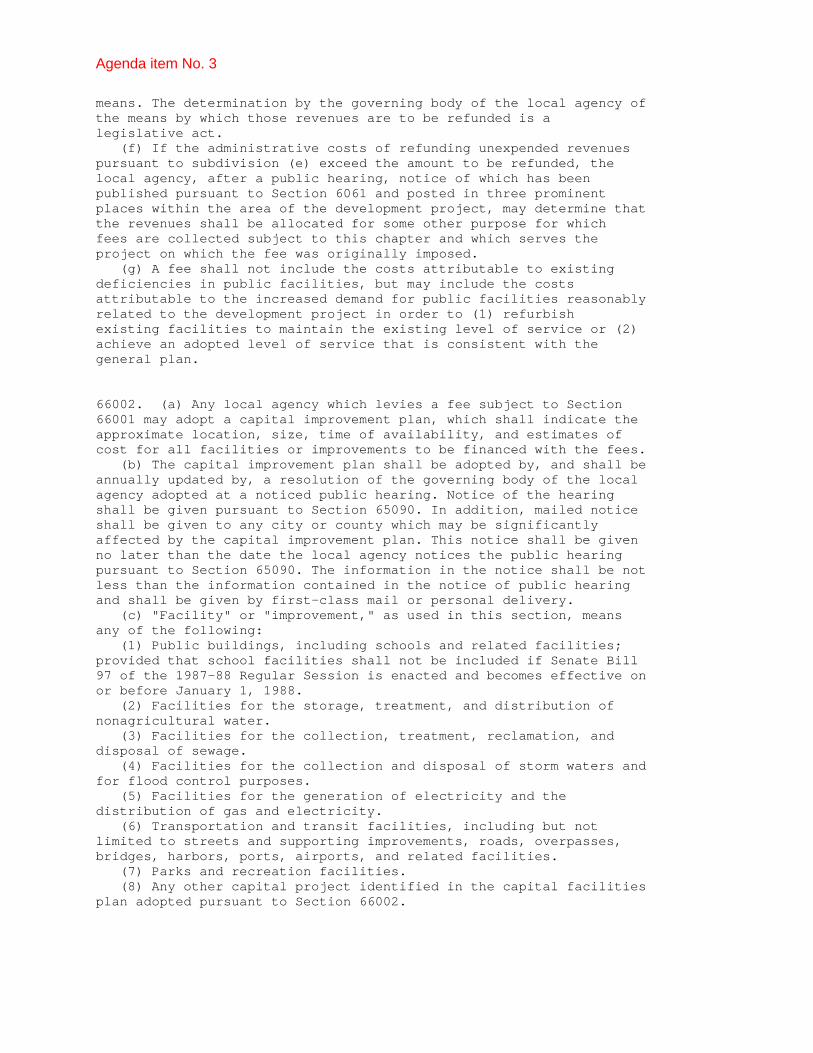
means. The determination by the governing body of the local agency of the means by which those revenues are to be refunded is a legislative act. (f) If the administrative costs of refunding unexpended revenues pursuant to subdivision (e) exceed the amount to be refunded, the local agency, after a public hearing, notice of which has been published pursuant to Section 6061 and posted in three prominent places within the area of the development project, may determine that the revenues shall be allocated for some other purpose for which fees are collected subject to this chapter and which serves the project on which the fee was originally imposed. (g) A fee shall not include the costs attributable to existing deficiencies in public facilities, but may include the costs attributable to the increased demand for public facilities reasonably related to the development project in order to (1) refurbish existing facilities to maintain the existing level of service or (2) achieve an adopted level of service that is consistent with the general plan. 66002. (a) Any local agency which levies a fee subject to Section 66001 may adopt a capital improvement plan, which shall indicate the approximate location, size, time of availability, and estimates of cost for all facilities or improvements to be financed with the fees. (b) The capital improvement plan shall be adopted by, and shall be annually updated by, a resolution of the governing body of the local agency adopted at a noticed public hearing. Notice of the hearing shall be given pursuant to Section 65090. In addition, mailed notice shall be given to any city or county which may be significantly affected by the capital improvement plan. This notice shall be given no later than the date the local agency notices the public hearing pursuant to Section 65090. The information in the notice shall be not less than the information contained in the notice of public hearing and shall be given by first-class mail or personal delivery. (c) "Facility" or "improvement," as used in this section, means any of the following: (1) Public buildings, including schools and related facilities; provided that school facilities shall not be included if Senate Bill 97 of the 1987-88 Regular Session is enacted and becomes effective on or before January 1, 1988. (2) Facilities for the storage, treatment, and distribution of nonagricultural water. (3) Facilities for the collection, treatment, reclamation, and disposal of sewage. (4) Facilities for the collection and disposal of storm waters and for flood control purposes. (5) Facilities for the generation of electricity and the distribution of gas and electricity. (6) Transportation and transit facilities, including but not limited to streets and supporting improvements, roads, overpasses, bridges, harbors, ports, airports, and related facilities. (7) Parks and recreation facilities. (8) Any other capital project identified in the capital facilities plan adopted pursuant to Section 66002.
Agenda item No. 3

66003. Sections 66001 and 66002 do not apply to a fee imposed pursuant to a reimbursement agreement by and between a local agency and a property owner or developer for that portion of the cost of a public facility paid by the property owner or developer which exceeds the need for the public facility attributable to and reasonably related to the development. This chapter shall become operative on January 1, 1989. 66004. The establishment or increase of any fee pursuant to this chapter shall be subject to the requirements of Section 66018. 66005. (a) When a local agency imposes any fee or exaction as a condition of approval of a proposed development, as defined by Section 65927, or development project, those fees or exactions shall not exceed the estimated reasonable cost of providing the service or facility for which the fee or exaction is imposed. (b) This section does not apply to fees or monetary exactions expressly authorized to be imposed under Sections 66475.1 and 66477. (c) It is the intent of the Legislature in adding this section to codify existing constitutional and decisional law with respect to the imposition of development fees and monetary exactions on developments by local agencies. This section is declaratory of existing law and shall not be construed or interpreted as creating new law or as modifying or changing existing law. 66005.1. (a) When a local agency imposes a fee on a housing development pursuant to Section 66001 for the purpose of mitigating vehicular traffic impacts, if that housing development satisfies all of the following characteristics, the fee, or the portion thereof relating to vehicular traffic impacts, shall be set at a rate that reflects a lower rate of automobile trip generation associated with such housing developments in comparison with housing developments without these characteristics, unless the local agency adopts findings after a public hearing establishing that the housing development, even with these characteristics, would not generate fewer automobile trips than a housing development without those characteristics: (1) The housing development is located within one-half mile of a transit station and there is direct access between the housing development and the transit station along a barrier-free walkable pathway not exceeding one-half mile in length. (2) Convenience retail uses, including a store that sells food, are located within one-half mile of the housing development. (3) The housing development provides either the minimum number of parking spaces required by the local ordinance, or no more than one onsite parking space for zero to two bedroom units, and two onsite parking spaces for three or more bedroom units, whichever is less. (b) If a housing development does not satisfy the characteristics in subdivision (a), the local agency may charge a fee that is proportional to the estimated rate of automobile trip generation associated with the housing development.
Agenda item No. 3
(c) As used in this section, "housing development" means a development project with common ownership and financing consisting of residential use or mixed use where not less than 50 percent of the floorspace is for residential use. (d) For the purposes of this section, "transit station" has the meaning set forth in paragraph (4) of subdivision (b) of Section 65460.1. "Transit station" includes planned transit stations otherwise meeting this definition whose construction is programmed to be completed prior to the scheduled completion and occupancy of the housing development. (e) This section shall become operative on January 1, 2011. 66006. (a) If a local agency requires the payment of a fee specified in subdivision (c) in connection with the approval of a development project, the local agency receiving the fee shall deposit it with the other fees for the improvement in a separate capital facilities account or fund in a manner to avoid any commingling of the fees with other revenues and funds of the local agency, except for temporary investments, and expend those fees solely for the purpose for which the fee was collected. Any interest income earned by moneys in the capital facilities account or fund shall also be deposited in that account or fund and shall be expended only for the purpose for which the fee was originally collected. (b) (1) For each separate account or fund established pursuant to subdivision (a), the local agency shall, within 180 days after the last day of each fiscal year, make available to the public the following information for the fiscal year: (A) A brief description of the type of fee in the account or fund. (B) The amount of the fee. (C) The beginning and ending balance of the account or fund. (D) The amount of the fees collected and the interest earned. (E) An identification of each public improvement on which fees were expended and the amount of the expenditures on each improvement, including the total percentage of the cost of the public improvement that was funded with fees. (F) An identification of an approximate date by which the construction of the public improvement will commence if the local agency determines that sufficient funds have been collected to complete financing on an incomplete public improvement, as identified in paragraph (2) of subdivision (a) of Section 66001, and the public improvement remains incomplete. (G) A description of each interfund transfer or loan made from the account or fund, including the public improvement on which the transferred or loaned fees will be expended, and, in the case of an interfund loan, the date on which the loan will be repaid, and the rate of interest that the account or fund will receive on the loan. (H) The amount of refunds made pursuant to subdivision (e) of Section 66001 and any allocations pursuant to subdivision (f) of Section 66001. (2) The local agency shall review the information made available to the public pursuant to paragraph (1) at the next regularly scheduled public meeting not less than 15 days after this information is made available to the public, as required by this subdivision. Notice of the time and place of the meeting, including the address
Agenda item No. 3
where this information may be reviewed, shall be mailed, at least 15 days prior to the meeting, to any interested party who files a written request with the local agency for mailed notice of the meeting. Any written request for mailed notices shall be valid for one year from the date on which it is filed unless a renewal request is filed. Renewal requests for mailed notices shall be filed on or before April 1 of each year. The legislative body may establish a reasonable annual charge for sending notices based on the estimated cost of providing the service. (c) For purposes of this section, "fee" means any fee imposed to provide for an improvement to be constructed to serve a development project, or which is a fee for public improvements within the meaning of subdivision (b) of Section 66000, and that is imposed by the local agency as a condition of approving the development project. (d) Any person may request an audit of any local agency fee or charge that is subject to Section 66023, including fees or charges of school districts, in accordance with that section. (e) The Legislature finds and declares that untimely or improper allocation of development fees hinders economic growth and is, therefore, a matter of statewide interest and concern. It is, therefore, the intent of the Legislature that this section shall supersede all conflicting local laws and shall apply in charter cities. (f) At the time the local agency imposes a fee for public improvements on a specific development project, it shall identify the public improvement that the fee will be used to finance. 66006.5. (a) A city or county which imposes an assessment, fee, or charge, other than a tax, for transportation purposes may, by ordinance, prescribe conditions and procedures allowing real property which is needed by the city or county for local transportation purposes, or by the state for transportation projects which will not receive any federal funds, to be donated by the obligor in satisfaction or partial satisfaction of the assessment, fee, or charge. (b) To facilitate the implementation of subdivision (a), the Department of Transportation shall do all of the following: (1) Give priority to the refinement, modification, and enhancement of procedures and policies dealing with right-of-way donations in order to encourage and facilitate those donations. (2) Reduce or simplify paperwork requirements involving right-of-way procurement. (3) Increase communication and education efforts as a means to solicit and encourage voluntary right-of-way donations. (4) Enhance communication and coordination with local public entities through agreements of understanding that address state acceptance of right-of-way donations. 66007. (a) Except as otherwise provided in subdivisions (b) and (g), any local agency that imposes any fees or charges on a residential development for the construction of public improvements or facilities shall not require the payment of those fees or charges, notwithstanding any other provision of law, until the date of the
Agenda item No. 3

final inspection, or the date the certificate of occupancy is issued, whichever occurs first. However, utility service fees may be collected at the time an application for utility service is received. If the residential development contains more than one dwelling, the local agency may determine whether the fees or charges shall be paid on a pro rata basis for each dwelling when it receives its final inspection or certificate of occupancy, whichever occurs first; on a pro rata basis when a certain percentage of the dwellings have received their final inspection or certificate of occupancy, whichever occurs first; or on a lump-sum basis when the first dwelling in the development receives its final inspection or certificate of occupancy, whichever occurs first. (b) (1) Notwithstanding subdivision (a), the local agency may require the payment of those fees or charges at an earlier time if (A) the local agency determines that the fees or charges will be collected for public improvements or facilities for which an account has been established and funds appropriated and for which the local agency has adopted a proposed construction schedule or plan prior to final inspection or issuance of the certificate of occupancy or (B) the fees or charges are to reimburse the local agency for expenditures previously made. "Appropriated," as used in this subdivision, means authorization by the governing body of the local agency for which the fee is collected to make expenditures and incur obligations for specific purposes. (2) (A) Paragraph (1) does not apply to units reserved for occupancy by lower income households included in a residential development proposed by a nonprofit housing developer in which at least 49 percent of the total units are reserved for occupancy by lower income households, as defined in Section 50079.5 of the Health and Safety Code, at an affordable rent, as defined in Section 50053 of the Health and Safety Code. In addition to the contract that may be required under subdivision (c), a city, county, or city and county may require the posting of a performance bond or a letter of credit from a federally insured, recognized depository institution to guarantee payment of any fees or charges that are subject to this paragraph. Fees and charges exempted from paragraph (1) under this paragraph shall become immediately due and payable when the residential development no longer meets the requirements of this paragraph. (B) The exception provided in subparagraph (A) does not apply to fees and charges levied pursuant to Chapter 6 (commencing with Section 17620) of Part 10.5 of Division 1 of Title 1 of the Education Code. (c) (1) If any fee or charge specified in subdivision (a) is not fully paid prior to issuance of a building permit for construction of any portion of the residential development encumbered thereby, the local agency issuing the building permit may require the property owner, or lessee if the lessee's interest appears of record, as a condition of issuance of the building permit, to execute a contract to pay the fee or charge, or applicable portion thereof, within the time specified in subdivision (a). If the fee or charge is prorated pursuant to subdivision (a), the obligation under the contract shall be similarly prorated. (2) The obligation to pay the fee or charge shall inure to the benefit of, and be enforceable by, the local agency that imposed the fee or charge, regardless of whether it is a party to the contract. The contract shall contain a legal description of the property
Agenda item No. 3
affected, shall be recorded in the office of the county recorder of the county and, from the date of recordation, shall constitute a lien for the payment of the fee or charge, which shall be enforceable against successors in interest to the property owner or lessee at the time of issuance of the building permit. The contract shall be recorded in the grantor-grantee index in the name of the public agency issuing the building permit as grantee and in the name of the property owner or lessee as grantor. The local agency shall record a release of the obligation, containing a legal description of the property, in the event the obligation is paid in full, or a partial release in the event the fee or charge is prorated pursuant to subdivision (a). (3) The contract may require the property owner or lessee to provide appropriate notification of the opening of any escrow for the sale of the property for which the building permit was issued and to provide in the escrow instructions that the fee or charge be paid to the local agency imposing the same from the sale proceeds in escrow prior to disbursing proceeds to the seller. (d) This section applies only to fees collected by a local agency to fund the construction of public improvements or facilities. It does not apply to fees collected to cover the cost of code enforcement or inspection services, or to other fees collected to pay for the cost of enforcement of local ordinances or state law. (e) "Final inspection" or "certificate of occupancy," as used in this section, have the same meaning as described in Sections 305 and 307 of the Uniform Building Code, International Conference of Building Officials, 1985 edition. (f) Methods of complying with the requirement in subdivision (b) that a proposed construction schedule or plan be adopted, include, but are not limited to, (1) the adoption of the capital improvement plan described in Section 66002, or (2) the submittal of a five-year plan for construction and rehabilitation of school facilities pursuant to subdivision (c) of Section 17017.5 of the Education Code. (g) A local agency may defer the collection of one or more fees up to the close of escrow. This subdivision shall not apply to fees and charges levied pursuant to Chapter 6 (commencing with Section 17620) of Part 10.5 of Division 1 of Title 1 of the Education Code. 66008. A local agency shall expend a fee for public improvements, as accounted for pursuant to Section 66006, solely and exclusively for the purpose or purposes, as identified in subdivision (f) of Section 66006, for which the fee was collected. The fee shall not be levied, collected, or imposed for general revenue purposes.
Agenda item No. 3

Appendix
APPENDIX B: TRAFFIC VOLUMES
Agenda item No. 3

City of Rialto
Traffic/Transportation Fee Program Study
Appendix B-1Existing Intersection Volumes - Area A
El Rivino Rd
5
Agua
Man
sa R
d
210
Sycam
ore
Ave
Riverside Ave
Willo
w A
ve
Rialto Ave
Merrill Ave
Randall Ave
San Bernardino Ave
Locust A
ve
Lin
den A
ve
Cedar A
ve
Foothill Blvd
Base Line Rd
Valley Blvd
Ald
er A
ve
10
Pepper A
ve
Walnut Ave
Santa Ana Ave
215
15
Rive
rside A
ve
Rialto Airport
San
ta A
na R
iver
215
Sta
te S
t
Cajon B
lvd
Slover Ave
Jurupa Ave
Sie
rra A
ve
Cactu
s A
ve
Lila
c A
ve
Etiwanda Ave
Renaissance Pkwy
Ranch
o R
d
La C
adena D
r
Metrolink
12
3
4
567
8
9 11
10
20
12
13141516
18
23
22
24
25
26
27
31
32
33
35
36
38
414243
44
46
49
50
17
19
28
34
47
37
40
39
45
21 29
30
48
Legend
City of Rialto
Sphere of Influence
Study IntersectionXX
NNOT TO SCALE
1. Sierra Ave & I-15 NB Ramp
51
5/3
34
15
5/3
14
47
/12
46
06
/32
4
197/2761/9
114/251
2. Sierra Ave & Riverside Ave
16
8/3
86
118
/14
6
30
6/3
92
36
9/2
24
152/85394/281
3. Live Oak Ave & Riverside Ave
33
6/1
78
64
/25
316/224143/258
20/62280/242
4. Alder Ave & Riverside Ave
97
/47
16
6/5
8
326/19249/66
89/141205/268
5. Alder Ave & Sierra Lakes Pkwy
36
/57
10
9/1
47
24
5/2
78
17
/31
12
6/1
99
6/1
6
5/540/168
31/98
310/28337/14423/8
6. Alder Ave & SR-210 WB Ramps
39
0/3
08
36
3/4
32
16
9/2
21
51
3/3
27
226/1741/184/60
7. Alder Ave & SR-210 EB Ramps
39
2/3
94
19
1/1
80
45
/11
92
63
/24
6
181/2932/2
300/298
8. Alder Ave & Renaissance Pkwy
65
/55
15
/51
91
7/4
0
65
/21
46
1/4
77
26
/47
66/4665/6576/12
62/5568/4919/63
9. Alder Ave & Base Line Rd
14
6/4
33
23
/36
37
7/3
5
15
9/4
43
51
/30
47
7/2
6
76/36386/309
66/143
42/180297/316195/62
10. Locust Ave & Sierra Lakes Pkwy
2/3
31
/60
0/1
17
/44
97
/16
52
44
/28
2
187/24847/153
2/5
1/159/9136/34
11. Locust Ave & Base Line Rd
88/8
23
7/4
5
3/0
1/0
3/4
7/0228/401
64/120
23/35248/3303/1
12. Ayala Dr & Riverside Ave
80/6
41
50/5
7
436/33589/70
111/90392/403
13. Ayala Dr & Casmalia St
113
/129
367/4
56
98/1
05
15
/16
39
/31
41
5/8
7/2849/65
197/134
193/10836/3420/10
14. Ayala Dr & SR-210 WB Ramps
743/5
05
405/5
32
60
0/3
54
40
7/1
96
362/2983/6206/200
15. Ayala Dr & SR-210 EB Ramps
809/6
33
291/3
06
23
7/1
39
48
6/4
21
0/1
83/2241/3
321/549
16. Ayala Dr & Renaissance Pkwy
111/6
780
7/7
68
13
/23
79/2
25
684/7
47
6/4
28/2961/49
160/121
8/1369/27266/115
17. Cedar Ave & Base Line Rd
26
/58
53
9/5
09
90
/14
4
41/7
9596/5
53
50/5
7
145/145253/290
58/50
61/107267/28861/56
Volumes have been rounded to the nearest 5 trips and balanced between the two intersections
Note:
Agenda item No. 3
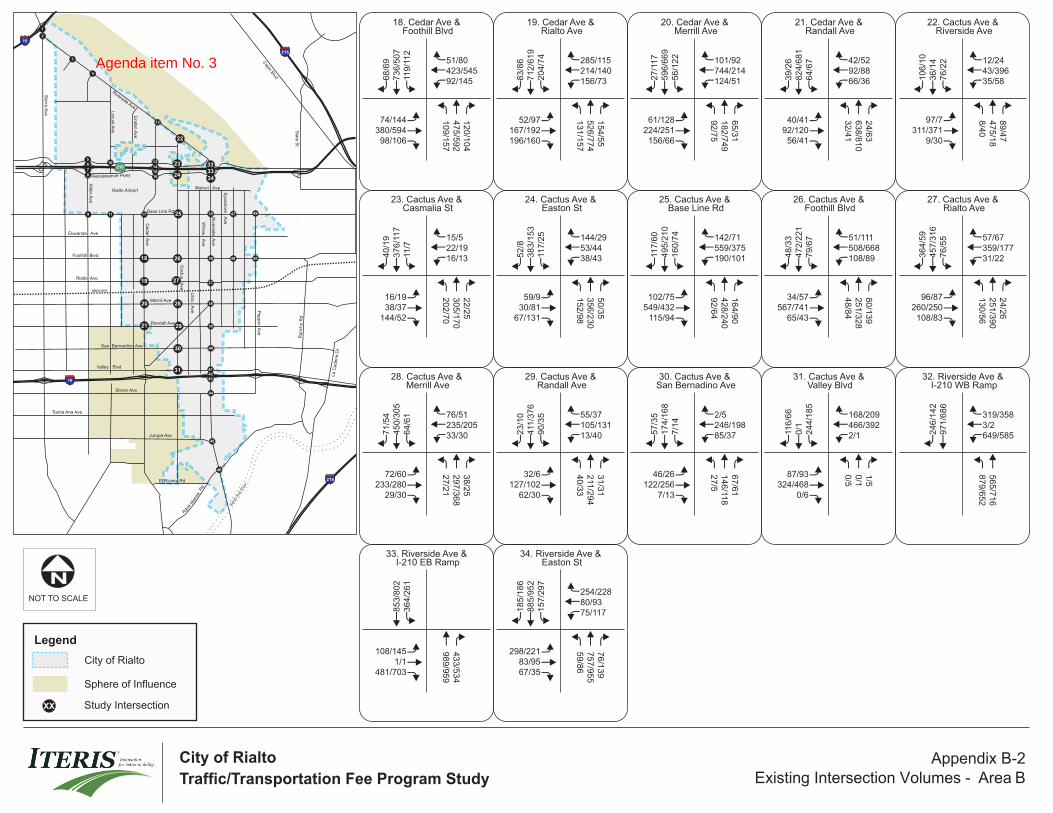
City of Rialto
Traffic/Transportation Fee Program Study
El Rivino Rd
5
Agua
Man
sa R
d
210
Sycam
ore
Ave
Riverside Ave
Willo
w A
ve
Rialto Ave
Merrill Ave
Randall Ave
San Bernardino Ave
Locust A
ve
Lin
den A
ve
Cedar A
ve
Foothill Blvd
Base Line Rd
Valley Blvd
Ald
er A
ve
10
Pepper A
ve
Walnut Ave
Santa Ana Ave
215
15
Rive
rside A
ve
Rialto Airport
San
ta A
na R
iver
215
Sta
te S
t
Cajon B
lvd
Slover Ave
Jurupa Ave
Sie
rra A
ve
Cactu
s A
ve
Lila
c A
ve
Etiwanda Ave
Renaissance Pkwy
Ranch
o R
d
La C
adena D
r
Metrolink
1
2
3
4
56
7
8
9 11
10
20
12
13141516
18
23
22
24
25
26
27
31
3233
35
36
38
414243
44
46
49
50
17
19
28
34
47
37
40
39
45
21 29
30
48
Legend
City of Rialto
Sphere of Influence
Study IntersectionXX
NNOT TO SCALE
18. Cedar Ave & Foothill Blvd
10
9/1
57
47
5/5
92
12
0/1
04
119
/11
27
36
/50
76
8/6
9
74/144380/594
98/106
92/145423/54551/80
19. Cedar Ave & Rialto Ave
13
1/1
57
52
6/7
74
15
4/5
5
20
4/7
47
12
/61
98
3/8
6
52/97167/192196/160
156/73214/140285/115
20. Cedar Ave & Merrill Ave
92
/75
18
2/7
49
65
/31
56
/12
25
96
/66
92
7/1
17
61/128224/251
156/66
124/51744/214101/92
21. Cedar Ave & Randall Ave
32
/41
63
8/8
10
24
/63
64
/67
82
4/6
81
39
/26
40/4192/120
56/41
66/3692/8842/52
22. Cactus Ave & Riverside Ave
8/4
04
75
/18
89
/47
76
/22
36
/14
10
6/1
0
97/7311/371
9/30
35/5843/39612/24
23. Cactus Ave & Casmalia St
20
2/7
03
05
/17
02
2/2
5
11/7
37
6/1
17
40
/19
16/1938/37
144/52
16/1322/1915/5
24. Cactus Ave & Easton St
15
2/9
83
56
/23
05
0/3
5
117
/25
38
3/1
53
52
/8
59/930/81
67/131
38/4353/44144/29
25. Cactus Ave & Base Line Rd
92
/64
42
8/2
40
16
4/9
0
16
0/7
44
95
/21
011
7/6
0
102/75549/432
115/94
190/101559/375142/71
26. Cactus Ave & Foothill Blvd
48
/84
25
1/3
28
80
/13
9
79
/67
47
2/2
21
48
/33
34/57567/741
65/43
108/89508/66851/111
27. Cactus Ave & Rialto Ave
13
0/5
62
51
/39
02
4/2
6
76
/55
45
7/3
16
36
4/5
9
96/87260/250
108/83
31/22359/17757/67
28. Cactus Ave & Merrill Ave
27/2
12
97/3
68
38/2
5
64
/61
45
0/3
05
71
/54
72/60233/280
29/30
33/30235/20576/51
29. Cactus Ave & Randall Ave
40/3
32
11/2
94
31/3
1
90
/35
411
/37
62
3/1
0
32/6127/102
62/30
13/40105/13155/37
30. Cactus Ave & San Bernadino Ave
27/5
146/11
86
7/6
1
7/1
41
74
/16
85
7/3
5
46/26122/256
7/13
85/37246/1982/5
31. Cactus Ave & Valley Blvd
0/5
0/1
1/5
24
4/1
85
0/1
116
/66
87/93324/468
0/6
2/1466/392168/209
32. Riverside Ave & I-210 WB Ramp
879/6
52
565/7
16
97
1/6
86
24
6/1
42
649/5853/2319/358
33. Riverside Ave & I-210 EB Ramp
98
9/9
59
43
3/5
34
364/2
61
853/8
02
108/1451/1
481/703
34. Riverside Ave & Easton St
59
/86
75
7/9
55
76
/13
9
157/2
97
885/9
52
185/1
86
298/22183/9567/35
75/11780/93254/228
Volumes have been rounded to the nearest 5 trips and balanced between the two intersections
Note:
Appendix B-2 Existing Intersection Volumes - Area B
Agenda item No. 3
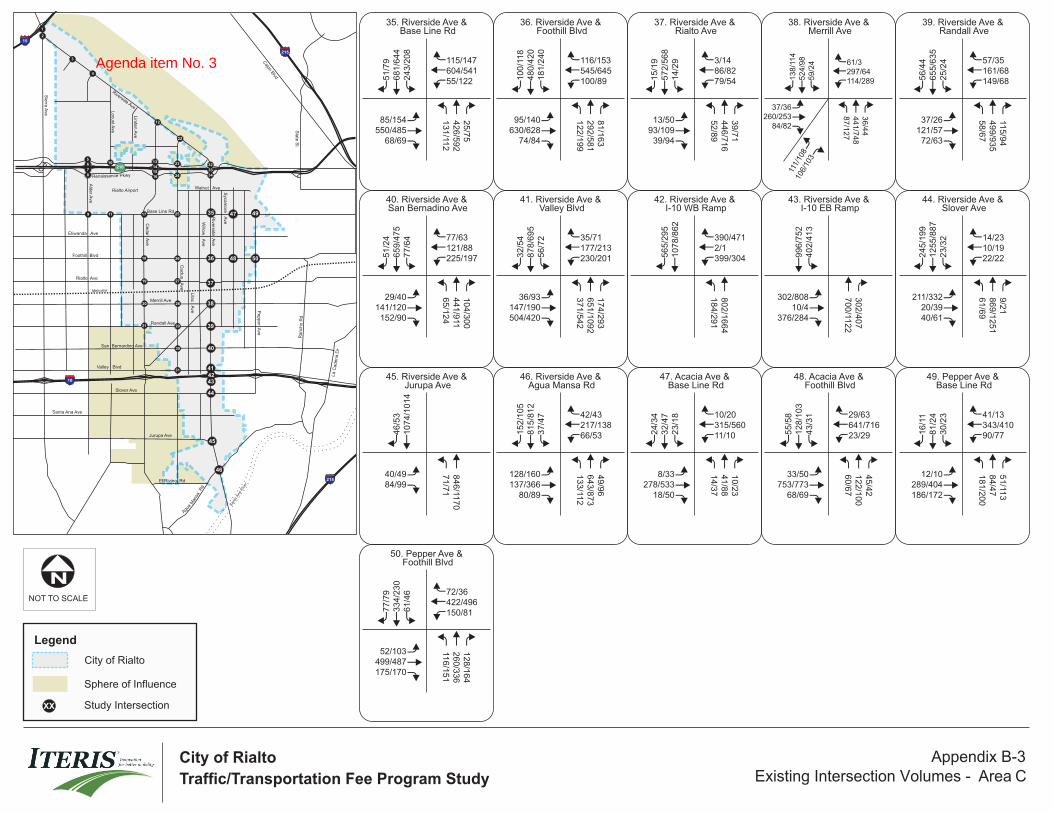
City of Rialto
Traffic/Transportation Fee Program Study
El Rivino Rd
5
Agua
Man
sa R
d
210
Sycam
ore
Ave
Riverside Ave
Willo
w A
ve
Rialto Ave
Merrill Ave
Randall Ave
San Bernardino Ave
Locust A
ve
Lin
den A
ve
Cedar A
ve
Foothill Blvd
Base Line Rd
Valley Blvd
Ald
er A
ve
10
Pepper A
ve
Walnut Ave
Santa Ana Ave
215
15
Rive
rside A
ve
Rialto Airport
San
ta A
na R
iver
215
Sta
te S
t
Cajon B
lvd
Slover Ave
Jurupa Ave
Sie
rra A
ve
Cactu
s A
ve
Lila
c A
ve
Etiwanda Ave
Renaissance Pkwy
Ranch
o R
d
La C
adena D
r
Metrolink
1
2
3
4
56
7
8
9 11
10
20
12
13141516
18
23
22
24
25
26
27
31
32
33
35
36
38
414243
44
46
49
50
17
19
28
34
47
37
40
39
45
21 29
30
48
Legend
City of Rialto
Sphere of Influence
Study IntersectionXX
NNOT TO SCALE
35. Riverside Ave & Base Line Rd
13
1/11
24
26
/59
22
5/7
5
24
3/2
08
68
1/6
44
51
/79
85/154550/485
68/69
55/122604/541115/147
36. Riverside Ave & Foothill Blvd
12
2/1
99
29
2/5
81
81
/16
3
18
1/2
40
48
0/4
20
10
0/1
18
95/140630/628
74/84
100/89545/645116/153
37. Riverside Ave & Rialto Ave
52
/89
44
6/7
16
39
/71
14
/29
57
2/5
68
15
/19
13/5093/109
39/94
79/5486/823/14
39. Riverside Ave & Randall Ave
58
/67
49
9/9
35
115
/94
25
/24
65
5/6
35
56
/44
37/26121/57
72/63
149/68161/6857/35
40. Riverside Ave & San Bernadino Ave
65
/12
44
41
/911
10
4/3
00
77
/64
65
9/4
75
51
/24
29/40141/120
152/90
225/197121/8877/63
41. Riverside Ave & Valley Blvd
37
1/5
42
65
1/1
09
21
74
/29
3
56
/72
87
8/6
95
32
/54
36/93147/190504/420
230/201177/21335/71
42. Riverside Ave & I-10 WB Ramp
18
4/2
91
80
2/1
66
4
10
78
/86
25
65
/29
5
399/3042/1390/471
43. Riverside Ave & I-10 EB Ramp
70
0/11
22
30
2/4
07
40
2/4
13
99
6/7
52
302/80810/4
376/284
44. Riverside Ave & Slover Ave
61
/69
86
9/1
25
19
/21
23
/32
12
55
/88
72
45
/19
9
211/33220/3940/61
22/2210/1914/23
45. Riverside Ave & Jurupa Ave
71/7
18
46/11
70
10
74
/10
14
46
/53
40/4984/99
46. Riverside Ave & Agua Mansa Rd
133/11
26
43/8
73
49/9
6
37
/47
81
5/8
12
15
2/1
05
128/160137/366
80/89
66/53217/13842/43
47. Acacia Ave & Base Line Rd
14/3
74
1/8
81
0/2
3
23
/18
32
/47
24
/34
8/33278/533
18/50
11/10315/56010/20
48. Acacia Ave & Foothill Blvd
60/6
71
22/1
00
45/4
2
43
/31
12
8/1
03
55
/58
33/50753/773
68/69
23/29641/71629/63
49. Pepper Ave & Base Line Rd
181/2
00
84/4
75
1/11
3
30
/23
81
/24
16
/11
12/10289/404186/172
90/77343/41041/13
50. Pepper Ave & Foothill Blvd
116
/151
26
0/3
36
12
8/1
64
61/4
6334/2
30
77/7
9
52/103499/487175/170
150/81422/49672/36
38. Riverside Ave & Merrill Ave
87/1
27
441/7
48
36/4
4
59/2
4524/9
8138/1
14
37/36260/253
84/82
114/289297/6461/3
111/
108
106/
103
Volumes have been rounded to the nearest 5 trips and balanced between the two intersections
Note:
Appendix B-3 Existing Intersection Volumes - Area C
Agenda item No. 3

City of Rialto
Traffic/Transportation Fee Program Study
El Rivino Rd
5
Agua
Man
sa R
d
210
Sycam
ore
Ave
Riverside Ave
Willo
w A
ve
Rialto Ave
Merrill Ave
Randall Ave
San Bernardino Ave
Locust A
ve
Lin
den A
ve
Cedar A
ve
Foothill Blvd
Base Line Rd
Valley Blvd
Ald
er A
ve
10
Pepper A
ve
Walnut Ave
Santa Ana Ave
215
15
Rive
rside A
ve
Rialto Airport
San
ta A
na R
iver
215
Sta
te S
t
Cajon B
lvd
Slover Ave
Jurupa Ave
Sie
rra A
ve
Cactu
s A
ve
Lila
c A
ve
Etiwanda Ave
Renaissance Pkwy
Ranch
o R
d
La C
adena D
r
Metrolink
12
3
4
567
8
9 11
10
20
12
13141516
18
23
22
24
25
26
27
31
32
33
35
36
38
414243
44
46
49
50
17
19
28
34
47
37
40
39
45
21 29
30
48
Legend
City of Rialto
Sphere of Influence
Study IntersectionXX
NNOT TO SCALE
1. Sierra Ave & I-15 NB Ramp
2. Sierra Ave & Riverside Ave
3. Live Oak Ave & Riverside Ave
4. Alder Ave & Riverside Ave
5. Alder Ave & Sierra Lakes Pkwy
6. Alder Ave & SR-210 WB Ramps
7. Alder Ave & SR-210 EB Ramps
8. Alder Ave & Renaissance Pkwy
9. Alder Ave & Base Line Rd
10. Locust Ave & Sierra Lakes Pkwy
11. Locust Ave & Base Line Rd
12. Ayala Dr & Riverside Ave
13. Ayala Dr & Casmalia St
14. Ayala Dr & SR-210 WB Ramps
15. Ayala Dr & SR-210 EB Ramps
16. Ayala Dr & Renaissance Pkwy
17. Cedar Ave & Base Line Rd
64
5/11
86
31
2/8
05
94
/29
81
75
2/5
86
196/1632/4
262/81
28
1/1
61
112
/60
967/597151/108
32/94636/893
22
4/3
19
12
3/1
24
770/563255/205
174/120568/683
63
/71
27
3/4
97
30
1/2
99
25
/41
47
8/3
85
13
/24
8/1533/16265/137
530/37235/15031/23
43
6/6
27
54
3/7
94
43
0/4
20
64
3/4
77
409/2996½99/71
73
4/1
08
42
72
/33
1
60
/14
67
85
/57
0
247/3372/1
697/380
35
/36
81
/74
22
5/7
8
57
3/2
49
78
9/5
30
10
5/1
56
165/154180/296
39/5
100/60221/165170/520
43
2/3
09
34
0/3
37
87
/62
84
/41
32
3/3
47
10
7/9
5
150/55811/896244/512
79/147839/834195/21
29
/30
17
3/3
02
0/7
7/3
12
85
/33
02
72
/30
3
133/23230/185
10/17
5/2103/9224/17
160/94304/921
39/130
21/59730/525143/74
124/9
22
38/2
12
499/66698/104
201/208722/484
175/1
36
551/6
49
113
/123
20
/37
34
/56
32
8/2
1
11/5963/115
205/151
222/10768/4737/18
641
/553
491
/647
76
9/5
31
39
1/2
90
559/3513/7338/250
1017
/970
336/6
57
42
9/2
96
90
3/5
86
114/2301/4
415/513
26
5/1
20
86
3/1
05
13/7
159/3
38
947/6
78
134/3
3
132/37070/142
125/213
2/3209/64360/207
14
7/1
43
611
/55
19
8/1
78
30/1
05
609/6
30
190/1
50
249/398420/908135/134
65/1001047/63147/54
110
/71
20/1
951/2
7
34
/17
97
/36
46
/19
9
0/0
411
/92
88
/22
68
3/3
53
95
8/4
44
49
/33
14/11234/307
0/0
10/13156/58671/724
Volumes have been rounded to the nearest 5 trips and balanced between the two intersections
Note:
Appendix B-4 2040 Intersection Volumes - Area A
Agenda item No. 3

City of Rialto
Traffic/Transportation Fee Program Study
El Rivino Rd
5
Agua
Man
sa R
d
210
Sycam
ore
Ave
Riverside Ave
Willo
w A
ve
Rialto Ave
Merrill Ave
Randall Ave
San Bernardino Ave
Locust A
ve
Lin
den A
ve
Cedar A
ve
Foothill Blvd
Base Line Rd
Valley Blvd
Ald
er A
ve
10
Pepper A
ve
Walnut Ave
Santa Ana Ave
215
15
Rive
rside A
ve
Rialto Airport
San
ta A
na R
iver
215
Sta
te S
t
Cajon B
lvd
Slover Ave
Jurupa Ave
Sie
rra A
ve
Cactu
s A
ve
Lila
c A
ve
Etiwanda Ave
Renaissance Pkwy
Ranch
o R
d
La C
adena D
r
Metrolink
1
2
3
4
56
7
8
9 11
10
20
12
13141516
18
23
22
24
25
26
27
31
3233
35
36
38
414243
44
46
49
50
17
19
28
34
47
37
40
39
45
21 29
30
48
Legend
City of Rialto
Sphere of Influence
Study IntersectionXX
NNOT TO SCALE
18. Cedar Ave & Foothill Blvd
19. Cedar Ave & Rialto Ave
20. Cedar Ave & Merrill Ave
21. Cedar Ave & Randall Ave
22. Cactus Ave & Riverside Ave
23. Cactus Ave & Casmalia St
24. Cactus Ave & Easton St
25. Cactus Ave & Base Line Rd
26. Cactus Ave & Foothill Blvd
27. Cactus Ave & Rialto Ave
28. Cactus Ave & Merrill Ave
29. Cactus Ave & Randall Ave
30. Cactus Ave & San Bernadino Ave
31. Cactus Ave & Valley Blvd
32. Riverside Ave & I-210 WB Ramp
33. Riverside Ave & I-210 EB Ramp
34. Riverside Ave & Easton St
15
2/2
23
58
1/7
08
15
6/2
04
13
3/1
67
82
0/5
69
81
/74
106/166573/1129148/150
186/227920/82098/102
17
3/1
79
66
7/9
95
24
8/1
27
20
1/8
88
80
/77
96
8/5
0
31/65123/231181/205
257/150232/133296/123
72
/54
31
9/9
85
79
/49
93
/26
98
11/8
02
29
/12
0
88/136226/313
128/45
155/63742/230224/181
45
/34
75
3/9
76
15
/40
62
/93
96
8/7
22
84
/48
59/8273/127
53/33
43/19110/8242/70
43
/82
48
4/3
61
32
/62
37
/43
21
/41
19
8/3
0
94/24440/849
14/103
114/82460/57023/34
23
2/7
54
12
/22
92
4/4
8
12
/18
42
6/2
52
47
/28
22/2041/55
159/64
29/2140/2033/7
20
1/11
23
75
/27
64
4/3
1
13
6/7
14
02
/23
89
0/2
9
85/2937/18774/168
47/30109/72235/51
24
4/2
20
54
7/3
74
24
2/2
65
117
/74
56
8/3
96
15
5/7
0
99/74618/801203/331
326/2301105/527134/45
12
6/1
91
54
4/7
74
10
8/1
88
94
/10
78
11/6
77
113
/89
66/156695/1156
114/129
143/124924/82175/141
17
3/11
04
72
/84
24
2/8
0
94
/10
68
00
/67
73
39
/74
108/82277/327163/121
72/46442/21698/90
62/5
05
51/8
49
48/3
2
57
/60
85
8/6
89
115
/97
100/138223/357
59/88
50/45299/24278/59
49
/50
44
5/7
81
37
/60
114
/64
83
7/7
71
30
/15
43/799/8578/28
21/51107/11896/59
8/2
27
8/4
26
91
/90
56
/10
14
02
/35
61
09
/65
90/108169/437
3/6
162/59390/28719/72
0/3
0/1
1/7
45
4/3
86
0/1
12
3/6
9
84/99421/602
0/5
2/2599/457281/405
612/4
50
857/8
15
10
34
/11
31
25
1/2
18
501/4492/2514/423
13
25
/105
337
6/3
94
543/5
34
988/1
041
142/2111/1
320/435
97/1
02
855
/910
73/1
99
117/3
60
969/9
24
228/1
94
353/29784/191103/55
181/142220/118486/233
Volumes have been rounded to the nearest 5 trips and balanced between the two intersections
Note:
Appendix B-5 2040 Intersection Volumes - Area B
Agenda item No. 3

City of Rialto
Traffic/Transportation Fee Program Study
El Rivino Rd
5
Agua
Man
sa R
d
210
Sycam
ore
Ave
Riverside Ave
Willo
w A
ve
Rialto Ave
Merrill Ave
Randall Ave
San Bernardino Ave
Locust A
ve
Lin
den A
ve
Cedar A
ve
Foothill Blvd
Base Line Rd
Valley Blvd
Ald
er A
ve
10
Pepper A
ve
Walnut Ave
Santa Ana Ave
215
15
Rive
rside A
ve
Rialto Airport
San
ta A
na R
iver
215
Sta
te S
t
Cajon B
lvd
Slover Ave
Jurupa Ave
Sie
rra A
ve
Cactu
s A
ve
Lila
c A
ve
Etiwanda Ave
Renaissance Pkwy
Ranch
o R
d
La C
adena D
r
Metrolink
1
2
3
4
56
7
8
9 11
10
20
12
13141516
18
23
22
24
25
26
27
31
32
33
35
36
38
414243
44
46
49
50
17
19
28
34
47
37
40
39
45
21 29
30
48
Legend
City of Rialto
Sphere of Influence
Study IntersectionXX
NNOT TO SCALE
35. Riverside Ave & Base Line Rd
36. Riverside Ave & Foothill Blvd
37. Riverside Ave & Rialto Ave
39. Riverside Ave & Randall Ave
40. Riverside Ave & San Bernadino Ave
41. Riverside Ave & Valley Blvd
42. Riverside Ave & I-10 WB Ramp
43. Riverside Ave & I-10 EB Ramp
44. Riverside Ave & Slover Ave
45. Riverside Ave & Jurupa Ave
46. Riverside Ave & Agua Mansa Rd
47. Acacia Ave & Base Line Rd
48. Acacia Ave & Foothill Blvd
49. Pepper Ave & Base Line Rd
50. Pepper Ave & Foothill Blvd
38. Riverside Ave & Merrill Ave
81/1
36
480/9
95
36/4
5
40/1
0803/1
63
328/1
37
56/35203/155
61/103
181/302253/6128/3
142/
191
116/
161
23
0/1
63
40
5/5
33
32
/119
20
4/1
91
75
8/6
14
58
/67
76/155679/861111/128
94/1901032/742106/125
16
7/2
07
33
8/6
20
10
3/2
01
22
0/2
90
65
9/5
08
13
0/1
20
105/190770/985102/132
175/144906/874164/213
39
/94
48
6/9
66
29
/78
30
/55
94
0/6
65
32
/34
31/89148/157
49/84
94/65128/1527/33
50
/63
38
5/1
09
811
8/1
41
37
/37
84
6/5
83
71
/42
28/35124/96
63/64
186/74196/7862/49
90
/20
63
24
/10
39
12
4/4
17
10
2/8
58
28
/39
47
7/3
8
25/82198/296204/138
363/222237/19180/94
40
2/8
99
56
3/1
51
41
87
/51
6
60
/65
12
40
/68
53
4/4
5
35/100180/261820/637
534/264312/23948/67
24
7/6
00
95
2/2
55
4
22
70
/12
67
34
4/3
31
820/4341/1205/381
90
7/2
39
73
02
/83
7
52
6/4
40
25
69
/12
65
316/7728/4
601/413
57
/71
1113
/27
98
10
/0
36
/02
85
0/1
45
33
17
/17
8
176/42715/0
42/67
22/1310/614/16
92/2
13
113
5/2
50
6
24
48
/15
57
80
/10
5
46/61122/135
253/1
84
946/2
172
100/2
88
94
/94
19
50
/13
32
36
3/1
16
129/274192/751103/150
180/127588/22488/105
49
/44
75
/125
48
/52
37
/26
64
/10
02
7/2
6
3/33333/834
26/118
41/40703/78611/35
74/7
7123
/108
56/8
4
58
/60
17
2/1
17
72
/63
34/48986/1378
88/74
43/461194/106245/88
211
/258
44
3/6
87
12
/64
12
8/3
19
56
6/3
78
33
0/3
48
184/275201/430212/208
35/30401/317215/110
152
/20
14
63
/68
511
3/1
61
103/8
1631/4
32
194/1
88
132/335635/763249/282
197/91740/709170/79
Volumes have been rounded to the nearest 5 trips and balanced between the two intersections
Note:
Appendix B-6 2040 Intersection Volumes - Area C
Agenda item No. 3

Appendix
APPENDIX C: INTERSECTION LOS CALCULATION SHEETS
Agenda item No. 3

Rialto Impact Fee Study Existing Conditions1: Sierra Ave & I-15 NB Off Ramp/I-15 NB On Ramp Timing Plan: AM Peak Hour
Synchro 7 - ReportPage 1
Movement EBL EBT EBR WBL WBT WBR NBL NBT NBR SBL SBT SBRLane ConfigurationsSign Control Stop Stop Stop StopVolume (vph) 197 1 114 0 0 0 0 515 155 47 606 0Peak Hour Factor 0.94 0.94 0.94 0.94 0.94 0.94 0.94 0.94 0.94 0.94 0.94 0.94Hourly flow rate (vph) 210 1 121 0 0 0 0 548 165 50 645 0
Direction, Lane # EB 1 EB 2 NB 1 NB 2 SB 1 SB 2Volume Total (vph) 140 192 365 348 265 430Volume Left (vph) 140 70 0 0 50 0Volume Right (vph) 0 121 0 165 0 0Hadj (s) 0.53 -0.23 0.03 -0.30 0.13 0.03Departure Headway (s) 8.3 7.5 6.9 6.6 7.0 6.9Degree Utilization, x 0.32 0.40 0.70 0.63 0.51 0.82Capacity (veh/h) 401 442 508 530 502 512Control Delay (s) 14.0 14.4 23.3 19.0 16.0 33.3Approach Delay (s) 14.2 21.2 26.7Approach LOS B C D
Intersection SummaryDelay 22.1Level of Service CIntersection Capacity Utilization 58.8% ICU Level of Service BAnalysis Period (min) 15
Agenda item No. 3

Rialto Impact Fee Study Existing Conditions2: Sierra Ave & Riverside Ave Timing Plan: AM Peak Hour
Synchro 7 - ReportPage 2
Movement WBL WBR NBT NBR SBL SBTLane ConfigurationsSign Control Stop Stop StopVolume (vph) 152 394 168 118 306 369Peak Hour Factor 0.94 0.94 0.94 0.94 0.94 0.94Hourly flow rate (vph) 162 419 179 126 326 393
Direction, Lane # WB 1 WB 2 NB 1 NB 2 SB 1 SB 2Volume Total (vph) 162 419 179 126 326 393Volume Left (vph) 162 0 0 0 326 0Volume Right (vph) 0 419 0 126 0 0Hadj (s) 0.53 -0.67 0.03 -0.67 0.53 0.03Departure Headway (s) 7.7 6.5 7.6 6.9 7.5 7.0Degree Utilization, x 0.35 0.76 0.38 0.24 0.68 0.76Capacity (veh/h) 451 536 445 496 473 506Control Delay (s) 13.6 26.0 14.0 10.9 23.4 27.4Approach Delay (s) 22.5 12.7 25.6Approach LOS C B D
Intersection SummaryDelay 22.0Level of Service CIntersection Capacity Utilization 47.7% ICU Level of Service AAnalysis Period (min) 15
Agenda item No. 3
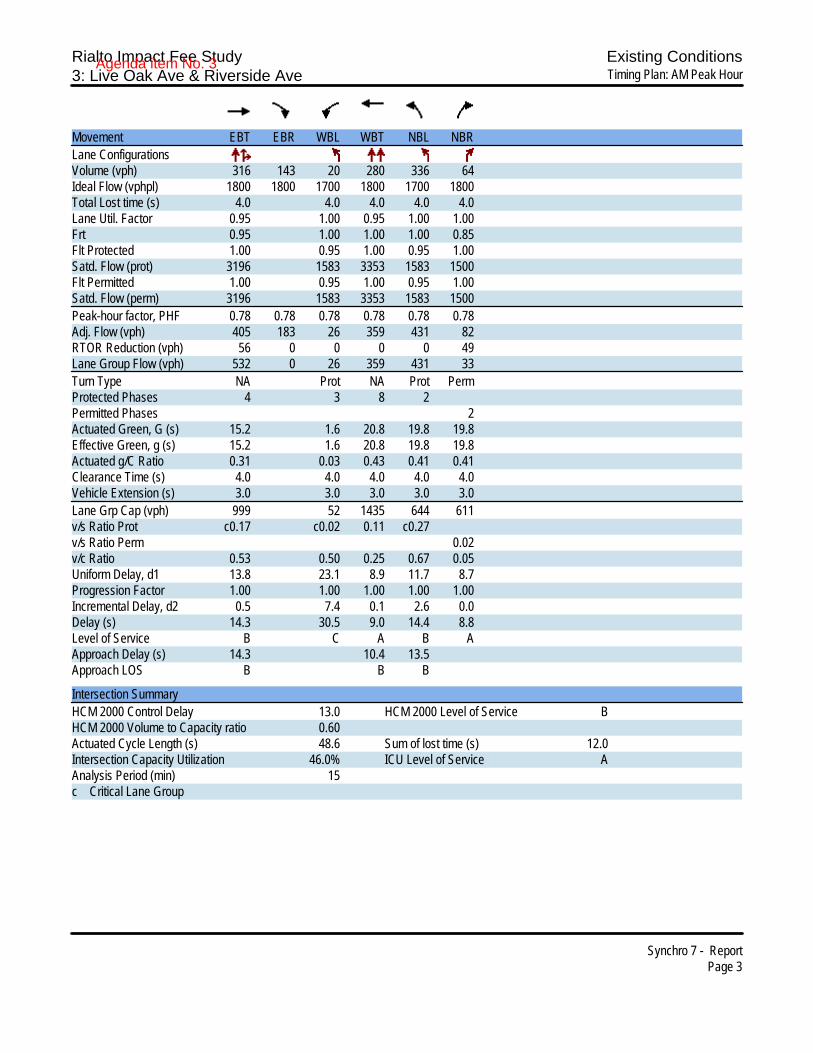
Rialto Impact Fee Study Existing Conditions3: Live Oak Ave & Riverside Ave Timing Plan: AM Peak Hour
Synchro 7 - ReportPage 3
Movement EBT EBR WBL WBT NBL NBRLane ConfigurationsVolume (vph) 316 143 20 280 336 64Ideal Flow (vphpl) 1800 1800 1700 1800 1700 1800Total Lost time (s) 4.0 4.0 4.0 4.0 4.0Lane Util. Factor 0.95 1.00 0.95 1.00 1.00Frt 0.95 1.00 1.00 1.00 0.85Flt Protected 1.00 0.95 1.00 0.95 1.00Satd. Flow (prot) 3196 1583 3353 1583 1500Flt Permitted 1.00 0.95 1.00 0.95 1.00Satd. Flow (perm) 3196 1583 3353 1583 1500Peak-hour factor, PHF 0.78 0.78 0.78 0.78 0.78 0.78Adj. Flow (vph) 405 183 26 359 431 82RTOR Reduction (vph) 56 0 0 0 0 49Lane Group Flow (vph) 532 0 26 359 431 33Turn Type NA Prot NA Prot PermProtected Phases 4 3 8 2Permitted Phases 2Actuated Green, G (s) 15.2 1.6 20.8 19.8 19.8Effective Green, g (s) 15.2 1.6 20.8 19.8 19.8Actuated g/C Ratio 0.31 0.03 0.43 0.41 0.41Clearance Time (s) 4.0 4.0 4.0 4.0 4.0Vehicle Extension (s) 3.0 3.0 3.0 3.0 3.0Lane Grp Cap (vph) 999 52 1435 644 611v/s Ratio Prot c0.17 c0.02 0.11 c0.27v/s Ratio Perm 0.02v/c Ratio 0.53 0.50 0.25 0.67 0.05Uniform Delay, d1 13.8 23.1 8.9 11.7 8.7Progression Factor 1.00 1.00 1.00 1.00 1.00Incremental Delay, d2 0.5 7.4 0.1 2.6 0.0Delay (s) 14.3 30.5 9.0 14.4 8.8Level of Service B C A B AApproach Delay (s) 14.3 10.4 13.5Approach LOS B B B
Intersection SummaryHCM 2000 Control Delay 13.0 HCM 2000 Level of Service BHCM 2000 Volume to Capacity ratio 0.60Actuated Cycle Length (s) 48.6 Sum of lost time (s) 12.0Intersection Capacity Utilization 46.0% ICU Level of Service AAnalysis Period (min) 15c Critical Lane Group
Agenda item No. 3
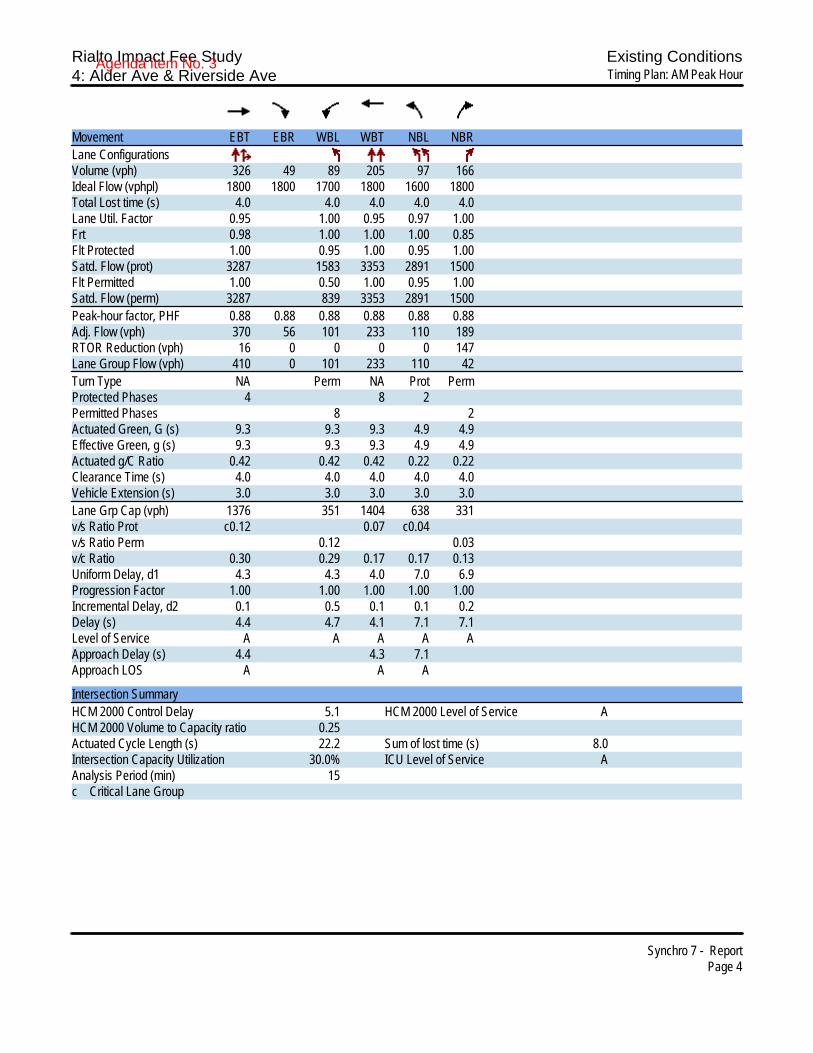
Rialto Impact Fee Study Existing Conditions4: Alder Ave & Riverside Ave Timing Plan: AM Peak Hour
Synchro 7 - ReportPage 4
Movement EBT EBR WBL WBT NBL NBRLane ConfigurationsVolume (vph) 326 49 89 205 97 166Ideal Flow (vphpl) 1800 1800 1700 1800 1600 1800Total Lost time (s) 4.0 4.0 4.0 4.0 4.0Lane Util. Factor 0.95 1.00 0.95 0.97 1.00Frt 0.98 1.00 1.00 1.00 0.85Flt Protected 1.00 0.95 1.00 0.95 1.00Satd. Flow (prot) 3287 1583 3353 2891 1500Flt Permitted 1.00 0.50 1.00 0.95 1.00Satd. Flow (perm) 3287 839 3353 2891 1500Peak-hour factor, PHF 0.88 0.88 0.88 0.88 0.88 0.88Adj. Flow (vph) 370 56 101 233 110 189RTOR Reduction (vph) 16 0 0 0 0 147Lane Group Flow (vph) 410 0 101 233 110 42Turn Type NA Perm NA Prot PermProtected Phases 4 8 2Permitted Phases 8 2Actuated Green, G (s) 9.3 9.3 9.3 4.9 4.9Effective Green, g (s) 9.3 9.3 9.3 4.9 4.9Actuated g/C Ratio 0.42 0.42 0.42 0.22 0.22Clearance Time (s) 4.0 4.0 4.0 4.0 4.0Vehicle Extension (s) 3.0 3.0 3.0 3.0 3.0Lane Grp Cap (vph) 1376 351 1404 638 331v/s Ratio Prot c0.12 0.07 c0.04v/s Ratio Perm 0.12 0.03v/c Ratio 0.30 0.29 0.17 0.17 0.13Uniform Delay, d1 4.3 4.3 4.0 7.0 6.9Progression Factor 1.00 1.00 1.00 1.00 1.00Incremental Delay, d2 0.1 0.5 0.1 0.1 0.2Delay (s) 4.4 4.7 4.1 7.1 7.1Level of Service A A A A AApproach Delay (s) 4.4 4.3 7.1Approach LOS A A A
Intersection SummaryHCM 2000 Control Delay 5.1 HCM 2000 Level of Service AHCM 2000 Volume to Capacity ratio 0.25Actuated Cycle Length (s) 22.2 Sum of lost time (s) 8.0Intersection Capacity Utilization 30.0% ICU Level of Service AAnalysis Period (min) 15c Critical Lane Group
Agenda item No. 3

Rialto Impact Fee Study Existing Conditions5: Alder Ave & Sierra Lakes Pkwy/Casmalia St Timing Plan: AM Peak Hour
Synchro 7 - ReportPage 5
Movement EBL EBT EBR WBL WBT WBR NBL NBT NBR SBL SBT SBRLane ConfigurationsVolume (vph) 5 40 45 453 37 23 42 125 280 17 184 6Ideal Flow (vphpl) 1700 1800 1800 1700 1800 1800 1700 1800 1800 1700 1800 1800Total Lost time (s) 4.0 4.0 4.0 4.0 4.0 4.0 4.0 4.0 4.0 4.0Lane Util. Factor 1.00 1.00 1.00 1.00 1.00 1.00 0.95 1.00 0.95 1.00Frt 1.00 0.92 1.00 1.00 0.85 1.00 0.90 1.00 1.00 0.85Flt Protected 0.95 1.00 0.95 1.00 1.00 0.95 1.00 0.95 1.00 1.00Satd. Flow (prot) 1583 1625 1583 1765 1500 1583 3005 1583 3353 1500Flt Permitted 0.73 1.00 0.70 1.00 1.00 0.63 1.00 0.49 1.00 1.00Satd. Flow (perm) 1219 1625 1165 1765 1500 1052 3005 814 3353 1500Peak-hour factor, PHF 0.96 0.96 0.96 0.96 0.96 0.96 0.96 0.96 0.96 0.96 0.96 0.96Adj. Flow (vph) 5 42 47 472 39 24 44 130 292 18 192 6RTOR Reduction (vph) 0 20 0 0 0 10 0 225 0 0 0 5Lane Group Flow (vph) 5 69 0 472 39 14 44 197 0 18 192 1Turn Type Perm NA Perm NA Perm Perm NA Perm NA PermProtected Phases 4 8 2 6Permitted Phases 4 8 8 2 6 6Actuated Green, G (s) 22.6 22.6 22.6 22.6 22.6 9.2 9.2 9.2 9.2 9.2Effective Green, g (s) 22.6 22.6 22.6 22.6 22.6 9.2 9.2 9.2 9.2 9.2Actuated g/C Ratio 0.57 0.57 0.57 0.57 0.57 0.23 0.23 0.23 0.23 0.23Clearance Time (s) 4.0 4.0 4.0 4.0 4.0 4.0 4.0 4.0 4.0 4.0Vehicle Extension (s) 3.0 3.0 3.0 3.0 3.0 3.0 3.0 3.0 3.0 3.0Lane Grp Cap (vph) 692 922 661 1002 851 243 694 188 775 346v/s Ratio Prot 0.04 0.02 c0.07 0.06v/s Ratio Perm 0.00 c0.40 0.01 0.04 0.02 0.00v/c Ratio 0.01 0.07 0.71 0.04 0.02 0.18 0.28 0.10 0.25 0.00Uniform Delay, d1 3.7 3.9 6.3 3.8 3.8 12.3 12.6 12.0 12.5 11.8Progression Factor 1.00 1.00 1.00 1.00 1.00 1.00 1.00 1.00 1.00 1.00Incremental Delay, d2 0.0 0.0 3.7 0.0 0.0 0.4 0.2 0.2 0.2 0.0Delay (s) 3.7 3.9 9.9 3.8 3.8 12.6 12.8 12.3 12.6 11.8Level of Service A A A A A B B B B BApproach Delay (s) 3.9 9.2 12.8 12.6Approach LOS A A B B
Intersection SummaryHCM 2000 Control Delay 10.7 HCM 2000 Level of Service BHCM 2000 Volume to Capacity ratio 0.59Actuated Cycle Length (s) 39.8 Sum of lost time (s) 8.0Intersection Capacity Utilization 61.2% ICU Level of Service BAnalysis Period (min) 15c Critical Lane Group
Agenda item No. 3
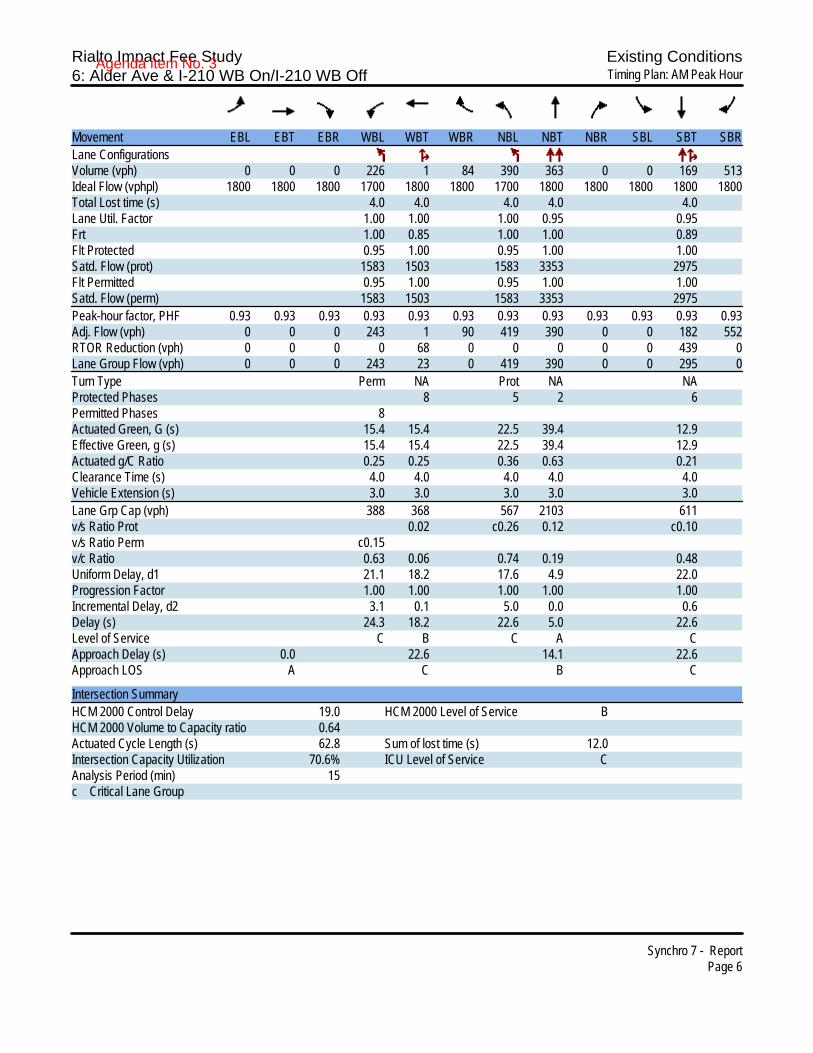
Rialto Impact Fee Study Existing Conditions6: Alder Ave & I-210 WB On/I-210 WB Off Timing Plan: AM Peak Hour
Synchro 7 - ReportPage 6
Movement EBL EBT EBR WBL WBT WBR NBL NBT NBR SBL SBT SBRLane ConfigurationsVolume (vph) 0 0 0 226 1 84 390 363 0 0 169 513Ideal Flow (vphpl) 1800 1800 1800 1700 1800 1800 1700 1800 1800 1800 1800 1800Total Lost time (s) 4.0 4.0 4.0 4.0 4.0Lane Util. Factor 1.00 1.00 1.00 0.95 0.95Frt 1.00 0.85 1.00 1.00 0.89Flt Protected 0.95 1.00 0.95 1.00 1.00Satd. Flow (prot) 1583 1503 1583 3353 2975Flt Permitted 0.95 1.00 0.95 1.00 1.00Satd. Flow (perm) 1583 1503 1583 3353 2975Peak-hour factor, PHF 0.93 0.93 0.93 0.93 0.93 0.93 0.93 0.93 0.93 0.93 0.93 0.93Adj. Flow (vph) 0 0 0 243 1 90 419 390 0 0 182 552RTOR Reduction (vph) 0 0 0 0 68 0 0 0 0 0 439 0Lane Group Flow (vph) 0 0 0 243 23 0 419 390 0 0 295 0Turn Type Perm NA Prot NA NAProtected Phases 8 5 2 6Permitted Phases 8Actuated Green, G (s) 15.4 15.4 22.5 39.4 12.9Effective Green, g (s) 15.4 15.4 22.5 39.4 12.9Actuated g/C Ratio 0.25 0.25 0.36 0.63 0.21Clearance Time (s) 4.0 4.0 4.0 4.0 4.0Vehicle Extension (s) 3.0 3.0 3.0 3.0 3.0Lane Grp Cap (vph) 388 368 567 2103 611v/s Ratio Prot 0.02 c0.26 0.12 c0.10v/s Ratio Perm c0.15v/c Ratio 0.63 0.06 0.74 0.19 0.48Uniform Delay, d1 21.1 18.2 17.6 4.9 22.0Progression Factor 1.00 1.00 1.00 1.00 1.00Incremental Delay, d2 3.1 0.1 5.0 0.0 0.6Delay (s) 24.3 18.2 22.6 5.0 22.6Level of Service C B C A CApproach Delay (s) 0.0 22.6 14.1 22.6Approach LOS A C B C
Intersection SummaryHCM 2000 Control Delay 19.0 HCM 2000 Level of Service BHCM 2000 Volume to Capacity ratio 0.64Actuated Cycle Length (s) 62.8 Sum of lost time (s) 12.0Intersection Capacity Utilization 70.6% ICU Level of Service CAnalysis Period (min) 15c Critical Lane Group
Agenda item No. 3
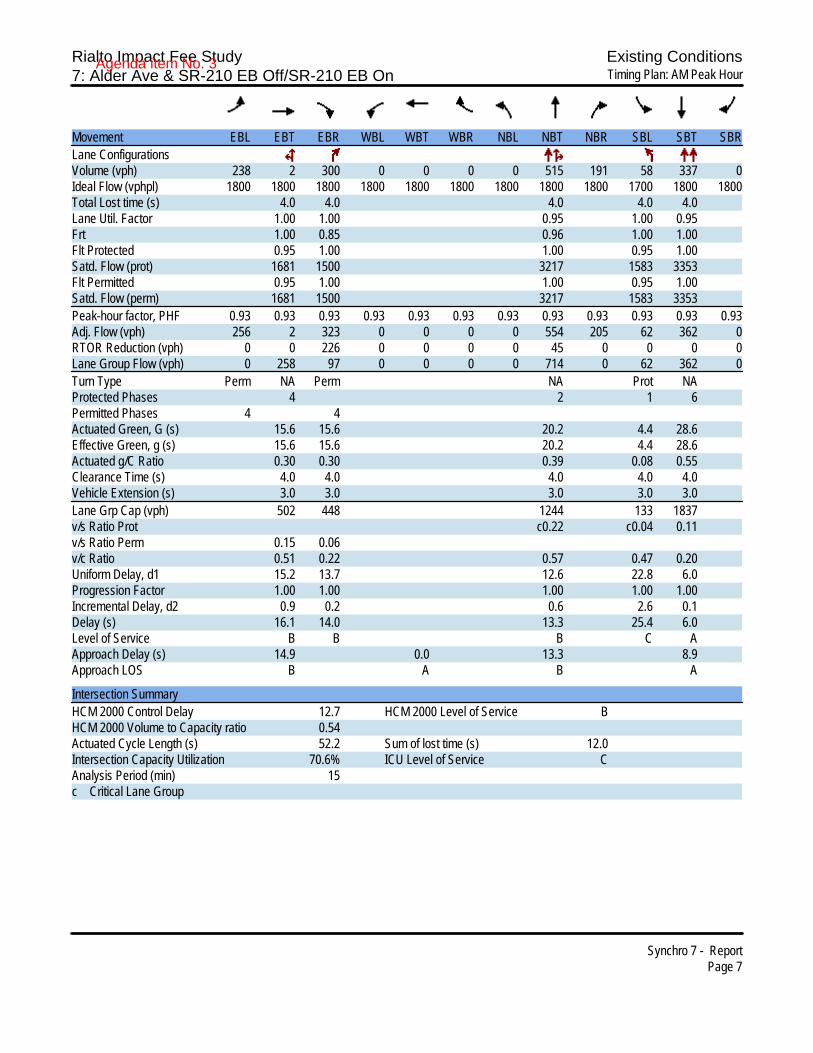
Rialto Impact Fee Study Existing Conditions7: Alder Ave & SR-210 EB Off/SR-210 EB On Timing Plan: AM Peak Hour
Synchro 7 - ReportPage 7
Movement EBL EBT EBR WBL WBT WBR NBL NBT NBR SBL SBT SBRLane ConfigurationsVolume (vph) 238 2 300 0 0 0 0 515 191 58 337 0Ideal Flow (vphpl) 1800 1800 1800 1800 1800 1800 1800 1800 1800 1700 1800 1800Total Lost time (s) 4.0 4.0 4.0 4.0 4.0Lane Util. Factor 1.00 1.00 0.95 1.00 0.95Frt 1.00 0.85 0.96 1.00 1.00Flt Protected 0.95 1.00 1.00 0.95 1.00Satd. Flow (prot) 1681 1500 3217 1583 3353Flt Permitted 0.95 1.00 1.00 0.95 1.00Satd. Flow (perm) 1681 1500 3217 1583 3353Peak-hour factor, PHF 0.93 0.93 0.93 0.93 0.93 0.93 0.93 0.93 0.93 0.93 0.93 0.93Adj. Flow (vph) 256 2 323 0 0 0 0 554 205 62 362 0RTOR Reduction (vph) 0 0 226 0 0 0 0 45 0 0 0 0Lane Group Flow (vph) 0 258 97 0 0 0 0 714 0 62 362 0Turn Type Perm NA Perm NA Prot NAProtected Phases 4 2 1 6Permitted Phases 4 4Actuated Green, G (s) 15.6 15.6 20.2 4.4 28.6Effective Green, g (s) 15.6 15.6 20.2 4.4 28.6Actuated g/C Ratio 0.30 0.30 0.39 0.08 0.55Clearance Time (s) 4.0 4.0 4.0 4.0 4.0Vehicle Extension (s) 3.0 3.0 3.0 3.0 3.0Lane Grp Cap (vph) 502 448 1244 133 1837v/s Ratio Prot c0.22 c0.04 0.11v/s Ratio Perm 0.15 0.06v/c Ratio 0.51 0.22 0.57 0.47 0.20Uniform Delay, d1 15.2 13.7 12.6 22.8 6.0Progression Factor 1.00 1.00 1.00 1.00 1.00Incremental Delay, d2 0.9 0.2 0.6 2.6 0.1Delay (s) 16.1 14.0 13.3 25.4 6.0Level of Service B B B C AApproach Delay (s) 14.9 0.0 13.3 8.9Approach LOS B A B A
Intersection SummaryHCM 2000 Control Delay 12.7 HCM 2000 Level of Service BHCM 2000 Volume to Capacity ratio 0.54Actuated Cycle Length (s) 52.2 Sum of lost time (s) 12.0Intersection Capacity Utilization 70.6% ICU Level of Service CAnalysis Period (min) 15c Critical Lane Group
Agenda item No. 3
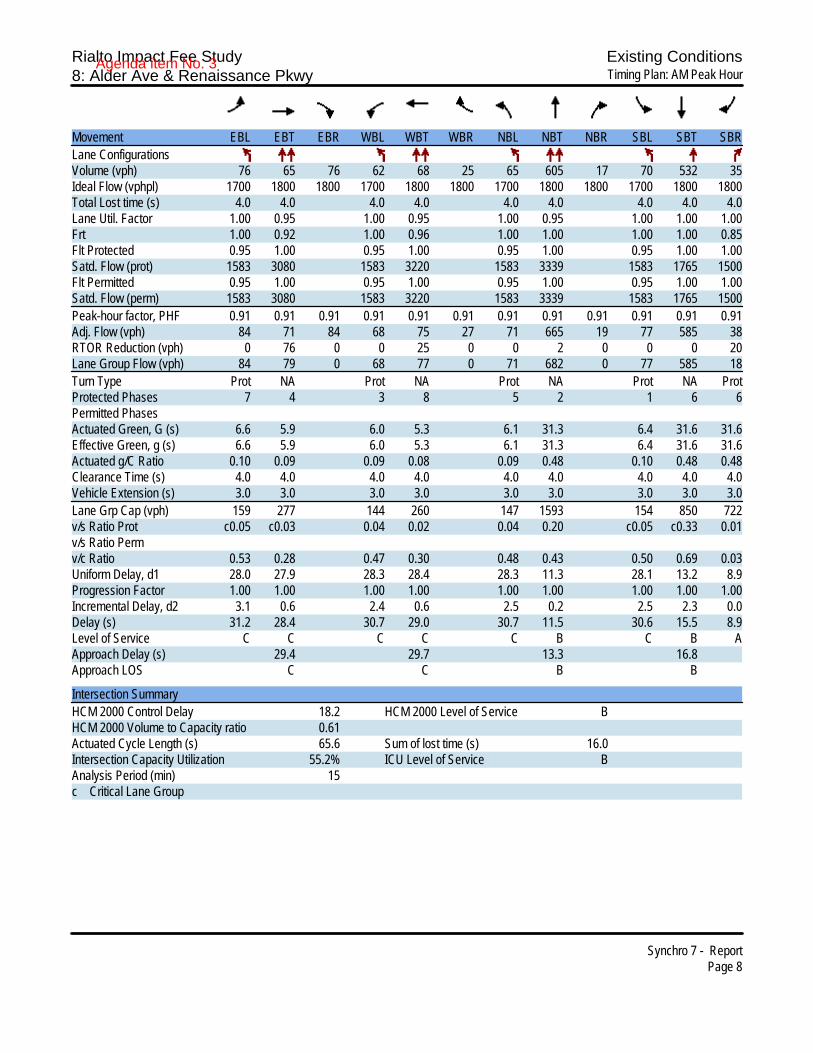
Rialto Impact Fee Study Existing Conditions8: Alder Ave & Renaissance Pkwy Timing Plan: AM Peak Hour
Synchro 7 - ReportPage 8
Movement EBL EBT EBR WBL WBT WBR NBL NBT NBR SBL SBT SBRLane ConfigurationsVolume (vph) 76 65 76 62 68 25 65 605 17 70 532 35Ideal Flow (vphpl) 1700 1800 1800 1700 1800 1800 1700 1800 1800 1700 1800 1800Total Lost time (s) 4.0 4.0 4.0 4.0 4.0 4.0 4.0 4.0 4.0Lane Util. Factor 1.00 0.95 1.00 0.95 1.00 0.95 1.00 1.00 1.00Frt 1.00 0.92 1.00 0.96 1.00 1.00 1.00 1.00 0.85Flt Protected 0.95 1.00 0.95 1.00 0.95 1.00 0.95 1.00 1.00Satd. Flow (prot) 1583 3080 1583 3220 1583 3339 1583 1765 1500Flt Permitted 0.95 1.00 0.95 1.00 0.95 1.00 0.95 1.00 1.00Satd. Flow (perm) 1583 3080 1583 3220 1583 3339 1583 1765 1500Peak-hour factor, PHF 0.91 0.91 0.91 0.91 0.91 0.91 0.91 0.91 0.91 0.91 0.91 0.91Adj. Flow (vph) 84 71 84 68 75 27 71 665 19 77 585 38RTOR Reduction (vph) 0 76 0 0 25 0 0 2 0 0 0 20Lane Group Flow (vph) 84 79 0 68 77 0 71 682 0 77 585 18Turn Type Prot NA Prot NA Prot NA Prot NA ProtProtected Phases 7 4 3 8 5 2 1 6 6Permitted PhasesActuated Green, G (s) 6.6 5.9 6.0 5.3 6.1 31.3 6.4 31.6 31.6Effective Green, g (s) 6.6 5.9 6.0 5.3 6.1 31.3 6.4 31.6 31.6Actuated g/C Ratio 0.10 0.09 0.09 0.08 0.09 0.48 0.10 0.48 0.48Clearance Time (s) 4.0 4.0 4.0 4.0 4.0 4.0 4.0 4.0 4.0Vehicle Extension (s) 3.0 3.0 3.0 3.0 3.0 3.0 3.0 3.0 3.0Lane Grp Cap (vph) 159 277 144 260 147 1593 154 850 722v/s Ratio Prot c0.05 c0.03 0.04 0.02 0.04 0.20 c0.05 c0.33 0.01v/s Ratio Permv/c Ratio 0.53 0.28 0.47 0.30 0.48 0.43 0.50 0.69 0.03Uniform Delay, d1 28.0 27.9 28.3 28.4 28.3 11.3 28.1 13.2 8.9Progression Factor 1.00 1.00 1.00 1.00 1.00 1.00 1.00 1.00 1.00Incremental Delay, d2 3.1 0.6 2.4 0.6 2.5 0.2 2.5 2.3 0.0Delay (s) 31.2 28.4 30.7 29.0 30.7 11.5 30.6 15.5 8.9Level of Service C C C C C B C B AApproach Delay (s) 29.4 29.7 13.3 16.8Approach LOS C C B B
Intersection SummaryHCM 2000 Control Delay 18.2 HCM 2000 Level of Service BHCM 2000 Volume to Capacity ratio 0.61Actuated Cycle Length (s) 65.6 Sum of lost time (s) 16.0Intersection Capacity Utilization 55.2% ICU Level of Service BAnalysis Period (min) 15c Critical Lane Group
Agenda item No. 3

Rialto Impact Fee Study Existing Conditions9: Alder Ave & Base Line Rd Timing Plan: AM Peak Hour
Synchro 7 - ReportPage 9
Movement EBL EBT EBR WBL WBT WBR NBL NBT NBR SBL SBT SBRLane ConfigurationsVolume (vph) 76 386 66 42 297 195 146 323 77 159 351 77Ideal Flow (vphpl) 1700 1800 1800 1700 1800 1800 1700 1800 1800 1700 1800 1800Total Lost time (s) 4.0 4.0 4.0 4.0 4.0 4.0 4.0 4.0 4.0Lane Util. Factor 1.00 1.00 1.00 1.00 1.00 1.00 1.00 1.00 1.00Frt 1.00 0.98 1.00 0.94 1.00 0.97 1.00 1.00 0.85Flt Protected 0.95 1.00 0.95 1.00 0.95 1.00 0.95 1.00 1.00Satd. Flow (prot) 1583 1726 1583 1660 1583 1714 1583 1765 1500Flt Permitted 0.95 1.00 0.95 1.00 0.95 1.00 0.95 1.00 1.00Satd. Flow (perm) 1583 1726 1583 1660 1583 1714 1583 1765 1500Peak-hour factor, PHF 0.86 0.86 0.86 0.86 0.86 0.86 0.86 0.86 0.86 0.86 0.86 0.86Adj. Flow (vph) 88 449 77 49 345 227 170 376 90 185 408 90RTOR Reduction (vph) 0 6 0 0 24 0 0 9 0 0 0 61Lane Group Flow (vph) 88 520 0 49 548 0 170 457 0 185 408 29Turn Type Prot NA Prot NA Prot NA Prot NA PermProtected Phases 7 4 3 8 5 2 1 6Permitted Phases 6Actuated Green, G (s) 6.0 36.8 4.0 34.8 11.0 32.0 12.0 33.0 33.0Effective Green, g (s) 6.0 36.8 4.0 34.8 11.0 32.0 12.0 33.0 33.0Actuated g/C Ratio 0.06 0.37 0.04 0.35 0.11 0.32 0.12 0.33 0.33Clearance Time (s) 4.0 4.0 4.0 4.0 4.0 4.0 4.0 4.0 4.0Vehicle Extension (s) 3.0 3.0 3.0 3.0 3.0 3.0 3.0 3.0 3.0Lane Grp Cap (vph) 94 630 62 573 172 544 188 577 491v/s Ratio Prot c0.06 0.30 0.03 c0.33 0.11 c0.27 c0.12 0.23v/s Ratio Perm 0.02v/c Ratio 0.94 0.83 0.79 0.96 0.99 0.84 0.98 0.71 0.06Uniform Delay, d1 47.2 29.1 48.0 32.3 44.8 32.0 44.3 29.7 23.3Progression Factor 1.00 1.00 1.00 1.00 1.00 1.00 1.00 1.00 1.00Incremental Delay, d2 71.5 8.7 48.2 26.9 64.6 14.5 60.6 7.1 0.2Delay (s) 118.7 37.8 96.2 59.2 109.4 46.5 104.9 36.8 23.5Level of Service F D F E F D F D CApproach Delay (s) 49.4 62.1 63.3 53.5Approach LOS D E E D
Intersection SummaryHCM 2000 Control Delay 57.0 HCM 2000 Level of Service EHCM 2000 Volume to Capacity ratio 0.91Actuated Cycle Length (s) 100.8 Sum of lost time (s) 16.0Intersection Capacity Utilization 79.8% ICU Level of Service DAnalysis Period (min) 15c Critical Lane Group
Agenda item No. 3

Rialto Impact Fee Study Existing Conditions10: Locust Ave & Casmalia St Timing Plan: AM Peak Hour
Synchro 7 - ReportPage 10
Movement EBL EBT EBR WBL WBT WBR NBL NBT NBR SBL SBT SBRLane ConfigurationsVolume (vph) 187 47 2 1 59 36 2 31 0 17 97 244Ideal Flow (vphpl) 1700 1800 1800 1700 1800 1800 1700 1800 1800 1700 1800 1800Total Lost time (s) 4.0 4.0 4.0 4.0 4.0 4.0 4.0 4.0Lane Util. Factor 1.00 1.00 1.00 1.00 1.00 0.95 1.00 0.95Frt 1.00 0.99 1.00 0.94 1.00 1.00 1.00 0.89Flt Protected 0.95 1.00 0.95 1.00 0.95 1.00 0.95 1.00Satd. Flow (prot) 1583 1754 1583 1664 1583 3353 1583 2993Flt Permitted 0.95 1.00 0.95 1.00 0.95 1.00 0.95 1.00Satd. Flow (perm) 1583 1754 1583 1664 1583 3353 1583 2993Peak-hour factor, PHF 0.95 0.95 0.95 0.95 0.95 0.95 0.95 0.95 0.95 0.95 0.95 0.95Adj. Flow (vph) 197 49 2 1 62 38 2 33 0 18 102 257RTOR Reduction (vph) 0 1 0 0 24 0 0 0 0 0 199 0Lane Group Flow (vph) 197 50 0 1 76 0 2 33 0 18 160 0Turn Type Prot NA Prot NA Prot NA Prot NAProtected Phases 7 4 3 8 5 2 1 6Permitted PhasesActuated Green, G (s) 8.9 13.9 0.6 5.6 0.7 8.9 0.9 9.1Effective Green, g (s) 8.9 13.9 0.6 5.6 0.7 8.9 0.9 9.1Actuated g/C Ratio 0.22 0.34 0.01 0.14 0.02 0.22 0.02 0.23Clearance Time (s) 4.0 4.0 4.0 4.0 4.0 4.0 4.0 4.0Vehicle Extension (s) 3.0 3.0 3.0 3.0 3.0 3.0 3.0 3.0Lane Grp Cap (vph) 349 604 23 231 27 740 35 675v/s Ratio Prot c0.12 0.03 0.00 c0.05 0.00 0.01 c0.01 c0.05v/s Ratio Permv/c Ratio 0.56 0.08 0.04 0.33 0.07 0.04 0.51 0.24Uniform Delay, d1 14.0 8.9 19.6 15.7 19.5 12.4 19.5 12.8Progression Factor 1.00 1.00 1.00 1.00 1.00 1.00 1.00 1.00Incremental Delay, d2 2.1 0.1 0.8 0.8 1.2 0.0 12.2 0.2Delay (s) 16.1 9.0 20.3 16.5 20.7 12.4 31.7 12.9Level of Service B A C B C B C BApproach Delay (s) 14.6 16.5 12.9 13.8Approach LOS B B B B
Intersection SummaryHCM 2000 Control Delay 14.4 HCM 2000 Level of Service BHCM 2000 Volume to Capacity ratio 0.39Actuated Cycle Length (s) 40.3 Sum of lost time (s) 16.0Intersection Capacity Utilization 36.1% ICU Level of Service AAnalysis Period (min) 15c Critical Lane Group
Agenda item No. 3
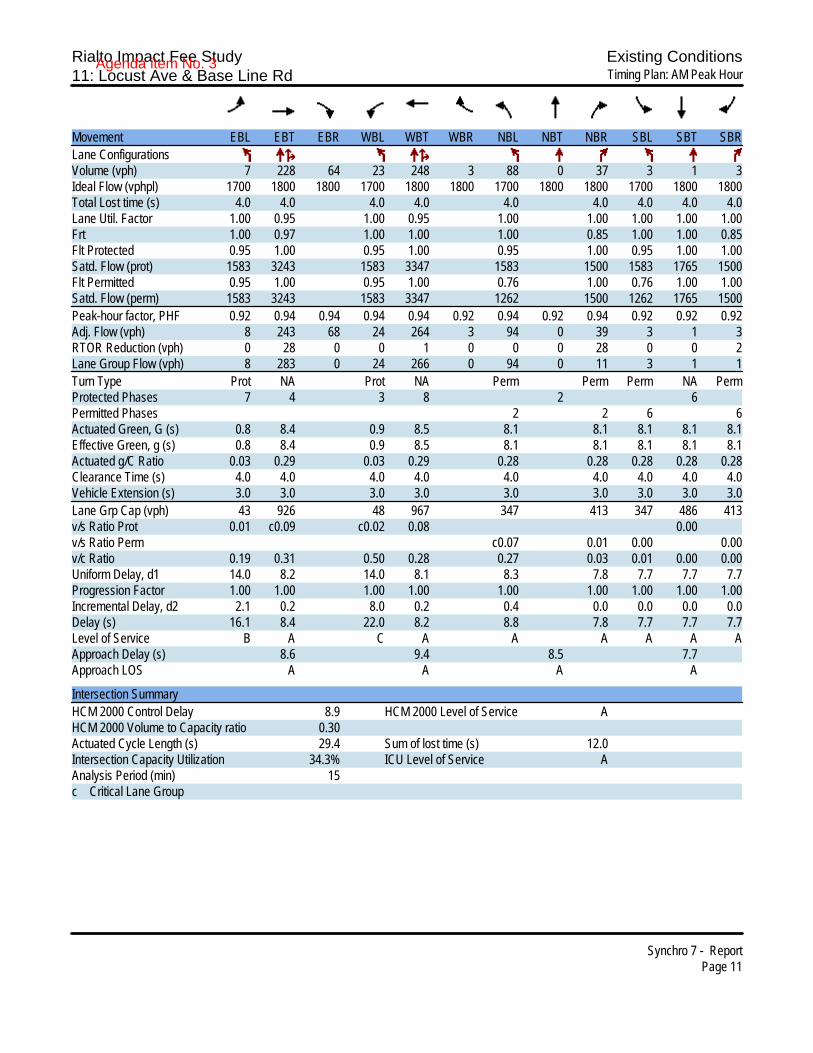
Rialto Impact Fee Study Existing Conditions11: Locust Ave & Base Line Rd Timing Plan: AM Peak Hour
Synchro 7 - ReportPage 11
Movement EBL EBT EBR WBL WBT WBR NBL NBT NBR SBL SBT SBRLane ConfigurationsVolume (vph) 7 228 64 23 248 3 88 0 37 3 1 3Ideal Flow (vphpl) 1700 1800 1800 1700 1800 1800 1700 1800 1800 1700 1800 1800Total Lost time (s) 4.0 4.0 4.0 4.0 4.0 4.0 4.0 4.0 4.0Lane Util. Factor 1.00 0.95 1.00 0.95 1.00 1.00 1.00 1.00 1.00Frt 1.00 0.97 1.00 1.00 1.00 0.85 1.00 1.00 0.85Flt Protected 0.95 1.00 0.95 1.00 0.95 1.00 0.95 1.00 1.00Satd. Flow (prot) 1583 3243 1583 3347 1583 1500 1583 1765 1500Flt Permitted 0.95 1.00 0.95 1.00 0.76 1.00 0.76 1.00 1.00Satd. Flow (perm) 1583 3243 1583 3347 1262 1500 1262 1765 1500Peak-hour factor, PHF 0.92 0.94 0.94 0.94 0.94 0.92 0.94 0.92 0.94 0.92 0.92 0.92Adj. Flow (vph) 8 243 68 24 264 3 94 0 39 3 1 3RTOR Reduction (vph) 0 28 0 0 1 0 0 0 28 0 0 2Lane Group Flow (vph) 8 283 0 24 266 0 94 0 11 3 1 1Turn Type Prot NA Prot NA Perm Perm Perm NA PermProtected Phases 7 4 3 8 2 6Permitted Phases 2 2 6 6Actuated Green, G (s) 0.8 8.4 0.9 8.5 8.1 8.1 8.1 8.1 8.1Effective Green, g (s) 0.8 8.4 0.9 8.5 8.1 8.1 8.1 8.1 8.1Actuated g/C Ratio 0.03 0.29 0.03 0.29 0.28 0.28 0.28 0.28 0.28Clearance Time (s) 4.0 4.0 4.0 4.0 4.0 4.0 4.0 4.0 4.0Vehicle Extension (s) 3.0 3.0 3.0 3.0 3.0 3.0 3.0 3.0 3.0Lane Grp Cap (vph) 43 926 48 967 347 413 347 486 413v/s Ratio Prot 0.01 c0.09 c0.02 0.08 0.00v/s Ratio Perm c0.07 0.01 0.00 0.00v/c Ratio 0.19 0.31 0.50 0.28 0.27 0.03 0.01 0.00 0.00Uniform Delay, d1 14.0 8.2 14.0 8.1 8.3 7.8 7.7 7.7 7.7Progression Factor 1.00 1.00 1.00 1.00 1.00 1.00 1.00 1.00 1.00Incremental Delay, d2 2.1 0.2 8.0 0.2 0.4 0.0 0.0 0.0 0.0Delay (s) 16.1 8.4 22.0 8.2 8.8 7.8 7.7 7.7 7.7Level of Service B A C A A A A A AApproach Delay (s) 8.6 9.4 8.5 7.7Approach LOS A A A A
Intersection SummaryHCM 2000 Control Delay 8.9 HCM 2000 Level of Service AHCM 2000 Volume to Capacity ratio 0.30Actuated Cycle Length (s) 29.4 Sum of lost time (s) 12.0Intersection Capacity Utilization 34.3% ICU Level of Service AAnalysis Period (min) 15c Critical Lane Group
Agenda item No. 3

Rialto Impact Fee Study Existing Conditions12: Ayala Dr & Riverside Ave Timing Plan: AM Peak Hour
Synchro 7 - ReportPage 12
Movement EBT EBR WBL WBT NBL NBRLane ConfigurationsVolume (vph) 436 89 111 392 80 150Ideal Flow (vphpl) 1800 1800 1700 1800 1700 1800Total Lost time (s) 4.0 4.0 4.0 4.0 4.0Lane Util. Factor 0.95 1.00 0.95 1.00 0.88Frt 0.97 1.00 1.00 1.00 0.85Flt Protected 1.00 0.95 1.00 0.95 1.00Satd. Flow (prot) 3268 1583 3353 1583 2640Flt Permitted 1.00 0.95 1.00 0.95 1.00Satd. Flow (perm) 3268 1583 3353 1583 2640Peak-hour factor, PHF 0.92 0.92 0.92 0.92 0.92 0.92Adj. Flow (vph) 474 97 121 426 87 163RTOR Reduction (vph) 18 0 0 0 0 139Lane Group Flow (vph) 553 0 121 426 87 24Turn Type NA Prot NA Prot PermProtected Phases 4 3 8 2Permitted Phases 2Actuated Green, G (s) 15.7 6.9 26.6 6.1 6.1Effective Green, g (s) 15.7 6.9 26.6 6.1 6.1Actuated g/C Ratio 0.39 0.17 0.65 0.15 0.15Clearance Time (s) 4.0 4.0 4.0 4.0 4.0Vehicle Extension (s) 3.0 3.0 3.0 3.0 3.0Lane Grp Cap (vph) 1260 268 2191 237 395v/s Ratio Prot c0.17 c0.08 0.13 c0.05v/s Ratio Perm 0.01v/c Ratio 0.44 0.45 0.19 0.37 0.06Uniform Delay, d1 9.2 15.2 2.8 15.6 14.8Progression Factor 1.00 1.00 1.00 1.00 1.00Incremental Delay, d2 0.2 1.2 0.0 1.0 0.1Delay (s) 9.5 16.4 2.8 16.5 14.9Level of Service A B A B BApproach Delay (s) 9.5 5.8 15.5Approach LOS A A B
Intersection SummaryHCM 2000 Control Delay 9.1 HCM 2000 Level of Service AHCM 2000 Volume to Capacity ratio 0.43Actuated Cycle Length (s) 40.7 Sum of lost time (s) 12.0Intersection Capacity Utilization 37.5% ICU Level of Service AAnalysis Period (min) 15c Critical Lane Group
Agenda item No. 3
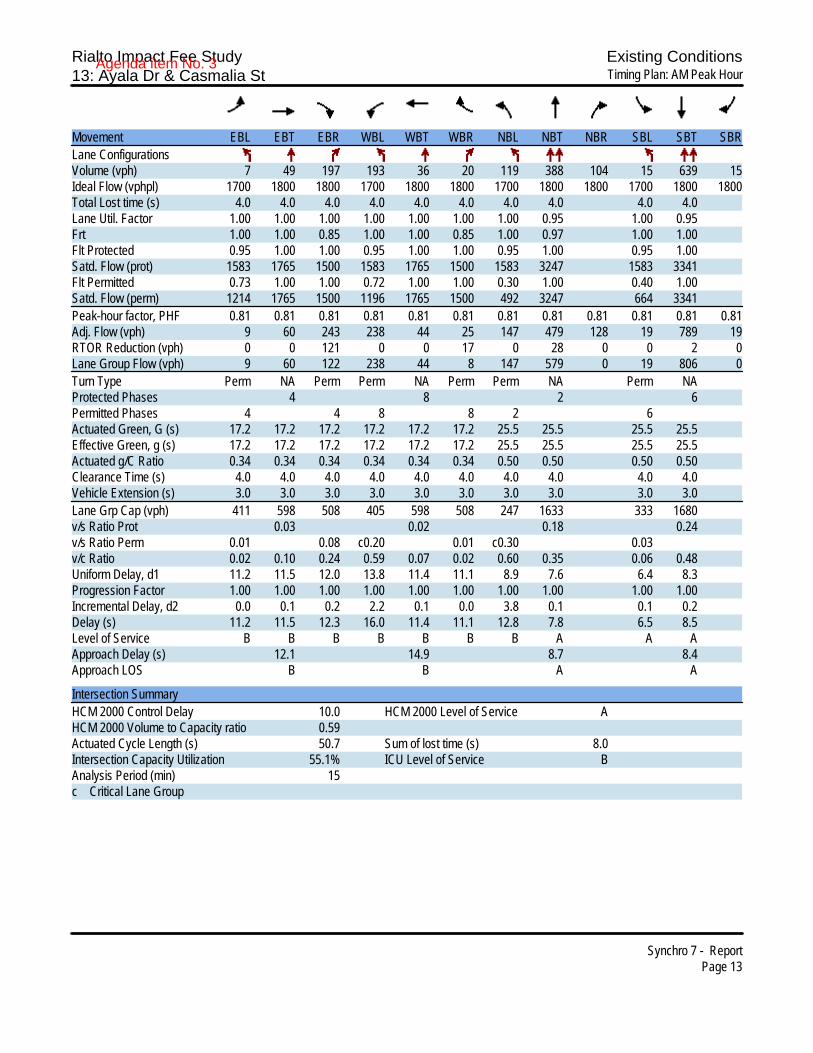
Rialto Impact Fee Study Existing Conditions13: Ayala Dr & Casmalia St Timing Plan: AM Peak Hour
Synchro 7 - ReportPage 13
Movement EBL EBT EBR WBL WBT WBR NBL NBT NBR SBL SBT SBRLane ConfigurationsVolume (vph) 7 49 197 193 36 20 119 388 104 15 639 15Ideal Flow (vphpl) 1700 1800 1800 1700 1800 1800 1700 1800 1800 1700 1800 1800Total Lost time (s) 4.0 4.0 4.0 4.0 4.0 4.0 4.0 4.0 4.0 4.0Lane Util. Factor 1.00 1.00 1.00 1.00 1.00 1.00 1.00 0.95 1.00 0.95Frt 1.00 1.00 0.85 1.00 1.00 0.85 1.00 0.97 1.00 1.00Flt Protected 0.95 1.00 1.00 0.95 1.00 1.00 0.95 1.00 0.95 1.00Satd. Flow (prot) 1583 1765 1500 1583 1765 1500 1583 3247 1583 3341Flt Permitted 0.73 1.00 1.00 0.72 1.00 1.00 0.30 1.00 0.40 1.00Satd. Flow (perm) 1214 1765 1500 1196 1765 1500 492 3247 664 3341Peak-hour factor, PHF 0.81 0.81 0.81 0.81 0.81 0.81 0.81 0.81 0.81 0.81 0.81 0.81Adj. Flow (vph) 9 60 243 238 44 25 147 479 128 19 789 19RTOR Reduction (vph) 0 0 121 0 0 17 0 28 0 0 2 0Lane Group Flow (vph) 9 60 122 238 44 8 147 579 0 19 806 0Turn Type Perm NA Perm Perm NA Perm Perm NA Perm NAProtected Phases 4 8 2 6Permitted Phases 4 4 8 8 2 6Actuated Green, G (s) 17.2 17.2 17.2 17.2 17.2 17.2 25.5 25.5 25.5 25.5Effective Green, g (s) 17.2 17.2 17.2 17.2 17.2 17.2 25.5 25.5 25.5 25.5Actuated g/C Ratio 0.34 0.34 0.34 0.34 0.34 0.34 0.50 0.50 0.50 0.50Clearance Time (s) 4.0 4.0 4.0 4.0 4.0 4.0 4.0 4.0 4.0 4.0Vehicle Extension (s) 3.0 3.0 3.0 3.0 3.0 3.0 3.0 3.0 3.0 3.0Lane Grp Cap (vph) 411 598 508 405 598 508 247 1633 333 1680v/s Ratio Prot 0.03 0.02 0.18 0.24v/s Ratio Perm 0.01 0.08 c0.20 0.01 c0.30 0.03v/c Ratio 0.02 0.10 0.24 0.59 0.07 0.02 0.60 0.35 0.06 0.48Uniform Delay, d1 11.2 11.5 12.0 13.8 11.4 11.1 8.9 7.6 6.4 8.3Progression Factor 1.00 1.00 1.00 1.00 1.00 1.00 1.00 1.00 1.00 1.00Incremental Delay, d2 0.0 0.1 0.2 2.2 0.1 0.0 3.8 0.1 0.1 0.2Delay (s) 11.2 11.5 12.3 16.0 11.4 11.1 12.8 7.8 6.5 8.5Level of Service B B B B B B B A A AApproach Delay (s) 12.1 14.9 8.7 8.4Approach LOS B B A A
Intersection SummaryHCM 2000 Control Delay 10.0 HCM 2000 Level of Service AHCM 2000 Volume to Capacity ratio 0.59Actuated Cycle Length (s) 50.7 Sum of lost time (s) 8.0Intersection Capacity Utilization 55.1% ICU Level of Service BAnalysis Period (min) 15c Critical Lane Group
Agenda item No. 3
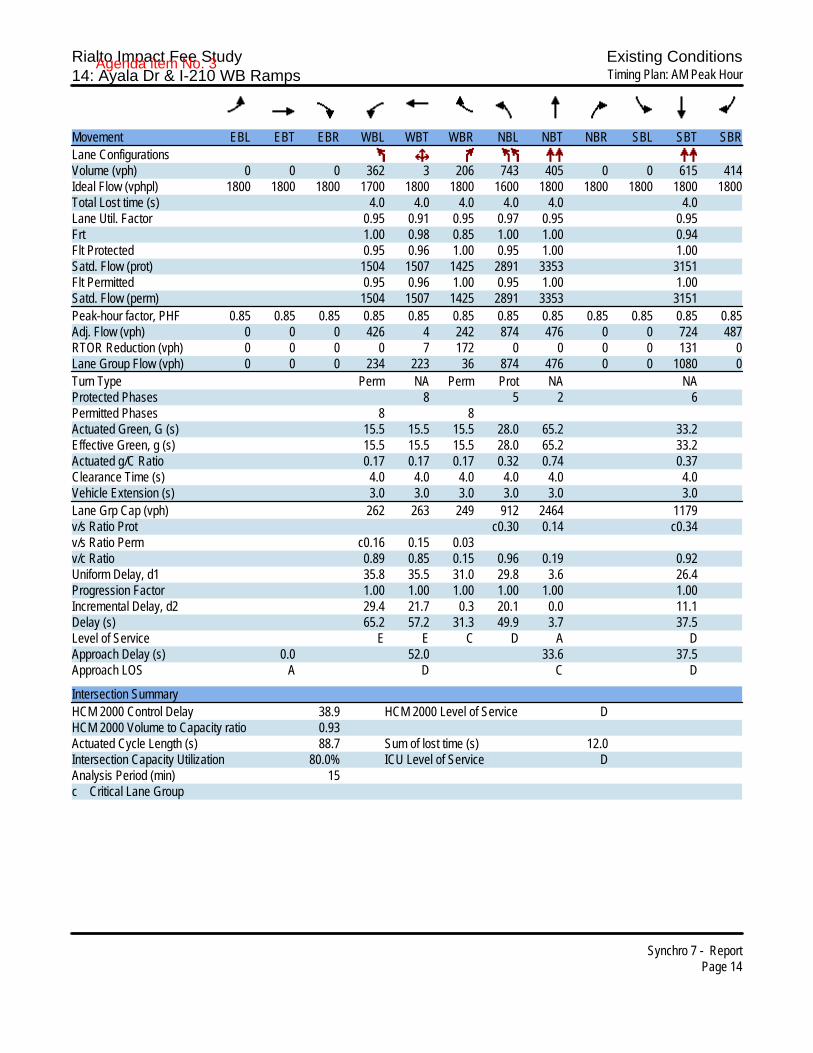
Rialto Impact Fee Study Existing Conditions14: Ayala Dr & I-210 WB Ramps Timing Plan: AM Peak Hour
Synchro 7 - ReportPage 14
Movement EBL EBT EBR WBL WBT WBR NBL NBT NBR SBL SBT SBRLane ConfigurationsVolume (vph) 0 0 0 362 3 206 743 405 0 0 615 414Ideal Flow (vphpl) 1800 1800 1800 1700 1800 1800 1600 1800 1800 1800 1800 1800Total Lost time (s) 4.0 4.0 4.0 4.0 4.0 4.0Lane Util. Factor 0.95 0.91 0.95 0.97 0.95 0.95Frt 1.00 0.98 0.85 1.00 1.00 0.94Flt Protected 0.95 0.96 1.00 0.95 1.00 1.00Satd. Flow (prot) 1504 1507 1425 2891 3353 3151Flt Permitted 0.95 0.96 1.00 0.95 1.00 1.00Satd. Flow (perm) 1504 1507 1425 2891 3353 3151Peak-hour factor, PHF 0.85 0.85 0.85 0.85 0.85 0.85 0.85 0.85 0.85 0.85 0.85 0.85Adj. Flow (vph) 0 0 0 426 4 242 874 476 0 0 724 487RTOR Reduction (vph) 0 0 0 0 7 172 0 0 0 0 131 0Lane Group Flow (vph) 0 0 0 234 223 36 874 476 0 0 1080 0Turn Type Perm NA Perm Prot NA NAProtected Phases 8 5 2 6Permitted Phases 8 8Actuated Green, G (s) 15.5 15.5 15.5 28.0 65.2 33.2Effective Green, g (s) 15.5 15.5 15.5 28.0 65.2 33.2Actuated g/C Ratio 0.17 0.17 0.17 0.32 0.74 0.37Clearance Time (s) 4.0 4.0 4.0 4.0 4.0 4.0Vehicle Extension (s) 3.0 3.0 3.0 3.0 3.0 3.0Lane Grp Cap (vph) 262 263 249 912 2464 1179v/s Ratio Prot c0.30 0.14 c0.34v/s Ratio Perm c0.16 0.15 0.03v/c Ratio 0.89 0.85 0.15 0.96 0.19 0.92Uniform Delay, d1 35.8 35.5 31.0 29.8 3.6 26.4Progression Factor 1.00 1.00 1.00 1.00 1.00 1.00Incremental Delay, d2 29.4 21.7 0.3 20.1 0.0 11.1Delay (s) 65.2 57.2 31.3 49.9 3.7 37.5Level of Service E E C D A DApproach Delay (s) 0.0 52.0 33.6 37.5Approach LOS A D C D
Intersection SummaryHCM 2000 Control Delay 38.9 HCM 2000 Level of Service DHCM 2000 Volume to Capacity ratio 0.93Actuated Cycle Length (s) 88.7 Sum of lost time (s) 12.0Intersection Capacity Utilization 80.0% ICU Level of Service DAnalysis Period (min) 15c Critical Lane Group
Agenda item No. 3
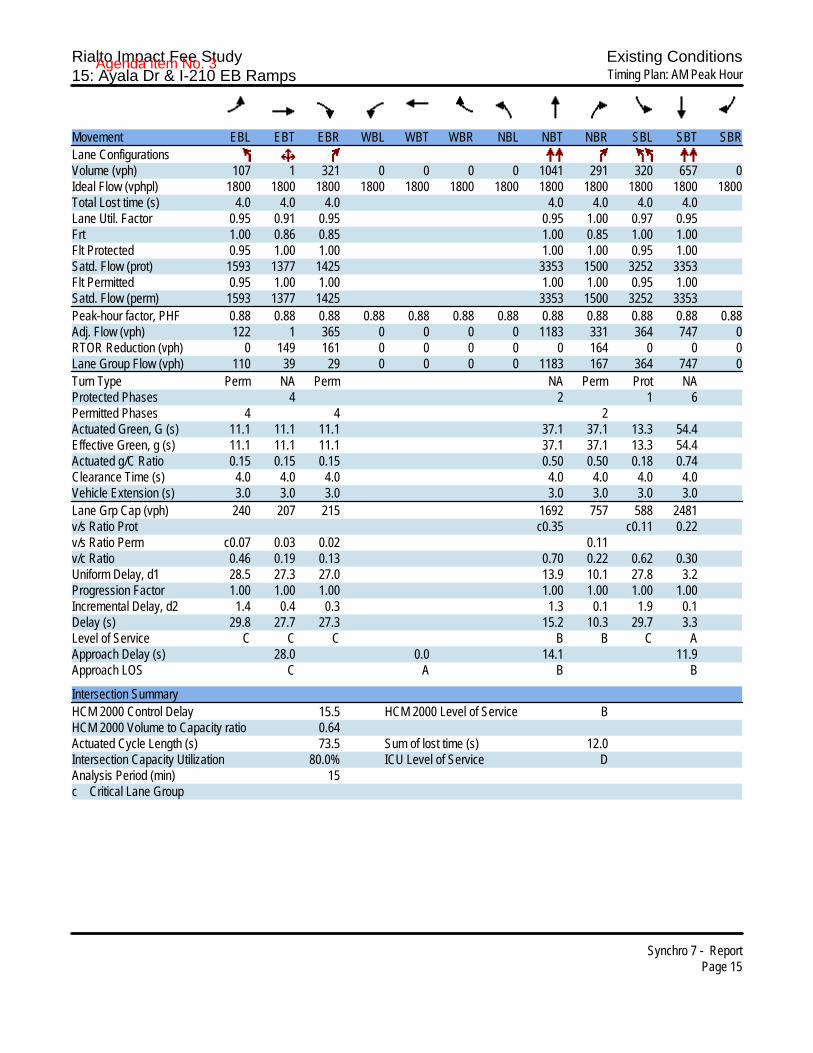
Rialto Impact Fee Study Existing Conditions15: Ayala Dr & I-210 EB Ramps Timing Plan: AM Peak Hour
Synchro 7 - ReportPage 15
Movement EBL EBT EBR WBL WBT WBR NBL NBT NBR SBL SBT SBRLane ConfigurationsVolume (vph) 107 1 321 0 0 0 0 1041 291 320 657 0Ideal Flow (vphpl) 1800 1800 1800 1800 1800 1800 1800 1800 1800 1800 1800 1800Total Lost time (s) 4.0 4.0 4.0 4.0 4.0 4.0 4.0Lane Util. Factor 0.95 0.91 0.95 0.95 1.00 0.97 0.95Frt 1.00 0.86 0.85 1.00 0.85 1.00 1.00Flt Protected 0.95 1.00 1.00 1.00 1.00 0.95 1.00Satd. Flow (prot) 1593 1377 1425 3353 1500 3252 3353Flt Permitted 0.95 1.00 1.00 1.00 1.00 0.95 1.00Satd. Flow (perm) 1593 1377 1425 3353 1500 3252 3353Peak-hour factor, PHF 0.88 0.88 0.88 0.88 0.88 0.88 0.88 0.88 0.88 0.88 0.88 0.88Adj. Flow (vph) 122 1 365 0 0 0 0 1183 331 364 747 0RTOR Reduction (vph) 0 149 161 0 0 0 0 0 164 0 0 0Lane Group Flow (vph) 110 39 29 0 0 0 0 1183 167 364 747 0Turn Type Perm NA Perm NA Perm Prot NAProtected Phases 4 2 1 6Permitted Phases 4 4 2Actuated Green, G (s) 11.1 11.1 11.1 37.1 37.1 13.3 54.4Effective Green, g (s) 11.1 11.1 11.1 37.1 37.1 13.3 54.4Actuated g/C Ratio 0.15 0.15 0.15 0.50 0.50 0.18 0.74Clearance Time (s) 4.0 4.0 4.0 4.0 4.0 4.0 4.0Vehicle Extension (s) 3.0 3.0 3.0 3.0 3.0 3.0 3.0Lane Grp Cap (vph) 240 207 215 1692 757 588 2481v/s Ratio Prot c0.35 c0.11 0.22v/s Ratio Perm c0.07 0.03 0.02 0.11v/c Ratio 0.46 0.19 0.13 0.70 0.22 0.62 0.30Uniform Delay, d1 28.5 27.3 27.0 13.9 10.1 27.8 3.2Progression Factor 1.00 1.00 1.00 1.00 1.00 1.00 1.00Incremental Delay, d2 1.4 0.4 0.3 1.3 0.1 1.9 0.1Delay (s) 29.8 27.7 27.3 15.2 10.3 29.7 3.3Level of Service C C C B B C AApproach Delay (s) 28.0 0.0 14.1 11.9Approach LOS C A B B
Intersection SummaryHCM 2000 Control Delay 15.5 HCM 2000 Level of Service BHCM 2000 Volume to Capacity ratio 0.64Actuated Cycle Length (s) 73.5 Sum of lost time (s) 12.0Intersection Capacity Utilization 80.0% ICU Level of Service DAnalysis Period (min) 15c Critical Lane Group
Agenda item No. 3
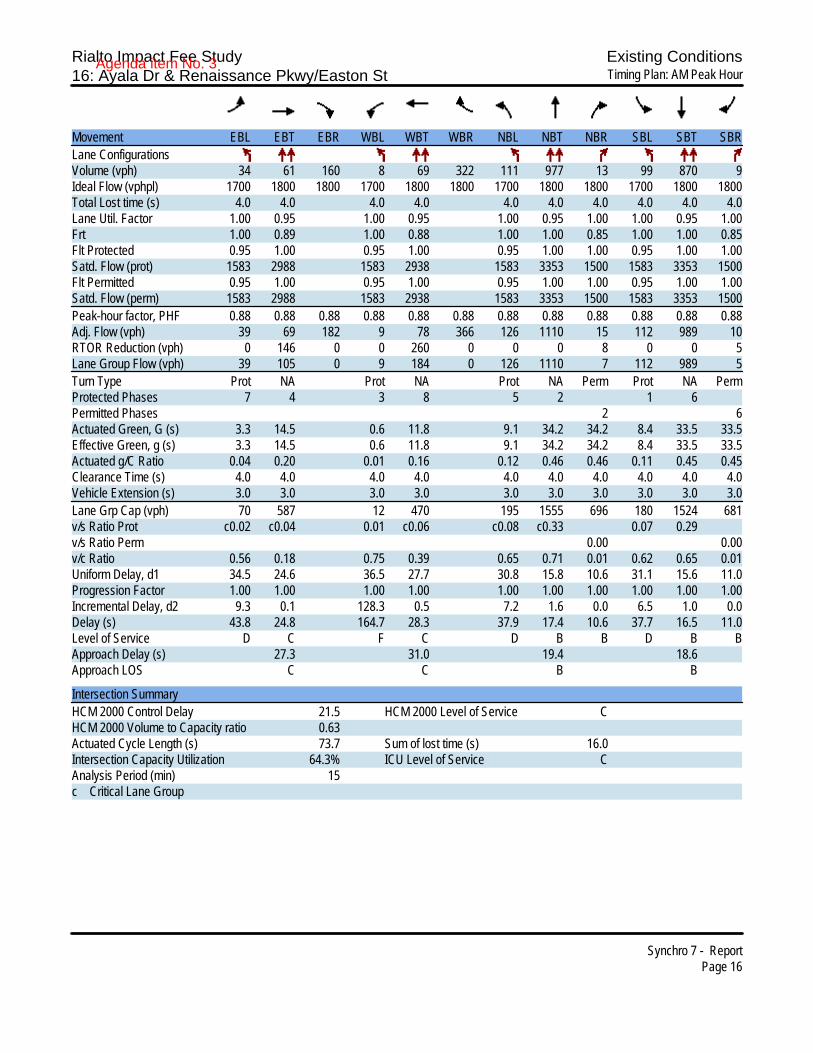
Rialto Impact Fee Study Existing Conditions16: Ayala Dr & Renaissance Pkwy/Easton St Timing Plan: AM Peak Hour
Synchro 7 - ReportPage 16
Movement EBL EBT EBR WBL WBT WBR NBL NBT NBR SBL SBT SBRLane ConfigurationsVolume (vph) 34 61 160 8 69 322 111 977 13 99 870 9Ideal Flow (vphpl) 1700 1800 1800 1700 1800 1800 1700 1800 1800 1700 1800 1800Total Lost time (s) 4.0 4.0 4.0 4.0 4.0 4.0 4.0 4.0 4.0 4.0Lane Util. Factor 1.00 0.95 1.00 0.95 1.00 0.95 1.00 1.00 0.95 1.00Frt 1.00 0.89 1.00 0.88 1.00 1.00 0.85 1.00 1.00 0.85Flt Protected 0.95 1.00 0.95 1.00 0.95 1.00 1.00 0.95 1.00 1.00Satd. Flow (prot) 1583 2988 1583 2938 1583 3353 1500 1583 3353 1500Flt Permitted 0.95 1.00 0.95 1.00 0.95 1.00 1.00 0.95 1.00 1.00Satd. Flow (perm) 1583 2988 1583 2938 1583 3353 1500 1583 3353 1500Peak-hour factor, PHF 0.88 0.88 0.88 0.88 0.88 0.88 0.88 0.88 0.88 0.88 0.88 0.88Adj. Flow (vph) 39 69 182 9 78 366 126 1110 15 112 989 10RTOR Reduction (vph) 0 146 0 0 260 0 0 0 8 0 0 5Lane Group Flow (vph) 39 105 0 9 184 0 126 1110 7 112 989 5Turn Type Prot NA Prot NA Prot NA Perm Prot NA PermProtected Phases 7 4 3 8 5 2 1 6Permitted Phases 2 6Actuated Green, G (s) 3.3 14.5 0.6 11.8 9.1 34.2 34.2 8.4 33.5 33.5Effective Green, g (s) 3.3 14.5 0.6 11.8 9.1 34.2 34.2 8.4 33.5 33.5Actuated g/C Ratio 0.04 0.20 0.01 0.16 0.12 0.46 0.46 0.11 0.45 0.45Clearance Time (s) 4.0 4.0 4.0 4.0 4.0 4.0 4.0 4.0 4.0 4.0Vehicle Extension (s) 3.0 3.0 3.0 3.0 3.0 3.0 3.0 3.0 3.0 3.0Lane Grp Cap (vph) 70 587 12 470 195 1555 696 180 1524 681v/s Ratio Prot c0.02 c0.04 0.01 c0.06 c0.08 c0.33 0.07 0.29v/s Ratio Perm 0.00 0.00v/c Ratio 0.56 0.18 0.75 0.39 0.65 0.71 0.01 0.62 0.65 0.01Uniform Delay, d1 34.5 24.6 36.5 27.7 30.8 15.8 10.6 31.1 15.6 11.0Progression Factor 1.00 1.00 1.00 1.00 1.00 1.00 1.00 1.00 1.00 1.00Incremental Delay, d2 9.3 0.1 128.3 0.5 7.2 1.6 0.0 6.5 1.0 0.0Delay (s) 43.8 24.8 164.7 28.3 37.9 17.4 10.6 37.7 16.5 11.0Level of Service D C F C D B B D B BApproach Delay (s) 27.3 31.0 19.4 18.6Approach LOS C C B B
Intersection SummaryHCM 2000 Control Delay 21.5 HCM 2000 Level of Service CHCM 2000 Volume to Capacity ratio 0.63Actuated Cycle Length (s) 73.7 Sum of lost time (s) 16.0Intersection Capacity Utilization 64.3% ICU Level of Service CAnalysis Period (min) 15c Critical Lane Group
Agenda item No. 3
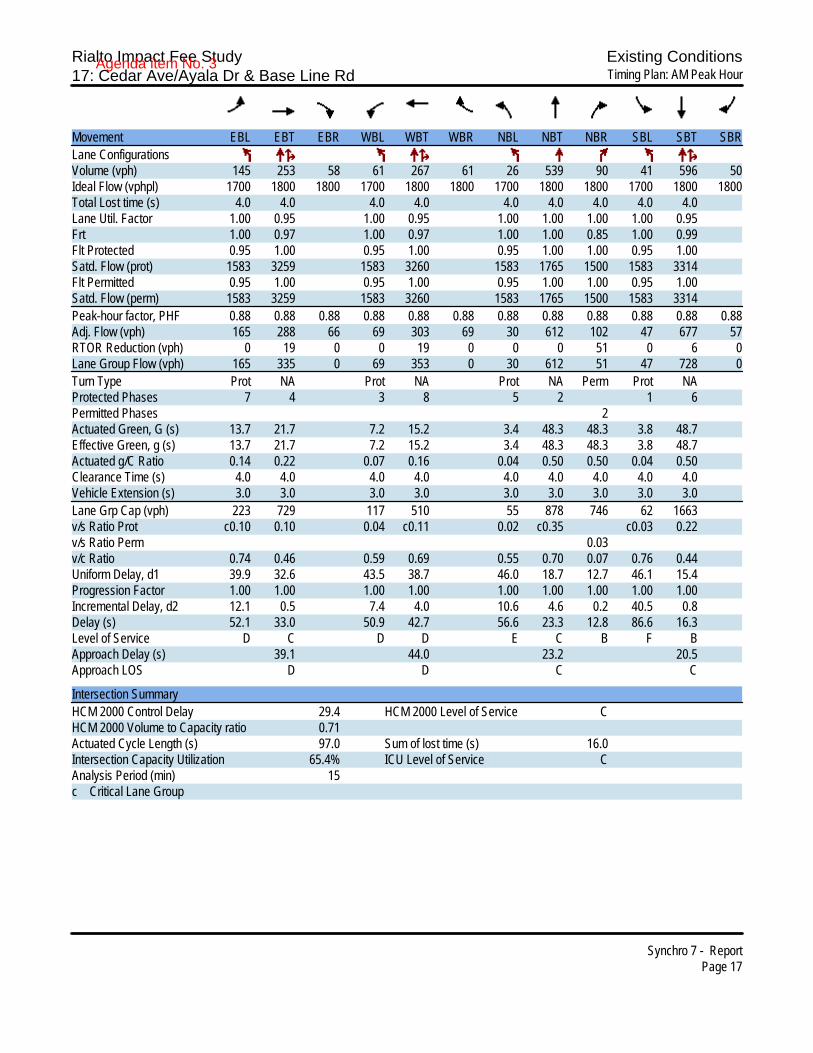
Rialto Impact Fee Study Existing Conditions17: Cedar Ave/Ayala Dr & Base Line Rd Timing Plan: AM Peak Hour
Synchro 7 - ReportPage 17
Movement EBL EBT EBR WBL WBT WBR NBL NBT NBR SBL SBT SBRLane ConfigurationsVolume (vph) 145 253 58 61 267 61 26 539 90 41 596 50Ideal Flow (vphpl) 1700 1800 1800 1700 1800 1800 1700 1800 1800 1700 1800 1800Total Lost time (s) 4.0 4.0 4.0 4.0 4.0 4.0 4.0 4.0 4.0Lane Util. Factor 1.00 0.95 1.00 0.95 1.00 1.00 1.00 1.00 0.95Frt 1.00 0.97 1.00 0.97 1.00 1.00 0.85 1.00 0.99Flt Protected 0.95 1.00 0.95 1.00 0.95 1.00 1.00 0.95 1.00Satd. Flow (prot) 1583 3259 1583 3260 1583 1765 1500 1583 3314Flt Permitted 0.95 1.00 0.95 1.00 0.95 1.00 1.00 0.95 1.00Satd. Flow (perm) 1583 3259 1583 3260 1583 1765 1500 1583 3314Peak-hour factor, PHF 0.88 0.88 0.88 0.88 0.88 0.88 0.88 0.88 0.88 0.88 0.88 0.88Adj. Flow (vph) 165 288 66 69 303 69 30 612 102 47 677 57RTOR Reduction (vph) 0 19 0 0 19 0 0 0 51 0 6 0Lane Group Flow (vph) 165 335 0 69 353 0 30 612 51 47 728 0Turn Type Prot NA Prot NA Prot NA Perm Prot NAProtected Phases 7 4 3 8 5 2 1 6Permitted Phases 2Actuated Green, G (s) 13.7 21.7 7.2 15.2 3.4 48.3 48.3 3.8 48.7Effective Green, g (s) 13.7 21.7 7.2 15.2 3.4 48.3 48.3 3.8 48.7Actuated g/C Ratio 0.14 0.22 0.07 0.16 0.04 0.50 0.50 0.04 0.50Clearance Time (s) 4.0 4.0 4.0 4.0 4.0 4.0 4.0 4.0 4.0Vehicle Extension (s) 3.0 3.0 3.0 3.0 3.0 3.0 3.0 3.0 3.0Lane Grp Cap (vph) 223 729 117 510 55 878 746 62 1663v/s Ratio Prot c0.10 0.10 0.04 c0.11 0.02 c0.35 c0.03 0.22v/s Ratio Perm 0.03v/c Ratio 0.74 0.46 0.59 0.69 0.55 0.70 0.07 0.76 0.44Uniform Delay, d1 39.9 32.6 43.5 38.7 46.0 18.7 12.7 46.1 15.4Progression Factor 1.00 1.00 1.00 1.00 1.00 1.00 1.00 1.00 1.00Incremental Delay, d2 12.1 0.5 7.4 4.0 10.6 4.6 0.2 40.5 0.8Delay (s) 52.1 33.0 50.9 42.7 56.6 23.3 12.8 86.6 16.3Level of Service D C D D E C B F BApproach Delay (s) 39.1 44.0 23.2 20.5Approach LOS D D C C
Intersection SummaryHCM 2000 Control Delay 29.4 HCM 2000 Level of Service CHCM 2000 Volume to Capacity ratio 0.71Actuated Cycle Length (s) 97.0 Sum of lost time (s) 16.0Intersection Capacity Utilization 65.4% ICU Level of Service CAnalysis Period (min) 15c Critical Lane Group
Agenda item No. 3

Rialto Impact Fee Study Existing Conditions18: Cedar Ave & Foothill Blvd Timing Plan: AM Peak Hour
Synchro 7 - ReportPage 18
Movement EBL EBT EBR WBL WBT WBR NBL NBT NBR SBL SBT SBRLane ConfigurationsVolume (vph) 74 380 98 92 423 51 109 475 120 119 736 68Ideal Flow (vphpl) 1700 1800 1800 1700 1800 1800 1700 1800 1800 1700 1800 1800Total Lost time (s) 4.0 4.0 4.0 4.0 4.0 4.0 4.0 4.0Lane Util. Factor 1.00 0.91 1.00 0.91 1.00 0.95 1.00 0.95Frt 1.00 0.97 1.00 0.98 1.00 0.97 1.00 0.99Flt Protected 0.95 1.00 0.95 1.00 0.95 1.00 0.95 1.00Satd. Flow (prot) 1583 4670 1583 4740 1583 3251 1583 3311Flt Permitted 0.95 1.00 0.95 1.00 0.95 1.00 0.95 1.00Satd. Flow (perm) 1583 4670 1583 4740 1583 3251 1583 3311Peak-hour factor, PHF 0.89 0.89 0.89 0.89 0.89 0.89 0.89 0.89 0.89 0.89 0.89 0.89Adj. Flow (vph) 83 427 110 103 475 57 122 534 135 134 827 76RTOR Reduction (vph) 0 46 0 0 15 0 0 21 0 0 6 0Lane Group Flow (vph) 83 491 0 103 517 0 122 648 0 134 897 0Turn Type Prot NA Prot NA Prot NA Prot NAProtected Phases 7 4 3 8 5 2 1 6Permitted PhasesActuated Green, G (s) 7.7 14.2 8.8 15.3 9.9 41.0 12.5 43.6Effective Green, g (s) 7.7 14.2 8.8 15.3 9.9 41.0 12.5 43.6Actuated g/C Ratio 0.08 0.15 0.10 0.17 0.11 0.44 0.14 0.47Clearance Time (s) 4.0 4.0 4.0 4.0 4.0 4.0 4.0 4.0Vehicle Extension (s) 3.0 3.0 3.0 3.0 3.0 3.0 3.0 3.0Lane Grp Cap (vph) 131 716 150 784 169 1440 213 1560v/s Ratio Prot 0.05 0.11 c0.07 c0.11 0.08 0.20 c0.08 c0.27v/s Ratio Permv/c Ratio 0.63 0.69 0.69 0.66 0.72 0.45 0.63 0.58Uniform Delay, d1 41.0 37.0 40.5 36.2 40.0 17.9 37.8 17.7Progression Factor 1.00 1.00 1.00 1.00 1.00 1.00 1.00 1.00Incremental Delay, d2 9.6 2.7 12.3 2.0 14.1 1.0 5.7 1.5Delay (s) 50.6 39.8 52.8 38.2 54.1 18.9 43.5 19.3Level of Service D D D D D B D BApproach Delay (s) 41.2 40.5 24.4 22.4Approach LOS D D C C
Intersection SummaryHCM 2000 Control Delay 30.4 HCM 2000 Level of Service CHCM 2000 Volume to Capacity ratio 0.63Actuated Cycle Length (s) 92.5 Sum of lost time (s) 16.0Intersection Capacity Utilization 59.6% ICU Level of Service BAnalysis Period (min) 15c Critical Lane Group
Agenda item No. 3

Rialto Impact Fee Study Existing Conditions19: Cedar Ave & Rialto Ave Timing Plan: AM Peak Hour
Synchro 7 - ReportPage 19
Movement EBL EBT EBR WBL WBT WBR NBL NBT NBR SBL SBT SBRLane ConfigurationsVolume (vph) 52 167 196 156 214 285 131 526 154 204 712 83Ideal Flow (vphpl) 1700 1800 1800 1700 1800 1800 1700 1800 1800 1700 1800 1800Total Lost time (s) 4.0 4.0 4.0 4.0 4.0 4.0 4.0 4.0Lane Util. Factor 1.00 0.95 1.00 0.95 1.00 0.95 1.00 0.95Frt 1.00 0.92 1.00 0.91 1.00 0.97 1.00 0.98Flt Protected 0.95 1.00 0.95 1.00 0.95 1.00 0.95 1.00Satd. Flow (prot) 1583 3081 1583 3066 1583 3239 1583 3300Flt Permitted 0.95 1.00 0.95 1.00 0.95 1.00 0.95 1.00Satd. Flow (perm) 1583 3081 1583 3066 1583 3239 1583 3300Peak-hour factor, PHF 0.85 0.85 0.85 0.85 0.85 0.85 0.85 0.85 0.85 0.85 0.85 0.85Adj. Flow (vph) 61 196 231 184 252 335 154 619 181 240 838 98RTOR Reduction (vph) 0 197 0 0 238 0 0 27 0 0 9 0Lane Group Flow (vph) 61 230 0 184 349 0 154 773 0 240 927 0Turn Type Prot NA Prot NA Prot NA Prot NAProtected Phases 7 4 3 8 5 2 1 6Permitted PhasesActuated Green, G (s) 6.7 12.6 14.0 19.9 12.4 26.2 17.4 31.2Effective Green, g (s) 6.7 12.6 14.0 19.9 12.4 26.2 17.4 31.2Actuated g/C Ratio 0.08 0.15 0.16 0.23 0.14 0.30 0.20 0.36Clearance Time (s) 4.0 4.0 4.0 4.0 4.0 4.0 4.0 4.0Vehicle Extension (s) 3.0 3.0 3.0 3.0 3.0 3.0 3.0 3.0Lane Grp Cap (vph) 123 450 257 707 227 984 319 1194v/s Ratio Prot 0.04 0.07 c0.12 c0.11 0.10 0.24 c0.15 c0.28v/s Ratio Permv/c Ratio 0.50 0.51 0.72 0.49 0.68 0.79 0.75 0.78Uniform Delay, d1 38.1 34.0 34.2 28.8 35.0 27.4 32.4 24.4Progression Factor 1.00 1.00 1.00 1.00 1.00 1.00 1.00 1.00Incremental Delay, d2 3.1 1.0 9.1 0.5 7.8 4.2 9.6 3.2Delay (s) 41.3 34.9 43.3 29.3 42.8 31.6 42.0 27.6Level of Service D C D C D C D CApproach Delay (s) 35.7 32.7 33.4 30.6Approach LOS D C C C
Intersection SummaryHCM 2000 Control Delay 32.6 HCM 2000 Level of Service CHCM 2000 Volume to Capacity ratio 0.75Actuated Cycle Length (s) 86.2 Sum of lost time (s) 16.0Intersection Capacity Utilization 67.7% ICU Level of Service CAnalysis Period (min) 15c Critical Lane Group
Agenda item No. 3
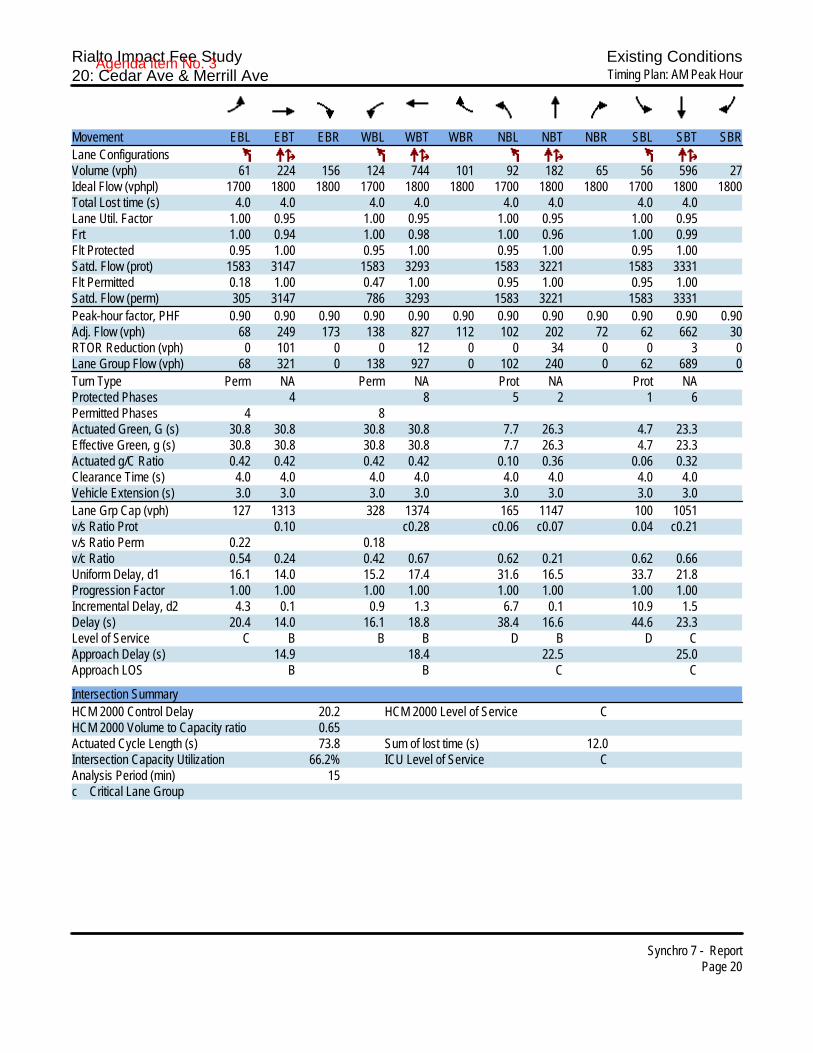
Rialto Impact Fee Study Existing Conditions20: Cedar Ave & Merrill Ave Timing Plan: AM Peak Hour
Synchro 7 - ReportPage 20
Movement EBL EBT EBR WBL WBT WBR NBL NBT NBR SBL SBT SBRLane ConfigurationsVolume (vph) 61 224 156 124 744 101 92 182 65 56 596 27Ideal Flow (vphpl) 1700 1800 1800 1700 1800 1800 1700 1800 1800 1700 1800 1800Total Lost time (s) 4.0 4.0 4.0 4.0 4.0 4.0 4.0 4.0Lane Util. Factor 1.00 0.95 1.00 0.95 1.00 0.95 1.00 0.95Frt 1.00 0.94 1.00 0.98 1.00 0.96 1.00 0.99Flt Protected 0.95 1.00 0.95 1.00 0.95 1.00 0.95 1.00Satd. Flow (prot) 1583 3147 1583 3293 1583 3221 1583 3331Flt Permitted 0.18 1.00 0.47 1.00 0.95 1.00 0.95 1.00Satd. Flow (perm) 305 3147 786 3293 1583 3221 1583 3331Peak-hour factor, PHF 0.90 0.90 0.90 0.90 0.90 0.90 0.90 0.90 0.90 0.90 0.90 0.90Adj. Flow (vph) 68 249 173 138 827 112 102 202 72 62 662 30RTOR Reduction (vph) 0 101 0 0 12 0 0 34 0 0 3 0Lane Group Flow (vph) 68 321 0 138 927 0 102 240 0 62 689 0Turn Type Perm NA Perm NA Prot NA Prot NAProtected Phases 4 8 5 2 1 6Permitted Phases 4 8Actuated Green, G (s) 30.8 30.8 30.8 30.8 7.7 26.3 4.7 23.3Effective Green, g (s) 30.8 30.8 30.8 30.8 7.7 26.3 4.7 23.3Actuated g/C Ratio 0.42 0.42 0.42 0.42 0.10 0.36 0.06 0.32Clearance Time (s) 4.0 4.0 4.0 4.0 4.0 4.0 4.0 4.0Vehicle Extension (s) 3.0 3.0 3.0 3.0 3.0 3.0 3.0 3.0Lane Grp Cap (vph) 127 1313 328 1374 165 1147 100 1051v/s Ratio Prot 0.10 c0.28 c0.06 c0.07 0.04 c0.21v/s Ratio Perm 0.22 0.18v/c Ratio 0.54 0.24 0.42 0.67 0.62 0.21 0.62 0.66Uniform Delay, d1 16.1 14.0 15.2 17.4 31.6 16.5 33.7 21.8Progression Factor 1.00 1.00 1.00 1.00 1.00 1.00 1.00 1.00Incremental Delay, d2 4.3 0.1 0.9 1.3 6.7 0.1 10.9 1.5Delay (s) 20.4 14.0 16.1 18.8 38.4 16.6 44.6 23.3Level of Service C B B B D B D CApproach Delay (s) 14.9 18.4 22.5 25.0Approach LOS B B C C
Intersection SummaryHCM 2000 Control Delay 20.2 HCM 2000 Level of Service CHCM 2000 Volume to Capacity ratio 0.65Actuated Cycle Length (s) 73.8 Sum of lost time (s) 12.0Intersection Capacity Utilization 66.2% ICU Level of Service CAnalysis Period (min) 15c Critical Lane Group
Agenda item No. 3
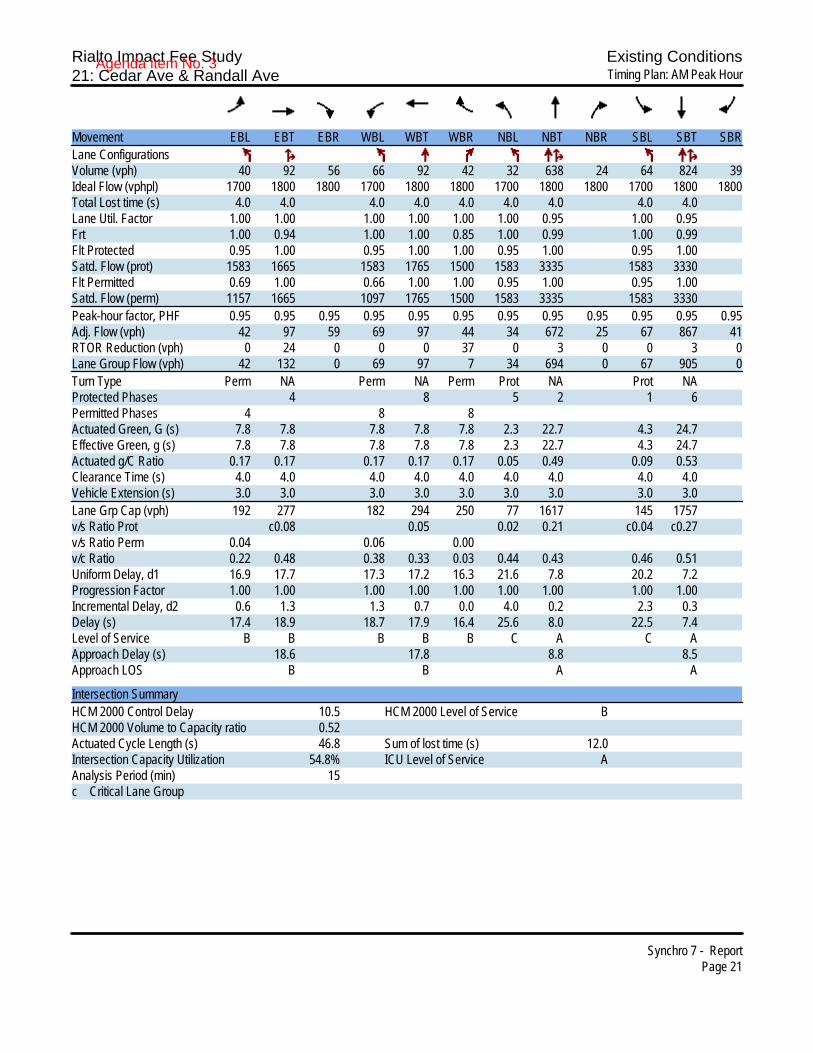
Rialto Impact Fee Study Existing Conditions21: Cedar Ave & Randall Ave Timing Plan: AM Peak Hour
Synchro 7 - ReportPage 21
Movement EBL EBT EBR WBL WBT WBR NBL NBT NBR SBL SBT SBRLane ConfigurationsVolume (vph) 40 92 56 66 92 42 32 638 24 64 824 39Ideal Flow (vphpl) 1700 1800 1800 1700 1800 1800 1700 1800 1800 1700 1800 1800Total Lost time (s) 4.0 4.0 4.0 4.0 4.0 4.0 4.0 4.0 4.0Lane Util. Factor 1.00 1.00 1.00 1.00 1.00 1.00 0.95 1.00 0.95Frt 1.00 0.94 1.00 1.00 0.85 1.00 0.99 1.00 0.99Flt Protected 0.95 1.00 0.95 1.00 1.00 0.95 1.00 0.95 1.00Satd. Flow (prot) 1583 1665 1583 1765 1500 1583 3335 1583 3330Flt Permitted 0.69 1.00 0.66 1.00 1.00 0.95 1.00 0.95 1.00Satd. Flow (perm) 1157 1665 1097 1765 1500 1583 3335 1583 3330Peak-hour factor, PHF 0.95 0.95 0.95 0.95 0.95 0.95 0.95 0.95 0.95 0.95 0.95 0.95Adj. Flow (vph) 42 97 59 69 97 44 34 672 25 67 867 41RTOR Reduction (vph) 0 24 0 0 0 37 0 3 0 0 3 0Lane Group Flow (vph) 42 132 0 69 97 7 34 694 0 67 905 0Turn Type Perm NA Perm NA Perm Prot NA Prot NAProtected Phases 4 8 5 2 1 6Permitted Phases 4 8 8Actuated Green, G (s) 7.8 7.8 7.8 7.8 7.8 2.3 22.7 4.3 24.7Effective Green, g (s) 7.8 7.8 7.8 7.8 7.8 2.3 22.7 4.3 24.7Actuated g/C Ratio 0.17 0.17 0.17 0.17 0.17 0.05 0.49 0.09 0.53Clearance Time (s) 4.0 4.0 4.0 4.0 4.0 4.0 4.0 4.0 4.0Vehicle Extension (s) 3.0 3.0 3.0 3.0 3.0 3.0 3.0 3.0 3.0Lane Grp Cap (vph) 192 277 182 294 250 77 1617 145 1757v/s Ratio Prot c0.08 0.05 0.02 0.21 c0.04 c0.27v/s Ratio Perm 0.04 0.06 0.00v/c Ratio 0.22 0.48 0.38 0.33 0.03 0.44 0.43 0.46 0.51Uniform Delay, d1 16.9 17.7 17.3 17.2 16.3 21.6 7.8 20.2 7.2Progression Factor 1.00 1.00 1.00 1.00 1.00 1.00 1.00 1.00 1.00Incremental Delay, d2 0.6 1.3 1.3 0.7 0.0 4.0 0.2 2.3 0.3Delay (s) 17.4 18.9 18.7 17.9 16.4 25.6 8.0 22.5 7.4Level of Service B B B B B C A C AApproach Delay (s) 18.6 17.8 8.8 8.5Approach LOS B B A A
Intersection SummaryHCM 2000 Control Delay 10.5 HCM 2000 Level of Service BHCM 2000 Volume to Capacity ratio 0.52Actuated Cycle Length (s) 46.8 Sum of lost time (s) 12.0Intersection Capacity Utilization 54.8% ICU Level of Service AAnalysis Period (min) 15c Critical Lane Group
Agenda item No. 3
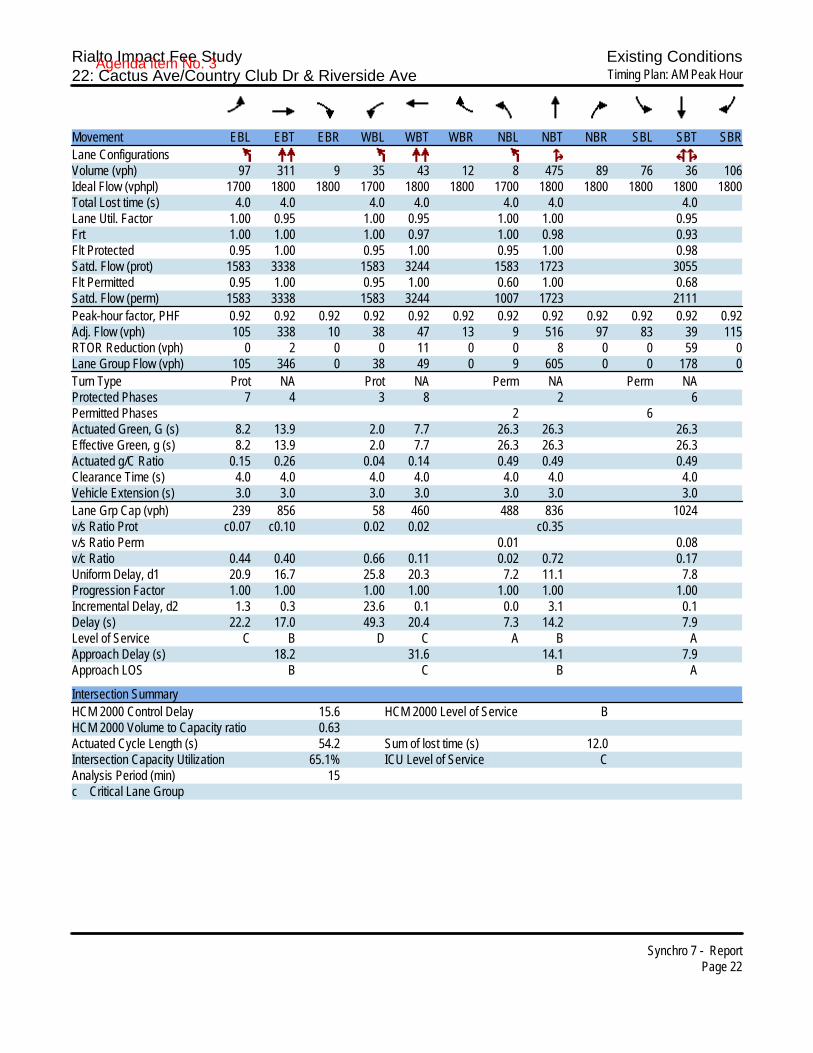
Rialto Impact Fee Study Existing Conditions22: Cactus Ave/Country Club Dr & Riverside Ave Timing Plan: AM Peak Hour
Synchro 7 - ReportPage 22
Movement EBL EBT EBR WBL WBT WBR NBL NBT NBR SBL SBT SBRLane ConfigurationsVolume (vph) 97 311 9 35 43 12 8 475 89 76 36 106Ideal Flow (vphpl) 1700 1800 1800 1700 1800 1800 1700 1800 1800 1800 1800 1800Total Lost time (s) 4.0 4.0 4.0 4.0 4.0 4.0 4.0Lane Util. Factor 1.00 0.95 1.00 0.95 1.00 1.00 0.95Frt 1.00 1.00 1.00 0.97 1.00 0.98 0.93Flt Protected 0.95 1.00 0.95 1.00 0.95 1.00 0.98Satd. Flow (prot) 1583 3338 1583 3244 1583 1723 3055Flt Permitted 0.95 1.00 0.95 1.00 0.60 1.00 0.68Satd. Flow (perm) 1583 3338 1583 3244 1007 1723 2111Peak-hour factor, PHF 0.92 0.92 0.92 0.92 0.92 0.92 0.92 0.92 0.92 0.92 0.92 0.92Adj. Flow (vph) 105 338 10 38 47 13 9 516 97 83 39 115RTOR Reduction (vph) 0 2 0 0 11 0 0 8 0 0 59 0Lane Group Flow (vph) 105 346 0 38 49 0 9 605 0 0 178 0Turn Type Prot NA Prot NA Perm NA Perm NAProtected Phases 7 4 3 8 2 6Permitted Phases 2 6Actuated Green, G (s) 8.2 13.9 2.0 7.7 26.3 26.3 26.3Effective Green, g (s) 8.2 13.9 2.0 7.7 26.3 26.3 26.3Actuated g/C Ratio 0.15 0.26 0.04 0.14 0.49 0.49 0.49Clearance Time (s) 4.0 4.0 4.0 4.0 4.0 4.0 4.0Vehicle Extension (s) 3.0 3.0 3.0 3.0 3.0 3.0 3.0Lane Grp Cap (vph) 239 856 58 460 488 836 1024v/s Ratio Prot c0.07 c0.10 0.02 0.02 c0.35v/s Ratio Perm 0.01 0.08v/c Ratio 0.44 0.40 0.66 0.11 0.02 0.72 0.17Uniform Delay, d1 20.9 16.7 25.8 20.3 7.2 11.1 7.8Progression Factor 1.00 1.00 1.00 1.00 1.00 1.00 1.00Incremental Delay, d2 1.3 0.3 23.6 0.1 0.0 3.1 0.1Delay (s) 22.2 17.0 49.3 20.4 7.3 14.2 7.9Level of Service C B D C A B AApproach Delay (s) 18.2 31.6 14.1 7.9Approach LOS B C B A
Intersection SummaryHCM 2000 Control Delay 15.6 HCM 2000 Level of Service BHCM 2000 Volume to Capacity ratio 0.63Actuated Cycle Length (s) 54.2 Sum of lost time (s) 12.0Intersection Capacity Utilization 65.1% ICU Level of Service CAnalysis Period (min) 15c Critical Lane Group
Agenda item No. 3
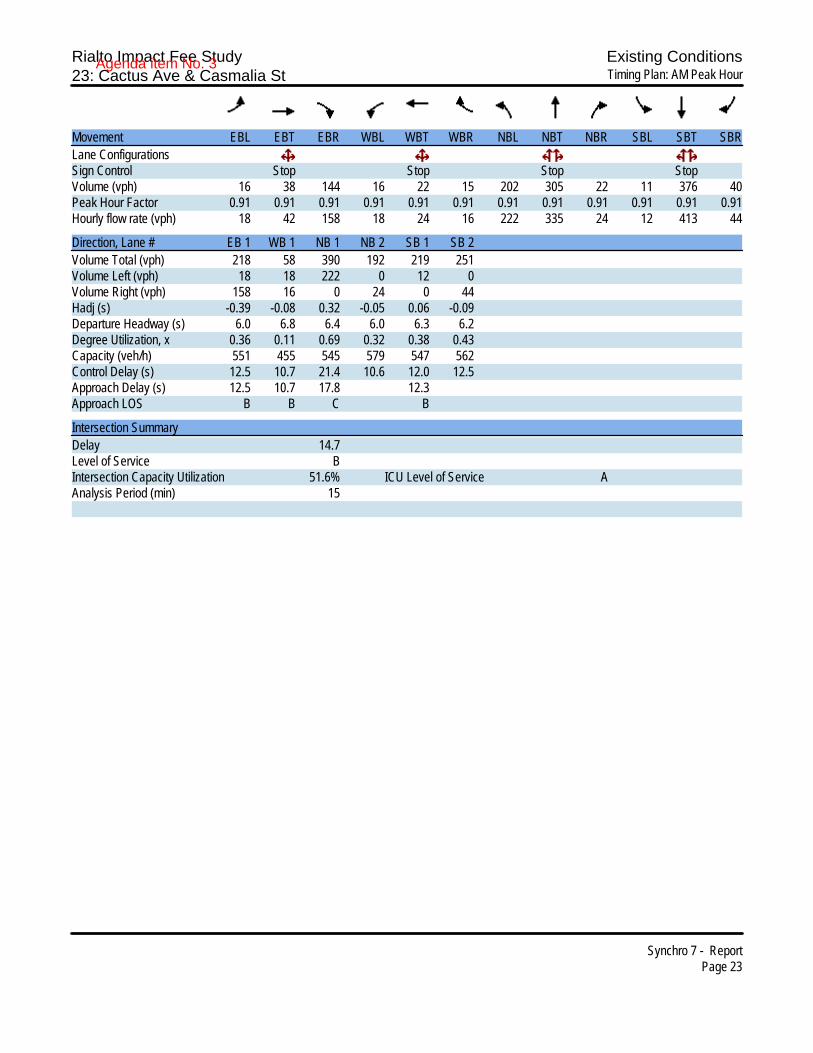
Rialto Impact Fee Study Existing Conditions23: Cactus Ave & Casmalia St Timing Plan: AM Peak Hour
Synchro 7 - ReportPage 23
Movement EBL EBT EBR WBL WBT WBR NBL NBT NBR SBL SBT SBRLane ConfigurationsSign Control Stop Stop Stop StopVolume (vph) 16 38 144 16 22 15 202 305 22 11 376 40Peak Hour Factor 0.91 0.91 0.91 0.91 0.91 0.91 0.91 0.91 0.91 0.91 0.91 0.91Hourly flow rate (vph) 18 42 158 18 24 16 222 335 24 12 413 44
Direction, Lane # EB 1 WB 1 NB 1 NB 2 SB 1 SB 2Volume Total (vph) 218 58 390 192 219 251Volume Left (vph) 18 18 222 0 12 0Volume Right (vph) 158 16 0 24 0 44Hadj (s) -0.39 -0.08 0.32 -0.05 0.06 -0.09Departure Headway (s) 6.0 6.8 6.4 6.0 6.3 6.2Degree Utilization, x 0.36 0.11 0.69 0.32 0.38 0.43Capacity (veh/h) 551 455 545 579 547 562Control Delay (s) 12.5 10.7 21.4 10.6 12.0 12.5Approach Delay (s) 12.5 10.7 17.8 12.3Approach LOS B B C B
Intersection SummaryDelay 14.7Level of Service BIntersection Capacity Utilization 51.6% ICU Level of Service AAnalysis Period (min) 15
Agenda item No. 3

Rialto Impact Fee Study Existing Conditions24: Cactus Ave & Easton St Timing Plan: AM Peak Hour
Synchro 7 - ReportPage 24
Movement EBL EBT EBR WBL WBT WBR NBL NBT NBR SBL SBT SBRLane ConfigurationsSign Control Stop Stop Stop StopVolume (vph) 59 30 67 38 53 144 152 356 50 117 383 52Peak Hour Factor 0.93 0.93 0.93 0.93 0.93 0.93 0.93 0.93 0.93 0.93 0.93 0.93Hourly flow rate (vph) 63 32 72 41 57 155 163 383 54 126 412 56
Direction, Lane # EB 1 WB 1 NB 1 NB 2 SB 1 SB 2Volume Total (vph) 168 253 355 245 332 262Volume Left (vph) 63 41 163 0 126 0Volume Right (vph) 72 155 0 54 0 56Hadj (s) -0.15 -0.30 0.26 -0.12 0.22 -0.12Departure Headway (s) 7.6 7.1 7.5 7.1 7.5 7.1Degree Utilization, x 0.35 0.50 0.74 0.48 0.69 0.52Capacity (veh/h) 426 474 469 494 464 483Control Delay (s) 14.6 16.9 27.5 15.3 24.1 16.3Approach Delay (s) 14.6 16.9 22.5 20.7Approach LOS B C C C
Intersection SummaryDelay 20.1Level of Service CIntersection Capacity Utilization 62.2% ICU Level of Service BAnalysis Period (min) 15
Agenda item No. 3

Rialto Impact Fee Study Existing Conditions25: Cactus Ave & Base Line Rd Timing Plan: AM Peak Hour
Synchro 7 - ReportPage 25
Movement EBL EBT EBR WBL WBT WBR NBL NBT NBR SBL SBT SBRLane ConfigurationsVolume (vph) 102 549 115 190 559 142 92 428 164 160 495 117Ideal Flow (vphpl) 1700 1800 1800 1700 1800 1800 1700 1800 1800 1700 1800 1800Total Lost time (s) 4.0 4.0 4.0 4.0 4.0 4.0 4.0 4.0Lane Util. Factor 1.00 0.95 1.00 0.95 1.00 0.95 1.00 0.95Frt 1.00 0.97 1.00 0.97 1.00 0.96 1.00 0.97Flt Protected 0.95 1.00 0.95 1.00 0.95 1.00 0.95 1.00Satd. Flow (prot) 1583 3266 1583 3251 1583 3214 1583 3257Flt Permitted 0.95 1.00 0.95 1.00 0.95 1.00 0.95 1.00Satd. Flow (perm) 1583 3266 1583 3251 1583 3214 1583 3257Peak-hour factor, PHF 0.81 0.81 0.81 0.81 0.81 0.81 0.81 0.81 0.81 0.81 0.81 0.81Adj. Flow (vph) 126 678 142 235 690 175 114 528 202 198 611 144RTOR Reduction (vph) 0 18 0 0 23 0 0 39 0 0 20 0Lane Group Flow (vph) 126 802 0 235 842 0 114 691 0 198 735 0Turn Type Prot NA Prot NA Prot NA Prot NAProtected Phases 7 4 3 8 5 2 1 6Permitted PhasesActuated Green, G (s) 10.4 25.8 17.1 32.5 9.6 25.2 14.4 30.0Effective Green, g (s) 10.4 25.8 17.1 32.5 9.6 25.2 14.4 30.0Actuated g/C Ratio 0.11 0.26 0.17 0.33 0.10 0.26 0.15 0.30Clearance Time (s) 4.0 4.0 4.0 4.0 4.0 4.0 4.0 4.0Vehicle Extension (s) 3.0 3.0 3.0 3.0 3.0 3.0 3.0 3.0Lane Grp Cap (vph) 167 855 274 1072 154 822 231 991v/s Ratio Prot 0.08 c0.25 c0.15 0.26 0.07 c0.21 c0.13 0.23v/s Ratio Permv/c Ratio 0.75 0.94 0.86 0.79 0.74 0.84 0.86 0.74Uniform Delay, d1 42.8 35.6 39.5 29.8 43.2 34.7 41.0 30.8Progression Factor 1.00 1.00 1.00 1.00 1.00 1.00 1.00 1.00Incremental Delay, d2 17.4 17.5 22.3 3.9 17.3 10.1 25.5 5.0Delay (s) 60.3 53.0 61.8 33.7 60.5 44.8 66.5 35.8Level of Service E D E C E D E DApproach Delay (s) 54.0 39.7 47.0 42.1Approach LOS D D D D
Intersection SummaryHCM 2000 Control Delay 45.4 HCM 2000 Level of Service DHCM 2000 Volume to Capacity ratio 0.88Actuated Cycle Length (s) 98.5 Sum of lost time (s) 16.0Intersection Capacity Utilization 72.9% ICU Level of Service CAnalysis Period (min) 15c Critical Lane Group
Agenda item No. 3

Rialto Impact Fee Study Existing Conditions26: Cactus Ave & Foothill Blvd Timing Plan: AM Peak Hour
Synchro 7 - ReportPage 26
Movement EBL EBT EBR WBL WBT WBR NBL NBT NBR SBL SBT SBRLane ConfigurationsVolume (vph) 34 567 65 108 508 51 48 251 80 79 472 48Ideal Flow (vphpl) 1700 1800 1800 1700 1800 1800 1700 1800 1800 1700 1800 1800Total Lost time (s) 4.0 4.0 4.0 4.0 4.0 4.0 4.0 4.0 4.0Lane Util. Factor 1.00 0.91 1.00 0.95 1.00 1.00 0.95 1.00 0.95Frt 1.00 0.98 1.00 1.00 0.85 1.00 0.96 1.00 0.99Flt Protected 0.95 1.00 0.95 1.00 1.00 0.95 1.00 0.95 1.00Satd. Flow (prot) 1583 4743 1583 3353 1500 1583 3231 1583 3306Flt Permitted 0.95 1.00 0.95 1.00 1.00 0.37 1.00 0.51 1.00Satd. Flow (perm) 1583 4743 1583 3353 1500 617 3231 846 3306Peak-hour factor, PHF 0.88 0.88 0.88 0.88 0.88 0.88 0.88 0.88 0.88 0.88 0.88 0.88Adj. Flow (vph) 39 644 74 123 577 58 55 285 91 90 536 55RTOR Reduction (vph) 0 15 0 0 0 39 0 27 0 0 7 0Lane Group Flow (vph) 39 703 0 123 577 19 55 349 0 90 584 0Turn Type Prot NA Prot NA Perm Perm NA Perm NAProtected Phases 7 4 3 8 2 6Permitted Phases 8 2 6Actuated Green, G (s) 5.0 21.1 11.8 27.9 27.9 39.4 39.4 39.4 39.4Effective Green, g (s) 5.0 21.1 11.8 27.9 27.9 39.4 39.4 39.4 39.4Actuated g/C Ratio 0.06 0.25 0.14 0.33 0.33 0.47 0.47 0.47 0.47Clearance Time (s) 4.0 4.0 4.0 4.0 4.0 4.0 4.0 4.0 4.0Vehicle Extension (s) 3.0 3.0 3.0 3.0 3.0 3.0 3.0 3.0 3.0Lane Grp Cap (vph) 93 1187 221 1109 496 288 1510 395 1545v/s Ratio Prot 0.02 c0.15 c0.08 0.17 0.11 c0.18v/s Ratio Perm 0.01 0.09 0.11v/c Ratio 0.42 0.59 0.56 0.52 0.04 0.19 0.23 0.23 0.38Uniform Delay, d1 38.2 27.8 33.8 22.8 19.1 13.1 13.4 13.4 14.5Progression Factor 1.00 1.00 1.00 1.00 1.00 1.00 1.00 1.00 1.00Incremental Delay, d2 3.0 0.8 3.0 0.4 0.0 1.5 0.4 1.3 0.7Delay (s) 41.3 28.6 36.8 23.2 19.1 14.6 13.8 14.7 15.2Level of Service D C D C B B B B BApproach Delay (s) 29.3 25.1 13.9 15.2Approach LOS C C B B
Intersection SummaryHCM 2000 Control Delay 21.9 HCM 2000 Level of Service CHCM 2000 Volume to Capacity ratio 0.47Actuated Cycle Length (s) 84.3 Sum of lost time (s) 12.0Intersection Capacity Utilization 51.8% ICU Level of Service AAnalysis Period (min) 15c Critical Lane Group
Agenda item No. 3

Rialto Impact Fee Study Existing Conditions27: Cactus Ave & Rialto Ave Timing Plan: AM Peak Hour
Synchro 7 - ReportPage 27
Movement EBL EBT EBR WBL WBT WBR NBL NBT NBR SBL SBT SBRLane ConfigurationsVolume (vph) 96 260 108 31 359 57 130 251 24 76 457 364Ideal Flow (vphpl) 1700 1800 1800 1700 1800 1800 1700 1800 1800 1700 1800 1800Total Lost time (s) 4.0 4.0 4.0 4.0 4.0 4.0 4.0 4.0Lane Util. Factor 1.00 0.95 1.00 0.95 1.00 0.95 1.00 0.95Frt 1.00 0.96 1.00 0.98 1.00 0.99 1.00 0.93Flt Protected 0.95 1.00 0.95 1.00 0.95 1.00 0.95 1.00Satd. Flow (prot) 1583 3205 1583 3284 1583 3309 1583 3130Flt Permitted 0.38 1.00 0.43 1.00 0.22 1.00 0.55 1.00Satd. Flow (perm) 637 3205 716 3284 374 3309 916 3130Peak-hour factor, PHF 0.82 0.82 0.82 0.82 0.82 0.82 0.82 0.82 0.82 0.82 0.82 0.82Adj. Flow (vph) 117 317 132 38 438 70 159 306 29 93 557 444RTOR Reduction (vph) 0 45 0 0 13 0 0 8 0 0 75 0Lane Group Flow (vph) 117 404 0 38 495 0 159 327 0 93 926 0Turn Type Perm NA Perm NA Perm NA Perm NAProtected Phases 4 8 2 6Permitted Phases 4 8 2 6Actuated Green, G (s) 20.4 20.4 20.4 20.4 35.7 35.7 35.7 35.7Effective Green, g (s) 20.4 20.4 20.4 20.4 35.7 35.7 35.7 35.7Actuated g/C Ratio 0.32 0.32 0.32 0.32 0.56 0.56 0.56 0.56Clearance Time (s) 4.0 4.0 4.0 4.0 4.0 4.0 4.0 4.0Vehicle Extension (s) 3.0 3.0 3.0 3.0 3.0 3.0 3.0 3.0Lane Grp Cap (vph) 202 1020 227 1045 208 1842 510 1743v/s Ratio Prot 0.13 0.15 0.10 0.30v/s Ratio Perm c0.18 0.05 c0.43 0.10v/c Ratio 0.58 0.40 0.17 0.47 0.76 0.18 0.18 0.53Uniform Delay, d1 18.3 17.0 15.7 17.5 11.0 7.0 7.0 8.9Progression Factor 1.00 1.00 1.00 1.00 1.00 1.00 1.00 1.00Incremental Delay, d2 4.0 0.3 0.4 0.3 15.3 0.0 0.2 0.3Delay (s) 22.3 17.3 16.1 17.9 26.3 7.0 7.2 9.2Level of Service C B B B C A A AApproach Delay (s) 18.3 17.8 13.2 9.1Approach LOS B B B A
Intersection SummaryHCM 2000 Control Delay 13.5 HCM 2000 Level of Service BHCM 2000 Volume to Capacity ratio 0.70Actuated Cycle Length (s) 64.1 Sum of lost time (s) 8.0Intersection Capacity Utilization 65.4% ICU Level of Service CAnalysis Period (min) 15c Critical Lane Group
Agenda item No. 3

Rialto Impact Fee Study Existing Conditions28: Cactus Ave & Merrill Ave Timing Plan: AM Peak Hour
Synchro 7 - ReportPage 28
Movement EBL EBT EBR WBL WBT WBR NBL NBT NBR SBL SBT SBRLane ConfigurationsVolume (vph) 72 233 29 33 235 76 27 297 38 64 450 71Ideal Flow (vphpl) 1700 1800 1800 1700 1800 1800 1700 1800 1800 1700 1800 1800Total Lost time (s) 4.0 4.0 4.0 4.0 4.0 4.0 4.0 4.0Lane Util. Factor 1.00 0.95 1.00 0.95 1.00 0.95 1.00 0.95Frt 1.00 0.98 1.00 0.96 1.00 0.98 1.00 0.98Flt Protected 0.95 1.00 0.95 1.00 0.95 1.00 0.95 1.00Satd. Flow (prot) 1583 3297 1583 3231 1583 3296 1583 3284Flt Permitted 0.53 1.00 0.56 1.00 0.95 1.00 0.95 1.00Satd. Flow (perm) 886 3297 937 3231 1583 3296 1583 3284Peak-hour factor, PHF 0.84 0.84 0.84 0.84 0.84 0.84 0.84 0.84 0.84 0.84 0.84 0.84Adj. Flow (vph) 86 277 35 39 280 90 32 354 45 76 536 85RTOR Reduction (vph) 0 11 0 0 34 0 0 11 0 0 14 0Lane Group Flow (vph) 86 301 0 39 336 0 32 388 0 76 607 0Turn Type Perm NA Perm NA Prot NA Prot NAProtected Phases 4 8 5 2 1 6Permitted Phases 4 8Actuated Green, G (s) 12.0 12.0 12.0 12.0 2.3 14.5 4.5 16.7Effective Green, g (s) 12.0 12.0 12.0 12.0 2.3 14.5 4.5 16.7Actuated g/C Ratio 0.28 0.28 0.28 0.28 0.05 0.34 0.10 0.39Clearance Time (s) 4.0 4.0 4.0 4.0 4.0 4.0 4.0 4.0Vehicle Extension (s) 3.0 3.0 3.0 3.0 3.0 3.0 3.0 3.0Lane Grp Cap (vph) 247 920 261 901 84 1111 165 1275v/s Ratio Prot 0.09 c0.10 0.02 0.12 c0.05 c0.18v/s Ratio Perm 0.10 0.04v/c Ratio 0.35 0.33 0.15 0.37 0.38 0.35 0.46 0.48Uniform Delay, d1 12.4 12.3 11.7 12.5 19.7 10.7 18.1 9.9Progression Factor 1.00 1.00 1.00 1.00 1.00 1.00 1.00 1.00Incremental Delay, d2 0.9 0.2 0.3 0.3 2.9 0.2 2.0 0.3Delay (s) 13.2 12.5 11.9 12.7 22.5 10.9 20.1 10.1Level of Service B B B B C B C BApproach Delay (s) 12.7 12.7 11.8 11.2Approach LOS B B B B
Intersection SummaryHCM 2000 Control Delay 11.9 HCM 2000 Level of Service BHCM 2000 Volume to Capacity ratio 0.46Actuated Cycle Length (s) 43.0 Sum of lost time (s) 12.0Intersection Capacity Utilization 46.1% ICU Level of Service AAnalysis Period (min) 15c Critical Lane Group
Agenda item No. 3
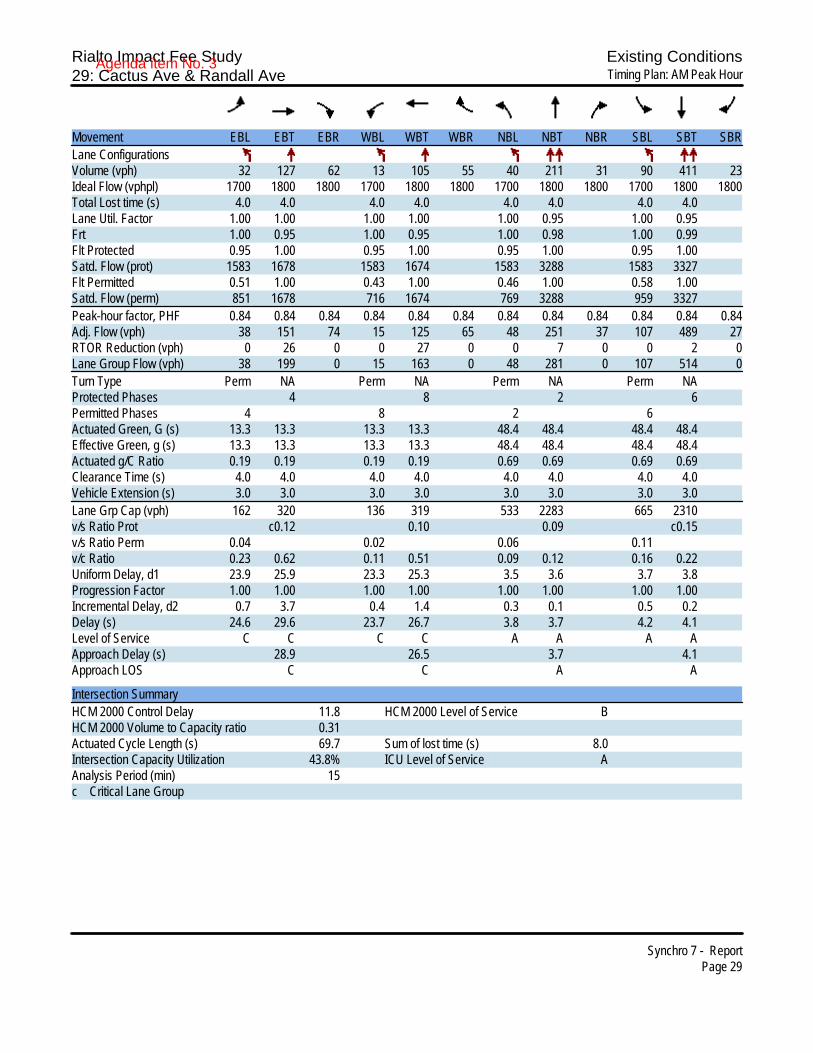
Rialto Impact Fee Study Existing Conditions29: Cactus Ave & Randall Ave Timing Plan: AM Peak Hour
Synchro 7 - ReportPage 29
Movement EBL EBT EBR WBL WBT WBR NBL NBT NBR SBL SBT SBRLane ConfigurationsVolume (vph) 32 127 62 13 105 55 40 211 31 90 411 23Ideal Flow (vphpl) 1700 1800 1800 1700 1800 1800 1700 1800 1800 1700 1800 1800Total Lost time (s) 4.0 4.0 4.0 4.0 4.0 4.0 4.0 4.0Lane Util. Factor 1.00 1.00 1.00 1.00 1.00 0.95 1.00 0.95Frt 1.00 0.95 1.00 0.95 1.00 0.98 1.00 0.99Flt Protected 0.95 1.00 0.95 1.00 0.95 1.00 0.95 1.00Satd. Flow (prot) 1583 1678 1583 1674 1583 3288 1583 3327Flt Permitted 0.51 1.00 0.43 1.00 0.46 1.00 0.58 1.00Satd. Flow (perm) 851 1678 716 1674 769 3288 959 3327Peak-hour factor, PHF 0.84 0.84 0.84 0.84 0.84 0.84 0.84 0.84 0.84 0.84 0.84 0.84Adj. Flow (vph) 38 151 74 15 125 65 48 251 37 107 489 27RTOR Reduction (vph) 0 26 0 0 27 0 0 7 0 0 2 0Lane Group Flow (vph) 38 199 0 15 163 0 48 281 0 107 514 0Turn Type Perm NA Perm NA Perm NA Perm NAProtected Phases 4 8 2 6Permitted Phases 4 8 2 6Actuated Green, G (s) 13.3 13.3 13.3 13.3 48.4 48.4 48.4 48.4Effective Green, g (s) 13.3 13.3 13.3 13.3 48.4 48.4 48.4 48.4Actuated g/C Ratio 0.19 0.19 0.19 0.19 0.69 0.69 0.69 0.69Clearance Time (s) 4.0 4.0 4.0 4.0 4.0 4.0 4.0 4.0Vehicle Extension (s) 3.0 3.0 3.0 3.0 3.0 3.0 3.0 3.0Lane Grp Cap (vph) 162 320 136 319 533 2283 665 2310v/s Ratio Prot c0.12 0.10 0.09 c0.15v/s Ratio Perm 0.04 0.02 0.06 0.11v/c Ratio 0.23 0.62 0.11 0.51 0.09 0.12 0.16 0.22Uniform Delay, d1 23.9 25.9 23.3 25.3 3.5 3.6 3.7 3.8Progression Factor 1.00 1.00 1.00 1.00 1.00 1.00 1.00 1.00Incremental Delay, d2 0.7 3.7 0.4 1.4 0.3 0.1 0.5 0.2Delay (s) 24.6 29.6 23.7 26.7 3.8 3.7 4.2 4.1Level of Service C C C C A A A AApproach Delay (s) 28.9 26.5 3.7 4.1Approach LOS C C A A
Intersection SummaryHCM 2000 Control Delay 11.8 HCM 2000 Level of Service BHCM 2000 Volume to Capacity ratio 0.31Actuated Cycle Length (s) 69.7 Sum of lost time (s) 8.0Intersection Capacity Utilization 43.8% ICU Level of Service AAnalysis Period (min) 15c Critical Lane Group
Agenda item No. 3

Rialto Impact Fee Study Existing Conditions30: Cactus Ave & San Bernardino Ave/San Bernardinio Ave Timing Plan: AM Peak Hour
Synchro 7 - ReportPage 30
Movement EBL EBT EBR WBL WBT WBR NBL NBT NBR SBL SBT SBRLane ConfigurationsSign Control Stop Stop Stop StopVolume (vph) 46 122 7 85 246 2 27 146 67 7 174 57Peak Hour Factor 0.68 0.68 0.68 0.68 0.68 0.68 0.68 0.68 0.68 0.68 0.68 0.68Hourly flow rate (vph) 68 179 10 125 362 3 40 215 99 10 256 84
Direction, Lane # EB 1 EB 2 WB 1 WB 2 NB 1 NB 2 SB 1 SB 2Volume Total (vph) 157 100 306 184 40 313 10 340Volume Left (vph) 68 0 125 0 40 0 10 0Volume Right (vph) 0 10 0 3 0 99 0 84Hadj (s) 0.25 -0.04 0.24 0.02 0.53 -0.19 0.53 -0.14Departure Headway (s) 8.1 7.8 7.6 7.4 8.1 7.4 8.1 7.4Degree Utilization, x 0.35 0.22 0.65 0.38 0.09 0.64 0.02 0.70Capacity (veh/h) 419 432 458 468 425 467 425 468Control Delay (s) 14.2 11.7 22.3 13.6 10.7 21.3 10.0 24.4Approach Delay (s) 13.2 19.1 20.1 24.0Approach LOS B C C C
Intersection SummaryDelay 19.5Level of Service CIntersection Capacity Utilization 45.0% ICU Level of Service AAnalysis Period (min) 15
Agenda item No. 3
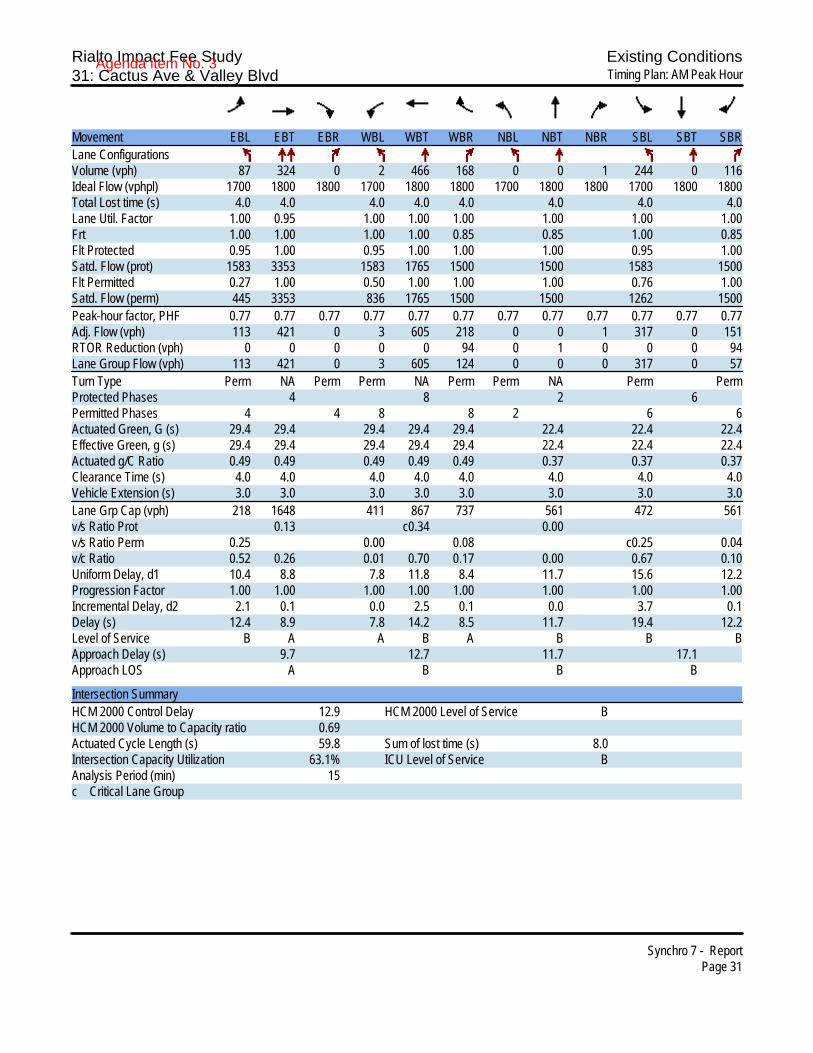
Rialto Impact Fee Study Existing Conditions31: Cactus Ave & Valley Blvd Timing Plan: AM Peak Hour
Synchro 7 - ReportPage 31
Movement EBL EBT EBR WBL WBT WBR NBL NBT NBR SBL SBT SBRLane ConfigurationsVolume (vph) 87 324 0 2 466 168 0 0 1 244 0 116Ideal Flow (vphpl) 1700 1800 1800 1700 1800 1800 1700 1800 1800 1700 1800 1800Total Lost time (s) 4.0 4.0 4.0 4.0 4.0 4.0 4.0 4.0Lane Util. Factor 1.00 0.95 1.00 1.00 1.00 1.00 1.00 1.00Frt 1.00 1.00 1.00 1.00 0.85 0.85 1.00 0.85Flt Protected 0.95 1.00 0.95 1.00 1.00 1.00 0.95 1.00Satd. Flow (prot) 1583 3353 1583 1765 1500 1500 1583 1500Flt Permitted 0.27 1.00 0.50 1.00 1.00 1.00 0.76 1.00Satd. Flow (perm) 445 3353 836 1765 1500 1500 1262 1500Peak-hour factor, PHF 0.77 0.77 0.77 0.77 0.77 0.77 0.77 0.77 0.77 0.77 0.77 0.77Adj. Flow (vph) 113 421 0 3 605 218 0 0 1 317 0 151RTOR Reduction (vph) 0 0 0 0 0 94 0 1 0 0 0 94Lane Group Flow (vph) 113 421 0 3 605 124 0 0 0 317 0 57Turn Type Perm NA Perm Perm NA Perm Perm NA Perm PermProtected Phases 4 8 2 6Permitted Phases 4 4 8 8 2 6 6Actuated Green, G (s) 29.4 29.4 29.4 29.4 29.4 22.4 22.4 22.4Effective Green, g (s) 29.4 29.4 29.4 29.4 29.4 22.4 22.4 22.4Actuated g/C Ratio 0.49 0.49 0.49 0.49 0.49 0.37 0.37 0.37Clearance Time (s) 4.0 4.0 4.0 4.0 4.0 4.0 4.0 4.0Vehicle Extension (s) 3.0 3.0 3.0 3.0 3.0 3.0 3.0 3.0Lane Grp Cap (vph) 218 1648 411 867 737 561 472 561v/s Ratio Prot 0.13 c0.34 0.00v/s Ratio Perm 0.25 0.00 0.08 c0.25 0.04v/c Ratio 0.52 0.26 0.01 0.70 0.17 0.00 0.67 0.10Uniform Delay, d1 10.4 8.8 7.8 11.8 8.4 11.7 15.6 12.2Progression Factor 1.00 1.00 1.00 1.00 1.00 1.00 1.00 1.00Incremental Delay, d2 2.1 0.1 0.0 2.5 0.1 0.0 3.7 0.1Delay (s) 12.4 8.9 7.8 14.2 8.5 11.7 19.4 12.2Level of Service B A A B A B B BApproach Delay (s) 9.7 12.7 11.7 17.1Approach LOS A B B B
Intersection SummaryHCM 2000 Control Delay 12.9 HCM 2000 Level of Service BHCM 2000 Volume to Capacity ratio 0.69Actuated Cycle Length (s) 59.8 Sum of lost time (s) 8.0Intersection Capacity Utilization 63.1% ICU Level of Service BAnalysis Period (min) 15c Critical Lane Group
Agenda item No. 3

Rialto Impact Fee Study Existing Conditions32: Riverside Ave & I-210 WB Ramps Timing Plan: AM Peak Hour
Synchro 7 - ReportPage 32
Movement EBL EBT EBR WBL WBT WBR NBL NBT NBR SBL SBT SBRLane ConfigurationsVolume (vph) 0 0 0 649 3 319 879 565 0 0 971 246Ideal Flow (vphpl) 1800 1800 1800 1700 1800 1800 1600 1800 1800 1800 1800 1800Total Lost time (s) 4.0 4.0 4.0 4.0 4.0 4.0 4.0Lane Util. Factor 0.95 0.91 0.95 0.97 0.95 0.86 1.00Frt 1.00 0.99 0.85 1.00 1.00 1.00 0.85Flt Protected 0.95 0.96 1.00 0.95 1.00 1.00 1.00Satd. Flow (prot) 1504 1515 1425 2891 3353 6071 1500Flt Permitted 0.95 0.96 1.00 0.95 1.00 1.00 1.00Satd. Flow (perm) 1504 1515 1425 2891 3353 6071 1500Peak-hour factor, PHF 0.95 0.95 0.95 0.95 0.95 0.95 0.95 0.95 0.95 0.95 0.95 0.95Adj. Flow (vph) 0 0 0 683 3 336 925 595 0 0 1022 259RTOR Reduction (vph) 0 0 0 0 4 215 0 0 0 0 0 204Lane Group Flow (vph) 0 0 0 362 354 87 925 595 0 0 1022 55Turn Type Perm NA Perm Prot NA NA PermProtected Phases 8 5 2 6Permitted Phases 8 8 6Actuated Green, G (s) 24.5 24.5 24.5 30.3 52.3 18.0 18.0Effective Green, g (s) 24.5 24.5 24.5 30.3 52.3 18.0 18.0Actuated g/C Ratio 0.29 0.29 0.29 0.36 0.62 0.21 0.21Clearance Time (s) 4.0 4.0 4.0 4.0 4.0 4.0 4.0Vehicle Extension (s) 3.0 3.0 3.0 3.0 3.0 3.0 3.0Lane Grp Cap (vph) 434 437 411 1032 2067 1288 318v/s Ratio Prot c0.32 0.18 c0.17v/s Ratio Perm c0.24 0.23 0.06 0.04v/c Ratio 0.83 0.81 0.21 0.90 0.29 0.79 0.17Uniform Delay, d1 28.2 28.0 22.8 25.8 7.6 31.6 27.3Progression Factor 1.00 1.00 1.00 1.00 1.00 1.00 1.00Incremental Delay, d2 12.9 10.6 0.3 10.2 0.1 3.4 0.3Delay (s) 41.2 38.6 23.1 36.0 7.6 35.1 27.6Level of Service D D C D A D CApproach Delay (s) 0.0 34.9 24.9 33.6Approach LOS A C C C
Intersection SummaryHCM 2000 Control Delay 30.5 HCM 2000 Level of Service CHCM 2000 Volume to Capacity ratio 0.85Actuated Cycle Length (s) 84.8 Sum of lost time (s) 12.0Intersection Capacity Utilization 85.5% ICU Level of Service EAnalysis Period (min) 15c Critical Lane Group
Agenda item No. 3
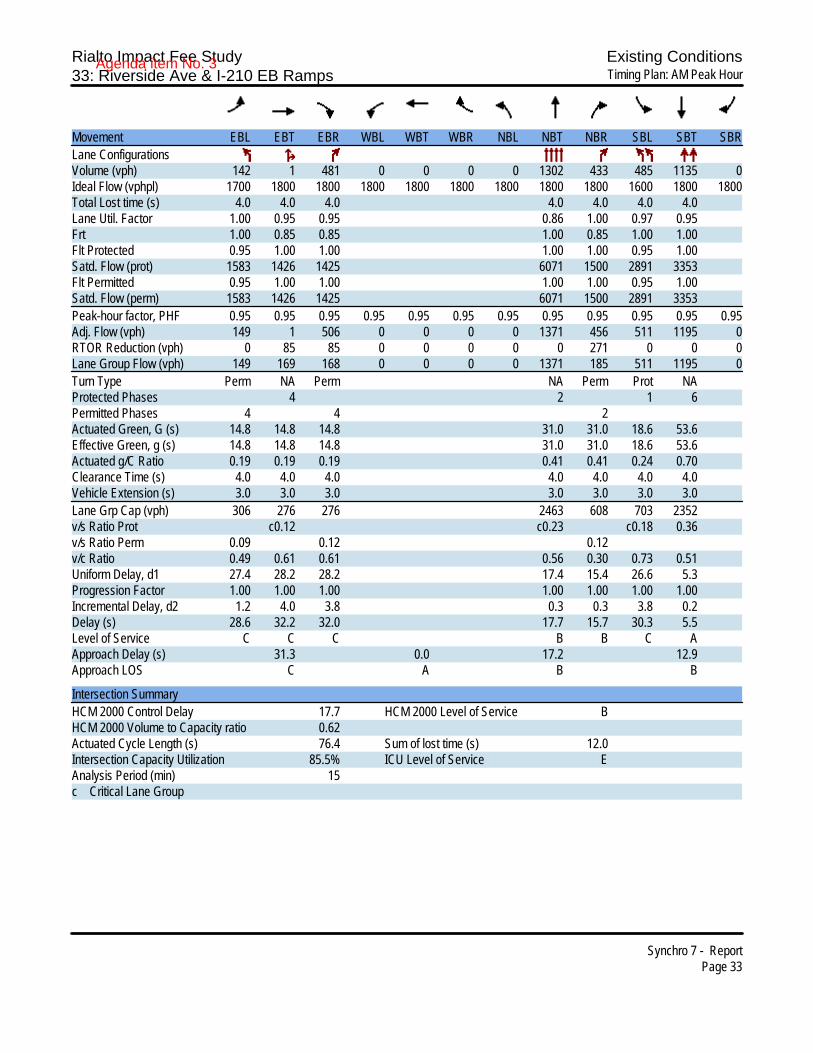
Rialto Impact Fee Study Existing Conditions33: Riverside Ave & I-210 EB Ramps Timing Plan: AM Peak Hour
Synchro 7 - ReportPage 33
Movement EBL EBT EBR WBL WBT WBR NBL NBT NBR SBL SBT SBRLane ConfigurationsVolume (vph) 142 1 481 0 0 0 0 1302 433 485 1135 0Ideal Flow (vphpl) 1700 1800 1800 1800 1800 1800 1800 1800 1800 1600 1800 1800Total Lost time (s) 4.0 4.0 4.0 4.0 4.0 4.0 4.0Lane Util. Factor 1.00 0.95 0.95 0.86 1.00 0.97 0.95Frt 1.00 0.85 0.85 1.00 0.85 1.00 1.00Flt Protected 0.95 1.00 1.00 1.00 1.00 0.95 1.00Satd. Flow (prot) 1583 1426 1425 6071 1500 2891 3353Flt Permitted 0.95 1.00 1.00 1.00 1.00 0.95 1.00Satd. Flow (perm) 1583 1426 1425 6071 1500 2891 3353Peak-hour factor, PHF 0.95 0.95 0.95 0.95 0.95 0.95 0.95 0.95 0.95 0.95 0.95 0.95Adj. Flow (vph) 149 1 506 0 0 0 0 1371 456 511 1195 0RTOR Reduction (vph) 0 85 85 0 0 0 0 0 271 0 0 0Lane Group Flow (vph) 149 169 168 0 0 0 0 1371 185 511 1195 0Turn Type Perm NA Perm NA Perm Prot NAProtected Phases 4 2 1 6Permitted Phases 4 4 2Actuated Green, G (s) 14.8 14.8 14.8 31.0 31.0 18.6 53.6Effective Green, g (s) 14.8 14.8 14.8 31.0 31.0 18.6 53.6Actuated g/C Ratio 0.19 0.19 0.19 0.41 0.41 0.24 0.70Clearance Time (s) 4.0 4.0 4.0 4.0 4.0 4.0 4.0Vehicle Extension (s) 3.0 3.0 3.0 3.0 3.0 3.0 3.0Lane Grp Cap (vph) 306 276 276 2463 608 703 2352v/s Ratio Prot c0.12 c0.23 c0.18 0.36v/s Ratio Perm 0.09 0.12 0.12v/c Ratio 0.49 0.61 0.61 0.56 0.30 0.73 0.51Uniform Delay, d1 27.4 28.2 28.2 17.4 15.4 26.6 5.3Progression Factor 1.00 1.00 1.00 1.00 1.00 1.00 1.00Incremental Delay, d2 1.2 4.0 3.8 0.3 0.3 3.8 0.2Delay (s) 28.6 32.2 32.0 17.7 15.7 30.3 5.5Level of Service C C C B B C AApproach Delay (s) 31.3 0.0 17.2 12.9Approach LOS C A B B
Intersection SummaryHCM 2000 Control Delay 17.7 HCM 2000 Level of Service BHCM 2000 Volume to Capacity ratio 0.62Actuated Cycle Length (s) 76.4 Sum of lost time (s) 12.0Intersection Capacity Utilization 85.5% ICU Level of Service EAnalysis Period (min) 15c Critical Lane Group
Agenda item No. 3
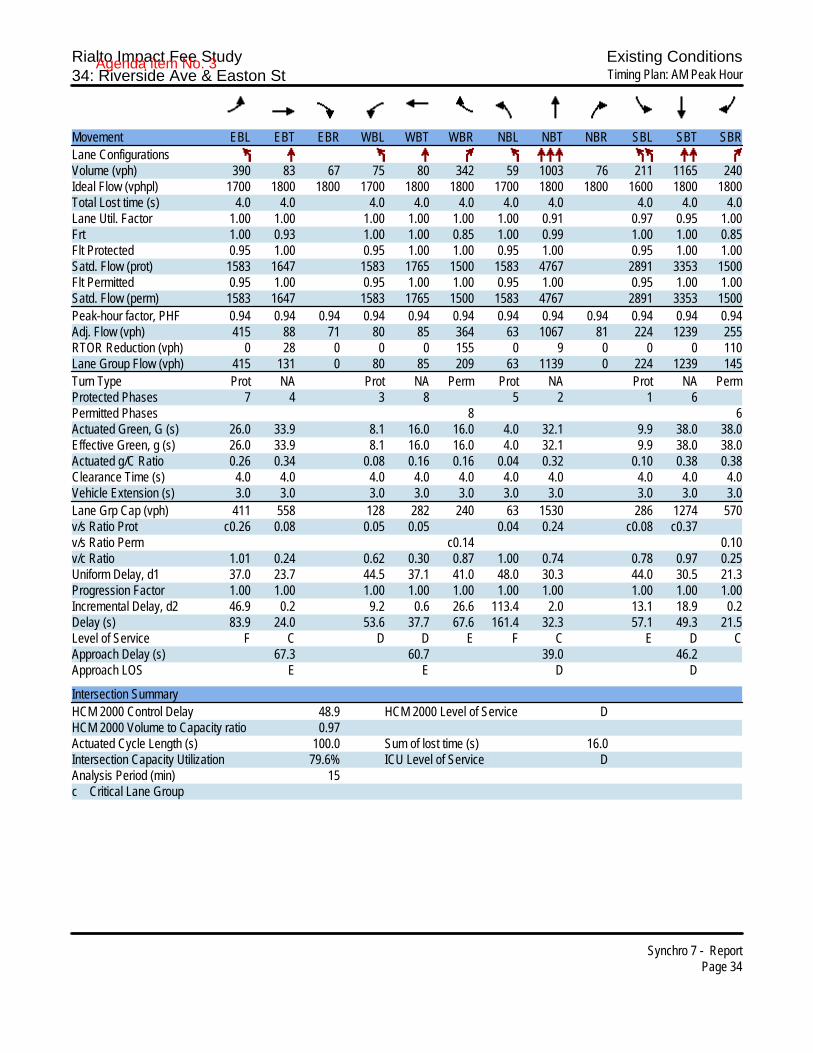
Rialto Impact Fee Study Existing Conditions34: Riverside Ave & Easton St Timing Plan: AM Peak Hour
Synchro 7 - ReportPage 34
Movement EBL EBT EBR WBL WBT WBR NBL NBT NBR SBL SBT SBRLane ConfigurationsVolume (vph) 390 83 67 75 80 342 59 1003 76 211 1165 240Ideal Flow (vphpl) 1700 1800 1800 1700 1800 1800 1700 1800 1800 1600 1800 1800Total Lost time (s) 4.0 4.0 4.0 4.0 4.0 4.0 4.0 4.0 4.0 4.0Lane Util. Factor 1.00 1.00 1.00 1.00 1.00 1.00 0.91 0.97 0.95 1.00Frt 1.00 0.93 1.00 1.00 0.85 1.00 0.99 1.00 1.00 0.85Flt Protected 0.95 1.00 0.95 1.00 1.00 0.95 1.00 0.95 1.00 1.00Satd. Flow (prot) 1583 1647 1583 1765 1500 1583 4767 2891 3353 1500Flt Permitted 0.95 1.00 0.95 1.00 1.00 0.95 1.00 0.95 1.00 1.00Satd. Flow (perm) 1583 1647 1583 1765 1500 1583 4767 2891 3353 1500Peak-hour factor, PHF 0.94 0.94 0.94 0.94 0.94 0.94 0.94 0.94 0.94 0.94 0.94 0.94Adj. Flow (vph) 415 88 71 80 85 364 63 1067 81 224 1239 255RTOR Reduction (vph) 0 28 0 0 0 155 0 9 0 0 0 110Lane Group Flow (vph) 415 131 0 80 85 209 63 1139 0 224 1239 145Turn Type Prot NA Prot NA Perm Prot NA Prot NA PermProtected Phases 7 4 3 8 5 2 1 6Permitted Phases 8 6Actuated Green, G (s) 26.0 33.9 8.1 16.0 16.0 4.0 32.1 9.9 38.0 38.0Effective Green, g (s) 26.0 33.9 8.1 16.0 16.0 4.0 32.1 9.9 38.0 38.0Actuated g/C Ratio 0.26 0.34 0.08 0.16 0.16 0.04 0.32 0.10 0.38 0.38Clearance Time (s) 4.0 4.0 4.0 4.0 4.0 4.0 4.0 4.0 4.0 4.0Vehicle Extension (s) 3.0 3.0 3.0 3.0 3.0 3.0 3.0 3.0 3.0 3.0Lane Grp Cap (vph) 411 558 128 282 240 63 1530 286 1274 570v/s Ratio Prot c0.26 0.08 0.05 0.05 0.04 0.24 c0.08 c0.37v/s Ratio Perm c0.14 0.10v/c Ratio 1.01 0.24 0.62 0.30 0.87 1.00 0.74 0.78 0.97 0.25Uniform Delay, d1 37.0 23.7 44.5 37.1 41.0 48.0 30.3 44.0 30.5 21.3Progression Factor 1.00 1.00 1.00 1.00 1.00 1.00 1.00 1.00 1.00 1.00Incremental Delay, d2 46.9 0.2 9.2 0.6 26.6 113.4 2.0 13.1 18.9 0.2Delay (s) 83.9 24.0 53.6 37.7 67.6 161.4 32.3 57.1 49.3 21.5Level of Service F C D D E F C E D CApproach Delay (s) 67.3 60.7 39.0 46.2Approach LOS E E D D
Intersection SummaryHCM 2000 Control Delay 48.9 HCM 2000 Level of Service DHCM 2000 Volume to Capacity ratio 0.97Actuated Cycle Length (s) 100.0 Sum of lost time (s) 16.0Intersection Capacity Utilization 79.6% ICU Level of Service DAnalysis Period (min) 15c Critical Lane Group
Agenda item No. 3

Rialto Impact Fee Study Existing Conditions35: Riverside Ave & Base Line Rd Timing Plan: AM Peak Hour
Synchro 7 - ReportPage 35
Movement EBL EBT EBR WBL WBT WBR NBL NBT NBR SBL SBT SBRLane ConfigurationsVolume (vph) 85 550 68 55 604 115 131 426 25 243 681 51Ideal Flow (vphpl) 1700 1800 1800 1700 1800 1800 1700 1800 1800 1700 1800 1800Total Lost time (s) 4.0 4.0 4.0 4.0 4.0 4.0 4.0 4.0Lane Util. Factor 1.00 0.95 1.00 0.91 1.00 0.95 1.00 0.95Frt 1.00 0.98 1.00 0.98 1.00 0.99 1.00 0.99Flt Protected 0.95 1.00 0.95 1.00 0.95 1.00 0.95 1.00Satd. Flow (prot) 1583 3298 1583 4702 1583 3325 1583 3318Flt Permitted 0.95 1.00 0.95 1.00 0.95 1.00 0.95 1.00Satd. Flow (perm) 1583 3298 1583 4702 1583 3325 1583 3318Peak-hour factor, PHF 0.86 0.86 0.86 0.86 0.86 0.86 0.86 0.86 0.86 0.86 0.86 0.86Adj. Flow (vph) 99 640 79 64 702 134 152 495 29 283 792 59RTOR Reduction (vph) 0 10 0 0 28 0 0 4 0 0 5 0Lane Group Flow (vph) 99 709 0 64 808 0 152 520 0 283 846 0Turn Type Prot NA Prot NA Prot NA Prot NAProtected Phases 7 4 3 8 5 2 1 6Permitted PhasesActuated Green, G (s) 8.0 24.1 6.0 22.1 12.9 27.7 20.8 35.6Effective Green, g (s) 8.0 24.1 6.0 22.1 12.9 27.7 20.8 35.6Actuated g/C Ratio 0.08 0.25 0.06 0.23 0.14 0.29 0.22 0.38Clearance Time (s) 4.0 4.0 4.0 4.0 4.0 4.0 4.0 4.0Vehicle Extension (s) 3.0 3.0 3.0 3.0 3.0 3.0 3.0 3.0Lane Grp Cap (vph) 133 840 100 1098 215 973 348 1248v/s Ratio Prot c0.06 c0.22 0.04 0.17 0.10 0.16 c0.18 c0.25v/s Ratio Permv/c Ratio 0.74 0.84 0.64 0.74 0.71 0.53 0.81 0.68Uniform Delay, d1 42.3 33.5 43.2 33.6 39.0 28.0 35.1 24.7Progression Factor 1.00 1.00 1.00 1.00 1.00 1.00 1.00 1.00Incremental Delay, d2 20.0 7.8 13.1 2.6 10.1 2.1 13.5 3.0Delay (s) 62.3 41.3 56.4 36.2 49.2 30.1 48.6 27.7Level of Service E D E D D C D CApproach Delay (s) 43.8 37.6 34.4 32.9Approach LOS D D C C
Intersection SummaryHCM 2000 Control Delay 36.9 HCM 2000 Level of Service DHCM 2000 Volume to Capacity ratio 0.80Actuated Cycle Length (s) 94.6 Sum of lost time (s) 16.0Intersection Capacity Utilization 64.8% ICU Level of Service CAnalysis Period (min) 15c Critical Lane Group
Agenda item No. 3

Rialto Impact Fee Study Existing Conditions36: Riverside Ave & Foothill Blvd Timing Plan: AM Peak Hour
Synchro 7 - ReportPage 36
Movement EBL EBT EBR WBL WBT WBR NBL NBT NBR SBL SBT SBRLane ConfigurationsVolume (vph) 95 630 74 100 545 116 122 292 81 181 480 100Ideal Flow (vphpl) 1700 1800 1800 1700 1800 1800 1700 1800 1800 1700 1800 1800Total Lost time (s) 4.0 4.0 4.0 4.0 4.0 4.0 4.0 4.0 4.0Lane Util. Factor 1.00 0.91 1.00 0.91 1.00 0.95 1.00 1.00 0.95Frt 1.00 0.98 1.00 0.97 1.00 1.00 0.85 1.00 0.97Flt Protected 0.95 1.00 0.95 1.00 0.95 1.00 1.00 0.95 1.00Satd. Flow (prot) 1583 4741 1583 4691 1583 3353 1500 1583 3266Flt Permitted 0.95 1.00 0.95 1.00 0.95 1.00 1.00 0.95 1.00Satd. Flow (perm) 1583 4741 1583 4691 1583 3353 1500 1583 3266Peak-hour factor, PHF 0.93 0.93 0.93 0.93 0.93 0.93 0.93 0.93 0.93 0.93 0.93 0.93Adj. Flow (vph) 102 677 80 108 586 125 131 314 87 195 516 108RTOR Reduction (vph) 0 14 0 0 32 0 0 0 66 0 18 0Lane Group Flow (vph) 102 743 0 108 679 0 131 314 21 195 606 0Turn Type Prot NA Prot NA Prot NA Perm Prot NAProtected Phases 7 4 3 8 5 2 1 6Permitted Phases 2Actuated Green, G (s) 8.1 18.8 8.4 19.1 9.4 19.0 19.0 15.2 24.8Effective Green, g (s) 8.1 18.8 8.4 19.1 9.4 19.0 19.0 15.2 24.8Actuated g/C Ratio 0.10 0.24 0.11 0.25 0.12 0.25 0.25 0.20 0.32Clearance Time (s) 4.0 4.0 4.0 4.0 4.0 4.0 4.0 4.0 4.0Vehicle Extension (s) 3.0 3.0 3.0 3.0 3.0 3.0 3.0 3.0 3.0Lane Grp Cap (vph) 165 1151 171 1157 192 823 368 310 1046v/s Ratio Prot 0.06 c0.16 c0.07 0.14 0.08 0.09 c0.12 c0.19v/s Ratio Perm 0.01v/c Ratio 0.62 0.65 0.63 0.59 0.68 0.38 0.06 0.63 0.58Uniform Delay, d1 33.2 26.3 33.0 25.7 32.6 24.3 22.4 28.5 21.9Progression Factor 1.00 1.00 1.00 1.00 1.00 1.00 1.00 1.00 1.00Incremental Delay, d2 6.7 1.3 7.4 0.8 9.6 0.3 0.1 4.0 0.8Delay (s) 39.9 27.6 40.4 26.4 42.2 24.6 22.4 32.5 22.7Level of Service D C D C D C C C CApproach Delay (s) 29.0 28.3 28.6 25.1Approach LOS C C C C
Intersection SummaryHCM 2000 Control Delay 27.7 HCM 2000 Level of Service CHCM 2000 Volume to Capacity ratio 0.64Actuated Cycle Length (s) 77.4 Sum of lost time (s) 16.0Intersection Capacity Utilization 59.0% ICU Level of Service BAnalysis Period (min) 15c Critical Lane Group
Agenda item No. 3
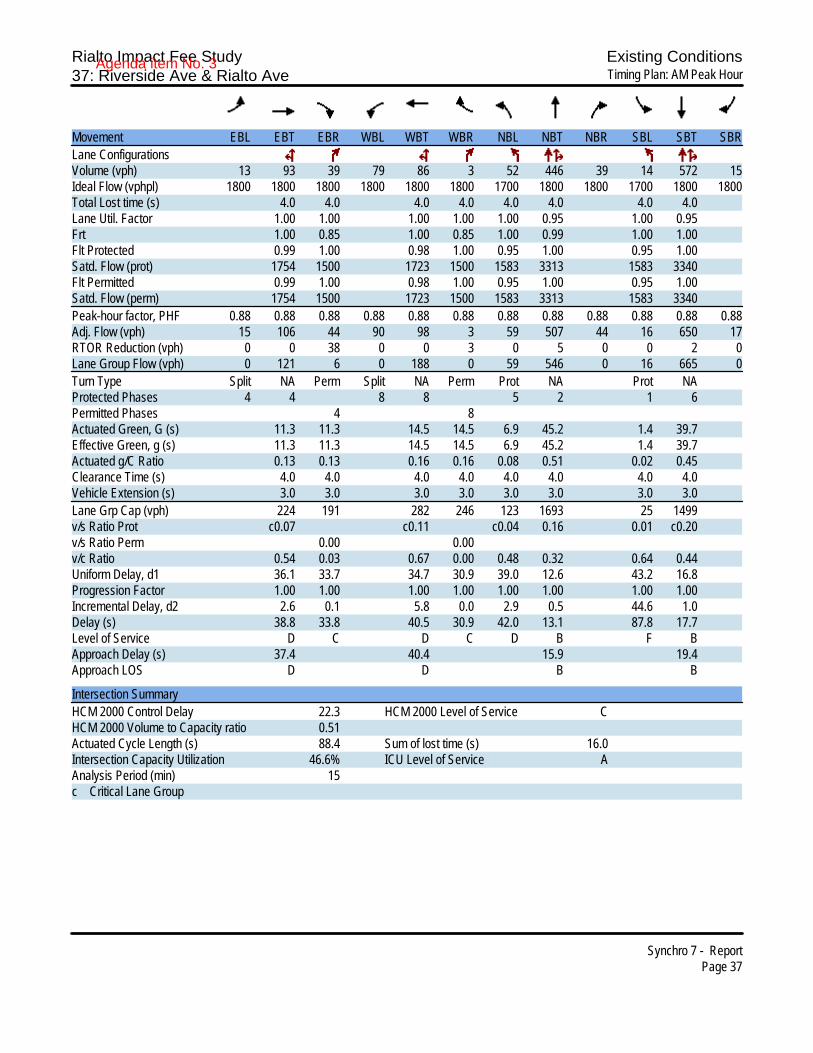
Rialto Impact Fee Study Existing Conditions37: Riverside Ave & Rialto Ave Timing Plan: AM Peak Hour
Synchro 7 - ReportPage 37
Movement EBL EBT EBR WBL WBT WBR NBL NBT NBR SBL SBT SBRLane ConfigurationsVolume (vph) 13 93 39 79 86 3 52 446 39 14 572 15Ideal Flow (vphpl) 1800 1800 1800 1800 1800 1800 1700 1800 1800 1700 1800 1800Total Lost time (s) 4.0 4.0 4.0 4.0 4.0 4.0 4.0 4.0Lane Util. Factor 1.00 1.00 1.00 1.00 1.00 0.95 1.00 0.95Frt 1.00 0.85 1.00 0.85 1.00 0.99 1.00 1.00Flt Protected 0.99 1.00 0.98 1.00 0.95 1.00 0.95 1.00Satd. Flow (prot) 1754 1500 1723 1500 1583 3313 1583 3340Flt Permitted 0.99 1.00 0.98 1.00 0.95 1.00 0.95 1.00Satd. Flow (perm) 1754 1500 1723 1500 1583 3313 1583 3340Peak-hour factor, PHF 0.88 0.88 0.88 0.88 0.88 0.88 0.88 0.88 0.88 0.88 0.88 0.88Adj. Flow (vph) 15 106 44 90 98 3 59 507 44 16 650 17RTOR Reduction (vph) 0 0 38 0 0 3 0 5 0 0 2 0Lane Group Flow (vph) 0 121 6 0 188 0 59 546 0 16 665 0Turn Type Split NA Perm Split NA Perm Prot NA Prot NAProtected Phases 4 4 8 8 5 2 1 6Permitted Phases 4 8Actuated Green, G (s) 11.3 11.3 14.5 14.5 6.9 45.2 1.4 39.7Effective Green, g (s) 11.3 11.3 14.5 14.5 6.9 45.2 1.4 39.7Actuated g/C Ratio 0.13 0.13 0.16 0.16 0.08 0.51 0.02 0.45Clearance Time (s) 4.0 4.0 4.0 4.0 4.0 4.0 4.0 4.0Vehicle Extension (s) 3.0 3.0 3.0 3.0 3.0 3.0 3.0 3.0Lane Grp Cap (vph) 224 191 282 246 123 1693 25 1499v/s Ratio Prot c0.07 c0.11 c0.04 0.16 0.01 c0.20v/s Ratio Perm 0.00 0.00v/c Ratio 0.54 0.03 0.67 0.00 0.48 0.32 0.64 0.44Uniform Delay, d1 36.1 33.7 34.7 30.9 39.0 12.6 43.2 16.8Progression Factor 1.00 1.00 1.00 1.00 1.00 1.00 1.00 1.00Incremental Delay, d2 2.6 0.1 5.8 0.0 2.9 0.5 44.6 1.0Delay (s) 38.8 33.8 40.5 30.9 42.0 13.1 87.8 17.7Level of Service D C D C D B F BApproach Delay (s) 37.4 40.4 15.9 19.4Approach LOS D D B B
Intersection SummaryHCM 2000 Control Delay 22.3 HCM 2000 Level of Service CHCM 2000 Volume to Capacity ratio 0.51Actuated Cycle Length (s) 88.4 Sum of lost time (s) 16.0Intersection Capacity Utilization 46.6% ICU Level of Service AAnalysis Period (min) 15c Critical Lane Group
Agenda item No. 3
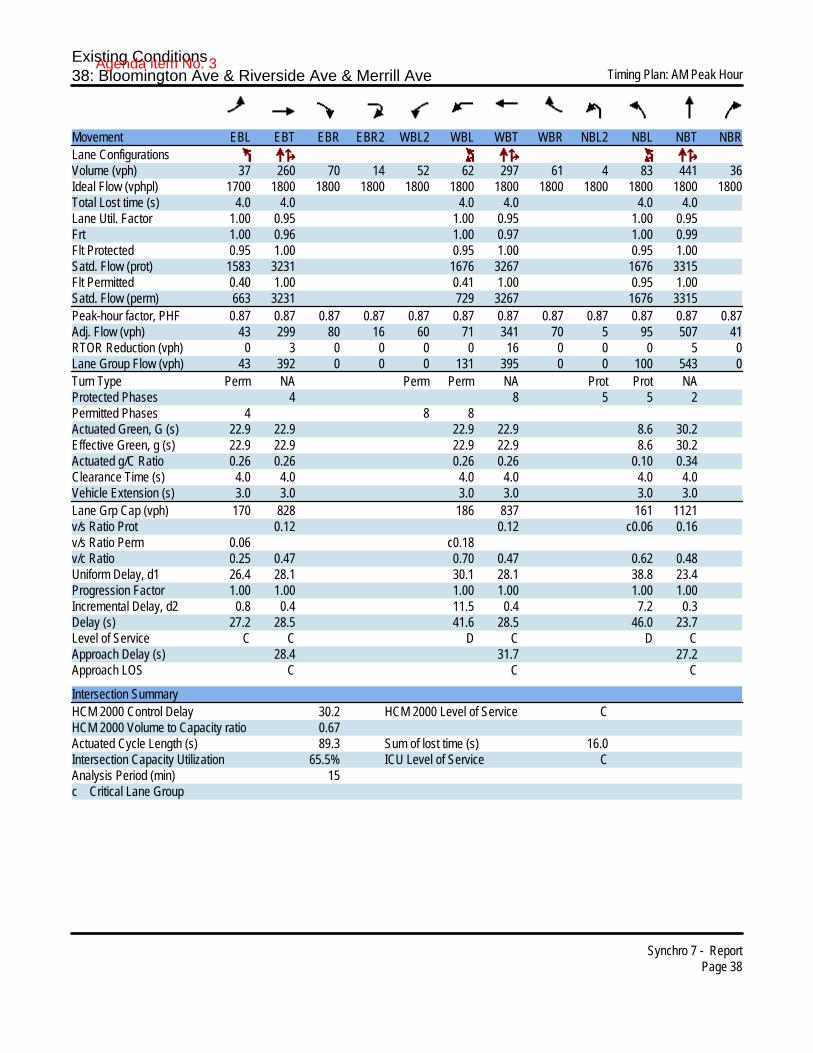
Existing Conditions38: Bloomington Ave & Riverside Ave & Merrill Ave Timing Plan: AM Peak Hour
Synchro 7 - ReportPage 38
Movement EBL EBT EBR EBR2 WBL2 WBL WBT WBR NBL2 NBL NBT NBRLane ConfigurationsVolume (vph) 37 260 70 14 52 62 297 61 4 83 441 36Ideal Flow (vphpl) 1700 1800 1800 1800 1800 1800 1800 1800 1800 1800 1800 1800Total Lost time (s) 4.0 4.0 4.0 4.0 4.0 4.0Lane Util. Factor 1.00 0.95 1.00 0.95 1.00 0.95Frt 1.00 0.96 1.00 0.97 1.00 0.99Flt Protected 0.95 1.00 0.95 1.00 0.95 1.00Satd. Flow (prot) 1583 3231 1676 3267 1676 3315Flt Permitted 0.40 1.00 0.41 1.00 0.95 1.00Satd. Flow (perm) 663 3231 729 3267 1676 3315Peak-hour factor, PHF 0.87 0.87 0.87 0.87 0.87 0.87 0.87 0.87 0.87 0.87 0.87 0.87Adj. Flow (vph) 43 299 80 16 60 71 341 70 5 95 507 41RTOR Reduction (vph) 0 3 0 0 0 0 16 0 0 0 5 0Lane Group Flow (vph) 43 392 0 0 0 131 395 0 0 100 543 0Turn Type Perm NA Perm Perm NA Prot Prot NAProtected Phases 4 8 5 5 2Permitted Phases 4 8 8Actuated Green, G (s) 22.9 22.9 22.9 22.9 8.6 30.2Effective Green, g (s) 22.9 22.9 22.9 22.9 8.6 30.2Actuated g/C Ratio 0.26 0.26 0.26 0.26 0.10 0.34Clearance Time (s) 4.0 4.0 4.0 4.0 4.0 4.0Vehicle Extension (s) 3.0 3.0 3.0 3.0 3.0 3.0Lane Grp Cap (vph) 170 828 186 837 161 1121v/s Ratio Prot 0.12 0.12 c0.06 0.16v/s Ratio Perm 0.06 c0.18v/c Ratio 0.25 0.47 0.70 0.47 0.62 0.48Uniform Delay, d1 26.4 28.1 30.1 28.1 38.8 23.4Progression Factor 1.00 1.00 1.00 1.00 1.00 1.00Incremental Delay, d2 0.8 0.4 11.5 0.4 7.2 0.3Delay (s) 27.2 28.5 41.6 28.5 46.0 23.7Level of Service C C D C D CApproach Delay (s) 28.4 31.7 27.2Approach LOS C C C
Intersection SummaryHCM 2000 Control Delay 30.2 HCM 2000 Level of Service CHCM 2000 Volume to Capacity ratio 0.67Actuated Cycle Length (s) 89.3 Sum of lost time (s) 16.0Intersection Capacity Utilization 65.5% ICU Level of Service CAnalysis Period (min) 15c Critical Lane Group
Agenda item No. 3
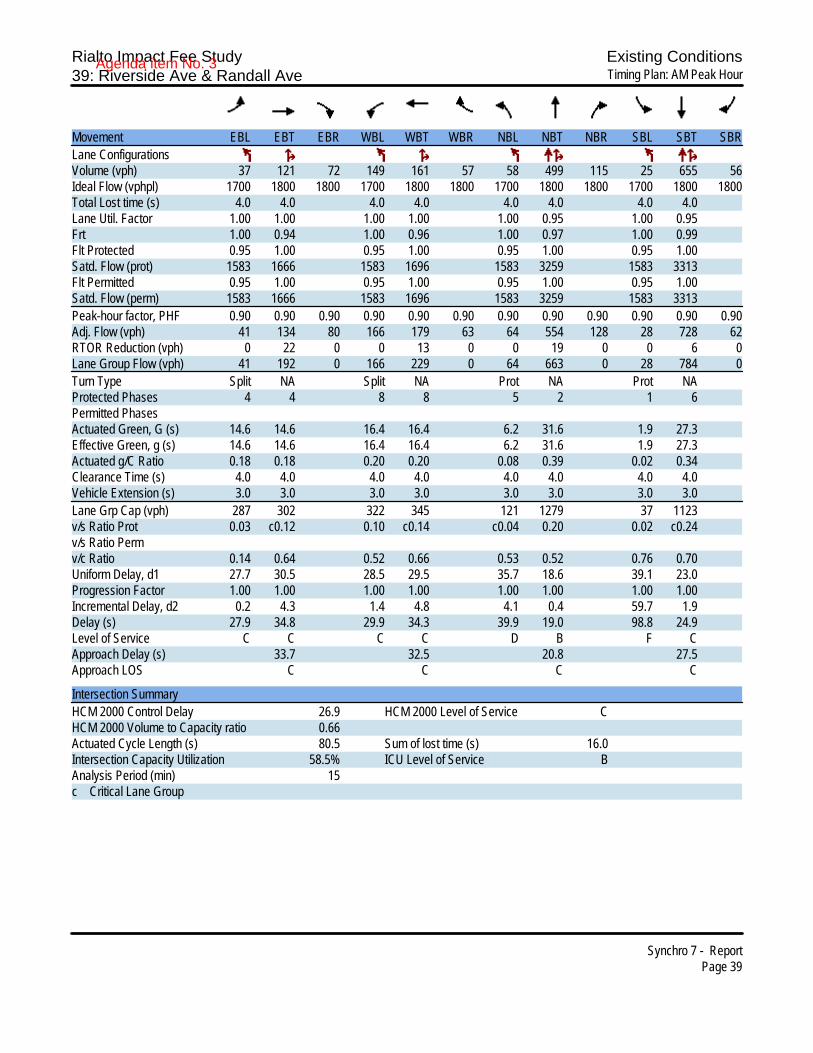
Rialto Impact Fee Study Existing Conditions39: Riverside Ave & Randall Ave Timing Plan: AM Peak Hour
Synchro 7 - ReportPage 39
Movement EBL EBT EBR WBL WBT WBR NBL NBT NBR SBL SBT SBRLane ConfigurationsVolume (vph) 37 121 72 149 161 57 58 499 115 25 655 56Ideal Flow (vphpl) 1700 1800 1800 1700 1800 1800 1700 1800 1800 1700 1800 1800Total Lost time (s) 4.0 4.0 4.0 4.0 4.0 4.0 4.0 4.0Lane Util. Factor 1.00 1.00 1.00 1.00 1.00 0.95 1.00 0.95Frt 1.00 0.94 1.00 0.96 1.00 0.97 1.00 0.99Flt Protected 0.95 1.00 0.95 1.00 0.95 1.00 0.95 1.00Satd. Flow (prot) 1583 1666 1583 1696 1583 3259 1583 3313Flt Permitted 0.95 1.00 0.95 1.00 0.95 1.00 0.95 1.00Satd. Flow (perm) 1583 1666 1583 1696 1583 3259 1583 3313Peak-hour factor, PHF 0.90 0.90 0.90 0.90 0.90 0.90 0.90 0.90 0.90 0.90 0.90 0.90Adj. Flow (vph) 41 134 80 166 179 63 64 554 128 28 728 62RTOR Reduction (vph) 0 22 0 0 13 0 0 19 0 0 6 0Lane Group Flow (vph) 41 192 0 166 229 0 64 663 0 28 784 0Turn Type Split NA Split NA Prot NA Prot NAProtected Phases 4 4 8 8 5 2 1 6Permitted PhasesActuated Green, G (s) 14.6 14.6 16.4 16.4 6.2 31.6 1.9 27.3Effective Green, g (s) 14.6 14.6 16.4 16.4 6.2 31.6 1.9 27.3Actuated g/C Ratio 0.18 0.18 0.20 0.20 0.08 0.39 0.02 0.34Clearance Time (s) 4.0 4.0 4.0 4.0 4.0 4.0 4.0 4.0Vehicle Extension (s) 3.0 3.0 3.0 3.0 3.0 3.0 3.0 3.0Lane Grp Cap (vph) 287 302 322 345 121 1279 37 1123v/s Ratio Prot 0.03 c0.12 0.10 c0.14 c0.04 0.20 0.02 c0.24v/s Ratio Permv/c Ratio 0.14 0.64 0.52 0.66 0.53 0.52 0.76 0.70Uniform Delay, d1 27.7 30.5 28.5 29.5 35.7 18.6 39.1 23.0Progression Factor 1.00 1.00 1.00 1.00 1.00 1.00 1.00 1.00Incremental Delay, d2 0.2 4.3 1.4 4.8 4.1 0.4 59.7 1.9Delay (s) 27.9 34.8 29.9 34.3 39.9 19.0 98.8 24.9Level of Service C C C C D B F CApproach Delay (s) 33.7 32.5 20.8 27.5Approach LOS C C C C
Intersection SummaryHCM 2000 Control Delay 26.9 HCM 2000 Level of Service CHCM 2000 Volume to Capacity ratio 0.66Actuated Cycle Length (s) 80.5 Sum of lost time (s) 16.0Intersection Capacity Utilization 58.5% ICU Level of Service BAnalysis Period (min) 15c Critical Lane Group
Agenda item No. 3

Rialto Impact Fee Study Existing Conditions40: Riverside Ave & San Bernardinio Ave Timing Plan: AM Peak Hour
Synchro 7 - ReportPage 40
Movement EBL EBT EBR WBL WBT WBR NBL NBT NBR SBL SBT SBRLane ConfigurationsVolume (vph) 29 141 152 225 121 77 65 441 104 77 659 51Ideal Flow (vphpl) 1700 1800 1800 1700 1800 1800 1700 1800 1800 1700 1800 1800Total Lost time (s) 4.0 4.0 4.0 4.0 4.0 4.0 4.0 4.0 4.0Lane Util. Factor 1.00 1.00 1.00 1.00 1.00 1.00 0.95 1.00 0.95Frt 1.00 0.92 1.00 1.00 0.85 1.00 0.97 1.00 0.99Flt Protected 0.95 1.00 0.95 1.00 1.00 0.95 1.00 0.95 1.00Satd. Flow (prot) 1583 1628 1583 1765 1500 1583 3257 1583 3317Flt Permitted 0.95 1.00 0.95 1.00 1.00 0.95 1.00 0.95 1.00Satd. Flow (perm) 1583 1628 1583 1765 1500 1583 3257 1583 3317Peak-hour factor, PHF 0.96 0.96 0.96 0.96 0.96 0.96 0.96 0.96 0.96 0.96 0.96 0.96Adj. Flow (vph) 30 147 158 234 126 80 68 459 108 80 686 53RTOR Reduction (vph) 0 38 0 0 0 47 0 20 0 0 6 0Lane Group Flow (vph) 30 267 0 234 126 33 68 547 0 80 733 0Turn Type Prot NA Prot NA Perm Prot NA Prot NAProtected Phases 7 4 3 8 5 2 1 6Permitted Phases 8Actuated Green, G (s) 3.1 20.7 17.2 34.8 34.8 5.7 23.1 7.1 24.5Effective Green, g (s) 3.1 20.7 17.2 34.8 34.8 5.7 23.1 7.1 24.5Actuated g/C Ratio 0.04 0.25 0.20 0.41 0.41 0.07 0.27 0.08 0.29Clearance Time (s) 4.0 4.0 4.0 4.0 4.0 4.0 4.0 4.0 4.0Vehicle Extension (s) 3.0 3.0 3.0 3.0 3.0 3.0 3.0 3.0 3.0Lane Grp Cap (vph) 58 400 323 730 620 107 894 133 966v/s Ratio Prot 0.02 c0.16 c0.15 0.07 0.04 0.17 c0.05 c0.22v/s Ratio Perm 0.02v/c Ratio 0.52 0.67 0.72 0.17 0.05 0.64 0.61 0.60 0.76Uniform Delay, d1 39.8 28.6 31.2 15.6 14.8 38.2 26.6 37.1 27.1Progression Factor 1.00 1.00 1.00 1.00 1.00 1.00 1.00 1.00 1.00Incremental Delay, d2 7.6 4.2 7.8 0.1 0.0 11.7 1.2 7.5 3.5Delay (s) 47.3 32.7 39.1 15.7 14.8 49.9 27.8 44.6 30.6Level of Service D C D B B D C D CApproach Delay (s) 34.1 28.0 30.2 32.0Approach LOS C C C C
Intersection SummaryHCM 2000 Control Delay 31.0 HCM 2000 Level of Service CHCM 2000 Volume to Capacity ratio 0.72Actuated Cycle Length (s) 84.1 Sum of lost time (s) 16.0Intersection Capacity Utilization 69.9% ICU Level of Service CAnalysis Period (min) 15c Critical Lane Group
Agenda item No. 3
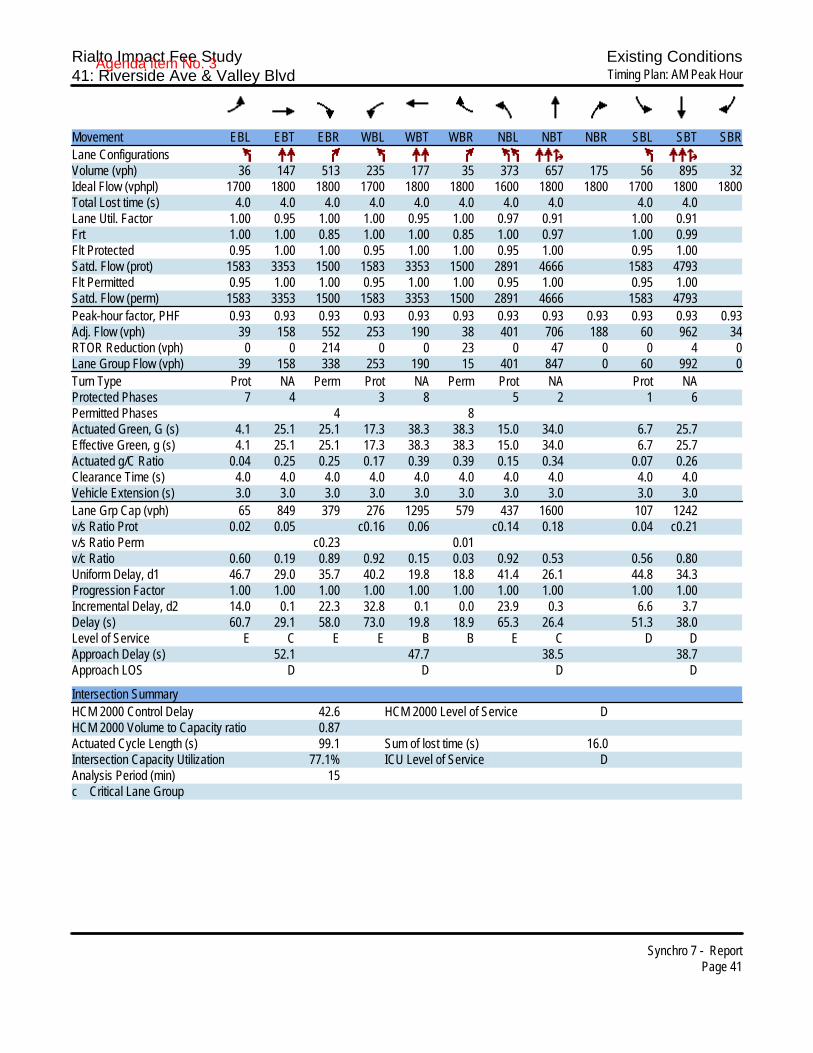
Rialto Impact Fee Study Existing Conditions41: Riverside Ave & Valley Blvd Timing Plan: AM Peak Hour
Synchro 7 - ReportPage 41
Movement EBL EBT EBR WBL WBT WBR NBL NBT NBR SBL SBT SBRLane ConfigurationsVolume (vph) 36 147 513 235 177 35 373 657 175 56 895 32Ideal Flow (vphpl) 1700 1800 1800 1700 1800 1800 1600 1800 1800 1700 1800 1800Total Lost time (s) 4.0 4.0 4.0 4.0 4.0 4.0 4.0 4.0 4.0 4.0Lane Util. Factor 1.00 0.95 1.00 1.00 0.95 1.00 0.97 0.91 1.00 0.91Frt 1.00 1.00 0.85 1.00 1.00 0.85 1.00 0.97 1.00 0.99Flt Protected 0.95 1.00 1.00 0.95 1.00 1.00 0.95 1.00 0.95 1.00Satd. Flow (prot) 1583 3353 1500 1583 3353 1500 2891 4666 1583 4793Flt Permitted 0.95 1.00 1.00 0.95 1.00 1.00 0.95 1.00 0.95 1.00Satd. Flow (perm) 1583 3353 1500 1583 3353 1500 2891 4666 1583 4793Peak-hour factor, PHF 0.93 0.93 0.93 0.93 0.93 0.93 0.93 0.93 0.93 0.93 0.93 0.93Adj. Flow (vph) 39 158 552 253 190 38 401 706 188 60 962 34RTOR Reduction (vph) 0 0 214 0 0 23 0 47 0 0 4 0Lane Group Flow (vph) 39 158 338 253 190 15 401 847 0 60 992 0Turn Type Prot NA Perm Prot NA Perm Prot NA Prot NAProtected Phases 7 4 3 8 5 2 1 6Permitted Phases 4 8Actuated Green, G (s) 4.1 25.1 25.1 17.3 38.3 38.3 15.0 34.0 6.7 25.7Effective Green, g (s) 4.1 25.1 25.1 17.3 38.3 38.3 15.0 34.0 6.7 25.7Actuated g/C Ratio 0.04 0.25 0.25 0.17 0.39 0.39 0.15 0.34 0.07 0.26Clearance Time (s) 4.0 4.0 4.0 4.0 4.0 4.0 4.0 4.0 4.0 4.0Vehicle Extension (s) 3.0 3.0 3.0 3.0 3.0 3.0 3.0 3.0 3.0 3.0Lane Grp Cap (vph) 65 849 379 276 1295 579 437 1600 107 1242v/s Ratio Prot 0.02 0.05 c0.16 0.06 c0.14 0.18 0.04 c0.21v/s Ratio Perm c0.23 0.01v/c Ratio 0.60 0.19 0.89 0.92 0.15 0.03 0.92 0.53 0.56 0.80Uniform Delay, d1 46.7 29.0 35.7 40.2 19.8 18.8 41.4 26.1 44.8 34.3Progression Factor 1.00 1.00 1.00 1.00 1.00 1.00 1.00 1.00 1.00 1.00Incremental Delay, d2 14.0 0.1 22.3 32.8 0.1 0.0 23.9 0.3 6.6 3.7Delay (s) 60.7 29.1 58.0 73.0 19.8 18.9 65.3 26.4 51.3 38.0Level of Service E C E E B B E C D DApproach Delay (s) 52.1 47.7 38.5 38.7Approach LOS D D D D
Intersection SummaryHCM 2000 Control Delay 42.6 HCM 2000 Level of Service DHCM 2000 Volume to Capacity ratio 0.87Actuated Cycle Length (s) 99.1 Sum of lost time (s) 16.0Intersection Capacity Utilization 77.1% ICU Level of Service DAnalysis Period (min) 15c Critical Lane Group
Agenda item No. 3

Rialto Impact Fee Study Existing Conditions42: Riverside Ave & I-10 WB Ramps Timing Plan: AM Peak Hour
Synchro 7 - ReportPage 42
Movement EBL EBT EBR WBL WBT WBR NBL NBT NBR SBL SBT SBRLane ConfigurationsVolume (vph) 0 0 0 399 2 390 187 815 0 0 1078 565Ideal Flow (vphpl) 1800 1800 1800 1700 1800 1800 1600 1800 1800 1800 1800 1800Total Lost time (s) 4.0 4.0 4.0 4.0 4.0 4.0 4.0Lane Util. Factor 0.95 0.91 0.95 0.97 0.91 0.86 1.00Frt 1.00 0.92 0.85 1.00 1.00 1.00 0.85Flt Protected 0.95 0.98 1.00 0.95 1.00 1.00 1.00Satd. Flow (prot) 1504 1445 1425 2891 4818 6071 1500Flt Permitted 0.95 0.98 1.00 0.95 1.00 1.00 1.00Satd. Flow (perm) 1504 1445 1425 2891 4818 6071 1500Peak-hour factor, PHF 0.92 0.92 0.92 0.92 0.92 0.92 0.92 0.92 0.92 0.92 0.92 0.92Adj. Flow (vph) 0 0 0 434 2 424 203 886 0 0 1172 614RTOR Reduction (vph) 0 0 0 0 43 107 0 0 0 0 0 349Lane Group Flow (vph) 0 0 0 299 247 164 203 886 0 0 1172 265Turn Type Perm NA Perm Prot NA NA PermProtected Phases 8 5 2 6Permitted Phases 8 8 6Actuated Green, G (s) 23.5 23.5 23.5 10.6 49.5 34.9 34.9Effective Green, g (s) 23.5 23.5 23.5 10.6 49.5 34.9 34.9Actuated g/C Ratio 0.29 0.29 0.29 0.13 0.61 0.43 0.43Clearance Time (s) 4.0 4.0 4.0 4.0 4.0 4.0 4.0Vehicle Extension (s) 3.0 3.0 3.0 3.0 3.0 3.0 3.0Lane Grp Cap (vph) 436 419 413 378 2944 2615 646v/s Ratio Prot c0.07 0.18 c0.19v/s Ratio Perm c0.20 0.17 0.11 0.18v/c Ratio 0.69 0.59 0.40 0.54 0.30 0.45 0.41Uniform Delay, d1 25.5 24.6 23.1 32.9 7.5 16.3 15.9Progression Factor 1.00 1.00 1.00 1.00 1.00 1.00 1.00Incremental Delay, d2 4.4 2.2 0.6 1.5 0.1 0.1 0.4Delay (s) 29.9 26.9 23.7 34.4 7.6 16.4 16.4Level of Service C C C C A B BApproach Delay (s) 0.0 26.9 12.6 16.4Approach LOS A C B B
Intersection SummaryHCM 2000 Control Delay 17.7 HCM 2000 Level of Service BHCM 2000 Volume to Capacity ratio 0.54Actuated Cycle Length (s) 81.0 Sum of lost time (s) 12.0Intersection Capacity Utilization 69.2% ICU Level of Service CAnalysis Period (min) 15c Critical Lane Group
Agenda item No. 3
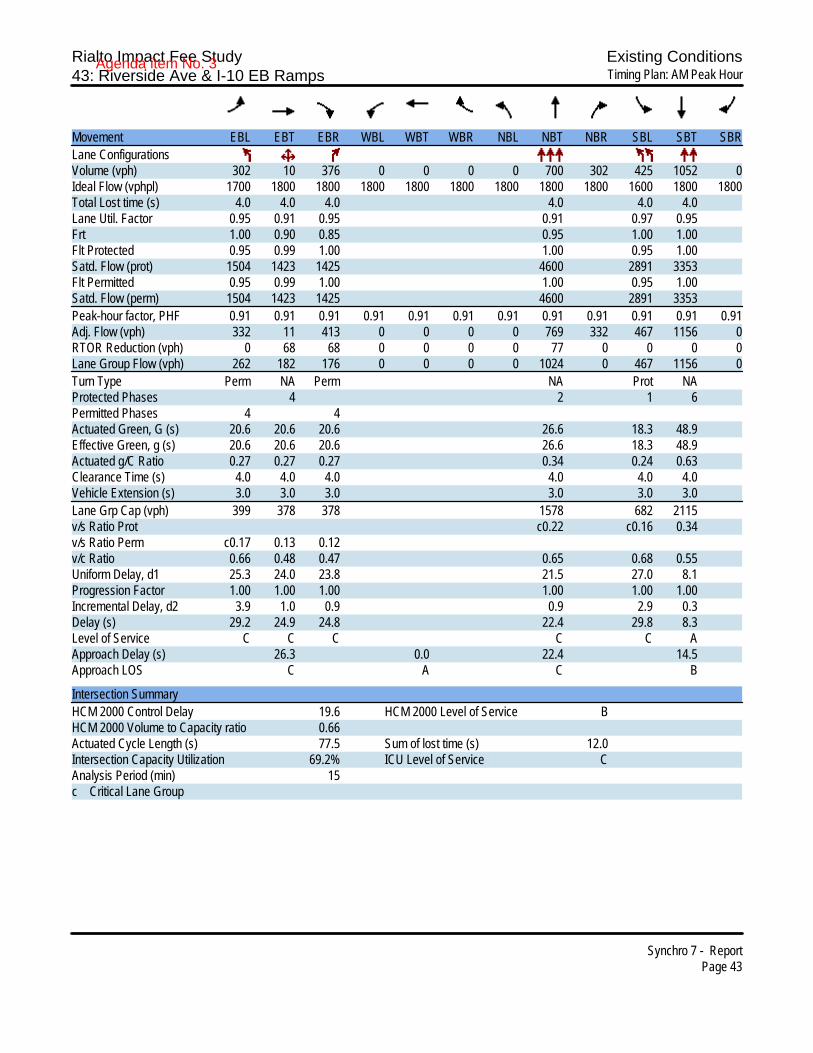
Rialto Impact Fee Study Existing Conditions43: Riverside Ave & I-10 EB Ramps Timing Plan: AM Peak Hour
Synchro 7 - ReportPage 43
Movement EBL EBT EBR WBL WBT WBR NBL NBT NBR SBL SBT SBRLane ConfigurationsVolume (vph) 302 10 376 0 0 0 0 700 302 425 1052 0Ideal Flow (vphpl) 1700 1800 1800 1800 1800 1800 1800 1800 1800 1600 1800 1800Total Lost time (s) 4.0 4.0 4.0 4.0 4.0 4.0Lane Util. Factor 0.95 0.91 0.95 0.91 0.97 0.95Frt 1.00 0.90 0.85 0.95 1.00 1.00Flt Protected 0.95 0.99 1.00 1.00 0.95 1.00Satd. Flow (prot) 1504 1423 1425 4600 2891 3353Flt Permitted 0.95 0.99 1.00 1.00 0.95 1.00Satd. Flow (perm) 1504 1423 1425 4600 2891 3353Peak-hour factor, PHF 0.91 0.91 0.91 0.91 0.91 0.91 0.91 0.91 0.91 0.91 0.91 0.91Adj. Flow (vph) 332 11 413 0 0 0 0 769 332 467 1156 0RTOR Reduction (vph) 0 68 68 0 0 0 0 77 0 0 0 0Lane Group Flow (vph) 262 182 176 0 0 0 0 1024 0 467 1156 0Turn Type Perm NA Perm NA Prot NAProtected Phases 4 2 1 6Permitted Phases 4 4Actuated Green, G (s) 20.6 20.6 20.6 26.6 18.3 48.9Effective Green, g (s) 20.6 20.6 20.6 26.6 18.3 48.9Actuated g/C Ratio 0.27 0.27 0.27 0.34 0.24 0.63Clearance Time (s) 4.0 4.0 4.0 4.0 4.0 4.0Vehicle Extension (s) 3.0 3.0 3.0 3.0 3.0 3.0Lane Grp Cap (vph) 399 378 378 1578 682 2115v/s Ratio Prot c0.22 c0.16 0.34v/s Ratio Perm c0.17 0.13 0.12v/c Ratio 0.66 0.48 0.47 0.65 0.68 0.55Uniform Delay, d1 25.3 24.0 23.8 21.5 27.0 8.1Progression Factor 1.00 1.00 1.00 1.00 1.00 1.00Incremental Delay, d2 3.9 1.0 0.9 0.9 2.9 0.3Delay (s) 29.2 24.9 24.8 22.4 29.8 8.3Level of Service C C C C C AApproach Delay (s) 26.3 0.0 22.4 14.5Approach LOS C A C B
Intersection SummaryHCM 2000 Control Delay 19.6 HCM 2000 Level of Service BHCM 2000 Volume to Capacity ratio 0.66Actuated Cycle Length (s) 77.5 Sum of lost time (s) 12.0Intersection Capacity Utilization 69.2% ICU Level of Service CAnalysis Period (min) 15c Critical Lane Group
Agenda item No. 3

Rialto Impact Fee Study Existing Conditions44: Riverside Ave & Slover Ave Timing Plan: AM Peak Hour
Synchro 7 - ReportPage 44
Movement EBL EBT EBR WBL WBT WBR NBL NBT NBR SBL SBT SBRLane ConfigurationsVolume (vph) 211 20 40 22 10 14 61 869 9 23 1255 245Ideal Flow (vphpl) 1700 1800 1800 1700 1800 1800 1700 1800 1800 1700 1800 1800Total Lost time (s) 4.0 4.0 4.0 4.0 4.0 4.0 4.0 4.0Lane Util. Factor 1.00 0.95 1.00 0.95 1.00 0.95 1.00 0.95Frt 1.00 0.90 1.00 0.91 1.00 1.00 1.00 0.98Flt Protected 0.95 1.00 0.95 1.00 0.95 1.00 0.95 1.00Satd. Flow (prot) 1583 3015 1583 3055 1583 3348 1583 3271Flt Permitted 0.74 1.00 0.71 1.00 0.95 1.00 0.95 1.00Satd. Flow (perm) 1231 3015 1185 3055 1583 3348 1583 3271Peak-hour factor, PHF 0.89 0.89 0.89 0.89 0.89 0.89 0.89 0.89 0.89 0.89 0.89 0.89Adj. Flow (vph) 237 22 45 25 11 16 69 976 10 26 1410 275RTOR Reduction (vph) 0 35 0 0 12 0 0 1 0 0 15 0Lane Group Flow (vph) 237 32 0 25 15 0 69 985 0 26 1670 0Turn Type Perm NA Perm NA Prot NA Prot NAProtected Phases 4 8 5 2 1 6Permitted Phases 4 8Actuated Green, G (s) 22.7 22.7 22.7 22.7 5.1 59.5 3.2 57.6Effective Green, g (s) 22.7 22.7 22.7 22.7 5.1 59.5 3.2 57.6Actuated g/C Ratio 0.23 0.23 0.23 0.23 0.05 0.61 0.03 0.59Clearance Time (s) 4.0 4.0 4.0 4.0 4.0 4.0 4.0 4.0Vehicle Extension (s) 3.0 3.0 3.0 3.0 3.0 3.0 3.0 3.0Lane Grp Cap (vph) 286 702 276 711 82 2045 52 1934v/s Ratio Prot 0.01 0.00 c0.04 0.29 0.02 c0.51v/s Ratio Perm c0.19 0.02v/c Ratio 0.83 0.05 0.09 0.02 0.84 0.48 0.50 0.86Uniform Delay, d1 35.5 29.0 29.3 28.8 45.7 10.4 46.3 16.6Progression Factor 1.00 1.00 1.00 1.00 1.00 1.00 1.00 1.00Incremental Delay, d2 17.6 0.0 0.1 0.0 50.7 0.2 7.4 4.3Delay (s) 53.1 29.0 29.4 28.8 96.4 10.6 53.7 20.9Level of Service D C C C F B D CApproach Delay (s) 47.8 29.1 16.2 21.4Approach LOS D C B C
Intersection SummaryHCM 2000 Control Delay 22.4 HCM 2000 Level of Service CHCM 2000 Volume to Capacity ratio 0.85Actuated Cycle Length (s) 97.4 Sum of lost time (s) 12.0Intersection Capacity Utilization 78.4% ICU Level of Service DAnalysis Period (min) 15c Critical Lane Group
Agenda item No. 3

Rialto Impact Fee Study Existing Conditions45: Riverside Ave & Jurupa Ave Timing Plan: AM Peak Hour
Synchro 7 - ReportPage 45
Movement EBL EBR NBL NBT SBT SBRLane ConfigurationsVolume (vph) 40 84 71 846 1074 46Ideal Flow (vphpl) 1700 1800 1700 1800 1800 1800Total Lost time (s) 4.0 4.0 4.0 4.0 4.0Lane Util. Factor 1.00 1.00 1.00 0.91 0.95Frt 1.00 0.85 1.00 1.00 0.99Flt Protected 0.95 1.00 0.95 1.00 1.00Satd. Flow (prot) 1583 1500 1583 4818 3332Flt Permitted 0.95 1.00 0.95 1.00 1.00Satd. Flow (perm) 1583 1500 1583 4818 3332Peak-hour factor, PHF 0.94 0.94 0.94 0.94 0.94 0.94Adj. Flow (vph) 43 89 76 900 1143 49RTOR Reduction (vph) 0 80 0 0 3 0Lane Group Flow (vph) 43 9 76 900 1189 0Turn Type Prot Perm Prot NA NAProtected Phases 4 5 2 6Permitted Phases 4Actuated Green, G (s) 5.6 5.6 4.6 39.7 31.1Effective Green, g (s) 5.6 5.6 4.6 39.7 31.1Actuated g/C Ratio 0.11 0.11 0.09 0.74 0.58Clearance Time (s) 4.0 4.0 4.0 4.0 4.0Vehicle Extension (s) 3.0 3.0 3.0 3.0 3.0Lane Grp Cap (vph) 166 157 136 3588 1944v/s Ratio Prot c0.03 c0.05 0.19 c0.36v/s Ratio Perm 0.01v/c Ratio 0.26 0.06 0.56 0.25 0.61Uniform Delay, d1 21.9 21.5 23.4 2.1 7.2Progression Factor 1.00 1.00 1.00 1.00 1.00Incremental Delay, d2 0.8 0.2 4.9 0.0 0.6Delay (s) 22.8 21.6 28.3 2.2 7.8Level of Service C C C A AApproach Delay (s) 22.0 4.2 7.8Approach LOS C A A
Intersection SummaryHCM 2000 Control Delay 7.1 HCM 2000 Level of Service AHCM 2000 Volume to Capacity ratio 0.56Actuated Cycle Length (s) 53.3 Sum of lost time (s) 12.0Intersection Capacity Utilization 50.6% ICU Level of Service AAnalysis Period (min) 15c Critical Lane Group
Agenda item No. 3
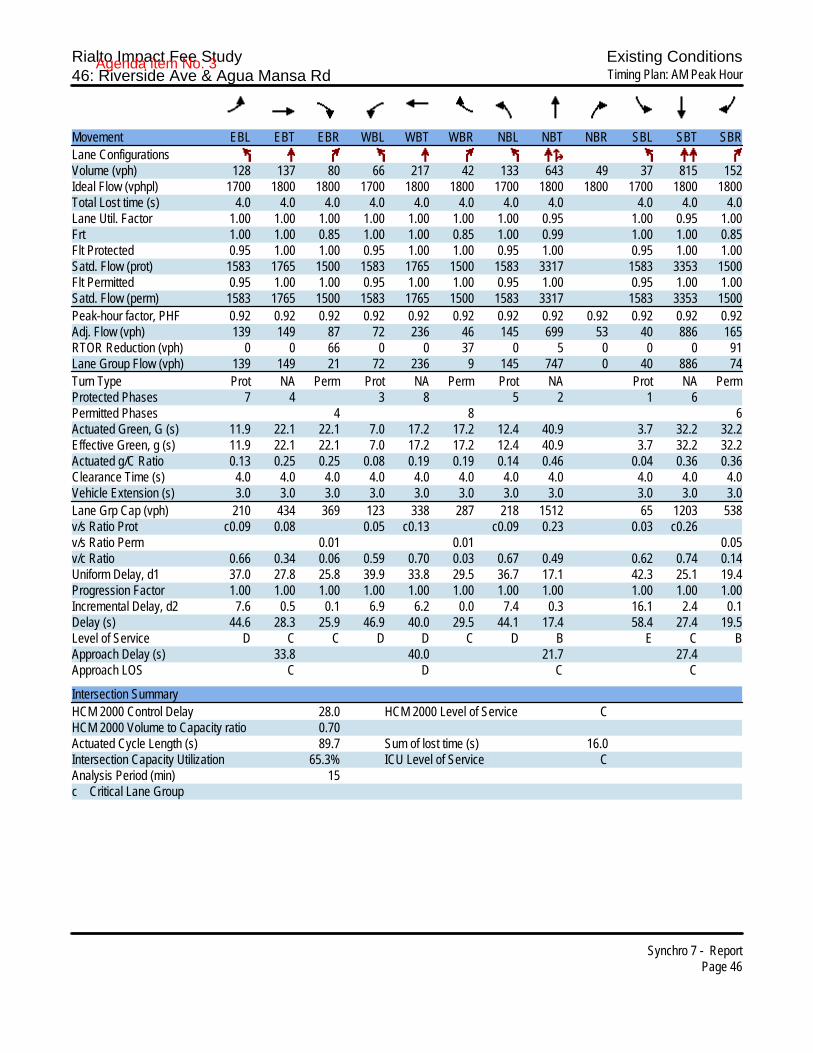
Rialto Impact Fee Study Existing Conditions46: Riverside Ave & Agua Mansa Rd Timing Plan: AM Peak Hour
Synchro 7 - ReportPage 46
Movement EBL EBT EBR WBL WBT WBR NBL NBT NBR SBL SBT SBRLane ConfigurationsVolume (vph) 128 137 80 66 217 42 133 643 49 37 815 152Ideal Flow (vphpl) 1700 1800 1800 1700 1800 1800 1700 1800 1800 1700 1800 1800Total Lost time (s) 4.0 4.0 4.0 4.0 4.0 4.0 4.0 4.0 4.0 4.0 4.0Lane Util. Factor 1.00 1.00 1.00 1.00 1.00 1.00 1.00 0.95 1.00 0.95 1.00Frt 1.00 1.00 0.85 1.00 1.00 0.85 1.00 0.99 1.00 1.00 0.85Flt Protected 0.95 1.00 1.00 0.95 1.00 1.00 0.95 1.00 0.95 1.00 1.00Satd. Flow (prot) 1583 1765 1500 1583 1765 1500 1583 3317 1583 3353 1500Flt Permitted 0.95 1.00 1.00 0.95 1.00 1.00 0.95 1.00 0.95 1.00 1.00Satd. Flow (perm) 1583 1765 1500 1583 1765 1500 1583 3317 1583 3353 1500Peak-hour factor, PHF 0.92 0.92 0.92 0.92 0.92 0.92 0.92 0.92 0.92 0.92 0.92 0.92Adj. Flow (vph) 139 149 87 72 236 46 145 699 53 40 886 165RTOR Reduction (vph) 0 0 66 0 0 37 0 5 0 0 0 91Lane Group Flow (vph) 139 149 21 72 236 9 145 747 0 40 886 74Turn Type Prot NA Perm Prot NA Perm Prot NA Prot NA PermProtected Phases 7 4 3 8 5 2 1 6Permitted Phases 4 8 6Actuated Green, G (s) 11.9 22.1 22.1 7.0 17.2 17.2 12.4 40.9 3.7 32.2 32.2Effective Green, g (s) 11.9 22.1 22.1 7.0 17.2 17.2 12.4 40.9 3.7 32.2 32.2Actuated g/C Ratio 0.13 0.25 0.25 0.08 0.19 0.19 0.14 0.46 0.04 0.36 0.36Clearance Time (s) 4.0 4.0 4.0 4.0 4.0 4.0 4.0 4.0 4.0 4.0 4.0Vehicle Extension (s) 3.0 3.0 3.0 3.0 3.0 3.0 3.0 3.0 3.0 3.0 3.0Lane Grp Cap (vph) 210 434 369 123 338 287 218 1512 65 1203 538v/s Ratio Prot c0.09 0.08 0.05 c0.13 c0.09 0.23 0.03 c0.26v/s Ratio Perm 0.01 0.01 0.05v/c Ratio 0.66 0.34 0.06 0.59 0.70 0.03 0.67 0.49 0.62 0.74 0.14Uniform Delay, d1 37.0 27.8 25.8 39.9 33.8 29.5 36.7 17.1 42.3 25.1 19.4Progression Factor 1.00 1.00 1.00 1.00 1.00 1.00 1.00 1.00 1.00 1.00 1.00Incremental Delay, d2 7.6 0.5 0.1 6.9 6.2 0.0 7.4 0.3 16.1 2.4 0.1Delay (s) 44.6 28.3 25.9 46.9 40.0 29.5 44.1 17.4 58.4 27.4 19.5Level of Service D C C D D C D B E C BApproach Delay (s) 33.8 40.0 21.7 27.4Approach LOS C D C C
Intersection SummaryHCM 2000 Control Delay 28.0 HCM 2000 Level of Service CHCM 2000 Volume to Capacity ratio 0.70Actuated Cycle Length (s) 89.7 Sum of lost time (s) 16.0Intersection Capacity Utilization 65.3% ICU Level of Service CAnalysis Period (min) 15c Critical Lane Group
Agenda item No. 3

Rialto Impact Fee Study Existing Conditions47: Acacia Ave & Base Line Rd Timing Plan: AM Peak Hour
Synchro 7 - ReportPage 47
Movement EBL EBT EBR WBL WBT WBR NBL NBT NBR SBL SBT SBRLane ConfigurationsVolume (vph) 8 278 18 11 315 10 14 41 10 23 32 24Ideal Flow (vphpl) 1700 1800 1800 1700 1800 1800 1800 1800 1800 1800 1800 1800Total Lost time (s) 4.0 4.0 4.0 4.0 4.0 4.0Lane Util. Factor 1.00 0.95 1.00 0.95 1.00 1.00Frt 1.00 0.99 1.00 1.00 0.98 0.96Flt Protected 0.95 1.00 0.95 1.00 0.99 0.99Satd. Flow (prot) 1583 3322 1583 3338 1709 1668Flt Permitted 0.56 1.00 0.56 1.00 1.00 1.00Satd. Flow (perm) 939 3322 939 3338 1728 1693Peak-hour factor, PHF 0.83 0.83 0.83 0.83 0.83 0.83 0.83 0.83 0.83 0.83 0.83 0.83Adj. Flow (vph) 10 335 22 13 380 12 17 49 12 28 39 29RTOR Reduction (vph) 0 6 0 0 2 0 0 10 0 0 24 0Lane Group Flow (vph) 10 351 0 13 390 0 0 68 0 0 72 0Turn Type Perm NA Perm NA Perm NA Perm NAProtected Phases 4 8 2 6Permitted Phases 4 8 2 6Actuated Green, G (s) 7.1 7.1 7.1 7.1 2.0 2.0Effective Green, g (s) 7.1 7.1 7.1 7.1 2.0 2.0Actuated g/C Ratio 0.42 0.42 0.42 0.42 0.12 0.12Clearance Time (s) 4.0 4.0 4.0 4.0 4.0 4.0Vehicle Extension (s) 3.0 3.0 3.0 3.0 3.0 3.0Lane Grp Cap (vph) 389 1379 389 1385 202 198v/s Ratio Prot 0.11 c0.12v/s Ratio Perm 0.01 0.01 0.04 c0.04v/c Ratio 0.03 0.25 0.03 0.28 0.34 0.36Uniform Delay, d1 3.0 3.3 3.0 3.3 6.9 7.0Progression Factor 1.00 1.00 1.00 1.00 1.00 1.00Incremental Delay, d2 0.0 0.1 0.0 0.1 1.0 1.1Delay (s) 3.0 3.4 3.0 3.4 7.9 8.1Level of Service A A A A A AApproach Delay (s) 3.4 3.4 7.9 8.1Approach LOS A A A A
Intersection SummaryHCM 2000 Control Delay 4.2 HCM 2000 Level of Service AHCM 2000 Volume to Capacity ratio 0.30Actuated Cycle Length (s) 17.1 Sum of lost time (s) 8.0Intersection Capacity Utilization 23.9% ICU Level of Service AAnalysis Period (min) 15c Critical Lane Group
Agenda item No. 3

Rialto Impact Fee Study Existing Conditions48: Acacia Ave & Foothill Blvd Timing Plan: AM Peak Hour
Synchro 7 - ReportPage 48
Movement EBL EBT EBR WBL WBT WBR NBL NBT NBR SBL SBT SBRLane ConfigurationsVolume (vph) 33 753 68 23 641 29 60 122 45 43 128 55Ideal Flow (vphpl) 1700 1800 1800 1700 1800 1800 1800 1800 1800 1800 1800 1800Total Lost time (s) 4.0 4.0 4.0 4.0 4.0 4.0Lane Util. Factor 1.00 0.91 1.00 0.95 1.00 1.00Frt 1.00 0.99 1.00 0.99 0.97 0.97Flt Protected 0.95 1.00 0.95 1.00 0.99 0.99Satd. Flow (prot) 1583 4758 1583 3331 1695 1691Flt Permitted 0.95 1.00 0.95 1.00 0.88 0.92Satd. Flow (perm) 1583 4758 1583 3331 1514 1562Peak-hour factor, PHF 0.89 0.89 0.89 0.89 0.89 0.89 0.89 0.89 0.89 0.89 0.89 0.89Adj. Flow (vph) 37 846 76 26 720 33 67 137 51 48 144 62RTOR Reduction (vph) 0 11 0 0 3 0 0 10 0 0 13 0Lane Group Flow (vph) 37 911 0 26 750 0 0 245 0 0 241 0Turn Type Prot NA Prot NA Perm NA Perm NAProtected Phases 7 4 3 8 2 6Permitted Phases 2 6Actuated Green, G (s) 2.3 19.8 2.1 19.6 15.2 15.2Effective Green, g (s) 2.3 19.8 2.1 19.6 15.2 15.2Actuated g/C Ratio 0.05 0.40 0.04 0.40 0.31 0.31Clearance Time (s) 4.0 4.0 4.0 4.0 4.0 4.0Vehicle Extension (s) 3.0 3.0 3.0 3.0 3.0 3.0Lane Grp Cap (vph) 74 1918 67 1329 468 483v/s Ratio Prot c0.02 0.19 0.02 c0.23v/s Ratio Perm c0.16 0.15v/c Ratio 0.50 0.48 0.39 0.56 0.52 0.50Uniform Delay, d1 22.8 10.8 22.9 11.4 14.0 13.8Progression Factor 1.00 1.00 1.00 1.00 1.00 1.00Incremental Delay, d2 5.2 0.2 3.7 0.6 1.1 0.8Delay (s) 28.1 11.0 26.6 12.0 15.0 14.7Level of Service C B C B B BApproach Delay (s) 11.7 12.5 15.0 14.7Approach LOS B B B B
Intersection SummaryHCM 2000 Control Delay 12.7 HCM 2000 Level of Service BHCM 2000 Volume to Capacity ratio 0.54Actuated Cycle Length (s) 49.1 Sum of lost time (s) 12.0Intersection Capacity Utilization 53.0% ICU Level of Service AAnalysis Period (min) 15c Critical Lane Group
Agenda item No. 3

Rialto Impact Fee Study Existing Conditions49: Pepper Ave & Base Line Rd Timing Plan: AM Peak Hour
Synchro 7 - ReportPage 49
Movement EBL EBT EBR WBL WBT WBR NBL NBT NBR SBL SBT SBRLane ConfigurationsVolume (vph) 12 289 186 90 343 41 181 84 51 30 81 16Ideal Flow (vphpl) 1700 1800 1800 1700 1800 1800 1700 1800 1800 1700 1800 1800Total Lost time (s) 4.0 4.0 4.0 4.0 4.0 4.0 4.0 4.0Lane Util. Factor 1.00 0.95 1.00 0.95 1.00 0.95 1.00 0.95Frt 1.00 0.94 1.00 0.98 1.00 0.94 1.00 0.98Flt Protected 0.95 1.00 0.95 1.00 0.95 1.00 0.95 1.00Satd. Flow (prot) 1583 3156 1583 3299 1583 3163 1583 3272Flt Permitted 0.40 1.00 0.30 1.00 0.69 1.00 0.66 1.00Satd. Flow (perm) 660 3156 502 3299 1143 3163 1099 3272Peak-hour factor, PHF 0.92 0.92 0.92 0.92 0.92 0.92 0.92 0.92 0.92 0.92 0.92 0.92Adj. Flow (vph) 13 314 202 98 373 45 197 91 55 33 88 17RTOR Reduction (vph) 0 145 0 0 13 0 0 19 0 0 6 0Lane Group Flow (vph) 13 371 0 98 405 0 197 127 0 33 99 0Turn Type Perm NA Perm NA Perm NA Perm NAProtected Phases 4 8 2 6Permitted Phases 4 8 2 6Actuated Green, G (s) 16.8 16.8 16.8 16.8 47.3 47.3 47.3 47.3Effective Green, g (s) 16.8 16.8 16.8 16.8 47.3 47.3 47.3 47.3Actuated g/C Ratio 0.23 0.23 0.23 0.23 0.66 0.66 0.66 0.66Clearance Time (s) 4.0 4.0 4.0 4.0 4.0 4.0 4.0 4.0Vehicle Extension (s) 3.0 3.0 3.0 3.0 3.0 3.0 3.0 3.0Lane Grp Cap (vph) 153 735 116 768 749 2075 720 2146v/s Ratio Prot 0.12 0.12 0.04 0.03v/s Ratio Perm 0.02 c0.20 c0.17 0.03v/c Ratio 0.08 0.50 0.84 0.53 0.26 0.06 0.05 0.05Uniform Delay, d1 21.6 24.0 26.4 24.2 5.2 4.4 4.4 4.4Progression Factor 1.00 1.00 1.00 1.00 1.00 1.00 1.00 1.00Incremental Delay, d2 0.2 0.5 40.0 0.7 0.9 0.1 0.1 0.0Delay (s) 21.9 24.6 66.4 24.8 6.0 4.5 4.5 4.4Level of Service C C E C A A A AApproach Delay (s) 24.5 32.7 5.4 4.5Approach LOS C C A A
Intersection SummaryHCM 2000 Control Delay 21.2 HCM 2000 Level of Service CHCM 2000 Volume to Capacity ratio 0.41Actuated Cycle Length (s) 72.1 Sum of lost time (s) 8.0Intersection Capacity Utilization 48.2% ICU Level of Service AAnalysis Period (min) 15c Critical Lane Group
Agenda item No. 3

Rialto Impact Fee Study Existing Conditions50: Pepper Ave & Foothill Blvd Timing Plan: AM Peak Hour
Synchro 7 - ReportPage 50
Movement EBL EBT EBR WBL WBT WBR NBL NBT NBR SBL SBT SBRLane ConfigurationsVolume (vph) 52 499 175 150 422 72 116 260 128 61 334 77Ideal Flow (vphpl) 1700 1800 1800 1700 1800 1800 1700 1800 1800 1700 1800 1800Total Lost time (s) 4.0 4.0 4.0 4.0 4.0 4.0 4.0 4.0 4.0Lane Util. Factor 1.00 0.95 1.00 1.00 0.95 1.00 0.95 1.00 0.95Frt 1.00 1.00 0.85 1.00 0.98 1.00 0.95 1.00 0.97Flt Protected 0.95 1.00 1.00 0.95 1.00 0.95 1.00 0.95 1.00Satd. Flow (prot) 1583 3353 1500 1583 3280 1583 3187 1583 3258Flt Permitted 0.95 1.00 1.00 0.95 1.00 0.46 1.00 0.47 1.00Satd. Flow (perm) 1583 3353 1500 1583 3280 762 3187 789 3258Peak-hour factor, PHF 0.93 0.93 0.93 0.93 0.93 0.93 0.93 0.93 0.93 0.93 0.93 0.93Adj. Flow (vph) 56 537 188 161 454 77 125 280 138 66 359 83RTOR Reduction (vph) 0 0 141 0 14 0 0 54 0 0 18 0Lane Group Flow (vph) 56 537 47 161 517 0 125 364 0 66 424 0Turn Type Prot NA Perm Prot NA Perm NA Perm NAProtected Phases 7 4 3 8 2 6Permitted Phases 4 2 6Actuated Green, G (s) 5.4 21.8 21.8 14.0 30.4 39.5 39.5 39.5 39.5Effective Green, g (s) 5.4 21.8 21.8 14.0 30.4 39.5 39.5 39.5 39.5Actuated g/C Ratio 0.06 0.25 0.25 0.16 0.35 0.45 0.45 0.45 0.45Clearance Time (s) 4.0 4.0 4.0 4.0 4.0 4.0 4.0 4.0 4.0Vehicle Extension (s) 3.0 3.0 3.0 3.0 3.0 3.0 3.0 3.0 3.0Lane Grp Cap (vph) 97 837 374 253 1142 344 1441 356 1474v/s Ratio Prot 0.04 c0.16 c0.10 0.16 0.11 0.13v/s Ratio Perm 0.03 c0.16 0.08v/c Ratio 0.58 0.64 0.13 0.64 0.45 0.36 0.25 0.19 0.29Uniform Delay, d1 39.8 29.3 25.4 34.3 22.0 15.7 14.8 14.3 15.0Progression Factor 1.00 1.00 1.00 1.00 1.00 1.00 1.00 1.00 1.00Incremental Delay, d2 8.1 1.7 0.2 5.2 0.3 3.0 0.4 1.1 0.5Delay (s) 47.9 31.0 25.5 39.4 22.3 18.6 15.2 15.4 15.5Level of Service D C C D C B B B BApproach Delay (s) 30.9 26.3 16.0 15.5Approach LOS C C B B
Intersection SummaryHCM 2000 Control Delay 23.3 HCM 2000 Level of Service CHCM 2000 Volume to Capacity ratio 0.49Actuated Cycle Length (s) 87.3 Sum of lost time (s) 12.0Intersection Capacity Utilization 56.7% ICU Level of Service BAnalysis Period (min) 15c Critical Lane Group
Agenda item No. 3

Rialto Impact Fee Study Existing Conditions1: Sierra Ave & I-15 NB Off Ramp/I-15 NB On Ramp Timing Plan: PM Peak Hour
Synchro 7 - ReportPage 1
Movement EBL EBT EBR WBL WBT WBR NBL NBT NBR SBL SBT SBRLane ConfigurationsSign Control Stop Stop Stop StopVolume (vph) 276 9 251 0 0 0 0 334 314 124 324 0Peak Hour Factor 0.97 0.97 0.97 0.97 0.97 0.97 0.97 0.97 0.97 0.97 0.97 0.97Hourly flow rate (vph) 285 9 259 0 0 0 0 344 324 128 334 0
Direction, Lane # EB 1 EB 2 NB 1 NB 2 SB 1 SB 2Volume Total (vph) 190 363 230 438 239 223Volume Left (vph) 190 95 0 0 128 0Volume Right (vph) 0 259 0 324 0 0Hadj (s) 0.53 -0.33 0.03 -0.48 0.30 0.03Departure Headway (s) 8.0 7.1 7.3 6.7 7.8 7.5Degree Utilization, x 0.42 0.71 0.46 0.82 0.52 0.46Capacity (veh/h) 437 491 473 524 440 464Control Delay (s) 15.4 24.7 15.2 32.3 17.6 15.7Approach Delay (s) 21.5 26.4 16.7Approach LOS C D C
Intersection SummaryDelay 22.1Level of Service CIntersection Capacity Utilization 60.1% ICU Level of Service BAnalysis Period (min) 15
Agenda item No. 3

Rialto Impact Fee Study Existing Conditions2: Sierra Ave & Riverside Ave Timing Plan: PM Peak Hour
Synchro 7 - ReportPage 2
Movement WBL WBR NBT NBR SBL SBTLane ConfigurationsSign Control Stop Stop StopVolume (vph) 85 281 386 146 392 224Peak Hour Factor 0.91 0.91 0.91 0.91 0.91 0.91Hourly flow rate (vph) 93 309 424 160 431 246
Direction, Lane # WB 1 WB 2 NB 1 NB 2 SB 1 SB 2Volume Total (vph) 93 309 424 160 431 246Volume Left (vph) 93 0 0 0 431 0Volume Right (vph) 0 309 0 160 0 0Hadj (s) 0.53 -0.67 0.03 -0.67 0.53 0.03Departure Headway (s) 8.2 7.0 7.1 6.4 7.5 7.0Degree Utilization, x 0.21 0.60 0.84 0.29 0.89 0.48Capacity (veh/h) 424 489 497 540 472 505Control Delay (s) 12.2 18.7 36.1 10.8 45.1 14.9Approach Delay (s) 17.2 29.2 34.1Approach LOS C D D
Intersection SummaryDelay 28.3Level of Service DIntersection Capacity Utilization 61.0% ICU Level of Service BAnalysis Period (min) 15
Agenda item No. 3

Rialto Impact Fee Study Existing Conditions3: Live Oak Ave & Riverside Ave Timing Plan: PM Peak Hour
Synchro 7 - ReportPage 3
Movement EBT EBR WBL WBT NBL NBRLane ConfigurationsVolume (vph) 224 258 62 242 178 25Ideal Flow (vphpl) 1800 1800 1700 1800 1700 1800Total Lost time (s) 4.0 4.0 4.0 4.0 4.0Lane Util. Factor 0.95 1.00 0.95 1.00 1.00Frt 0.92 1.00 1.00 1.00 0.85Flt Protected 1.00 0.95 1.00 0.95 1.00Satd. Flow (prot) 3083 1583 3353 1583 1500Flt Permitted 1.00 0.95 1.00 0.95 1.00Satd. Flow (perm) 3083 1583 3353 1583 1500Peak-hour factor, PHF 0.96 0.96 0.96 0.96 0.96 0.96Adj. Flow (vph) 233 269 65 252 185 26RTOR Reduction (vph) 178 0 0 0 0 20Lane Group Flow (vph) 324 0 65 252 185 6Turn Type NA Prot NA Prot PermProtected Phases 4 3 8 2Permitted Phases 2Actuated Green, G (s) 11.6 2.4 18.0 8.2 8.2Effective Green, g (s) 11.6 2.4 18.0 8.2 8.2Actuated g/C Ratio 0.34 0.07 0.53 0.24 0.24Clearance Time (s) 4.0 4.0 4.0 4.0 4.0Vehicle Extension (s) 3.0 3.0 3.0 3.0 3.0Lane Grp Cap (vph) 1045 111 1764 379 359v/s Ratio Prot c0.11 c0.04 0.08 c0.12v/s Ratio Perm 0.00v/c Ratio 0.31 0.59 0.14 0.49 0.02Uniform Delay, d1 8.3 15.4 4.1 11.2 9.9Progression Factor 1.00 1.00 1.00 1.00 1.00Incremental Delay, d2 0.2 7.7 0.0 1.0 0.0Delay (s) 8.5 23.1 4.2 12.2 9.9Level of Service A C A B AApproach Delay (s) 8.5 8.1 11.9Approach LOS A A B
Intersection SummaryHCM 2000 Control Delay 9.1 HCM 2000 Level of Service AHCM 2000 Volume to Capacity ratio 0.41Actuated Cycle Length (s) 34.2 Sum of lost time (s) 12.0Intersection Capacity Utilization 40.2% ICU Level of Service AAnalysis Period (min) 15c Critical Lane Group
Agenda item No. 3

Rialto Impact Fee Study Existing Conditions4: Alder Ave & Riverside Ave Timing Plan: PM Peak Hour
Synchro 7 - ReportPage 4
Movement EBT EBR WBL WBT NBL NBRLane ConfigurationsVolume (vph) 192 66 141 268 47 58Ideal Flow (vphpl) 1800 1800 1700 1800 1600 1800Total Lost time (s) 4.0 4.0 4.0 4.0 4.0Lane Util. Factor 0.95 1.00 0.95 0.97 1.00Frt 0.96 1.00 1.00 1.00 0.85Flt Protected 1.00 0.95 1.00 0.95 1.00Satd. Flow (prot) 3225 1583 3353 2891 1500Flt Permitted 1.00 0.59 1.00 0.95 1.00Satd. Flow (perm) 3225 982 3353 2891 1500Peak-hour factor, PHF 0.98 0.98 0.98 0.98 0.98 0.98Adj. Flow (vph) 196 67 144 273 48 59RTOR Reduction (vph) 37 0 0 0 0 53Lane Group Flow (vph) 226 0 144 273 48 6Turn Type NA Perm NA Prot PermProtected Phases 4 8 2Permitted Phases 8 2Actuated Green, G (s) 7.8 7.8 7.8 1.7 1.7Effective Green, g (s) 7.8 7.8 7.8 1.7 1.7Actuated g/C Ratio 0.45 0.45 0.45 0.10 0.10Clearance Time (s) 4.0 4.0 4.0 4.0 4.0Vehicle Extension (s) 3.0 3.0 3.0 3.0 3.0Lane Grp Cap (vph) 1437 437 1494 280 145v/s Ratio Prot 0.07 0.08 c0.02v/s Ratio Perm c0.15 0.00v/c Ratio 0.16 0.33 0.18 0.17 0.04Uniform Delay, d1 2.9 3.2 2.9 7.3 7.2Progression Factor 1.00 1.00 1.00 1.00 1.00Incremental Delay, d2 0.1 0.4 0.1 0.3 0.1Delay (s) 2.9 3.6 3.0 7.5 7.3Level of Service A A A A AApproach Delay (s) 2.9 3.2 7.4Approach LOS A A A
Intersection SummaryHCM 2000 Control Delay 3.7 HCM 2000 Level of Service AHCM 2000 Volume to Capacity ratio 0.30Actuated Cycle Length (s) 17.5 Sum of lost time (s) 8.0Intersection Capacity Utilization 29.9% ICU Level of Service AAnalysis Period (min) 15c Critical Lane Group
Agenda item No. 3
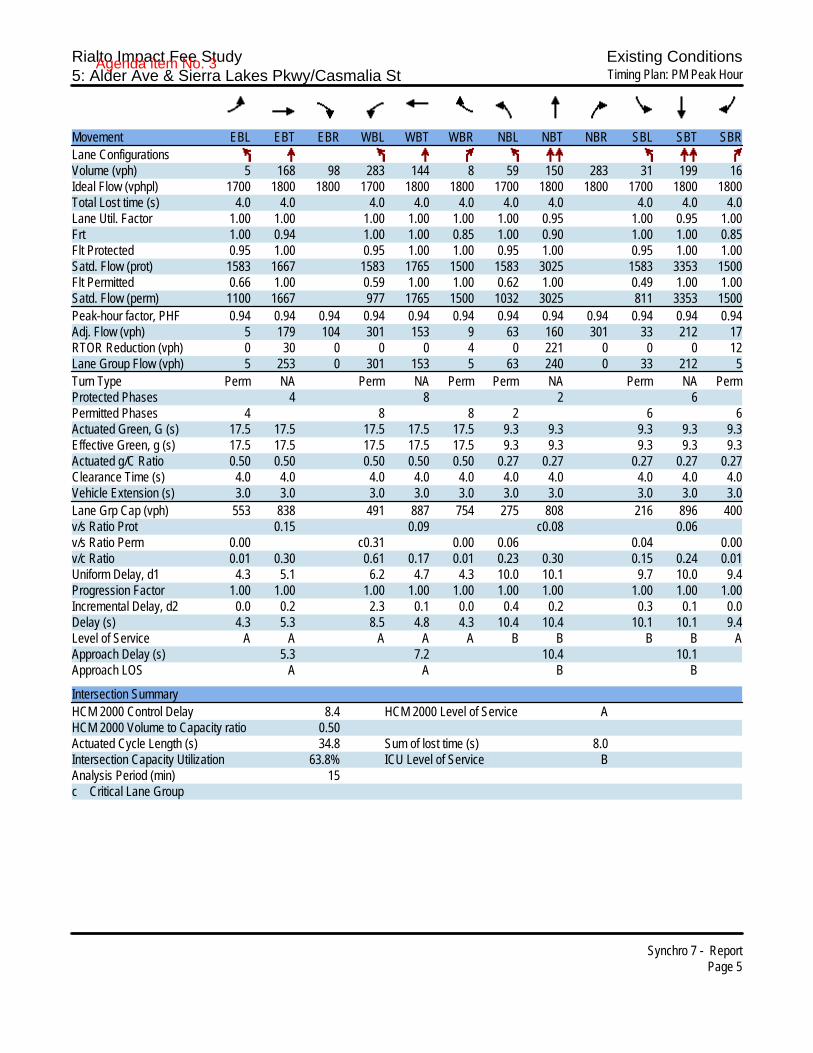
Rialto Impact Fee Study Existing Conditions5: Alder Ave & Sierra Lakes Pkwy/Casmalia St Timing Plan: PM Peak Hour
Synchro 7 - ReportPage 5
Movement EBL EBT EBR WBL WBT WBR NBL NBT NBR SBL SBT SBRLane ConfigurationsVolume (vph) 5 168 98 283 144 8 59 150 283 31 199 16Ideal Flow (vphpl) 1700 1800 1800 1700 1800 1800 1700 1800 1800 1700 1800 1800Total Lost time (s) 4.0 4.0 4.0 4.0 4.0 4.0 4.0 4.0 4.0 4.0Lane Util. Factor 1.00 1.00 1.00 1.00 1.00 1.00 0.95 1.00 0.95 1.00Frt 1.00 0.94 1.00 1.00 0.85 1.00 0.90 1.00 1.00 0.85Flt Protected 0.95 1.00 0.95 1.00 1.00 0.95 1.00 0.95 1.00 1.00Satd. Flow (prot) 1583 1667 1583 1765 1500 1583 3025 1583 3353 1500Flt Permitted 0.66 1.00 0.59 1.00 1.00 0.62 1.00 0.49 1.00 1.00Satd. Flow (perm) 1100 1667 977 1765 1500 1032 3025 811 3353 1500Peak-hour factor, PHF 0.94 0.94 0.94 0.94 0.94 0.94 0.94 0.94 0.94 0.94 0.94 0.94Adj. Flow (vph) 5 179 104 301 153 9 63 160 301 33 212 17RTOR Reduction (vph) 0 30 0 0 0 4 0 221 0 0 0 12Lane Group Flow (vph) 5 253 0 301 153 5 63 240 0 33 212 5Turn Type Perm NA Perm NA Perm Perm NA Perm NA PermProtected Phases 4 8 2 6Permitted Phases 4 8 8 2 6 6Actuated Green, G (s) 17.5 17.5 17.5 17.5 17.5 9.3 9.3 9.3 9.3 9.3Effective Green, g (s) 17.5 17.5 17.5 17.5 17.5 9.3 9.3 9.3 9.3 9.3Actuated g/C Ratio 0.50 0.50 0.50 0.50 0.50 0.27 0.27 0.27 0.27 0.27Clearance Time (s) 4.0 4.0 4.0 4.0 4.0 4.0 4.0 4.0 4.0 4.0Vehicle Extension (s) 3.0 3.0 3.0 3.0 3.0 3.0 3.0 3.0 3.0 3.0Lane Grp Cap (vph) 553 838 491 887 754 275 808 216 896 400v/s Ratio Prot 0.15 0.09 c0.08 0.06v/s Ratio Perm 0.00 c0.31 0.00 0.06 0.04 0.00v/c Ratio 0.01 0.30 0.61 0.17 0.01 0.23 0.30 0.15 0.24 0.01Uniform Delay, d1 4.3 5.1 6.2 4.7 4.3 10.0 10.1 9.7 10.0 9.4Progression Factor 1.00 1.00 1.00 1.00 1.00 1.00 1.00 1.00 1.00 1.00Incremental Delay, d2 0.0 0.2 2.3 0.1 0.0 0.4 0.2 0.3 0.1 0.0Delay (s) 4.3 5.3 8.5 4.8 4.3 10.4 10.4 10.1 10.1 9.4Level of Service A A A A A B B B B AApproach Delay (s) 5.3 7.2 10.4 10.1Approach LOS A A B B
Intersection SummaryHCM 2000 Control Delay 8.4 HCM 2000 Level of Service AHCM 2000 Volume to Capacity ratio 0.50Actuated Cycle Length (s) 34.8 Sum of lost time (s) 8.0Intersection Capacity Utilization 63.8% ICU Level of Service BAnalysis Period (min) 15c Critical Lane Group
Agenda item No. 3

Rialto Impact Fee Study Existing Conditions6: Alder Ave & I-210 WB On/I-210 WB Off Timing Plan: PM Peak Hour
Synchro 7 - ReportPage 6
Movement EBL EBT EBR WBL WBT WBR NBL NBT NBR SBL SBT SBRLane ConfigurationsVolume (vph) 0 0 0 174 1 60 308 432 0 0 234 346Ideal Flow (vphpl) 1800 1800 1800 1700 1800 1800 1700 1800 1800 1800 1800 1800Total Lost time (s) 4.0 4.0 4.0 4.0 4.0Lane Util. Factor 1.00 1.00 1.00 0.95 0.95Frt 1.00 0.85 1.00 1.00 0.91Flt Protected 0.95 1.00 0.95 1.00 1.00Satd. Flow (prot) 1583 1504 1583 3353 3053Flt Permitted 0.95 1.00 0.95 1.00 1.00Satd. Flow (perm) 1583 1504 1583 3353 3053Peak-hour factor, PHF 0.95 0.95 0.95 0.95 0.95 0.95 0.95 0.95 0.95 0.95 0.95 0.95Adj. Flow (vph) 0 0 0 183 1 63 324 455 0 0 246 364RTOR Reduction (vph) 0 0 0 0 51 0 0 0 0 0 272 0Lane Group Flow (vph) 0 0 0 183 13 0 324 455 0 0 338 0Turn Type Perm NA Prot NA NAProtected Phases 8 5 2 6Permitted Phases 8Actuated Green, G (s) 9.9 9.9 18.1 35.6 13.5Effective Green, g (s) 9.9 9.9 18.1 35.6 13.5Actuated g/C Ratio 0.19 0.19 0.34 0.67 0.25Clearance Time (s) 4.0 4.0 4.0 4.0 4.0Vehicle Extension (s) 3.0 3.0 3.0 3.0 3.0Lane Grp Cap (vph) 292 278 535 2231 770v/s Ratio Prot 0.01 c0.20 0.14 c0.11v/s Ratio Perm c0.12v/c Ratio 0.63 0.05 0.61 0.20 0.44Uniform Delay, d1 20.1 17.9 14.7 3.5 16.8Progression Factor 1.00 1.00 1.00 1.00 1.00Incremental Delay, d2 4.2 0.1 1.9 0.0 0.4Delay (s) 24.3 18.0 16.7 3.5 17.2Level of Service C B B A BApproach Delay (s) 0.0 22.6 9.0 17.2Approach LOS A C A B
Intersection SummaryHCM 2000 Control Delay 14.1 HCM 2000 Level of Service BHCM 2000 Volume to Capacity ratio 0.56Actuated Cycle Length (s) 53.5 Sum of lost time (s) 12.0Intersection Capacity Utilization 58.4% ICU Level of Service BAnalysis Period (min) 15c Critical Lane Group
Agenda item No. 3

Rialto Impact Fee Study Existing Conditions7: Alder Ave & SR-210 EB Off/SR-210 EB On Timing Plan: PM Peak Hour
Synchro 7 - ReportPage 7
Movement EBL EBT EBR WBL WBT WBR NBL NBT NBR SBL SBT SBRLane ConfigurationsVolume (vph) 316 2 298 0 0 0 0 424 204 133 275 0Ideal Flow (vphpl) 1800 1800 1800 1800 1800 1800 1800 1800 1800 1700 1800 1800Total Lost time (s) 4.0 4.0 4.0 4.0 4.0Lane Util. Factor 1.00 1.00 0.95 1.00 0.95Frt 1.00 0.85 0.95 1.00 1.00Flt Protected 0.95 1.00 1.00 0.95 1.00Satd. Flow (prot) 1681 1500 3190 1583 3353Flt Permitted 0.95 1.00 1.00 0.95 1.00Satd. Flow (perm) 1681 1500 3190 1583 3353Peak-hour factor, PHF 0.97 0.97 0.97 0.97 0.97 0.97 0.97 0.97 0.97 0.97 0.97 0.97Adj. Flow (vph) 326 2 307 0 0 0 0 437 210 137 284 0RTOR Reduction (vph) 0 0 205 0 0 0 0 65 0 0 0 0Lane Group Flow (vph) 0 328 102 0 0 0 0 582 0 137 284 0Turn Type Perm NA Perm NA Prot NAProtected Phases 4 2 1 6Permitted Phases 4 4Actuated Green, G (s) 19.7 19.7 18.7 8.8 31.5Effective Green, g (s) 19.7 19.7 18.7 8.8 31.5Actuated g/C Ratio 0.33 0.33 0.32 0.15 0.53Clearance Time (s) 4.0 4.0 4.0 4.0 4.0Vehicle Extension (s) 3.0 3.0 3.0 3.0 3.0Lane Grp Cap (vph) 559 499 1007 235 1784v/s Ratio Prot c0.18 c0.09 0.08v/s Ratio Perm 0.20 0.07v/c Ratio 0.59 0.20 0.58 0.58 0.16Uniform Delay, d1 16.4 14.1 16.9 23.5 7.1Progression Factor 1.00 1.00 1.00 1.00 1.00Incremental Delay, d2 1.6 0.2 0.8 3.7 0.0Delay (s) 18.0 14.3 17.8 27.1 7.1Level of Service B B B C AApproach Delay (s) 16.2 0.0 17.8 13.6Approach LOS B A B B
Intersection SummaryHCM 2000 Control Delay 16.2 HCM 2000 Level of Service BHCM 2000 Volume to Capacity ratio 0.58Actuated Cycle Length (s) 59.2 Sum of lost time (s) 12.0Intersection Capacity Utilization 58.4% ICU Level of Service BAnalysis Period (min) 15c Critical Lane Group
Agenda item No. 3

Rialto Impact Fee Study Existing Conditions8: Alder Ave & Renaissance Pkwy Timing Plan: PM Peak Hour
Synchro 7 - ReportPage 8
Movement EBL EBT EBR WBL WBT WBR NBL NBT NBR SBL SBT SBRLane ConfigurationsVolume (vph) 46 65 12 55 49 63 5 519 40 23 502 48Ideal Flow (vphpl) 1700 1800 1800 1700 1800 1800 1700 1800 1800 1700 1800 1800Total Lost time (s) 4.0 4.0 4.0 4.0 4.0 4.0 4.0 4.0 4.0Lane Util. Factor 1.00 0.95 1.00 0.95 1.00 0.95 1.00 1.00 1.00Frt 1.00 0.98 1.00 0.92 1.00 0.99 1.00 1.00 0.85Flt Protected 0.95 1.00 0.95 1.00 0.95 1.00 0.95 1.00 1.00Satd. Flow (prot) 1583 3275 1583 3071 1583 3317 1583 1765 1500Flt Permitted 0.95 1.00 0.95 1.00 0.95 1.00 0.95 1.00 1.00Satd. Flow (perm) 1583 3275 1583 3071 1583 3317 1583 1765 1500Peak-hour factor, PHF 0.91 0.91 0.91 0.91 0.91 0.91 0.91 0.91 0.91 0.91 0.91 0.91Adj. Flow (vph) 51 71 13 60 54 69 5 570 44 25 552 53RTOR Reduction (vph) 0 12 0 0 61 0 0 6 0 0 0 28Lane Group Flow (vph) 51 72 0 60 62 0 5 608 0 25 552 25Turn Type Prot NA Prot NA Prot NA Prot NA ProtProtected Phases 7 4 3 8 5 2 1 6 6Permitted PhasesActuated Green, G (s) 3.6 5.2 4.0 5.6 0.5 23.5 0.7 23.7 23.7Effective Green, g (s) 3.6 5.2 4.0 5.6 0.5 23.5 0.7 23.7 23.7Actuated g/C Ratio 0.07 0.11 0.08 0.11 0.01 0.48 0.01 0.48 0.48Clearance Time (s) 4.0 4.0 4.0 4.0 4.0 4.0 4.0 4.0 4.0Vehicle Extension (s) 3.0 3.0 3.0 3.0 3.0 3.0 3.0 3.0 3.0Lane Grp Cap (vph) 115 344 128 348 16 1577 22 846 719v/s Ratio Prot 0.03 c0.02 c0.04 0.02 0.00 0.18 c0.02 c0.31 0.02v/s Ratio Permv/c Ratio 0.44 0.21 0.47 0.18 0.31 0.39 1.14 0.65 0.04Uniform Delay, d1 21.9 20.2 21.7 19.8 24.3 8.3 24.3 9.7 6.8Progression Factor 1.00 1.00 1.00 1.00 1.00 1.00 1.00 1.00 1.00Incremental Delay, d2 2.7 0.3 2.7 0.2 10.9 0.2 237.5 1.8 0.0Delay (s) 24.7 20.5 24.4 20.1 35.1 8.5 261.9 11.5 6.8Level of Service C C C C D A F B AApproach Delay (s) 22.1 21.5 8.7 21.1Approach LOS C C A C
Intersection SummaryHCM 2000 Control Delay 16.3 HCM 2000 Level of Service BHCM 2000 Volume to Capacity ratio 0.57Actuated Cycle Length (s) 49.4 Sum of lost time (s) 16.0Intersection Capacity Utilization 44.6% ICU Level of Service AAnalysis Period (min) 15c Critical Lane Group
Agenda item No. 3
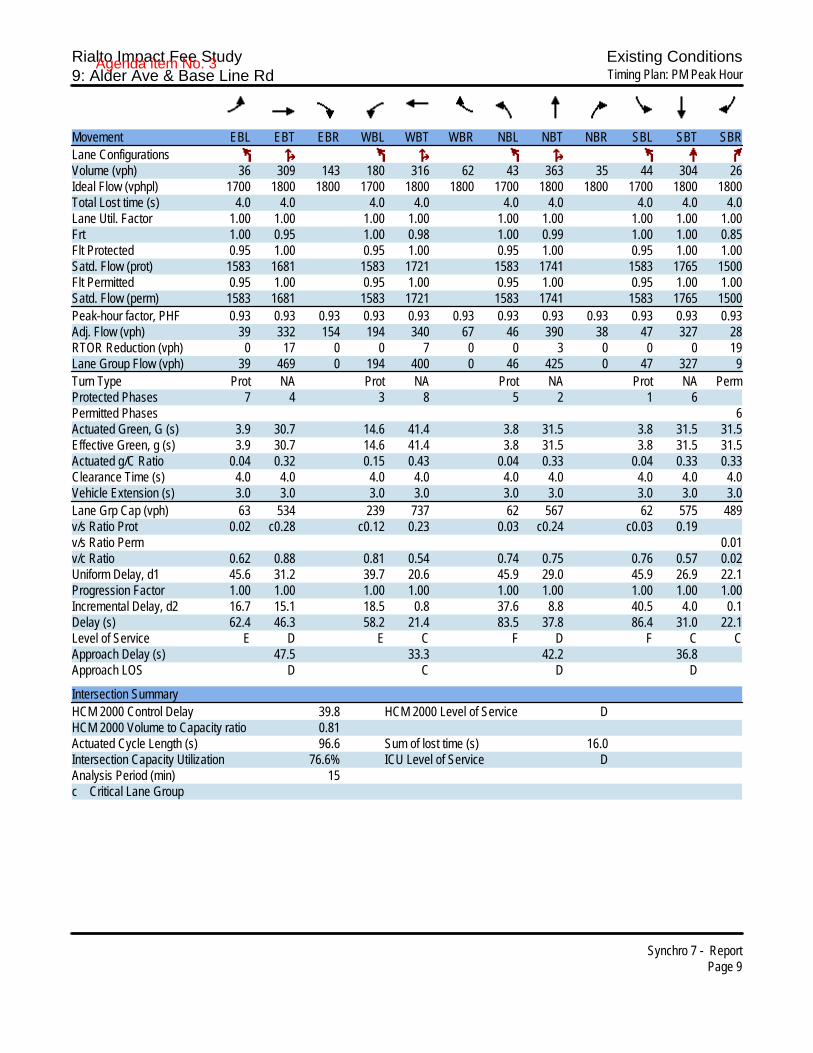
Rialto Impact Fee Study Existing Conditions9: Alder Ave & Base Line Rd Timing Plan: PM Peak Hour
Synchro 7 - ReportPage 9
Movement EBL EBT EBR WBL WBT WBR NBL NBT NBR SBL SBT SBRLane ConfigurationsVolume (vph) 36 309 143 180 316 62 43 363 35 44 304 26Ideal Flow (vphpl) 1700 1800 1800 1700 1800 1800 1700 1800 1800 1700 1800 1800Total Lost time (s) 4.0 4.0 4.0 4.0 4.0 4.0 4.0 4.0 4.0Lane Util. Factor 1.00 1.00 1.00 1.00 1.00 1.00 1.00 1.00 1.00Frt 1.00 0.95 1.00 0.98 1.00 0.99 1.00 1.00 0.85Flt Protected 0.95 1.00 0.95 1.00 0.95 1.00 0.95 1.00 1.00Satd. Flow (prot) 1583 1681 1583 1721 1583 1741 1583 1765 1500Flt Permitted 0.95 1.00 0.95 1.00 0.95 1.00 0.95 1.00 1.00Satd. Flow (perm) 1583 1681 1583 1721 1583 1741 1583 1765 1500Peak-hour factor, PHF 0.93 0.93 0.93 0.93 0.93 0.93 0.93 0.93 0.93 0.93 0.93 0.93Adj. Flow (vph) 39 332 154 194 340 67 46 390 38 47 327 28RTOR Reduction (vph) 0 17 0 0 7 0 0 3 0 0 0 19Lane Group Flow (vph) 39 469 0 194 400 0 46 425 0 47 327 9Turn Type Prot NA Prot NA Prot NA Prot NA PermProtected Phases 7 4 3 8 5 2 1 6Permitted Phases 6Actuated Green, G (s) 3.9 30.7 14.6 41.4 3.8 31.5 3.8 31.5 31.5Effective Green, g (s) 3.9 30.7 14.6 41.4 3.8 31.5 3.8 31.5 31.5Actuated g/C Ratio 0.04 0.32 0.15 0.43 0.04 0.33 0.04 0.33 0.33Clearance Time (s) 4.0 4.0 4.0 4.0 4.0 4.0 4.0 4.0 4.0Vehicle Extension (s) 3.0 3.0 3.0 3.0 3.0 3.0 3.0 3.0 3.0Lane Grp Cap (vph) 63 534 239 737 62 567 62 575 489v/s Ratio Prot 0.02 c0.28 c0.12 0.23 0.03 c0.24 c0.03 0.19v/s Ratio Perm 0.01v/c Ratio 0.62 0.88 0.81 0.54 0.74 0.75 0.76 0.57 0.02Uniform Delay, d1 45.6 31.2 39.7 20.6 45.9 29.0 45.9 26.9 22.1Progression Factor 1.00 1.00 1.00 1.00 1.00 1.00 1.00 1.00 1.00Incremental Delay, d2 16.7 15.1 18.5 0.8 37.6 8.8 40.5 4.0 0.1Delay (s) 62.4 46.3 58.2 21.4 83.5 37.8 86.4 31.0 22.1Level of Service E D E C F D F C CApproach Delay (s) 47.5 33.3 42.2 36.8Approach LOS D C D D
Intersection SummaryHCM 2000 Control Delay 39.8 HCM 2000 Level of Service DHCM 2000 Volume to Capacity ratio 0.81Actuated Cycle Length (s) 96.6 Sum of lost time (s) 16.0Intersection Capacity Utilization 76.6% ICU Level of Service DAnalysis Period (min) 15c Critical Lane Group
Agenda item No. 3

Rialto Impact Fee Study Existing Conditions10: Locust Ave & Casmalia St Timing Plan: PM Peak Hour
Synchro 7 - ReportPage 10
Movement EBL EBT EBR WBL WBT WBR NBL NBT NBR SBL SBT SBRLane ConfigurationsVolume (vph) 248 153 5 1 91 34 3 60 1 44 165 282Ideal Flow (vphpl) 1700 1800 1800 1700 1800 1800 1700 1800 1800 1700 1800 1800Total Lost time (s) 4.0 4.0 4.0 4.0 4.0 4.0 4.0 4.0Lane Util. Factor 1.00 1.00 1.00 1.00 1.00 0.95 1.00 0.95Frt 1.00 1.00 1.00 0.96 1.00 1.00 1.00 0.91Flt Protected 0.95 1.00 0.95 1.00 0.95 1.00 0.95 1.00Satd. Flow (prot) 1583 1757 1583 1693 1583 3346 1583 3036Flt Permitted 0.95 1.00 0.95 1.00 0.95 1.00 0.95 1.00Satd. Flow (perm) 1583 1757 1583 1693 1583 3346 1583 3036Peak-hour factor, PHF 0.80 0.80 0.80 0.80 0.80 0.80 0.80 0.80 0.80 0.80 0.80 0.80Adj. Flow (vph) 310 191 6 1 114 42 4 75 1 55 206 352RTOR Reduction (vph) 0 1 0 0 13 0 0 1 0 0 268 0Lane Group Flow (vph) 310 196 0 1 143 0 4 75 0 55 290 0Turn Type Prot NA Prot NA Prot NA Prot NAProtected Phases 7 4 3 8 5 2 1 6Permitted PhasesActuated Green, G (s) 18.4 29.0 0.5 11.1 0.5 10.9 4.1 14.5Effective Green, g (s) 18.4 29.0 0.5 11.1 0.5 10.9 4.1 14.5Actuated g/C Ratio 0.30 0.48 0.01 0.18 0.01 0.18 0.07 0.24Clearance Time (s) 4.0 4.0 4.0 4.0 4.0 4.0 4.0 4.0Vehicle Extension (s) 3.0 3.0 3.0 3.0 3.0 3.0 3.0 3.0Lane Grp Cap (vph) 481 842 13 310 13 602 107 727v/s Ratio Prot c0.20 0.11 0.00 c0.08 0.00 0.02 c0.03 c0.10v/s Ratio Permv/c Ratio 0.64 0.23 0.08 0.46 0.31 0.12 0.51 0.40Uniform Delay, d1 18.2 9.2 29.8 22.0 29.8 20.8 27.2 19.3Progression Factor 1.00 1.00 1.00 1.00 1.00 1.00 1.00 1.00Incremental Delay, d2 3.0 0.1 2.5 1.1 13.0 0.1 4.1 0.4Delay (s) 21.2 9.4 32.3 23.1 42.8 20.9 31.4 19.7Level of Service C A C C D C C BApproach Delay (s) 16.6 23.2 22.0 20.7Approach LOS B C C C
Intersection SummaryHCM 2000 Control Delay 19.5 HCM 2000 Level of Service BHCM 2000 Volume to Capacity ratio 0.53Actuated Cycle Length (s) 60.5 Sum of lost time (s) 16.0Intersection Capacity Utilization 47.0% ICU Level of Service AAnalysis Period (min) 15c Critical Lane Group
Agenda item No. 3

Rialto Impact Fee Study Existing Conditions11: Locust Ave & Base Line Rd Timing Plan: PM Peak Hour
Synchro 7 - ReportPage 11
Movement EBL EBT EBR WBL WBT WBR NBL NBT NBR SBL SBT SBRLane ConfigurationsVolume (vph) 0 401 120 35 330 1 82 0 45 0 0 4Ideal Flow (vphpl) 1700 1800 1800 1700 1800 1800 1700 1800 1800 1700 1800 1800Total Lost time (s) 4.0 4.0 4.0 4.0 4.0 4.0Lane Util. Factor 0.95 1.00 0.95 1.00 1.00 1.00Frt 0.97 1.00 1.00 1.00 0.85 0.85Flt Protected 1.00 0.95 1.00 0.95 1.00 1.00Satd. Flow (prot) 3237 1583 3351 1583 1500 1500Flt Permitted 1.00 0.95 1.00 0.76 1.00 1.00Satd. Flow (perm) 3237 1583 3351 1262 1500 1500Peak-hour factor, PHF 0.92 0.96 0.96 0.96 0.96 0.92 0.96 0.92 0.96 0.92 0.92 0.92Adj. Flow (vph) 0 418 125 36 344 1 85 0 47 0 0 4RTOR Reduction (vph) 0 31 0 0 0 0 0 0 35 0 0 3Lane Group Flow (vph) 0 512 0 36 345 0 85 0 12 0 0 1Turn Type Prot NA Prot NA Perm Perm Perm PermProtected Phases 7 4 3 8 2 6Permitted Phases 2 2 6 6Actuated Green, G (s) 12.4 1.0 17.4 8.7 8.7 8.7Effective Green, g (s) 12.4 1.0 17.4 8.7 8.7 8.7Actuated g/C Ratio 0.36 0.03 0.51 0.26 0.26 0.26Clearance Time (s) 4.0 4.0 4.0 4.0 4.0 4.0Vehicle Extension (s) 3.0 3.0 3.0 3.0 3.0 3.0Lane Grp Cap (vph) 1177 46 1709 321 382 382v/s Ratio Prot c0.16 c0.02 0.10v/s Ratio Perm c0.07 0.01 0.00v/c Ratio 0.43 0.78 0.20 0.26 0.03 0.00Uniform Delay, d1 8.2 16.4 4.6 10.1 9.5 9.5Progression Factor 1.00 1.00 1.00 1.00 1.00 1.00Incremental Delay, d2 0.3 57.8 0.1 0.4 0.0 0.0Delay (s) 8.5 74.2 4.6 10.6 9.6 9.5Level of Service A E A B A AApproach Delay (s) 8.5 11.2 10.2 9.5Approach LOS A B B A
Intersection SummaryHCM 2000 Control Delay 9.7 HCM 2000 Level of Service AHCM 2000 Volume to Capacity ratio 0.38Actuated Cycle Length (s) 34.1 Sum of lost time (s) 12.0Intersection Capacity Utilization 34.2% ICU Level of Service AAnalysis Period (min) 15c Critical Lane Group
Agenda item No. 3
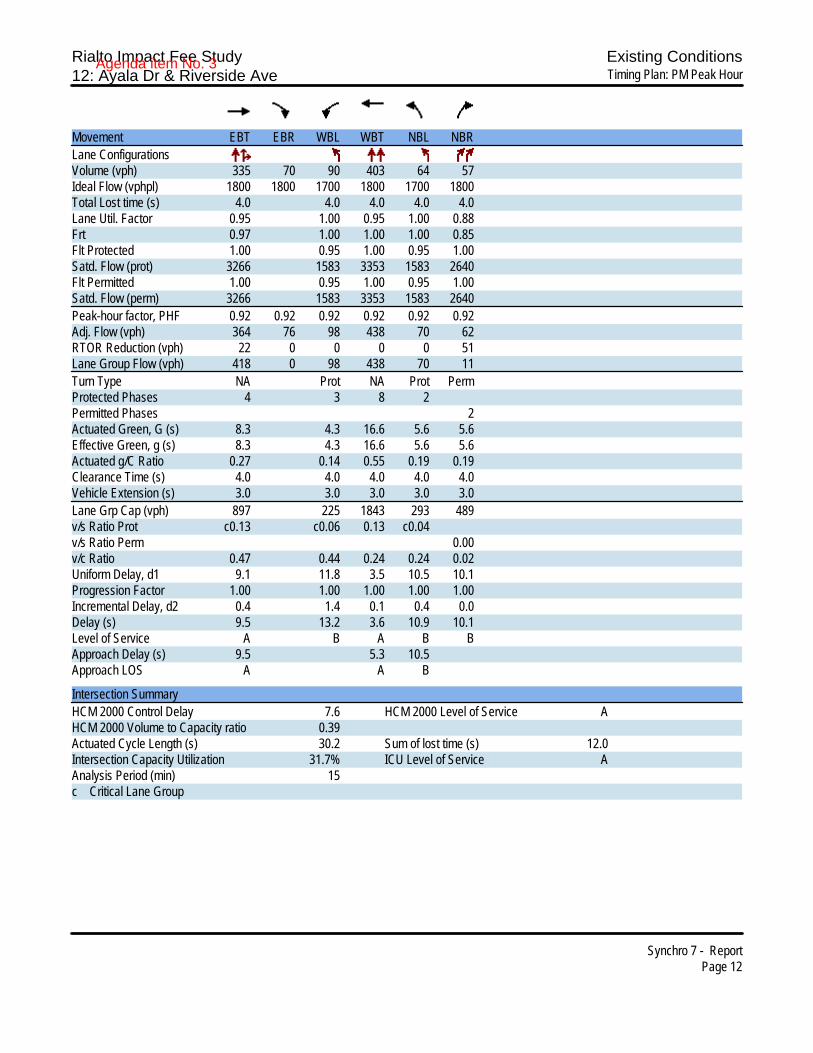
Rialto Impact Fee Study Existing Conditions12: Ayala Dr & Riverside Ave Timing Plan: PM Peak Hour
Synchro 7 - ReportPage 12
Movement EBT EBR WBL WBT NBL NBRLane ConfigurationsVolume (vph) 335 70 90 403 64 57Ideal Flow (vphpl) 1800 1800 1700 1800 1700 1800Total Lost time (s) 4.0 4.0 4.0 4.0 4.0Lane Util. Factor 0.95 1.00 0.95 1.00 0.88Frt 0.97 1.00 1.00 1.00 0.85Flt Protected 1.00 0.95 1.00 0.95 1.00Satd. Flow (prot) 3266 1583 3353 1583 2640Flt Permitted 1.00 0.95 1.00 0.95 1.00Satd. Flow (perm) 3266 1583 3353 1583 2640Peak-hour factor, PHF 0.92 0.92 0.92 0.92 0.92 0.92Adj. Flow (vph) 364 76 98 438 70 62RTOR Reduction (vph) 22 0 0 0 0 51Lane Group Flow (vph) 418 0 98 438 70 11Turn Type NA Prot NA Prot PermProtected Phases 4 3 8 2Permitted Phases 2Actuated Green, G (s) 8.3 4.3 16.6 5.6 5.6Effective Green, g (s) 8.3 4.3 16.6 5.6 5.6Actuated g/C Ratio 0.27 0.14 0.55 0.19 0.19Clearance Time (s) 4.0 4.0 4.0 4.0 4.0Vehicle Extension (s) 3.0 3.0 3.0 3.0 3.0Lane Grp Cap (vph) 897 225 1843 293 489v/s Ratio Prot c0.13 c0.06 0.13 c0.04v/s Ratio Perm 0.00v/c Ratio 0.47 0.44 0.24 0.24 0.02Uniform Delay, d1 9.1 11.8 3.5 10.5 10.1Progression Factor 1.00 1.00 1.00 1.00 1.00Incremental Delay, d2 0.4 1.4 0.1 0.4 0.0Delay (s) 9.5 13.2 3.6 10.9 10.1Level of Service A B A B BApproach Delay (s) 9.5 5.3 10.5Approach LOS A A B
Intersection SummaryHCM 2000 Control Delay 7.6 HCM 2000 Level of Service AHCM 2000 Volume to Capacity ratio 0.39Actuated Cycle Length (s) 30.2 Sum of lost time (s) 12.0Intersection Capacity Utilization 31.7% ICU Level of Service AAnalysis Period (min) 15c Critical Lane Group
Agenda item No. 3

Rialto Impact Fee Study Existing Conditions13: Ayala Dr & Casmalia St Timing Plan: PM Peak Hour
Synchro 7 - ReportPage 13
Movement EBL EBT EBR WBL WBT WBR NBL NBT NBR SBL SBT SBRLane ConfigurationsVolume (vph) 28 65 134 108 34 10 136 484 112 1 314 8Ideal Flow (vphpl) 1700 1800 1800 1700 1800 1800 1700 1800 1800 1700 1800 1800Total Lost time (s) 4.0 4.0 4.0 4.0 4.0 4.0 4.0 4.0 4.0 4.0Lane Util. Factor 1.00 1.00 1.00 1.00 1.00 1.00 1.00 0.95 1.00 0.95Frt 1.00 1.00 0.85 1.00 1.00 0.85 1.00 0.97 1.00 1.00Flt Protected 0.95 1.00 1.00 0.95 1.00 1.00 0.95 1.00 0.95 1.00Satd. Flow (prot) 1583 1765 1500 1583 1765 1500 1583 3258 1583 3340Flt Permitted 0.73 1.00 1.00 0.71 1.00 1.00 0.54 1.00 0.40 1.00Satd. Flow (perm) 1221 1765 1500 1182 1765 1500 893 3258 662 3340Peak-hour factor, PHF 0.89 0.89 0.89 0.89 0.89 0.89 0.89 0.89 0.89 0.89 0.89 0.89Adj. Flow (vph) 31 73 151 121 38 11 153 544 126 1 353 9RTOR Reduction (vph) 0 0 116 0 0 8 0 24 0 0 2 0Lane Group Flow (vph) 31 73 35 121 38 3 153 646 0 1 360 0Turn Type Perm NA Perm Perm NA Perm Perm NA Perm NAProtected Phases 4 8 2 6Permitted Phases 4 4 8 8 2 6Actuated Green, G (s) 7.1 7.1 7.1 7.1 7.1 7.1 15.7 15.7 15.7 15.7Effective Green, g (s) 7.1 7.1 7.1 7.1 7.1 7.1 15.7 15.7 15.7 15.7Actuated g/C Ratio 0.23 0.23 0.23 0.23 0.23 0.23 0.51 0.51 0.51 0.51Clearance Time (s) 4.0 4.0 4.0 4.0 4.0 4.0 4.0 4.0 4.0 4.0Vehicle Extension (s) 3.0 3.0 3.0 3.0 3.0 3.0 3.0 3.0 3.0 3.0Lane Grp Cap (vph) 281 406 345 272 406 345 455 1660 337 1702v/s Ratio Prot 0.04 0.02 c0.20 0.11v/s Ratio Perm 0.03 0.02 c0.10 0.00 0.17 0.00v/c Ratio 0.11 0.18 0.10 0.44 0.09 0.01 0.34 0.39 0.00 0.21Uniform Delay, d1 9.4 9.5 9.3 10.2 9.3 9.1 4.5 4.6 3.7 4.1Progression Factor 1.00 1.00 1.00 1.00 1.00 1.00 1.00 1.00 1.00 1.00Incremental Delay, d2 0.2 0.2 0.1 1.2 0.1 0.0 0.4 0.2 0.0 0.1Delay (s) 9.5 9.7 9.5 11.3 9.4 9.1 4.9 4.8 3.7 4.2Level of Service A A A B A A A A A AApproach Delay (s) 9.5 10.8 4.8 4.2Approach LOS A B A A
Intersection SummaryHCM 2000 Control Delay 6.0 HCM 2000 Level of Service AHCM 2000 Volume to Capacity ratio 0.41Actuated Cycle Length (s) 30.8 Sum of lost time (s) 8.0Intersection Capacity Utilization 44.6% ICU Level of Service AAnalysis Period (min) 15c Critical Lane Group
Agenda item No. 3

Rialto Impact Fee Study Existing Conditions14: Ayala Dr & I-210 WB Ramps Timing Plan: PM Peak Hour
Synchro 7 - ReportPage 14
Movement EBL EBT EBR WBL WBT WBR NBL NBT NBR SBL SBT SBRLane ConfigurationsVolume (vph) 0 0 0 298 6 200 505 532 0 0 354 202Ideal Flow (vphpl) 1800 1800 1800 1700 1800 1800 1600 1800 1800 1800 1800 1800Total Lost time (s) 4.0 4.0 4.0 4.0 4.0 4.0Lane Util. Factor 0.95 0.91 0.95 0.97 0.95 0.95Frt 1.00 0.96 0.85 1.00 1.00 0.95Flt Protected 0.95 0.97 1.00 0.95 1.00 1.00Satd. Flow (prot) 1504 1491 1425 2891 3353 3170Flt Permitted 0.95 0.97 1.00 0.95 1.00 1.00Satd. Flow (perm) 1504 1491 1425 2891 3353 3170Peak-hour factor, PHF 0.94 0.94 0.94 0.94 0.94 0.94 0.94 0.94 0.94 0.94 0.94 0.94Adj. Flow (vph) 0 0 0 317 6 213 537 566 0 0 377 215RTOR Reduction (vph) 0 0 0 0 14 127 0 0 0 0 93 0Lane Group Flow (vph) 0 0 0 187 169 39 537 566 0 0 499 0Turn Type Perm NA Perm Prot NA NAProtected Phases 8 5 2 6Permitted Phases 8 8Actuated Green, G (s) 14.1 14.1 14.1 17.4 38.2 16.8Effective Green, g (s) 14.1 14.1 14.1 17.4 38.2 16.8Actuated g/C Ratio 0.23 0.23 0.23 0.29 0.63 0.28Clearance Time (s) 4.0 4.0 4.0 4.0 4.0 4.0Vehicle Extension (s) 3.0 3.0 3.0 3.0 3.0 3.0Lane Grp Cap (vph) 351 348 333 834 2124 883v/s Ratio Prot c0.19 0.17 c0.16v/s Ratio Perm c0.12 0.11 0.03v/c Ratio 0.53 0.49 0.12 0.64 0.27 0.57Uniform Delay, d1 20.2 20.0 18.2 18.7 4.9 18.6Progression Factor 1.00 1.00 1.00 1.00 1.00 1.00Incremental Delay, d2 1.6 1.1 0.2 1.7 0.1 0.8Delay (s) 21.8 21.0 18.4 20.5 4.9 19.5Level of Service C C B C A BApproach Delay (s) 0.0 20.5 12.5 19.5Approach LOS A C B B
Intersection SummaryHCM 2000 Control Delay 16.3 HCM 2000 Level of Service BHCM 2000 Volume to Capacity ratio 0.58Actuated Cycle Length (s) 60.3 Sum of lost time (s) 12.0Intersection Capacity Utilization 55.3% ICU Level of Service BAnalysis Period (min) 15c Critical Lane Group
Agenda item No. 3
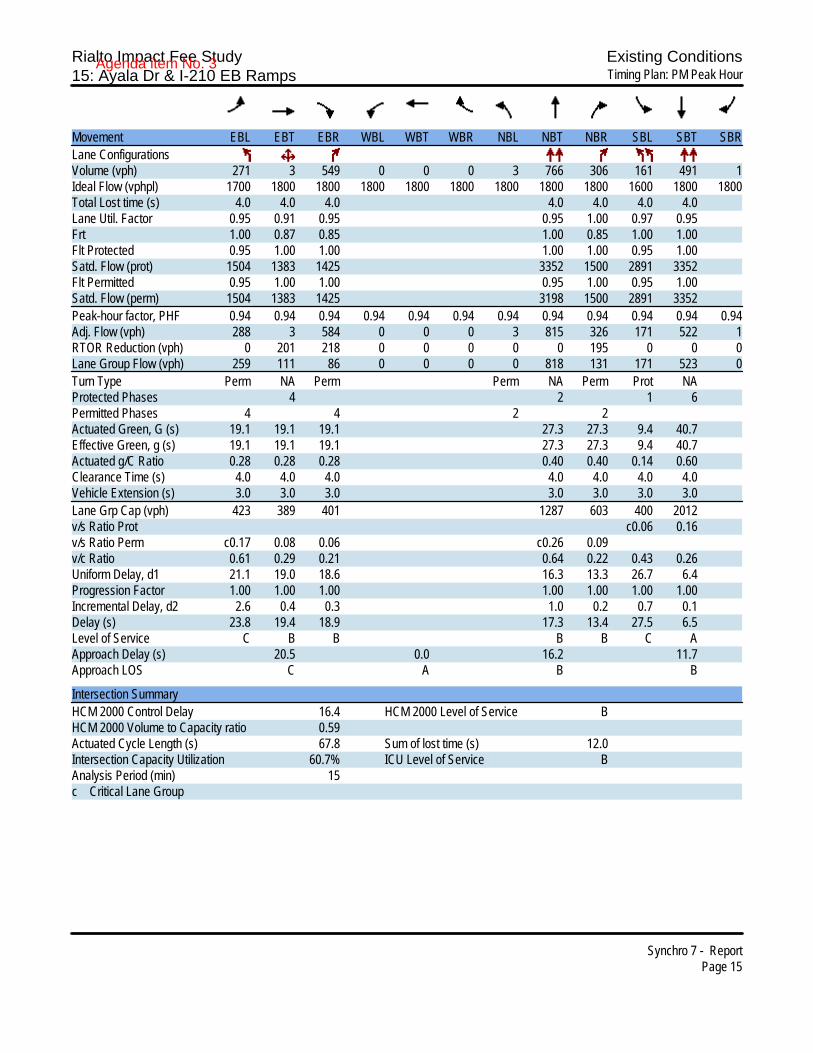
Rialto Impact Fee Study Existing Conditions15: Ayala Dr & I-210 EB Ramps Timing Plan: PM Peak Hour
Synchro 7 - ReportPage 15
Movement EBL EBT EBR WBL WBT WBR NBL NBT NBR SBL SBT SBRLane ConfigurationsVolume (vph) 271 3 549 0 0 0 3 766 306 161 491 1Ideal Flow (vphpl) 1700 1800 1800 1800 1800 1800 1800 1800 1800 1600 1800 1800Total Lost time (s) 4.0 4.0 4.0 4.0 4.0 4.0 4.0Lane Util. Factor 0.95 0.91 0.95 0.95 1.00 0.97 0.95Frt 1.00 0.87 0.85 1.00 0.85 1.00 1.00Flt Protected 0.95 1.00 1.00 1.00 1.00 0.95 1.00Satd. Flow (prot) 1504 1383 1425 3352 1500 2891 3352Flt Permitted 0.95 1.00 1.00 0.95 1.00 0.95 1.00Satd. Flow (perm) 1504 1383 1425 3198 1500 2891 3352Peak-hour factor, PHF 0.94 0.94 0.94 0.94 0.94 0.94 0.94 0.94 0.94 0.94 0.94 0.94Adj. Flow (vph) 288 3 584 0 0 0 3 815 326 171 522 1RTOR Reduction (vph) 0 201 218 0 0 0 0 0 195 0 0 0Lane Group Flow (vph) 259 111 86 0 0 0 0 818 131 171 523 0Turn Type Perm NA Perm Perm NA Perm Prot NAProtected Phases 4 2 1 6Permitted Phases 4 4 2 2Actuated Green, G (s) 19.1 19.1 19.1 27.3 27.3 9.4 40.7Effective Green, g (s) 19.1 19.1 19.1 27.3 27.3 9.4 40.7Actuated g/C Ratio 0.28 0.28 0.28 0.40 0.40 0.14 0.60Clearance Time (s) 4.0 4.0 4.0 4.0 4.0 4.0 4.0Vehicle Extension (s) 3.0 3.0 3.0 3.0 3.0 3.0 3.0Lane Grp Cap (vph) 423 389 401 1287 603 400 2012v/s Ratio Prot c0.06 0.16v/s Ratio Perm c0.17 0.08 0.06 c0.26 0.09v/c Ratio 0.61 0.29 0.21 0.64 0.22 0.43 0.26Uniform Delay, d1 21.1 19.0 18.6 16.3 13.3 26.7 6.4Progression Factor 1.00 1.00 1.00 1.00 1.00 1.00 1.00Incremental Delay, d2 2.6 0.4 0.3 1.0 0.2 0.7 0.1Delay (s) 23.8 19.4 18.9 17.3 13.4 27.5 6.5Level of Service C B B B B C AApproach Delay (s) 20.5 0.0 16.2 11.7Approach LOS C A B B
Intersection SummaryHCM 2000 Control Delay 16.4 HCM 2000 Level of Service BHCM 2000 Volume to Capacity ratio 0.59Actuated Cycle Length (s) 67.8 Sum of lost time (s) 12.0Intersection Capacity Utilization 60.7% ICU Level of Service BAnalysis Period (min) 15c Critical Lane Group
Agenda item No. 3
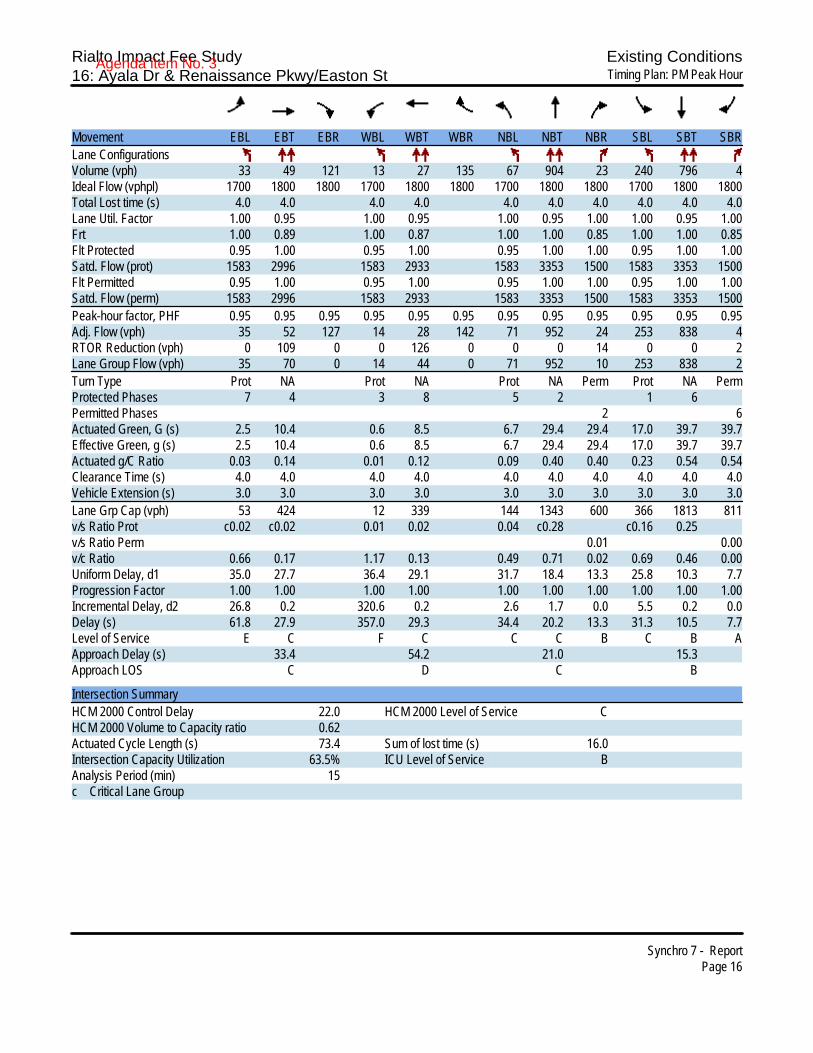
Rialto Impact Fee Study Existing Conditions16: Ayala Dr & Renaissance Pkwy/Easton St Timing Plan: PM Peak Hour
Synchro 7 - ReportPage 16
Movement EBL EBT EBR WBL WBT WBR NBL NBT NBR SBL SBT SBRLane ConfigurationsVolume (vph) 33 49 121 13 27 135 67 904 23 240 796 4Ideal Flow (vphpl) 1700 1800 1800 1700 1800 1800 1700 1800 1800 1700 1800 1800Total Lost time (s) 4.0 4.0 4.0 4.0 4.0 4.0 4.0 4.0 4.0 4.0Lane Util. Factor 1.00 0.95 1.00 0.95 1.00 0.95 1.00 1.00 0.95 1.00Frt 1.00 0.89 1.00 0.87 1.00 1.00 0.85 1.00 1.00 0.85Flt Protected 0.95 1.00 0.95 1.00 0.95 1.00 1.00 0.95 1.00 1.00Satd. Flow (prot) 1583 2996 1583 2933 1583 3353 1500 1583 3353 1500Flt Permitted 0.95 1.00 0.95 1.00 0.95 1.00 1.00 0.95 1.00 1.00Satd. Flow (perm) 1583 2996 1583 2933 1583 3353 1500 1583 3353 1500Peak-hour factor, PHF 0.95 0.95 0.95 0.95 0.95 0.95 0.95 0.95 0.95 0.95 0.95 0.95Adj. Flow (vph) 35 52 127 14 28 142 71 952 24 253 838 4RTOR Reduction (vph) 0 109 0 0 126 0 0 0 14 0 0 2Lane Group Flow (vph) 35 70 0 14 44 0 71 952 10 253 838 2Turn Type Prot NA Prot NA Prot NA Perm Prot NA PermProtected Phases 7 4 3 8 5 2 1 6Permitted Phases 2 6Actuated Green, G (s) 2.5 10.4 0.6 8.5 6.7 29.4 29.4 17.0 39.7 39.7Effective Green, g (s) 2.5 10.4 0.6 8.5 6.7 29.4 29.4 17.0 39.7 39.7Actuated g/C Ratio 0.03 0.14 0.01 0.12 0.09 0.40 0.40 0.23 0.54 0.54Clearance Time (s) 4.0 4.0 4.0 4.0 4.0 4.0 4.0 4.0 4.0 4.0Vehicle Extension (s) 3.0 3.0 3.0 3.0 3.0 3.0 3.0 3.0 3.0 3.0Lane Grp Cap (vph) 53 424 12 339 144 1343 600 366 1813 811v/s Ratio Prot c0.02 c0.02 0.01 0.02 0.04 c0.28 c0.16 0.25v/s Ratio Perm 0.01 0.00v/c Ratio 0.66 0.17 1.17 0.13 0.49 0.71 0.02 0.69 0.46 0.00Uniform Delay, d1 35.0 27.7 36.4 29.1 31.7 18.4 13.3 25.8 10.3 7.7Progression Factor 1.00 1.00 1.00 1.00 1.00 1.00 1.00 1.00 1.00 1.00Incremental Delay, d2 26.8 0.2 320.6 0.2 2.6 1.7 0.0 5.5 0.2 0.0Delay (s) 61.8 27.9 357.0 29.3 34.4 20.2 13.3 31.3 10.5 7.7Level of Service E C F C C C B C B AApproach Delay (s) 33.4 54.2 21.0 15.3Approach LOS C D C B
Intersection SummaryHCM 2000 Control Delay 22.0 HCM 2000 Level of Service CHCM 2000 Volume to Capacity ratio 0.62Actuated Cycle Length (s) 73.4 Sum of lost time (s) 16.0Intersection Capacity Utilization 63.5% ICU Level of Service BAnalysis Period (min) 15c Critical Lane Group
Agenda item No. 3
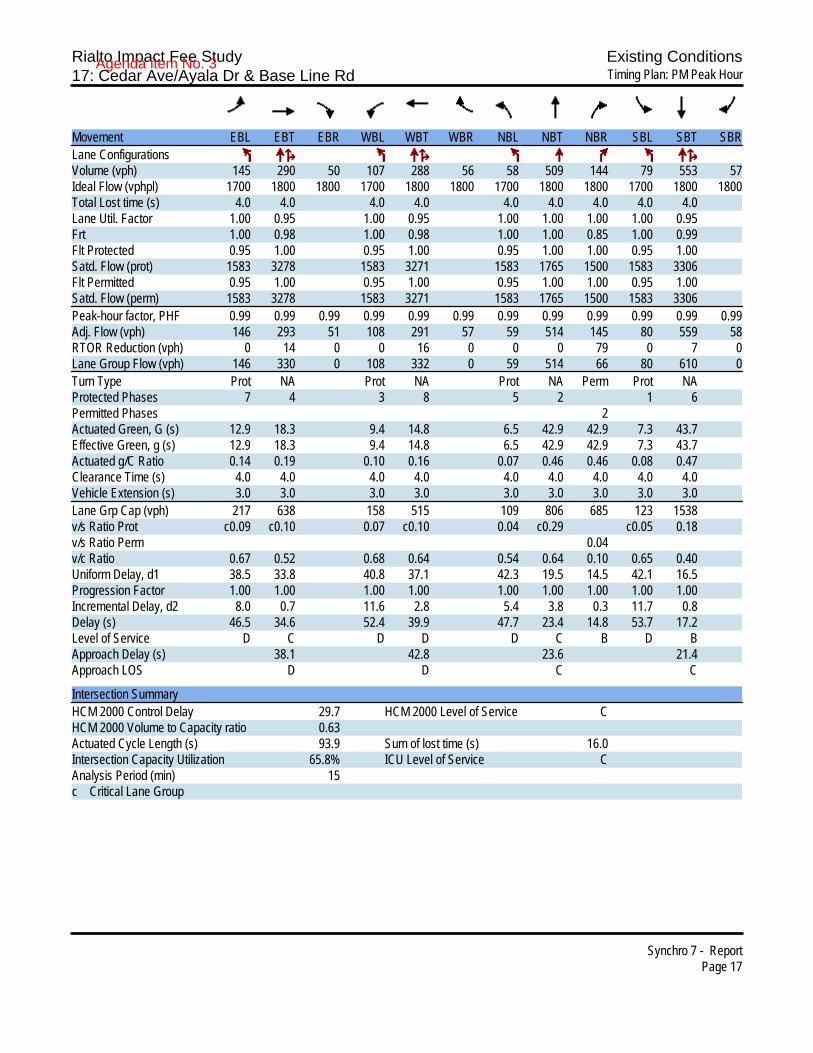
Rialto Impact Fee Study Existing Conditions17: Cedar Ave/Ayala Dr & Base Line Rd Timing Plan: PM Peak Hour
Synchro 7 - ReportPage 17
Movement EBL EBT EBR WBL WBT WBR NBL NBT NBR SBL SBT SBRLane ConfigurationsVolume (vph) 145 290 50 107 288 56 58 509 144 79 553 57Ideal Flow (vphpl) 1700 1800 1800 1700 1800 1800 1700 1800 1800 1700 1800 1800Total Lost time (s) 4.0 4.0 4.0 4.0 4.0 4.0 4.0 4.0 4.0Lane Util. Factor 1.00 0.95 1.00 0.95 1.00 1.00 1.00 1.00 0.95Frt 1.00 0.98 1.00 0.98 1.00 1.00 0.85 1.00 0.99Flt Protected 0.95 1.00 0.95 1.00 0.95 1.00 1.00 0.95 1.00Satd. Flow (prot) 1583 3278 1583 3271 1583 1765 1500 1583 3306Flt Permitted 0.95 1.00 0.95 1.00 0.95 1.00 1.00 0.95 1.00Satd. Flow (perm) 1583 3278 1583 3271 1583 1765 1500 1583 3306Peak-hour factor, PHF 0.99 0.99 0.99 0.99 0.99 0.99 0.99 0.99 0.99 0.99 0.99 0.99Adj. Flow (vph) 146 293 51 108 291 57 59 514 145 80 559 58RTOR Reduction (vph) 0 14 0 0 16 0 0 0 79 0 7 0Lane Group Flow (vph) 146 330 0 108 332 0 59 514 66 80 610 0Turn Type Prot NA Prot NA Prot NA Perm Prot NAProtected Phases 7 4 3 8 5 2 1 6Permitted Phases 2Actuated Green, G (s) 12.9 18.3 9.4 14.8 6.5 42.9 42.9 7.3 43.7Effective Green, g (s) 12.9 18.3 9.4 14.8 6.5 42.9 42.9 7.3 43.7Actuated g/C Ratio 0.14 0.19 0.10 0.16 0.07 0.46 0.46 0.08 0.47Clearance Time (s) 4.0 4.0 4.0 4.0 4.0 4.0 4.0 4.0 4.0Vehicle Extension (s) 3.0 3.0 3.0 3.0 3.0 3.0 3.0 3.0 3.0Lane Grp Cap (vph) 217 638 158 515 109 806 685 123 1538v/s Ratio Prot c0.09 c0.10 0.07 c0.10 0.04 c0.29 c0.05 0.18v/s Ratio Perm 0.04v/c Ratio 0.67 0.52 0.68 0.64 0.54 0.64 0.10 0.65 0.40Uniform Delay, d1 38.5 33.8 40.8 37.1 42.3 19.5 14.5 42.1 16.5Progression Factor 1.00 1.00 1.00 1.00 1.00 1.00 1.00 1.00 1.00Incremental Delay, d2 8.0 0.7 11.6 2.8 5.4 3.8 0.3 11.7 0.8Delay (s) 46.5 34.6 52.4 39.9 47.7 23.4 14.8 53.7 17.2Level of Service D C D D D C B D BApproach Delay (s) 38.1 42.8 23.6 21.4Approach LOS D D C C
Intersection SummaryHCM 2000 Control Delay 29.7 HCM 2000 Level of Service CHCM 2000 Volume to Capacity ratio 0.63Actuated Cycle Length (s) 93.9 Sum of lost time (s) 16.0Intersection Capacity Utilization 65.8% ICU Level of Service CAnalysis Period (min) 15c Critical Lane Group
Agenda item No. 3

Rialto Impact Fee Study Existing Conditions18: Cedar Ave & Foothill Blvd Timing Plan: PM Peak Hour
Synchro 7 - ReportPage 18
Movement EBL EBT EBR WBL WBT WBR NBL NBT NBR SBL SBT SBRLane ConfigurationsVolume (vph) 144 594 106 145 545 80 157 592 104 112 507 69Ideal Flow (vphpl) 1700 1800 1800 1700 1800 1800 1700 1800 1800 1700 1800 1800Total Lost time (s) 4.0 4.0 4.0 4.0 4.0 4.0 4.0 4.0Lane Util. Factor 1.00 0.91 1.00 0.91 1.00 0.95 1.00 0.95Frt 1.00 0.98 1.00 0.98 1.00 0.98 1.00 0.98Flt Protected 0.95 1.00 0.95 1.00 0.95 1.00 0.95 1.00Satd. Flow (prot) 1583 4708 1583 4725 1583 3278 1583 3292Flt Permitted 0.95 1.00 0.95 1.00 0.95 1.00 0.95 1.00Satd. Flow (perm) 1583 4708 1583 4725 1583 3278 1583 3292Peak-hour factor, PHF 0.99 0.99 0.99 0.99 0.99 0.99 0.99 0.99 0.99 0.99 0.99 0.99Adj. Flow (vph) 145 600 107 146 551 81 159 598 105 113 512 70RTOR Reduction (vph) 0 26 0 0 19 0 0 13 0 0 10 0Lane Group Flow (vph) 145 681 0 146 613 0 159 690 0 113 572 0Turn Type Prot NA Prot NA Prot NA Prot NAProtected Phases 7 4 3 8 5 2 1 6Permitted PhasesActuated Green, G (s) 13.1 18.1 13.2 18.2 13.9 35.4 9.5 31.0Effective Green, g (s) 13.1 18.1 13.2 18.2 13.9 35.4 9.5 31.0Actuated g/C Ratio 0.14 0.20 0.14 0.20 0.15 0.38 0.10 0.34Clearance Time (s) 4.0 4.0 4.0 4.0 4.0 4.0 4.0 4.0Vehicle Extension (s) 3.0 3.0 3.0 3.0 3.0 3.0 3.0 3.0Lane Grp Cap (vph) 224 924 226 932 238 1258 163 1106v/s Ratio Prot 0.09 c0.14 c0.09 0.13 c0.10 c0.21 0.07 0.17v/s Ratio Permv/c Ratio 0.65 0.74 0.65 0.66 0.67 0.55 0.69 0.52Uniform Delay, d1 37.4 34.8 37.3 34.1 37.0 22.2 39.9 24.6Progression Factor 1.00 1.00 1.00 1.00 1.00 1.00 1.00 1.00Incremental Delay, d2 6.3 3.1 6.2 1.7 6.9 1.7 12.0 1.7Delay (s) 43.7 37.9 43.5 35.8 43.9 23.9 52.0 26.3Level of Service D D D D D C D CApproach Delay (s) 38.9 37.3 27.6 30.5Approach LOS D D C C
Intersection SummaryHCM 2000 Control Delay 33.6 HCM 2000 Level of Service CHCM 2000 Volume to Capacity ratio 0.65Actuated Cycle Length (s) 92.2 Sum of lost time (s) 16.0Intersection Capacity Utilization 64.6% ICU Level of Service CAnalysis Period (min) 15c Critical Lane Group
Agenda item No. 3
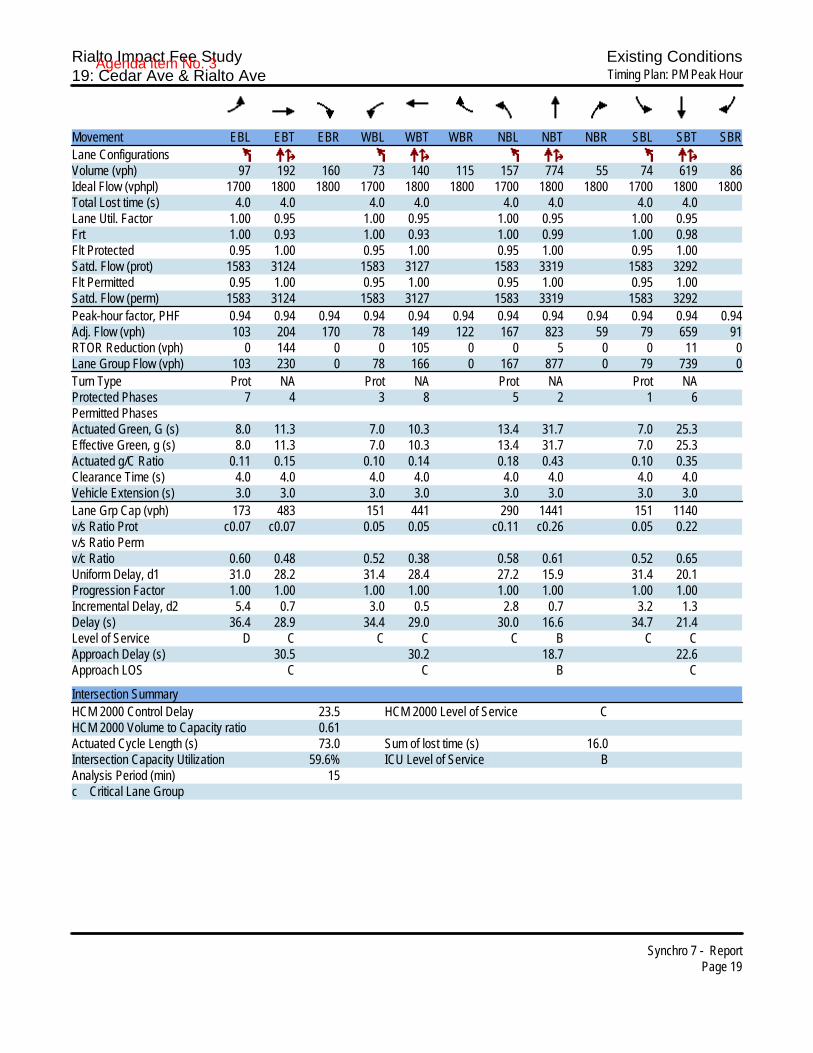
Rialto Impact Fee Study Existing Conditions19: Cedar Ave & Rialto Ave Timing Plan: PM Peak Hour
Synchro 7 - ReportPage 19
Movement EBL EBT EBR WBL WBT WBR NBL NBT NBR SBL SBT SBRLane ConfigurationsVolume (vph) 97 192 160 73 140 115 157 774 55 74 619 86Ideal Flow (vphpl) 1700 1800 1800 1700 1800 1800 1700 1800 1800 1700 1800 1800Total Lost time (s) 4.0 4.0 4.0 4.0 4.0 4.0 4.0 4.0Lane Util. Factor 1.00 0.95 1.00 0.95 1.00 0.95 1.00 0.95Frt 1.00 0.93 1.00 0.93 1.00 0.99 1.00 0.98Flt Protected 0.95 1.00 0.95 1.00 0.95 1.00 0.95 1.00Satd. Flow (prot) 1583 3124 1583 3127 1583 3319 1583 3292Flt Permitted 0.95 1.00 0.95 1.00 0.95 1.00 0.95 1.00Satd. Flow (perm) 1583 3124 1583 3127 1583 3319 1583 3292Peak-hour factor, PHF 0.94 0.94 0.94 0.94 0.94 0.94 0.94 0.94 0.94 0.94 0.94 0.94Adj. Flow (vph) 103 204 170 78 149 122 167 823 59 79 659 91RTOR Reduction (vph) 0 144 0 0 105 0 0 5 0 0 11 0Lane Group Flow (vph) 103 230 0 78 166 0 167 877 0 79 739 0Turn Type Prot NA Prot NA Prot NA Prot NAProtected Phases 7 4 3 8 5 2 1 6Permitted PhasesActuated Green, G (s) 8.0 11.3 7.0 10.3 13.4 31.7 7.0 25.3Effective Green, g (s) 8.0 11.3 7.0 10.3 13.4 31.7 7.0 25.3Actuated g/C Ratio 0.11 0.15 0.10 0.14 0.18 0.43 0.10 0.35Clearance Time (s) 4.0 4.0 4.0 4.0 4.0 4.0 4.0 4.0Vehicle Extension (s) 3.0 3.0 3.0 3.0 3.0 3.0 3.0 3.0Lane Grp Cap (vph) 173 483 151 441 290 1441 151 1140v/s Ratio Prot c0.07 c0.07 0.05 0.05 c0.11 c0.26 0.05 0.22v/s Ratio Permv/c Ratio 0.60 0.48 0.52 0.38 0.58 0.61 0.52 0.65Uniform Delay, d1 31.0 28.2 31.4 28.4 27.2 15.9 31.4 20.1Progression Factor 1.00 1.00 1.00 1.00 1.00 1.00 1.00 1.00Incremental Delay, d2 5.4 0.7 3.0 0.5 2.8 0.7 3.2 1.3Delay (s) 36.4 28.9 34.4 29.0 30.0 16.6 34.7 21.4Level of Service D C C C C B C CApproach Delay (s) 30.5 30.2 18.7 22.6Approach LOS C C B C
Intersection SummaryHCM 2000 Control Delay 23.5 HCM 2000 Level of Service CHCM 2000 Volume to Capacity ratio 0.61Actuated Cycle Length (s) 73.0 Sum of lost time (s) 16.0Intersection Capacity Utilization 59.6% ICU Level of Service BAnalysis Period (min) 15c Critical Lane Group
Agenda item No. 3

Rialto Impact Fee Study Existing Conditions20: Cedar Ave & Merrill Ave Timing Plan: PM Peak Hour
Synchro 7 - ReportPage 20
Movement EBL EBT EBR WBL WBT WBR NBL NBT NBR SBL SBT SBRLane ConfigurationsVolume (vph) 128 251 66 51 214 92 75 749 31 122 669 117Ideal Flow (vphpl) 1700 1800 1800 1700 1800 1800 1700 1800 1800 1700 1800 1800Total Lost time (s) 4.0 4.0 4.0 4.0 4.0 4.0 4.0 4.0Lane Util. Factor 1.00 0.95 1.00 0.95 1.00 0.95 1.00 0.95Frt 1.00 0.97 1.00 0.95 1.00 0.99 1.00 0.98Flt Protected 0.95 1.00 0.95 1.00 0.95 1.00 0.95 1.00Satd. Flow (prot) 1583 3248 1583 3202 1583 3333 1583 3278Flt Permitted 0.54 1.00 0.52 1.00 0.95 1.00 0.95 1.00Satd. Flow (perm) 892 3248 873 3202 1583 3333 1583 3278Peak-hour factor, PHF 0.96 0.96 0.96 0.96 0.96 0.96 0.96 0.96 0.96 0.96 0.96 0.96Adj. Flow (vph) 133 261 69 53 223 96 78 780 32 127 697 122RTOR Reduction (vph) 0 25 0 0 51 0 0 3 0 0 15 0Lane Group Flow (vph) 133 305 0 53 268 0 78 809 0 127 804 0Turn Type Perm NA Perm NA Prot NA Prot NAProtected Phases 4 8 5 2 1 6Permitted Phases 4 8Actuated Green, G (s) 17.5 17.5 17.5 17.5 6.8 24.9 9.0 27.1Effective Green, g (s) 17.5 17.5 17.5 17.5 6.8 24.9 9.0 27.1Actuated g/C Ratio 0.28 0.28 0.28 0.28 0.11 0.39 0.14 0.43Clearance Time (s) 4.0 4.0 4.0 4.0 4.0 4.0 4.0 4.0Vehicle Extension (s) 3.0 3.0 3.0 3.0 3.0 3.0 3.0 3.0Lane Grp Cap (vph) 246 896 240 883 169 1309 224 1401v/s Ratio Prot 0.09 0.08 0.05 0.24 c0.08 c0.25v/s Ratio Perm c0.15 0.06v/c Ratio 0.54 0.34 0.22 0.30 0.46 0.62 0.57 0.57Uniform Delay, d1 19.5 18.3 17.7 18.1 26.6 15.4 25.4 13.8Progression Factor 1.00 1.00 1.00 1.00 1.00 1.00 1.00 1.00Incremental Delay, d2 2.4 0.2 0.5 0.2 2.0 0.9 3.3 0.6Delay (s) 21.9 18.6 18.2 18.3 28.6 16.3 28.7 14.3Level of Service C B B B C B C BApproach Delay (s) 19.5 18.3 17.4 16.3Approach LOS B B B B
Intersection SummaryHCM 2000 Control Delay 17.5 HCM 2000 Level of Service BHCM 2000 Volume to Capacity ratio 0.58Actuated Cycle Length (s) 63.4 Sum of lost time (s) 12.0Intersection Capacity Utilization 61.1% ICU Level of Service BAnalysis Period (min) 15c Critical Lane Group
Agenda item No. 3

Rialto Impact Fee Study Existing Conditions21: Cedar Ave & Randall Ave Timing Plan: PM Peak Hour
Synchro 7 - ReportPage 21
Movement EBL EBT EBR WBL WBT WBR NBL NBT NBR SBL SBT SBRLane ConfigurationsVolume (vph) 41 120 41 36 88 52 41 810 63 67 681 26Ideal Flow (vphpl) 1700 1800 1800 1700 1800 1800 1700 1800 1800 1700 1800 1800Total Lost time (s) 4.0 4.0 4.0 4.0 4.0 4.0 4.0 4.0 4.0Lane Util. Factor 1.00 1.00 1.00 1.00 1.00 1.00 0.95 1.00 0.95Frt 1.00 0.96 1.00 1.00 0.85 1.00 0.99 1.00 0.99Flt Protected 0.95 1.00 0.95 1.00 1.00 0.95 1.00 0.95 1.00Satd. Flow (prot) 1583 1698 1583 1765 1500 1583 3317 1583 3334Flt Permitted 0.70 1.00 0.63 1.00 1.00 0.95 1.00 0.95 1.00Satd. Flow (perm) 1163 1698 1045 1765 1500 1583 3317 1583 3334Peak-hour factor, PHF 0.97 0.97 0.97 0.97 0.97 0.97 0.97 0.97 0.97 0.97 0.97 0.97Adj. Flow (vph) 42 124 42 37 91 54 42 835 65 69 702 27RTOR Reduction (vph) 0 13 0 0 0 45 0 6 0 0 3 0Lane Group Flow (vph) 42 153 0 37 91 9 42 894 0 69 726 0Turn Type Perm NA Perm NA Perm Prot NA Prot NAProtected Phases 4 8 5 2 1 6Permitted Phases 4 8 8Actuated Green, G (s) 8.5 8.5 8.5 8.5 8.5 2.4 26.1 4.5 28.2Effective Green, g (s) 8.5 8.5 8.5 8.5 8.5 2.4 26.1 4.5 28.2Actuated g/C Ratio 0.17 0.17 0.17 0.17 0.17 0.05 0.51 0.09 0.55Clearance Time (s) 4.0 4.0 4.0 4.0 4.0 4.0 4.0 4.0 4.0Vehicle Extension (s) 3.0 3.0 3.0 3.0 3.0 3.0 3.0 3.0 3.0Lane Grp Cap (vph) 193 282 173 293 249 74 1694 139 1839v/s Ratio Prot c0.09 0.05 0.03 c0.27 c0.04 0.22v/s Ratio Perm 0.04 0.04 0.01v/c Ratio 0.22 0.54 0.21 0.31 0.04 0.57 0.53 0.50 0.39Uniform Delay, d1 18.4 19.5 18.4 18.7 17.9 23.8 8.4 22.2 6.6Progression Factor 1.00 1.00 1.00 1.00 1.00 1.00 1.00 1.00 1.00Incremental Delay, d2 0.6 2.1 0.6 0.6 0.1 9.6 0.3 2.8 0.1Delay (s) 19.0 21.6 19.0 19.3 17.9 33.5 8.7 25.0 6.7Level of Service B C B B B C A C AApproach Delay (s) 21.1 18.9 9.8 8.3Approach LOS C B A A
Intersection SummaryHCM 2000 Control Delay 11.1 HCM 2000 Level of Service BHCM 2000 Volume to Capacity ratio 0.52Actuated Cycle Length (s) 51.1 Sum of lost time (s) 12.0Intersection Capacity Utilization 55.9% ICU Level of Service BAnalysis Period (min) 15c Critical Lane Group
Agenda item No. 3
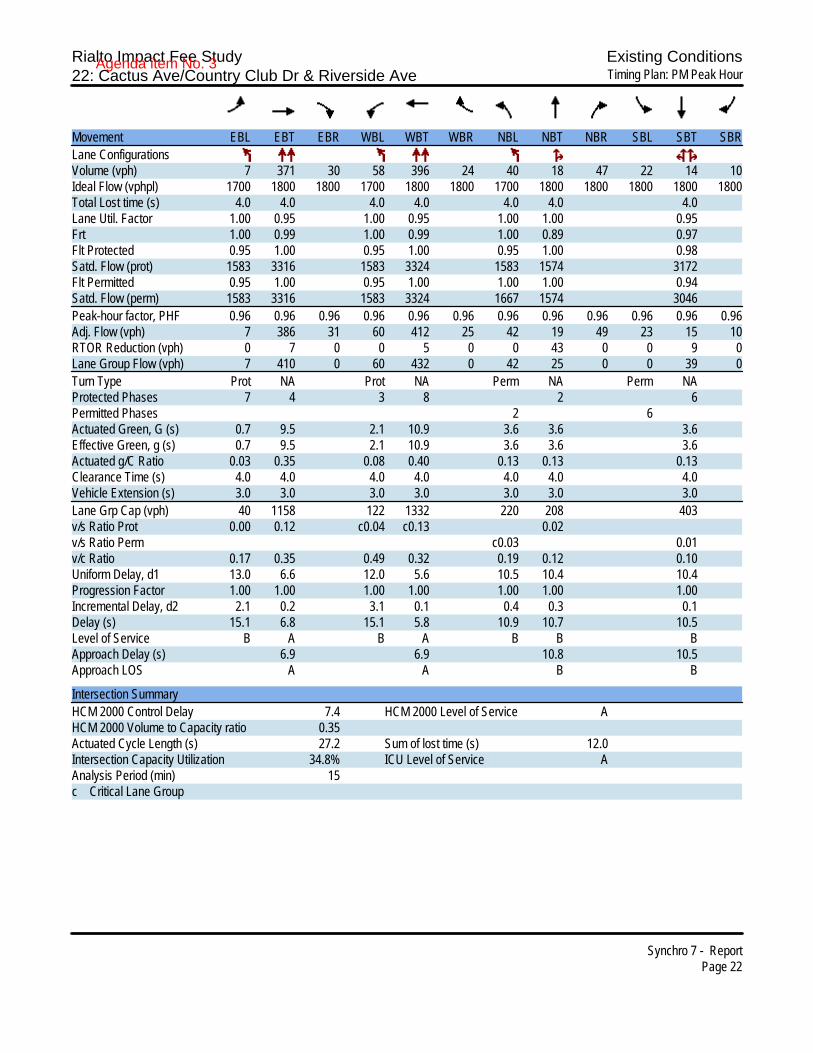
Rialto Impact Fee Study Existing Conditions22: Cactus Ave/Country Club Dr & Riverside Ave Timing Plan: PM Peak Hour
Synchro 7 - ReportPage 22
Movement EBL EBT EBR WBL WBT WBR NBL NBT NBR SBL SBT SBRLane ConfigurationsVolume (vph) 7 371 30 58 396 24 40 18 47 22 14 10Ideal Flow (vphpl) 1700 1800 1800 1700 1800 1800 1700 1800 1800 1800 1800 1800Total Lost time (s) 4.0 4.0 4.0 4.0 4.0 4.0 4.0Lane Util. Factor 1.00 0.95 1.00 0.95 1.00 1.00 0.95Frt 1.00 0.99 1.00 0.99 1.00 0.89 0.97Flt Protected 0.95 1.00 0.95 1.00 0.95 1.00 0.98Satd. Flow (prot) 1583 3316 1583 3324 1583 1574 3172Flt Permitted 0.95 1.00 0.95 1.00 1.00 1.00 0.94Satd. Flow (perm) 1583 3316 1583 3324 1667 1574 3046Peak-hour factor, PHF 0.96 0.96 0.96 0.96 0.96 0.96 0.96 0.96 0.96 0.96 0.96 0.96Adj. Flow (vph) 7 386 31 60 412 25 42 19 49 23 15 10RTOR Reduction (vph) 0 7 0 0 5 0 0 43 0 0 9 0Lane Group Flow (vph) 7 410 0 60 432 0 42 25 0 0 39 0Turn Type Prot NA Prot NA Perm NA Perm NAProtected Phases 7 4 3 8 2 6Permitted Phases 2 6Actuated Green, G (s) 0.7 9.5 2.1 10.9 3.6 3.6 3.6Effective Green, g (s) 0.7 9.5 2.1 10.9 3.6 3.6 3.6Actuated g/C Ratio 0.03 0.35 0.08 0.40 0.13 0.13 0.13Clearance Time (s) 4.0 4.0 4.0 4.0 4.0 4.0 4.0Vehicle Extension (s) 3.0 3.0 3.0 3.0 3.0 3.0 3.0Lane Grp Cap (vph) 40 1158 122 1332 220 208 403v/s Ratio Prot 0.00 0.12 c0.04 c0.13 0.02v/s Ratio Perm c0.03 0.01v/c Ratio 0.17 0.35 0.49 0.32 0.19 0.12 0.10Uniform Delay, d1 13.0 6.6 12.0 5.6 10.5 10.4 10.4Progression Factor 1.00 1.00 1.00 1.00 1.00 1.00 1.00Incremental Delay, d2 2.1 0.2 3.1 0.1 0.4 0.3 0.1Delay (s) 15.1 6.8 15.1 5.8 10.9 10.7 10.5Level of Service B A B A B B BApproach Delay (s) 6.9 6.9 10.8 10.5Approach LOS A A B B
Intersection SummaryHCM 2000 Control Delay 7.4 HCM 2000 Level of Service AHCM 2000 Volume to Capacity ratio 0.35Actuated Cycle Length (s) 27.2 Sum of lost time (s) 12.0Intersection Capacity Utilization 34.8% ICU Level of Service AAnalysis Period (min) 15c Critical Lane Group
Agenda item No. 3

Rialto Impact Fee Study Existing Conditions23: Cactus Ave & Casmalia St Timing Plan: PM Peak Hour
Synchro 7 - ReportPage 23
Movement EBL EBT EBR WBL WBT WBR NBL NBT NBR SBL SBT SBRLane ConfigurationsSign Control Stop Stop Stop StopVolume (vph) 19 37 52 13 19 5 70 170 25 7 117 19Peak Hour Factor 0.88 0.88 0.88 0.88 0.88 0.88 0.88 0.88 0.88 0.88 0.88 0.88Hourly flow rate (vph) 22 42 59 15 22 6 80 193 28 8 133 22
Direction, Lane # EB 1 WB 1 NB 1 NB 2 SB 1 SB 2Volume Total (vph) 123 42 176 125 74 88Volume Left (vph) 22 15 80 0 8 0Volume Right (vph) 59 6 0 28 0 22Hadj (s) -0.22 0.02 0.26 -0.13 0.09 -0.14Departure Headway (s) 4.8 5.2 5.4 5.0 5.3 5.1Degree Utilization, x 0.16 0.06 0.26 0.17 0.11 0.12Capacity (veh/h) 691 633 651 698 644 674Control Delay (s) 8.7 8.5 9.0 7.8 7.8 7.6Approach Delay (s) 8.7 8.5 8.5 7.7Approach LOS A A A A
Intersection SummaryDelay 8.4Level of Service AIntersection Capacity Utilization 29.4% ICU Level of Service AAnalysis Period (min) 15
Agenda item No. 3

Rialto Impact Fee Study Existing Conditions24: Cactus Ave & Easton St Timing Plan: PM Peak Hour
Synchro 7 - ReportPage 24
Movement EBL EBT EBR WBL WBT WBR NBL NBT NBR SBL SBT SBRLane ConfigurationsSign Control Stop Stop Stop StopVolume (vph) 9 81 131 43 44 29 98 230 35 25 153 8Peak Hour Factor 0.94 0.94 0.94 0.94 0.94 0.94 0.94 0.94 0.94 0.94 0.94 0.94Hourly flow rate (vph) 10 86 139 46 47 31 104 245 37 27 163 9
Direction, Lane # EB 1 WB 1 NB 1 NB 2 SB 1 SB 2Volume Total (vph) 235 123 227 160 108 90Volume Left (vph) 10 46 104 0 27 0Volume Right (vph) 139 31 0 37 0 9Hadj (s) -0.31 -0.04 0.26 -0.13 0.16 -0.03Departure Headway (s) 5.3 5.8 6.1 5.7 6.2 6.0Degree Utilization, x 0.35 0.20 0.38 0.25 0.19 0.15Capacity (veh/h) 630 565 568 603 536 553Control Delay (s) 11.1 10.2 11.6 9.4 9.5 8.9Approach Delay (s) 11.1 10.2 10.7 9.2Approach LOS B B B A
Intersection SummaryDelay 10.4Level of Service BIntersection Capacity Utilization 50.1% ICU Level of Service AAnalysis Period (min) 15
Agenda item No. 3

Rialto Impact Fee Study Existing Conditions25: Cactus Ave & Base Line Rd Timing Plan: PM Peak Hour
Synchro 7 - ReportPage 25
Movement EBL EBT EBR WBL WBT WBR NBL NBT NBR SBL SBT SBRLane ConfigurationsVolume (vph) 75 432 94 101 375 71 64 240 90 74 210 60Ideal Flow (vphpl) 1700 1800 1800 1700 1800 1800 1700 1800 1800 1700 1800 1800Total Lost time (s) 4.0 4.0 4.0 4.0 4.0 4.0 4.0 4.0Lane Util. Factor 1.00 0.95 1.00 0.95 1.00 0.95 1.00 0.95Frt 1.00 0.97 1.00 0.98 1.00 0.96 1.00 0.97Flt Protected 0.95 1.00 0.95 1.00 0.95 1.00 0.95 1.00Satd. Flow (prot) 1583 3263 1583 3273 1583 3216 1583 3241Flt Permitted 0.95 1.00 0.95 1.00 0.95 1.00 0.95 1.00Satd. Flow (perm) 1583 3263 1583 3273 1583 3216 1583 3241Peak-hour factor, PHF 0.93 0.93 0.93 0.93 0.93 0.93 0.93 0.93 0.93 0.93 0.93 0.93Adj. Flow (vph) 81 465 101 109 403 76 69 258 97 80 226 65RTOR Reduction (vph) 0 20 0 0 18 0 0 34 0 0 23 0Lane Group Flow (vph) 81 546 0 109 461 0 69 321 0 80 268 0Turn Type Prot NA Prot NA Prot NA Prot NAProtected Phases 7 4 3 8 5 2 1 6Permitted PhasesActuated Green, G (s) 7.5 19.2 8.9 20.6 7.0 26.7 7.5 27.2Effective Green, g (s) 7.5 19.2 8.9 20.6 7.0 26.7 7.5 27.2Actuated g/C Ratio 0.10 0.25 0.11 0.26 0.09 0.34 0.10 0.35Clearance Time (s) 4.0 4.0 4.0 4.0 4.0 4.0 4.0 4.0Vehicle Extension (s) 3.0 3.0 3.0 3.0 3.0 3.0 3.0 3.0Lane Grp Cap (vph) 151 800 179 861 141 1096 151 1125v/s Ratio Prot 0.05 c0.17 c0.07 0.14 0.04 c0.10 c0.05 0.08v/s Ratio Permv/c Ratio 0.54 0.68 0.61 0.54 0.49 0.29 0.53 0.24Uniform Delay, d1 33.7 26.8 33.0 24.7 33.9 18.9 33.7 18.2Progression Factor 1.00 1.00 1.00 1.00 1.00 1.00 1.00 1.00Incremental Delay, d2 3.6 2.4 5.8 0.6 2.7 0.7 3.3 0.5Delay (s) 37.4 29.2 38.8 25.4 36.6 19.6 37.1 18.7Level of Service D C D C D B D BApproach Delay (s) 30.2 27.9 22.3 22.6Approach LOS C C C C
Intersection SummaryHCM 2000 Control Delay 26.5 HCM 2000 Level of Service CHCM 2000 Volume to Capacity ratio 0.49Actuated Cycle Length (s) 78.3 Sum of lost time (s) 16.0Intersection Capacity Utilization 50.0% ICU Level of Service AAnalysis Period (min) 15c Critical Lane Group
Agenda item No. 3

Rialto Impact Fee Study Existing Conditions26: Cactus Ave & Foothill Blvd Timing Plan: PM Peak Hour
Synchro 7 - ReportPage 26
Movement EBL EBT EBR WBL WBT WBR NBL NBT NBR SBL SBT SBRLane ConfigurationsVolume (vph) 57 741 43 89 668 111 84 328 139 67 221 33Ideal Flow (vphpl) 1700 1800 1800 1700 1800 1800 1700 1800 1800 1700 1800 1800Total Lost time (s) 4.0 4.0 4.0 4.0 4.0 4.0 4.0 4.0 4.0Lane Util. Factor 1.00 0.91 1.00 0.95 1.00 1.00 0.95 1.00 0.95Frt 1.00 0.99 1.00 1.00 0.85 1.00 0.96 1.00 0.98Flt Protected 0.95 1.00 0.95 1.00 1.00 0.95 1.00 0.95 1.00Satd. Flow (prot) 1583 4778 1583 3353 1500 1583 3203 1583 3288Flt Permitted 0.95 1.00 0.95 1.00 1.00 0.59 1.00 0.44 1.00Satd. Flow (perm) 1583 4778 1583 3353 1500 983 3203 729 3288Peak-hour factor, PHF 0.97 0.97 0.97 0.97 0.97 0.97 0.97 0.97 0.97 0.97 0.97 0.97Adj. Flow (vph) 59 764 44 92 689 114 87 338 143 69 228 34RTOR Reduction (vph) 0 7 0 0 0 77 0 39 0 0 10 0Lane Group Flow (vph) 59 801 0 92 689 37 87 442 0 69 252 0Turn Type Prot NA Prot NA Perm Perm NA Perm NAProtected Phases 7 4 3 8 2 6Permitted Phases 8 2 6Actuated Green, G (s) 5.4 22.4 8.3 25.3 25.3 35.9 35.9 35.9 35.9Effective Green, g (s) 5.4 22.4 8.3 25.3 25.3 35.9 35.9 35.9 35.9Actuated g/C Ratio 0.07 0.28 0.11 0.32 0.32 0.46 0.46 0.46 0.46Clearance Time (s) 4.0 4.0 4.0 4.0 4.0 4.0 4.0 4.0 4.0Vehicle Extension (s) 3.0 3.0 3.0 3.0 3.0 3.0 3.0 3.0 3.0Lane Grp Cap (vph) 108 1361 167 1079 482 448 1462 332 1501v/s Ratio Prot 0.04 0.17 c0.06 c0.21 c0.14 0.08v/s Ratio Perm 0.02 0.09 0.09v/c Ratio 0.55 0.59 0.55 0.64 0.08 0.19 0.30 0.21 0.17Uniform Delay, d1 35.4 24.1 33.4 22.7 18.5 12.7 13.5 12.8 12.6Progression Factor 1.00 1.00 1.00 1.00 1.00 1.00 1.00 1.00 1.00Incremental Delay, d2 5.5 0.7 3.9 1.3 0.1 1.0 0.5 1.4 0.2Delay (s) 41.0 24.8 37.3 24.0 18.6 13.7 14.0 14.2 12.8Level of Service D C D C B B B B BApproach Delay (s) 25.9 24.7 13.9 13.1Approach LOS C C B B
Intersection SummaryHCM 2000 Control Delay 21.3 HCM 2000 Level of Service CHCM 2000 Volume to Capacity ratio 0.46Actuated Cycle Length (s) 78.6 Sum of lost time (s) 12.0Intersection Capacity Utilization 54.8% ICU Level of Service AAnalysis Period (min) 15c Critical Lane Group
Agenda item No. 3
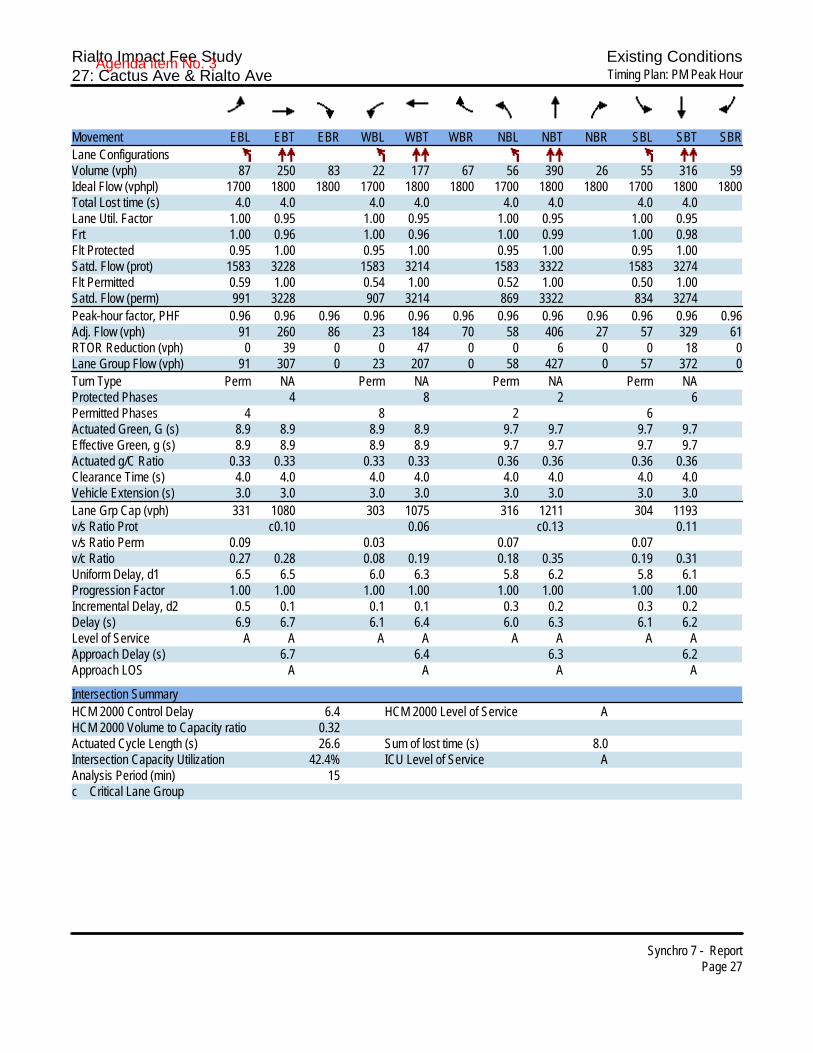
Rialto Impact Fee Study Existing Conditions27: Cactus Ave & Rialto Ave Timing Plan: PM Peak Hour
Synchro 7 - ReportPage 27
Movement EBL EBT EBR WBL WBT WBR NBL NBT NBR SBL SBT SBRLane ConfigurationsVolume (vph) 87 250 83 22 177 67 56 390 26 55 316 59Ideal Flow (vphpl) 1700 1800 1800 1700 1800 1800 1700 1800 1800 1700 1800 1800Total Lost time (s) 4.0 4.0 4.0 4.0 4.0 4.0 4.0 4.0Lane Util. Factor 1.00 0.95 1.00 0.95 1.00 0.95 1.00 0.95Frt 1.00 0.96 1.00 0.96 1.00 0.99 1.00 0.98Flt Protected 0.95 1.00 0.95 1.00 0.95 1.00 0.95 1.00Satd. Flow (prot) 1583 3228 1583 3214 1583 3322 1583 3274Flt Permitted 0.59 1.00 0.54 1.00 0.52 1.00 0.50 1.00Satd. Flow (perm) 991 3228 907 3214 869 3322 834 3274Peak-hour factor, PHF 0.96 0.96 0.96 0.96 0.96 0.96 0.96 0.96 0.96 0.96 0.96 0.96Adj. Flow (vph) 91 260 86 23 184 70 58 406 27 57 329 61RTOR Reduction (vph) 0 39 0 0 47 0 0 6 0 0 18 0Lane Group Flow (vph) 91 307 0 23 207 0 58 427 0 57 372 0Turn Type Perm NA Perm NA Perm NA Perm NAProtected Phases 4 8 2 6Permitted Phases 4 8 2 6Actuated Green, G (s) 8.9 8.9 8.9 8.9 9.7 9.7 9.7 9.7Effective Green, g (s) 8.9 8.9 8.9 8.9 9.7 9.7 9.7 9.7Actuated g/C Ratio 0.33 0.33 0.33 0.33 0.36 0.36 0.36 0.36Clearance Time (s) 4.0 4.0 4.0 4.0 4.0 4.0 4.0 4.0Vehicle Extension (s) 3.0 3.0 3.0 3.0 3.0 3.0 3.0 3.0Lane Grp Cap (vph) 331 1080 303 1075 316 1211 304 1193v/s Ratio Prot c0.10 0.06 c0.13 0.11v/s Ratio Perm 0.09 0.03 0.07 0.07v/c Ratio 0.27 0.28 0.08 0.19 0.18 0.35 0.19 0.31Uniform Delay, d1 6.5 6.5 6.0 6.3 5.8 6.2 5.8 6.1Progression Factor 1.00 1.00 1.00 1.00 1.00 1.00 1.00 1.00Incremental Delay, d2 0.5 0.1 0.1 0.1 0.3 0.2 0.3 0.2Delay (s) 6.9 6.7 6.1 6.4 6.0 6.3 6.1 6.2Level of Service A A A A A A A AApproach Delay (s) 6.7 6.4 6.3 6.2Approach LOS A A A A
Intersection SummaryHCM 2000 Control Delay 6.4 HCM 2000 Level of Service AHCM 2000 Volume to Capacity ratio 0.32Actuated Cycle Length (s) 26.6 Sum of lost time (s) 8.0Intersection Capacity Utilization 42.4% ICU Level of Service AAnalysis Period (min) 15c Critical Lane Group
Agenda item No. 3

Rialto Impact Fee Study Existing Conditions28: Cactus Ave & Merrill Ave Timing Plan: PM Peak Hour
Synchro 7 - ReportPage 28
Movement EBL EBT EBR WBL WBT WBR NBL NBT NBR SBL SBT SBRLane ConfigurationsVolume (vph) 60 280 30 30 205 51 21 368 25 61 305 54Ideal Flow (vphpl) 1700 1800 1800 1700 1800 1800 1700 1800 1800 1700 1800 1800Total Lost time (s) 4.0 4.0 4.0 4.0 4.0 4.0 4.0 4.0Lane Util. Factor 1.00 0.95 1.00 0.95 1.00 0.95 1.00 0.95Frt 1.00 0.99 1.00 0.97 1.00 0.99 1.00 0.98Flt Protected 0.95 1.00 0.95 1.00 0.95 1.00 0.95 1.00Satd. Flow (prot) 1583 3304 1583 3253 1583 3320 1583 3278Flt Permitted 0.58 1.00 0.55 1.00 0.95 1.00 0.95 1.00Satd. Flow (perm) 974 3304 921 3253 1583 3320 1583 3278Peak-hour factor, PHF 0.94 0.94 0.94 0.94 0.94 0.94 0.94 0.94 0.94 0.94 0.94 0.94Adj. Flow (vph) 64 298 32 32 218 54 22 391 27 65 324 57RTOR Reduction (vph) 0 9 0 0 24 0 0 5 0 0 16 0Lane Group Flow (vph) 64 321 0 32 248 0 22 413 0 65 365 0Turn Type Perm NA Perm NA Prot NA Prot NAProtected Phases 4 8 5 2 1 6Permitted Phases 4 8Actuated Green, G (s) 10.4 10.4 10.4 10.4 1.1 12.9 4.1 15.9Effective Green, g (s) 10.4 10.4 10.4 10.4 1.1 12.9 4.1 15.9Actuated g/C Ratio 0.26 0.26 0.26 0.26 0.03 0.33 0.10 0.40Clearance Time (s) 4.0 4.0 4.0 4.0 4.0 4.0 4.0 4.0Vehicle Extension (s) 3.0 3.0 3.0 3.0 3.0 3.0 3.0 3.0Lane Grp Cap (vph) 257 872 243 858 44 1087 164 1322v/s Ratio Prot c0.10 0.08 0.01 c0.12 c0.04 c0.11v/s Ratio Perm 0.07 0.03v/c Ratio 0.25 0.37 0.13 0.29 0.50 0.38 0.40 0.28Uniform Delay, d1 11.4 11.8 11.1 11.6 18.9 10.2 16.5 7.9Progression Factor 1.00 1.00 1.00 1.00 1.00 1.00 1.00 1.00Incremental Delay, d2 0.5 0.3 0.2 0.2 8.7 0.2 1.6 0.1Delay (s) 11.9 12.1 11.3 11.7 27.5 10.4 18.1 8.0Level of Service B B B B C B B AApproach Delay (s) 12.1 11.7 11.3 9.5Approach LOS B B B A
Intersection SummaryHCM 2000 Control Delay 11.0 HCM 2000 Level of Service BHCM 2000 Volume to Capacity ratio 0.36Actuated Cycle Length (s) 39.4 Sum of lost time (s) 12.0Intersection Capacity Utilization 41.2% ICU Level of Service AAnalysis Period (min) 15c Critical Lane Group
Agenda item No. 3

Rialto Impact Fee Study Existing Conditions29: Cactus Ave & Randall Ave Timing Plan: PM Peak Hour
Synchro 7 - ReportPage 29
Movement EBL EBT EBR WBL WBT WBR NBL NBT NBR SBL SBT SBRLane ConfigurationsVolume (vph) 6 102 30 40 131 37 33 294 31 35 376 10Ideal Flow (vphpl) 1700 1800 1800 1700 1800 1800 1700 1800 1800 1700 1800 1800Total Lost time (s) 4.0 4.0 4.0 4.0 4.0 4.0 4.0 4.0Lane Util. Factor 1.00 1.00 1.00 1.00 1.00 0.95 1.00 0.95Frt 1.00 0.97 1.00 0.97 1.00 0.99 1.00 1.00Flt Protected 0.95 1.00 0.95 1.00 0.95 1.00 0.95 1.00Satd. Flow (prot) 1583 1705 1583 1706 1583 3305 1583 3340Flt Permitted 0.52 1.00 0.62 1.00 0.51 1.00 0.54 1.00Satd. Flow (perm) 861 1705 1031 1706 848 3305 904 3340Peak-hour factor, PHF 0.93 0.93 0.93 0.93 0.93 0.93 0.93 0.93 0.93 0.93 0.93 0.93Adj. Flow (vph) 6 110 32 43 141 40 35 316 33 38 404 11RTOR Reduction (vph) 0 16 0 0 16 0 0 4 0 0 1 0Lane Group Flow (vph) 6 126 0 43 165 0 35 345 0 38 414 0Turn Type Perm NA Perm NA Perm NA Perm NAProtected Phases 4 8 2 6Permitted Phases 4 8 2 6Actuated Green, G (s) 11.8 11.8 11.8 11.8 48.6 48.6 48.6 48.6Effective Green, g (s) 11.8 11.8 11.8 11.8 48.6 48.6 48.6 48.6Actuated g/C Ratio 0.17 0.17 0.17 0.17 0.71 0.71 0.71 0.71Clearance Time (s) 4.0 4.0 4.0 4.0 4.0 4.0 4.0 4.0Vehicle Extension (s) 3.0 3.0 3.0 3.0 3.0 3.0 3.0 3.0Lane Grp Cap (vph) 148 294 177 294 602 2348 642 2373v/s Ratio Prot 0.07 c0.10 0.10 c0.12v/s Ratio Perm 0.01 0.04 0.04 0.04v/c Ratio 0.04 0.43 0.24 0.56 0.06 0.15 0.06 0.17Uniform Delay, d1 23.6 25.3 24.4 25.9 3.0 3.2 3.0 3.3Progression Factor 1.00 1.00 1.00 1.00 1.00 1.00 1.00 1.00Incremental Delay, d2 0.1 1.0 0.7 2.5 0.2 0.1 0.2 0.2Delay (s) 23.7 26.3 25.2 28.4 3.2 3.3 3.2 3.4Level of Service C C C C A A A AApproach Delay (s) 26.2 27.8 3.3 3.4Approach LOS C C A A
Intersection SummaryHCM 2000 Control Delay 10.7 HCM 2000 Level of Service BHCM 2000 Volume to Capacity ratio 0.25Actuated Cycle Length (s) 68.4 Sum of lost time (s) 8.0Intersection Capacity Utilization 41.0% ICU Level of Service AAnalysis Period (min) 15c Critical Lane Group
Agenda item No. 3

Rialto Impact Fee Study Existing Conditions30: Cactus Ave & San Bernardino Ave/San Bernardinio Ave Timing Plan: PM Peak Hour
Synchro 7 - ReportPage 30
Movement EBL EBT EBR WBL WBT WBR NBL NBT NBR SBL SBT SBRLane ConfigurationsSign Control Stop Stop Stop StopVolume (vph) 26 256 13 37 198 5 5 118 61 14 168 35Peak Hour Factor 0.92 0.92 0.92 0.92 0.92 0.92 0.92 0.92 0.92 0.92 0.92 0.92Hourly flow rate (vph) 28 278 14 40 215 5 5 128 66 15 183 38
Direction, Lane # EB 1 EB 2 WB 1 WB 2 NB 1 NB 2 SB 1 SB 2Volume Total (vph) 167 153 148 113 5 195 15 221Volume Left (vph) 28 0 40 0 5 0 15 0Volume Right (vph) 0 14 0 5 0 66 0 38Hadj (s) 0.12 -0.03 0.17 0.00 0.53 -0.20 0.53 -0.09Departure Headway (s) 6.3 6.2 6.4 6.3 7.0 6.3 6.9 6.3Degree Utilization, x 0.29 0.26 0.26 0.20 0.01 0.34 0.03 0.39Capacity (veh/h) 539 552 526 539 481 541 486 539Control Delay (s) 10.7 10.1 10.5 9.6 8.9 11.2 8.9 12.0Approach Delay (s) 10.4 10.1 11.2 11.8Approach LOS B B B B
Intersection SummaryDelay 10.8Level of Service BIntersection Capacity Utilization 38.8% ICU Level of Service AAnalysis Period (min) 15
Agenda item No. 3

Rialto Impact Fee Study Existing Conditions31: Cactus Ave & Valley Blvd Timing Plan: PM Peak Hour
Synchro 7 - ReportPage 31
Movement EBL EBT EBR WBL WBT WBR NBL NBT NBR SBL SBT SBRLane ConfigurationsVolume (vph) 93 468 6 1 392 209 5 1 5 185 1 66Ideal Flow (vphpl) 1700 1800 1800 1700 1800 1800 1700 1800 1800 1700 1800 1800Total Lost time (s) 4.0 4.0 4.0 4.0 4.0 4.0 4.0 4.0 4.0 4.0 4.0Lane Util. Factor 1.00 0.95 1.00 1.00 1.00 1.00 1.00 1.00 1.00 1.00 1.00Frt 1.00 1.00 0.85 1.00 1.00 0.85 1.00 0.87 1.00 1.00 0.85Flt Protected 0.95 1.00 1.00 0.95 1.00 1.00 0.95 1.00 0.95 1.00 1.00Satd. Flow (prot) 1583 3353 1500 1583 1765 1500 1583 1538 1583 1765 1500Flt Permitted 0.43 1.00 1.00 0.46 1.00 1.00 0.76 1.00 0.75 1.00 1.00Satd. Flow (perm) 715 3353 1500 766 1765 1500 1262 1538 1255 1765 1500Peak-hour factor, PHF 0.90 0.90 0.90 0.90 0.90 0.90 0.90 0.90 0.90 0.90 0.90 0.90Adj. Flow (vph) 103 520 7 1 436 232 6 1 6 206 1 73RTOR Reduction (vph) 0 0 4 0 0 128 0 4 0 0 0 48Lane Group Flow (vph) 103 520 3 1 436 104 6 3 0 206 1 25Turn Type Perm NA Perm Perm NA Perm Perm NA Perm NA PermProtected Phases 4 8 2 6Permitted Phases 4 4 8 8 2 6 6Actuated Green, G (s) 17.2 17.2 17.2 17.2 17.2 17.2 13.0 13.0 13.0 13.0 13.0Effective Green, g (s) 17.2 17.2 17.2 17.2 17.2 17.2 13.0 13.0 13.0 13.0 13.0Actuated g/C Ratio 0.45 0.45 0.45 0.45 0.45 0.45 0.34 0.34 0.34 0.34 0.34Clearance Time (s) 4.0 4.0 4.0 4.0 4.0 4.0 4.0 4.0 4.0 4.0 4.0Vehicle Extension (s) 3.0 3.0 3.0 3.0 3.0 3.0 3.0 3.0 3.0 3.0 3.0Lane Grp Cap (vph) 321 1509 675 344 794 675 429 523 427 600 510v/s Ratio Prot 0.16 c0.25 0.00 0.00v/s Ratio Perm 0.14 0.00 0.00 0.07 0.00 c0.16 0.02v/c Ratio 0.32 0.34 0.00 0.00 0.55 0.15 0.01 0.01 0.48 0.00 0.05Uniform Delay, d1 6.7 6.8 5.8 5.8 7.7 6.2 8.4 8.3 9.9 8.3 8.5Progression Factor 1.00 1.00 1.00 1.00 1.00 1.00 1.00 1.00 1.00 1.00 1.00Incremental Delay, d2 0.6 0.1 0.0 0.0 0.8 0.1 0.0 0.0 0.9 0.0 0.0Delay (s) 7.3 7.0 5.8 5.8 8.4 6.3 8.4 8.3 10.8 8.3 8.5Level of Service A A A A A A A A B A AApproach Delay (s) 7.0 7.7 8.3 10.2Approach LOS A A A B
Intersection SummaryHCM 2000 Control Delay 7.9 HCM 2000 Level of Service AHCM 2000 Volume to Capacity ratio 0.52Actuated Cycle Length (s) 38.2 Sum of lost time (s) 8.0Intersection Capacity Utilization 55.7% ICU Level of Service BAnalysis Period (min) 15c Critical Lane Group
Agenda item No. 3
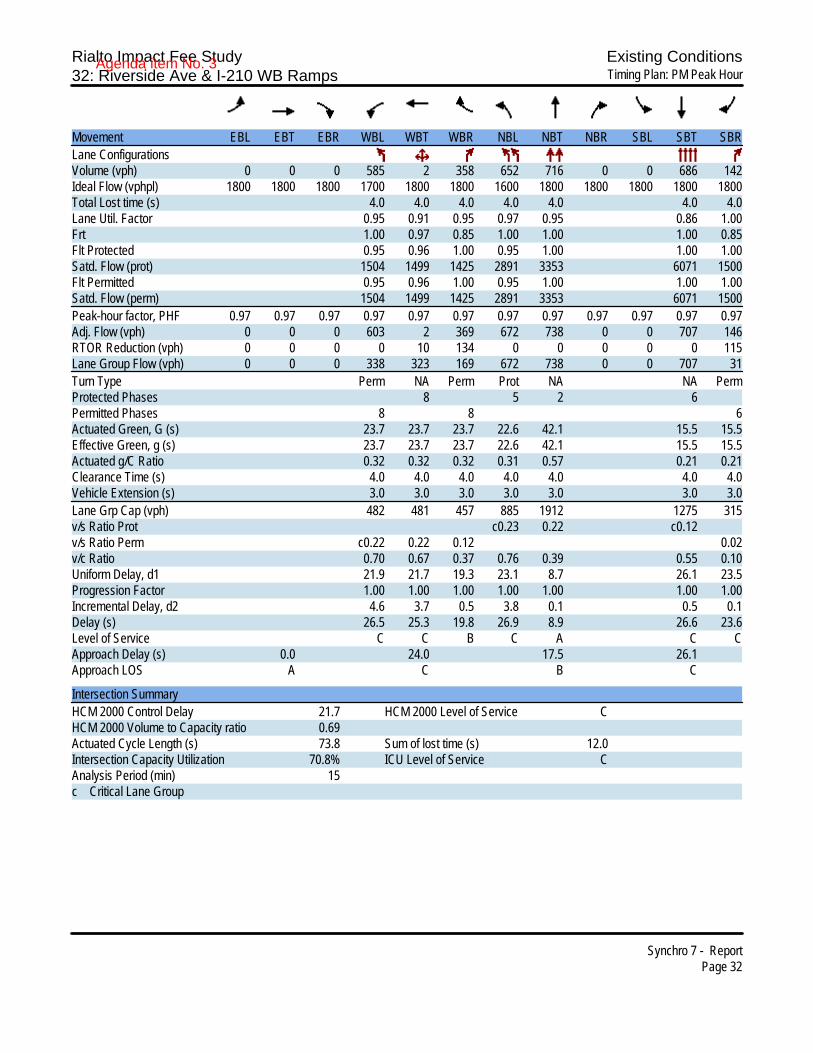
Rialto Impact Fee Study Existing Conditions32: Riverside Ave & I-210 WB Ramps Timing Plan: PM Peak Hour
Synchro 7 - ReportPage 32
Movement EBL EBT EBR WBL WBT WBR NBL NBT NBR SBL SBT SBRLane ConfigurationsVolume (vph) 0 0 0 585 2 358 652 716 0 0 686 142Ideal Flow (vphpl) 1800 1800 1800 1700 1800 1800 1600 1800 1800 1800 1800 1800Total Lost time (s) 4.0 4.0 4.0 4.0 4.0 4.0 4.0Lane Util. Factor 0.95 0.91 0.95 0.97 0.95 0.86 1.00Frt 1.00 0.97 0.85 1.00 1.00 1.00 0.85Flt Protected 0.95 0.96 1.00 0.95 1.00 1.00 1.00Satd. Flow (prot) 1504 1499 1425 2891 3353 6071 1500Flt Permitted 0.95 0.96 1.00 0.95 1.00 1.00 1.00Satd. Flow (perm) 1504 1499 1425 2891 3353 6071 1500Peak-hour factor, PHF 0.97 0.97 0.97 0.97 0.97 0.97 0.97 0.97 0.97 0.97 0.97 0.97Adj. Flow (vph) 0 0 0 603 2 369 672 738 0 0 707 146RTOR Reduction (vph) 0 0 0 0 10 134 0 0 0 0 0 115Lane Group Flow (vph) 0 0 0 338 323 169 672 738 0 0 707 31Turn Type Perm NA Perm Prot NA NA PermProtected Phases 8 5 2 6Permitted Phases 8 8 6Actuated Green, G (s) 23.7 23.7 23.7 22.6 42.1 15.5 15.5Effective Green, g (s) 23.7 23.7 23.7 22.6 42.1 15.5 15.5Actuated g/C Ratio 0.32 0.32 0.32 0.31 0.57 0.21 0.21Clearance Time (s) 4.0 4.0 4.0 4.0 4.0 4.0 4.0Vehicle Extension (s) 3.0 3.0 3.0 3.0 3.0 3.0 3.0Lane Grp Cap (vph) 482 481 457 885 1912 1275 315v/s Ratio Prot c0.23 0.22 c0.12v/s Ratio Perm c0.22 0.22 0.12 0.02v/c Ratio 0.70 0.67 0.37 0.76 0.39 0.55 0.10Uniform Delay, d1 21.9 21.7 19.3 23.1 8.7 26.1 23.5Progression Factor 1.00 1.00 1.00 1.00 1.00 1.00 1.00Incremental Delay, d2 4.6 3.7 0.5 3.8 0.1 0.5 0.1Delay (s) 26.5 25.3 19.8 26.9 8.9 26.6 23.6Level of Service C C B C A C CApproach Delay (s) 0.0 24.0 17.5 26.1Approach LOS A C B C
Intersection SummaryHCM 2000 Control Delay 21.7 HCM 2000 Level of Service CHCM 2000 Volume to Capacity ratio 0.69Actuated Cycle Length (s) 73.8 Sum of lost time (s) 12.0Intersection Capacity Utilization 70.8% ICU Level of Service CAnalysis Period (min) 15c Critical Lane Group
Agenda item No. 3

Rialto Impact Fee Study Existing Conditions33: Riverside Ave & I-210 EB Ramps Timing Plan: PM Peak Hour
Synchro 7 - ReportPage 33
Movement EBL EBT EBR WBL WBT WBR NBL NBT NBR SBL SBT SBRLane ConfigurationsVolume (vph) 180 1 703 0 0 0 0 1188 534 312 959 0Ideal Flow (vphpl) 1700 1800 1800 1800 1800 1800 1800 1800 1800 1600 1800 1800Total Lost time (s) 4.0 4.0 4.0 4.0 4.0 4.0 4.0Lane Util. Factor 1.00 0.95 0.95 0.86 1.00 0.97 0.95Frt 1.00 0.85 0.85 1.00 0.85 1.00 1.00Flt Protected 0.95 1.00 1.00 1.00 1.00 0.95 1.00Satd. Flow (prot) 1583 1426 1425 6071 1500 2891 3353Flt Permitted 0.95 1.00 1.00 1.00 1.00 0.95 1.00Satd. Flow (perm) 1583 1426 1425 6071 1500 2891 3353Peak-hour factor, PHF 0.98 0.98 0.98 0.98 0.98 0.98 0.98 0.98 0.98 0.98 0.98 0.98Adj. Flow (vph) 184 1 717 0 0 0 0 1212 545 318 979 0RTOR Reduction (vph) 0 83 83 0 0 0 0 0 334 0 0 0Lane Group Flow (vph) 184 277 275 0 0 0 0 1212 211 318 979 0Turn Type Perm NA Perm NA Perm Prot NAProtected Phases 4 2 1 6Permitted Phases 4 4 2Actuated Green, G (s) 21.3 21.3 21.3 29.3 29.3 13.2 46.5Effective Green, g (s) 21.3 21.3 21.3 29.3 29.3 13.2 46.5Actuated g/C Ratio 0.28 0.28 0.28 0.39 0.39 0.17 0.61Clearance Time (s) 4.0 4.0 4.0 4.0 4.0 4.0 4.0Vehicle Extension (s) 3.0 3.0 3.0 3.0 3.0 3.0 3.0Lane Grp Cap (vph) 444 400 400 2346 579 503 2056v/s Ratio Prot c0.19 0.20 c0.11 c0.29v/s Ratio Perm 0.12 0.19 0.14v/c Ratio 0.41 0.69 0.69 0.52 0.36 0.63 0.48Uniform Delay, d1 22.2 24.3 24.3 17.8 16.6 29.0 8.0Progression Factor 1.00 1.00 1.00 1.00 1.00 1.00 1.00Incremental Delay, d2 0.6 5.1 4.8 0.2 0.4 2.6 0.2Delay (s) 22.8 29.4 29.1 18.0 17.0 31.6 8.2Level of Service C C C B B C AApproach Delay (s) 27.9 0.0 17.7 13.9Approach LOS C A B B
Intersection SummaryHCM 2000 Control Delay 18.8 HCM 2000 Level of Service BHCM 2000 Volume to Capacity ratio 0.60Actuated Cycle Length (s) 75.8 Sum of lost time (s) 12.0Intersection Capacity Utilization 70.8% ICU Level of Service CAnalysis Period (min) 15c Critical Lane Group
Agenda item No. 3

Rialto Impact Fee Study Existing Conditions34: Riverside Ave & Easton St Timing Plan: PM Peak Hour
Synchro 7 - ReportPage 34
Movement EBL EBT EBR WBL WBT WBR NBL NBT NBR SBL SBT SBRLane ConfigurationsVolume (vph) 272 95 35 117 93 279 86 1171 139 339 1103 220Ideal Flow (vphpl) 1700 1800 1800 1700 1800 1800 1700 1800 1800 1600 1800 1800Total Lost time (s) 4.0 4.0 4.0 4.0 4.0 4.0 4.0 4.0 4.0 4.0Lane Util. Factor 1.00 1.00 1.00 1.00 1.00 1.00 0.91 0.97 0.95 1.00Frt 1.00 0.96 1.00 1.00 0.85 1.00 0.98 1.00 1.00 0.85Flt Protected 0.95 1.00 0.95 1.00 1.00 0.95 1.00 0.95 1.00 1.00Satd. Flow (prot) 1583 1693 1583 1765 1500 1583 4741 2891 3353 1500Flt Permitted 0.95 1.00 0.95 1.00 1.00 0.95 1.00 0.95 1.00 1.00Satd. Flow (perm) 1583 1693 1583 1765 1500 1583 4741 2891 3353 1500Peak-hour factor, PHF 0.98 0.98 0.98 0.98 0.98 0.98 0.98 0.98 0.98 0.98 0.98 0.98Adj. Flow (vph) 278 97 36 119 95 285 88 1195 142 346 1126 224RTOR Reduction (vph) 0 14 0 0 0 235 0 14 0 0 0 98Lane Group Flow (vph) 278 119 0 119 95 50 88 1323 0 346 1126 126Turn Type Prot NA Prot NA Perm Prot NA Prot NA PermProtected Phases 7 4 3 8 5 2 1 6Permitted Phases 8 6Actuated Green, G (s) 19.5 18.6 11.4 10.5 10.5 6.1 31.1 14.2 39.2 39.2Effective Green, g (s) 19.5 18.6 11.4 10.5 10.5 6.1 31.1 14.2 39.2 39.2Actuated g/C Ratio 0.21 0.20 0.12 0.12 0.12 0.07 0.34 0.16 0.43 0.43Clearance Time (s) 4.0 4.0 4.0 4.0 4.0 4.0 4.0 4.0 4.0 4.0Vehicle Extension (s) 3.0 3.0 3.0 3.0 3.0 3.0 3.0 3.0 3.0 3.0Lane Grp Cap (vph) 338 344 197 202 172 105 1614 449 1439 644v/s Ratio Prot c0.18 0.07 0.08 c0.05 0.06 0.28 c0.12 c0.34v/s Ratio Perm 0.03 0.08v/c Ratio 0.82 0.34 0.60 0.47 0.29 0.84 0.82 0.77 0.78 0.20Uniform Delay, d1 34.2 31.1 37.8 37.8 37.0 42.1 27.5 37.0 22.4 16.2Progression Factor 1.00 1.00 1.00 1.00 1.00 1.00 1.00 1.00 1.00 1.00Incremental Delay, d2 14.8 0.6 5.1 1.7 1.0 41.2 3.4 8.0 2.9 0.2Delay (s) 49.1 31.7 43.0 39.5 38.0 83.4 30.9 45.0 25.2 16.4Level of Service D C D D D F C D C BApproach Delay (s) 43.5 39.4 34.2 28.1Approach LOS D D C C
Intersection SummaryHCM 2000 Control Delay 33.2 HCM 2000 Level of Service CHCM 2000 Volume to Capacity ratio 0.77Actuated Cycle Length (s) 91.3 Sum of lost time (s) 16.0Intersection Capacity Utilization 74.0% ICU Level of Service DAnalysis Period (min) 15c Critical Lane Group
Agenda item No. 3

Rialto Impact Fee Study Existing Conditions35: Riverside Ave & Base Line Rd Timing Plan: PM Peak Hour
Synchro 7 - ReportPage 35
Movement EBL EBT EBR WBL WBT WBR NBL NBT NBR SBL SBT SBRLane ConfigurationsVolume (vph) 154 485 69 122 541 147 112 592 75 208 644 79Ideal Flow (vphpl) 1700 1800 1800 1700 1800 1800 1700 1800 1800 1700 1800 1800Total Lost time (s) 4.0 4.0 4.0 4.0 4.0 4.0 4.0 4.0Lane Util. Factor 1.00 0.95 1.00 0.91 1.00 0.95 1.00 0.95Frt 1.00 0.98 1.00 0.97 1.00 0.98 1.00 0.98Flt Protected 0.95 1.00 0.95 1.00 0.95 1.00 0.95 1.00Satd. Flow (prot) 1583 3290 1583 4663 1583 3297 1583 3298Flt Permitted 0.95 1.00 0.95 1.00 0.95 1.00 0.95 1.00Satd. Flow (perm) 1583 3290 1583 4663 1583 3297 1583 3298Peak-hour factor, PHF 0.97 0.97 0.97 0.97 0.97 0.97 0.97 0.97 0.97 0.97 0.97 0.97Adj. Flow (vph) 159 500 71 126 558 152 115 610 77 214 664 81RTOR Reduction (vph) 0 11 0 0 49 0 0 10 0 0 9 0Lane Group Flow (vph) 159 560 0 126 661 0 115 677 0 214 736 0Turn Type Prot NA Prot NA Prot NA Prot NAProtected Phases 7 4 3 8 5 2 1 6Permitted PhasesActuated Green, G (s) 13.4 20.0 11.4 18.0 11.4 30.0 16.7 35.3Effective Green, g (s) 13.4 20.0 11.4 18.0 11.4 30.0 16.7 35.3Actuated g/C Ratio 0.14 0.21 0.12 0.19 0.12 0.32 0.18 0.38Clearance Time (s) 4.0 4.0 4.0 4.0 4.0 4.0 4.0 4.0Vehicle Extension (s) 3.0 3.0 3.0 3.0 3.0 3.0 3.0 3.0Lane Grp Cap (vph) 225 699 191 891 191 1051 280 1237v/s Ratio Prot c0.10 c0.17 0.08 0.14 0.07 0.21 c0.14 c0.22v/s Ratio Permv/c Ratio 0.71 0.80 0.66 0.74 0.60 0.64 0.76 0.60Uniform Delay, d1 38.5 35.2 39.5 35.9 39.2 27.5 36.8 23.7Progression Factor 1.00 1.00 1.00 1.00 1.00 1.00 1.00 1.00Incremental Delay, d2 9.7 6.6 8.0 3.4 5.3 3.0 11.7 2.1Delay (s) 48.2 41.7 47.5 39.2 44.5 30.5 48.5 25.8Level of Service D D D D D C D CApproach Delay (s) 43.1 40.5 32.5 30.8Approach LOS D D C C
Intersection SummaryHCM 2000 Control Delay 36.4 HCM 2000 Level of Service DHCM 2000 Volume to Capacity ratio 0.73Actuated Cycle Length (s) 94.1 Sum of lost time (s) 16.0Intersection Capacity Utilization 70.0% ICU Level of Service CAnalysis Period (min) 15c Critical Lane Group
Agenda item No. 3

Rialto Impact Fee Study Existing Conditions36: Riverside Ave & Foothill Blvd Timing Plan: PM Peak Hour
Synchro 7 - ReportPage 36
Movement EBL EBT EBR WBL WBT WBR NBL NBT NBR SBL SBT SBRLane ConfigurationsVolume (vph) 140 628 84 89 645 153 199 581 163 240 420 118Ideal Flow (vphpl) 1700 1800 1800 1700 1800 1800 1700 1800 1800 1700 1800 1800Total Lost time (s) 4.0 4.0 4.0 4.0 4.0 4.0 4.0 4.0 4.0Lane Util. Factor 1.00 0.91 1.00 0.91 1.00 0.95 1.00 1.00 0.95Frt 1.00 0.98 1.00 0.97 1.00 1.00 0.85 1.00 0.97Flt Protected 0.95 1.00 0.95 1.00 0.95 1.00 1.00 0.95 1.00Satd. Flow (prot) 1583 4732 1583 4679 1583 3353 1500 1583 3243Flt Permitted 0.95 1.00 0.95 1.00 0.95 1.00 1.00 0.95 1.00Satd. Flow (perm) 1583 4732 1583 4679 1583 3353 1500 1583 3243Peak-hour factor, PHF 0.98 0.98 0.98 0.98 0.98 0.98 0.98 0.98 0.98 0.98 0.98 0.98Adj. Flow (vph) 143 641 86 91 658 156 203 593 166 245 429 120RTOR Reduction (vph) 0 16 0 0 38 0 0 0 120 0 26 0Lane Group Flow (vph) 143 711 0 91 776 0 203 593 46 245 523 0Turn Type Prot NA Prot NA Prot NA Perm Prot NAProtected Phases 7 4 3 8 5 2 1 6Permitted Phases 2Actuated Green, G (s) 12.3 24.2 8.1 20.0 16.2 21.3 21.3 18.3 23.4Effective Green, g (s) 12.3 24.2 8.1 20.0 16.2 21.3 21.3 18.3 23.4Actuated g/C Ratio 0.14 0.28 0.09 0.23 0.18 0.24 0.24 0.21 0.27Clearance Time (s) 4.0 4.0 4.0 4.0 4.0 4.0 4.0 4.0 4.0Vehicle Extension (s) 3.0 3.0 3.0 3.0 3.0 3.0 3.0 3.0 3.0Lane Grp Cap (vph) 221 1302 145 1064 291 812 363 329 863v/s Ratio Prot c0.09 0.15 0.06 c0.17 0.13 c0.18 c0.15 0.16v/s Ratio Perm 0.03v/c Ratio 0.65 0.55 0.63 0.73 0.70 0.73 0.13 0.74 0.61Uniform Delay, d1 35.7 27.2 38.4 31.4 33.6 30.7 26.0 32.6 28.2Progression Factor 1.00 1.00 1.00 1.00 1.00 1.00 1.00 1.00 1.00Incremental Delay, d2 6.4 0.5 8.2 2.5 7.1 3.4 0.2 8.8 1.2Delay (s) 42.1 27.6 46.7 34.0 40.7 34.1 26.2 41.4 29.4Level of Service D C D C D C C D CApproach Delay (s) 30.0 35.3 34.1 33.1Approach LOS C D C C
Intersection SummaryHCM 2000 Control Delay 33.2 HCM 2000 Level of Service CHCM 2000 Volume to Capacity ratio 0.71Actuated Cycle Length (s) 87.9 Sum of lost time (s) 16.0Intersection Capacity Utilization 70.6% ICU Level of Service CAnalysis Period (min) 15c Critical Lane Group
Agenda item No. 3

Rialto Impact Fee Study Existing Conditions37: Riverside Ave & Rialto Ave Timing Plan: PM Peak Hour
Synchro 7 - ReportPage 37
Movement EBL EBT EBR WBL WBT WBR NBL NBT NBR SBL SBT SBRLane ConfigurationsVolume (vph) 50 109 94 54 82 14 89 716 71 29 568 19Ideal Flow (vphpl) 1800 1800 1800 1800 1800 1800 1700 1800 1800 1700 1800 1800Total Lost time (s) 4.0 4.0 4.0 4.0 4.0 4.0 4.0 4.0Lane Util. Factor 1.00 1.00 1.00 1.00 1.00 0.95 1.00 0.95Frt 1.00 0.85 1.00 0.85 1.00 0.99 1.00 1.00Flt Protected 0.98 1.00 0.98 1.00 0.95 1.00 0.95 1.00Satd. Flow (prot) 1737 1500 1730 1500 1583 3308 1583 3337Flt Permitted 0.98 1.00 0.98 1.00 0.95 1.00 0.95 1.00Satd. Flow (perm) 1737 1500 1730 1500 1583 3308 1583 3337Peak-hour factor, PHF 0.96 0.96 0.96 0.96 0.96 0.96 0.96 0.96 0.96 0.96 0.96 0.96Adj. Flow (vph) 52 114 98 56 85 15 93 746 74 30 592 20RTOR Reduction (vph) 0 0 83 0 0 13 0 6 0 0 2 0Lane Group Flow (vph) 0 166 15 0 141 2 93 814 0 30 610 0Turn Type Split NA Perm Split NA Perm Prot NA Prot NAProtected Phases 4 4 8 8 5 2 1 6Permitted Phases 4 8Actuated Green, G (s) 13.4 13.4 12.2 12.2 8.4 42.0 3.3 36.9Effective Green, g (s) 13.4 13.4 12.2 12.2 8.4 42.0 3.3 36.9Actuated g/C Ratio 0.15 0.15 0.14 0.14 0.10 0.48 0.04 0.42Clearance Time (s) 4.0 4.0 4.0 4.0 4.0 4.0 4.0 4.0Vehicle Extension (s) 3.0 3.0 3.0 3.0 3.0 3.0 3.0 3.0Lane Grp Cap (vph) 267 231 242 210 153 1598 60 1416v/s Ratio Prot c0.10 c0.08 c0.06 c0.25 0.02 0.18v/s Ratio Perm 0.01 0.00v/c Ratio 0.62 0.07 0.58 0.01 0.61 0.51 0.50 0.43Uniform Delay, d1 34.4 31.4 35.0 32.2 37.7 15.4 41.0 17.6Progression Factor 1.00 1.00 1.00 1.00 1.00 1.00 1.00 1.00Incremental Delay, d2 4.4 0.1 3.5 0.0 6.7 1.2 6.4 1.0Delay (s) 38.8 31.5 38.5 32.2 44.3 16.5 47.4 18.6Level of Service D C D C D B D BApproach Delay (s) 36.1 37.9 19.4 19.9Approach LOS D D B B
Intersection SummaryHCM 2000 Control Delay 23.3 HCM 2000 Level of Service CHCM 2000 Volume to Capacity ratio 0.57Actuated Cycle Length (s) 86.9 Sum of lost time (s) 16.0Intersection Capacity Utilization 52.3% ICU Level of Service AAnalysis Period (min) 15c Critical Lane Group
Agenda item No. 3

Existing Conditions38: Bloomington Ave & Riverside Ave & Merrill Ave Timing Plan: PM Peak Hour
Synchro 7 - ReportPage 38
Movement EBL EBT EBR EBR2 WBL2 WBL WBT WBR NBL2 NBL NBT NBRLane ConfigurationsVolume (vph) 36 253 68 14 42 247 64 3 1 126 748 44Ideal Flow (vphpl) 1700 1800 1800 1800 1800 1800 1800 1800 1800 1800 1800 1800Total Lost time (s) 4.0 4.0 4.0 4.0 4.0 4.0Lane Util. Factor 1.00 0.95 1.00 0.95 1.00 0.95Frt 1.00 0.96 1.00 0.99 1.00 0.99Flt Protected 0.95 1.00 0.95 1.00 0.95 1.00Satd. Flow (prot) 1583 3230 1676 3332 1676 3325Flt Permitted 0.71 1.00 0.49 1.00 0.95 1.00Satd. Flow (perm) 1178 3230 861 3332 1676 3325Peak-hour factor, PHF 0.91 0.91 0.91 0.91 0.91 0.91 0.91 0.91 0.91 0.91 0.91 0.91Adj. Flow (vph) 40 278 75 15 46 271 70 3 1 138 822 48RTOR Reduction (vph) 0 2 0 0 0 0 2 0 0 0 3 0Lane Group Flow (vph) 40 366 0 0 0 317 71 0 0 139 867 0Turn Type Perm NA Perm Perm NA Prot Prot NAProtected Phases 4 8 5 5 2Permitted Phases 4 8 8Actuated Green, G (s) 43.1 43.1 43.1 43.1 13.9 32.0Effective Green, g (s) 43.1 43.1 43.1 43.1 13.9 32.0Actuated g/C Ratio 0.41 0.41 0.41 0.41 0.13 0.30Clearance Time (s) 4.0 4.0 4.0 4.0 4.0 4.0Vehicle Extension (s) 3.0 3.0 3.0 3.0 3.0 3.0Lane Grp Cap (vph) 477 1309 349 1350 219 1000v/s Ratio Prot 0.11 0.02 c0.08 c0.26v/s Ratio Perm 0.03 c0.37v/c Ratio 0.08 0.28 0.91 0.05 0.63 0.87Uniform Delay, d1 19.4 21.2 29.7 19.2 43.8 35.1Progression Factor 1.00 1.00 1.00 1.00 1.00 1.00Incremental Delay, d2 0.1 0.1 26.2 0.0 5.9 8.0Delay (s) 19.5 21.3 56.0 19.2 49.7 43.1Level of Service B C E B D DApproach Delay (s) 21.1 49.1 44.0Approach LOS C D D
Intersection SummaryHCM 2000 Control Delay 41.6 HCM 2000 Level of Service DHCM 2000 Volume to Capacity ratio 0.85Actuated Cycle Length (s) 106.3 Sum of lost time (s) 16.0Intersection Capacity Utilization 76.9% ICU Level of Service DAnalysis Period (min) 15c Critical Lane Group
Agenda item No. 3

Rialto Impact Fee Study Existing Conditions39: Riverside Ave & Randall Ave Timing Plan: PM Peak Hour
Synchro 7 - ReportPage 39
Movement EBL EBT EBR WBL WBT WBR NBL NBT NBR SBL SBT SBRLane ConfigurationsVolume (vph) 26 57 63 68 68 35 67 935 94 24 635 44Ideal Flow (vphpl) 1700 1800 1800 1700 1800 1800 1700 1800 1800 1700 1800 1800Total Lost time (s) 4.0 4.0 4.0 4.0 4.0 4.0 4.0 4.0Lane Util. Factor 1.00 1.00 1.00 1.00 1.00 0.95 1.00 0.95Frt 1.00 0.92 1.00 0.95 1.00 0.99 1.00 0.99Flt Protected 0.95 1.00 0.95 1.00 0.95 1.00 0.95 1.00Satd. Flow (prot) 1583 1625 1583 1676 1583 3307 1583 3320Flt Permitted 0.95 1.00 0.95 1.00 0.95 1.00 0.95 1.00Satd. Flow (perm) 1583 1625 1583 1676 1583 3307 1583 3320Peak-hour factor, PHF 0.96 0.96 0.96 0.96 0.96 0.96 0.96 0.96 0.96 0.96 0.96 0.96Adj. Flow (vph) 27 59 66 71 71 36 70 974 98 25 661 46RTOR Reduction (vph) 0 43 0 0 20 0 0 7 0 0 5 0Lane Group Flow (vph) 27 82 0 71 87 0 70 1065 0 25 702 0Turn Type Split NA Split NA Prot NA Prot NAProtected Phases 4 4 8 8 5 2 1 6Permitted PhasesActuated Green, G (s) 7.2 7.2 7.3 7.3 4.4 34.1 1.7 31.4Effective Green, g (s) 7.2 7.2 7.3 7.3 4.4 34.1 1.7 31.4Actuated g/C Ratio 0.11 0.11 0.11 0.11 0.07 0.51 0.03 0.47Clearance Time (s) 4.0 4.0 4.0 4.0 4.0 4.0 4.0 4.0Vehicle Extension (s) 3.0 3.0 3.0 3.0 3.0 3.0 3.0 3.0Lane Grp Cap (vph) 171 176 174 184 105 1700 40 1572v/s Ratio Prot 0.02 c0.05 0.04 c0.05 c0.04 c0.32 0.02 0.21v/s Ratio Permv/c Ratio 0.16 0.47 0.41 0.48 0.67 0.63 0.62 0.45Uniform Delay, d1 26.8 27.7 27.5 27.7 30.2 11.5 32.0 11.7Progression Factor 1.00 1.00 1.00 1.00 1.00 1.00 1.00 1.00Incremental Delay, d2 0.4 2.0 1.6 1.9 14.8 0.7 26.7 0.2Delay (s) 27.2 29.7 29.0 29.6 45.1 12.3 58.7 11.9Level of Service C C C C D B E BApproach Delay (s) 29.3 29.4 14.3 13.5Approach LOS C C B B
Intersection SummaryHCM 2000 Control Delay 16.3 HCM 2000 Level of Service BHCM 2000 Volume to Capacity ratio 0.60Actuated Cycle Length (s) 66.3 Sum of lost time (s) 16.0Intersection Capacity Utilization 54.7% ICU Level of Service AAnalysis Period (min) 15c Critical Lane Group
Agenda item No. 3

Rialto Impact Fee Study Existing Conditions40: Riverside Ave & San Bernardinio Ave Timing Plan: PM Peak Hour
Synchro 7 - ReportPage 40
Movement EBL EBT EBR WBL WBT WBR NBL NBT NBR SBL SBT SBRLane ConfigurationsVolume (vph) 40 120 90 197 88 63 124 911 300 64 475 24Ideal Flow (vphpl) 1700 1800 1800 1700 1800 1800 1700 1800 1800 1700 1800 1800Total Lost time (s) 4.0 4.0 4.0 4.0 4.0 4.0 4.0 4.0 4.0Lane Util. Factor 1.00 1.00 1.00 1.00 1.00 1.00 0.95 1.00 0.95Frt 1.00 0.94 1.00 1.00 0.85 1.00 0.96 1.00 0.99Flt Protected 0.95 1.00 0.95 1.00 1.00 0.95 1.00 0.95 1.00Satd. Flow (prot) 1583 1651 1583 1765 1500 1583 3228 1583 3329Flt Permitted 0.95 1.00 0.95 1.00 1.00 0.95 1.00 0.95 1.00Satd. Flow (perm) 1583 1651 1583 1765 1500 1583 3228 1583 3329Peak-hour factor, PHF 0.98 0.98 0.98 0.98 0.98 0.98 0.98 0.98 0.98 0.98 0.98 0.98Adj. Flow (vph) 41 122 92 201 90 64 127 930 306 65 485 24RTOR Reduction (vph) 0 26 0 0 0 45 0 33 0 0 3 0Lane Group Flow (vph) 41 188 0 201 90 19 127 1203 0 65 506 0Turn Type Prot NA Prot NA Perm Prot NA Prot NAProtected Phases 7 4 3 8 5 2 1 6Permitted Phases 8Actuated Green, G (s) 3.8 16.2 15.2 27.6 27.6 10.1 39.3 5.1 34.3Effective Green, g (s) 3.8 16.2 15.2 27.6 27.6 10.1 39.3 5.1 34.3Actuated g/C Ratio 0.04 0.18 0.17 0.30 0.30 0.11 0.43 0.06 0.37Clearance Time (s) 4.0 4.0 4.0 4.0 4.0 4.0 4.0 4.0 4.0Vehicle Extension (s) 3.0 3.0 3.0 3.0 3.0 3.0 3.0 3.0 3.0Lane Grp Cap (vph) 65 291 262 530 450 174 1381 87 1243v/s Ratio Prot 0.03 c0.11 c0.13 0.05 c0.08 c0.37 0.04 0.15v/s Ratio Perm 0.01v/c Ratio 0.63 0.64 0.77 0.17 0.04 0.73 0.87 0.75 0.41Uniform Delay, d1 43.3 35.1 36.6 23.7 22.7 39.5 23.9 42.7 21.2Progression Factor 1.00 1.00 1.00 1.00 1.00 1.00 1.00 1.00 1.00Incremental Delay, d2 18.2 4.8 12.6 0.2 0.0 14.2 6.3 29.0 0.2Delay (s) 61.6 40.0 49.2 23.8 22.8 53.7 30.3 71.7 21.5Level of Service E D D C C D C E CApproach Delay (s) 43.4 38.0 32.4 27.2Approach LOS D D C C
Intersection SummaryHCM 2000 Control Delay 33.1 HCM 2000 Level of Service CHCM 2000 Volume to Capacity ratio 0.81Actuated Cycle Length (s) 91.8 Sum of lost time (s) 16.0Intersection Capacity Utilization 78.7% ICU Level of Service DAnalysis Period (min) 15c Critical Lane Group
Agenda item No. 3

Rialto Impact Fee Study Existing Conditions41: Riverside Ave & Valley Blvd Timing Plan: PM Peak Hour
Synchro 7 - ReportPage 41
Movement EBL EBT EBR WBL WBT WBR NBL NBT NBR SBL SBT SBRLane ConfigurationsVolume (vph) 93 190 420 201 213 71 601 1210 324 72 695 54Ideal Flow (vphpl) 1700 1800 1800 1700 1800 1800 1600 1800 1800 1700 1800 1800Total Lost time (s) 4.0 4.0 4.0 4.0 4.0 4.0 4.0 4.0 4.0 4.0Lane Util. Factor 1.00 0.95 1.00 1.00 0.95 1.00 0.97 0.91 1.00 0.91Frt 1.00 1.00 0.85 1.00 1.00 0.85 1.00 0.97 1.00 0.99Flt Protected 0.95 1.00 1.00 0.95 1.00 1.00 0.95 1.00 0.95 1.00Satd. Flow (prot) 1583 3353 1500 1583 3353 1500 2891 4665 1583 4766Flt Permitted 0.95 1.00 1.00 0.95 1.00 1.00 0.95 1.00 0.95 1.00Satd. Flow (perm) 1583 3353 1500 1583 3353 1500 2891 4665 1583 4766Peak-hour factor, PHF 0.98 0.98 0.98 0.98 0.98 0.98 0.98 0.98 0.98 0.98 0.98 0.98Adj. Flow (vph) 95 194 429 205 217 72 613 1235 331 73 709 55RTOR Reduction (vph) 0 0 366 0 0 56 0 46 0 0 8 0Lane Group Flow (vph) 95 194 63 205 217 16 613 1520 0 73 756 0Turn Type Prot NA Perm Prot NA Perm Prot NA Prot NAProtected Phases 7 4 3 8 5 2 1 6Permitted Phases 4 8Actuated Green, G (s) 8.5 13.1 13.1 15.5 20.1 20.1 22.7 39.4 5.2 21.9Effective Green, g (s) 8.5 13.1 13.1 15.5 20.1 20.1 22.7 39.4 5.2 21.9Actuated g/C Ratio 0.10 0.15 0.15 0.17 0.23 0.23 0.25 0.44 0.06 0.25Clearance Time (s) 4.0 4.0 4.0 4.0 4.0 4.0 4.0 4.0 4.0 4.0Vehicle Extension (s) 3.0 3.0 3.0 3.0 3.0 3.0 3.0 3.0 3.0 3.0Lane Grp Cap (vph) 150 492 220 275 755 338 735 2060 92 1170v/s Ratio Prot 0.06 c0.06 c0.13 0.06 c0.21 c0.33 0.05 0.16v/s Ratio Perm 0.04 0.01v/c Ratio 0.63 0.39 0.29 0.75 0.29 0.05 0.83 0.74 0.79 0.65Uniform Delay, d1 38.8 34.5 33.9 35.0 28.6 27.1 31.5 20.6 41.5 30.2Progression Factor 1.00 1.00 1.00 1.00 1.00 1.00 1.00 1.00 1.00 1.00Incremental Delay, d2 8.4 0.5 0.7 10.5 0.2 0.1 8.1 1.4 36.1 1.2Delay (s) 47.3 35.0 34.6 45.4 28.8 27.1 39.6 22.0 77.5 31.4Level of Service D C C D C C D C E CApproach Delay (s) 36.4 35.5 27.0 35.4Approach LOS D D C D
Intersection SummaryHCM 2000 Control Delay 31.2 HCM 2000 Level of Service CHCM 2000 Volume to Capacity ratio 0.73Actuated Cycle Length (s) 89.2 Sum of lost time (s) 16.0Intersection Capacity Utilization 68.1% ICU Level of Service CAnalysis Period (min) 15c Critical Lane Group
Agenda item No. 3

Rialto Impact Fee Study Existing Conditions42: Riverside Ave & I-10 WB Ramps Timing Plan: PM Peak Hour
Synchro 7 - ReportPage 42
Movement EBL EBT EBR WBL WBT WBR NBL NBT NBR SBL SBT SBRLane ConfigurationsVolume (vph) 0 0 0 304 1 471 291 1664 0 0 980 336Ideal Flow (vphpl) 1800 1800 1800 1700 1800 1800 1600 1800 1800 1800 1800 1800Total Lost time (s) 4.0 4.0 4.0 4.0 4.0 4.0 4.0Lane Util. Factor 0.95 0.91 0.95 0.97 0.91 0.86 1.00Frt 1.00 0.87 0.85 1.00 1.00 1.00 0.85Flt Protected 0.95 0.99 1.00 0.95 1.00 1.00 1.00Satd. Flow (prot) 1504 1390 1425 2891 4818 6071 1500Flt Permitted 0.95 0.99 1.00 0.95 1.00 1.00 1.00Satd. Flow (perm) 1504 1390 1425 2891 4818 6071 1500Peak-hour factor, PHF 0.95 0.95 0.95 0.95 0.95 0.95 0.95 0.95 0.95 0.95 0.95 0.95Adj. Flow (vph) 0 0 0 320 1 496 306 1752 0 0 1032 354RTOR Reduction (vph) 0 0 0 0 11 43 0 0 0 0 0 232Lane Group Flow (vph) 0 0 0 282 256 225 306 1752 0 0 1032 122Turn Type Perm NA Perm Prot NA NA PermProtected Phases 8 5 2 6Permitted Phases 8 8 6Actuated Green, G (s) 20.8 20.8 20.8 13.1 41.3 24.2 24.2Effective Green, g (s) 20.8 20.8 20.8 13.1 41.3 24.2 24.2Actuated g/C Ratio 0.30 0.30 0.30 0.19 0.59 0.35 0.35Clearance Time (s) 4.0 4.0 4.0 4.0 4.0 4.0 4.0Vehicle Extension (s) 3.0 3.0 3.0 3.0 3.0 3.0 3.0Lane Grp Cap (vph) 446 412 422 540 2838 2095 517v/s Ratio Prot 0.11 c0.36 0.17v/s Ratio Perm c0.19 0.18 0.16 0.08v/c Ratio 0.63 0.62 0.53 0.57 0.62 0.49 0.24Uniform Delay, d1 21.3 21.3 20.6 25.9 9.3 18.1 16.4Progression Factor 1.00 1.00 1.00 1.00 1.00 1.00 1.00Incremental Delay, d2 2.9 2.9 1.3 1.4 0.4 0.2 0.2Delay (s) 24.3 24.2 21.9 27.3 9.7 18.3 16.6Level of Service C C C C A B BApproach Delay (s) 0.0 23.5 12.3 17.9Approach LOS A C B B
Intersection SummaryHCM 2000 Control Delay 16.3 HCM 2000 Level of Service BHCM 2000 Volume to Capacity ratio 0.66Actuated Cycle Length (s) 70.1 Sum of lost time (s) 12.0Intersection Capacity Utilization 102.0% ICU Level of Service GAnalysis Period (min) 15c Critical Lane Group
Agenda item No. 3

Rialto Impact Fee Study Existing Conditions43: Riverside Ave & I-10 EB Ramps Timing Plan: PM Peak Hour
Synchro 7 - ReportPage 43
Movement EBL EBT EBR WBL WBT WBR NBL NBT NBR SBL SBT SBRLane ConfigurationsVolume (vph) 818 4 284 0 0 0 0 1137 407 454 828 0Ideal Flow (vphpl) 1700 1800 1800 1800 1800 1800 1800 1800 1800 1600 1800 1800Total Lost time (s) 4.0 4.0 4.0 4.0 4.0 4.0Lane Util. Factor 0.95 0.91 0.95 0.91 0.97 0.95Frt 1.00 0.99 0.85 0.96 1.00 1.00Flt Protected 0.95 0.96 1.00 1.00 0.95 1.00Satd. Flow (prot) 1504 1519 1425 4627 2891 3353Flt Permitted 0.95 0.96 1.00 1.00 0.95 1.00Satd. Flow (perm) 1504 1519 1425 4627 2891 3353Peak-hour factor, PHF 0.99 0.99 0.99 0.99 0.99 0.99 0.99 0.99 0.99 0.99 0.99 0.99Adj. Flow (vph) 826 4 287 0 0 0 0 1148 411 459 836 0RTOR Reduction (vph) 0 3 110 0 0 0 0 71 0 0 0 0Lane Group Flow (vph) 430 426 148 0 0 0 0 1488 0 459 836 0Turn Type Perm NA Perm NA Prot NAProtected Phases 4 2 1 6Permitted Phases 4 4Actuated Green, G (s) 28.5 28.5 28.5 31.9 15.7 51.6Effective Green, g (s) 28.5 28.5 28.5 31.9 15.7 51.6Actuated g/C Ratio 0.32 0.32 0.32 0.36 0.18 0.59Clearance Time (s) 4.0 4.0 4.0 4.0 4.0 4.0Vehicle Extension (s) 3.0 3.0 3.0 3.0 3.0 3.0Lane Grp Cap (vph) 486 491 460 1675 515 1963v/s Ratio Prot c0.32 c0.16 0.25v/s Ratio Perm c0.29 0.28 0.10v/c Ratio 0.88 0.87 0.32 0.89 0.89 0.43Uniform Delay, d1 28.2 28.0 22.5 26.4 35.4 10.1Progression Factor 1.00 1.00 1.00 1.00 1.00 1.00Incremental Delay, d2 17.2 15.0 0.4 6.2 17.4 0.1Delay (s) 45.5 43.0 22.9 32.6 52.8 10.2Level of Service D D C C D BApproach Delay (s) 39.3 0.0 32.6 25.3Approach LOS D A C C
Intersection SummaryHCM 2000 Control Delay 32.1 HCM 2000 Level of Service CHCM 2000 Volume to Capacity ratio 0.89Actuated Cycle Length (s) 88.1 Sum of lost time (s) 12.0Intersection Capacity Utilization 102.0% ICU Level of Service GAnalysis Period (min) 15c Critical Lane Group
Agenda item No. 3

Rialto Impact Fee Study Existing Conditions44: Riverside Ave & Slover Ave Timing Plan: PM Peak Hour
Synchro 7 - ReportPage 44
Movement EBL EBT EBR WBL WBT WBR NBL NBT NBR SBL SBT SBRLane ConfigurationsVolume (vph) 332 39 61 22 19 23 69 1251 21 32 887 199Ideal Flow (vphpl) 1700 1800 1800 1700 1800 1800 1700 1800 1800 1700 1800 1800Total Lost time (s) 4.0 4.0 4.0 4.0 4.0 4.0 4.0 4.0Lane Util. Factor 1.00 0.95 1.00 0.95 1.00 0.95 1.00 0.95Frt 1.00 0.91 1.00 0.92 1.00 1.00 1.00 0.97Flt Protected 0.95 1.00 0.95 1.00 0.95 1.00 0.95 1.00Satd. Flow (prot) 1583 3045 1583 3079 1583 3345 1583 3261Flt Permitted 0.73 1.00 0.69 1.00 0.95 1.00 0.95 1.00Satd. Flow (perm) 1211 3045 1145 3079 1583 3345 1583 3261Peak-hour factor, PHF 0.97 0.97 0.97 0.97 0.97 0.97 0.97 0.97 0.97 0.97 0.97 0.97Adj. Flow (vph) 342 40 63 23 20 24 71 1290 22 33 914 205RTOR Reduction (vph) 0 42 0 0 16 0 0 1 0 0 18 0Lane Group Flow (vph) 342 61 0 23 28 0 71 1311 0 33 1101 0Turn Type Perm NA Perm NA Prot NA Prot NAProtected Phases 4 8 5 2 1 6Permitted Phases 4 8Actuated Green, G (s) 28.8 28.8 28.8 28.8 5.1 41.9 2.0 38.8Effective Green, g (s) 28.8 28.8 28.8 28.8 5.1 41.9 2.0 38.8Actuated g/C Ratio 0.34 0.34 0.34 0.34 0.06 0.49 0.02 0.46Clearance Time (s) 4.0 4.0 4.0 4.0 4.0 4.0 4.0 4.0Vehicle Extension (s) 3.0 3.0 3.0 3.0 3.0 3.0 3.0 3.0Lane Grp Cap (vph) 411 1035 389 1046 95 1654 37 1493v/s Ratio Prot 0.02 0.01 c0.04 c0.39 0.02 0.34v/s Ratio Perm c0.28 0.02v/c Ratio 0.83 0.06 0.06 0.03 0.75 0.79 0.89 0.74Uniform Delay, d1 25.7 18.8 18.8 18.6 39.2 17.8 41.2 18.8Progression Factor 1.00 1.00 1.00 1.00 1.00 1.00 1.00 1.00Incremental Delay, d2 13.4 0.0 0.1 0.0 27.0 2.7 104.8 1.9Delay (s) 39.1 18.9 18.9 18.6 66.2 20.5 146.1 20.7Level of Service D B B B E C F CApproach Delay (s) 34.4 18.7 22.8 24.3Approach LOS C B C C
Intersection SummaryHCM 2000 Control Delay 25.0 HCM 2000 Level of Service CHCM 2000 Volume to Capacity ratio 0.82Actuated Cycle Length (s) 84.7 Sum of lost time (s) 12.0Intersection Capacity Utilization 77.8% ICU Level of Service DAnalysis Period (min) 15c Critical Lane Group
Agenda item No. 3
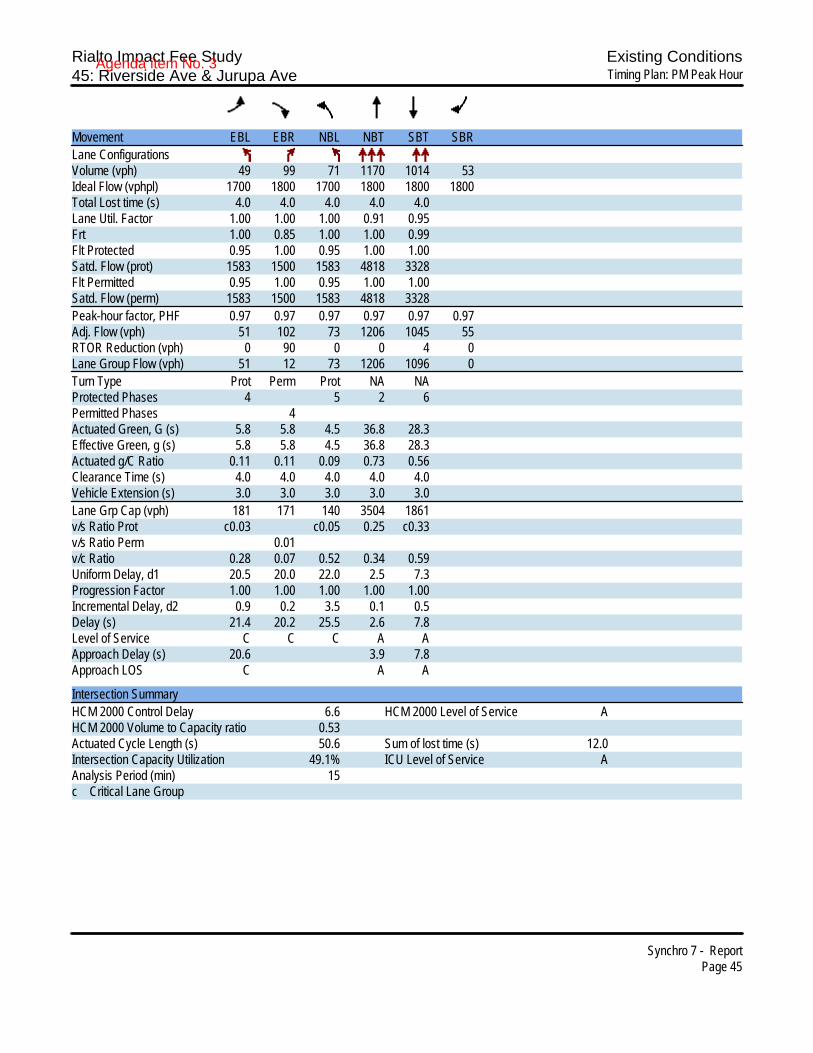
Rialto Impact Fee Study Existing Conditions45: Riverside Ave & Jurupa Ave Timing Plan: PM Peak Hour
Synchro 7 - ReportPage 45
Movement EBL EBR NBL NBT SBT SBRLane ConfigurationsVolume (vph) 49 99 71 1170 1014 53Ideal Flow (vphpl) 1700 1800 1700 1800 1800 1800Total Lost time (s) 4.0 4.0 4.0 4.0 4.0Lane Util. Factor 1.00 1.00 1.00 0.91 0.95Frt 1.00 0.85 1.00 1.00 0.99Flt Protected 0.95 1.00 0.95 1.00 1.00Satd. Flow (prot) 1583 1500 1583 4818 3328Flt Permitted 0.95 1.00 0.95 1.00 1.00Satd. Flow (perm) 1583 1500 1583 4818 3328Peak-hour factor, PHF 0.97 0.97 0.97 0.97 0.97 0.97Adj. Flow (vph) 51 102 73 1206 1045 55RTOR Reduction (vph) 0 90 0 0 4 0Lane Group Flow (vph) 51 12 73 1206 1096 0Turn Type Prot Perm Prot NA NAProtected Phases 4 5 2 6Permitted Phases 4Actuated Green, G (s) 5.8 5.8 4.5 36.8 28.3Effective Green, g (s) 5.8 5.8 4.5 36.8 28.3Actuated g/C Ratio 0.11 0.11 0.09 0.73 0.56Clearance Time (s) 4.0 4.0 4.0 4.0 4.0Vehicle Extension (s) 3.0 3.0 3.0 3.0 3.0Lane Grp Cap (vph) 181 171 140 3504 1861v/s Ratio Prot c0.03 c0.05 0.25 c0.33v/s Ratio Perm 0.01v/c Ratio 0.28 0.07 0.52 0.34 0.59Uniform Delay, d1 20.5 20.0 22.0 2.5 7.3Progression Factor 1.00 1.00 1.00 1.00 1.00Incremental Delay, d2 0.9 0.2 3.5 0.1 0.5Delay (s) 21.4 20.2 25.5 2.6 7.8Level of Service C C C A AApproach Delay (s) 20.6 3.9 7.8Approach LOS C A A
Intersection SummaryHCM 2000 Control Delay 6.6 HCM 2000 Level of Service AHCM 2000 Volume to Capacity ratio 0.53Actuated Cycle Length (s) 50.6 Sum of lost time (s) 12.0Intersection Capacity Utilization 49.1% ICU Level of Service AAnalysis Period (min) 15c Critical Lane Group
Agenda item No. 3

Rialto Impact Fee Study Existing Conditions46: Riverside Ave & Agua Mansa Rd Timing Plan: PM Peak Hour
Synchro 7 - ReportPage 46
Movement EBL EBT EBR WBL WBT WBR NBL NBT NBR SBL SBT SBRLane ConfigurationsVolume (vph) 160 366 89 53 138 43 112 873 96 47 812 105Ideal Flow (vphpl) 1700 1800 1800 1700 1800 1800 1700 1800 1800 1700 1800 1800Total Lost time (s) 4.0 4.0 4.0 4.0 4.0 4.0 4.0 4.0 4.0 4.0 4.0Lane Util. Factor 1.00 1.00 1.00 1.00 1.00 1.00 1.00 0.95 1.00 0.95 1.00Frt 1.00 1.00 0.85 1.00 1.00 0.85 1.00 0.99 1.00 1.00 0.85Flt Protected 0.95 1.00 1.00 0.95 1.00 1.00 0.95 1.00 0.95 1.00 1.00Satd. Flow (prot) 1583 1765 1500 1583 1765 1500 1583 3303 1583 3353 1500Flt Permitted 0.95 1.00 1.00 0.95 1.00 1.00 0.95 1.00 0.95 1.00 1.00Satd. Flow (perm) 1583 1765 1500 1583 1765 1500 1583 3303 1583 3353 1500Peak-hour factor, PHF 0.96 0.96 0.96 0.96 0.96 0.96 0.96 0.96 0.96 0.96 0.96 0.96Adj. Flow (vph) 167 381 93 55 144 45 117 909 100 49 846 109RTOR Reduction (vph) 0 0 64 0 0 36 0 8 0 0 0 71Lane Group Flow (vph) 167 381 29 55 144 9 117 1001 0 49 846 38Turn Type Prot NA Perm Prot NA Perm Prot NA Prot NA PermProtected Phases 7 4 3 8 5 2 1 6Permitted Phases 4 8 6Actuated Green, G (s) 14.4 25.9 25.9 5.1 16.6 16.6 8.2 33.6 3.6 29.0 29.0Effective Green, g (s) 14.4 25.9 25.9 5.1 16.6 16.6 8.2 33.6 3.6 29.0 29.0Actuated g/C Ratio 0.17 0.31 0.31 0.06 0.20 0.20 0.10 0.40 0.04 0.34 0.34Clearance Time (s) 4.0 4.0 4.0 4.0 4.0 4.0 4.0 4.0 4.0 4.0 4.0Vehicle Extension (s) 3.0 3.0 3.0 3.0 3.0 3.0 3.0 3.0 3.0 3.0 3.0Lane Grp Cap (vph) 270 542 461 95 347 295 154 1318 67 1154 516v/s Ratio Prot c0.11 c0.22 0.03 0.08 c0.07 c0.30 0.03 0.25v/s Ratio Perm 0.02 0.01 0.03v/c Ratio 0.62 0.70 0.06 0.58 0.41 0.03 0.76 0.76 0.73 0.73 0.07Uniform Delay, d1 32.4 25.8 20.6 38.5 29.6 27.3 37.0 21.8 39.8 24.2 18.6Progression Factor 1.00 1.00 1.00 1.00 1.00 1.00 1.00 1.00 1.00 1.00 1.00Incremental Delay, d2 4.2 4.1 0.1 8.3 0.8 0.0 19.2 2.6 33.4 2.4 0.1Delay (s) 36.5 29.9 20.6 46.8 30.4 27.3 56.2 24.4 73.2 26.6 18.6Level of Service D C C D C C E C E C BApproach Delay (s) 30.3 33.5 27.7 28.0Approach LOS C C C C
Intersection SummaryHCM 2000 Control Delay 28.8 HCM 2000 Level of Service CHCM 2000 Volume to Capacity ratio 0.77Actuated Cycle Length (s) 84.2 Sum of lost time (s) 16.0Intersection Capacity Utilization 69.0% ICU Level of Service CAnalysis Period (min) 15c Critical Lane Group
Agenda item No. 3

Rialto Impact Fee Study Existing Conditions47: Acacia Ave & Base Line Rd Timing Plan: PM Peak Hour
Synchro 7 - ReportPage 47
Movement EBL EBT EBR WBL WBT WBR NBL NBT NBR SBL SBT SBRLane ConfigurationsVolume (vph) 33 533 50 10 560 20 37 88 23 18 47 34Ideal Flow (vphpl) 1700 1800 1800 1700 1800 1800 1800 1800 1800 1800 1800 1800Total Lost time (s) 4.0 4.0 4.0 4.0 4.0 4.0Lane Util. Factor 1.00 0.95 1.00 0.95 1.00 1.00Frt 1.00 0.99 1.00 0.99 0.98 0.95Flt Protected 0.95 1.00 0.95 1.00 0.99 0.99Satd. Flow (prot) 1583 3310 1583 3336 1707 1668Flt Permitted 0.42 1.00 0.42 1.00 0.89 0.91Satd. Flow (perm) 697 3310 695 3336 1536 1539Peak-hour factor, PHF 0.94 0.94 0.94 0.94 0.94 0.94 0.94 0.94 0.94 0.94 0.94 0.94Adj. Flow (vph) 35 567 53 11 596 21 39 94 24 19 50 36RTOR Reduction (vph) 0 8 0 0 3 0 0 8 0 0 24 0Lane Group Flow (vph) 35 612 0 11 614 0 0 149 0 0 81 0Turn Type Perm NA Perm NA Perm NA Perm NAProtected Phases 4 8 2 6Permitted Phases 4 8 2 6Actuated Green, G (s) 13.0 13.0 13.0 13.0 6.5 6.5Effective Green, g (s) 13.0 13.0 13.0 13.0 6.5 6.5Actuated g/C Ratio 0.47 0.47 0.47 0.47 0.24 0.24Clearance Time (s) 4.0 4.0 4.0 4.0 4.0 4.0Vehicle Extension (s) 3.0 3.0 3.0 3.0 3.0 3.0Lane Grp Cap (vph) 329 1564 328 1577 363 363v/s Ratio Prot c0.18 0.18v/s Ratio Perm 0.05 0.02 c0.10 0.05v/c Ratio 0.11 0.39 0.03 0.39 0.41 0.22Uniform Delay, d1 4.0 4.7 3.9 4.7 8.9 8.5Progression Factor 1.00 1.00 1.00 1.00 1.00 1.00Incremental Delay, d2 0.1 0.2 0.0 0.2 0.8 0.3Delay (s) 4.2 4.9 3.9 4.8 9.6 8.8Level of Service A A A A A AApproach Delay (s) 4.8 4.8 9.6 8.8Approach LOS A A A A
Intersection SummaryHCM 2000 Control Delay 5.6 HCM 2000 Level of Service AHCM 2000 Volume to Capacity ratio 0.40Actuated Cycle Length (s) 27.5 Sum of lost time (s) 8.0Intersection Capacity Utilization 43.5% ICU Level of Service AAnalysis Period (min) 15c Critical Lane Group
Agenda item No. 3

Rialto Impact Fee Study Existing Conditions48: Acacia Ave & Foothill Blvd Timing Plan: PM Peak Hour
Synchro 7 - ReportPage 48
Movement EBL EBT EBR WBL WBT WBR NBL NBT NBR SBL SBT SBRLane ConfigurationsVolume (vph) 50 773 69 29 716 63 67 100 42 31 103 58Ideal Flow (vphpl) 1700 1800 1800 1700 1800 1800 1800 1800 1800 1800 1800 1800Total Lost time (s) 4.0 4.0 4.0 4.0 4.0 4.0Lane Util. Factor 1.00 0.91 1.00 0.95 1.00 1.00Frt 1.00 0.99 1.00 0.99 0.97 0.96Flt Protected 0.95 1.00 0.95 1.00 0.98 0.99Satd. Flow (prot) 1583 4758 1583 3312 1689 1679Flt Permitted 0.95 1.00 0.95 1.00 0.87 0.93Satd. Flow (perm) 1583 4758 1583 3312 1490 1574Peak-hour factor, PHF 0.96 0.96 0.96 0.96 0.96 0.96 0.96 0.96 0.96 0.96 0.96 0.96Adj. Flow (vph) 52 805 72 30 746 66 70 104 44 32 107 60RTOR Reduction (vph) 0 10 0 0 6 0 0 10 0 0 17 0Lane Group Flow (vph) 52 867 0 30 806 0 0 208 0 0 182 0Turn Type Prot NA Prot NA Perm NA Perm NAProtected Phases 7 4 3 8 2 6Permitted Phases 2 6Actuated Green, G (s) 4.1 24.2 2.3 22.4 14.4 14.4Effective Green, g (s) 4.1 24.2 2.3 22.4 14.4 14.4Actuated g/C Ratio 0.08 0.46 0.04 0.42 0.27 0.27Clearance Time (s) 4.0 4.0 4.0 4.0 4.0 4.0Vehicle Extension (s) 3.0 3.0 3.0 3.0 3.0 3.0Lane Grp Cap (vph) 122 2176 68 1402 405 428v/s Ratio Prot c0.03 0.18 0.02 c0.24v/s Ratio Perm c0.14 0.12v/c Ratio 0.43 0.40 0.44 0.57 0.51 0.42Uniform Delay, d1 23.3 9.5 24.7 11.6 16.3 15.8Progression Factor 1.00 1.00 1.00 1.00 1.00 1.00Incremental Delay, d2 2.4 0.1 4.5 0.6 1.1 0.7Delay (s) 25.7 9.6 29.2 12.2 17.4 16.5Level of Service C A C B B BApproach Delay (s) 10.5 12.8 17.4 16.5Approach LOS B B B B
Intersection SummaryHCM 2000 Control Delay 12.6 HCM 2000 Level of Service BHCM 2000 Volume to Capacity ratio 0.53Actuated Cycle Length (s) 52.9 Sum of lost time (s) 12.0Intersection Capacity Utilization 58.4% ICU Level of Service BAnalysis Period (min) 15c Critical Lane Group
Agenda item No. 3

Rialto Impact Fee Study Existing Conditions49: Pepper Ave & Base Line Rd Timing Plan: PM Peak Hour
Synchro 7 - ReportPage 49
Movement EBL EBT EBR WBL WBT WBR NBL NBT NBR SBL SBT SBRLane ConfigurationsVolume (vph) 10 404 172 77 410 13 200 47 113 23 24 11Ideal Flow (vphpl) 1700 1800 1800 1700 1800 1800 1700 1800 1800 1700 1800 1800Total Lost time (s) 4.0 4.0 4.0 4.0 4.0 4.0 4.0 4.0Lane Util. Factor 1.00 0.95 1.00 0.95 1.00 0.95 1.00 0.95Frt 1.00 0.96 1.00 1.00 1.00 0.89 1.00 0.95Flt Protected 0.95 1.00 0.95 1.00 0.95 1.00 0.95 1.00Satd. Flow (prot) 1583 3203 1583 3337 1583 2998 1583 3194Flt Permitted 0.38 1.00 0.24 1.00 0.73 1.00 0.64 1.00Satd. Flow (perm) 631 3203 401 3337 1218 2998 1074 3194Peak-hour factor, PHF 0.94 0.94 0.94 0.94 0.94 0.94 0.94 0.94 0.94 0.94 0.94 0.94Adj. Flow (vph) 11 430 183 82 436 14 213 50 120 24 26 12RTOR Reduction (vph) 0 64 0 0 3 0 0 44 0 0 4 0Lane Group Flow (vph) 11 549 0 82 447 0 213 126 0 24 34 0Turn Type Perm NA Perm NA Perm NA Perm NAProtected Phases 4 8 2 6Permitted Phases 4 8 2 6Actuated Green, G (s) 18.9 18.9 18.9 18.9 47.2 47.2 47.2 47.2Effective Green, g (s) 18.9 18.9 18.9 18.9 47.2 47.2 47.2 47.2Actuated g/C Ratio 0.26 0.26 0.26 0.26 0.64 0.64 0.64 0.64Clearance Time (s) 4.0 4.0 4.0 4.0 4.0 4.0 4.0 4.0Vehicle Extension (s) 3.0 3.0 3.0 3.0 3.0 3.0 3.0 3.0Lane Grp Cap (vph) 160 816 102 851 775 1909 684 2034v/s Ratio Prot 0.17 0.13 0.04 0.01v/s Ratio Perm 0.02 c0.20 c0.17 0.02v/c Ratio 0.07 0.67 0.80 0.53 0.27 0.07 0.04 0.02Uniform Delay, d1 20.9 24.8 25.9 23.7 5.9 5.1 5.0 4.9Progression Factor 1.00 1.00 1.00 1.00 1.00 1.00 1.00 1.00Incremental Delay, d2 0.2 2.2 35.2 0.6 0.9 0.1 0.1 0.0Delay (s) 21.1 27.0 61.0 24.3 6.8 5.2 5.1 4.9Level of Service C C E C A A A AApproach Delay (s) 26.9 30.0 6.1 5.0Approach LOS C C A A
Intersection SummaryHCM 2000 Control Delay 22.1 HCM 2000 Level of Service CHCM 2000 Volume to Capacity ratio 0.43Actuated Cycle Length (s) 74.1 Sum of lost time (s) 8.0Intersection Capacity Utilization 51.4% ICU Level of Service AAnalysis Period (min) 15c Critical Lane Group
Agenda item No. 3
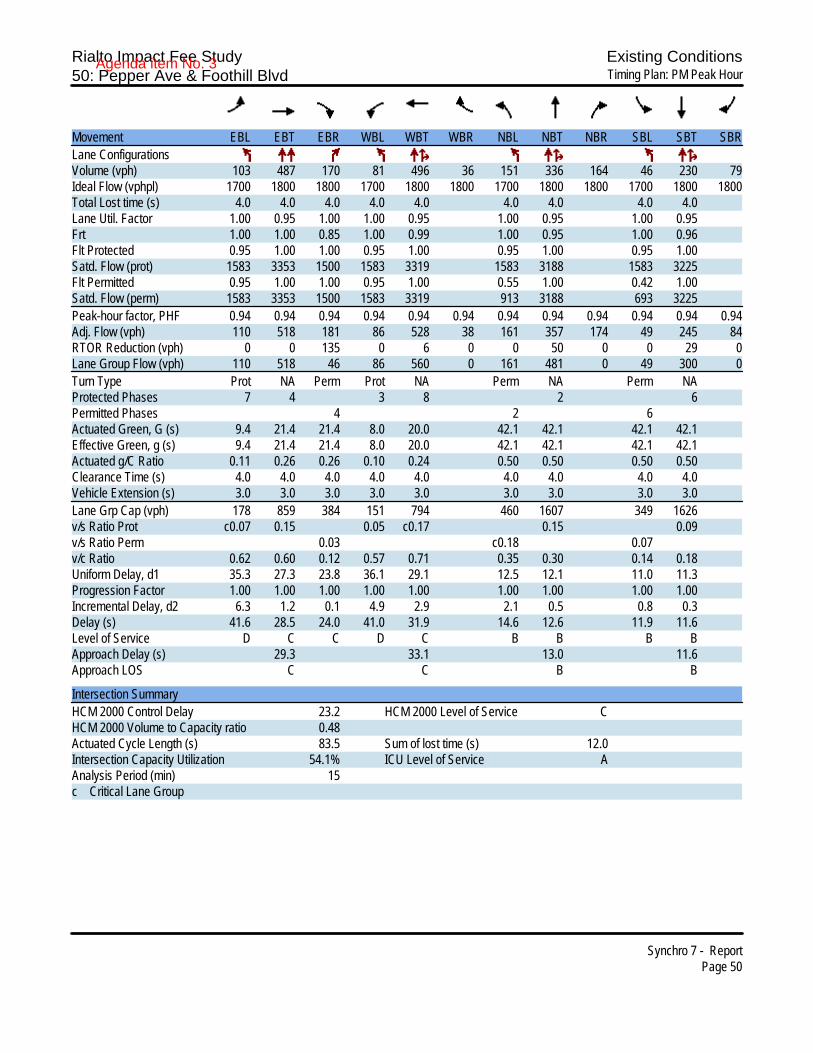
Rialto Impact Fee Study Existing Conditions50: Pepper Ave & Foothill Blvd Timing Plan: PM Peak Hour
Synchro 7 - ReportPage 50
Movement EBL EBT EBR WBL WBT WBR NBL NBT NBR SBL SBT SBRLane ConfigurationsVolume (vph) 103 487 170 81 496 36 151 336 164 46 230 79Ideal Flow (vphpl) 1700 1800 1800 1700 1800 1800 1700 1800 1800 1700 1800 1800Total Lost time (s) 4.0 4.0 4.0 4.0 4.0 4.0 4.0 4.0 4.0Lane Util. Factor 1.00 0.95 1.00 1.00 0.95 1.00 0.95 1.00 0.95Frt 1.00 1.00 0.85 1.00 0.99 1.00 0.95 1.00 0.96Flt Protected 0.95 1.00 1.00 0.95 1.00 0.95 1.00 0.95 1.00Satd. Flow (prot) 1583 3353 1500 1583 3319 1583 3188 1583 3225Flt Permitted 0.95 1.00 1.00 0.95 1.00 0.55 1.00 0.42 1.00Satd. Flow (perm) 1583 3353 1500 1583 3319 913 3188 693 3225Peak-hour factor, PHF 0.94 0.94 0.94 0.94 0.94 0.94 0.94 0.94 0.94 0.94 0.94 0.94Adj. Flow (vph) 110 518 181 86 528 38 161 357 174 49 245 84RTOR Reduction (vph) 0 0 135 0 6 0 0 50 0 0 29 0Lane Group Flow (vph) 110 518 46 86 560 0 161 481 0 49 300 0Turn Type Prot NA Perm Prot NA Perm NA Perm NAProtected Phases 7 4 3 8 2 6Permitted Phases 4 2 6Actuated Green, G (s) 9.4 21.4 21.4 8.0 20.0 42.1 42.1 42.1 42.1Effective Green, g (s) 9.4 21.4 21.4 8.0 20.0 42.1 42.1 42.1 42.1Actuated g/C Ratio 0.11 0.26 0.26 0.10 0.24 0.50 0.50 0.50 0.50Clearance Time (s) 4.0 4.0 4.0 4.0 4.0 4.0 4.0 4.0 4.0Vehicle Extension (s) 3.0 3.0 3.0 3.0 3.0 3.0 3.0 3.0 3.0Lane Grp Cap (vph) 178 859 384 151 794 460 1607 349 1626v/s Ratio Prot c0.07 0.15 0.05 c0.17 0.15 0.09v/s Ratio Perm 0.03 c0.18 0.07v/c Ratio 0.62 0.60 0.12 0.57 0.71 0.35 0.30 0.14 0.18Uniform Delay, d1 35.3 27.3 23.8 36.1 29.1 12.5 12.1 11.0 11.3Progression Factor 1.00 1.00 1.00 1.00 1.00 1.00 1.00 1.00 1.00Incremental Delay, d2 6.3 1.2 0.1 4.9 2.9 2.1 0.5 0.8 0.3Delay (s) 41.6 28.5 24.0 41.0 31.9 14.6 12.6 11.9 11.6Level of Service D C C D C B B B BApproach Delay (s) 29.3 33.1 13.0 11.6Approach LOS C C B B
Intersection SummaryHCM 2000 Control Delay 23.2 HCM 2000 Level of Service CHCM 2000 Volume to Capacity ratio 0.48Actuated Cycle Length (s) 83.5 Sum of lost time (s) 12.0Intersection Capacity Utilization 54.1% ICU Level of Service AAnalysis Period (min) 15c Critical Lane Group
Agenda item No. 3
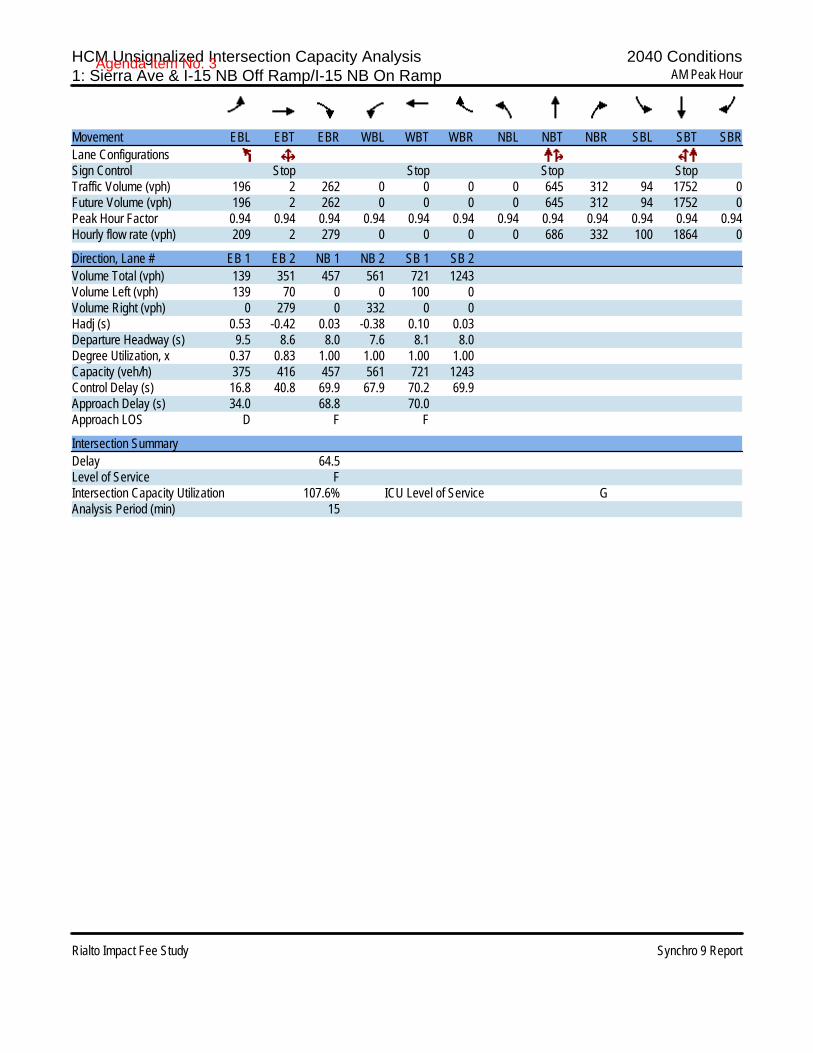
HCM Unsignalized Intersection Capacity Analysis 2040 Conditions1: Sierra Ave & I-15 NB Off Ramp/I-15 NB On Ramp AM Peak Hour
Rialto Impact Fee Study Synchro 9 Report
Movement EBL EBT EBR WBL WBT WBR NBL NBT NBR SBL SBT SBRLane ConfigurationsSign Control Stop Stop Stop StopTraffic Volume (vph) 196 2 262 0 0 0 0 645 312 94 1752 0Future Volume (vph) 196 2 262 0 0 0 0 645 312 94 1752 0Peak Hour Factor 0.94 0.94 0.94 0.94 0.94 0.94 0.94 0.94 0.94 0.94 0.94 0.94Hourly flow rate (vph) 209 2 279 0 0 0 0 686 332 100 1864 0
Direction, Lane # EB 1 EB 2 NB 1 NB 2 SB 1 SB 2Volume Total (vph) 139 351 457 561 721 1243Volume Left (vph) 139 70 0 0 100 0Volume Right (vph) 0 279 0 332 0 0Hadj (s) 0.53 -0.42 0.03 -0.38 0.10 0.03Departure Headway (s) 9.5 8.6 8.0 7.6 8.1 8.0Degree Utilization, x 0.37 0.83 1.00 1.00 1.00 1.00Capacity (veh/h) 375 416 457 561 721 1243Control Delay (s) 16.8 40.8 69.9 67.9 70.2 69.9Approach Delay (s) 34.0 68.8 70.0Approach LOS D F F
Intersection SummaryDelay 64.5Level of Service FIntersection Capacity Utilization 107.6% ICU Level of Service GAnalysis Period (min) 15
Agenda item No. 3

HCM Unsignalized Intersection Capacity Analysis 2040 Conditions2: Sierra Ave & Riverside Ave AM Peak Hour
Rialto Impact Fee Study Synchro 9 Report
Movement EBL EBT EBR WBL WBT WBR NBL NBT NBR SBL SBT SBRLane ConfigurationsSign Control Stop Stop Stop StopTraffic Volume (vph) 14 34 0 10 156 671 0 411 8 683 958 49Future Volume (vph) 14 34 0 10 156 671 0 411 8 683 958 49Peak Hour Factor 0.92 0.92 0.92 0.94 0.92 0.94 0.92 0.94 0.94 0.94 0.94 0.92Hourly flow rate (vph) 15 37 0 11 170 714 0 437 9 727 1019 53
Direction, Lane # EB 1 EB 2 WB 1 WB 2 NB 1 NB 2 SB 1 SB 2Volume Total (vph) 15 37 11 884 437 9 727 1072Volume Left (vph) 15 0 11 0 0 0 727 0Volume Right (vph) 0 0 0 714 0 9 0 53Hadj (s) 0.53 0.03 0.53 -0.53 0.03 -0.67 0.53 0.00Departure Headway (s) 10.0 9.5 8.5 7.4 8.1 7.4 8.1 7.6Degree Utilization, x 0.04 0.10 0.03 1.00 0.98 0.02 1.00 1.00Capacity (veh/h) 351 370 411 884 437 481 727 1072Control Delay (s) 12.2 12.3 10.5 67.0 64.7 9.3 70.5 68.0Approach Delay (s) 12.3 66.3 63.6 69.0Approach LOS B F F F
Intersection SummaryDelay 66.6Level of Service FIntersection Capacity Utilization 141.5% ICU Level of Service HAnalysis Period (min) 15
Agenda item No. 3

HCM Signalized Intersection Capacity Analysis 2040 Conditions3: Live Oak Ave & Riverside Ave AM Peak Hour
Rialto Impact Fee Study Synchro 9 Report
Movement EBT EBR WBL WBT NBL NBRLane ConfigurationsTraffic Volume (vph) 967 151 32 636 281 112Future Volume (vph) 967 151 32 636 281 112Ideal Flow (vphpl) 1800 1800 1700 1800 1700 1800Total Lost time (s) 4.0 4.0 4.0 4.0 4.0Lane Util. Factor 0.95 1.00 0.95 1.00 1.00Frt 0.98 1.00 1.00 1.00 0.85Flt Protected 1.00 0.95 1.00 0.95 1.00Satd. Flow (prot) 3285 1583 3353 1583 1500Flt Permitted 1.00 0.95 1.00 0.95 1.00Satd. Flow (perm) 3285 1583 3353 1583 1500Peak-hour factor, PHF 0.78 0.78 0.78 0.78 0.78 0.78Adj. Flow (vph) 1240 194 41 815 360 144RTOR Reduction (vph) 13 0 0 0 0 87Lane Group Flow (vph) 1421 0 41 815 360 57Turn Type NA Prot NA Prot PermProtected Phases 4 3 8 2Permitted Phases 2Actuated Green, G (s) 38.9 2.0 44.9 22.2 22.2Effective Green, g (s) 38.9 2.0 44.9 22.2 22.2Actuated g/C Ratio 0.52 0.03 0.60 0.30 0.30Clearance Time (s) 4.0 4.0 4.0 4.0 4.0Vehicle Extension (s) 3.0 3.0 3.0 3.0 3.0Lane Grp Cap (vph) 1701 42 2004 467 443v/s Ratio Prot c0.43 c0.03 0.24 c0.23v/s Ratio Perm 0.04v/c Ratio 0.84 0.98 0.41 0.77 0.13Uniform Delay, d1 15.4 36.5 8.0 24.1 19.4Progression Factor 1.00 1.00 1.00 1.00 1.00Incremental Delay, d2 3.7 128.6 0.1 7.7 0.1Delay (s) 19.1 165.2 8.2 31.8 19.5Level of Service B F A C BApproach Delay (s) 19.1 15.7 28.3Approach LOS B B C
Intersection SummaryHCM 2000 Control Delay 19.7 HCM 2000 Level of Service BHCM 2000 Volume to Capacity ratio 0.82Actuated Cycle Length (s) 75.1 Sum of lost time (s) 12.0Intersection Capacity Utilization 57.4% ICU Level of Service BAnalysis Period (min) 15c Critical Lane Group
Agenda item No. 3

HCM Signalized Intersection Capacity Analysis 2040 Conditions4: Alder Ave & Riverside Ave AM Peak Hour
Rialto Impact Fee Study Synchro 9 Report
Movement EBT EBR WBL WBT NBL NBRLane ConfigurationsTraffic Volume (vph) 770 255 174 568 224 123Future Volume (vph) 770 255 174 568 224 123Ideal Flow (vphpl) 1800 1800 1700 1800 1600 1800Total Lost time (s) 4.0 4.0 4.0 4.0 4.0Lane Util. Factor 0.95 1.00 0.95 0.97 1.00Frt 0.96 1.00 1.00 1.00 0.85Flt Protected 1.00 0.95 1.00 0.95 1.00Satd. Flow (prot) 3048 1495 3167 2730 1417Flt Permitted 1.00 0.21 1.00 0.95 1.00Satd. Flow (perm) 3048 331 3167 2730 1417Peak-hour factor, PHF 0.88 0.88 0.88 0.88 0.88 0.88Adj. Flow (vph) 875 290 198 645 255 140RTOR Reduction (vph) 40 0 0 0 0 115Lane Group Flow (vph) 1125 0 198 645 255 25Heavy Vehicles (%) 8% 8% 8% 8% 8% 8%Turn Type NA Perm NA Prot PermProtected Phases 4 8 2Permitted Phases 8 2Actuated Green, G (s) 48.5 48.5 48.5 12.3 12.3Effective Green, g (s) 48.5 48.5 48.5 12.3 12.3Actuated g/C Ratio 0.70 0.70 0.70 0.18 0.18Clearance Time (s) 4.0 4.0 4.0 4.0 4.0Vehicle Extension (s) 3.0 3.0 3.0 3.0 3.0Lane Grp Cap (vph) 2148 233 2232 488 253v/s Ratio Prot 0.37 0.20 c0.09v/s Ratio Perm c0.60 0.02v/c Ratio 0.52 0.85 0.29 0.52 0.10Uniform Delay, d1 4.7 7.5 3.8 25.6 23.6Progression Factor 1.00 1.00 1.00 1.00 1.00Incremental Delay, d2 0.2 24.0 0.1 1.0 0.2Delay (s) 5.0 31.5 3.8 26.6 23.8Level of Service A C A C CApproach Delay (s) 5.0 10.3 25.6Approach LOS A B C
Intersection SummaryHCM 2000 Control Delay 10.2 HCM 2000 Level of Service BHCM 2000 Volume to Capacity ratio 0.78Actuated Cycle Length (s) 68.8 Sum of lost time (s) 8.0Intersection Capacity Utilization 59.4% ICU Level of Service BAnalysis Period (min) 15c Critical Lane Group
Agenda item No. 3

HCM Signalized Intersection Capacity Analysis 2040 Conditions5: Alder Ave & Sierra Lakes Pkwy/Casmalia St AM Peak Hour
Rialto Impact Fee Study Synchro 9 Report
Movement EBL EBT EBR WBL WBT WBR NBL NBT NBR SBL SBT SBRLane ConfigurationsTraffic Volume (vph) 8 33 65 530 35 31 63 273 301 25 478 13Future Volume (vph) 8 33 65 530 35 31 63 273 301 25 478 13Ideal Flow (vphpl) 1700 1800 1800 1700 1800 1800 1700 1800 1800 1700 1800 1800Total Lost time (s) 4.0 4.0 4.0 4.0 4.0 4.0 4.0 4.0 4.0 4.0Lane Util. Factor 1.00 1.00 1.00 1.00 1.00 1.00 0.95 1.00 0.95 1.00Frt 1.00 0.90 1.00 1.00 0.85 1.00 0.92 1.00 1.00 0.85Flt Protected 0.95 1.00 0.95 1.00 1.00 0.95 1.00 0.95 1.00 1.00Satd. Flow (prot) 1495 1500 1495 1667 1417 1495 2917 1495 3167 1417Flt Permitted 0.73 1.00 0.69 1.00 1.00 0.36 1.00 0.27 1.00 1.00Satd. Flow (perm) 1155 1500 1088 1667 1417 561 2917 432 3167 1417Peak-hour factor, PHF 0.96 0.96 0.96 0.96 0.96 0.96 0.96 0.96 0.96 0.96 0.96 0.96Adj. Flow (vph) 8 34 68 552 36 32 66 284 314 26 498 14RTOR Reduction (vph) 0 26 0 0 0 12 0 203 0 0 0 10Lane Group Flow (vph) 8 76 0 552 36 20 66 395 0 26 498 4Heavy Vehicles (%) 8% 8% 8% 8% 8% 8% 8% 8% 8% 8% 8% 8%Turn Type Perm NA Perm NA Perm Perm NA Perm NA PermProtected Phases 4 8 2 6Permitted Phases 4 8 8 2 6 6Actuated Green, G (s) 40.7 40.7 40.7 40.7 40.7 17.8 17.8 17.8 17.8 17.8Effective Green, g (s) 40.7 40.7 40.7 40.7 40.7 17.8 17.8 17.8 17.8 17.8Actuated g/C Ratio 0.61 0.61 0.61 0.61 0.61 0.27 0.27 0.27 0.27 0.27Clearance Time (s) 4.0 4.0 4.0 4.0 4.0 4.0 4.0 4.0 4.0 4.0Vehicle Extension (s) 3.0 3.0 3.0 3.0 3.0 3.0 3.0 3.0 3.0 3.0Lane Grp Cap (vph) 706 918 665 1020 867 150 780 115 847 379v/s Ratio Prot 0.05 0.02 0.14 c0.16v/s Ratio Perm 0.01 c0.51 0.01 0.12 0.06 0.00v/c Ratio 0.01 0.08 0.83 0.04 0.02 0.44 0.51 0.23 0.59 0.01Uniform Delay, d1 5.0 5.3 10.2 5.1 5.1 20.2 20.6 19.0 21.2 17.9Progression Factor 1.00 1.00 1.00 1.00 1.00 1.00 1.00 1.00 1.00 1.00Incremental Delay, d2 0.0 0.0 8.6 0.0 0.0 2.1 0.5 1.0 1.0 0.0Delay (s) 5.0 5.3 18.8 5.1 5.1 22.3 21.1 20.0 22.2 17.9Level of Service A A B A A C C B C BApproach Delay (s) 5.3 17.3 21.3 22.0Approach LOS A B C C
Intersection SummaryHCM 2000 Control Delay 19.3 HCM 2000 Level of Service BHCM 2000 Volume to Capacity ratio 0.76Actuated Cycle Length (s) 66.5 Sum of lost time (s) 8.0Intersection Capacity Utilization 71.0% ICU Level of Service CAnalysis Period (min) 15c Critical Lane Group
Agenda item No. 3
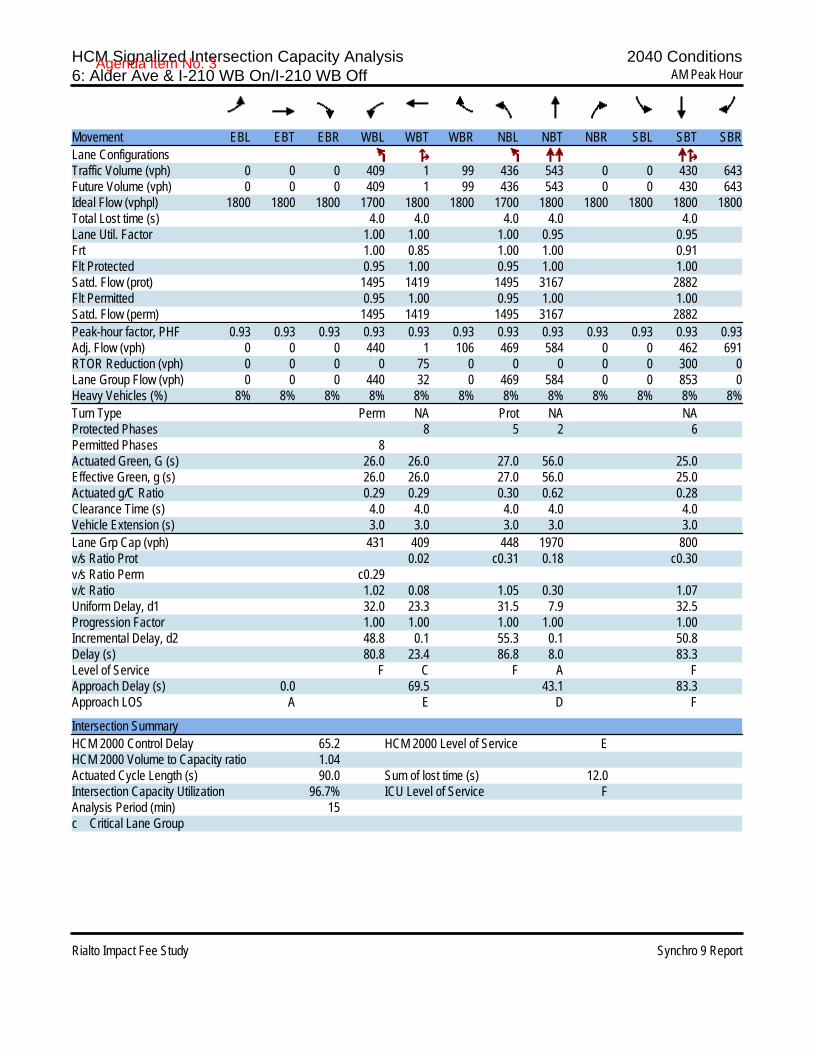
HCM Signalized Intersection Capacity Analysis 2040 Conditions6: Alder Ave & I-210 WB On/I-210 WB Off AM Peak Hour
Rialto Impact Fee Study Synchro 9 Report
Movement EBL EBT EBR WBL WBT WBR NBL NBT NBR SBL SBT SBRLane ConfigurationsTraffic Volume (vph) 0 0 0 409 1 99 436 543 0 0 430 643Future Volume (vph) 0 0 0 409 1 99 436 543 0 0 430 643Ideal Flow (vphpl) 1800 1800 1800 1700 1800 1800 1700 1800 1800 1800 1800 1800Total Lost time (s) 4.0 4.0 4.0 4.0 4.0Lane Util. Factor 1.00 1.00 1.00 0.95 0.95Frt 1.00 0.85 1.00 1.00 0.91Flt Protected 0.95 1.00 0.95 1.00 1.00Satd. Flow (prot) 1495 1419 1495 3167 2882Flt Permitted 0.95 1.00 0.95 1.00 1.00Satd. Flow (perm) 1495 1419 1495 3167 2882Peak-hour factor, PHF 0.93 0.93 0.93 0.93 0.93 0.93 0.93 0.93 0.93 0.93 0.93 0.93Adj. Flow (vph) 0 0 0 440 1 106 469 584 0 0 462 691RTOR Reduction (vph) 0 0 0 0 75 0 0 0 0 0 300 0Lane Group Flow (vph) 0 0 0 440 32 0 469 584 0 0 853 0Heavy Vehicles (%) 8% 8% 8% 8% 8% 8% 8% 8% 8% 8% 8% 8%Turn Type Perm NA Prot NA NAProtected Phases 8 5 2 6Permitted Phases 8Actuated Green, G (s) 26.0 26.0 27.0 56.0 25.0Effective Green, g (s) 26.0 26.0 27.0 56.0 25.0Actuated g/C Ratio 0.29 0.29 0.30 0.62 0.28Clearance Time (s) 4.0 4.0 4.0 4.0 4.0Vehicle Extension (s) 3.0 3.0 3.0 3.0 3.0Lane Grp Cap (vph) 431 409 448 1970 800v/s Ratio Prot 0.02 c0.31 0.18 c0.30v/s Ratio Perm c0.29v/c Ratio 1.02 0.08 1.05 0.30 1.07Uniform Delay, d1 32.0 23.3 31.5 7.9 32.5Progression Factor 1.00 1.00 1.00 1.00 1.00Incremental Delay, d2 48.8 0.1 55.3 0.1 50.8Delay (s) 80.8 23.4 86.8 8.0 83.3Level of Service F C F A FApproach Delay (s) 0.0 69.5 43.1 83.3Approach LOS A E D F
Intersection SummaryHCM 2000 Control Delay 65.2 HCM 2000 Level of Service EHCM 2000 Volume to Capacity ratio 1.04Actuated Cycle Length (s) 90.0 Sum of lost time (s) 12.0Intersection Capacity Utilization 96.7% ICU Level of Service FAnalysis Period (min) 15c Critical Lane Group
Agenda item No. 3
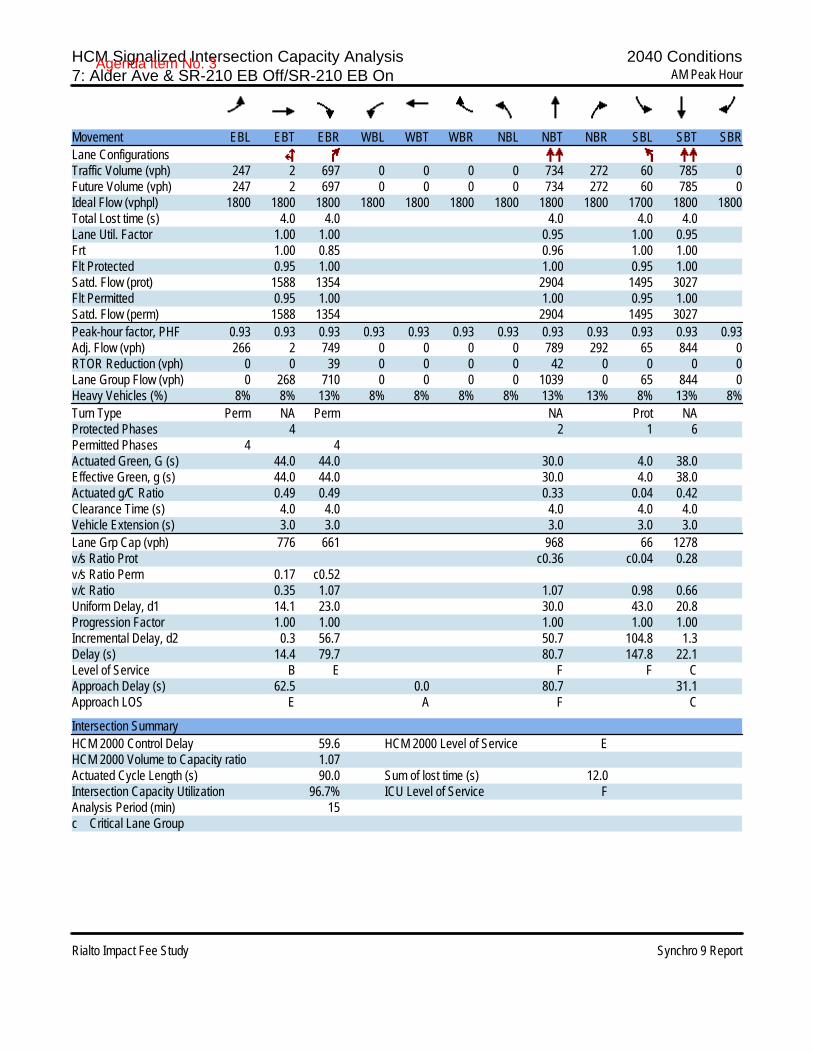
HCM Signalized Intersection Capacity Analysis 2040 Conditions7: Alder Ave & SR-210 EB Off/SR-210 EB On AM Peak Hour
Rialto Impact Fee Study Synchro 9 Report
Movement EBL EBT EBR WBL WBT WBR NBL NBT NBR SBL SBT SBRLane ConfigurationsTraffic Volume (vph) 247 2 697 0 0 0 0 734 272 60 785 0Future Volume (vph) 247 2 697 0 0 0 0 734 272 60 785 0Ideal Flow (vphpl) 1800 1800 1800 1800 1800 1800 1800 1800 1800 1700 1800 1800Total Lost time (s) 4.0 4.0 4.0 4.0 4.0Lane Util. Factor 1.00 1.00 0.95 1.00 0.95Frt 1.00 0.85 0.96 1.00 1.00Flt Protected 0.95 1.00 1.00 0.95 1.00Satd. Flow (prot) 1588 1354 2904 1495 3027Flt Permitted 0.95 1.00 1.00 0.95 1.00Satd. Flow (perm) 1588 1354 2904 1495 3027Peak-hour factor, PHF 0.93 0.93 0.93 0.93 0.93 0.93 0.93 0.93 0.93 0.93 0.93 0.93Adj. Flow (vph) 266 2 749 0 0 0 0 789 292 65 844 0RTOR Reduction (vph) 0 0 39 0 0 0 0 42 0 0 0 0Lane Group Flow (vph) 0 268 710 0 0 0 0 1039 0 65 844 0Heavy Vehicles (%) 8% 8% 13% 8% 8% 8% 8% 13% 13% 8% 13% 8%Turn Type Perm NA Perm NA Prot NAProtected Phases 4 2 1 6Permitted Phases 4 4Actuated Green, G (s) 44.0 44.0 30.0 4.0 38.0Effective Green, g (s) 44.0 44.0 30.0 4.0 38.0Actuated g/C Ratio 0.49 0.49 0.33 0.04 0.42Clearance Time (s) 4.0 4.0 4.0 4.0 4.0Vehicle Extension (s) 3.0 3.0 3.0 3.0 3.0Lane Grp Cap (vph) 776 661 968 66 1278v/s Ratio Prot c0.36 c0.04 0.28v/s Ratio Perm 0.17 c0.52v/c Ratio 0.35 1.07 1.07 0.98 0.66Uniform Delay, d1 14.1 23.0 30.0 43.0 20.8Progression Factor 1.00 1.00 1.00 1.00 1.00Incremental Delay, d2 0.3 56.7 50.7 104.8 1.3Delay (s) 14.4 79.7 80.7 147.8 22.1Level of Service B E F F CApproach Delay (s) 62.5 0.0 80.7 31.1Approach LOS E A F C
Intersection SummaryHCM 2000 Control Delay 59.6 HCM 2000 Level of Service EHCM 2000 Volume to Capacity ratio 1.07Actuated Cycle Length (s) 90.0 Sum of lost time (s) 12.0Intersection Capacity Utilization 96.7% ICU Level of Service FAnalysis Period (min) 15c Critical Lane Group
Agenda item No. 3

HCM Signalized Intersection Capacity Analysis 2040 Conditions8: Alder Ave & Renaissance Pkwy AM Peak Hour
Rialto Impact Fee Study Synchro 9 Report
Movement EBL EBT EBR WBL WBT WBR NBL NBT NBR SBL SBT SBRLane ConfigurationsTraffic Volume (vph) 165 180 39 100 221 170 35 681 25 573 789 105Future Volume (vph) 165 180 39 100 221 170 35 681 25 573 789 105Ideal Flow (vphpl) 1700 1800 1800 1700 1800 1800 1700 1800 1800 1700 1800 1800Total Lost time (s) 4.0 4.0 4.0 4.0 4.0 4.0 4.0 4.0 4.0Lane Util. Factor 1.00 0.95 1.00 0.95 1.00 0.95 1.00 1.00 1.00Frt 1.00 0.97 1.00 0.93 1.00 0.99 1.00 1.00 0.85Flt Protected 0.95 1.00 0.95 1.00 0.95 1.00 0.95 1.00 1.00Satd. Flow (prot) 1495 3113 1495 2960 1495 3150 1495 1667 1417Flt Permitted 0.95 1.00 0.95 1.00 0.95 1.00 0.95 1.00 1.00Satd. Flow (perm) 1495 3113 1495 2960 1495 3150 1495 1667 1417Peak-hour factor, PHF 0.91 0.91 0.91 0.91 0.91 0.91 0.91 0.91 0.91 0.91 0.91 0.91Adj. Flow (vph) 181 198 43 110 243 187 38 748 27 630 867 115RTOR Reduction (vph) 0 19 0 0 144 0 0 2 0 0 0 49Lane Group Flow (vph) 181 222 0 110 286 0 38 773 0 630 867 66Heavy Vehicles (%) 8% 8% 2% 8% 8% 8% 8% 8% 8% 8% 8% 8%Turn Type Prot NA Prot NA Prot NA Prot NA ProtProtected Phases 7 4 3 8 5 2 1 6 6Permitted PhasesActuated Green, G (s) 10.0 13.8 9.6 13.4 3.2 24.9 34.0 55.7 55.7Effective Green, g (s) 10.0 13.8 9.6 13.4 3.2 24.9 34.0 55.7 55.7Actuated g/C Ratio 0.10 0.14 0.10 0.14 0.03 0.25 0.35 0.57 0.57Clearance Time (s) 4.0 4.0 4.0 4.0 4.0 4.0 4.0 4.0 4.0Vehicle Extension (s) 3.0 3.0 3.0 3.0 3.0 3.0 3.0 3.0 3.0Lane Grp Cap (vph) 152 437 146 403 48 797 517 944 802v/s Ratio Prot c0.12 0.07 0.07 c0.10 0.03 0.25 c0.42 c0.52 0.05v/s Ratio Permv/c Ratio 1.19 0.51 0.75 0.71 0.79 0.97 1.22 0.92 0.08Uniform Delay, d1 44.1 39.1 43.2 40.6 47.2 36.3 32.1 19.2 9.7Progression Factor 1.00 1.00 1.00 1.00 1.00 1.00 1.00 1.00 1.00Incremental Delay, d2 133.4 0.9 19.5 5.6 58.5 24.3 115.0 13.4 0.0Delay (s) 177.6 40.0 62.7 46.2 105.7 60.6 147.1 32.7 9.7Level of Service F D E D F E F C AApproach Delay (s) 99.0 49.6 62.7 75.8Approach LOS F D E E
Intersection SummaryHCM 2000 Control Delay 71.4 HCM 2000 Level of Service EHCM 2000 Volume to Capacity ratio 1.07Actuated Cycle Length (s) 98.3 Sum of lost time (s) 16.0Intersection Capacity Utilization 91.9% ICU Level of Service FAnalysis Period (min) 15c Critical Lane Group
Agenda item No. 3

HCM Signalized Intersection Capacity Analysis 2040 Conditions9: Alder Ave & Base Line Rd AM Peak Hour
Rialto Impact Fee Study Synchro 9 Report
Movement EBL EBT EBR WBL WBT WBR NBL NBT NBR SBL SBT SBRLane ConfigurationsTraffic Volume (vph) 150 811 244 79 839 195 432 340 87 84 323 107Future Volume (vph) 150 811 244 79 839 195 432 340 87 84 323 107Ideal Flow (vphpl) 1700 1800 1800 1700 1800 1800 1700 1800 1800 1700 1800 1800Total Lost time (s) 4.0 4.0 4.0 4.0 4.0 4.0 4.0 4.0 4.0Lane Util. Factor 1.00 1.00 1.00 1.00 1.00 1.00 1.00 1.00 1.00Frt 1.00 0.97 1.00 0.97 1.00 0.97 1.00 1.00 0.85Flt Protected 0.95 1.00 0.95 1.00 0.95 1.00 0.95 1.00 1.00Satd. Flow (prot) 1495 1609 1495 1619 1495 1616 1495 1667 1417Flt Permitted 0.95 1.00 0.95 1.00 0.95 1.00 0.95 1.00 1.00Satd. Flow (perm) 1495 1609 1495 1619 1495 1616 1495 1667 1417Peak-hour factor, PHF 0.86 0.86 0.86 0.86 0.86 0.86 0.86 0.86 0.86 0.86 0.86 0.86Adj. Flow (vph) 174 943 284 92 976 227 502 395 101 98 376 124RTOR Reduction (vph) 0 11 0 0 8 0 0 9 0 0 0 99Lane Group Flow (vph) 174 1216 0 92 1195 0 502 487 0 98 376 25Heavy Vehicles (%) 8% 8% 8% 8% 8% 8% 8% 8% 8% 8% 8% 8%Turn Type Prot NA Prot NA Prot NA Prot NA PermProtected Phases 7 4 3 8 5 2 1 6Permitted Phases 6Actuated Green, G (s) 7.0 43.0 4.0 40.0 17.0 31.0 6.0 20.0 20.0Effective Green, g (s) 7.0 43.0 4.0 40.0 17.0 31.0 6.0 20.0 20.0Actuated g/C Ratio 0.07 0.43 0.04 0.40 0.17 0.31 0.06 0.20 0.20Clearance Time (s) 4.0 4.0 4.0 4.0 4.0 4.0 4.0 4.0 4.0Vehicle Extension (s) 3.0 3.0 3.0 3.0 3.0 3.0 3.0 3.0 3.0Lane Grp Cap (vph) 104 691 59 647 254 500 89 333 283v/s Ratio Prot c0.12 c0.76 0.06 0.74 c0.34 0.30 0.07 c0.23v/s Ratio Perm 0.02v/c Ratio 1.67 1.76 1.56 1.85 1.98 0.97 1.10 1.13 0.09Uniform Delay, d1 46.5 28.5 48.0 30.0 41.5 34.1 47.0 40.0 32.6Progression Factor 1.00 1.00 1.00 1.00 1.00 1.00 1.00 1.00 1.00Incremental Delay, d2 341.1 347.9 318.8 386.8 453.3 34.3 125.4 89.0 0.6Delay (s) 387.6 376.4 366.8 416.8 494.8 68.4 172.4 129.0 33.2Level of Service F F F F F E F F CApproach Delay (s) 377.8 413.3 282.9 116.2Approach LOS F F F F
Intersection SummaryHCM 2000 Control Delay 330.0 HCM 2000 Level of Service FHCM 2000 Volume to Capacity ratio 1.68Actuated Cycle Length (s) 100.0 Sum of lost time (s) 16.0Intersection Capacity Utilization 126.4% ICU Level of Service HAnalysis Period (min) 15c Critical Lane Group
Agenda item No. 3

HCM Signalized Intersection Capacity Analysis 2040 Conditions10: Locust Ave & Casmalia St AM Peak Hour
Rialto Impact Fee Study Synchro 9 Report
Movement EBL EBT EBR WBL WBT WBR NBL NBT NBR SBL SBT SBRLane ConfigurationsTraffic Volume (vph) 133 30 10 5 103 24 29 173 0 7 285 272Future Volume (vph) 133 30 10 5 103 24 29 173 0 7 285 272Ideal Flow (vphpl) 1700 1800 1800 1700 1800 1800 1700 1800 1800 1700 1800 1800Total Lost time (s) 4.0 4.0 4.0 4.0 4.0 4.0 4.0 4.0Lane Util. Factor 1.00 1.00 1.00 1.00 1.00 0.95 1.00 0.95Frt 1.00 0.96 1.00 0.97 1.00 1.00 1.00 0.93Flt Protected 0.95 1.00 0.95 1.00 0.95 1.00 0.95 1.00Satd. Flow (prot) 1583 1697 1583 1715 1583 3353 1583 3107Flt Permitted 0.95 1.00 0.95 1.00 0.95 1.00 0.95 1.00Satd. Flow (perm) 1583 1697 1583 1715 1583 3353 1583 3107Peak-hour factor, PHF 0.95 0.95 0.95 0.95 0.95 0.95 0.95 0.95 0.95 0.95 0.95 0.95Adj. Flow (vph) 140 32 11 5 108 25 31 182 0 7 300 286RTOR Reduction (vph) 0 7 0 0 8 0 0 0 0 0 181 0Lane Group Flow (vph) 140 36 0 5 125 0 31 182 0 7 406 0Turn Type Prot NA Prot NA Prot NA Prot NAProtected Phases 7 4 3 8 5 2 1 6Permitted PhasesActuated Green, G (s) 8.1 17.5 0.5 9.9 2.1 18.2 0.6 16.7Effective Green, g (s) 8.1 17.5 0.5 9.9 2.1 18.2 0.6 16.7Actuated g/C Ratio 0.15 0.33 0.01 0.19 0.04 0.34 0.01 0.32Clearance Time (s) 4.0 4.0 4.0 4.0 4.0 4.0 4.0 4.0Vehicle Extension (s) 3.0 3.0 3.0 3.0 3.0 3.0 3.0 3.0Lane Grp Cap (vph) 242 562 14 321 62 1155 17 982v/s Ratio Prot c0.09 0.02 0.00 c0.07 c0.02 0.05 0.00 c0.13v/s Ratio Permv/c Ratio 0.58 0.06 0.36 0.39 0.50 0.16 0.41 0.41Uniform Delay, d1 20.8 12.1 26.0 18.8 24.8 12.0 25.9 14.2Progression Factor 1.00 1.00 1.00 1.00 1.00 1.00 1.00 1.00Incremental Delay, d2 3.3 0.0 14.9 0.8 6.2 0.1 15.4 0.3Delay (s) 24.1 12.1 40.9 19.6 31.1 12.1 41.3 14.5Level of Service C B D B C B D BApproach Delay (s) 21.3 20.4 14.8 14.8Approach LOS C C B B
Intersection SummaryHCM 2000 Control Delay 16.5 HCM 2000 Level of Service BHCM 2000 Volume to Capacity ratio 0.45Actuated Cycle Length (s) 52.8 Sum of lost time (s) 16.0Intersection Capacity Utilization 49.7% ICU Level of Service AAnalysis Period (min) 15c Critical Lane Group
Agenda item No. 3

HCM Signalized Intersection Capacity Analysis 2040 Conditions11: Locust Ave & Base Line Rd AM Peak Hour
Rialto Impact Fee Study Synchro 9 Report
Movement EBL EBT EBR WBL WBT WBR NBL NBT NBR SBL SBT SBRLane ConfigurationsTraffic Volume (vph) 160 304 39 21 730 143 110 20 51 34 7 46Future Volume (vph) 160 304 39 21 730 143 110 20 51 34 7 46Ideal Flow (vphpl) 1700 1800 1800 1700 1800 1800 1700 1800 1800 1700 1800 1800Total Lost time (s) 4.0 4.0 4.0 4.0 4.0 4.0 4.0 4.0 4.0 4.0Lane Util. Factor 1.00 0.95 1.00 0.95 1.00 1.00 1.00 1.00 1.00 1.00Frt 1.00 0.98 1.00 0.98 1.00 1.00 0.85 1.00 1.00 0.85Flt Protected 0.95 1.00 0.95 1.00 0.95 1.00 1.00 0.95 1.00 1.00Satd. Flow (prot) 1583 3296 1583 3269 1583 1765 1500 1583 1765 1500Flt Permitted 0.95 1.00 0.95 1.00 0.75 1.00 1.00 0.74 1.00 1.00Satd. Flow (perm) 1583 3296 1583 3269 1254 1765 1500 1238 1765 1500Peak-hour factor, PHF 0.92 0.94 0.94 0.94 0.94 0.92 0.94 0.92 0.94 0.92 0.92 0.92Adj. Flow (vph) 174 323 41 22 777 155 117 22 54 37 8 50RTOR Reduction (vph) 0 9 0 0 16 0 0 0 44 0 0 41Lane Group Flow (vph) 174 355 0 22 916 0 117 22 10 37 8 9Turn Type Prot NA Prot NA Perm NA Perm Perm NA PermProtected Phases 7 4 3 8 2 6Permitted Phases 2 2 6 6Actuated Green, G (s) 13.5 41.7 1.9 30.1 12.4 12.4 12.4 12.4 12.4 12.4Effective Green, g (s) 13.5 41.7 1.9 30.1 12.4 12.4 12.4 12.4 12.4 12.4Actuated g/C Ratio 0.20 0.61 0.03 0.44 0.18 0.18 0.18 0.18 0.18 0.18Clearance Time (s) 4.0 4.0 4.0 4.0 4.0 4.0 4.0 4.0 4.0 4.0Vehicle Extension (s) 3.0 3.0 3.0 3.0 3.0 3.0 3.0 3.0 3.0 3.0Lane Grp Cap (vph) 314 2021 44 1447 228 321 273 225 321 273v/s Ratio Prot c0.11 0.11 0.01 c0.28 0.01 0.00v/s Ratio Perm c0.09 0.01 0.03 0.01v/c Ratio 0.55 0.18 0.50 0.63 0.51 0.07 0.04 0.16 0.02 0.03Uniform Delay, d1 24.5 5.7 32.6 14.7 25.1 23.0 22.9 23.4 22.8 22.9Progression Factor 1.00 1.00 1.00 1.00 1.00 1.00 1.00 1.00 1.00 1.00Incremental Delay, d2 2.1 0.0 8.7 0.9 1.9 0.1 0.1 0.3 0.0 0.1Delay (s) 26.7 5.7 41.2 15.6 27.0 23.1 22.9 23.8 22.9 22.9Level of Service C A D B C C C C C CApproach Delay (s) 12.5 16.2 25.4 23.3Approach LOS B B C C
Intersection SummaryHCM 2000 Control Delay 16.4 HCM 2000 Level of Service BHCM 2000 Volume to Capacity ratio 0.59Actuated Cycle Length (s) 68.0 Sum of lost time (s) 12.0Intersection Capacity Utilization 59.5% ICU Level of Service BAnalysis Period (min) 15c Critical Lane Group
Agenda item No. 3

HCM Signalized Intersection Capacity Analysis 2040 Conditions12: Ayala Dr & Riverside Ave AM Peak Hour
Rialto Impact Fee Study Synchro 9 Report
Movement EBT EBR WBL WBT NBL NBRLane ConfigurationsTraffic Volume (vph) 499 98 201 722 124 238Future Volume (vph) 499 98 201 722 124 238Ideal Flow (vphpl) 1800 1800 1700 1800 1700 1800Total Lost time (s) 4.0 4.0 4.0 4.0 4.0Lane Util. Factor 0.95 1.00 0.95 1.00 0.88Frt 0.98 1.00 1.00 1.00 0.85Flt Protected 1.00 0.95 1.00 0.95 1.00Satd. Flow (prot) 3088 1495 3167 1495 2493Flt Permitted 1.00 0.95 1.00 0.95 1.00Satd. Flow (perm) 3088 1495 3167 1495 2493Peak-hour factor, PHF 0.92 0.92 0.92 0.92 0.92 0.92Adj. Flow (vph) 542 107 218 785 135 259RTOR Reduction (vph) 18 0 0 0 0 208Lane Group Flow (vph) 631 0 218 785 135 51Heavy Vehicles (%) 8% 8% 8% 8% 8% 8%Turn Type NA Prot NA Prot PermProtected Phases 4 3 8 2Permitted Phases 2Actuated Green, G (s) 19.2 14.5 37.7 11.3 11.3Effective Green, g (s) 19.2 14.5 37.7 11.3 11.3Actuated g/C Ratio 0.34 0.25 0.66 0.20 0.20Clearance Time (s) 4.0 4.0 4.0 4.0 4.0Vehicle Extension (s) 3.0 3.0 3.0 3.0 3.0Lane Grp Cap (vph) 1040 380 2094 296 494v/s Ratio Prot c0.20 c0.15 0.25 c0.09v/s Ratio Perm 0.02v/c Ratio 0.61 0.57 0.37 0.46 0.10Uniform Delay, d1 15.8 18.6 4.3 20.1 18.7Progression Factor 1.00 1.00 1.00 1.00 1.00Incremental Delay, d2 1.0 2.1 0.1 1.1 0.1Delay (s) 16.8 20.6 4.5 21.3 18.8Level of Service B C A C BApproach Delay (s) 16.8 8.0 19.6Approach LOS B A B
Intersection SummaryHCM 2000 Control Delay 13.0 HCM 2000 Level of Service BHCM 2000 Volume to Capacity ratio 0.56Actuated Cycle Length (s) 57.0 Sum of lost time (s) 12.0Intersection Capacity Utilization 48.0% ICU Level of Service AAnalysis Period (min) 15c Critical Lane Group
Agenda item No. 3
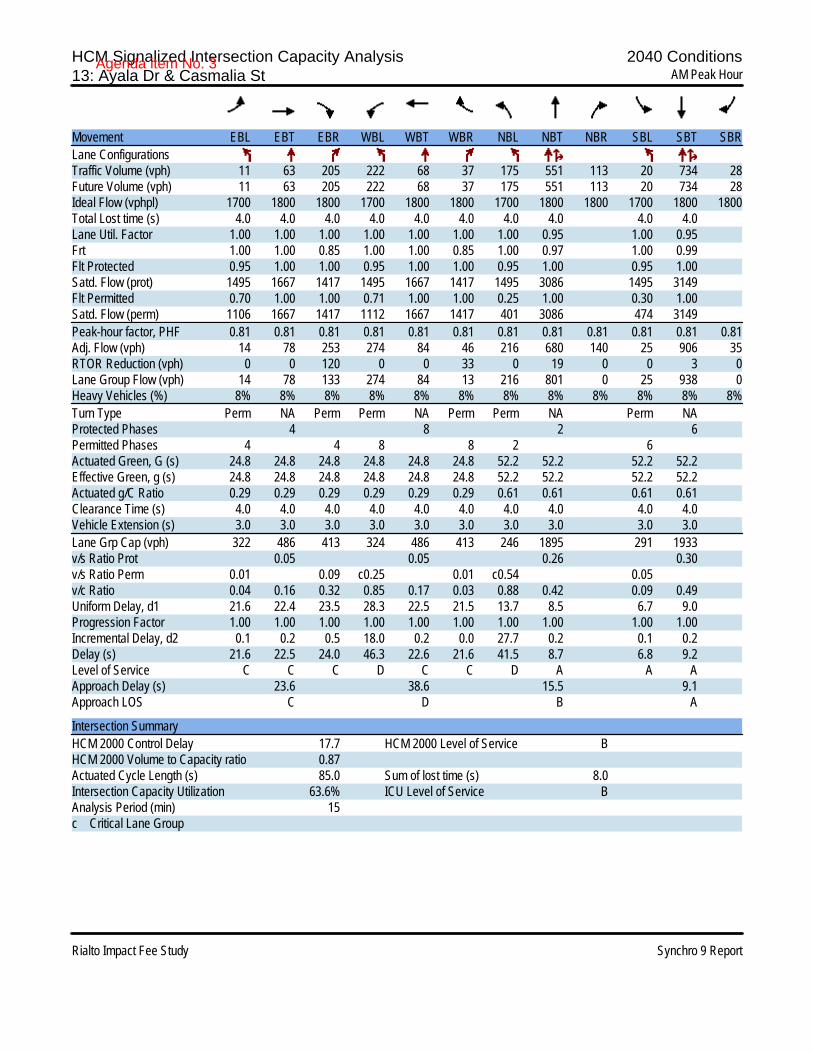
HCM Signalized Intersection Capacity Analysis 2040 Conditions13: Ayala Dr & Casmalia St AM Peak Hour
Rialto Impact Fee Study Synchro 9 Report
Movement EBL EBT EBR WBL WBT WBR NBL NBT NBR SBL SBT SBRLane ConfigurationsTraffic Volume (vph) 11 63 205 222 68 37 175 551 113 20 734 28Future Volume (vph) 11 63 205 222 68 37 175 551 113 20 734 28Ideal Flow (vphpl) 1700 1800 1800 1700 1800 1800 1700 1800 1800 1700 1800 1800Total Lost time (s) 4.0 4.0 4.0 4.0 4.0 4.0 4.0 4.0 4.0 4.0Lane Util. Factor 1.00 1.00 1.00 1.00 1.00 1.00 1.00 0.95 1.00 0.95Frt 1.00 1.00 0.85 1.00 1.00 0.85 1.00 0.97 1.00 0.99Flt Protected 0.95 1.00 1.00 0.95 1.00 1.00 0.95 1.00 0.95 1.00Satd. Flow (prot) 1495 1667 1417 1495 1667 1417 1495 3086 1495 3149Flt Permitted 0.70 1.00 1.00 0.71 1.00 1.00 0.25 1.00 0.30 1.00Satd. Flow (perm) 1106 1667 1417 1112 1667 1417 401 3086 474 3149Peak-hour factor, PHF 0.81 0.81 0.81 0.81 0.81 0.81 0.81 0.81 0.81 0.81 0.81 0.81Adj. Flow (vph) 14 78 253 274 84 46 216 680 140 25 906 35RTOR Reduction (vph) 0 0 120 0 0 33 0 19 0 0 3 0Lane Group Flow (vph) 14 78 133 274 84 13 216 801 0 25 938 0Heavy Vehicles (%) 8% 8% 8% 8% 8% 8% 8% 8% 8% 8% 8% 8%Turn Type Perm NA Perm Perm NA Perm Perm NA Perm NAProtected Phases 4 8 2 6Permitted Phases 4 4 8 8 2 6Actuated Green, G (s) 24.8 24.8 24.8 24.8 24.8 24.8 52.2 52.2 52.2 52.2Effective Green, g (s) 24.8 24.8 24.8 24.8 24.8 24.8 52.2 52.2 52.2 52.2Actuated g/C Ratio 0.29 0.29 0.29 0.29 0.29 0.29 0.61 0.61 0.61 0.61Clearance Time (s) 4.0 4.0 4.0 4.0 4.0 4.0 4.0 4.0 4.0 4.0Vehicle Extension (s) 3.0 3.0 3.0 3.0 3.0 3.0 3.0 3.0 3.0 3.0Lane Grp Cap (vph) 322 486 413 324 486 413 246 1895 291 1933v/s Ratio Prot 0.05 0.05 0.26 0.30v/s Ratio Perm 0.01 0.09 c0.25 0.01 c0.54 0.05v/c Ratio 0.04 0.16 0.32 0.85 0.17 0.03 0.88 0.42 0.09 0.49Uniform Delay, d1 21.6 22.4 23.5 28.3 22.5 21.5 13.7 8.5 6.7 9.0Progression Factor 1.00 1.00 1.00 1.00 1.00 1.00 1.00 1.00 1.00 1.00Incremental Delay, d2 0.1 0.2 0.5 18.0 0.2 0.0 27.7 0.2 0.1 0.2Delay (s) 21.6 22.5 24.0 46.3 22.6 21.6 41.5 8.7 6.8 9.2Level of Service C C C D C C D A A AApproach Delay (s) 23.6 38.6 15.5 9.1Approach LOS C D B A
Intersection SummaryHCM 2000 Control Delay 17.7 HCM 2000 Level of Service BHCM 2000 Volume to Capacity ratio 0.87Actuated Cycle Length (s) 85.0 Sum of lost time (s) 8.0Intersection Capacity Utilization 63.6% ICU Level of Service BAnalysis Period (min) 15c Critical Lane Group
Agenda item No. 3

HCM Signalized Intersection Capacity Analysis 2040 Conditions14: Ayala Dr & I-210 WB Ramps AM Peak Hour
Rialto Impact Fee Study Synchro 9 Report
Movement EBL EBT EBR WBL WBT WBR NBL NBT NBR SBL SBT SBRLane ConfigurationsTraffic Volume (vph) 0 0 0 559 3 338 641 491 0 0 769 391Future Volume (vph) 0 0 0 559 3 338 641 491 0 0 769 391Ideal Flow (vphpl) 1800 1800 1800 1700 1800 1800 1600 1800 1800 1800 1800 1800Total Lost time (s) 4.0 4.0 4.0 4.0 4.0 4.0Lane Util. Factor 0.95 0.91 0.95 0.97 0.95 0.95Frt 1.00 0.97 0.85 1.00 1.00 0.95Flt Protected 0.95 0.96 1.00 0.95 1.00 1.00Satd. Flow (prot) 1421 1417 1346 2730 3167 3007Flt Permitted 0.95 0.96 1.00 0.95 1.00 1.00Satd. Flow (perm) 1421 1417 1346 2730 3167 3007Peak-hour factor, PHF 0.85 0.85 0.85 0.85 0.85 0.85 0.85 0.85 0.85 0.85 0.85 0.85Adj. Flow (vph) 0 0 0 658 4 398 754 578 0 0 905 460RTOR Reduction (vph) 0 0 0 0 9 253 0 0 0 0 72 0Lane Group Flow (vph) 0 0 0 368 353 77 754 578 0 0 1294 0Heavy Vehicles (%) 8% 8% 8% 8% 8% 8% 8% 8% 8% 8% 8% 8%Turn Type Perm NA Perm Prot NA NAProtected Phases 8 5 2 6Permitted Phases 8 8Actuated Green, G (s) 21.0 21.0 21.0 22.0 61.0 35.0Effective Green, g (s) 21.0 21.0 21.0 22.0 61.0 35.0Actuated g/C Ratio 0.23 0.23 0.23 0.24 0.68 0.39Clearance Time (s) 4.0 4.0 4.0 4.0 4.0 4.0Vehicle Extension (s) 3.0 3.0 3.0 3.0 3.0 3.0Lane Grp Cap (vph) 331 330 314 667 2146 1169v/s Ratio Prot c0.28 0.18 c0.43v/s Ratio Perm c0.26 0.25 0.06v/c Ratio 1.11 1.07 0.25 1.13 0.27 1.11Uniform Delay, d1 34.5 34.5 28.1 34.0 5.7 27.5Progression Factor 1.00 1.00 1.00 1.00 1.00 1.00Incremental Delay, d2 83.1 69.1 0.4 76.6 0.1 60.6Delay (s) 117.6 103.6 28.5 110.6 5.8 88.1Level of Service F F C F A FApproach Delay (s) 0.0 85.0 65.1 88.1Approach LOS A F E F
Intersection SummaryHCM 2000 Control Delay 79.1 HCM 2000 Level of Service EHCM 2000 Volume to Capacity ratio 1.11Actuated Cycle Length (s) 90.0 Sum of lost time (s) 12.0Intersection Capacity Utilization 87.4% ICU Level of Service EAnalysis Period (min) 15c Critical Lane Group
Agenda item No. 3
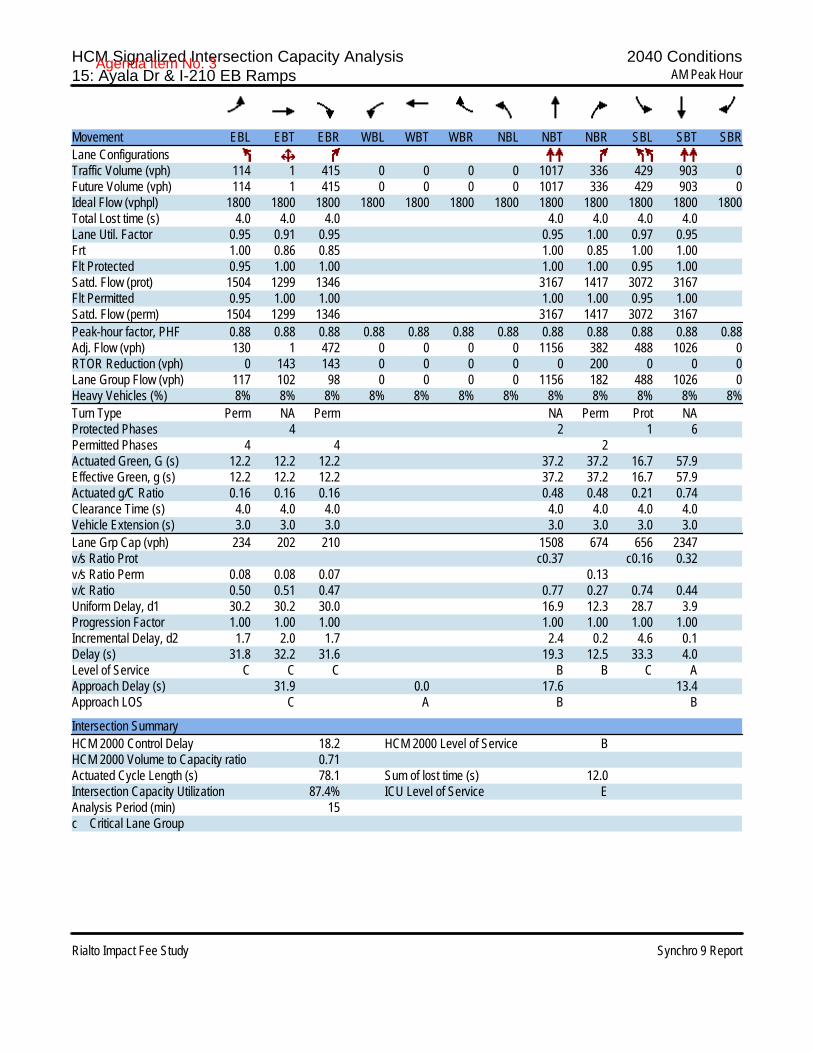
HCM Signalized Intersection Capacity Analysis 2040 Conditions15: Ayala Dr & I-210 EB Ramps AM Peak Hour
Rialto Impact Fee Study Synchro 9 Report
Movement EBL EBT EBR WBL WBT WBR NBL NBT NBR SBL SBT SBRLane ConfigurationsTraffic Volume (vph) 114 1 415 0 0 0 0 1017 336 429 903 0Future Volume (vph) 114 1 415 0 0 0 0 1017 336 429 903 0Ideal Flow (vphpl) 1800 1800 1800 1800 1800 1800 1800 1800 1800 1800 1800 1800Total Lost time (s) 4.0 4.0 4.0 4.0 4.0 4.0 4.0Lane Util. Factor 0.95 0.91 0.95 0.95 1.00 0.97 0.95Frt 1.00 0.86 0.85 1.00 0.85 1.00 1.00Flt Protected 0.95 1.00 1.00 1.00 1.00 0.95 1.00Satd. Flow (prot) 1504 1299 1346 3167 1417 3072 3167Flt Permitted 0.95 1.00 1.00 1.00 1.00 0.95 1.00Satd. Flow (perm) 1504 1299 1346 3167 1417 3072 3167Peak-hour factor, PHF 0.88 0.88 0.88 0.88 0.88 0.88 0.88 0.88 0.88 0.88 0.88 0.88Adj. Flow (vph) 130 1 472 0 0 0 0 1156 382 488 1026 0RTOR Reduction (vph) 0 143 143 0 0 0 0 0 200 0 0 0Lane Group Flow (vph) 117 102 98 0 0 0 0 1156 182 488 1026 0Heavy Vehicles (%) 8% 8% 8% 8% 8% 8% 8% 8% 8% 8% 8% 8%Turn Type Perm NA Perm NA Perm Prot NAProtected Phases 4 2 1 6Permitted Phases 4 4 2Actuated Green, G (s) 12.2 12.2 12.2 37.2 37.2 16.7 57.9Effective Green, g (s) 12.2 12.2 12.2 37.2 37.2 16.7 57.9Actuated g/C Ratio 0.16 0.16 0.16 0.48 0.48 0.21 0.74Clearance Time (s) 4.0 4.0 4.0 4.0 4.0 4.0 4.0Vehicle Extension (s) 3.0 3.0 3.0 3.0 3.0 3.0 3.0Lane Grp Cap (vph) 234 202 210 1508 674 656 2347v/s Ratio Prot c0.37 c0.16 0.32v/s Ratio Perm 0.08 0.08 0.07 0.13v/c Ratio 0.50 0.51 0.47 0.77 0.27 0.74 0.44Uniform Delay, d1 30.2 30.2 30.0 16.9 12.3 28.7 3.9Progression Factor 1.00 1.00 1.00 1.00 1.00 1.00 1.00Incremental Delay, d2 1.7 2.0 1.7 2.4 0.2 4.6 0.1Delay (s) 31.8 32.2 31.6 19.3 12.5 33.3 4.0Level of Service C C C B B C AApproach Delay (s) 31.9 0.0 17.6 13.4Approach LOS C A B B
Intersection SummaryHCM 2000 Control Delay 18.2 HCM 2000 Level of Service BHCM 2000 Volume to Capacity ratio 0.71Actuated Cycle Length (s) 78.1 Sum of lost time (s) 12.0Intersection Capacity Utilization 87.4% ICU Level of Service EAnalysis Period (min) 15c Critical Lane Group
Agenda item No. 3

HCM Signalized Intersection Capacity Analysis 2040 Conditions16: Ayala Dr & Renaissance Pkwy/Easton St AM Peak Hour
Rialto Impact Fee Study Synchro 9 Report
Movement EBL EBT EBR WBL WBT WBR NBL NBT NBR SBL SBT SBRLane ConfigurationsTraffic Volume (vph) 132 70 125 2 209 360 265 863 3 159 947 134Future Volume (vph) 132 70 125 2 209 360 265 863 3 159 947 134Ideal Flow (vphpl) 1700 1800 1800 1700 1800 1800 1700 1800 1800 1700 1800 1800Total Lost time (s) 4.0 4.0 4.0 4.0 4.0 4.0 4.0 4.0 4.0 4.0Lane Util. Factor 1.00 0.95 1.00 0.95 1.00 0.95 1.00 1.00 0.95 1.00Frt 1.00 0.90 1.00 0.91 1.00 1.00 0.85 1.00 1.00 0.85Flt Protected 0.95 1.00 0.95 1.00 0.95 1.00 1.00 0.95 1.00 1.00Satd. Flow (prot) 1495 2863 1495 2866 1495 3167 1417 1495 3167 1417Flt Permitted 0.95 1.00 0.95 1.00 0.95 1.00 1.00 0.95 1.00 1.00Satd. Flow (perm) 1495 2863 1495 2866 1495 3167 1417 1495 3167 1417Peak-hour factor, PHF 0.88 0.88 0.88 0.88 0.88 0.88 0.88 0.88 0.88 0.88 0.88 0.88Adj. Flow (vph) 150 80 142 2 238 409 301 981 3 181 1076 152RTOR Reduction (vph) 0 102 0 0 279 0 0 0 2 0 0 99Lane Group Flow (vph) 150 120 0 2 368 0 301 981 1 181 1076 53Heavy Vehicles (%) 8% 8% 8% 8% 8% 8% 8% 8% 8% 8% 8% 8%Turn Type Prot NA Prot NA Prot NA Perm Prot NA PermProtected Phases 7 4 3 8 5 2 1 6Permitted Phases 2 6Actuated Green, G (s) 11.0 28.3 0.8 18.1 21.0 41.7 41.7 14.8 35.5 35.5Effective Green, g (s) 11.0 28.3 0.8 18.1 21.0 41.7 41.7 14.8 35.5 35.5Actuated g/C Ratio 0.11 0.28 0.01 0.18 0.21 0.41 0.41 0.15 0.35 0.35Clearance Time (s) 4.0 4.0 4.0 4.0 4.0 4.0 4.0 4.0 4.0 4.0Vehicle Extension (s) 3.0 3.0 3.0 3.0 3.0 3.0 3.0 3.0 3.0 3.0Lane Grp Cap (vph) 161 797 11 510 309 1299 581 217 1106 495v/s Ratio Prot c0.10 0.04 0.00 c0.13 c0.20 0.31 0.12 c0.34v/s Ratio Perm 0.00 0.04v/c Ratio 0.93 0.15 0.18 0.72 0.97 0.76 0.00 0.83 0.97 0.11Uniform Delay, d1 44.9 27.6 50.1 39.4 40.0 25.6 17.7 42.2 32.6 22.3Progression Factor 1.00 1.00 1.00 1.00 1.00 1.00 1.00 1.00 1.00 1.00Incremental Delay, d2 50.9 0.1 7.8 5.0 43.8 2.5 0.0 23.2 20.6 0.1Delay (s) 95.9 27.7 57.9 44.4 83.9 28.1 17.7 65.4 53.2 22.4Level of Service F C E D F C B E D CApproach Delay (s) 55.2 44.4 41.2 51.5Approach LOS E D D D
Intersection SummaryHCM 2000 Control Delay 47.0 HCM 2000 Level of Service DHCM 2000 Volume to Capacity ratio 0.91Actuated Cycle Length (s) 101.6 Sum of lost time (s) 16.0Intersection Capacity Utilization 83.9% ICU Level of Service EAnalysis Period (min) 15c Critical Lane Group
Agenda item No. 3

HCM Signalized Intersection Capacity Analysis 2040 Conditions17: Cedar Ave/Ayala Dr & Base Line Rd AM Peak Hour
Rialto Impact Fee Study Synchro 9 Report
Movement EBL EBT EBR WBL WBT WBR NBL NBT NBR SBL SBT SBRLane ConfigurationsTraffic Volume (vph) 249 420 135 65 1047 47 147 611 98 30 609 190Future Volume (vph) 249 420 135 65 1047 47 147 611 98 30 609 190Ideal Flow (vphpl) 1700 1800 1800 1700 1800 1800 1700 1800 1800 1700 1800 1800Total Lost time (s) 4.0 4.0 4.0 4.0 4.0 4.0 4.0 4.0 4.0Lane Util. Factor 1.00 0.95 1.00 0.95 1.00 1.00 1.00 1.00 0.95Frt 1.00 0.96 1.00 0.99 1.00 1.00 0.85 1.00 0.96Flt Protected 0.95 1.00 0.95 1.00 0.95 1.00 1.00 0.95 1.00Satd. Flow (prot) 1495 3051 1495 3146 1495 1667 1417 1495 3054Flt Permitted 0.95 1.00 0.95 1.00 0.95 1.00 1.00 0.95 1.00Satd. Flow (perm) 1495 3051 1495 3146 1495 1667 1417 1495 3054Peak-hour factor, PHF 0.88 0.88 0.88 0.88 0.88 0.88 0.88 0.88 0.88 0.88 0.88 0.88Adj. Flow (vph) 283 477 153 74 1190 53 167 694 111 34 692 216RTOR Reduction (vph) 0 30 0 0 3 0 0 0 60 0 29 0Lane Group Flow (vph) 283 600 0 74 1240 0 167 694 51 34 879 0Heavy Vehicles (%) 8% 8% 8% 8% 8% 8% 8% 8% 8% 8% 8% 8%Turn Type Prot NA Prot NA Prot NA Perm Prot NAProtected Phases 7 4 3 8 5 2 1 6Permitted Phases 2Actuated Green, G (s) 14.0 36.6 8.2 30.8 10.0 39.2 39.2 2.4 31.6Effective Green, g (s) 14.0 36.6 8.2 30.8 10.0 39.2 39.2 2.4 31.6Actuated g/C Ratio 0.14 0.36 0.08 0.30 0.10 0.38 0.38 0.02 0.31Clearance Time (s) 4.0 4.0 4.0 4.0 4.0 4.0 4.0 4.0 4.0Vehicle Extension (s) 3.0 3.0 3.0 3.0 3.0 3.0 3.0 3.0 3.0Lane Grp Cap (vph) 204 1090 119 946 145 638 542 35 942v/s Ratio Prot c0.19 0.20 0.05 c0.39 c0.11 c0.42 0.02 0.29v/s Ratio Perm 0.04v/c Ratio 1.39 0.55 0.62 1.31 1.15 1.09 0.09 0.97 0.93Uniform Delay, d1 44.2 26.3 45.6 35.8 46.2 31.6 20.2 50.0 34.4Progression Factor 1.00 1.00 1.00 1.00 1.00 1.00 1.00 1.00 1.00Incremental Delay, d2 201.6 0.6 9.7 147.2 121.3 61.8 0.3 140.0 17.0Delay (s) 245.8 26.9 55.3 183.0 167.5 93.4 20.6 190.0 51.4Level of Service F C E F F F C F DApproach Delay (s) 94.8 175.9 97.8 56.4Approach LOS F F F E
Intersection SummaryHCM 2000 Control Delay 112.5 HCM 2000 Level of Service FHCM 2000 Volume to Capacity ratio 1.25Actuated Cycle Length (s) 102.4 Sum of lost time (s) 16.0Intersection Capacity Utilization 98.2% ICU Level of Service FAnalysis Period (min) 15c Critical Lane Group
Agenda item No. 3
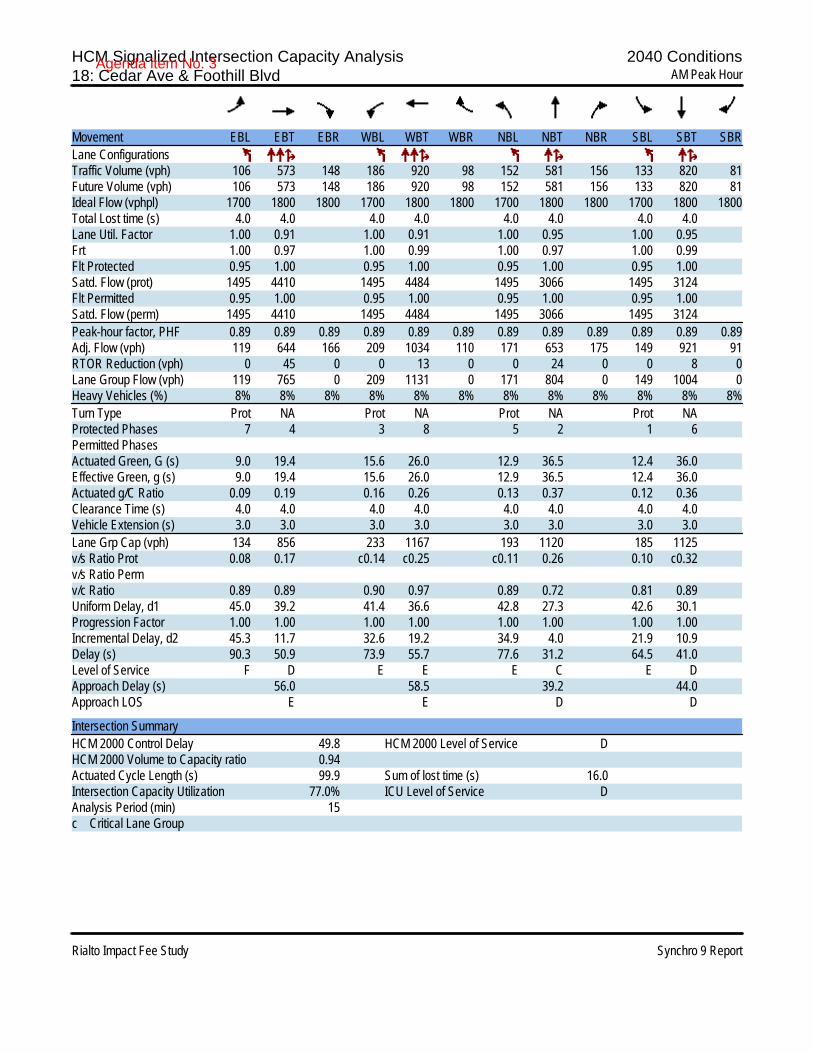
HCM Signalized Intersection Capacity Analysis 2040 Conditions18: Cedar Ave & Foothill Blvd AM Peak Hour
Rialto Impact Fee Study Synchro 9 Report
Movement EBL EBT EBR WBL WBT WBR NBL NBT NBR SBL SBT SBRLane ConfigurationsTraffic Volume (vph) 106 573 148 186 920 98 152 581 156 133 820 81Future Volume (vph) 106 573 148 186 920 98 152 581 156 133 820 81Ideal Flow (vphpl) 1700 1800 1800 1700 1800 1800 1700 1800 1800 1700 1800 1800Total Lost time (s) 4.0 4.0 4.0 4.0 4.0 4.0 4.0 4.0Lane Util. Factor 1.00 0.91 1.00 0.91 1.00 0.95 1.00 0.95Frt 1.00 0.97 1.00 0.99 1.00 0.97 1.00 0.99Flt Protected 0.95 1.00 0.95 1.00 0.95 1.00 0.95 1.00Satd. Flow (prot) 1495 4410 1495 4484 1495 3066 1495 3124Flt Permitted 0.95 1.00 0.95 1.00 0.95 1.00 0.95 1.00Satd. Flow (perm) 1495 4410 1495 4484 1495 3066 1495 3124Peak-hour factor, PHF 0.89 0.89 0.89 0.89 0.89 0.89 0.89 0.89 0.89 0.89 0.89 0.89Adj. Flow (vph) 119 644 166 209 1034 110 171 653 175 149 921 91RTOR Reduction (vph) 0 45 0 0 13 0 0 24 0 0 8 0Lane Group Flow (vph) 119 765 0 209 1131 0 171 804 0 149 1004 0Heavy Vehicles (%) 8% 8% 8% 8% 8% 8% 8% 8% 8% 8% 8% 8%Turn Type Prot NA Prot NA Prot NA Prot NAProtected Phases 7 4 3 8 5 2 1 6Permitted PhasesActuated Green, G (s) 9.0 19.4 15.6 26.0 12.9 36.5 12.4 36.0Effective Green, g (s) 9.0 19.4 15.6 26.0 12.9 36.5 12.4 36.0Actuated g/C Ratio 0.09 0.19 0.16 0.26 0.13 0.37 0.12 0.36Clearance Time (s) 4.0 4.0 4.0 4.0 4.0 4.0 4.0 4.0Vehicle Extension (s) 3.0 3.0 3.0 3.0 3.0 3.0 3.0 3.0Lane Grp Cap (vph) 134 856 233 1167 193 1120 185 1125v/s Ratio Prot 0.08 0.17 c0.14 c0.25 c0.11 0.26 0.10 c0.32v/s Ratio Permv/c Ratio 0.89 0.89 0.90 0.97 0.89 0.72 0.81 0.89Uniform Delay, d1 45.0 39.2 41.4 36.6 42.8 27.3 42.6 30.1Progression Factor 1.00 1.00 1.00 1.00 1.00 1.00 1.00 1.00Incremental Delay, d2 45.3 11.7 32.6 19.2 34.9 4.0 21.9 10.9Delay (s) 90.3 50.9 73.9 55.7 77.6 31.2 64.5 41.0Level of Service F D E E E C E DApproach Delay (s) 56.0 58.5 39.2 44.0Approach LOS E E D D
Intersection SummaryHCM 2000 Control Delay 49.8 HCM 2000 Level of Service DHCM 2000 Volume to Capacity ratio 0.94Actuated Cycle Length (s) 99.9 Sum of lost time (s) 16.0Intersection Capacity Utilization 77.0% ICU Level of Service DAnalysis Period (min) 15c Critical Lane Group
Agenda item No. 3
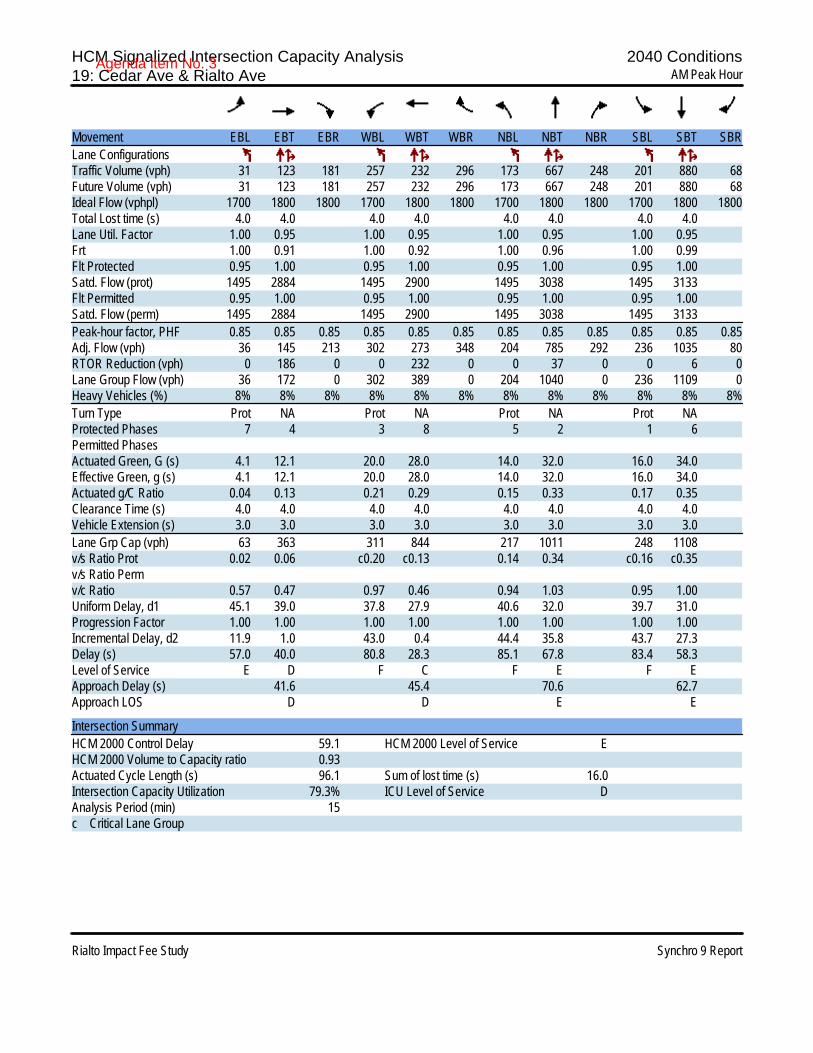
HCM Signalized Intersection Capacity Analysis 2040 Conditions19: Cedar Ave & Rialto Ave AM Peak Hour
Rialto Impact Fee Study Synchro 9 Report
Movement EBL EBT EBR WBL WBT WBR NBL NBT NBR SBL SBT SBRLane ConfigurationsTraffic Volume (vph) 31 123 181 257 232 296 173 667 248 201 880 68Future Volume (vph) 31 123 181 257 232 296 173 667 248 201 880 68Ideal Flow (vphpl) 1700 1800 1800 1700 1800 1800 1700 1800 1800 1700 1800 1800Total Lost time (s) 4.0 4.0 4.0 4.0 4.0 4.0 4.0 4.0Lane Util. Factor 1.00 0.95 1.00 0.95 1.00 0.95 1.00 0.95Frt 1.00 0.91 1.00 0.92 1.00 0.96 1.00 0.99Flt Protected 0.95 1.00 0.95 1.00 0.95 1.00 0.95 1.00Satd. Flow (prot) 1495 2884 1495 2900 1495 3038 1495 3133Flt Permitted 0.95 1.00 0.95 1.00 0.95 1.00 0.95 1.00Satd. Flow (perm) 1495 2884 1495 2900 1495 3038 1495 3133Peak-hour factor, PHF 0.85 0.85 0.85 0.85 0.85 0.85 0.85 0.85 0.85 0.85 0.85 0.85Adj. Flow (vph) 36 145 213 302 273 348 204 785 292 236 1035 80RTOR Reduction (vph) 0 186 0 0 232 0 0 37 0 0 6 0Lane Group Flow (vph) 36 172 0 302 389 0 204 1040 0 236 1109 0Heavy Vehicles (%) 8% 8% 8% 8% 8% 8% 8% 8% 8% 8% 8% 8%Turn Type Prot NA Prot NA Prot NA Prot NAProtected Phases 7 4 3 8 5 2 1 6Permitted PhasesActuated Green, G (s) 4.1 12.1 20.0 28.0 14.0 32.0 16.0 34.0Effective Green, g (s) 4.1 12.1 20.0 28.0 14.0 32.0 16.0 34.0Actuated g/C Ratio 0.04 0.13 0.21 0.29 0.15 0.33 0.17 0.35Clearance Time (s) 4.0 4.0 4.0 4.0 4.0 4.0 4.0 4.0Vehicle Extension (s) 3.0 3.0 3.0 3.0 3.0 3.0 3.0 3.0Lane Grp Cap (vph) 63 363 311 844 217 1011 248 1108v/s Ratio Prot 0.02 0.06 c0.20 c0.13 0.14 0.34 c0.16 c0.35v/s Ratio Permv/c Ratio 0.57 0.47 0.97 0.46 0.94 1.03 0.95 1.00Uniform Delay, d1 45.1 39.0 37.8 27.9 40.6 32.0 39.7 31.0Progression Factor 1.00 1.00 1.00 1.00 1.00 1.00 1.00 1.00Incremental Delay, d2 11.9 1.0 43.0 0.4 44.4 35.8 43.7 27.3Delay (s) 57.0 40.0 80.8 28.3 85.1 67.8 83.4 58.3Level of Service E D F C F E F EApproach Delay (s) 41.6 45.4 70.6 62.7Approach LOS D D E E
Intersection SummaryHCM 2000 Control Delay 59.1 HCM 2000 Level of Service EHCM 2000 Volume to Capacity ratio 0.93Actuated Cycle Length (s) 96.1 Sum of lost time (s) 16.0Intersection Capacity Utilization 79.3% ICU Level of Service DAnalysis Period (min) 15c Critical Lane Group
Agenda item No. 3

HCM Signalized Intersection Capacity Analysis 2040 Conditions20: Cedar Ave & Merrill Ave AM Peak Hour
Rialto Impact Fee Study Synchro 9 Report
Movement EBL EBT EBR WBL WBT WBR NBL NBT NBR SBL SBT SBRLane ConfigurationsTraffic Volume (vph) 88 226 128 155 742 224 72 319 79 93 811 29Future Volume (vph) 88 226 128 155 742 224 72 319 79 93 811 29Ideal Flow (vphpl) 1700 1800 1800 1700 1800 1800 1700 1800 1800 1700 1800 1800Total Lost time (s) 4.0 4.0 4.0 4.0 4.0 4.0 4.0 4.0Lane Util. Factor 1.00 0.95 1.00 0.95 1.00 0.95 1.00 0.95Frt 1.00 0.95 1.00 0.97 1.00 0.97 1.00 0.99Flt Protected 0.95 1.00 0.95 1.00 0.95 1.00 0.95 1.00Satd. Flow (prot) 1495 2995 1495 3056 1495 3072 1495 3150Flt Permitted 0.14 1.00 0.49 1.00 0.95 1.00 0.95 1.00Satd. Flow (perm) 226 2995 768 3056 1495 3072 1495 3150Peak-hour factor, PHF 0.90 0.90 0.90 0.90 0.90 0.90 0.90 0.90 0.90 0.90 0.90 0.90Adj. Flow (vph) 98 251 142 172 824 249 80 354 88 103 901 32RTOR Reduction (vph) 0 78 0 0 30 0 0 20 0 0 3 0Lane Group Flow (vph) 98 315 0 172 1043 0 80 422 0 103 930 0Heavy Vehicles (%) 8% 8% 8% 8% 8% 8% 8% 8% 8% 8% 8% 8%Turn Type Perm NA Perm NA Prot NA Prot NAProtected Phases 4 8 5 2 1 6Permitted Phases 4 8Actuated Green, G (s) 41.1 41.1 41.1 41.1 6.2 29.3 8.9 32.0Effective Green, g (s) 41.1 41.1 41.1 41.1 6.2 29.3 8.9 32.0Actuated g/C Ratio 0.45 0.45 0.45 0.45 0.07 0.32 0.10 0.35Clearance Time (s) 4.0 4.0 4.0 4.0 4.0 4.0 4.0 4.0Vehicle Extension (s) 3.0 3.0 3.0 3.0 3.0 3.0 3.0 3.0Lane Grp Cap (vph) 101 1348 345 1375 101 985 145 1104v/s Ratio Prot 0.11 0.34 0.05 0.14 c0.07 c0.30v/s Ratio Perm c0.43 0.22v/c Ratio 0.97 0.23 0.50 0.76 0.79 0.43 0.71 0.84Uniform Delay, d1 24.5 15.4 17.8 21.0 41.9 24.4 40.0 27.3Progression Factor 1.00 1.00 1.00 1.00 1.00 1.00 1.00 1.00Incremental Delay, d2 79.6 0.1 1.1 2.5 33.3 0.3 15.1 6.0Delay (s) 104.2 15.5 18.9 23.4 75.3 24.7 55.1 33.3Level of Service F B B C E C E CApproach Delay (s) 33.2 22.8 32.5 35.5Approach LOS C C C D
Intersection SummaryHCM 2000 Control Delay 29.9 HCM 2000 Level of Service CHCM 2000 Volume to Capacity ratio 0.91Actuated Cycle Length (s) 91.3 Sum of lost time (s) 12.0Intersection Capacity Utilization 77.1% ICU Level of Service DAnalysis Period (min) 15c Critical Lane Group
Agenda item No. 3
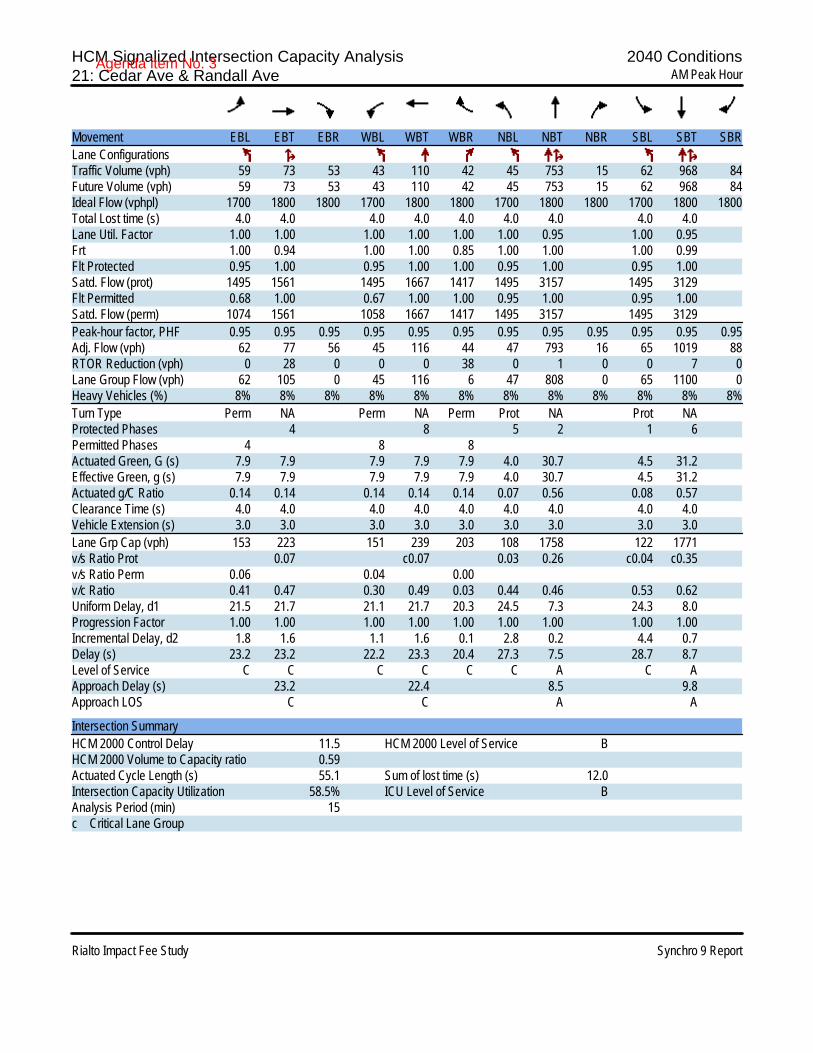
HCM Signalized Intersection Capacity Analysis 2040 Conditions21: Cedar Ave & Randall Ave AM Peak Hour
Rialto Impact Fee Study Synchro 9 Report
Movement EBL EBT EBR WBL WBT WBR NBL NBT NBR SBL SBT SBRLane ConfigurationsTraffic Volume (vph) 59 73 53 43 110 42 45 753 15 62 968 84Future Volume (vph) 59 73 53 43 110 42 45 753 15 62 968 84Ideal Flow (vphpl) 1700 1800 1800 1700 1800 1800 1700 1800 1800 1700 1800 1800Total Lost time (s) 4.0 4.0 4.0 4.0 4.0 4.0 4.0 4.0 4.0Lane Util. Factor 1.00 1.00 1.00 1.00 1.00 1.00 0.95 1.00 0.95Frt 1.00 0.94 1.00 1.00 0.85 1.00 1.00 1.00 0.99Flt Protected 0.95 1.00 0.95 1.00 1.00 0.95 1.00 0.95 1.00Satd. Flow (prot) 1495 1561 1495 1667 1417 1495 3157 1495 3129Flt Permitted 0.68 1.00 0.67 1.00 1.00 0.95 1.00 0.95 1.00Satd. Flow (perm) 1074 1561 1058 1667 1417 1495 3157 1495 3129Peak-hour factor, PHF 0.95 0.95 0.95 0.95 0.95 0.95 0.95 0.95 0.95 0.95 0.95 0.95Adj. Flow (vph) 62 77 56 45 116 44 47 793 16 65 1019 88RTOR Reduction (vph) 0 28 0 0 0 38 0 1 0 0 7 0Lane Group Flow (vph) 62 105 0 45 116 6 47 808 0 65 1100 0Heavy Vehicles (%) 8% 8% 8% 8% 8% 8% 8% 8% 8% 8% 8% 8%Turn Type Perm NA Perm NA Perm Prot NA Prot NAProtected Phases 4 8 5 2 1 6Permitted Phases 4 8 8Actuated Green, G (s) 7.9 7.9 7.9 7.9 7.9 4.0 30.7 4.5 31.2Effective Green, g (s) 7.9 7.9 7.9 7.9 7.9 4.0 30.7 4.5 31.2Actuated g/C Ratio 0.14 0.14 0.14 0.14 0.14 0.07 0.56 0.08 0.57Clearance Time (s) 4.0 4.0 4.0 4.0 4.0 4.0 4.0 4.0 4.0Vehicle Extension (s) 3.0 3.0 3.0 3.0 3.0 3.0 3.0 3.0 3.0Lane Grp Cap (vph) 153 223 151 239 203 108 1758 122 1771v/s Ratio Prot 0.07 c0.07 0.03 0.26 c0.04 c0.35v/s Ratio Perm 0.06 0.04 0.00v/c Ratio 0.41 0.47 0.30 0.49 0.03 0.44 0.46 0.53 0.62Uniform Delay, d1 21.5 21.7 21.1 21.7 20.3 24.5 7.3 24.3 8.0Progression Factor 1.00 1.00 1.00 1.00 1.00 1.00 1.00 1.00 1.00Incremental Delay, d2 1.8 1.6 1.1 1.6 0.1 2.8 0.2 4.4 0.7Delay (s) 23.2 23.2 22.2 23.3 20.4 27.3 7.5 28.7 8.7Level of Service C C C C C C A C AApproach Delay (s) 23.2 22.4 8.5 9.8Approach LOS C C A A
Intersection SummaryHCM 2000 Control Delay 11.5 HCM 2000 Level of Service BHCM 2000 Volume to Capacity ratio 0.59Actuated Cycle Length (s) 55.1 Sum of lost time (s) 12.0Intersection Capacity Utilization 58.5% ICU Level of Service BAnalysis Period (min) 15c Critical Lane Group
Agenda item No. 3

HCM Signalized Intersection Capacity Analysis 2040 Conditions22: Cactus Ave/Country Club Dr & Riverside Ave AM Peak Hour
Rialto Impact Fee Study Synchro 9 Report
Movement EBL EBT EBR WBL WBT WBR NBL NBT NBR SBL SBT SBRLane ConfigurationsTraffic Volume (vph) 94 440 14 114 460 23 43 484 132 37 21 198Future Volume (vph) 94 440 14 114 460 23 43 484 132 37 21 198Ideal Flow (vphpl) 1700 1800 1800 1700 1800 1800 1700 1800 1800 1800 1800 1800Total Lost time (s) 4.0 4.0 4.0 4.0 4.0 4.0 4.0Lane Util. Factor 1.00 0.95 1.00 0.95 1.00 1.00 0.95Frt 1.00 1.00 1.00 0.99 1.00 0.97 0.88Flt Protected 0.95 1.00 0.95 1.00 0.95 1.00 0.99Satd. Flow (prot) 1583 3338 1583 3329 1583 1708 2943Flt Permitted 0.95 1.00 0.95 1.00 0.58 1.00 0.79Satd. Flow (perm) 1583 3338 1583 3329 968 1708 2343Peak-hour factor, PHF 0.92 0.92 0.92 0.92 0.92 0.92 0.92 0.92 0.92 0.92 0.92 0.92Adj. Flow (vph) 102 478 15 124 500 25 47 526 143 40 23 215RTOR Reduction (vph) 0 2 0 0 4 0 0 11 0 0 108 0Lane Group Flow (vph) 102 491 0 124 521 0 47 658 0 0 170 0Turn Type Prot NA Prot NA Perm NA Perm NAProtected Phases 7 4 3 8 2 6Permitted Phases 2 6Actuated Green, G (s) 7.4 16.7 8.4 17.7 36.6 36.6 36.6Effective Green, g (s) 7.4 16.7 8.4 17.7 36.6 36.6 36.6Actuated g/C Ratio 0.10 0.23 0.11 0.24 0.50 0.50 0.50Clearance Time (s) 4.0 4.0 4.0 4.0 4.0 4.0 4.0Vehicle Extension (s) 3.0 3.0 3.0 3.0 3.0 3.0 3.0Lane Grp Cap (vph) 158 756 180 799 480 848 1163v/s Ratio Prot 0.06 0.15 c0.08 c0.16 c0.39v/s Ratio Perm 0.05 0.07v/c Ratio 0.65 0.65 0.69 0.65 0.10 0.78 0.15Uniform Delay, d1 31.9 25.8 31.4 25.2 9.8 15.2 10.1Progression Factor 1.00 1.00 1.00 1.00 1.00 1.00 1.00Incremental Delay, d2 8.7 1.9 10.5 1.9 0.1 4.5 0.1Delay (s) 40.6 27.8 41.9 27.1 9.9 19.7 10.1Level of Service D C D C A B BApproach Delay (s) 30.0 30.0 19.0 10.1Approach LOS C C B B
Intersection SummaryHCM 2000 Control Delay 24.0 HCM 2000 Level of Service CHCM 2000 Volume to Capacity ratio 0.74Actuated Cycle Length (s) 73.7 Sum of lost time (s) 12.0Intersection Capacity Utilization 71.2% ICU Level of Service CAnalysis Period (min) 15c Critical Lane Group
Agenda item No. 3
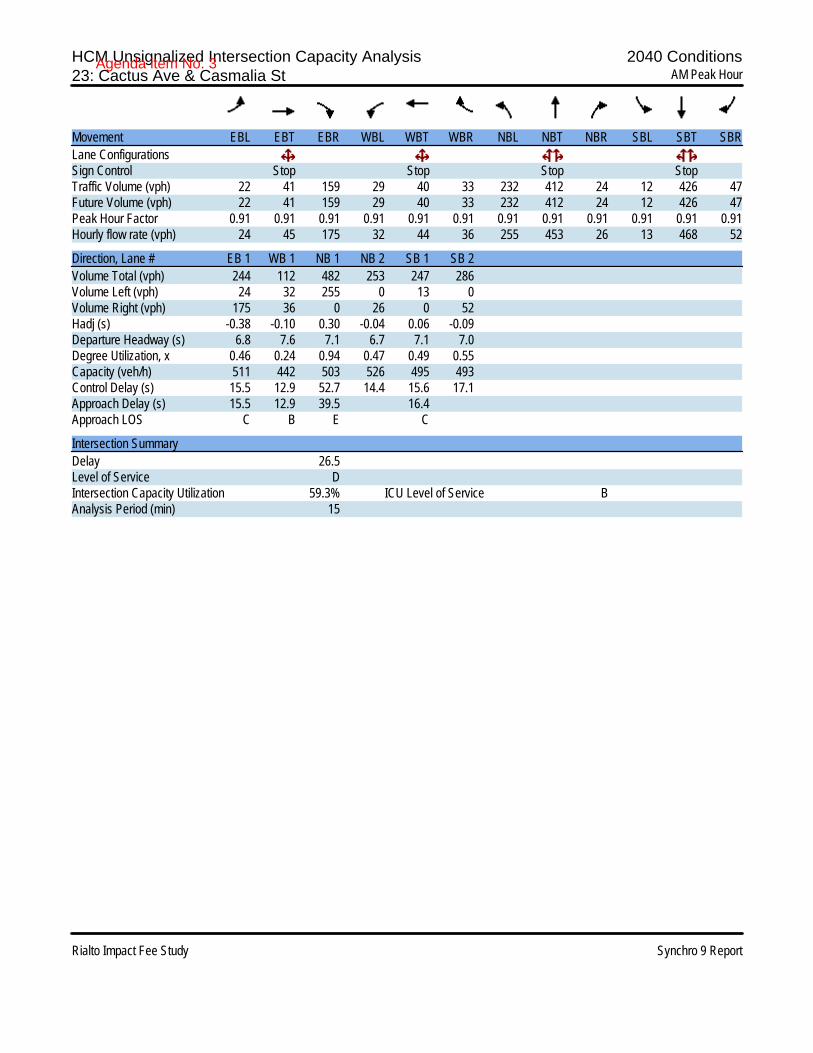
HCM Unsignalized Intersection Capacity Analysis 2040 Conditions23: Cactus Ave & Casmalia St AM Peak Hour
Rialto Impact Fee Study Synchro 9 Report
Movement EBL EBT EBR WBL WBT WBR NBL NBT NBR SBL SBT SBRLane ConfigurationsSign Control Stop Stop Stop StopTraffic Volume (vph) 22 41 159 29 40 33 232 412 24 12 426 47Future Volume (vph) 22 41 159 29 40 33 232 412 24 12 426 47Peak Hour Factor 0.91 0.91 0.91 0.91 0.91 0.91 0.91 0.91 0.91 0.91 0.91 0.91Hourly flow rate (vph) 24 45 175 32 44 36 255 453 26 13 468 52
Direction, Lane # EB 1 WB 1 NB 1 NB 2 SB 1 SB 2Volume Total (vph) 244 112 482 253 247 286Volume Left (vph) 24 32 255 0 13 0Volume Right (vph) 175 36 0 26 0 52Hadj (s) -0.38 -0.10 0.30 -0.04 0.06 -0.09Departure Headway (s) 6.8 7.6 7.1 6.7 7.1 7.0Degree Utilization, x 0.46 0.24 0.94 0.47 0.49 0.55Capacity (veh/h) 511 442 503 526 495 493Control Delay (s) 15.5 12.9 52.7 14.4 15.6 17.1Approach Delay (s) 15.5 12.9 39.5 16.4Approach LOS C B E C
Intersection SummaryDelay 26.5Level of Service DIntersection Capacity Utilization 59.3% ICU Level of Service BAnalysis Period (min) 15
Agenda item No. 3

HCM Unsignalized Intersection Capacity Analysis 2040 Conditions24: Cactus Ave & Easton St AM Peak Hour
Rialto Impact Fee Study Synchro 9 Report
Movement EBL EBT EBR WBL WBT WBR NBL NBT NBR SBL SBT SBRLane ConfigurationsSign Control Stop Stop Stop StopTraffic Volume (vph) 85 37 74 47 109 235 201 375 44 136 402 90Future Volume (vph) 85 37 74 47 109 235 201 375 44 136 402 90Peak Hour Factor 0.93 0.93 0.93 0.93 0.93 0.93 0.93 0.93 0.93 0.93 0.93 0.93Hourly flow rate (vph) 91 40 80 51 117 253 216 403 47 146 432 97
Direction, Lane # EB 1 WB 1 NB 1 NB 2 SB 1 SB 2Volume Total (vph) 211 421 418 249 362 313Volume Left (vph) 91 51 216 0 146 0Volume Right (vph) 80 253 0 47 0 97Hadj (s) -0.11 -0.30 0.29 -0.10 0.24 -0.18Departure Headway (s) 9.0 7.9 9.1 8.7 8.9 8.4Degree Utilization, x 0.53 0.92 1.00 0.60 0.89 0.73Capacity (veh/h) 378 421 418 405 393 418Control Delay (s) 21.8 53.1 74.7 22.5 50.5 30.2Approach Delay (s) 21.8 53.1 55.3 41.1Approach LOS C F F E
Intersection SummaryDelay 46.4Level of Service EIntersection Capacity Utilization 78.3% ICU Level of Service DAnalysis Period (min) 15
Agenda item No. 3

HCM Signalized Intersection Capacity Analysis 2040 Conditions25: Cactus Ave & Base Line Rd AM Peak Hour
Rialto Impact Fee Study Synchro 9 Report
Movement EBL EBT EBR WBL WBT WBR NBL NBT NBR SBL SBT SBRLane ConfigurationsTraffic Volume (vph) 99 618 203 326 1105 134 244 547 242 117 568 155Future Volume (vph) 99 618 203 326 1105 134 244 547 242 117 568 155Ideal Flow (vphpl) 1700 1800 1800 1700 1800 1800 1700 1800 1800 1700 1800 1800Total Lost time (s) 4.0 4.0 4.0 4.0 4.0 4.0 4.0 4.0Lane Util. Factor 1.00 0.95 1.00 0.95 1.00 0.95 1.00 0.95Frt 1.00 0.96 1.00 0.98 1.00 0.95 1.00 0.97Flt Protected 0.95 1.00 0.95 1.00 0.95 1.00 0.95 1.00Satd. Flow (prot) 1583 3228 1583 3299 1583 3199 1583 3245Flt Permitted 0.95 1.00 0.95 1.00 0.95 1.00 0.95 1.00Satd. Flow (perm) 1583 3228 1583 3299 1583 3199 1583 3245Peak-hour factor, PHF 0.81 0.81 0.81 0.81 0.81 0.81 0.81 0.81 0.81 0.81 0.81 0.81Adj. Flow (vph) 122 763 251 402 1364 165 301 675 299 144 701 191RTOR Reduction (vph) 0 32 0 0 9 0 0 50 0 0 25 0Lane Group Flow (vph) 122 982 0 402 1520 0 301 924 0 144 867 0Turn Type Prot NA Prot NA Prot NA Prot NAProtected Phases 7 4 3 8 5 2 1 6Permitted PhasesActuated Green, G (s) 6.0 25.0 20.0 39.0 15.0 30.0 9.0 24.0Effective Green, g (s) 6.0 25.0 20.0 39.0 15.0 30.0 9.0 24.0Actuated g/C Ratio 0.06 0.25 0.20 0.39 0.15 0.30 0.09 0.24Clearance Time (s) 4.0 4.0 4.0 4.0 4.0 4.0 4.0 4.0Vehicle Extension (s) 3.0 3.0 3.0 3.0 3.0 3.0 3.0 3.0Lane Grp Cap (vph) 94 807 316 1286 237 959 142 778v/s Ratio Prot 0.08 0.30 c0.25 c0.46 c0.19 0.29 0.09 c0.27v/s Ratio Permv/c Ratio 1.30 1.22 1.27 1.18 1.27 0.96 1.01 1.11Uniform Delay, d1 47.0 37.5 40.0 30.5 42.5 34.5 45.5 38.0Progression Factor 1.00 1.00 1.00 1.00 1.00 1.00 1.00 1.00Incremental Delay, d2 192.2 108.7 145.0 90.1 150.4 21.4 79.3 68.4Delay (s) 239.2 146.2 185.0 120.6 192.9 55.9 124.8 106.4Level of Service F F F F F E F FApproach Delay (s) 156.2 134.0 88.2 109.0Approach LOS F F F F
Intersection SummaryHCM 2000 Control Delay 123.0 HCM 2000 Level of Service FHCM 2000 Volume to Capacity ratio 1.23Actuated Cycle Length (s) 100.0 Sum of lost time (s) 16.0Intersection Capacity Utilization 95.3% ICU Level of Service FAnalysis Period (min) 15c Critical Lane Group
Agenda item No. 3
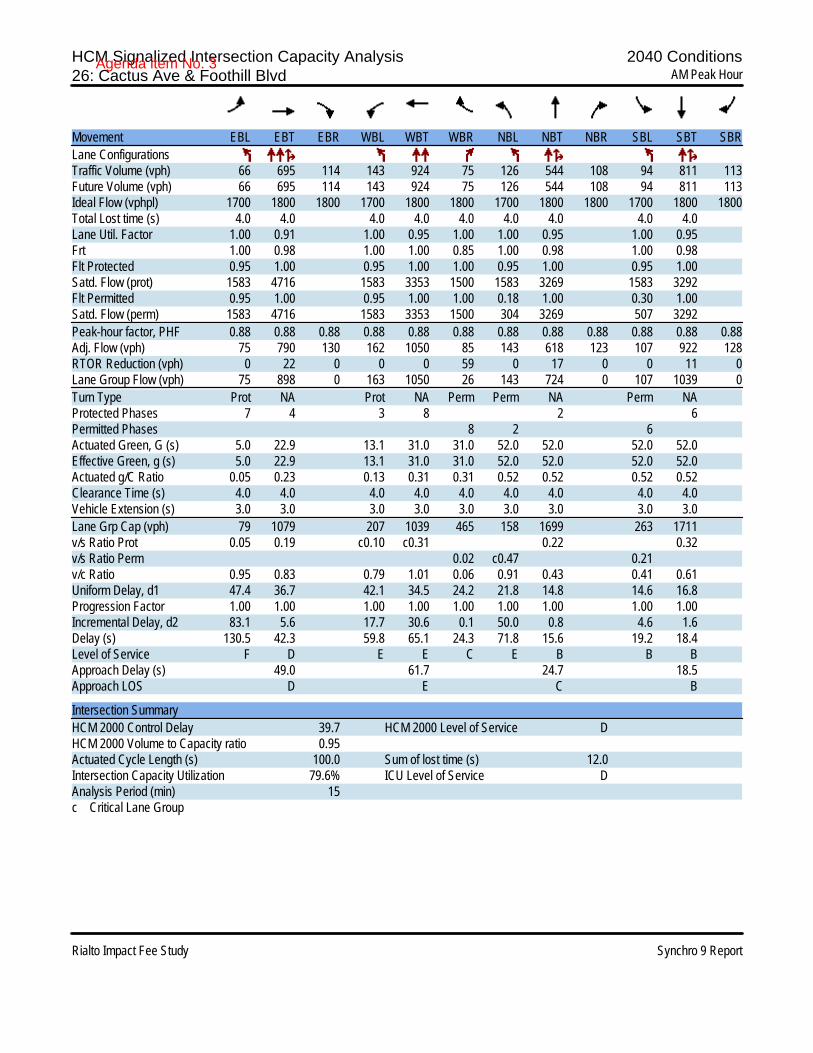
HCM Signalized Intersection Capacity Analysis 2040 Conditions26: Cactus Ave & Foothill Blvd AM Peak Hour
Rialto Impact Fee Study Synchro 9 Report
Movement EBL EBT EBR WBL WBT WBR NBL NBT NBR SBL SBT SBRLane ConfigurationsTraffic Volume (vph) 66 695 114 143 924 75 126 544 108 94 811 113Future Volume (vph) 66 695 114 143 924 75 126 544 108 94 811 113Ideal Flow (vphpl) 1700 1800 1800 1700 1800 1800 1700 1800 1800 1700 1800 1800Total Lost time (s) 4.0 4.0 4.0 4.0 4.0 4.0 4.0 4.0 4.0Lane Util. Factor 1.00 0.91 1.00 0.95 1.00 1.00 0.95 1.00 0.95Frt 1.00 0.98 1.00 1.00 0.85 1.00 0.98 1.00 0.98Flt Protected 0.95 1.00 0.95 1.00 1.00 0.95 1.00 0.95 1.00Satd. Flow (prot) 1583 4716 1583 3353 1500 1583 3269 1583 3292Flt Permitted 0.95 1.00 0.95 1.00 1.00 0.18 1.00 0.30 1.00Satd. Flow (perm) 1583 4716 1583 3353 1500 304 3269 507 3292Peak-hour factor, PHF 0.88 0.88 0.88 0.88 0.88 0.88 0.88 0.88 0.88 0.88 0.88 0.88Adj. Flow (vph) 75 790 130 162 1050 85 143 618 123 107 922 128RTOR Reduction (vph) 0 22 0 0 0 59 0 17 0 0 11 0Lane Group Flow (vph) 75 898 0 163 1050 26 143 724 0 107 1039 0Turn Type Prot NA Prot NA Perm Perm NA Perm NAProtected Phases 7 4 3 8 2 6Permitted Phases 8 2 6Actuated Green, G (s) 5.0 22.9 13.1 31.0 31.0 52.0 52.0 52.0 52.0Effective Green, g (s) 5.0 22.9 13.1 31.0 31.0 52.0 52.0 52.0 52.0Actuated g/C Ratio 0.05 0.23 0.13 0.31 0.31 0.52 0.52 0.52 0.52Clearance Time (s) 4.0 4.0 4.0 4.0 4.0 4.0 4.0 4.0 4.0Vehicle Extension (s) 3.0 3.0 3.0 3.0 3.0 3.0 3.0 3.0 3.0Lane Grp Cap (vph) 79 1079 207 1039 465 158 1699 263 1711v/s Ratio Prot 0.05 0.19 c0.10 c0.31 0.22 0.32v/s Ratio Perm 0.02 c0.47 0.21v/c Ratio 0.95 0.83 0.79 1.01 0.06 0.91 0.43 0.41 0.61Uniform Delay, d1 47.4 36.7 42.1 34.5 24.2 21.8 14.8 14.6 16.8Progression Factor 1.00 1.00 1.00 1.00 1.00 1.00 1.00 1.00 1.00Incremental Delay, d2 83.1 5.6 17.7 30.6 0.1 50.0 0.8 4.6 1.6Delay (s) 130.5 42.3 59.8 65.1 24.3 71.8 15.6 19.2 18.4Level of Service F D E E C E B B BApproach Delay (s) 49.0 61.7 24.7 18.5Approach LOS D E C B
Intersection SummaryHCM 2000 Control Delay 39.7 HCM 2000 Level of Service DHCM 2000 Volume to Capacity ratio 0.95Actuated Cycle Length (s) 100.0 Sum of lost time (s) 12.0Intersection Capacity Utilization 79.6% ICU Level of Service DAnalysis Period (min) 15c Critical Lane Group
Agenda item No. 3
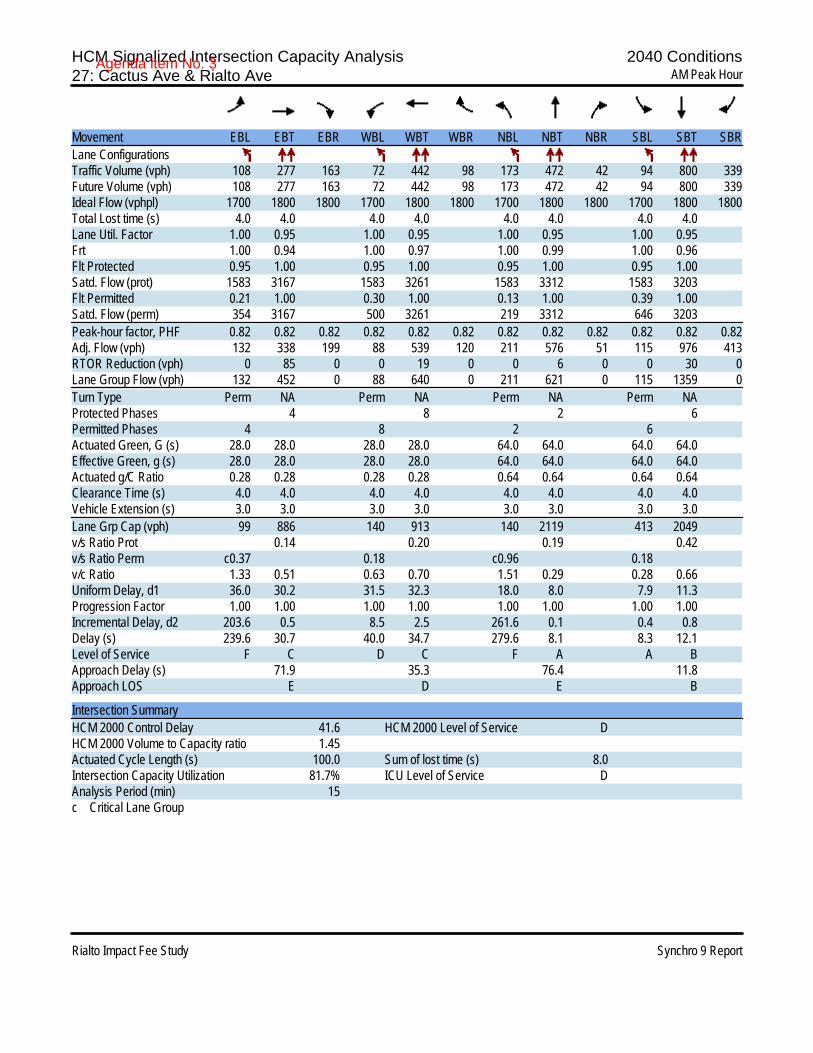
HCM Signalized Intersection Capacity Analysis 2040 Conditions27: Cactus Ave & Rialto Ave AM Peak Hour
Rialto Impact Fee Study Synchro 9 Report
Movement EBL EBT EBR WBL WBT WBR NBL NBT NBR SBL SBT SBRLane ConfigurationsTraffic Volume (vph) 108 277 163 72 442 98 173 472 42 94 800 339Future Volume (vph) 108 277 163 72 442 98 173 472 42 94 800 339Ideal Flow (vphpl) 1700 1800 1800 1700 1800 1800 1700 1800 1800 1700 1800 1800Total Lost time (s) 4.0 4.0 4.0 4.0 4.0 4.0 4.0 4.0Lane Util. Factor 1.00 0.95 1.00 0.95 1.00 0.95 1.00 0.95Frt 1.00 0.94 1.00 0.97 1.00 0.99 1.00 0.96Flt Protected 0.95 1.00 0.95 1.00 0.95 1.00 0.95 1.00Satd. Flow (prot) 1583 3167 1583 3261 1583 3312 1583 3203Flt Permitted 0.21 1.00 0.30 1.00 0.13 1.00 0.39 1.00Satd. Flow (perm) 354 3167 500 3261 219 3312 646 3203Peak-hour factor, PHF 0.82 0.82 0.82 0.82 0.82 0.82 0.82 0.82 0.82 0.82 0.82 0.82Adj. Flow (vph) 132 338 199 88 539 120 211 576 51 115 976 413RTOR Reduction (vph) 0 85 0 0 19 0 0 6 0 0 30 0Lane Group Flow (vph) 132 452 0 88 640 0 211 621 0 115 1359 0Turn Type Perm NA Perm NA Perm NA Perm NAProtected Phases 4 8 2 6Permitted Phases 4 8 2 6Actuated Green, G (s) 28.0 28.0 28.0 28.0 64.0 64.0 64.0 64.0Effective Green, g (s) 28.0 28.0 28.0 28.0 64.0 64.0 64.0 64.0Actuated g/C Ratio 0.28 0.28 0.28 0.28 0.64 0.64 0.64 0.64Clearance Time (s) 4.0 4.0 4.0 4.0 4.0 4.0 4.0 4.0Vehicle Extension (s) 3.0 3.0 3.0 3.0 3.0 3.0 3.0 3.0Lane Grp Cap (vph) 99 886 140 913 140 2119 413 2049v/s Ratio Prot 0.14 0.20 0.19 0.42v/s Ratio Perm c0.37 0.18 c0.96 0.18v/c Ratio 1.33 0.51 0.63 0.70 1.51 0.29 0.28 0.66Uniform Delay, d1 36.0 30.2 31.5 32.3 18.0 8.0 7.9 11.3Progression Factor 1.00 1.00 1.00 1.00 1.00 1.00 1.00 1.00Incremental Delay, d2 203.6 0.5 8.5 2.5 261.6 0.1 0.4 0.8Delay (s) 239.6 30.7 40.0 34.7 279.6 8.1 8.3 12.1Level of Service F C D C F A A BApproach Delay (s) 71.9 35.3 76.4 11.8Approach LOS E D E B
Intersection SummaryHCM 2000 Control Delay 41.6 HCM 2000 Level of Service DHCM 2000 Volume to Capacity ratio 1.45Actuated Cycle Length (s) 100.0 Sum of lost time (s) 8.0Intersection Capacity Utilization 81.7% ICU Level of Service DAnalysis Period (min) 15c Critical Lane Group
Agenda item No. 3

HCM Signalized Intersection Capacity Analysis 2040 Conditions28: Cactus Ave & Merrill Ave AM Peak Hour
Rialto Impact Fee Study Synchro 9 Report
Movement EBL EBT EBR WBL WBT WBR NBL NBT NBR SBL SBT SBRLane ConfigurationsTraffic Volume (vph) 100 223 59 50 299 78 62 551 48 57 858 115Future Volume (vph) 100 223 59 50 299 78 62 551 48 57 858 115Ideal Flow (vphpl) 1700 1800 1800 1700 1800 1800 1700 1800 1800 1700 1800 1800Total Lost time (s) 4.0 4.0 4.0 4.0 4.0 4.0 4.0 4.0Lane Util. Factor 1.00 0.95 1.00 0.95 1.00 0.95 1.00 0.95Frt 1.00 0.97 1.00 0.97 1.00 0.99 1.00 0.98Flt Protected 0.95 1.00 0.95 1.00 0.95 1.00 0.95 1.00Satd. Flow (prot) 1583 3248 1583 3249 1583 3313 1583 3293Flt Permitted 0.39 1.00 0.50 1.00 0.95 1.00 0.95 1.00Satd. Flow (perm) 656 3248 836 3249 1583 3313 1583 3293Peak-hour factor, PHF 0.84 0.84 0.84 0.84 0.84 0.84 0.84 0.84 0.84 0.84 0.84 0.84Adj. Flow (vph) 119 265 70 60 356 93 74 656 57 68 1021 137RTOR Reduction (vph) 0 25 0 0 25 0 0 6 0 0 10 0Lane Group Flow (vph) 119 310 0 60 424 0 74 707 0 68 1148 0Turn Type Perm NA Perm NA Prot NA Prot NAProtected Phases 4 8 5 2 1 6Permitted Phases 4 8Actuated Green, G (s) 20.1 20.1 20.1 20.1 6.6 34.6 6.5 34.5Effective Green, g (s) 20.1 20.1 20.1 20.1 6.6 34.6 6.5 34.5Actuated g/C Ratio 0.27 0.27 0.27 0.27 0.09 0.47 0.09 0.47Clearance Time (s) 4.0 4.0 4.0 4.0 4.0 4.0 4.0 4.0Vehicle Extension (s) 3.0 3.0 3.0 3.0 3.0 3.0 3.0 3.0Lane Grp Cap (vph) 180 891 229 892 142 1565 140 1552v/s Ratio Prot 0.10 0.13 c0.05 0.21 0.04 c0.35v/s Ratio Perm c0.18 0.07v/c Ratio 0.66 0.35 0.26 0.47 0.52 0.45 0.49 0.74Uniform Delay, d1 23.5 21.3 20.8 22.1 31.8 12.9 31.8 15.7Progression Factor 1.00 1.00 1.00 1.00 1.00 1.00 1.00 1.00Incremental Delay, d2 8.8 0.2 0.6 0.4 3.4 0.2 2.6 1.9Delay (s) 32.3 21.5 21.4 22.5 35.2 13.1 34.4 17.6Level of Service C C C C D B C BApproach Delay (s) 24.4 22.4 15.2 18.5Approach LOS C C B B
Intersection SummaryHCM 2000 Control Delay 19.2 HCM 2000 Level of Service BHCM 2000 Volume to Capacity ratio 0.69Actuated Cycle Length (s) 73.2 Sum of lost time (s) 12.0Intersection Capacity Utilization 63.6% ICU Level of Service BAnalysis Period (min) 15c Critical Lane Group
Agenda item No. 3
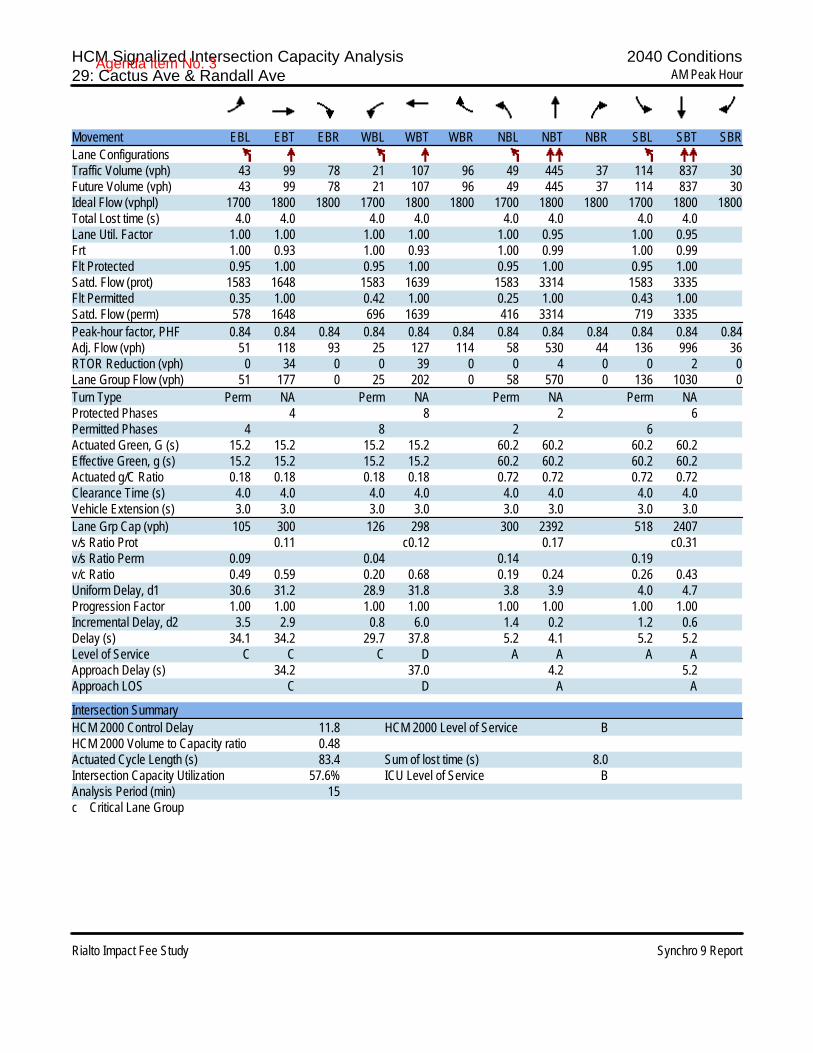
HCM Signalized Intersection Capacity Analysis 2040 Conditions29: Cactus Ave & Randall Ave AM Peak Hour
Rialto Impact Fee Study Synchro 9 Report
Movement EBL EBT EBR WBL WBT WBR NBL NBT NBR SBL SBT SBRLane ConfigurationsTraffic Volume (vph) 43 99 78 21 107 96 49 445 37 114 837 30Future Volume (vph) 43 99 78 21 107 96 49 445 37 114 837 30Ideal Flow (vphpl) 1700 1800 1800 1700 1800 1800 1700 1800 1800 1700 1800 1800Total Lost time (s) 4.0 4.0 4.0 4.0 4.0 4.0 4.0 4.0Lane Util. Factor 1.00 1.00 1.00 1.00 1.00 0.95 1.00 0.95Frt 1.00 0.93 1.00 0.93 1.00 0.99 1.00 0.99Flt Protected 0.95 1.00 0.95 1.00 0.95 1.00 0.95 1.00Satd. Flow (prot) 1583 1648 1583 1639 1583 3314 1583 3335Flt Permitted 0.35 1.00 0.42 1.00 0.25 1.00 0.43 1.00Satd. Flow (perm) 578 1648 696 1639 416 3314 719 3335Peak-hour factor, PHF 0.84 0.84 0.84 0.84 0.84 0.84 0.84 0.84 0.84 0.84 0.84 0.84Adj. Flow (vph) 51 118 93 25 127 114 58 530 44 136 996 36RTOR Reduction (vph) 0 34 0 0 39 0 0 4 0 0 2 0Lane Group Flow (vph) 51 177 0 25 202 0 58 570 0 136 1030 0Turn Type Perm NA Perm NA Perm NA Perm NAProtected Phases 4 8 2 6Permitted Phases 4 8 2 6Actuated Green, G (s) 15.2 15.2 15.2 15.2 60.2 60.2 60.2 60.2Effective Green, g (s) 15.2 15.2 15.2 15.2 60.2 60.2 60.2 60.2Actuated g/C Ratio 0.18 0.18 0.18 0.18 0.72 0.72 0.72 0.72Clearance Time (s) 4.0 4.0 4.0 4.0 4.0 4.0 4.0 4.0Vehicle Extension (s) 3.0 3.0 3.0 3.0 3.0 3.0 3.0 3.0Lane Grp Cap (vph) 105 300 126 298 300 2392 518 2407v/s Ratio Prot 0.11 c0.12 0.17 c0.31v/s Ratio Perm 0.09 0.04 0.14 0.19v/c Ratio 0.49 0.59 0.20 0.68 0.19 0.24 0.26 0.43Uniform Delay, d1 30.6 31.2 28.9 31.8 3.8 3.9 4.0 4.7Progression Factor 1.00 1.00 1.00 1.00 1.00 1.00 1.00 1.00Incremental Delay, d2 3.5 2.9 0.8 6.0 1.4 0.2 1.2 0.6Delay (s) 34.1 34.2 29.7 37.8 5.2 4.1 5.2 5.2Level of Service C C C D A A A AApproach Delay (s) 34.2 37.0 4.2 5.2Approach LOS C D A A
Intersection SummaryHCM 2000 Control Delay 11.8 HCM 2000 Level of Service BHCM 2000 Volume to Capacity ratio 0.48Actuated Cycle Length (s) 83.4 Sum of lost time (s) 8.0Intersection Capacity Utilization 57.6% ICU Level of Service BAnalysis Period (min) 15c Critical Lane Group
Agenda item No. 3

HCM Unsignalized Intersection Capacity Analysis 2040 Conditions30: Cactus Ave & San Bernardino Ave AM Peak Hour
Rialto Impact Fee Study Synchro 9 Report
Movement EBL EBT EBR WBL WBT WBR NBL NBT NBR SBL SBT SBRLane ConfigurationsSign Control Stop Stop Stop StopTraffic Volume (vph) 90 169 3 162 390 19 9 278 91 56 402 109Future Volume (vph) 90 169 3 162 390 19 9 278 91 56 402 109Peak Hour Factor 0.68 0.68 0.68 0.68 0.68 0.68 0.68 0.68 0.68 0.68 0.68 0.68Hourly flow rate (vph) 132 249 4 238 574 28 13 409 134 82 591 160
Direction, Lane # EB 1 EB 2 WB 1 WB 2 NB 1 NB 2 SB 1 SB 2Volume Total (vph) 257 129 525 315 13 543 82 751Volume Left (vph) 132 0 238 0 13 0 82 0Volume Right (vph) 0 4 0 28 0 134 0 160Hadj (s) 0.29 0.01 0.26 -0.03 0.53 -0.14 0.53 -0.12Departure Headway (s) 9.8 9.5 9.2 8.9 9.7 9.0 9.5 8.9Degree Utilization, x 0.69 0.34 1.00 0.78 0.03 1.00 0.22 1.00Capacity (veh/h) 361 376 525 395 365 543 371 751Control Delay (s) 31.0 16.1 75.4 36.0 11.8 74.5 14.0 74.1Approach Delay (s) 26.0 60.6 73.0 68.1Approach LOS D F F F
Intersection SummaryDelay 60.5Level of Service FIntersection Capacity Utilization 70.8% ICU Level of Service CAnalysis Period (min) 15
Agenda item No. 3

HCM Signalized Intersection Capacity Analysis 2040 Conditions31: Cactus Ave & Valley Blvd AM Peak Hour
Rialto Impact Fee Study Synchro 9 Report
Movement EBL EBT EBR WBL WBT WBR NBL NBT NBR SBL SBT SBRLane ConfigurationsTraffic Volume (vph) 84 421 0 2 599 281 0 0 1 454 0 123Future Volume (vph) 84 421 0 2 599 281 0 0 1 454 0 123Ideal Flow (vphpl) 1700 1800 1800 1700 1800 1800 1700 1800 1800 1700 1800 1800Total Lost time (s) 4.0 4.0 4.0 4.0 4.0 4.0 4.0 4.0Lane Util. Factor 1.00 0.95 1.00 1.00 1.00 1.00 1.00 1.00Frt 1.00 1.00 1.00 1.00 0.85 0.85 1.00 0.85Flt Protected 0.95 1.00 0.95 1.00 1.00 1.00 0.95 1.00Satd. Flow (prot) 1583 3353 1583 1765 1500 1500 1583 1500Flt Permitted 0.12 1.00 0.40 1.00 1.00 1.00 0.76 1.00Satd. Flow (perm) 197 3353 664 1765 1500 1500 1262 1500Peak-hour factor, PHF 0.77 0.77 0.77 0.77 0.77 0.77 0.77 0.77 0.77 0.77 0.77 0.77Adj. Flow (vph) 109 547 0 3 778 365 0 0 1 590 0 160RTOR Reduction (vph) 0 0 0 0 0 118 0 1 0 0 0 81Lane Group Flow (vph) 109 547 0 3 778 247 0 0 0 590 0 79Turn Type Perm NA Perm Perm NA Perm Perm NA Perm PermProtected Phases 4 8 2 6Permitted Phases 4 4 8 8 2 6 6Actuated Green, G (s) 50.0 50.0 50.0 50.0 50.0 42.0 42.0 42.0Effective Green, g (s) 50.0 50.0 50.0 50.0 50.0 42.0 42.0 42.0Actuated g/C Ratio 0.50 0.50 0.50 0.50 0.50 0.42 0.42 0.42Clearance Time (s) 4.0 4.0 4.0 4.0 4.0 4.0 4.0 4.0Vehicle Extension (s) 3.0 3.0 3.0 3.0 3.0 3.0 3.0 3.0Lane Grp Cap (vph) 98 1676 332 882 750 630 530 630v/s Ratio Prot 0.16 0.44 0.00v/s Ratio Perm c0.55 0.00 0.16 c0.47 0.05v/c Ratio 1.11 0.33 0.01 0.88 0.33 0.00 1.11 0.13Uniform Delay, d1 25.0 14.9 12.6 22.4 15.0 16.8 29.0 17.8Progression Factor 1.00 1.00 1.00 1.00 1.00 1.00 1.00 1.00Incremental Delay, d2 124.4 0.1 0.0 10.3 0.3 0.0 73.9 0.1Delay (s) 149.4 15.1 12.6 32.7 15.2 16.8 102.9 17.8Level of Service F B B C B B F BApproach Delay (s) 37.4 27.1 16.8 84.8Approach LOS D C B F
Intersection SummaryHCM 2000 Control Delay 46.7 HCM 2000 Level of Service DHCM 2000 Volume to Capacity ratio 1.11Actuated Cycle Length (s) 100.0 Sum of lost time (s) 8.0Intersection Capacity Utilization 83.3% ICU Level of Service EAnalysis Period (min) 15c Critical Lane Group
Agenda item No. 3
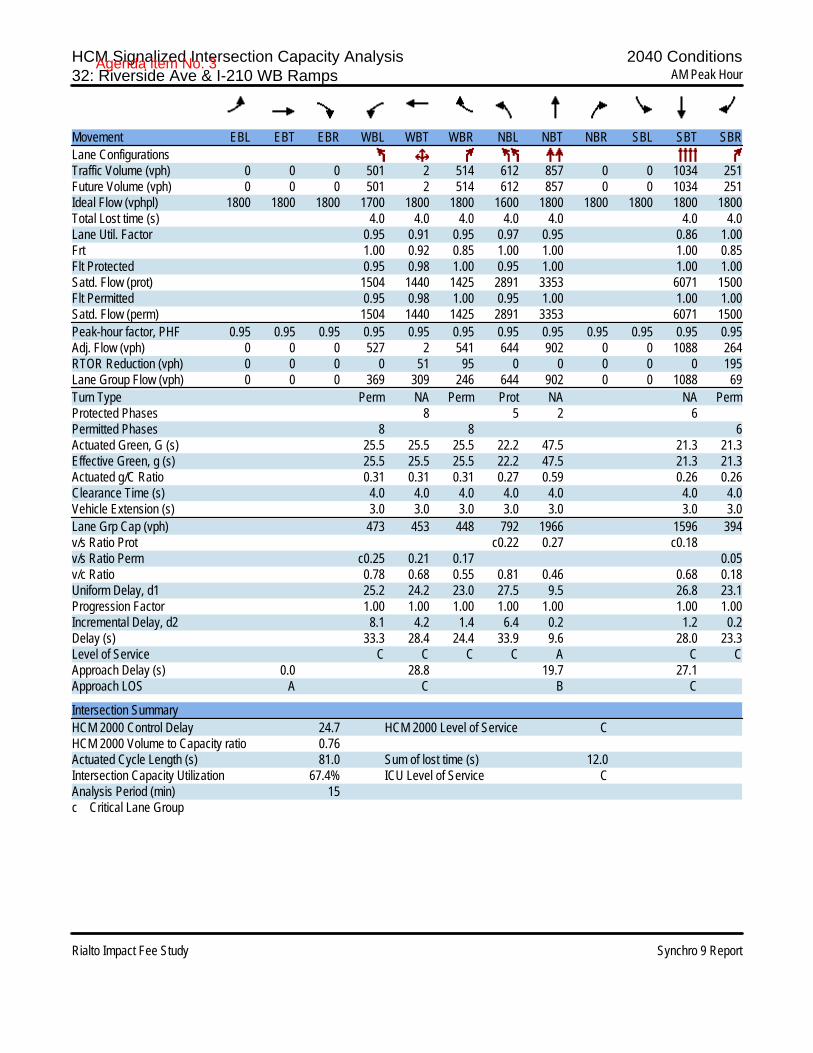
HCM Signalized Intersection Capacity Analysis 2040 Conditions32: Riverside Ave & I-210 WB Ramps AM Peak Hour
Rialto Impact Fee Study Synchro 9 Report
Movement EBL EBT EBR WBL WBT WBR NBL NBT NBR SBL SBT SBRLane ConfigurationsTraffic Volume (vph) 0 0 0 501 2 514 612 857 0 0 1034 251Future Volume (vph) 0 0 0 501 2 514 612 857 0 0 1034 251Ideal Flow (vphpl) 1800 1800 1800 1700 1800 1800 1600 1800 1800 1800 1800 1800Total Lost time (s) 4.0 4.0 4.0 4.0 4.0 4.0 4.0Lane Util. Factor 0.95 0.91 0.95 0.97 0.95 0.86 1.00Frt 1.00 0.92 0.85 1.00 1.00 1.00 0.85Flt Protected 0.95 0.98 1.00 0.95 1.00 1.00 1.00Satd. Flow (prot) 1504 1440 1425 2891 3353 6071 1500Flt Permitted 0.95 0.98 1.00 0.95 1.00 1.00 1.00Satd. Flow (perm) 1504 1440 1425 2891 3353 6071 1500Peak-hour factor, PHF 0.95 0.95 0.95 0.95 0.95 0.95 0.95 0.95 0.95 0.95 0.95 0.95Adj. Flow (vph) 0 0 0 527 2 541 644 902 0 0 1088 264RTOR Reduction (vph) 0 0 0 0 51 95 0 0 0 0 0 195Lane Group Flow (vph) 0 0 0 369 309 246 644 902 0 0 1088 69Turn Type Perm NA Perm Prot NA NA PermProtected Phases 8 5 2 6Permitted Phases 8 8 6Actuated Green, G (s) 25.5 25.5 25.5 22.2 47.5 21.3 21.3Effective Green, g (s) 25.5 25.5 25.5 22.2 47.5 21.3 21.3Actuated g/C Ratio 0.31 0.31 0.31 0.27 0.59 0.26 0.26Clearance Time (s) 4.0 4.0 4.0 4.0 4.0 4.0 4.0Vehicle Extension (s) 3.0 3.0 3.0 3.0 3.0 3.0 3.0Lane Grp Cap (vph) 473 453 448 792 1966 1596 394v/s Ratio Prot c0.22 0.27 c0.18v/s Ratio Perm c0.25 0.21 0.17 0.05v/c Ratio 0.78 0.68 0.55 0.81 0.46 0.68 0.18Uniform Delay, d1 25.2 24.2 23.0 27.5 9.5 26.8 23.1Progression Factor 1.00 1.00 1.00 1.00 1.00 1.00 1.00Incremental Delay, d2 8.1 4.2 1.4 6.4 0.2 1.2 0.2Delay (s) 33.3 28.4 24.4 33.9 9.6 28.0 23.3Level of Service C C C C A C CApproach Delay (s) 0.0 28.8 19.7 27.1Approach LOS A C B C
Intersection SummaryHCM 2000 Control Delay 24.7 HCM 2000 Level of Service CHCM 2000 Volume to Capacity ratio 0.76Actuated Cycle Length (s) 81.0 Sum of lost time (s) 12.0Intersection Capacity Utilization 67.4% ICU Level of Service CAnalysis Period (min) 15c Critical Lane Group
Agenda item No. 3
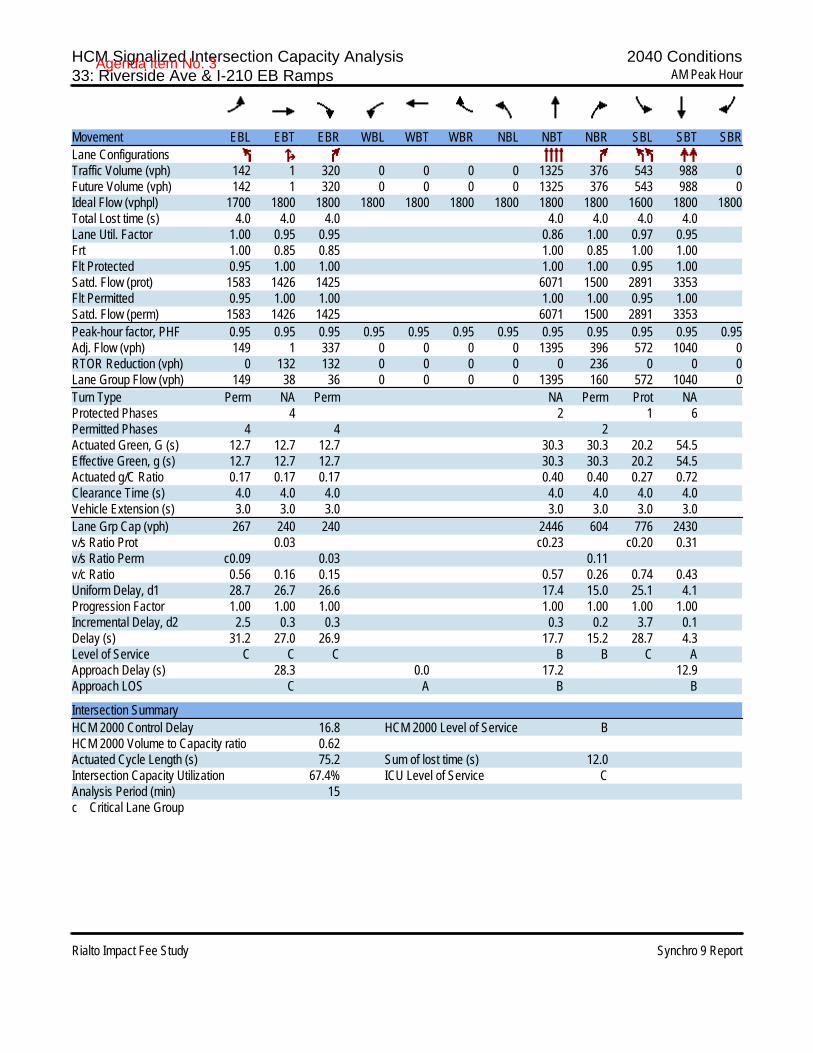
HCM Signalized Intersection Capacity Analysis 2040 Conditions33: Riverside Ave & I-210 EB Ramps AM Peak Hour
Rialto Impact Fee Study Synchro 9 Report
Movement EBL EBT EBR WBL WBT WBR NBL NBT NBR SBL SBT SBRLane ConfigurationsTraffic Volume (vph) 142 1 320 0 0 0 0 1325 376 543 988 0Future Volume (vph) 142 1 320 0 0 0 0 1325 376 543 988 0Ideal Flow (vphpl) 1700 1800 1800 1800 1800 1800 1800 1800 1800 1600 1800 1800Total Lost time (s) 4.0 4.0 4.0 4.0 4.0 4.0 4.0Lane Util. Factor 1.00 0.95 0.95 0.86 1.00 0.97 0.95Frt 1.00 0.85 0.85 1.00 0.85 1.00 1.00Flt Protected 0.95 1.00 1.00 1.00 1.00 0.95 1.00Satd. Flow (prot) 1583 1426 1425 6071 1500 2891 3353Flt Permitted 0.95 1.00 1.00 1.00 1.00 0.95 1.00Satd. Flow (perm) 1583 1426 1425 6071 1500 2891 3353Peak-hour factor, PHF 0.95 0.95 0.95 0.95 0.95 0.95 0.95 0.95 0.95 0.95 0.95 0.95Adj. Flow (vph) 149 1 337 0 0 0 0 1395 396 572 1040 0RTOR Reduction (vph) 0 132 132 0 0 0 0 0 236 0 0 0Lane Group Flow (vph) 149 38 36 0 0 0 0 1395 160 572 1040 0Turn Type Perm NA Perm NA Perm Prot NAProtected Phases 4 2 1 6Permitted Phases 4 4 2Actuated Green, G (s) 12.7 12.7 12.7 30.3 30.3 20.2 54.5Effective Green, g (s) 12.7 12.7 12.7 30.3 30.3 20.2 54.5Actuated g/C Ratio 0.17 0.17 0.17 0.40 0.40 0.27 0.72Clearance Time (s) 4.0 4.0 4.0 4.0 4.0 4.0 4.0Vehicle Extension (s) 3.0 3.0 3.0 3.0 3.0 3.0 3.0Lane Grp Cap (vph) 267 240 240 2446 604 776 2430v/s Ratio Prot 0.03 c0.23 c0.20 0.31v/s Ratio Perm c0.09 0.03 0.11v/c Ratio 0.56 0.16 0.15 0.57 0.26 0.74 0.43Uniform Delay, d1 28.7 26.7 26.6 17.4 15.0 25.1 4.1Progression Factor 1.00 1.00 1.00 1.00 1.00 1.00 1.00Incremental Delay, d2 2.5 0.3 0.3 0.3 0.2 3.7 0.1Delay (s) 31.2 27.0 26.9 17.7 15.2 28.7 4.3Level of Service C C C B B C AApproach Delay (s) 28.3 0.0 17.2 12.9Approach LOS C A B B
Intersection SummaryHCM 2000 Control Delay 16.8 HCM 2000 Level of Service BHCM 2000 Volume to Capacity ratio 0.62Actuated Cycle Length (s) 75.2 Sum of lost time (s) 12.0Intersection Capacity Utilization 67.4% ICU Level of Service CAnalysis Period (min) 15c Critical Lane Group
Agenda item No. 3

HCM Signalized Intersection Capacity Analysis 2040 Conditions34: Riverside Ave & Easton St AM Peak Hour
Rialto Impact Fee Study Synchro 9 Report
Movement EBL EBT EBR WBL WBT WBR NBL NBT NBR SBL SBT SBRLane ConfigurationsTraffic Volume (vph) 353 84 103 181 220 486 97 855 73 117 969 228Future Volume (vph) 353 84 103 181 220 486 97 855 73 117 969 228Ideal Flow (vphpl) 1700 1800 1800 1700 1800 1800 1700 1800 1800 1600 1800 1800Total Lost time (s) 4.0 4.0 4.0 4.0 4.0 4.0 4.0 4.0 4.0 4.0Lane Util. Factor 1.00 1.00 1.00 1.00 1.00 1.00 0.91 0.97 0.95 1.00Frt 1.00 0.92 1.00 1.00 0.85 1.00 0.99 1.00 1.00 0.85Flt Protected 0.95 1.00 0.95 1.00 1.00 0.95 1.00 0.95 1.00 1.00Satd. Flow (prot) 1583 1618 1583 1765 1500 1583 4761 2891 3353 1500Flt Permitted 0.95 1.00 0.95 1.00 1.00 0.95 1.00 0.95 1.00 1.00Satd. Flow (perm) 1583 1618 1583 1765 1500 1583 4761 2891 3353 1500Peak-hour factor, PHF 0.94 0.94 0.94 0.94 0.94 0.94 0.94 0.94 0.94 0.94 0.94 0.94Adj. Flow (vph) 376 89 110 193 234 517 103 910 78 124 1031 243RTOR Reduction (vph) 0 42 0 0 0 143 0 10 0 0 0 126Lane Group Flow (vph) 376 157 0 193 234 374 103 978 0 124 1031 117Turn Type Prot NA Prot NA Perm Prot NA Prot NA PermProtected Phases 7 4 3 8 5 2 1 6Permitted Phases 8 6Actuated Green, G (s) 23.0 29.2 16.8 23.0 23.0 7.0 30.3 7.7 31.0 31.0Effective Green, g (s) 23.0 29.2 16.8 23.0 23.0 7.0 30.3 7.7 31.0 31.0Actuated g/C Ratio 0.23 0.29 0.17 0.23 0.23 0.07 0.30 0.08 0.31 0.31Clearance Time (s) 4.0 4.0 4.0 4.0 4.0 4.0 4.0 4.0 4.0 4.0Vehicle Extension (s) 3.0 3.0 3.0 3.0 3.0 3.0 3.0 3.0 3.0 3.0Lane Grp Cap (vph) 364 472 265 405 345 110 1442 222 1039 465v/s Ratio Prot c0.24 0.10 0.12 0.13 c0.07 0.21 0.04 c0.31v/s Ratio Perm c0.25 0.08v/c Ratio 1.03 0.33 0.73 0.58 1.08 0.94 0.68 0.56 0.99 0.25Uniform Delay, d1 38.5 27.8 39.4 34.2 38.5 46.3 30.6 44.5 34.4 25.8Progression Factor 1.00 1.00 1.00 1.00 1.00 1.00 1.00 1.00 1.00 1.00Incremental Delay, d2 55.9 0.4 9.6 2.0 72.6 65.2 1.3 3.0 25.9 0.3Delay (s) 94.4 28.2 49.0 36.2 111.1 111.5 31.9 47.5 60.3 26.1Level of Service F C D D F F C D E CApproach Delay (s) 71.5 79.8 39.4 53.2Approach LOS E E D D
Intersection SummaryHCM 2000 Control Delay 58.3 HCM 2000 Level of Service EHCM 2000 Volume to Capacity ratio 1.02Actuated Cycle Length (s) 100.0 Sum of lost time (s) 16.0Intersection Capacity Utilization 82.8% ICU Level of Service EAnalysis Period (min) 15c Critical Lane Group
Agenda item No. 3

HCM Signalized Intersection Capacity Analysis 2040 Conditions35: Riverside Ave & Base Line Rd AM Peak Hour
Rialto Impact Fee Study Synchro 9 Report
Movement EBL EBT EBR WBL WBT WBR NBL NBT NBR SBL SBT SBRLane ConfigurationsTraffic Volume (vph) 76 679 111 94 1032 106 230 405 32 204 758 58Future Volume (vph) 76 679 111 94 1032 106 230 405 32 204 758 58Ideal Flow (vphpl) 1700 1800 1800 1700 1800 1800 1700 1800 1800 1700 1800 1800Total Lost time (s) 4.0 4.0 4.0 4.0 4.0 4.0 4.0 4.0Lane Util. Factor 1.00 0.95 1.00 0.91 1.00 0.95 1.00 0.95Frt 1.00 0.98 1.00 0.99 1.00 0.99 1.00 0.99Flt Protected 0.95 1.00 0.95 1.00 0.95 1.00 0.95 1.00Satd. Flow (prot) 1583 3282 1583 4750 1583 3316 1583 3317Flt Permitted 0.95 1.00 0.95 1.00 0.95 1.00 0.95 1.00Satd. Flow (perm) 1583 3282 1583 4750 1583 3316 1583 3317Peak-hour factor, PHF 0.86 0.86 0.86 0.86 0.86 0.86 0.86 0.86 0.86 0.86 0.86 0.86Adj. Flow (vph) 88 790 129 109 1200 123 267 471 37 237 881 67RTOR Reduction (vph) 0 13 0 0 12 0 0 6 0 0 6 0Lane Group Flow (vph) 88 906 0 109 1311 0 267 502 0 237 942 0Turn Type Prot NA Prot NA Prot NA Prot NAProtected Phases 7 4 3 8 5 2 1 6Permitted PhasesActuated Green, G (s) 6.0 27.0 8.0 29.0 18.0 29.6 19.4 31.0Effective Green, g (s) 6.0 27.0 8.0 29.0 18.0 29.6 19.4 31.0Actuated g/C Ratio 0.06 0.27 0.08 0.29 0.18 0.30 0.19 0.31Clearance Time (s) 4.0 4.0 4.0 4.0 4.0 4.0 4.0 4.0Vehicle Extension (s) 3.0 3.0 3.0 3.0 3.0 3.0 3.0 3.0Lane Grp Cap (vph) 94 886 126 1377 284 981 307 1028v/s Ratio Prot 0.06 c0.28 c0.07 0.28 c0.17 0.15 0.15 c0.28v/s Ratio Permv/c Ratio 0.94 1.02 0.87 0.95 0.94 0.51 0.77 0.92Uniform Delay, d1 46.8 36.5 45.5 34.8 40.5 29.2 38.2 33.3Progression Factor 1.00 1.00 1.00 1.00 1.00 1.00 1.00 1.00Incremental Delay, d2 71.5 36.0 42.0 14.3 37.6 1.9 11.4 14.0Delay (s) 118.3 72.5 87.5 49.2 78.0 31.1 49.6 47.3Level of Service F E F D E C D DApproach Delay (s) 76.5 52.1 47.3 47.8Approach LOS E D D D
Intersection SummaryHCM 2000 Control Delay 55.7 HCM 2000 Level of Service EHCM 2000 Volume to Capacity ratio 0.94Actuated Cycle Length (s) 100.0 Sum of lost time (s) 16.0Intersection Capacity Utilization 81.0% ICU Level of Service DAnalysis Period (min) 15c Critical Lane Group
Agenda item No. 3

HCM Signalized Intersection Capacity Analysis 2040 Conditions36: Riverside Ave & Foothill Blvd AM Peak Hour
Rialto Impact Fee Study Synchro 9 Report
Movement EBL EBT EBR WBL WBT WBR NBL NBT NBR SBL SBT SBRLane ConfigurationsTraffic Volume (vph) 105 770 102 175 906 164 167 338 103 220 659 130Future Volume (vph) 105 770 102 175 906 164 167 338 103 220 659 130Ideal Flow (vphpl) 1700 1800 1800 1700 1800 1800 1700 1800 1800 1700 1800 1800Total Lost time (s) 4.0 4.0 4.0 4.0 4.0 4.0 4.0 4.0 4.0Lane Util. Factor 1.00 0.91 1.00 0.91 1.00 0.95 1.00 1.00 0.95Frt 1.00 0.98 1.00 0.98 1.00 1.00 0.85 1.00 0.98Flt Protected 0.95 1.00 0.95 1.00 0.95 1.00 1.00 0.95 1.00Satd. Flow (prot) 1583 4733 1583 4707 1583 3353 1500 1583 3270Flt Permitted 0.95 1.00 0.95 1.00 0.95 1.00 1.00 0.95 1.00Satd. Flow (perm) 1583 4733 1583 4707 1583 3353 1500 1583 3270Peak-hour factor, PHF 0.93 0.93 0.93 0.93 0.93 0.93 0.93 0.93 0.93 0.93 0.93 0.93Adj. Flow (vph) 113 828 110 188 974 176 180 363 111 237 709 140RTOR Reduction (vph) 0 16 0 0 25 0 0 0 83 0 17 0Lane Group Flow (vph) 113 922 0 188 1125 0 180 363 28 237 832 0Turn Type Prot NA Prot NA Prot NA Perm Prot NAProtected Phases 7 4 3 8 5 2 1 6Permitted Phases 2Actuated Green, G (s) 9.5 21.2 14.5 26.2 13.8 23.6 23.6 19.0 28.8Effective Green, g (s) 9.5 21.2 14.5 26.2 13.8 23.6 23.6 19.0 28.8Actuated g/C Ratio 0.10 0.22 0.15 0.28 0.15 0.25 0.25 0.20 0.31Clearance Time (s) 4.0 4.0 4.0 4.0 4.0 4.0 4.0 4.0 4.0Vehicle Extension (s) 3.0 3.0 3.0 3.0 3.0 3.0 3.0 3.0 3.0Lane Grp Cap (vph) 159 1064 243 1307 231 839 375 318 998v/s Ratio Prot 0.07 0.19 c0.12 c0.24 0.11 0.11 c0.15 c0.25v/s Ratio Perm 0.02v/c Ratio 0.71 0.87 0.77 0.86 0.78 0.43 0.07 0.75 0.83Uniform Delay, d1 41.1 35.2 38.3 32.3 38.8 29.7 27.0 35.4 30.5Progression Factor 1.00 1.00 1.00 1.00 1.00 1.00 1.00 1.00 1.00Incremental Delay, d2 13.9 7.6 14.2 6.0 15.2 0.4 0.1 9.1 6.1Delay (s) 55.0 42.7 52.5 38.3 54.0 30.1 27.1 44.5 36.6Level of Service D D D D D C C D DApproach Delay (s) 44.1 40.3 36.2 38.3Approach LOS D D D D
Intersection SummaryHCM 2000 Control Delay 40.1 HCM 2000 Level of Service DHCM 2000 Volume to Capacity ratio 0.86Actuated Cycle Length (s) 94.3 Sum of lost time (s) 16.0Intersection Capacity Utilization 76.2% ICU Level of Service DAnalysis Period (min) 15c Critical Lane Group
Agenda item No. 3

HCM Signalized Intersection Capacity Analysis 2040 Conditions37: Riverside Ave & Rialto Ave AM Peak Hour
Rialto Impact Fee Study Synchro 9 Report
Movement EBL EBT EBR WBL WBT WBR NBL NBT NBR SBL SBT SBRLane ConfigurationsTraffic Volume (vph) 31 148 49 94 128 7 39 486 29 30 940 32Future Volume (vph) 31 148 49 94 128 7 39 486 29 30 940 32Ideal Flow (vphpl) 1800 1800 1800 1800 1800 1800 1700 1800 1800 1700 1800 1800Total Lost time (s) 4.0 4.0 4.0 4.0 4.0 4.0 4.0 4.0Lane Util. Factor 1.00 1.00 1.00 1.00 1.00 0.95 1.00 0.95Frt 1.00 0.85 1.00 0.85 1.00 0.99 1.00 1.00Flt Protected 0.99 1.00 0.98 1.00 0.95 1.00 0.95 1.00Satd. Flow (prot) 1750 1500 1728 1500 1583 3325 1583 3337Flt Permitted 0.99 1.00 0.98 1.00 0.95 1.00 0.95 1.00Satd. Flow (perm) 1750 1500 1728 1500 1583 3325 1583 3337Peak-hour factor, PHF 0.88 0.88 0.88 0.88 0.88 0.88 0.88 0.88 0.88 0.88 0.88 0.88Adj. Flow (vph) 35 168 56 107 145 8 44 552 33 34 1068 36RTOR Reduction (vph) 0 0 47 0 0 7 0 4 0 0 2 0Lane Group Flow (vph) 0 203 9 0 252 1 44 581 0 34 1102 0Turn Type Split NA Perm Split NA Perm Prot NA Prot NAProtected Phases 4 4 8 8 5 2 1 6Permitted Phases 4 8Actuated Green, G (s) 14.7 14.7 17.4 17.4 2.8 42.1 3.3 42.6Effective Green, g (s) 14.7 14.7 17.4 17.4 2.8 42.1 3.3 42.6Actuated g/C Ratio 0.16 0.16 0.19 0.19 0.03 0.45 0.04 0.46Clearance Time (s) 4.0 4.0 4.0 4.0 4.0 4.0 4.0 4.0Vehicle Extension (s) 3.0 3.0 3.0 3.0 3.0 3.0 3.0 3.0Lane Grp Cap (vph) 275 235 321 279 47 1497 55 1520v/s Ratio Prot c0.12 c0.15 c0.03 0.17 0.02 c0.33v/s Ratio Perm 0.01 0.00v/c Ratio 0.74 0.04 0.79 0.01 0.94 0.39 0.62 0.72Uniform Delay, d1 37.6 33.4 36.3 31.0 45.3 17.1 44.5 20.7Progression Factor 1.00 1.00 1.00 1.00 1.00 1.00 1.00 1.00Incremental Delay, d2 9.9 0.1 11.9 0.0 106.2 0.8 18.9 3.0Delay (s) 47.5 33.5 48.2 31.0 151.5 17.9 63.4 23.7Level of Service D C D C F B E CApproach Delay (s) 44.4 47.6 27.2 24.9Approach LOS D D C C
Intersection SummaryHCM 2000 Control Delay 30.3 HCM 2000 Level of Service CHCM 2000 Volume to Capacity ratio 0.75Actuated Cycle Length (s) 93.5 Sum of lost time (s) 16.0Intersection Capacity Utilization 67.8% ICU Level of Service CAnalysis Period (min) 15c Critical Lane Group
Agenda item No. 3

HCM Signalized Intersection Capacity Analysis 2040 Conditions38: Bloomington Ave & Riverside Ave & Merrill Ave AM Peak Hour
Rialto Impact Fee Study Synchro 9 Report
Movement EBL EBT EBR WBL2 WBL WBT WBR NBL NBT NBR SBL SBTLane ConfigurationsTraffic Volume (vph) 56 203 61 45 136 253 28 81 480 36 40 803Future Volume (vph) 56 203 61 45 136 253 28 81 480 36 40 803Ideal Flow (vphpl) 1700 1800 1800 1800 1800 1800 1800 1800 1800 1800 1700 1800Total Lost time (s) 4.0 4.0 4.0 4.0 4.0 4.0 4.0 4.0Lane Util. Factor 1.00 0.95 1.00 0.95 1.00 0.95 1.00 0.95Frt 1.00 0.97 1.00 0.99 1.00 0.99 1.00 0.96Flt Protected 0.95 1.00 0.95 1.00 0.95 1.00 0.95 1.00Satd. Flow (prot) 1583 3237 1676 3303 1676 3318 1583 3207Flt Permitted 0.48 1.00 0.50 1.00 0.95 1.00 0.95 1.00Satd. Flow (perm) 793 3237 877 3303 1676 3318 1583 3207Peak-hour factor, PHF 0.87 0.87 0.87 0.87 0.87 0.87 0.87 0.87 0.87 0.87 0.87 0.87Adj. Flow (vph) 64 233 70 52 156 291 32 93 552 41 46 923RTOR Reduction (vph) 0 0 0 0 0 8 0 0 5 0 0 2Lane Group Flow (vph) 64 303 0 0 208 315 0 93 588 0 46 1298Turn Type Perm NA Perm Perm NA Prot NA Prot NAProtected Phases 4 8 5 2 1 6Permitted Phases 4 8 8Actuated Green, G (s) 24.0 24.0 24.0 24.0 6.0 41.5 4.1 39.6Effective Green, g (s) 24.0 24.0 24.0 24.0 6.0 41.5 4.1 39.6Actuated g/C Ratio 0.25 0.25 0.25 0.25 0.06 0.43 0.04 0.41Clearance Time (s) 4.0 4.0 4.0 4.0 4.0 4.0 4.0 4.0Vehicle Extension (s) 3.0 3.0 3.0 3.0 3.0 3.0 3.0 3.0Lane Grp Cap (vph) 199 812 220 829 105 1440 67 1328v/s Ratio Prot 0.09 0.10 c0.06 0.18 0.03 c0.40v/s Ratio Perm 0.08 c0.24v/c Ratio 0.32 0.37 0.95 0.38 0.89 0.41 0.69 0.98Uniform Delay, d1 29.2 29.6 35.2 29.6 44.5 18.6 45.1 27.6Progression Factor 1.00 1.00 1.00 1.00 1.00 1.00 1.00 1.00Incremental Delay, d2 0.9 0.3 45.2 0.3 52.9 0.2 25.3 19.2Delay (s) 30.1 29.9 80.3 29.9 97.4 18.8 70.5 46.8Level of Service C C F C F B E DApproach Delay (s) 29.9 49.7 29.4 47.6Approach LOS C D C D
Intersection SummaryHCM 2000 Control Delay 41.4 HCM 2000 Level of Service DHCM 2000 Volume to Capacity ratio 0.89Actuated Cycle Length (s) 95.6 Sum of lost time (s) 16.0Intersection Capacity Utilization 78.7% ICU Level of Service DAnalysis Period (min) 15c Critical Lane Group
Agenda item No. 3
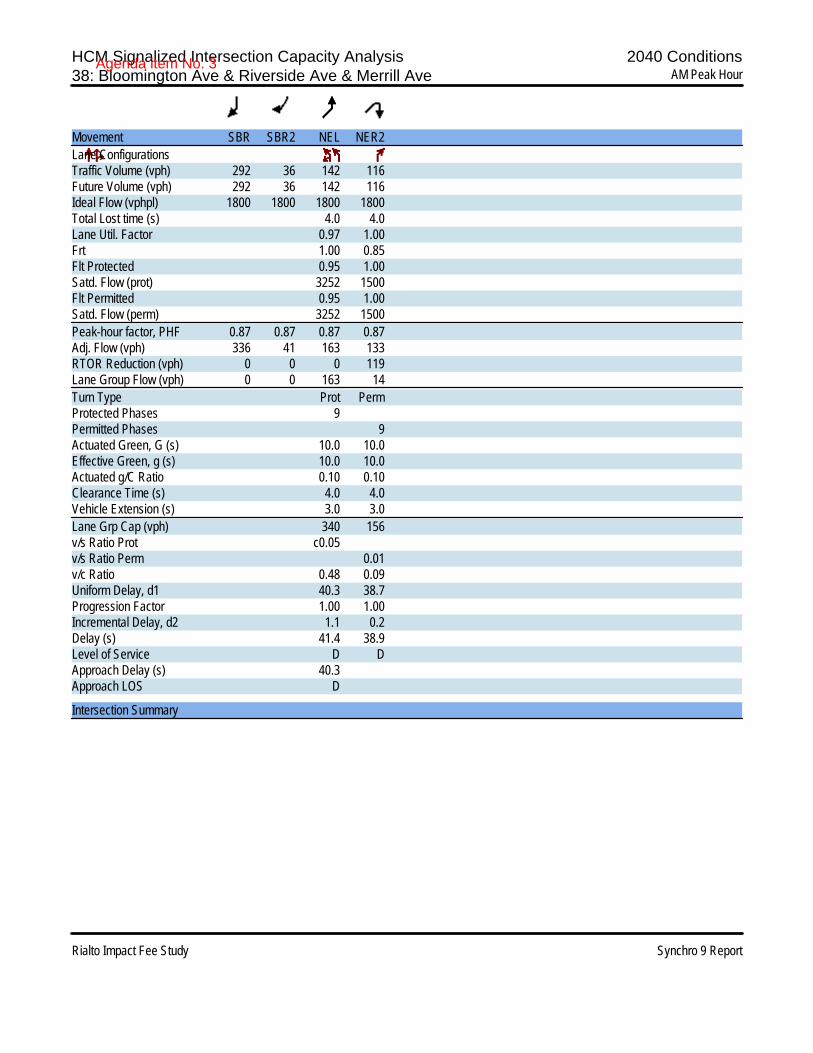
HCM Signalized Intersection Capacity Analysis 2040 Conditions38: Bloomington Ave & Riverside Ave & Merrill Ave AM Peak Hour
Rialto Impact Fee Study Synchro 9 Report
Movement SBR SBR2 NEL NER2Lane ConfigurationsTraffic Volume (vph) 292 36 142 116Future Volume (vph) 292 36 142 116Ideal Flow (vphpl) 1800 1800 1800 1800Total Lost time (s) 4.0 4.0Lane Util. Factor 0.97 1.00Frt 1.00 0.85Flt Protected 0.95 1.00Satd. Flow (prot) 3252 1500Flt Permitted 0.95 1.00Satd. Flow (perm) 3252 1500Peak-hour factor, PHF 0.87 0.87 0.87 0.87Adj. Flow (vph) 336 41 163 133RTOR Reduction (vph) 0 0 0 119Lane Group Flow (vph) 0 0 163 14Turn Type Prot PermProtected Phases 9Permitted Phases 9Actuated Green, G (s) 10.0 10.0Effective Green, g (s) 10.0 10.0Actuated g/C Ratio 0.10 0.10Clearance Time (s) 4.0 4.0Vehicle Extension (s) 3.0 3.0Lane Grp Cap (vph) 340 156v/s Ratio Prot c0.05v/s Ratio Perm 0.01v/c Ratio 0.48 0.09Uniform Delay, d1 40.3 38.7Progression Factor 1.00 1.00Incremental Delay, d2 1.1 0.2Delay (s) 41.4 38.9Level of Service D DApproach Delay (s) 40.3Approach LOS D
Intersection Summary
Agenda item No. 3

HCM Signalized Intersection Capacity Analysis 2040 Conditions39: Riverside Ave & Randall Ave AM Peak Hour
Rialto Impact Fee Study Synchro 9 Report
Movement EBL EBT EBR WBL WBT WBR NBL NBT NBR SBL SBT SBRLane ConfigurationsTraffic Volume (vph) 28 124 63 186 196 62 50 385 118 37 846 71Future Volume (vph) 28 124 63 186 196 62 50 385 118 37 846 71Ideal Flow (vphpl) 1700 1800 1800 1700 1800 1800 1700 1800 1800 1700 1800 1800Total Lost time (s) 4.0 4.0 4.0 4.0 4.0 4.0 4.0 4.0Lane Util. Factor 1.00 1.00 1.00 1.00 1.00 0.95 1.00 0.95Frt 1.00 0.95 1.00 0.96 1.00 0.96 1.00 0.99Flt Protected 0.95 1.00 0.95 1.00 0.95 1.00 0.95 1.00Satd. Flow (prot) 1583 1676 1583 1701 1583 3235 1583 3314Flt Permitted 0.95 1.00 0.95 1.00 0.95 1.00 0.95 1.00Satd. Flow (perm) 1583 1676 1583 1701 1583 3235 1583 3314Peak-hour factor, PHF 0.90 0.90 0.90 0.90 0.90 0.90 0.90 0.90 0.90 0.90 0.90 0.90Adj. Flow (vph) 31 138 70 207 218 69 56 428 131 41 940 79RTOR Reduction (vph) 0 18 0 0 12 0 0 28 0 0 6 0Lane Group Flow (vph) 31 190 0 207 275 0 56 531 0 41 1013 0Turn Type Split NA Split NA Prot NA Prot NAProtected Phases 4 4 8 8 5 2 1 6Permitted PhasesActuated Green, G (s) 14.3 14.3 18.9 18.9 5.1 34.6 3.7 33.2Effective Green, g (s) 14.3 14.3 18.9 18.9 5.1 34.6 3.7 33.2Actuated g/C Ratio 0.16 0.16 0.22 0.22 0.06 0.40 0.04 0.38Clearance Time (s) 4.0 4.0 4.0 4.0 4.0 4.0 4.0 4.0Vehicle Extension (s) 3.0 3.0 3.0 3.0 3.0 3.0 3.0 3.0Lane Grp Cap (vph) 258 273 341 367 92 1279 66 1257v/s Ratio Prot 0.02 c0.11 0.13 c0.16 c0.04 0.16 0.03 c0.31v/s Ratio Permv/c Ratio 0.12 0.69 0.61 0.75 0.61 0.42 0.62 0.81Uniform Delay, d1 31.2 34.5 30.9 32.1 40.2 19.1 41.2 24.3Progression Factor 1.00 1.00 1.00 1.00 1.00 1.00 1.00 1.00Incremental Delay, d2 0.2 7.5 3.0 8.2 10.9 0.2 16.8 3.9Delay (s) 31.4 42.0 34.0 40.3 51.1 19.4 58.0 28.1Level of Service C D C D D B E CApproach Delay (s) 40.6 37.6 22.2 29.3Approach LOS D D C C
Intersection SummaryHCM 2000 Control Delay 30.3 HCM 2000 Level of Service CHCM 2000 Volume to Capacity ratio 0.75Actuated Cycle Length (s) 87.5 Sum of lost time (s) 16.0Intersection Capacity Utilization 66.2% ICU Level of Service CAnalysis Period (min) 15c Critical Lane Group
Agenda item No. 3

HCM Signalized Intersection Capacity Analysis 2040 Conditions40: Riverside Ave & San Bernardinio Ave AM Peak Hour
Rialto Impact Fee Study Synchro 9 Report
Movement EBL EBT EBR WBL WBT WBR NBL NBT NBR SBL SBT SBRLane ConfigurationsTraffic Volume (vph) 25 198 204 363 237 80 90 324 124 102 828 77Future Volume (vph) 25 198 204 363 237 80 90 324 124 102 828 77Ideal Flow (vphpl) 1700 1800 1800 1700 1800 1800 1700 1800 1800 1700 1800 1800Total Lost time (s) 4.0 4.0 4.0 4.0 4.0 4.0 4.0 4.0 4.0Lane Util. Factor 1.00 1.00 1.00 1.00 1.00 1.00 0.95 1.00 0.95Frt 1.00 0.92 1.00 1.00 0.85 1.00 0.96 1.00 0.99Flt Protected 0.95 1.00 0.95 1.00 1.00 0.95 1.00 0.95 1.00Satd. Flow (prot) 1583 1630 1583 1765 1500 1583 3214 1583 3310Flt Permitted 0.95 1.00 0.95 1.00 1.00 0.95 1.00 0.95 1.00Satd. Flow (perm) 1583 1630 1583 1765 1500 1583 3214 1583 3310Peak-hour factor, PHF 0.96 0.96 0.96 0.96 0.96 0.96 0.96 0.96 0.96 0.96 0.96 0.96Adj. Flow (vph) 26 206 212 378 247 83 94 338 129 106 862 80RTOR Reduction (vph) 0 36 0 0 0 44 0 39 0 0 7 0Lane Group Flow (vph) 26 383 0 378 247 39 94 428 0 106 936 0Turn Type Prot NA Prot NA Perm Prot NA Prot NAProtected Phases 7 4 3 8 5 2 1 6Permitted Phases 8Actuated Green, G (s) 2.4 25.4 24.9 47.9 47.9 7.0 25.0 11.0 29.0Effective Green, g (s) 2.4 25.4 24.9 47.9 47.9 7.0 25.0 11.0 29.0Actuated g/C Ratio 0.02 0.25 0.24 0.47 0.47 0.07 0.24 0.11 0.28Clearance Time (s) 4.0 4.0 4.0 4.0 4.0 4.0 4.0 4.0 4.0Vehicle Extension (s) 3.0 3.0 3.0 3.0 3.0 3.0 3.0 3.0 3.0Lane Grp Cap (vph) 37 404 385 826 702 108 785 170 938v/s Ratio Prot 0.02 c0.23 c0.24 0.14 c0.06 0.13 0.07 c0.28v/s Ratio Perm 0.03v/c Ratio 0.70 0.95 0.98 0.30 0.06 0.87 0.54 0.62 1.00Uniform Delay, d1 49.6 37.8 38.5 16.8 14.8 47.2 33.7 43.7 36.6Progression Factor 1.00 1.00 1.00 1.00 1.00 1.00 1.00 1.00 1.00Incremental Delay, d2 46.2 31.3 40.8 0.2 0.0 48.4 0.8 6.9 28.6Delay (s) 95.8 69.1 79.3 17.0 14.9 95.6 34.5 50.6 65.2Level of Service F E E B B F C D EApproach Delay (s) 70.7 50.0 44.7 63.7Approach LOS E D D E
Intersection SummaryHCM 2000 Control Delay 57.5 HCM 2000 Level of Service EHCM 2000 Volume to Capacity ratio 0.97Actuated Cycle Length (s) 102.3 Sum of lost time (s) 16.0Intersection Capacity Utilization 92.3% ICU Level of Service FAnalysis Period (min) 15c Critical Lane Group
Agenda item No. 3
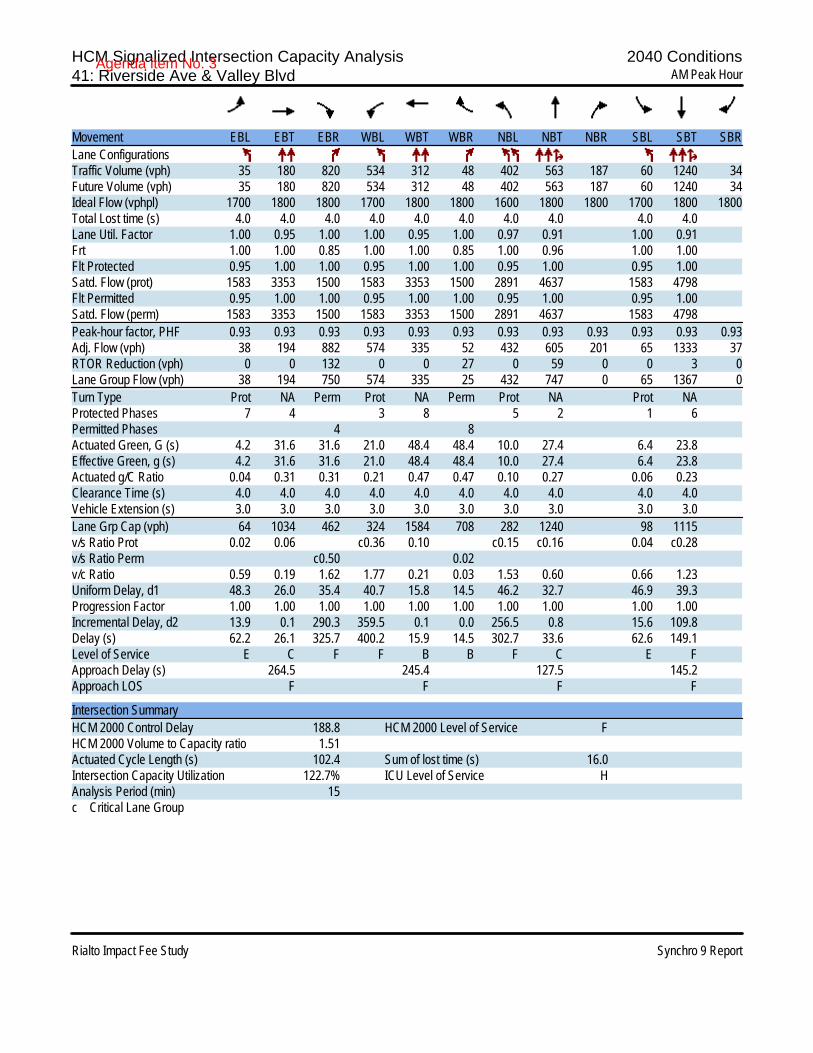
HCM Signalized Intersection Capacity Analysis 2040 Conditions41: Riverside Ave & Valley Blvd AM Peak Hour
Rialto Impact Fee Study Synchro 9 Report
Movement EBL EBT EBR WBL WBT WBR NBL NBT NBR SBL SBT SBRLane ConfigurationsTraffic Volume (vph) 35 180 820 534 312 48 402 563 187 60 1240 34Future Volume (vph) 35 180 820 534 312 48 402 563 187 60 1240 34Ideal Flow (vphpl) 1700 1800 1800 1700 1800 1800 1600 1800 1800 1700 1800 1800Total Lost time (s) 4.0 4.0 4.0 4.0 4.0 4.0 4.0 4.0 4.0 4.0Lane Util. Factor 1.00 0.95 1.00 1.00 0.95 1.00 0.97 0.91 1.00 0.91Frt 1.00 1.00 0.85 1.00 1.00 0.85 1.00 0.96 1.00 1.00Flt Protected 0.95 1.00 1.00 0.95 1.00 1.00 0.95 1.00 0.95 1.00Satd. Flow (prot) 1583 3353 1500 1583 3353 1500 2891 4637 1583 4798Flt Permitted 0.95 1.00 1.00 0.95 1.00 1.00 0.95 1.00 0.95 1.00Satd. Flow (perm) 1583 3353 1500 1583 3353 1500 2891 4637 1583 4798Peak-hour factor, PHF 0.93 0.93 0.93 0.93 0.93 0.93 0.93 0.93 0.93 0.93 0.93 0.93Adj. Flow (vph) 38 194 882 574 335 52 432 605 201 65 1333 37RTOR Reduction (vph) 0 0 132 0 0 27 0 59 0 0 3 0Lane Group Flow (vph) 38 194 750 574 335 25 432 747 0 65 1367 0Turn Type Prot NA Perm Prot NA Perm Prot NA Prot NAProtected Phases 7 4 3 8 5 2 1 6Permitted Phases 4 8Actuated Green, G (s) 4.2 31.6 31.6 21.0 48.4 48.4 10.0 27.4 6.4 23.8Effective Green, g (s) 4.2 31.6 31.6 21.0 48.4 48.4 10.0 27.4 6.4 23.8Actuated g/C Ratio 0.04 0.31 0.31 0.21 0.47 0.47 0.10 0.27 0.06 0.23Clearance Time (s) 4.0 4.0 4.0 4.0 4.0 4.0 4.0 4.0 4.0 4.0Vehicle Extension (s) 3.0 3.0 3.0 3.0 3.0 3.0 3.0 3.0 3.0 3.0Lane Grp Cap (vph) 64 1034 462 324 1584 708 282 1240 98 1115v/s Ratio Prot 0.02 0.06 c0.36 0.10 c0.15 c0.16 0.04 c0.28v/s Ratio Perm c0.50 0.02v/c Ratio 0.59 0.19 1.62 1.77 0.21 0.03 1.53 0.60 0.66 1.23Uniform Delay, d1 48.3 26.0 35.4 40.7 15.8 14.5 46.2 32.7 46.9 39.3Progression Factor 1.00 1.00 1.00 1.00 1.00 1.00 1.00 1.00 1.00 1.00Incremental Delay, d2 13.9 0.1 290.3 359.5 0.1 0.0 256.5 0.8 15.6 109.8Delay (s) 62.2 26.1 325.7 400.2 15.9 14.5 302.7 33.6 62.6 149.1Level of Service E C F F B B F C E FApproach Delay (s) 264.5 245.4 127.5 145.2Approach LOS F F F F
Intersection SummaryHCM 2000 Control Delay 188.8 HCM 2000 Level of Service FHCM 2000 Volume to Capacity ratio 1.51Actuated Cycle Length (s) 102.4 Sum of lost time (s) 16.0Intersection Capacity Utilization 122.7% ICU Level of Service HAnalysis Period (min) 15c Critical Lane Group
Agenda item No. 3

HCM Signalized Intersection Capacity Analysis 2040 Conditions42: Riverside Ave & I-10 WB Ramps AM Peak Hour
Rialto Impact Fee Study Synchro 9 Report
Movement EBL EBT EBR WBL WBT WBR NBL NBT NBR SBL SBT SBRLane ConfigurationsTraffic Volume (vph) 0 0 0 820 1 205 247 952 0 0 2270 344Future Volume (vph) 0 0 0 820 1 205 247 952 0 0 2270 344Ideal Flow (vphpl) 1800 1800 1800 1700 1800 1800 1600 1800 1800 1800 1800 1800Total Lost time (s) 4.0 4.0 4.0 4.0 4.0 4.0 4.0Lane Util. Factor 0.95 0.91 0.95 0.97 0.91 0.86 1.00Frt 1.00 0.99 0.85 1.00 1.00 1.00 0.85Flt Protected 0.95 0.95 1.00 0.95 1.00 1.00 1.00Satd. Flow (prot) 1504 1522 1425 2891 4818 6071 1500Flt Permitted 0.95 0.95 1.00 0.95 1.00 1.00 1.00Satd. Flow (perm) 1504 1522 1425 2891 4818 6071 1500Peak-hour factor, PHF 0.92 0.92 0.92 0.92 0.92 0.92 0.92 0.92 0.92 0.92 0.92 0.92Adj. Flow (vph) 0 0 0 891 1 223 268 1035 0 0 2467 374RTOR Reduction (vph) 0 0 0 0 2 68 0 0 0 0 0 174Lane Group Flow (vph) 0 0 0 454 458 133 268 1035 0 0 2467 200Turn Type Perm NA Perm Prot NA NA PermProtected Phases 8 5 2 6Permitted Phases 8 8 6Actuated Green, G (s) 32.5 32.5 32.5 10.0 58.0 44.0 44.0Effective Green, g (s) 32.5 32.5 32.5 10.0 58.0 44.0 44.0Actuated g/C Ratio 0.33 0.33 0.33 0.10 0.59 0.45 0.45Clearance Time (s) 4.0 4.0 4.0 4.0 4.0 4.0 4.0Vehicle Extension (s) 3.0 3.0 3.0 3.0 3.0 3.0 3.0Lane Grp Cap (vph) 496 502 470 293 2836 2711 670v/s Ratio Prot c0.09 0.21 c0.41v/s Ratio Perm c0.30 0.30 0.09 0.13v/c Ratio 0.92 0.91 0.28 0.91 0.36 0.91 0.30Uniform Delay, d1 31.7 31.6 24.4 43.8 10.6 25.4 17.4Progression Factor 1.00 1.00 1.00 1.00 1.00 1.00 1.00Incremental Delay, d2 21.5 20.9 0.3 31.1 0.1 5.0 0.3Delay (s) 53.2 52.5 24.7 75.0 10.7 30.4 17.6Level of Service D D C E B C BApproach Delay (s) 0.0 47.8 23.9 28.7Approach LOS A D C C
Intersection SummaryHCM 2000 Control Delay 31.6 HCM 2000 Level of Service CHCM 2000 Volume to Capacity ratio 0.91Actuated Cycle Length (s) 98.5 Sum of lost time (s) 12.0Intersection Capacity Utilization 112.4% ICU Level of Service HAnalysis Period (min) 15c Critical Lane Group
Agenda item No. 3

HCM Signalized Intersection Capacity Analysis 2040 Conditions43: Riverside Ave & I-10 EB Ramps AM Peak Hour
Rialto Impact Fee Study Synchro 9 Report
Movement EBL EBT EBR WBL WBT WBR NBL NBT NBR SBL SBT SBRLane ConfigurationsTraffic Volume (vph) 316 8 601 0 0 0 0 907 302 526 2569 0Future Volume (vph) 316 8 601 0 0 0 0 907 302 526 2569 0Ideal Flow (vphpl) 1700 1800 1800 1800 1800 1800 1800 1800 1800 1600 1800 1800Total Lost time (s) 4.0 4.0 4.0 4.0 4.0 4.0Lane Util. Factor 0.95 0.91 0.95 0.91 0.97 0.95Frt 1.00 0.87 0.85 0.96 1.00 1.00Flt Protected 0.95 1.00 1.00 1.00 0.95 1.00Satd. Flow (prot) 1504 1388 1425 4637 2891 3353Flt Permitted 0.95 1.00 1.00 1.00 0.95 1.00Satd. Flow (perm) 1504 1388 1425 4637 2891 3353Peak-hour factor, PHF 0.91 0.91 0.91 0.91 0.91 0.91 0.91 0.91 0.91 0.91 0.91 0.91Adj. Flow (vph) 347 9 660 0 0 0 0 997 332 578 2823 0RTOR Reduction (vph) 0 4 44 0 0 0 0 56 0 0 0 0Lane Group Flow (vph) 312 350 306 0 0 0 0 1273 0 578 2823 0Turn Type Perm NA Perm NA Prot NAProtected Phases 4 2 1 6Permitted Phases 4 4Actuated Green, G (s) 20.0 20.0 20.0 43.6 24.4 72.0Effective Green, g (s) 20.0 20.0 20.0 43.6 24.4 72.0Actuated g/C Ratio 0.20 0.20 0.20 0.44 0.24 0.72Clearance Time (s) 4.0 4.0 4.0 4.0 4.0 4.0Vehicle Extension (s) 3.0 3.0 3.0 3.0 3.0 3.0Lane Grp Cap (vph) 300 277 285 2021 705 2414v/s Ratio Prot 0.27 0.20 c0.84v/s Ratio Perm 0.21 0.25 0.21v/c Ratio 1.04 1.26 1.07 0.63 0.82 1.17Uniform Delay, d1 40.0 40.0 40.0 21.9 35.7 14.0Progression Factor 1.00 1.00 1.00 1.00 1.00 1.00Incremental Delay, d2 62.7 144.2 74.3 0.6 7.4 81.1Delay (s) 102.7 184.2 114.3 22.5 43.1 95.1Level of Service F F F C D FApproach Delay (s) 135.1 0.0 22.5 86.3Approach LOS F A C F
Intersection SummaryHCM 2000 Control Delay 80.2 HCM 2000 Level of Service FHCM 2000 Volume to Capacity ratio 1.24Actuated Cycle Length (s) 100.0 Sum of lost time (s) 12.0Intersection Capacity Utilization 112.4% ICU Level of Service HAnalysis Period (min) 15c Critical Lane Group
Agenda item No. 3

HCM Signalized Intersection Capacity Analysis 2040 Conditions44: Riverside Ave & Slover Ave AM Peak Hour
Rialto Impact Fee Study Synchro 9 Report
Movement EBL EBT EBR WBL WBT WBR NBL NBT NBR SBL SBT SBRLane ConfigurationsTraffic Volume (vph) 176 15 42 22 10 14 57 1113 10 36 2850 317Future Volume (vph) 176 15 42 22 10 14 57 1113 10 36 2850 317Ideal Flow (vphpl) 1700 1800 1800 1700 1800 1800 1700 1800 1800 1700 1800 1800Total Lost time (s) 4.0 4.0 4.0 4.0 4.0 4.0 4.0 4.0Lane Util. Factor 1.00 0.95 1.00 0.95 1.00 0.95 1.00 0.95Frt 1.00 0.89 1.00 0.91 1.00 1.00 1.00 0.98Flt Protected 0.95 1.00 0.95 1.00 0.95 1.00 0.95 1.00Satd. Flow (prot) 1583 2984 1583 3055 1583 3349 1583 3303Flt Permitted 0.74 1.00 0.71 1.00 0.95 1.00 0.95 1.00Satd. Flow (perm) 1231 2984 1189 3055 1583 3349 1583 3303Peak-hour factor, PHF 0.89 0.89 0.89 0.89 0.89 0.89 0.89 0.89 0.89 0.89 0.89 0.89Adj. Flow (vph) 198 17 47 25 11 16 64 1251 11 40 3202 356RTOR Reduction (vph) 0 40 0 0 14 0 0 1 0 0 8 0Lane Group Flow (vph) 198 24 0 25 13 0 64 1261 0 40 3550 0Turn Type Perm NA Perm NA Prot NA Prot NAProtected Phases 4 8 5 2 1 6Permitted Phases 4 8Actuated Green, G (s) 16.0 16.0 16.0 16.0 4.0 77.4 4.2 77.6Effective Green, g (s) 16.0 16.0 16.0 16.0 4.0 77.4 4.2 77.6Actuated g/C Ratio 0.15 0.15 0.15 0.15 0.04 0.71 0.04 0.71Clearance Time (s) 4.0 4.0 4.0 4.0 4.0 4.0 4.0 4.0Vehicle Extension (s) 3.0 3.0 3.0 3.0 3.0 3.0 3.0 3.0Lane Grp Cap (vph) 179 435 173 445 57 2365 60 2338v/s Ratio Prot 0.01 0.00 c0.04 0.38 0.03 c1.08v/s Ratio Perm c0.16 0.02v/c Ratio 1.11 0.05 0.14 0.03 1.12 0.53 0.67 1.52Uniform Delay, d1 46.8 40.3 40.8 40.1 52.8 7.6 52.0 16.0Progression Factor 1.00 1.00 1.00 1.00 1.00 1.00 1.00 1.00Incremental Delay, d2 98.6 0.1 0.4 0.0 156.9 0.2 24.5 235.6Delay (s) 145.4 40.3 41.2 40.2 209.7 7.8 76.6 251.6Level of Service F D D D F A E FApproach Delay (s) 119.7 40.7 17.6 249.6Approach LOS F D B F
Intersection SummaryHCM 2000 Control Delay 182.3 HCM 2000 Level of Service FHCM 2000 Volume to Capacity ratio 1.43Actuated Cycle Length (s) 109.6 Sum of lost time (s) 12.0Intersection Capacity Utilization 118.0% ICU Level of Service HAnalysis Period (min) 15c Critical Lane Group
Agenda item No. 3

HCM Signalized Intersection Capacity Analysis 2040 Conditions45: Riverside Ave & Jurupa Ave AM Peak Hour
Rialto Impact Fee Study Synchro 9 Report
Movement EBL EBR NBL NBT SBT SBRLane ConfigurationsTraffic Volume (vph) 46 122 92 1135 2448 80Future Volume (vph) 46 122 92 1135 2448 80Ideal Flow (vphpl) 1700 1800 1700 1800 1800 1800Total Lost time (s) 4.0 4.0 4.0 4.0 4.0Lane Util. Factor 1.00 1.00 1.00 0.91 0.95Frt 1.00 0.85 1.00 1.00 1.00Flt Protected 0.95 1.00 0.95 1.00 1.00Satd. Flow (prot) 1583 1500 1583 4818 3337Flt Permitted 0.95 1.00 0.95 1.00 1.00Satd. Flow (perm) 1583 1500 1583 4818 3337Peak-hour factor, PHF 0.94 0.94 0.94 0.94 0.94 0.94Adj. Flow (vph) 49 130 98 1207 2604 85RTOR Reduction (vph) 0 66 0 0 2 0Lane Group Flow (vph) 49 64 98 1207 2687 0Turn Type Prot Perm Prot NA NAProtected Phases 4 5 2 6Permitted Phases 4Actuated Green, G (s) 9.1 9.1 4.0 66.1 58.1Effective Green, g (s) 9.1 9.1 4.0 66.1 58.1Actuated g/C Ratio 0.11 0.11 0.05 0.79 0.70Clearance Time (s) 4.0 4.0 4.0 4.0 4.0Vehicle Extension (s) 3.0 3.0 3.0 3.0 3.0Lane Grp Cap (vph) 173 164 76 3827 2330v/s Ratio Prot 0.03 c0.06 0.25 c0.81v/s Ratio Perm c0.04v/c Ratio 0.28 0.39 1.29 0.32 1.15Uniform Delay, d1 34.1 34.5 39.6 2.3 12.6Progression Factor 1.00 1.00 1.00 1.00 1.00Incremental Delay, d2 0.9 1.5 199.2 0.0 74.3Delay (s) 35.0 36.0 238.8 2.4 86.9Level of Service C D F A FApproach Delay (s) 35.7 20.1 86.9Approach LOS D C F
Intersection SummaryHCM 2000 Control Delay 63.8 HCM 2000 Level of Service EHCM 2000 Volume to Capacity ratio 1.06Actuated Cycle Length (s) 83.2 Sum of lost time (s) 12.0Intersection Capacity Utilization 93.1% ICU Level of Service FAnalysis Period (min) 15c Critical Lane Group
Agenda item No. 3

HCM Signalized Intersection Capacity Analysis 2040 Conditions46: Riverside Ave & Agua Mansa Rd AM Peak Hour
Rialto Impact Fee Study Synchro 9 Report
Movement EBL EBT EBR WBL WBT WBR NBL NBT NBR SBL SBT SBRLane ConfigurationsTraffic Volume (vph) 129 192 103 180 588 88 253 946 100 94 1950 363Future Volume (vph) 129 192 103 180 588 88 253 946 100 94 1950 363Ideal Flow (vphpl) 1700 1800 1800 1700 1800 1800 1700 1800 1800 1700 1800 1800Total Lost time (s) 4.0 4.0 4.0 4.0 4.0 4.0 4.0 4.0 4.0 4.0 4.0Lane Util. Factor 1.00 1.00 1.00 1.00 1.00 1.00 1.00 0.95 1.00 0.95 1.00Frt 1.00 1.00 0.85 1.00 1.00 0.85 1.00 0.99 1.00 1.00 0.85Flt Protected 0.95 1.00 1.00 0.95 1.00 1.00 0.95 1.00 0.95 1.00 1.00Satd. Flow (prot) 1583 1765 1500 1583 1765 1500 1583 3305 1583 3353 1500Flt Permitted 0.95 1.00 1.00 0.95 1.00 1.00 0.95 1.00 0.95 1.00 1.00Satd. Flow (perm) 1583 1765 1500 1583 1765 1500 1583 3305 1583 3353 1500Peak-hour factor, PHF 0.92 0.92 0.92 0.92 0.92 0.92 0.92 0.92 0.92 0.92 0.92 0.92Adj. Flow (vph) 140 209 112 196 639 96 275 1028 109 102 2120 395RTOR Reduction (vph) 0 0 94 0 0 72 0 8 0 0 0 81Lane Group Flow (vph) 140 209 18 196 639 24 275 1129 0 102 2120 314Turn Type Prot NA Perm Prot NA Perm Prot NA Prot NA PermProtected Phases 7 4 3 8 5 2 1 6Permitted Phases 4 8 6Actuated Green, G (s) 6.0 16.5 16.5 14.5 25.0 25.0 10.0 44.3 8.7 43.0 43.0Effective Green, g (s) 6.0 16.5 16.5 14.5 25.0 25.0 10.0 44.3 8.7 43.0 43.0Actuated g/C Ratio 0.06 0.16 0.16 0.14 0.25 0.25 0.10 0.44 0.09 0.43 0.43Clearance Time (s) 4.0 4.0 4.0 4.0 4.0 4.0 4.0 4.0 4.0 4.0 4.0Vehicle Extension (s) 3.0 3.0 3.0 3.0 3.0 3.0 3.0 3.0 3.0 3.0 3.0Lane Grp Cap (vph) 94 291 247 229 441 375 158 1464 137 1441 645v/s Ratio Prot c0.09 0.12 0.12 c0.36 c0.17 0.34 0.06 c0.63v/s Ratio Perm 0.01 0.02 0.21v/c Ratio 1.49 0.72 0.07 0.86 1.45 0.06 1.74 0.77 0.74 1.47 0.49Uniform Delay, d1 47.0 39.5 35.3 41.7 37.5 28.6 45.0 23.6 44.6 28.5 20.5Progression Factor 1.00 1.00 1.00 1.00 1.00 1.00 1.00 1.00 1.00 1.00 1.00Incremental Delay, d2 268.1 8.2 0.1 25.5 214.5 0.1 358.1 2.6 19.5 215.9 0.6Delay (s) 315.1 47.8 35.4 67.2 252.0 28.7 403.1 26.1 64.1 244.4 21.1Level of Service F D D E F C F C E F CApproach Delay (s) 125.9 190.0 99.6 203.6Approach LOS F F F F
Intersection SummaryHCM 2000 Control Delay 167.6 HCM 2000 Level of Service FHCM 2000 Volume to Capacity ratio 1.50Actuated Cycle Length (s) 100.0 Sum of lost time (s) 16.0Intersection Capacity Utilization 126.6% ICU Level of Service HAnalysis Period (min) 15c Critical Lane Group
Agenda item No. 3

HCM Signalized Intersection Capacity Analysis 2040 Conditions47: Acacia Ave & Base Line Rd AM Peak Hour
Rialto Impact Fee Study Synchro 9 Report
Movement EBL EBT EBR WBL WBT WBR NBL NBT NBR SBL SBT SBRLane ConfigurationsTraffic Volume (vph) 3 333 26 41 703 11 49 75 48 37 64 27Future Volume (vph) 3 333 26 41 703 11 49 75 48 37 64 27Ideal Flow (vphpl) 1700 1800 1800 1700 1800 1800 1800 1800 1800 1800 1800 1800Total Lost time (s) 4.0 4.0 4.0 4.0 4.0 4.0Lane Util. Factor 1.00 0.95 1.00 0.95 1.00 1.00Frt 1.00 0.99 1.00 1.00 0.96 0.97Flt Protected 0.95 1.00 0.95 1.00 0.99 0.99Satd. Flow (prot) 1583 3317 1583 3345 1674 1689Flt Permitted 0.29 1.00 0.50 1.00 0.88 0.87Satd. Flow (perm) 476 3317 834 3345 1487 1488Peak-hour factor, PHF 0.83 0.83 0.83 0.83 0.83 0.83 0.83 0.83 0.83 0.83 0.83 0.83Adj. Flow (vph) 4 401 31 49 847 13 59 90 58 45 77 33RTOR Reduction (vph) 0 6 0 0 1 0 0 16 0 0 11 0Lane Group Flow (vph) 4 426 0 49 859 0 0 191 0 0 144 0Turn Type Perm NA Perm NA Perm NA Perm NAProtected Phases 4 8 2 6Permitted Phases 4 8 2 6Actuated Green, G (s) 18.6 18.6 18.6 18.6 11.2 11.2Effective Green, g (s) 18.6 18.6 18.6 18.6 11.2 11.2Actuated g/C Ratio 0.49 0.49 0.49 0.49 0.30 0.30Clearance Time (s) 4.0 4.0 4.0 4.0 4.0 4.0Vehicle Extension (s) 3.0 3.0 3.0 3.0 3.0 3.0Lane Grp Cap (vph) 234 1632 410 1645 440 440v/s Ratio Prot 0.13 c0.26v/s Ratio Perm 0.01 0.06 c0.13 0.10v/c Ratio 0.02 0.26 0.12 0.52 0.43 0.33Uniform Delay, d1 4.9 5.6 5.2 6.6 10.7 10.4Progression Factor 1.00 1.00 1.00 1.00 1.00 1.00Incremental Delay, d2 0.0 0.1 0.1 0.3 0.7 0.4Delay (s) 4.9 5.7 5.3 6.9 11.4 10.8Level of Service A A A A B BApproach Delay (s) 5.7 6.8 11.4 10.8Approach LOS A A B B
Intersection SummaryHCM 2000 Control Delay 7.4 HCM 2000 Level of Service AHCM 2000 Volume to Capacity ratio 0.49Actuated Cycle Length (s) 37.8 Sum of lost time (s) 8.0Intersection Capacity Utilization 47.6% ICU Level of Service AAnalysis Period (min) 15c Critical Lane Group
Agenda item No. 3

HCM Signalized Intersection Capacity Analysis 2040 Conditions48: Acacia Ave & Foothill Blvd AM Peak Hour
Rialto Impact Fee Study Synchro 9 Report
Movement EBL EBT EBR WBL WBT WBR NBL NBT NBR SBL SBT SBRLane ConfigurationsTraffic Volume (vph) 34 986 88 43 1194 45 74 123 56 58 172 72Future Volume (vph) 34 986 88 43 1194 45 74 123 56 58 172 72Ideal Flow (vphpl) 1700 1800 1800 1700 1800 1800 1800 1800 1800 1800 1800 1800Total Lost time (s) 4.0 4.0 4.0 4.0 4.0 4.0Lane Util. Factor 1.00 0.91 1.00 0.95 1.00 1.00Frt 1.00 0.99 1.00 0.99 0.97 0.97Flt Protected 0.95 1.00 0.95 1.00 0.99 0.99Satd. Flow (prot) 1583 4758 1583 3335 1687 1692Flt Permitted 0.95 1.00 0.95 1.00 0.74 0.87Satd. Flow (perm) 1583 4758 1583 3335 1263 1491Peak-hour factor, PHF 0.89 0.89 0.89 0.89 0.89 0.89 0.89 0.89 0.89 0.89 0.89 0.89Adj. Flow (vph) 38 1108 99 48 1342 51 83 138 63 65 193 81RTOR Reduction (vph) 0 10 0 0 2 0 0 11 0 0 12 0Lane Group Flow (vph) 38 1197 0 48 1391 0 0 273 0 0 327 0Turn Type Prot NA Prot NA Perm NA Perm NAProtected Phases 7 4 3 8 2 6Permitted Phases 2 6Actuated Green, G (s) 2.5 40.1 3.4 41.0 23.2 23.2Effective Green, g (s) 2.5 40.1 3.4 41.0 23.2 23.2Actuated g/C Ratio 0.03 0.51 0.04 0.52 0.29 0.29Clearance Time (s) 4.0 4.0 4.0 4.0 4.0 4.0Vehicle Extension (s) 3.0 3.0 3.0 3.0 3.0 3.0Lane Grp Cap (vph) 50 2424 68 1737 372 439v/s Ratio Prot 0.02 0.25 c0.03 c0.42v/s Ratio Perm 0.22 c0.22v/c Ratio 0.76 0.49 0.71 0.80 0.73 0.74Uniform Delay, d1 37.8 12.6 37.2 15.5 25.0 25.1Progression Factor 1.00 1.00 1.00 1.00 1.00 1.00Incremental Delay, d2 48.9 0.2 28.3 2.7 7.3 6.7Delay (s) 86.8 12.8 65.4 18.2 32.3 31.8Level of Service F B E B C CApproach Delay (s) 15.1 19.8 32.3 31.8Approach LOS B B C C
Intersection SummaryHCM 2000 Control Delay 20.3 HCM 2000 Level of Service CHCM 2000 Volume to Capacity ratio 0.79Actuated Cycle Length (s) 78.7 Sum of lost time (s) 12.0Intersection Capacity Utilization 70.0% ICU Level of Service CAnalysis Period (min) 15c Critical Lane Group
Agenda item No. 3

HCM Signalized Intersection Capacity Analysis 2040 Conditions49: Pepper Ave & Base Line Rd AM Peak Hour
Rialto Impact Fee Study Synchro 9 Report
Movement EBL EBT EBR WBL WBT WBR NBL NBT NBR SBL SBT SBRLane ConfigurationsTraffic Volume (vph) 184 201 212 35 401 215 211 443 12 128 566 330Future Volume (vph) 184 201 212 35 401 215 211 443 12 128 566 330Ideal Flow (vphpl) 1700 1800 1800 1700 1800 1800 1700 1800 1800 1700 1800 1800Total Lost time (s) 4.0 4.0 4.0 4.0 4.0 4.0 4.0 4.0Lane Util. Factor 1.00 0.95 1.00 0.95 1.00 0.95 1.00 0.95Frt 1.00 0.92 1.00 0.95 1.00 1.00 1.00 0.94Flt Protected 0.95 1.00 0.95 1.00 0.95 1.00 0.95 1.00Satd. Flow (prot) 1583 3095 1583 3177 1583 3340 1583 3168Flt Permitted 0.28 1.00 0.42 1.00 0.22 1.00 0.44 1.00Satd. Flow (perm) 459 3095 699 3177 366 3340 733 3168Peak-hour factor, PHF 0.92 0.92 0.92 0.92 0.92 0.92 0.92 0.92 0.92 0.92 0.92 0.92Adj. Flow (vph) 200 218 230 38 436 234 229 482 13 139 615 359RTOR Reduction (vph) 0 145 0 0 71 0 0 2 0 0 84 0Lane Group Flow (vph) 200 303 0 38 599 0 229 493 0 139 890 0Turn Type Perm NA Perm NA Perm NA Perm NAProtected Phases 4 8 2 6Permitted Phases 4 8 2 6Actuated Green, G (s) 37.0 37.0 37.0 37.0 55.0 55.0 55.0 55.0Effective Green, g (s) 37.0 37.0 37.0 37.0 55.0 55.0 55.0 55.0Actuated g/C Ratio 0.37 0.37 0.37 0.37 0.55 0.55 0.55 0.55Clearance Time (s) 4.0 4.0 4.0 4.0 4.0 4.0 4.0 4.0Vehicle Extension (s) 3.0 3.0 3.0 3.0 3.0 3.0 3.0 3.0Lane Grp Cap (vph) 169 1145 258 1175 201 1837 403 1742v/s Ratio Prot 0.10 0.19 0.15 0.28v/s Ratio Perm c0.44 0.05 c0.63 0.19v/c Ratio 1.18 0.26 0.15 0.51 1.14 0.27 0.34 0.51Uniform Delay, d1 31.5 22.0 21.0 24.5 22.5 11.9 12.5 14.1Progression Factor 1.00 1.00 1.00 1.00 1.00 1.00 1.00 1.00Incremental Delay, d2 127.2 0.1 0.3 0.4 106.0 0.4 2.3 1.1Delay (s) 158.7 22.1 21.3 24.8 128.5 12.2 14.8 15.2Level of Service F C C C F B B BApproach Delay (s) 64.3 24.6 49.0 15.1Approach LOS E C D B
Intersection SummaryHCM 2000 Control Delay 34.9 HCM 2000 Level of Service CHCM 2000 Volume to Capacity ratio 1.15Actuated Cycle Length (s) 100.0 Sum of lost time (s) 8.0Intersection Capacity Utilization 84.4% ICU Level of Service EAnalysis Period (min) 15c Critical Lane Group
Agenda item No. 3

HCM Signalized Intersection Capacity Analysis 2040 Conditions50: Pepper Ave & Foothill Blvd AM Peak Hour
Rialto Impact Fee Study Synchro 9 Report
Movement EBL EBT EBR WBL WBT WBR NBL NBT NBR SBL SBT SBRLane ConfigurationsTraffic Volume (vph) 132 635 249 197 740 170 152 463 113 103 631 194Future Volume (vph) 132 635 249 197 740 170 152 463 113 103 631 194Ideal Flow (vphpl) 1700 1800 1800 1700 1800 1800 1700 1800 1800 1700 1800 1800Total Lost time (s) 4.0 4.0 4.0 4.0 4.0 4.0 4.0 4.0 4.0Lane Util. Factor 1.00 0.95 1.00 1.00 0.95 1.00 0.95 1.00 0.95Frt 1.00 1.00 0.85 1.00 0.97 1.00 0.97 1.00 0.96Flt Protected 0.95 1.00 1.00 0.95 1.00 0.95 1.00 0.95 1.00Satd. Flow (prot) 1583 3353 1500 1583 3259 1583 3254 1583 3234Flt Permitted 0.95 1.00 1.00 0.95 1.00 0.23 1.00 0.35 1.00Satd. Flow (perm) 1583 3353 1500 1583 3259 383 3254 591 3234Peak-hour factor, PHF 0.93 0.93 0.93 0.93 0.93 0.93 0.93 0.93 0.93 0.93 0.93 0.93Adj. Flow (vph) 142 683 268 212 796 183 163 498 122 111 678 209RTOR Reduction (vph) 0 0 130 0 20 0 0 21 0 0 29 0Lane Group Flow (vph) 142 683 138 212 959 0 163 599 0 111 858 0Turn Type Prot NA Perm Prot NA Perm NA Perm NAProtected Phases 7 4 3 8 2 6Permitted Phases 4 2 6Actuated Green, G (s) 10.0 25.0 25.0 14.0 29.0 49.0 49.0 49.0 49.0Effective Green, g (s) 10.0 25.0 25.0 14.0 29.0 49.0 49.0 49.0 49.0Actuated g/C Ratio 0.10 0.25 0.25 0.14 0.29 0.49 0.49 0.49 0.49Clearance Time (s) 4.0 4.0 4.0 4.0 4.0 4.0 4.0 4.0 4.0Vehicle Extension (s) 3.0 3.0 3.0 3.0 3.0 3.0 3.0 3.0 3.0Lane Grp Cap (vph) 158 838 375 221 945 187 1594 289 1584v/s Ratio Prot 0.09 0.20 c0.13 c0.29 0.18 0.27v/s Ratio Perm 0.09 c0.43 0.19v/c Ratio 0.90 0.82 0.37 0.96 1.01 0.87 0.38 0.38 0.54Uniform Delay, d1 44.5 35.3 31.0 42.7 35.5 22.7 15.9 16.0 17.7Progression Factor 1.00 1.00 1.00 1.00 1.00 1.00 1.00 1.00 1.00Incremental Delay, d2 42.9 6.1 0.6 48.4 33.0 39.0 0.7 3.8 1.3Delay (s) 87.4 41.5 31.6 91.2 68.5 61.7 16.6 19.9 19.0Level of Service F D C F E E B B BApproach Delay (s) 45.0 72.6 26.0 19.1Approach LOS D E C B
Intersection SummaryHCM 2000 Control Delay 43.1 HCM 2000 Level of Service DHCM 2000 Volume to Capacity ratio 0.94Actuated Cycle Length (s) 100.0 Sum of lost time (s) 12.0Intersection Capacity Utilization 83.2% ICU Level of Service EAnalysis Period (min) 15c Critical Lane Group
Agenda item No. 3
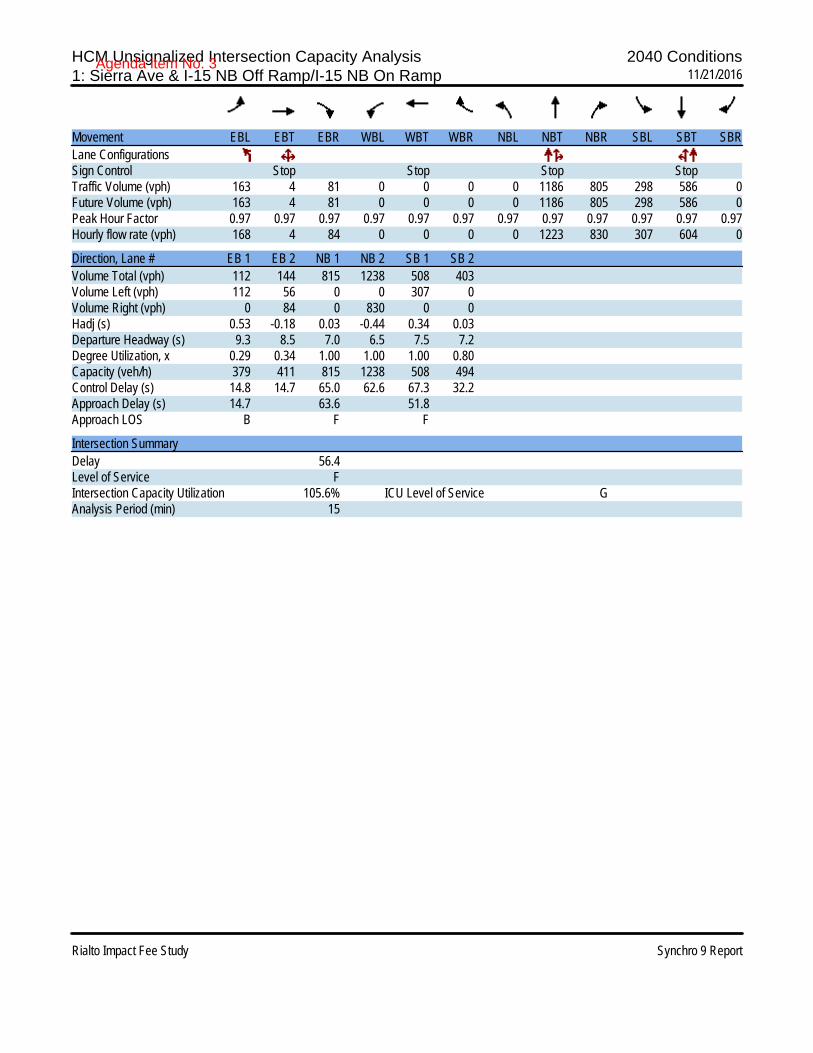
HCM Unsignalized Intersection Capacity Analysis 2040 Conditions1: Sierra Ave & I-15 NB Off Ramp/I-15 NB On Ramp 11/21/2016
Rialto Impact Fee Study Synchro 9 Report
Movement EBL EBT EBR WBL WBT WBR NBL NBT NBR SBL SBT SBRLane ConfigurationsSign Control Stop Stop Stop StopTraffic Volume (vph) 163 4 81 0 0 0 0 1186 805 298 586 0Future Volume (vph) 163 4 81 0 0 0 0 1186 805 298 586 0Peak Hour Factor 0.97 0.97 0.97 0.97 0.97 0.97 0.97 0.97 0.97 0.97 0.97 0.97Hourly flow rate (vph) 168 4 84 0 0 0 0 1223 830 307 604 0
Direction, Lane # EB 1 EB 2 NB 1 NB 2 SB 1 SB 2Volume Total (vph) 112 144 815 1238 508 403Volume Left (vph) 112 56 0 0 307 0Volume Right (vph) 0 84 0 830 0 0Hadj (s) 0.53 -0.18 0.03 -0.44 0.34 0.03Departure Headway (s) 9.3 8.5 7.0 6.5 7.5 7.2Degree Utilization, x 0.29 0.34 1.00 1.00 1.00 0.80Capacity (veh/h) 379 411 815 1238 508 494Control Delay (s) 14.8 14.7 65.0 62.6 67.3 32.2Approach Delay (s) 14.7 63.6 51.8Approach LOS B F F
Intersection SummaryDelay 56.4Level of Service FIntersection Capacity Utilization 105.6% ICU Level of Service GAnalysis Period (min) 15
Agenda item No. 3

HCM Unsignalized Intersection Capacity Analysis 2040 Conditions2: Sierra Ave & Riverside Ave 11/21/2016
Rialto Impact Fee Study Synchro 9 Report
Movement EBL EBT EBR WBL WBT WBR NBL NBT NBR SBL SBT SBRLane ConfigurationsSign Control Stop Stop Stop StopTraffic Volume (vph) 112 307 0 13 58 724 0 928 22 353 444 33Future Volume (vph) 112 307 0 13 58 724 0 928 22 353 444 33Peak Hour Factor 0.92 0.92 0.92 0.91 0.92 0.91 0.92 0.91 0.91 0.91 0.91 0.92Hourly flow rate (vph) 122 334 0 14 63 796 0 1020 24 388 488 36
Direction, Lane # EB 1 EB 2 WB 1 WB 2 NB 1 NB 2 SB 1 SB 2Volume Total (vph) 122 334 14 859 1020 24 388 524Volume Left (vph) 122 0 14 0 0 0 388 0Volume Right (vph) 0 0 0 796 0 24 0 36Hadj (s) 0.53 0.03 0.53 -0.61 0.03 -0.67 0.53 -0.01Departure Headway (s) 10.1 9.6 10.0 8.9 9.5 8.8 9.7 9.1Degree Utilization, x 0.34 0.89 0.04 1.00 1.00 0.06 1.00 1.00Capacity (veh/h) 352 364 352 859 1020 400 388 524Control Delay (s) 17.1 53.8 12.2 73.9 76.7 11.2 77.4 75.1Approach Delay (s) 44.0 73.0 75.2 76.1Approach LOS E F F F
Intersection SummaryDelay 70.5Level of Service FIntersection Capacity Utilization 148.7% ICU Level of Service HAnalysis Period (min) 15
Agenda item No. 3

HCM Signalized Intersection Capacity Analysis 2040 Conditions3: Live Oak Ave & Riverside Ave 11/21/2016
Rialto Impact Fee Study Synchro 9 Report
Movement EBT EBR WBL WBT NBL NBRLane ConfigurationsTraffic Volume (vph) 597 108 94 893 161 60Future Volume (vph) 597 108 94 893 161 60Ideal Flow (vphpl) 1800 1800 1700 1800 1700 1800Total Lost time (s) 4.0 4.0 4.0 4.0 4.0Lane Util. Factor 0.95 1.00 0.95 1.00 1.00Frt 0.98 1.00 1.00 1.00 0.85Flt Protected 1.00 0.95 1.00 0.95 1.00Satd. Flow (prot) 3276 1583 3353 1583 1500Flt Permitted 1.00 0.95 1.00 0.95 1.00Satd. Flow (perm) 3276 1583 3353 1583 1500Peak-hour factor, PHF 0.96 0.96 0.96 0.96 0.96 0.96Adj. Flow (vph) 622 112 98 930 168 62RTOR Reduction (vph) 16 0 0 0 0 52Lane Group Flow (vph) 719 0 98 930 168 11Turn Type NA Prot NA Prot PermProtected Phases 4 3 8 2Permitted Phases 2Actuated Green, G (s) 21.7 6.9 32.6 8.8 8.8Effective Green, g (s) 21.7 6.9 32.6 8.8 8.8Actuated g/C Ratio 0.44 0.14 0.66 0.18 0.18Clearance Time (s) 4.0 4.0 4.0 4.0 4.0Vehicle Extension (s) 3.0 3.0 3.0 3.0 3.0Lane Grp Cap (vph) 1439 221 2212 281 267v/s Ratio Prot c0.22 0.06 c0.28 c0.11v/s Ratio Perm 0.01v/c Ratio 0.50 0.44 0.42 0.60 0.04Uniform Delay, d1 10.0 19.5 4.0 18.7 16.8Progression Factor 1.00 1.00 1.00 1.00 1.00Incremental Delay, d2 0.3 1.4 0.1 3.4 0.1Delay (s) 10.2 20.9 4.1 22.1 16.9Level of Service B C A C BApproach Delay (s) 10.2 5.7 20.7Approach LOS B A C
Intersection SummaryHCM 2000 Control Delay 9.1 HCM 2000 Level of Service AHCM 2000 Volume to Capacity ratio 0.52Actuated Cycle Length (s) 49.4 Sum of lost time (s) 12.0Intersection Capacity Utilization 46.8% ICU Level of Service AAnalysis Period (min) 15c Critical Lane Group
Agenda item No. 3

HCM Signalized Intersection Capacity Analysis 2040 Conditions4: Alder Ave & Riverside Ave 11/21/2016
Rialto Impact Fee Study Synchro 9 Report
Movement EBT EBR WBL WBT NBL NBRLane ConfigurationsTraffic Volume (vph) 563 205 120 683 319 124Future Volume (vph) 563 205 120 683 319 124Ideal Flow (vphpl) 1800 1800 1700 1800 1600 1800Total Lost time (s) 4.0 4.0 4.0 4.0 4.0Lane Util. Factor 0.95 1.00 0.95 0.97 1.00Frt 0.96 1.00 1.00 1.00 0.85Flt Protected 1.00 0.95 1.00 0.95 1.00Satd. Flow (prot) 3040 1495 3167 2730 1417Flt Permitted 1.00 0.33 1.00 0.95 1.00Satd. Flow (perm) 3040 515 3167 2730 1417Peak-hour factor, PHF 0.98 0.98 0.98 0.98 0.98 0.98Adj. Flow (vph) 574 209 122 697 326 127RTOR Reduction (vph) 56 0 0 0 0 91Lane Group Flow (vph) 727 0 122 697 326 36Heavy Vehicles (%) 8% 8% 8% 8% 8% 8%Turn Type NA Perm NA Prot PermProtected Phases 4 8 2Permitted Phases 8 2Actuated Green, G (s) 18.4 18.4 18.4 10.4 10.4Effective Green, g (s) 18.4 18.4 18.4 10.4 10.4Actuated g/C Ratio 0.50 0.50 0.50 0.28 0.28Clearance Time (s) 4.0 4.0 4.0 4.0 4.0Vehicle Extension (s) 3.0 3.0 3.0 3.0 3.0Lane Grp Cap (vph) 1520 257 1583 771 400v/s Ratio Prot c0.24 0.22 c0.12v/s Ratio Perm 0.24 0.03v/c Ratio 0.48 0.47 0.44 0.42 0.09Uniform Delay, d1 6.0 6.0 5.9 10.8 9.7Progression Factor 1.00 1.00 1.00 1.00 1.00Incremental Delay, d2 0.2 1.4 0.2 0.4 0.1Delay (s) 6.3 7.4 6.1 11.1 9.8Level of Service A A A B AApproach Delay (s) 6.3 6.3 10.8Approach LOS A A B
Intersection SummaryHCM 2000 Control Delay 7.3 HCM 2000 Level of Service AHCM 2000 Volume to Capacity ratio 0.46Actuated Cycle Length (s) 36.8 Sum of lost time (s) 8.0Intersection Capacity Utilization 51.6% ICU Level of Service AAnalysis Period (min) 15c Critical Lane Group
Agenda item No. 3

HCM Signalized Intersection Capacity Analysis 2040 Conditions5: Alder Ave & Sierra Lakes Pkwy/Casmalia St 11/21/2016
Rialto Impact Fee Study Synchro 9 Report
Movement EBL EBT EBR WBL WBT WBR NBL NBT NBR SBL SBT SBRLane ConfigurationsTraffic Volume (vph) 15 162 137 372 150 23 71 497 299 41 385 24Future Volume (vph) 15 162 137 372 150 23 71 497 299 41 385 24Ideal Flow (vphpl) 1700 1800 1800 1700 1800 1800 1700 1800 1800 1700 1800 1800Total Lost time (s) 4.0 4.0 4.0 4.0 4.0 4.0 4.0 4.0 4.0 4.0Lane Util. Factor 1.00 1.00 1.00 1.00 1.00 1.00 0.95 1.00 0.95 1.00Frt 1.00 0.93 1.00 1.00 0.85 1.00 0.94 1.00 1.00 0.85Flt Protected 0.95 1.00 0.95 1.00 1.00 0.95 1.00 0.95 1.00 1.00Satd. Flow (prot) 1495 1552 1495 1667 1417 1495 2988 1495 3167 1417Flt Permitted 0.66 1.00 0.52 1.00 1.00 0.45 1.00 0.17 1.00 1.00Satd. Flow (perm) 1032 1552 825 1667 1417 710 2988 263 3167 1417Peak-hour factor, PHF 0.94 0.94 0.94 0.94 0.94 0.94 0.94 0.94 0.94 0.94 0.94 0.94Adj. Flow (vph) 16 172 146 396 160 24 76 529 318 44 410 26RTOR Reduction (vph) 0 33 0 0 0 11 0 88 0 0 0 17Lane Group Flow (vph) 16 285 0 396 160 13 76 759 0 44 410 9Heavy Vehicles (%) 8% 8% 8% 8% 8% 8% 8% 8% 8% 8% 8% 8%Turn Type Perm NA Perm NA Perm Perm NA Perm NA PermProtected Phases 4 8 2 6Permitted Phases 4 8 8 2 6 6Actuated Green, G (s) 44.2 44.2 44.2 44.2 44.2 26.4 26.4 26.4 26.4 26.4Effective Green, g (s) 44.2 44.2 44.2 44.2 44.2 26.4 26.4 26.4 26.4 26.4Actuated g/C Ratio 0.56 0.56 0.56 0.56 0.56 0.34 0.34 0.34 0.34 0.34Clearance Time (s) 4.0 4.0 4.0 4.0 4.0 4.0 4.0 4.0 4.0 4.0Vehicle Extension (s) 3.0 3.0 3.0 3.0 3.0 3.0 3.0 3.0 3.0 3.0Lane Grp Cap (vph) 580 872 463 937 796 238 1003 88 1063 475v/s Ratio Prot 0.18 0.10 c0.25 0.13v/s Ratio Perm 0.02 c0.48 0.01 0.11 0.17 0.01v/c Ratio 0.03 0.33 0.86 0.17 0.02 0.32 0.76 0.50 0.39 0.02Uniform Delay, d1 7.6 9.2 14.5 8.3 7.6 19.4 23.2 20.8 19.9 17.4Progression Factor 1.00 1.00 1.00 1.00 1.00 1.00 1.00 1.00 1.00 1.00Incremental Delay, d2 0.0 0.2 14.3 0.1 0.0 0.8 3.3 4.4 0.2 0.0Delay (s) 7.7 9.4 28.8 8.4 7.6 20.2 26.5 25.2 20.1 17.5Level of Service A A C A A C C C C BApproach Delay (s) 9.4 22.3 26.0 20.5Approach LOS A C C C
Intersection SummaryHCM 2000 Control Delay 21.5 HCM 2000 Level of Service CHCM 2000 Volume to Capacity ratio 0.82Actuated Cycle Length (s) 78.6 Sum of lost time (s) 8.0Intersection Capacity Utilization 82.2% ICU Level of Service EAnalysis Period (min) 15c Critical Lane Group
Agenda item No. 3

HCM Signalized Intersection Capacity Analysis 2040 Conditions6: Alder Ave & I-210 WB On/I-210 WB Off 11/21/2016
Rialto Impact Fee Study Synchro 9 Report
Movement EBL EBT EBR WBL WBT WBR NBL NBT NBR SBL SBT SBRLane ConfigurationsTraffic Volume (vph) 0 0 0 296 2 71 627 794 0 0 420 477Future Volume (vph) 0 0 0 296 2 71 627 794 0 0 420 477Ideal Flow (vphpl) 1800 1800 1800 1700 1800 1800 1700 1800 1800 1800 1800 1800Total Lost time (s) 4.0 4.0 4.0 4.0 4.0Lane Util. Factor 1.00 1.00 1.00 0.95 0.95Frt 1.00 0.85 1.00 1.00 0.92Flt Protected 0.95 1.00 0.95 1.00 1.00Satd. Flow (prot) 1495 1423 1495 3167 2914Flt Permitted 0.95 1.00 0.95 1.00 1.00Satd. Flow (perm) 1495 1423 1495 3167 2914Peak-hour factor, PHF 0.95 0.95 0.95 0.95 0.95 0.95 0.95 0.95 0.95 0.95 0.95 0.95Adj. Flow (vph) 0 0 0 312 2 75 660 836 0 0 442 502RTOR Reduction (vph) 0 0 0 0 60 0 0 0 0 0 228 0Lane Group Flow (vph) 0 0 0 312 17 0 660 836 0 0 716 0Heavy Vehicles (%) 8% 8% 8% 8% 8% 8% 8% 8% 8% 8% 8% 8%Turn Type Perm NA Prot NA NAProtected Phases 8 5 2 6Permitted Phases 8Actuated Green, G (s) 18.0 18.0 39.0 64.0 21.0Effective Green, g (s) 18.0 18.0 39.0 64.0 21.0Actuated g/C Ratio 0.20 0.20 0.43 0.71 0.23Clearance Time (s) 4.0 4.0 4.0 4.0 4.0Vehicle Extension (s) 3.0 3.0 3.0 3.0 3.0Lane Grp Cap (vph) 299 284 647 2252 679v/s Ratio Prot 0.01 c0.44 0.26 c0.25v/s Ratio Perm c0.21v/c Ratio 1.04 0.06 1.02 0.37 1.05Uniform Delay, d1 36.0 29.1 25.5 5.1 34.5Progression Factor 1.00 1.00 1.00 1.00 1.00Incremental Delay, d2 63.8 0.1 40.5 0.1 49.6Delay (s) 99.8 29.2 66.0 5.2 84.1Level of Service F C E A FApproach Delay (s) 0.0 85.9 32.0 84.1Approach LOS A F C F
Intersection SummaryHCM 2000 Control Delay 56.8 HCM 2000 Level of Service EHCM 2000 Volume to Capacity ratio 1.03Actuated Cycle Length (s) 90.0 Sum of lost time (s) 12.0Intersection Capacity Utilization 95.6% ICU Level of Service FAnalysis Period (min) 15c Critical Lane Group
Agenda item No. 3
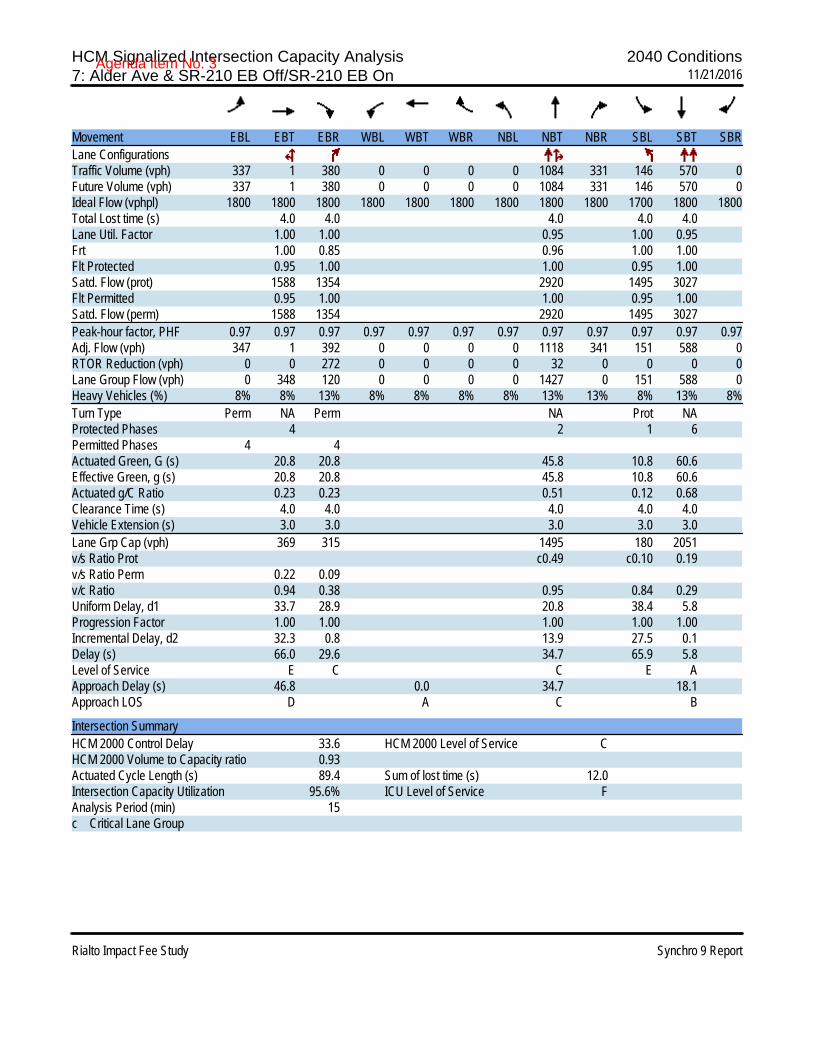
HCM Signalized Intersection Capacity Analysis 2040 Conditions7: Alder Ave & SR-210 EB Off/SR-210 EB On 11/21/2016
Rialto Impact Fee Study Synchro 9 Report
Movement EBL EBT EBR WBL WBT WBR NBL NBT NBR SBL SBT SBRLane ConfigurationsTraffic Volume (vph) 337 1 380 0 0 0 0 1084 331 146 570 0Future Volume (vph) 337 1 380 0 0 0 0 1084 331 146 570 0Ideal Flow (vphpl) 1800 1800 1800 1800 1800 1800 1800 1800 1800 1700 1800 1800Total Lost time (s) 4.0 4.0 4.0 4.0 4.0Lane Util. Factor 1.00 1.00 0.95 1.00 0.95Frt 1.00 0.85 0.96 1.00 1.00Flt Protected 0.95 1.00 1.00 0.95 1.00Satd. Flow (prot) 1588 1354 2920 1495 3027Flt Permitted 0.95 1.00 1.00 0.95 1.00Satd. Flow (perm) 1588 1354 2920 1495 3027Peak-hour factor, PHF 0.97 0.97 0.97 0.97 0.97 0.97 0.97 0.97 0.97 0.97 0.97 0.97Adj. Flow (vph) 347 1 392 0 0 0 0 1118 341 151 588 0RTOR Reduction (vph) 0 0 272 0 0 0 0 32 0 0 0 0Lane Group Flow (vph) 0 348 120 0 0 0 0 1427 0 151 588 0Heavy Vehicles (%) 8% 8% 13% 8% 8% 8% 8% 13% 13% 8% 13% 8%Turn Type Perm NA Perm NA Prot NAProtected Phases 4 2 1 6Permitted Phases 4 4Actuated Green, G (s) 20.8 20.8 45.8 10.8 60.6Effective Green, g (s) 20.8 20.8 45.8 10.8 60.6Actuated g/C Ratio 0.23 0.23 0.51 0.12 0.68Clearance Time (s) 4.0 4.0 4.0 4.0 4.0Vehicle Extension (s) 3.0 3.0 3.0 3.0 3.0Lane Grp Cap (vph) 369 315 1495 180 2051v/s Ratio Prot c0.49 c0.10 0.19v/s Ratio Perm 0.22 0.09v/c Ratio 0.94 0.38 0.95 0.84 0.29Uniform Delay, d1 33.7 28.9 20.8 38.4 5.8Progression Factor 1.00 1.00 1.00 1.00 1.00Incremental Delay, d2 32.3 0.8 13.9 27.5 0.1Delay (s) 66.0 29.6 34.7 65.9 5.8Level of Service E C C E AApproach Delay (s) 46.8 0.0 34.7 18.1Approach LOS D A C B
Intersection SummaryHCM 2000 Control Delay 33.6 HCM 2000 Level of Service CHCM 2000 Volume to Capacity ratio 0.93Actuated Cycle Length (s) 89.4 Sum of lost time (s) 12.0Intersection Capacity Utilization 95.6% ICU Level of Service FAnalysis Period (min) 15c Critical Lane Group
Agenda item No. 3
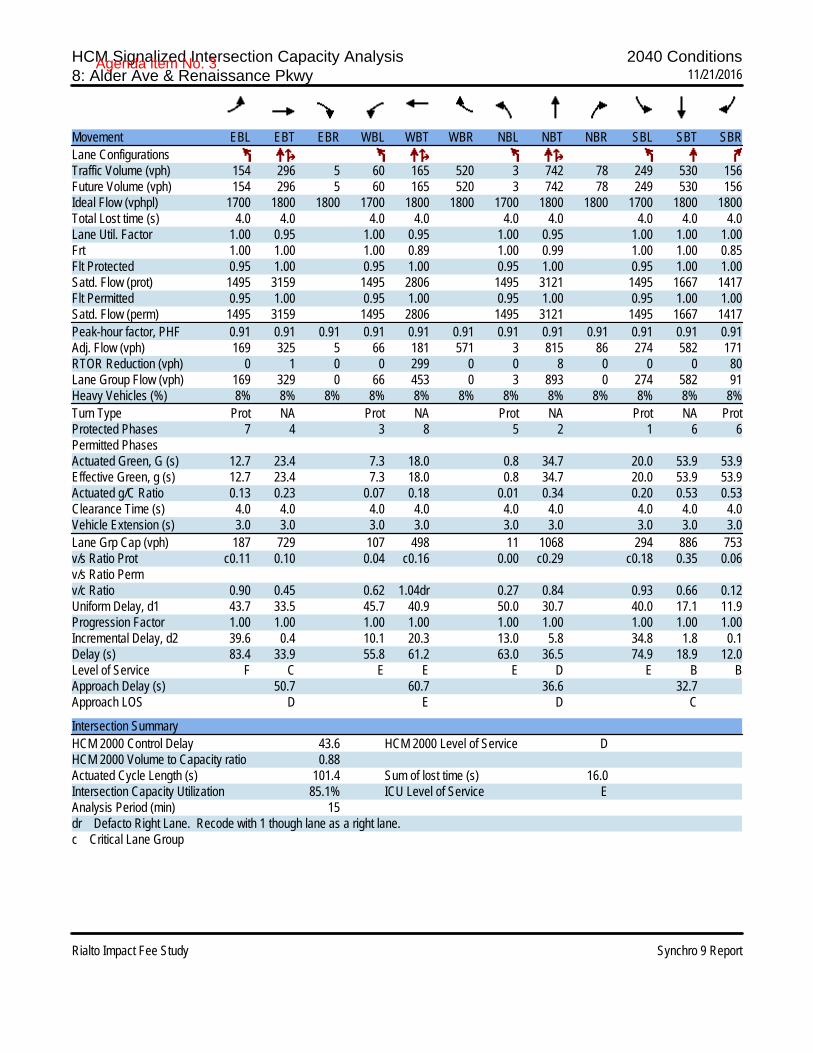
HCM Signalized Intersection Capacity Analysis 2040 Conditions8: Alder Ave & Renaissance Pkwy 11/21/2016
Rialto Impact Fee Study Synchro 9 Report
Movement EBL EBT EBR WBL WBT WBR NBL NBT NBR SBL SBT SBRLane ConfigurationsTraffic Volume (vph) 154 296 5 60 165 520 3 742 78 249 530 156Future Volume (vph) 154 296 5 60 165 520 3 742 78 249 530 156Ideal Flow (vphpl) 1700 1800 1800 1700 1800 1800 1700 1800 1800 1700 1800 1800Total Lost time (s) 4.0 4.0 4.0 4.0 4.0 4.0 4.0 4.0 4.0Lane Util. Factor 1.00 0.95 1.00 0.95 1.00 0.95 1.00 1.00 1.00Frt 1.00 1.00 1.00 0.89 1.00 0.99 1.00 1.00 0.85Flt Protected 0.95 1.00 0.95 1.00 0.95 1.00 0.95 1.00 1.00Satd. Flow (prot) 1495 3159 1495 2806 1495 3121 1495 1667 1417Flt Permitted 0.95 1.00 0.95 1.00 0.95 1.00 0.95 1.00 1.00Satd. Flow (perm) 1495 3159 1495 2806 1495 3121 1495 1667 1417Peak-hour factor, PHF 0.91 0.91 0.91 0.91 0.91 0.91 0.91 0.91 0.91 0.91 0.91 0.91Adj. Flow (vph) 169 325 5 66 181 571 3 815 86 274 582 171RTOR Reduction (vph) 0 1 0 0 299 0 0 8 0 0 0 80Lane Group Flow (vph) 169 329 0 66 453 0 3 893 0 274 582 91Heavy Vehicles (%) 8% 8% 8% 8% 8% 8% 8% 8% 8% 8% 8% 8%Turn Type Prot NA Prot NA Prot NA Prot NA ProtProtected Phases 7 4 3 8 5 2 1 6 6Permitted PhasesActuated Green, G (s) 12.7 23.4 7.3 18.0 0.8 34.7 20.0 53.9 53.9Effective Green, g (s) 12.7 23.4 7.3 18.0 0.8 34.7 20.0 53.9 53.9Actuated g/C Ratio 0.13 0.23 0.07 0.18 0.01 0.34 0.20 0.53 0.53Clearance Time (s) 4.0 4.0 4.0 4.0 4.0 4.0 4.0 4.0 4.0Vehicle Extension (s) 3.0 3.0 3.0 3.0 3.0 3.0 3.0 3.0 3.0Lane Grp Cap (vph) 187 729 107 498 11 1068 294 886 753v/s Ratio Prot c0.11 0.10 0.04 c0.16 0.00 c0.29 c0.18 0.35 0.06v/s Ratio Permv/c Ratio 0.90 0.45 0.62 1.04dr 0.27 0.84 0.93 0.66 0.12Uniform Delay, d1 43.7 33.5 45.7 40.9 50.0 30.7 40.0 17.1 11.9Progression Factor 1.00 1.00 1.00 1.00 1.00 1.00 1.00 1.00 1.00Incremental Delay, d2 39.6 0.4 10.1 20.3 13.0 5.8 34.8 1.8 0.1Delay (s) 83.4 33.9 55.8 61.2 63.0 36.5 74.9 18.9 12.0Level of Service F C E E E D E B BApproach Delay (s) 50.7 60.7 36.6 32.7Approach LOS D E D C
Intersection SummaryHCM 2000 Control Delay 43.6 HCM 2000 Level of Service DHCM 2000 Volume to Capacity ratio 0.88Actuated Cycle Length (s) 101.4 Sum of lost time (s) 16.0Intersection Capacity Utilization 85.1% ICU Level of Service EAnalysis Period (min) 15dr Defacto Right Lane. Recode with 1 though lane as a right lane.c Critical Lane Group
Agenda item No. 3
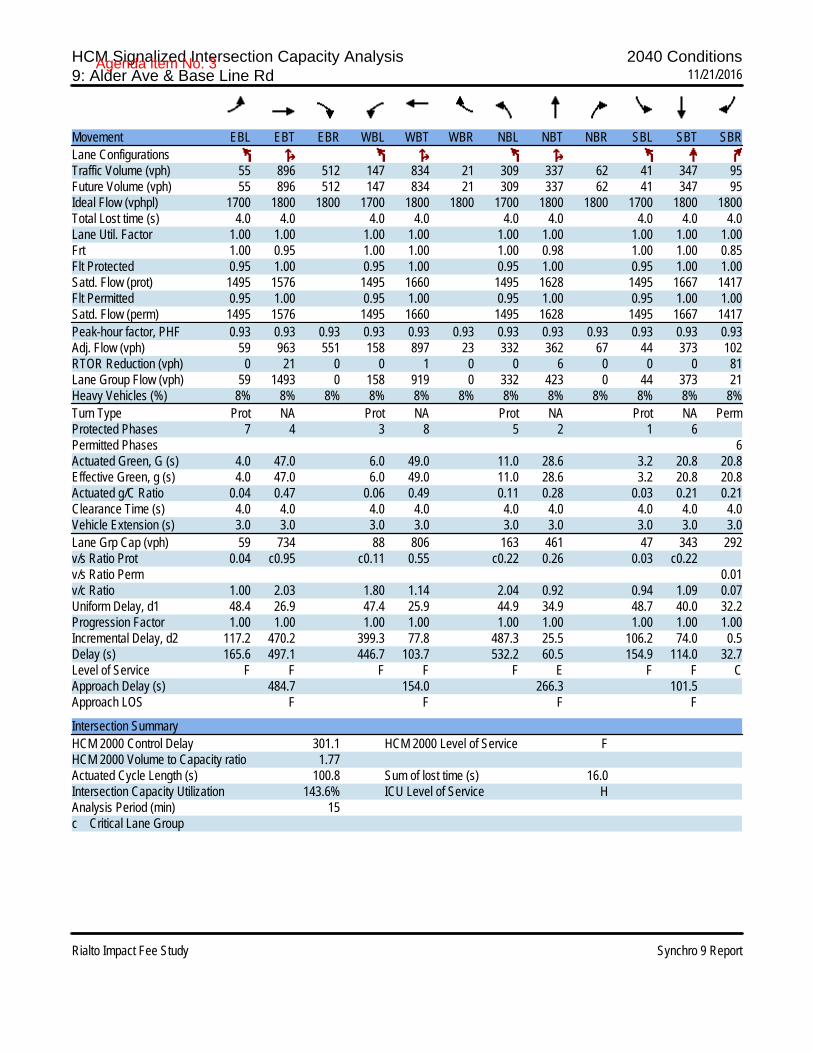
HCM Signalized Intersection Capacity Analysis 2040 Conditions9: Alder Ave & Base Line Rd 11/21/2016
Rialto Impact Fee Study Synchro 9 Report
Movement EBL EBT EBR WBL WBT WBR NBL NBT NBR SBL SBT SBRLane ConfigurationsTraffic Volume (vph) 55 896 512 147 834 21 309 337 62 41 347 95Future Volume (vph) 55 896 512 147 834 21 309 337 62 41 347 95Ideal Flow (vphpl) 1700 1800 1800 1700 1800 1800 1700 1800 1800 1700 1800 1800Total Lost time (s) 4.0 4.0 4.0 4.0 4.0 4.0 4.0 4.0 4.0Lane Util. Factor 1.00 1.00 1.00 1.00 1.00 1.00 1.00 1.00 1.00Frt 1.00 0.95 1.00 1.00 1.00 0.98 1.00 1.00 0.85Flt Protected 0.95 1.00 0.95 1.00 0.95 1.00 0.95 1.00 1.00Satd. Flow (prot) 1495 1576 1495 1660 1495 1628 1495 1667 1417Flt Permitted 0.95 1.00 0.95 1.00 0.95 1.00 0.95 1.00 1.00Satd. Flow (perm) 1495 1576 1495 1660 1495 1628 1495 1667 1417Peak-hour factor, PHF 0.93 0.93 0.93 0.93 0.93 0.93 0.93 0.93 0.93 0.93 0.93 0.93Adj. Flow (vph) 59 963 551 158 897 23 332 362 67 44 373 102RTOR Reduction (vph) 0 21 0 0 1 0 0 6 0 0 0 81Lane Group Flow (vph) 59 1493 0 158 919 0 332 423 0 44 373 21Heavy Vehicles (%) 8% 8% 8% 8% 8% 8% 8% 8% 8% 8% 8% 8%Turn Type Prot NA Prot NA Prot NA Prot NA PermProtected Phases 7 4 3 8 5 2 1 6Permitted Phases 6Actuated Green, G (s) 4.0 47.0 6.0 49.0 11.0 28.6 3.2 20.8 20.8Effective Green, g (s) 4.0 47.0 6.0 49.0 11.0 28.6 3.2 20.8 20.8Actuated g/C Ratio 0.04 0.47 0.06 0.49 0.11 0.28 0.03 0.21 0.21Clearance Time (s) 4.0 4.0 4.0 4.0 4.0 4.0 4.0 4.0 4.0Vehicle Extension (s) 3.0 3.0 3.0 3.0 3.0 3.0 3.0 3.0 3.0Lane Grp Cap (vph) 59 734 88 806 163 461 47 343 292v/s Ratio Prot 0.04 c0.95 c0.11 0.55 c0.22 0.26 0.03 c0.22v/s Ratio Perm 0.01v/c Ratio 1.00 2.03 1.80 1.14 2.04 0.92 0.94 1.09 0.07Uniform Delay, d1 48.4 26.9 47.4 25.9 44.9 34.9 48.7 40.0 32.2Progression Factor 1.00 1.00 1.00 1.00 1.00 1.00 1.00 1.00 1.00Incremental Delay, d2 117.2 470.2 399.3 77.8 487.3 25.5 106.2 74.0 0.5Delay (s) 165.6 497.1 446.7 103.7 532.2 60.5 154.9 114.0 32.7Level of Service F F F F F E F F CApproach Delay (s) 484.7 154.0 266.3 101.5Approach LOS F F F F
Intersection SummaryHCM 2000 Control Delay 301.1 HCM 2000 Level of Service FHCM 2000 Volume to Capacity ratio 1.77Actuated Cycle Length (s) 100.8 Sum of lost time (s) 16.0Intersection Capacity Utilization 143.6% ICU Level of Service HAnalysis Period (min) 15c Critical Lane Group
Agenda item No. 3

HCM Signalized Intersection Capacity Analysis 2040 Conditions10: Locust Ave & Casmalia St 11/21/2016
Rialto Impact Fee Study Synchro 9 Report
Movement EBL EBT EBR WBL WBT WBR NBL NBT NBR SBL SBT SBRLane ConfigurationsTraffic Volume (vph) 232 185 17 2 92 17 30 302 7 31 330 303Future Volume (vph) 232 185 17 2 92 17 30 302 7 31 330 303Ideal Flow (vphpl) 1700 1800 1800 1700 1800 1800 1700 1800 1800 1700 1800 1800Total Lost time (s) 4.0 4.0 4.0 4.0 4.0 4.0 4.0 4.0Lane Util. Factor 1.00 1.00 1.00 1.00 1.00 0.95 1.00 0.95Frt 1.00 0.99 1.00 0.98 1.00 1.00 1.00 0.93Flt Protected 0.95 1.00 0.95 1.00 0.95 1.00 0.95 1.00Satd. Flow (prot) 1583 1743 1583 1724 1583 3341 1583 3112Flt Permitted 0.95 1.00 0.95 1.00 0.95 1.00 0.95 1.00Satd. Flow (perm) 1583 1743 1583 1724 1583 3341 1583 3112Peak-hour factor, PHF 0.80 0.80 0.80 0.80 0.80 0.80 0.80 0.80 0.80 0.80 0.80 0.80Adj. Flow (vph) 290 231 21 2 115 21 38 378 9 39 412 379RTOR Reduction (vph) 0 3 0 0 7 0 0 1 0 0 170 0Lane Group Flow (vph) 290 249 0 3 129 0 38 386 0 39 622 0Turn Type Prot NA Prot NA Prot NA Prot NAProtected Phases 7 4 3 8 5 2 1 6Permitted PhasesActuated Green, G (s) 19.6 30.3 0.5 11.2 3.3 22.3 3.3 22.3Effective Green, g (s) 19.6 30.3 0.5 11.2 3.3 22.3 3.3 22.3Actuated g/C Ratio 0.27 0.42 0.01 0.15 0.05 0.31 0.05 0.31Clearance Time (s) 4.0 4.0 4.0 4.0 4.0 4.0 4.0 4.0Vehicle Extension (s) 3.0 3.0 3.0 3.0 3.0 3.0 3.0 3.0Lane Grp Cap (vph) 428 729 10 266 72 1029 72 958v/s Ratio Prot c0.18 0.14 0.00 c0.07 0.02 0.12 c0.02 c0.20v/s Ratio Permv/c Ratio 0.68 0.34 0.30 0.49 0.53 0.37 0.54 0.65Uniform Delay, d1 23.6 14.3 35.8 28.0 33.8 19.6 33.8 21.7Progression Factor 1.00 1.00 1.00 1.00 1.00 1.00 1.00 1.00Incremental Delay, d2 4.2 0.3 16.1 1.4 6.8 0.2 8.1 1.5Delay (s) 27.8 14.6 51.9 29.4 40.6 19.8 41.9 23.2Level of Service C B D C D B D CApproach Delay (s) 21.6 29.9 21.7 24.1Approach LOS C C C C
Intersection SummaryHCM 2000 Control Delay 23.3 HCM 2000 Level of Service CHCM 2000 Volume to Capacity ratio 0.62Actuated Cycle Length (s) 72.4 Sum of lost time (s) 16.0Intersection Capacity Utilization 54.3% ICU Level of Service AAnalysis Period (min) 15c Critical Lane Group
Agenda item No. 3
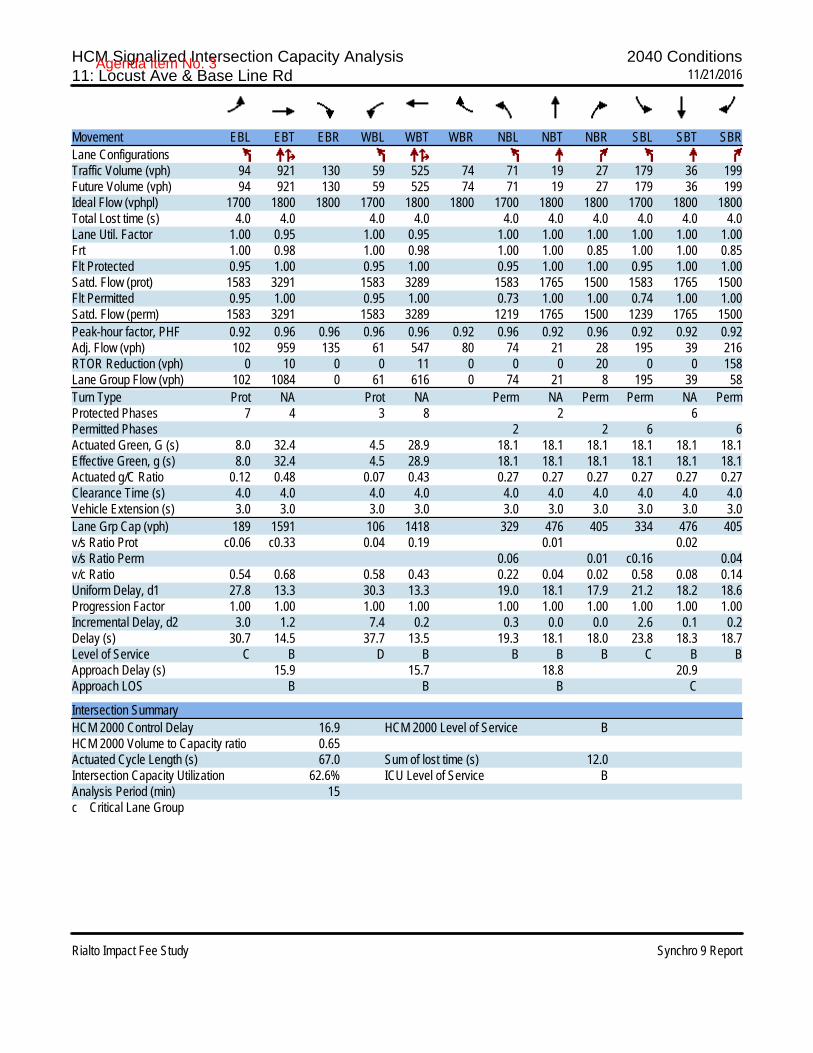
HCM Signalized Intersection Capacity Analysis 2040 Conditions11: Locust Ave & Base Line Rd 11/21/2016
Rialto Impact Fee Study Synchro 9 Report
Movement EBL EBT EBR WBL WBT WBR NBL NBT NBR SBL SBT SBRLane ConfigurationsTraffic Volume (vph) 94 921 130 59 525 74 71 19 27 179 36 199Future Volume (vph) 94 921 130 59 525 74 71 19 27 179 36 199Ideal Flow (vphpl) 1700 1800 1800 1700 1800 1800 1700 1800 1800 1700 1800 1800Total Lost time (s) 4.0 4.0 4.0 4.0 4.0 4.0 4.0 4.0 4.0 4.0Lane Util. Factor 1.00 0.95 1.00 0.95 1.00 1.00 1.00 1.00 1.00 1.00Frt 1.00 0.98 1.00 0.98 1.00 1.00 0.85 1.00 1.00 0.85Flt Protected 0.95 1.00 0.95 1.00 0.95 1.00 1.00 0.95 1.00 1.00Satd. Flow (prot) 1583 3291 1583 3289 1583 1765 1500 1583 1765 1500Flt Permitted 0.95 1.00 0.95 1.00 0.73 1.00 1.00 0.74 1.00 1.00Satd. Flow (perm) 1583 3291 1583 3289 1219 1765 1500 1239 1765 1500Peak-hour factor, PHF 0.92 0.96 0.96 0.96 0.96 0.92 0.96 0.92 0.96 0.92 0.92 0.92Adj. Flow (vph) 102 959 135 61 547 80 74 21 28 195 39 216RTOR Reduction (vph) 0 10 0 0 11 0 0 0 20 0 0 158Lane Group Flow (vph) 102 1084 0 61 616 0 74 21 8 195 39 58Turn Type Prot NA Prot NA Perm NA Perm Perm NA PermProtected Phases 7 4 3 8 2 6Permitted Phases 2 2 6 6Actuated Green, G (s) 8.0 32.4 4.5 28.9 18.1 18.1 18.1 18.1 18.1 18.1Effective Green, g (s) 8.0 32.4 4.5 28.9 18.1 18.1 18.1 18.1 18.1 18.1Actuated g/C Ratio 0.12 0.48 0.07 0.43 0.27 0.27 0.27 0.27 0.27 0.27Clearance Time (s) 4.0 4.0 4.0 4.0 4.0 4.0 4.0 4.0 4.0 4.0Vehicle Extension (s) 3.0 3.0 3.0 3.0 3.0 3.0 3.0 3.0 3.0 3.0Lane Grp Cap (vph) 189 1591 106 1418 329 476 405 334 476 405v/s Ratio Prot c0.06 c0.33 0.04 0.19 0.01 0.02v/s Ratio Perm 0.06 0.01 c0.16 0.04v/c Ratio 0.54 0.68 0.58 0.43 0.22 0.04 0.02 0.58 0.08 0.14Uniform Delay, d1 27.8 13.3 30.3 13.3 19.0 18.1 17.9 21.2 18.2 18.6Progression Factor 1.00 1.00 1.00 1.00 1.00 1.00 1.00 1.00 1.00 1.00Incremental Delay, d2 3.0 1.2 7.4 0.2 0.3 0.0 0.0 2.6 0.1 0.2Delay (s) 30.7 14.5 37.7 13.5 19.3 18.1 18.0 23.8 18.3 18.7Level of Service C B D B B B B C B BApproach Delay (s) 15.9 15.7 18.8 20.9Approach LOS B B B C
Intersection SummaryHCM 2000 Control Delay 16.9 HCM 2000 Level of Service BHCM 2000 Volume to Capacity ratio 0.65Actuated Cycle Length (s) 67.0 Sum of lost time (s) 12.0Intersection Capacity Utilization 62.6% ICU Level of Service BAnalysis Period (min) 15c Critical Lane Group
Agenda item No. 3

HCM Signalized Intersection Capacity Analysis 2040 Conditions12: Ayala Dr & Riverside Ave 11/21/2016
Rialto Impact Fee Study Synchro 9 Report
Movement EBT EBR WBL WBT NBL NBRLane ConfigurationsTraffic Volume (vph) 666 104 208 484 92 212Future Volume (vph) 666 104 208 484 92 212Ideal Flow (vphpl) 1800 1800 1700 1800 1700 1800Total Lost time (s) 4.0 4.0 4.0 4.0 4.0Lane Util. Factor 0.95 1.00 0.95 1.00 0.88Frt 0.98 1.00 1.00 1.00 0.85Flt Protected 1.00 0.95 1.00 0.95 1.00Satd. Flow (prot) 3103 1495 3167 1495 2493Flt Permitted 1.00 0.95 1.00 0.95 1.00Satd. Flow (perm) 3103 1495 3167 1495 2493Peak-hour factor, PHF 0.92 0.92 0.92 0.92 0.92 0.92Adj. Flow (vph) 724 113 226 526 100 230RTOR Reduction (vph) 13 0 0 0 0 192Lane Group Flow (vph) 824 0 226 526 100 38Heavy Vehicles (%) 8% 8% 8% 8% 8% 8%Turn Type NA Prot NA Prot PermProtected Phases 4 3 8 2Permitted Phases 2Actuated Green, G (s) 24.0 15.5 43.5 10.2 10.2Effective Green, g (s) 24.0 15.5 43.5 10.2 10.2Actuated g/C Ratio 0.39 0.25 0.71 0.17 0.17Clearance Time (s) 4.0 4.0 4.0 4.0 4.0Vehicle Extension (s) 3.0 3.0 3.0 3.0 3.0Lane Grp Cap (vph) 1207 375 2232 247 412v/s Ratio Prot c0.27 c0.15 0.17 c0.07v/s Ratio Perm 0.02v/c Ratio 0.68 0.60 0.24 0.40 0.09Uniform Delay, d1 15.7 20.4 3.2 23.0 21.8Progression Factor 1.00 1.00 1.00 1.00 1.00Incremental Delay, d2 1.6 2.7 0.1 1.1 0.1Delay (s) 17.3 23.1 3.3 24.1 21.9Level of Service B C A C CApproach Delay (s) 17.3 9.2 22.6Approach LOS B A C
Intersection SummaryHCM 2000 Control Delay 15.0 HCM 2000 Level of Service BHCM 2000 Volume to Capacity ratio 0.60Actuated Cycle Length (s) 61.7 Sum of lost time (s) 12.0Intersection Capacity Utilization 51.5% ICU Level of Service AAnalysis Period (min) 15c Critical Lane Group
Agenda item No. 3

HCM Signalized Intersection Capacity Analysis 2040 Conditions13: Ayala Dr & Casmalia St 11/21/2016
Rialto Impact Fee Study Synchro 9 Report
Movement EBL EBT EBR WBL WBT WBR NBL NBT NBR SBL SBT SBRLane ConfigurationsTraffic Volume (vph) 59 115 151 107 47 18 136 649 123 3 563 21Future Volume (vph) 59 115 151 107 47 18 136 649 123 3 563 21Ideal Flow (vphpl) 1700 1800 1800 1700 1800 1800 1700 1800 1800 1700 1800 1800Total Lost time (s) 4.0 4.0 4.0 4.0 4.0 4.0 4.0 4.0 4.0 4.0Lane Util. Factor 1.00 1.00 1.00 1.00 1.00 1.00 1.00 0.95 1.00 0.95Frt 1.00 1.00 0.85 1.00 1.00 0.85 1.00 0.98 1.00 0.99Flt Protected 0.95 1.00 1.00 0.95 1.00 1.00 0.95 1.00 0.95 1.00Satd. Flow (prot) 1495 1667 1417 1495 1667 1417 1495 3091 1495 3149Flt Permitted 0.72 1.00 1.00 0.67 1.00 1.00 0.39 1.00 0.29 1.00Satd. Flow (perm) 1137 1667 1417 1061 1667 1417 616 3091 455 3149Peak-hour factor, PHF 0.89 0.89 0.89 0.89 0.89 0.89 0.89 0.89 0.89 0.89 0.89 0.89Adj. Flow (vph) 66 129 170 120 53 20 153 729 138 3 633 24RTOR Reduction (vph) 0 0 123 0 0 15 0 20 0 0 3 0Lane Group Flow (vph) 66 129 47 120 53 5 153 847 0 3 654 0Heavy Vehicles (%) 8% 8% 8% 8% 8% 8% 8% 8% 8% 8% 8% 8%Turn Type Perm NA Perm Perm NA Perm Perm NA Perm NAProtected Phases 4 8 2 6Permitted Phases 4 4 8 8 2 6Actuated Green, G (s) 11.3 11.3 11.3 11.3 11.3 11.3 22.0 22.0 22.0 22.0Effective Green, g (s) 11.3 11.3 11.3 11.3 11.3 11.3 22.0 22.0 22.0 22.0Actuated g/C Ratio 0.27 0.27 0.27 0.27 0.27 0.27 0.53 0.53 0.53 0.53Clearance Time (s) 4.0 4.0 4.0 4.0 4.0 4.0 4.0 4.0 4.0 4.0Vehicle Extension (s) 3.0 3.0 3.0 3.0 3.0 3.0 3.0 3.0 3.0 3.0Lane Grp Cap (vph) 311 456 387 290 456 387 328 1646 242 1677v/s Ratio Prot 0.08 0.03 c0.27 0.21v/s Ratio Perm 0.06 0.03 c0.11 0.00 0.25 0.01v/c Ratio 0.21 0.28 0.12 0.41 0.12 0.01 0.47 0.51 0.01 0.39Uniform Delay, d1 11.6 11.8 11.3 12.3 11.3 10.9 6.0 6.2 4.5 5.7Progression Factor 1.00 1.00 1.00 1.00 1.00 1.00 1.00 1.00 1.00 1.00Incremental Delay, d2 0.3 0.3 0.1 1.0 0.1 0.0 1.1 0.3 0.0 0.2Delay (s) 11.9 12.2 11.4 13.2 11.4 11.0 7.1 6.5 4.6 5.8Level of Service B B B B B B A A A AApproach Delay (s) 11.8 12.5 6.6 5.8Approach LOS B B A A
Intersection SummaryHCM 2000 Control Delay 7.7 HCM 2000 Level of Service AHCM 2000 Volume to Capacity ratio 0.48Actuated Cycle Length (s) 41.3 Sum of lost time (s) 8.0Intersection Capacity Utilization 49.7% ICU Level of Service AAnalysis Period (min) 15c Critical Lane Group
Agenda item No. 3

HCM Signalized Intersection Capacity Analysis 2040 Conditions14: Ayala Dr & I-210 WB Ramps 11/21/2016
Rialto Impact Fee Study Synchro 9 Report
Movement EBL EBT EBR WBL WBT WBR NBL NBT NBR SBL SBT SBRLane ConfigurationsTraffic Volume (vph) 0 0 0 351 7 250 553 647 0 0 531 290Future Volume (vph) 0 0 0 351 7 250 553 647 0 0 531 290Ideal Flow (vphpl) 1800 1800 1800 1700 1800 1800 1600 1800 1800 1800 1800 1800Total Lost time (s) 4.0 4.0 4.0 4.0 4.0 4.0Lane Util. Factor 0.95 0.91 0.95 0.97 0.95 0.95Frt 1.00 0.96 0.85 1.00 1.00 0.95Flt Protected 0.95 0.97 1.00 0.95 1.00 1.00Satd. Flow (prot) 1421 1403 1346 2730 3167 2999Flt Permitted 0.95 0.97 1.00 0.95 1.00 1.00Satd. Flow (perm) 1421 1403 1346 2730 3167 2999Peak-hour factor, PHF 0.94 0.94 0.94 0.94 0.94 0.94 0.94 0.94 0.94 0.94 0.94 0.94Adj. Flow (vph) 0 0 0 373 7 266 588 688 0 0 565 309RTOR Reduction (vph) 0 0 0 0 16 157 0 0 0 0 83 0Lane Group Flow (vph) 0 0 0 224 204 45 588 688 0 0 791 0Heavy Vehicles (%) 8% 8% 8% 8% 8% 8% 8% 8% 8% 8% 8% 8%Turn Type Perm NA Perm Prot NA NAProtected Phases 8 5 2 6Permitted Phases 8 8Actuated Green, G (s) 17.2 17.2 17.2 21.1 51.8 26.7Effective Green, g (s) 17.2 17.2 17.2 21.1 51.8 26.7Actuated g/C Ratio 0.22 0.22 0.22 0.27 0.67 0.35Clearance Time (s) 4.0 4.0 4.0 4.0 4.0 4.0Vehicle Extension (s) 3.0 3.0 3.0 3.0 3.0 3.0Lane Grp Cap (vph) 317 313 300 748 2130 1039v/s Ratio Prot c0.22 0.22 c0.26v/s Ratio Perm c0.16 0.15 0.03v/c Ratio 0.71 0.65 0.15 0.79 0.32 0.76Uniform Delay, d1 27.6 27.2 24.0 25.9 5.3 22.3Progression Factor 1.00 1.00 1.00 1.00 1.00 1.00Incremental Delay, d2 7.0 4.8 0.2 5.5 0.1 3.3Delay (s) 34.6 32.0 24.3 31.3 5.4 25.7Level of Service C C C C A CApproach Delay (s) 0.0 30.5 17.3 25.7Approach LOS A C B C
Intersection SummaryHCM 2000 Control Delay 23.0 HCM 2000 Level of Service CHCM 2000 Volume to Capacity ratio 0.75Actuated Cycle Length (s) 77.0 Sum of lost time (s) 12.0Intersection Capacity Utilization 75.3% ICU Level of Service DAnalysis Period (min) 15c Critical Lane Group
Agenda item No. 3

HCM Signalized Intersection Capacity Analysis 2040 Conditions15: Ayala Dr & I-210 EB Ramps 11/21/2016
Rialto Impact Fee Study Synchro 9 Report
Movement EBL EBT EBR WBL WBT WBR NBL NBT NBR SBL SBT SBRLane ConfigurationsTraffic Volume (vph) 230 4 513 0 0 0 0 970 657 296 586 0Future Volume (vph) 230 4 513 0 0 0 0 970 657 296 586 0Ideal Flow (vphpl) 1700 1800 1800 1800 1800 1800 1800 1800 1800 1600 1800 1800Total Lost time (s) 4.0 4.0 4.0 4.0 4.0 4.0 4.0Lane Util. Factor 0.95 0.91 0.95 0.95 1.00 0.97 0.95Frt 1.00 0.86 0.85 1.00 0.85 1.00 1.00Flt Protected 0.95 1.00 1.00 1.00 1.00 0.95 1.00Satd. Flow (prot) 1421 1306 1346 3167 1417 2730 3167Flt Permitted 0.95 1.00 1.00 1.00 1.00 0.95 1.00Satd. Flow (perm) 1421 1306 1346 3167 1417 2730 3167Peak-hour factor, PHF 0.94 0.94 0.94 0.94 0.94 0.94 0.94 0.94 0.94 0.94 0.94 0.94Adj. Flow (vph) 245 4 546 0 0 0 0 1032 699 315 623 0RTOR Reduction (vph) 0 203 221 0 0 0 0 0 362 0 0 0Lane Group Flow (vph) 220 88 63 0 0 0 0 1032 337 315 623 0Heavy Vehicles (%) 8% 8% 8% 8% 8% 8% 8% 8% 8% 8% 8% 8%Turn Type Perm NA Perm NA Perm Prot NAProtected Phases 4 2 1 6Permitted Phases 4 4 2Actuated Green, G (s) 18.0 18.0 18.0 37.2 37.2 13.4 54.6Effective Green, g (s) 18.0 18.0 18.0 37.2 37.2 13.4 54.6Actuated g/C Ratio 0.22 0.22 0.22 0.46 0.46 0.17 0.68Clearance Time (s) 4.0 4.0 4.0 4.0 4.0 4.0 4.0Vehicle Extension (s) 3.0 3.0 3.0 3.0 3.0 3.0 3.0Lane Grp Cap (vph) 317 291 300 1461 654 453 2145v/s Ratio Prot c0.33 c0.12 0.20v/s Ratio Perm c0.15 0.07 0.05 0.24v/c Ratio 0.69 0.30 0.21 0.71 0.52 0.70 0.29Uniform Delay, d1 28.8 26.1 25.5 17.3 15.3 31.7 5.2Progression Factor 1.00 1.00 1.00 1.00 1.00 1.00 1.00Incremental Delay, d2 6.4 0.6 0.4 1.6 0.7 4.6 0.1Delay (s) 35.2 26.6 25.9 18.9 16.0 36.3 5.3Level of Service D C C B B D AApproach Delay (s) 28.7 0.0 17.7 15.7Approach LOS C A B B
Intersection SummaryHCM 2000 Control Delay 19.7 HCM 2000 Level of Service BHCM 2000 Volume to Capacity ratio 0.70Actuated Cycle Length (s) 80.6 Sum of lost time (s) 12.0Intersection Capacity Utilization 75.3% ICU Level of Service DAnalysis Period (min) 15c Critical Lane Group
Agenda item No. 3

HCM Signalized Intersection Capacity Analysis 2040 Conditions16: Ayala Dr & Renaissance Pkwy/Easton St 11/21/2016
Rialto Impact Fee Study Synchro 9 Report
Movement EBL EBT EBR WBL WBT WBR NBL NBT NBR SBL SBT SBRLane ConfigurationsTraffic Volume (vph) 370 142 213 3 64 207 120 1051 7 338 678 33Future Volume (vph) 370 142 213 3 64 207 120 1051 7 338 678 33Ideal Flow (vphpl) 1700 1800 1800 1700 1800 1800 1700 1800 1800 1700 1800 1800Total Lost time (s) 4.0 4.0 4.0 4.0 4.0 4.0 4.0 4.0 4.0 4.0Lane Util. Factor 1.00 0.95 1.00 0.95 1.00 0.95 1.00 1.00 0.95 1.00Frt 1.00 0.91 1.00 0.89 1.00 1.00 0.85 1.00 1.00 0.85Flt Protected 0.95 1.00 0.95 1.00 0.95 1.00 1.00 0.95 1.00 1.00Satd. Flow (prot) 1495 2881 1495 2803 1495 3167 1417 1495 3167 1417Flt Permitted 0.95 1.00 0.95 1.00 0.95 1.00 1.00 0.95 1.00 1.00Satd. Flow (perm) 1495 2881 1495 2803 1495 3167 1417 1495 3167 1417Peak-hour factor, PHF 0.95 0.95 0.95 0.95 0.95 0.95 0.95 0.95 0.95 0.95 0.95 0.95Adj. Flow (vph) 389 149 224 3 67 218 126 1106 7 356 714 35RTOR Reduction (vph) 0 152 0 0 192 0 0 0 5 0 0 21Lane Group Flow (vph) 389 221 0 3 93 0 126 1106 2 356 714 14Heavy Vehicles (%) 8% 8% 8% 8% 8% 8% 8% 8% 8% 8% 8% 8%Turn Type Prot NA Prot NA Prot NA Perm Prot NA PermProtected Phases 7 4 3 8 5 2 1 6Permitted Phases 2 6Actuated Green, G (s) 20.0 30.7 0.8 11.5 11.1 30.0 30.0 18.0 36.9 36.9Effective Green, g (s) 20.0 30.7 0.8 11.5 11.1 30.0 30.0 18.0 36.9 36.9Actuated g/C Ratio 0.21 0.32 0.01 0.12 0.12 0.31 0.31 0.19 0.39 0.39Clearance Time (s) 4.0 4.0 4.0 4.0 4.0 4.0 4.0 4.0 4.0 4.0Vehicle Extension (s) 3.0 3.0 3.0 3.0 3.0 3.0 3.0 3.0 3.0 3.0Lane Grp Cap (vph) 313 926 12 337 173 994 445 281 1223 547v/s Ratio Prot c0.26 c0.08 0.00 0.03 0.08 c0.35 c0.24 0.23v/s Ratio Perm 0.00 0.01v/c Ratio 1.24 0.24 0.25 0.28 0.73 1.11 0.00 1.27 0.58 0.02Uniform Delay, d1 37.8 23.8 47.1 38.2 40.7 32.8 22.5 38.8 23.2 18.2Progression Factor 1.00 1.00 1.00 1.00 1.00 1.00 1.00 1.00 1.00 1.00Incremental Delay, d2 133.4 0.1 10.7 0.4 14.2 64.7 0.0 145.2 0.7 0.0Delay (s) 171.1 23.9 57.7 38.7 54.9 97.5 22.5 184.0 23.9 18.2Level of Service F C E D D F C F C BApproach Delay (s) 99.1 38.9 92.7 75.3Approach LOS F D F E
Intersection SummaryHCM 2000 Control Delay 83.9 HCM 2000 Level of Service FHCM 2000 Volume to Capacity ratio 1.06Actuated Cycle Length (s) 95.5 Sum of lost time (s) 16.0Intersection Capacity Utilization 96.8% ICU Level of Service FAnalysis Period (min) 15c Critical Lane Group
Agenda item No. 3
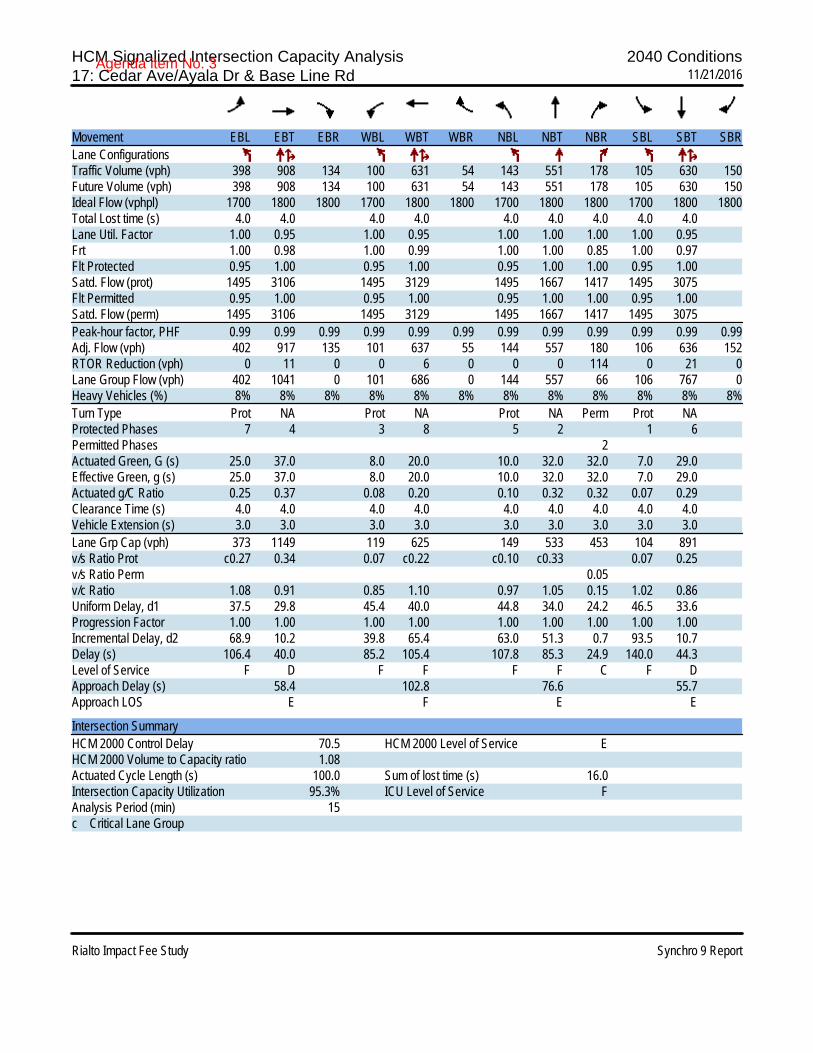
HCM Signalized Intersection Capacity Analysis 2040 Conditions17: Cedar Ave/Ayala Dr & Base Line Rd 11/21/2016
Rialto Impact Fee Study Synchro 9 Report
Movement EBL EBT EBR WBL WBT WBR NBL NBT NBR SBL SBT SBRLane ConfigurationsTraffic Volume (vph) 398 908 134 100 631 54 143 551 178 105 630 150Future Volume (vph) 398 908 134 100 631 54 143 551 178 105 630 150Ideal Flow (vphpl) 1700 1800 1800 1700 1800 1800 1700 1800 1800 1700 1800 1800Total Lost time (s) 4.0 4.0 4.0 4.0 4.0 4.0 4.0 4.0 4.0Lane Util. Factor 1.00 0.95 1.00 0.95 1.00 1.00 1.00 1.00 0.95Frt 1.00 0.98 1.00 0.99 1.00 1.00 0.85 1.00 0.97Flt Protected 0.95 1.00 0.95 1.00 0.95 1.00 1.00 0.95 1.00Satd. Flow (prot) 1495 3106 1495 3129 1495 1667 1417 1495 3075Flt Permitted 0.95 1.00 0.95 1.00 0.95 1.00 1.00 0.95 1.00Satd. Flow (perm) 1495 3106 1495 3129 1495 1667 1417 1495 3075Peak-hour factor, PHF 0.99 0.99 0.99 0.99 0.99 0.99 0.99 0.99 0.99 0.99 0.99 0.99Adj. Flow (vph) 402 917 135 101 637 55 144 557 180 106 636 152RTOR Reduction (vph) 0 11 0 0 6 0 0 0 114 0 21 0Lane Group Flow (vph) 402 1041 0 101 686 0 144 557 66 106 767 0Heavy Vehicles (%) 8% 8% 8% 8% 8% 8% 8% 8% 8% 8% 8% 8%Turn Type Prot NA Prot NA Prot NA Perm Prot NAProtected Phases 7 4 3 8 5 2 1 6Permitted Phases 2Actuated Green, G (s) 25.0 37.0 8.0 20.0 10.0 32.0 32.0 7.0 29.0Effective Green, g (s) 25.0 37.0 8.0 20.0 10.0 32.0 32.0 7.0 29.0Actuated g/C Ratio 0.25 0.37 0.08 0.20 0.10 0.32 0.32 0.07 0.29Clearance Time (s) 4.0 4.0 4.0 4.0 4.0 4.0 4.0 4.0 4.0Vehicle Extension (s) 3.0 3.0 3.0 3.0 3.0 3.0 3.0 3.0 3.0Lane Grp Cap (vph) 373 1149 119 625 149 533 453 104 891v/s Ratio Prot c0.27 0.34 0.07 c0.22 c0.10 c0.33 0.07 0.25v/s Ratio Perm 0.05v/c Ratio 1.08 0.91 0.85 1.10 0.97 1.05 0.15 1.02 0.86Uniform Delay, d1 37.5 29.8 45.4 40.0 44.8 34.0 24.2 46.5 33.6Progression Factor 1.00 1.00 1.00 1.00 1.00 1.00 1.00 1.00 1.00Incremental Delay, d2 68.9 10.2 39.8 65.4 63.0 51.3 0.7 93.5 10.7Delay (s) 106.4 40.0 85.2 105.4 107.8 85.3 24.9 140.0 44.3Level of Service F D F F F F C F DApproach Delay (s) 58.4 102.8 76.6 55.7Approach LOS E F E E
Intersection SummaryHCM 2000 Control Delay 70.5 HCM 2000 Level of Service EHCM 2000 Volume to Capacity ratio 1.08Actuated Cycle Length (s) 100.0 Sum of lost time (s) 16.0Intersection Capacity Utilization 95.3% ICU Level of Service FAnalysis Period (min) 15c Critical Lane Group
Agenda item No. 3
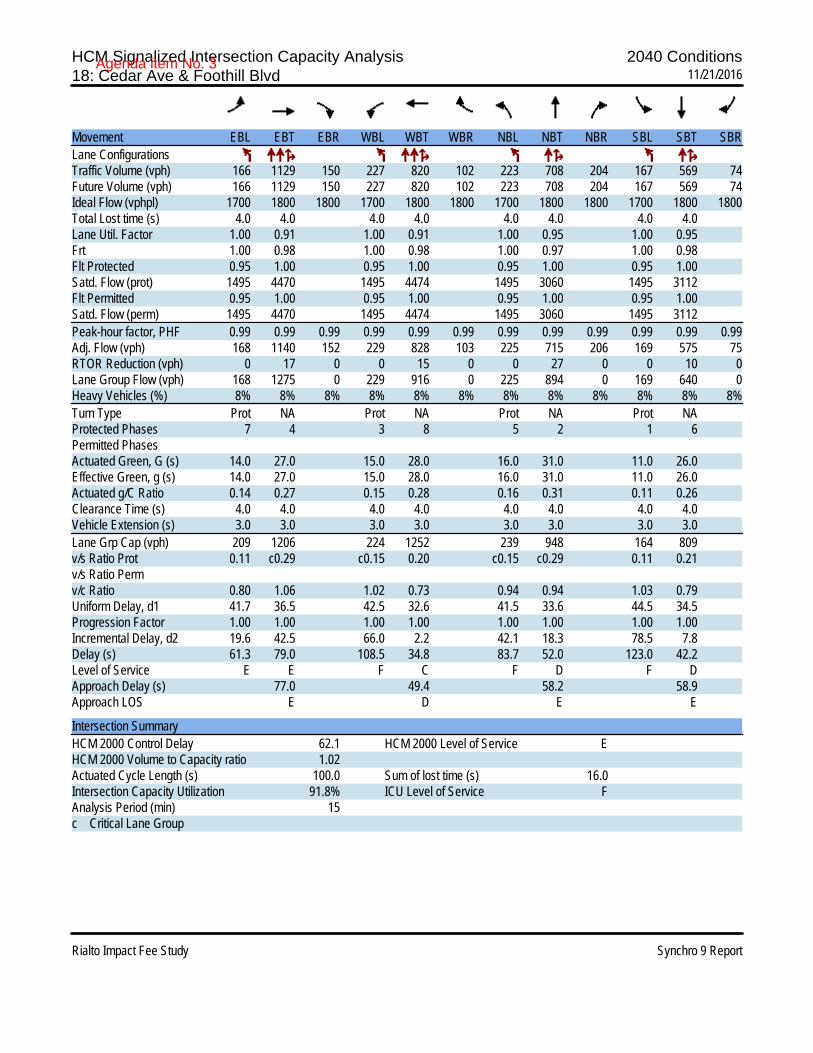
HCM Signalized Intersection Capacity Analysis 2040 Conditions18: Cedar Ave & Foothill Blvd 11/21/2016
Rialto Impact Fee Study Synchro 9 Report
Movement EBL EBT EBR WBL WBT WBR NBL NBT NBR SBL SBT SBRLane ConfigurationsTraffic Volume (vph) 166 1129 150 227 820 102 223 708 204 167 569 74Future Volume (vph) 166 1129 150 227 820 102 223 708 204 167 569 74Ideal Flow (vphpl) 1700 1800 1800 1700 1800 1800 1700 1800 1800 1700 1800 1800Total Lost time (s) 4.0 4.0 4.0 4.0 4.0 4.0 4.0 4.0Lane Util. Factor 1.00 0.91 1.00 0.91 1.00 0.95 1.00 0.95Frt 1.00 0.98 1.00 0.98 1.00 0.97 1.00 0.98Flt Protected 0.95 1.00 0.95 1.00 0.95 1.00 0.95 1.00Satd. Flow (prot) 1495 4470 1495 4474 1495 3060 1495 3112Flt Permitted 0.95 1.00 0.95 1.00 0.95 1.00 0.95 1.00Satd. Flow (perm) 1495 4470 1495 4474 1495 3060 1495 3112Peak-hour factor, PHF 0.99 0.99 0.99 0.99 0.99 0.99 0.99 0.99 0.99 0.99 0.99 0.99Adj. Flow (vph) 168 1140 152 229 828 103 225 715 206 169 575 75RTOR Reduction (vph) 0 17 0 0 15 0 0 27 0 0 10 0Lane Group Flow (vph) 168 1275 0 229 916 0 225 894 0 169 640 0Heavy Vehicles (%) 8% 8% 8% 8% 8% 8% 8% 8% 8% 8% 8% 8%Turn Type Prot NA Prot NA Prot NA Prot NAProtected Phases 7 4 3 8 5 2 1 6Permitted PhasesActuated Green, G (s) 14.0 27.0 15.0 28.0 16.0 31.0 11.0 26.0Effective Green, g (s) 14.0 27.0 15.0 28.0 16.0 31.0 11.0 26.0Actuated g/C Ratio 0.14 0.27 0.15 0.28 0.16 0.31 0.11 0.26Clearance Time (s) 4.0 4.0 4.0 4.0 4.0 4.0 4.0 4.0Vehicle Extension (s) 3.0 3.0 3.0 3.0 3.0 3.0 3.0 3.0Lane Grp Cap (vph) 209 1206 224 1252 239 948 164 809v/s Ratio Prot 0.11 c0.29 c0.15 0.20 c0.15 c0.29 0.11 0.21v/s Ratio Permv/c Ratio 0.80 1.06 1.02 0.73 0.94 0.94 1.03 0.79Uniform Delay, d1 41.7 36.5 42.5 32.6 41.5 33.6 44.5 34.5Progression Factor 1.00 1.00 1.00 1.00 1.00 1.00 1.00 1.00Incremental Delay, d2 19.6 42.5 66.0 2.2 42.1 18.3 78.5 7.8Delay (s) 61.3 79.0 108.5 34.8 83.7 52.0 123.0 42.2Level of Service E E F C F D F DApproach Delay (s) 77.0 49.4 58.2 58.9Approach LOS E D E E
Intersection SummaryHCM 2000 Control Delay 62.1 HCM 2000 Level of Service EHCM 2000 Volume to Capacity ratio 1.02Actuated Cycle Length (s) 100.0 Sum of lost time (s) 16.0Intersection Capacity Utilization 91.8% ICU Level of Service FAnalysis Period (min) 15c Critical Lane Group
Agenda item No. 3
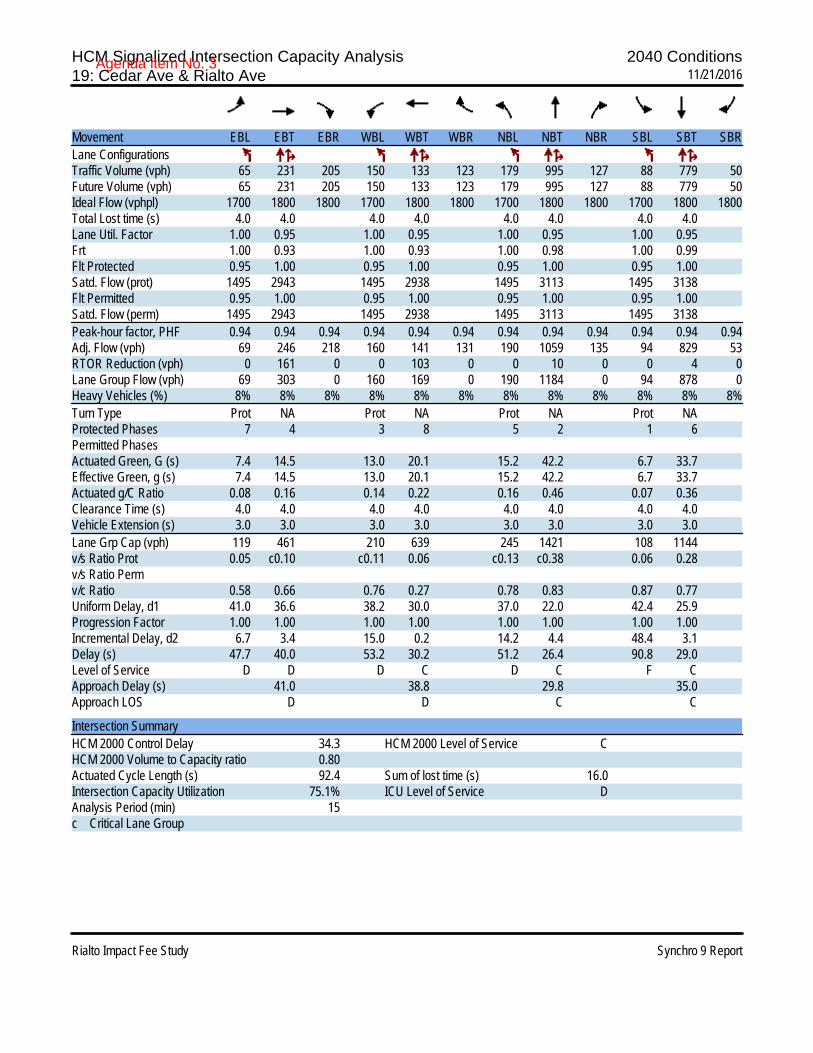
HCM Signalized Intersection Capacity Analysis 2040 Conditions19: Cedar Ave & Rialto Ave 11/21/2016
Rialto Impact Fee Study Synchro 9 Report
Movement EBL EBT EBR WBL WBT WBR NBL NBT NBR SBL SBT SBRLane ConfigurationsTraffic Volume (vph) 65 231 205 150 133 123 179 995 127 88 779 50Future Volume (vph) 65 231 205 150 133 123 179 995 127 88 779 50Ideal Flow (vphpl) 1700 1800 1800 1700 1800 1800 1700 1800 1800 1700 1800 1800Total Lost time (s) 4.0 4.0 4.0 4.0 4.0 4.0 4.0 4.0Lane Util. Factor 1.00 0.95 1.00 0.95 1.00 0.95 1.00 0.95Frt 1.00 0.93 1.00 0.93 1.00 0.98 1.00 0.99Flt Protected 0.95 1.00 0.95 1.00 0.95 1.00 0.95 1.00Satd. Flow (prot) 1495 2943 1495 2938 1495 3113 1495 3138Flt Permitted 0.95 1.00 0.95 1.00 0.95 1.00 0.95 1.00Satd. Flow (perm) 1495 2943 1495 2938 1495 3113 1495 3138Peak-hour factor, PHF 0.94 0.94 0.94 0.94 0.94 0.94 0.94 0.94 0.94 0.94 0.94 0.94Adj. Flow (vph) 69 246 218 160 141 131 190 1059 135 94 829 53RTOR Reduction (vph) 0 161 0 0 103 0 0 10 0 0 4 0Lane Group Flow (vph) 69 303 0 160 169 0 190 1184 0 94 878 0Heavy Vehicles (%) 8% 8% 8% 8% 8% 8% 8% 8% 8% 8% 8% 8%Turn Type Prot NA Prot NA Prot NA Prot NAProtected Phases 7 4 3 8 5 2 1 6Permitted PhasesActuated Green, G (s) 7.4 14.5 13.0 20.1 15.2 42.2 6.7 33.7Effective Green, g (s) 7.4 14.5 13.0 20.1 15.2 42.2 6.7 33.7Actuated g/C Ratio 0.08 0.16 0.14 0.22 0.16 0.46 0.07 0.36Clearance Time (s) 4.0 4.0 4.0 4.0 4.0 4.0 4.0 4.0Vehicle Extension (s) 3.0 3.0 3.0 3.0 3.0 3.0 3.0 3.0Lane Grp Cap (vph) 119 461 210 639 245 1421 108 1144v/s Ratio Prot 0.05 c0.10 c0.11 0.06 c0.13 c0.38 0.06 0.28v/s Ratio Permv/c Ratio 0.58 0.66 0.76 0.27 0.78 0.83 0.87 0.77Uniform Delay, d1 41.0 36.6 38.2 30.0 37.0 22.0 42.4 25.9Progression Factor 1.00 1.00 1.00 1.00 1.00 1.00 1.00 1.00Incremental Delay, d2 6.7 3.4 15.0 0.2 14.2 4.4 48.4 3.1Delay (s) 47.7 40.0 53.2 30.2 51.2 26.4 90.8 29.0Level of Service D D D C D C F CApproach Delay (s) 41.0 38.8 29.8 35.0Approach LOS D D C C
Intersection SummaryHCM 2000 Control Delay 34.3 HCM 2000 Level of Service CHCM 2000 Volume to Capacity ratio 0.80Actuated Cycle Length (s) 92.4 Sum of lost time (s) 16.0Intersection Capacity Utilization 75.1% ICU Level of Service DAnalysis Period (min) 15c Critical Lane Group
Agenda item No. 3

HCM Signalized Intersection Capacity Analysis 2040 Conditions20: Cedar Ave & Merrill Ave 11/21/2016
Rialto Impact Fee Study Synchro 9 Report
Movement EBL EBT EBR WBL WBT WBR NBL NBT NBR SBL SBT SBRLane ConfigurationsTraffic Volume (vph) 136 313 45 63 230 181 54 985 49 269 802 120Future Volume (vph) 136 313 45 63 230 181 54 985 49 269 802 120Ideal Flow (vphpl) 1700 1800 1800 1700 1800 1800 1700 1800 1800 1700 1800 1800Total Lost time (s) 4.0 4.0 4.0 4.0 4.0 4.0 4.0 4.0Lane Util. Factor 1.00 0.95 1.00 0.95 1.00 0.95 1.00 0.95Frt 1.00 0.98 1.00 0.93 1.00 0.99 1.00 0.98Flt Protected 0.95 1.00 0.95 1.00 0.95 1.00 0.95 1.00Satd. Flow (prot) 1495 3107 1495 2957 1495 3144 1495 3105Flt Permitted 0.38 1.00 0.43 1.00 0.95 1.00 0.95 1.00Satd. Flow (perm) 600 3107 683 2957 1495 3144 1495 3105Peak-hour factor, PHF 0.96 0.96 0.96 0.96 0.96 0.96 0.96 0.96 0.96 0.96 0.96 0.96Adj. Flow (vph) 142 326 47 66 240 189 56 1026 51 280 835 125RTOR Reduction (vph) 0 12 0 0 139 0 0 4 0 0 11 0Lane Group Flow (vph) 142 361 0 66 290 0 56 1073 0 280 949 0Heavy Vehicles (%) 8% 8% 8% 8% 8% 8% 8% 8% 8% 8% 8% 8%Turn Type Perm NA Perm NA Prot NA Prot NAProtected Phases 4 8 5 2 1 6Permitted Phases 4 8Actuated Green, G (s) 24.7 24.7 24.7 24.7 6.9 37.3 20.0 50.4Effective Green, g (s) 24.7 24.7 24.7 24.7 6.9 37.3 20.0 50.4Actuated g/C Ratio 0.26 0.26 0.26 0.26 0.07 0.40 0.21 0.54Clearance Time (s) 4.0 4.0 4.0 4.0 4.0 4.0 4.0 4.0Vehicle Extension (s) 3.0 3.0 3.0 3.0 3.0 3.0 3.0 3.0Lane Grp Cap (vph) 157 816 179 776 109 1247 318 1664v/s Ratio Prot 0.12 0.10 0.04 c0.34 c0.19 0.31v/s Ratio Perm c0.24 0.10v/c Ratio 0.90 0.44 0.37 0.37 0.51 0.86 0.88 0.57Uniform Delay, d1 33.5 28.9 28.3 28.3 41.9 26.0 35.8 14.6Progression Factor 1.00 1.00 1.00 1.00 1.00 1.00 1.00 1.00Incremental Delay, d2 44.7 0.4 1.3 0.3 4.0 6.3 23.5 0.5Delay (s) 78.2 29.3 29.6 28.6 46.0 32.3 59.3 15.0Level of Service E C C C D C E BApproach Delay (s) 42.8 28.8 32.9 25.0Approach LOS D C C C
Intersection SummaryHCM 2000 Control Delay 30.9 HCM 2000 Level of Service CHCM 2000 Volume to Capacity ratio 0.88Actuated Cycle Length (s) 94.0 Sum of lost time (s) 12.0Intersection Capacity Utilization 81.6% ICU Level of Service DAnalysis Period (min) 15c Critical Lane Group
Agenda item No. 3

HCM Signalized Intersection Capacity Analysis 2040 Conditions21: Cedar Ave & Randall Ave 11/21/2016
Rialto Impact Fee Study Synchro 9 Report
Movement EBL EBT EBR WBL WBT WBR NBL NBT NBR SBL SBT SBRLane ConfigurationsTraffic Volume (vph) 82 127 33 19 82 70 34 976 40 93 722 48Future Volume (vph) 82 127 33 19 82 70 34 976 40 93 722 48Ideal Flow (vphpl) 1700 1800 1800 1700 1800 1800 1700 1800 1800 1700 1800 1800Total Lost time (s) 4.0 4.0 4.0 4.0 4.0 4.0 4.0 4.0 4.0Lane Util. Factor 1.00 1.00 1.00 1.00 1.00 1.00 0.95 1.00 0.95Frt 1.00 0.97 1.00 1.00 0.85 1.00 0.99 1.00 0.99Flt Protected 0.95 1.00 0.95 1.00 1.00 0.95 1.00 0.95 1.00Satd. Flow (prot) 1495 1615 1495 1667 1417 1495 3148 1495 3137Flt Permitted 0.70 1.00 0.59 1.00 1.00 0.95 1.00 0.95 1.00Satd. Flow (perm) 1105 1615 922 1667 1417 1495 3148 1495 3137Peak-hour factor, PHF 0.97 0.97 0.97 0.97 0.97 0.97 0.97 0.97 0.97 0.97 0.97 0.97Adj. Flow (vph) 85 131 34 20 85 72 35 1006 41 96 744 49RTOR Reduction (vph) 0 10 0 0 0 58 0 3 0 0 5 0Lane Group Flow (vph) 85 155 0 20 85 14 35 1044 0 96 788 0Heavy Vehicles (%) 8% 8% 8% 8% 8% 8% 8% 8% 8% 8% 8% 8%Turn Type Perm NA Perm NA Perm Prot NA Prot NAProtected Phases 4 8 5 2 1 6Permitted Phases 4 8 8Actuated Green, G (s) 12.7 12.7 12.7 12.7 12.7 2.6 32.6 7.9 37.9Effective Green, g (s) 12.7 12.7 12.7 12.7 12.7 2.6 32.6 7.9 37.9Actuated g/C Ratio 0.19 0.19 0.19 0.19 0.19 0.04 0.50 0.12 0.58Clearance Time (s) 4.0 4.0 4.0 4.0 4.0 4.0 4.0 4.0 4.0Vehicle Extension (s) 3.0 3.0 3.0 3.0 3.0 3.0 3.0 3.0 3.0Lane Grp Cap (vph) 215 314 179 324 276 59 1574 181 1823v/s Ratio Prot c0.10 0.05 0.02 c0.33 c0.06 0.25v/s Ratio Perm 0.08 0.02 0.01v/c Ratio 0.40 0.49 0.11 0.26 0.05 0.59 0.66 0.53 0.43Uniform Delay, d1 22.9 23.4 21.6 22.3 21.3 30.8 12.2 26.9 7.6Progression Factor 1.00 1.00 1.00 1.00 1.00 1.00 1.00 1.00 1.00Incremental Delay, d2 1.2 1.2 0.3 0.4 0.1 15.0 1.1 3.0 0.2Delay (s) 24.1 24.6 21.9 22.7 21.4 45.8 13.3 29.9 7.8Level of Service C C C C C D B C AApproach Delay (s) 24.4 22.1 14.3 10.2Approach LOS C C B B
Intersection SummaryHCM 2000 Control Delay 14.4 HCM 2000 Level of Service BHCM 2000 Volume to Capacity ratio 0.60Actuated Cycle Length (s) 65.2 Sum of lost time (s) 12.0Intersection Capacity Utilization 61.4% ICU Level of Service BAnalysis Period (min) 15c Critical Lane Group
Agenda item No. 3

HCM Signalized Intersection Capacity Analysis 2040 Conditions22: Cactus Ave/Country Club Dr & Riverside Ave 11/21/2016
Rialto Impact Fee Study Synchro 9 Report
Movement EBL EBT EBR WBL WBT WBR NBL NBT NBR SBL SBT SBRLane ConfigurationsTraffic Volume (vph) 24 849 103 82 570 34 82 36 62 43 41 30Future Volume (vph) 24 849 103 82 570 34 82 36 62 43 41 30Ideal Flow (vphpl) 1700 1800 1800 1700 1800 1800 1700 1800 1800 1800 1800 1800Total Lost time (s) 4.0 4.0 4.0 4.0 4.0 4.0 4.0Lane Util. Factor 1.00 0.95 1.00 0.95 1.00 1.00 0.95Frt 1.00 0.98 1.00 0.99 1.00 0.91 0.96Flt Protected 0.95 1.00 0.95 1.00 0.95 1.00 0.98Satd. Flow (prot) 1583 3299 1583 3325 1583 1598 3162Flt Permitted 0.95 1.00 0.95 1.00 0.68 1.00 0.82Satd. Flow (perm) 1583 3299 1583 3325 1128 1598 2641Peak-hour factor, PHF 0.96 0.96 0.96 0.96 0.96 0.96 0.96 0.96 0.96 0.96 0.96 0.96Adj. Flow (vph) 25 884 107 85 594 35 85 38 65 45 43 31RTOR Reduction (vph) 0 9 0 0 4 0 0 56 0 0 27 0Lane Group Flow (vph) 25 982 0 85 625 0 85 47 0 0 92 0Turn Type Prot NA Prot NA Perm NA Perm NAProtected Phases 7 4 3 8 2 6Permitted Phases 2 6Actuated Green, G (s) 2.2 29.6 6.8 34.2 8.0 8.0 8.0Effective Green, g (s) 2.2 29.6 6.8 34.2 8.0 8.0 8.0Actuated g/C Ratio 0.04 0.52 0.12 0.61 0.14 0.14 0.14Clearance Time (s) 4.0 4.0 4.0 4.0 4.0 4.0 4.0Vehicle Extension (s) 3.0 3.0 3.0 3.0 3.0 3.0 3.0Lane Grp Cap (vph) 61 1731 190 2016 160 226 374v/s Ratio Prot 0.02 c0.30 c0.05 0.19 0.03v/s Ratio Perm c0.08 0.03v/c Ratio 0.41 0.57 0.45 0.31 0.53 0.21 0.25Uniform Delay, d1 26.5 9.1 23.1 5.4 22.5 21.4 21.5Progression Factor 1.00 1.00 1.00 1.00 1.00 1.00 1.00Incremental Delay, d2 4.4 0.4 1.7 0.1 3.4 0.5 0.3Delay (s) 30.9 9.5 24.7 5.5 25.8 21.9 21.9Level of Service C A C A C C CApproach Delay (s) 10.0 7.8 23.7 21.9Approach LOS B A C C
Intersection SummaryHCM 2000 Control Delay 11.2 HCM 2000 Level of Service BHCM 2000 Volume to Capacity ratio 0.54Actuated Cycle Length (s) 56.4 Sum of lost time (s) 12.0Intersection Capacity Utilization 55.1% ICU Level of Service BAnalysis Period (min) 15c Critical Lane Group
Agenda item No. 3
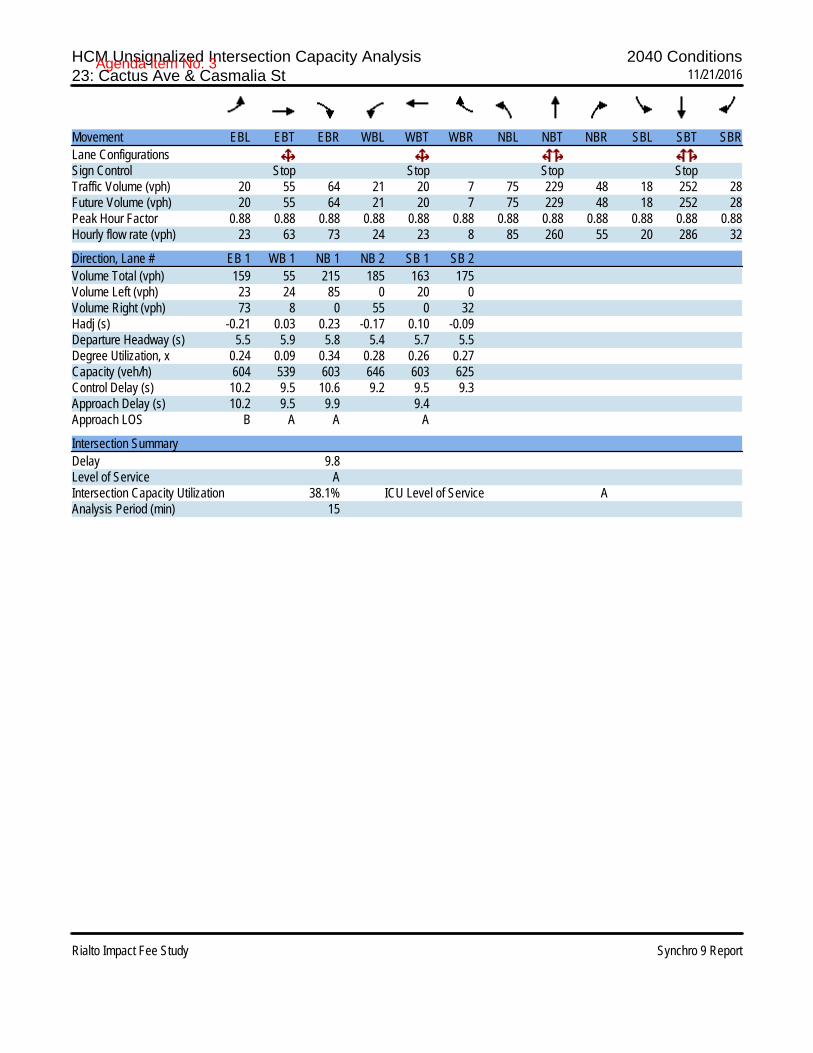
HCM Unsignalized Intersection Capacity Analysis 2040 Conditions23: Cactus Ave & Casmalia St 11/21/2016
Rialto Impact Fee Study Synchro 9 Report
Movement EBL EBT EBR WBL WBT WBR NBL NBT NBR SBL SBT SBRLane ConfigurationsSign Control Stop Stop Stop StopTraffic Volume (vph) 20 55 64 21 20 7 75 229 48 18 252 28Future Volume (vph) 20 55 64 21 20 7 75 229 48 18 252 28Peak Hour Factor 0.88 0.88 0.88 0.88 0.88 0.88 0.88 0.88 0.88 0.88 0.88 0.88Hourly flow rate (vph) 23 63 73 24 23 8 85 260 55 20 286 32
Direction, Lane # EB 1 WB 1 NB 1 NB 2 SB 1 SB 2Volume Total (vph) 159 55 215 185 163 175Volume Left (vph) 23 24 85 0 20 0Volume Right (vph) 73 8 0 55 0 32Hadj (s) -0.21 0.03 0.23 -0.17 0.10 -0.09Departure Headway (s) 5.5 5.9 5.8 5.4 5.7 5.5Degree Utilization, x 0.24 0.09 0.34 0.28 0.26 0.27Capacity (veh/h) 604 539 603 646 603 625Control Delay (s) 10.2 9.5 10.6 9.2 9.5 9.3Approach Delay (s) 10.2 9.5 9.9 9.4Approach LOS B A A A
Intersection SummaryDelay 9.8Level of Service AIntersection Capacity Utilization 38.1% ICU Level of Service AAnalysis Period (min) 15
Agenda item No. 3

HCM Unsignalized Intersection Capacity Analysis 2040 Conditions24: Cactus Ave & Easton St 11/21/2016
Rialto Impact Fee Study Synchro 9 Report
Movement EBL EBT EBR WBL WBT WBR NBL NBT NBR SBL SBT SBRLane ConfigurationsSign Control Stop Stop Stop StopTraffic Volume (vph) 29 187 168 30 72 51 112 276 31 71 238 29Future Volume (vph) 29 187 168 30 72 51 112 276 31 71 238 29Peak Hour Factor 0.94 0.94 0.94 0.94 0.94 0.94 0.94 0.94 0.94 0.94 0.94 0.94Hourly flow rate (vph) 31 199 179 32 77 54 119 294 33 76 253 31
Direction, Lane # EB 1 WB 1 NB 1 NB 2 SB 1 SB 2Volume Total (vph) 409 163 266 180 203 158Volume Left (vph) 31 32 119 0 76 0Volume Right (vph) 179 54 0 33 0 31Hadj (s) -0.21 -0.13 0.26 -0.09 0.22 -0.10Departure Headway (s) 6.4 7.2 7.5 7.2 7.7 7.3Degree Utilization, x 0.73 0.33 0.56 0.36 0.43 0.32Capacity (veh/h) 531 433 451 476 441 459Control Delay (s) 24.9 13.7 18.4 13.0 15.2 12.6Approach Delay (s) 24.9 13.7 16.2 14.0Approach LOS C B C B
Intersection SummaryDelay 17.9Level of Service CIntersection Capacity Utilization 58.0% ICU Level of Service BAnalysis Period (min) 15
Agenda item No. 3

HCM Signalized Intersection Capacity Analysis 2040 Conditions25: Cactus Ave & Base Line Rd 11/21/2016
Rialto Impact Fee Study Synchro 9 Report
Movement EBL EBT EBR WBL WBT WBR NBL NBT NBR SBL SBT SBRLane ConfigurationsTraffic Volume (vph) 74 801 331 230 527 45 220 374 265 74 396 70Future Volume (vph) 74 801 331 230 527 45 220 374 265 74 396 70Ideal Flow (vphpl) 1700 1800 1800 1700 1800 1800 1700 1800 1800 1700 1800 1800Total Lost time (s) 4.0 4.0 4.0 4.0 4.0 4.0 4.0 4.0Lane Util. Factor 1.00 0.95 1.00 0.95 1.00 0.95 1.00 0.95Frt 1.00 0.96 1.00 0.99 1.00 0.94 1.00 0.98Flt Protected 0.95 1.00 0.95 1.00 0.95 1.00 0.95 1.00Satd. Flow (prot) 1583 3206 1583 3314 1583 3144 1583 3278Flt Permitted 0.95 1.00 0.95 1.00 0.95 1.00 0.95 1.00Satd. Flow (perm) 1583 3206 1583 3314 1583 3144 1583 3278Peak-hour factor, PHF 0.93 0.93 0.93 0.93 0.93 0.93 0.93 0.93 0.93 0.93 0.93 0.93Adj. Flow (vph) 80 861 356 247 567 48 237 402 285 80 426 75RTOR Reduction (vph) 0 45 0 0 6 0 0 125 0 0 14 0Lane Group Flow (vph) 80 1172 0 247 609 0 237 562 0 80 487 0Turn Type Prot NA Prot NA Prot NA Prot NAProtected Phases 7 4 3 8 5 2 1 6Permitted PhasesActuated Green, G (s) 8.2 36.8 16.0 44.6 16.0 26.4 6.4 16.8Effective Green, g (s) 8.2 36.8 16.0 44.6 16.0 26.4 6.4 16.8Actuated g/C Ratio 0.08 0.36 0.16 0.44 0.16 0.26 0.06 0.17Clearance Time (s) 4.0 4.0 4.0 4.0 4.0 4.0 4.0 4.0Vehicle Extension (s) 3.0 3.0 3.0 3.0 3.0 3.0 3.0 3.0Lane Grp Cap (vph) 127 1161 249 1454 249 816 99 542v/s Ratio Prot 0.05 c0.37 c0.16 0.18 c0.15 0.18 0.05 c0.15v/s Ratio Permv/c Ratio 0.63 1.01 0.99 0.42 0.95 0.69 0.81 0.90Uniform Delay, d1 45.2 32.4 42.7 19.6 42.4 33.9 47.0 41.6Progression Factor 1.00 1.00 1.00 1.00 1.00 1.00 1.00 1.00Incremental Delay, d2 9.4 28.8 54.6 0.2 43.6 4.7 36.6 20.3Delay (s) 54.6 61.2 97.3 19.8 86.0 38.6 83.6 61.9Level of Service D E F B F D F EApproach Delay (s) 60.8 42.0 50.8 64.9Approach LOS E D D E
Intersection SummaryHCM 2000 Control Delay 54.5 HCM 2000 Level of Service DHCM 2000 Volume to Capacity ratio 0.97Actuated Cycle Length (s) 101.6 Sum of lost time (s) 16.0Intersection Capacity Utilization 89.7% ICU Level of Service EAnalysis Period (min) 15c Critical Lane Group
Agenda item No. 3
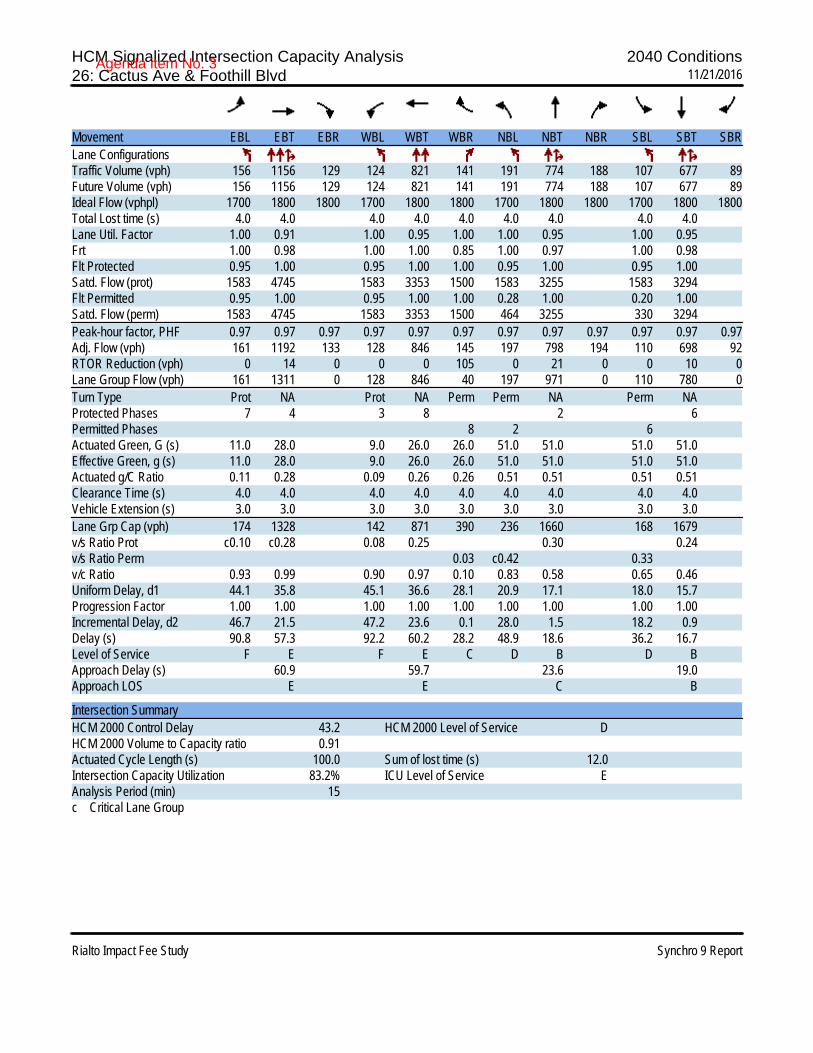
HCM Signalized Intersection Capacity Analysis 2040 Conditions26: Cactus Ave & Foothill Blvd 11/21/2016
Rialto Impact Fee Study Synchro 9 Report
Movement EBL EBT EBR WBL WBT WBR NBL NBT NBR SBL SBT SBRLane ConfigurationsTraffic Volume (vph) 156 1156 129 124 821 141 191 774 188 107 677 89Future Volume (vph) 156 1156 129 124 821 141 191 774 188 107 677 89Ideal Flow (vphpl) 1700 1800 1800 1700 1800 1800 1700 1800 1800 1700 1800 1800Total Lost time (s) 4.0 4.0 4.0 4.0 4.0 4.0 4.0 4.0 4.0Lane Util. Factor 1.00 0.91 1.00 0.95 1.00 1.00 0.95 1.00 0.95Frt 1.00 0.98 1.00 1.00 0.85 1.00 0.97 1.00 0.98Flt Protected 0.95 1.00 0.95 1.00 1.00 0.95 1.00 0.95 1.00Satd. Flow (prot) 1583 4745 1583 3353 1500 1583 3255 1583 3294Flt Permitted 0.95 1.00 0.95 1.00 1.00 0.28 1.00 0.20 1.00Satd. Flow (perm) 1583 4745 1583 3353 1500 464 3255 330 3294Peak-hour factor, PHF 0.97 0.97 0.97 0.97 0.97 0.97 0.97 0.97 0.97 0.97 0.97 0.97Adj. Flow (vph) 161 1192 133 128 846 145 197 798 194 110 698 92RTOR Reduction (vph) 0 14 0 0 0 105 0 21 0 0 10 0Lane Group Flow (vph) 161 1311 0 128 846 40 197 971 0 110 780 0Turn Type Prot NA Prot NA Perm Perm NA Perm NAProtected Phases 7 4 3 8 2 6Permitted Phases 8 2 6Actuated Green, G (s) 11.0 28.0 9.0 26.0 26.0 51.0 51.0 51.0 51.0Effective Green, g (s) 11.0 28.0 9.0 26.0 26.0 51.0 51.0 51.0 51.0Actuated g/C Ratio 0.11 0.28 0.09 0.26 0.26 0.51 0.51 0.51 0.51Clearance Time (s) 4.0 4.0 4.0 4.0 4.0 4.0 4.0 4.0 4.0Vehicle Extension (s) 3.0 3.0 3.0 3.0 3.0 3.0 3.0 3.0 3.0Lane Grp Cap (vph) 174 1328 142 871 390 236 1660 168 1679v/s Ratio Prot c0.10 c0.28 0.08 0.25 0.30 0.24v/s Ratio Perm 0.03 c0.42 0.33v/c Ratio 0.93 0.99 0.90 0.97 0.10 0.83 0.58 0.65 0.46Uniform Delay, d1 44.1 35.8 45.1 36.6 28.1 20.9 17.1 18.0 15.7Progression Factor 1.00 1.00 1.00 1.00 1.00 1.00 1.00 1.00 1.00Incremental Delay, d2 46.7 21.5 47.2 23.6 0.1 28.0 1.5 18.2 0.9Delay (s) 90.8 57.3 92.2 60.2 28.2 48.9 18.6 36.2 16.7Level of Service F E F E C D B D BApproach Delay (s) 60.9 59.7 23.6 19.0Approach LOS E E C B
Intersection SummaryHCM 2000 Control Delay 43.2 HCM 2000 Level of Service DHCM 2000 Volume to Capacity ratio 0.91Actuated Cycle Length (s) 100.0 Sum of lost time (s) 12.0Intersection Capacity Utilization 83.2% ICU Level of Service EAnalysis Period (min) 15c Critical Lane Group
Agenda item No. 3
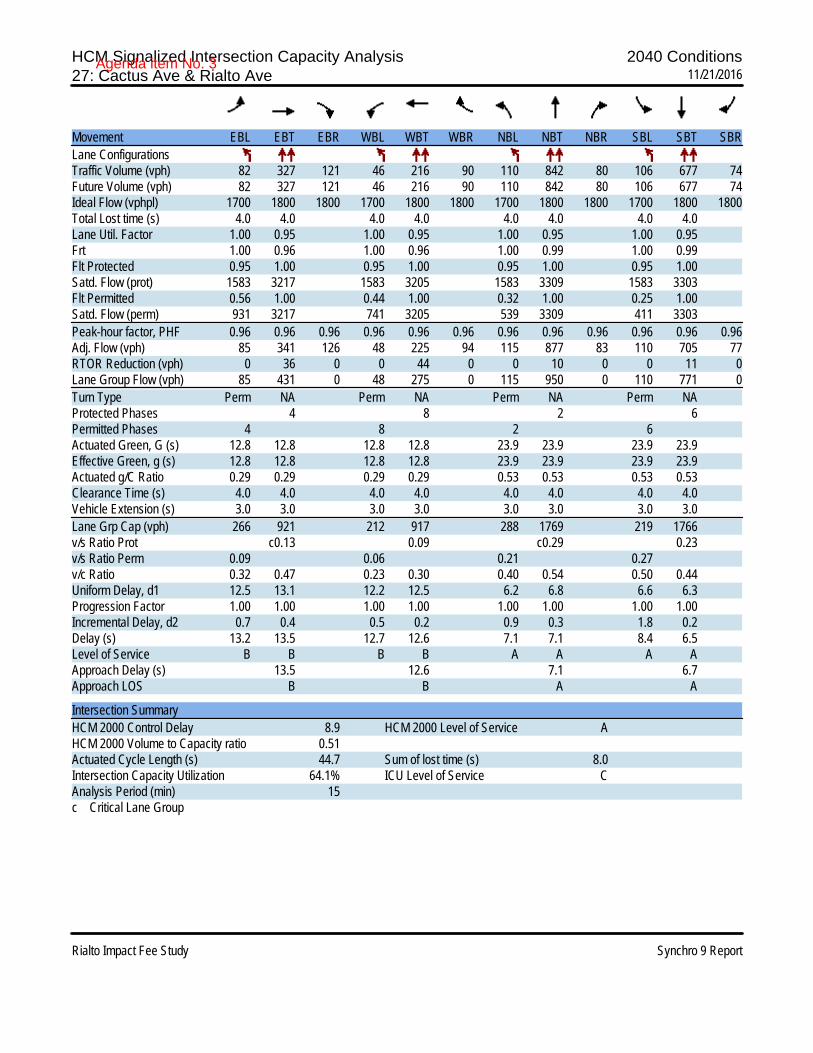
HCM Signalized Intersection Capacity Analysis 2040 Conditions27: Cactus Ave & Rialto Ave 11/21/2016
Rialto Impact Fee Study Synchro 9 Report
Movement EBL EBT EBR WBL WBT WBR NBL NBT NBR SBL SBT SBRLane ConfigurationsTraffic Volume (vph) 82 327 121 46 216 90 110 842 80 106 677 74Future Volume (vph) 82 327 121 46 216 90 110 842 80 106 677 74Ideal Flow (vphpl) 1700 1800 1800 1700 1800 1800 1700 1800 1800 1700 1800 1800Total Lost time (s) 4.0 4.0 4.0 4.0 4.0 4.0 4.0 4.0Lane Util. Factor 1.00 0.95 1.00 0.95 1.00 0.95 1.00 0.95Frt 1.00 0.96 1.00 0.96 1.00 0.99 1.00 0.99Flt Protected 0.95 1.00 0.95 1.00 0.95 1.00 0.95 1.00Satd. Flow (prot) 1583 3217 1583 3205 1583 3309 1583 3303Flt Permitted 0.56 1.00 0.44 1.00 0.32 1.00 0.25 1.00Satd. Flow (perm) 931 3217 741 3205 539 3309 411 3303Peak-hour factor, PHF 0.96 0.96 0.96 0.96 0.96 0.96 0.96 0.96 0.96 0.96 0.96 0.96Adj. Flow (vph) 85 341 126 48 225 94 115 877 83 110 705 77RTOR Reduction (vph) 0 36 0 0 44 0 0 10 0 0 11 0Lane Group Flow (vph) 85 431 0 48 275 0 115 950 0 110 771 0Turn Type Perm NA Perm NA Perm NA Perm NAProtected Phases 4 8 2 6Permitted Phases 4 8 2 6Actuated Green, G (s) 12.8 12.8 12.8 12.8 23.9 23.9 23.9 23.9Effective Green, g (s) 12.8 12.8 12.8 12.8 23.9 23.9 23.9 23.9Actuated g/C Ratio 0.29 0.29 0.29 0.29 0.53 0.53 0.53 0.53Clearance Time (s) 4.0 4.0 4.0 4.0 4.0 4.0 4.0 4.0Vehicle Extension (s) 3.0 3.0 3.0 3.0 3.0 3.0 3.0 3.0Lane Grp Cap (vph) 266 921 212 917 288 1769 219 1766v/s Ratio Prot c0.13 0.09 c0.29 0.23v/s Ratio Perm 0.09 0.06 0.21 0.27v/c Ratio 0.32 0.47 0.23 0.30 0.40 0.54 0.50 0.44Uniform Delay, d1 12.5 13.1 12.2 12.5 6.2 6.8 6.6 6.3Progression Factor 1.00 1.00 1.00 1.00 1.00 1.00 1.00 1.00Incremental Delay, d2 0.7 0.4 0.5 0.2 0.9 0.3 1.8 0.2Delay (s) 13.2 13.5 12.7 12.6 7.1 7.1 8.4 6.5Level of Service B B B B A A A AApproach Delay (s) 13.5 12.6 7.1 6.7Approach LOS B B A A
Intersection SummaryHCM 2000 Control Delay 8.9 HCM 2000 Level of Service AHCM 2000 Volume to Capacity ratio 0.51Actuated Cycle Length (s) 44.7 Sum of lost time (s) 8.0Intersection Capacity Utilization 64.1% ICU Level of Service CAnalysis Period (min) 15c Critical Lane Group
Agenda item No. 3

HCM Signalized Intersection Capacity Analysis 2040 Conditions28: Cactus Ave & Merrill Ave 11/21/2016
Rialto Impact Fee Study Synchro 9 Report
Movement EBL EBT EBR WBL WBT WBR NBL NBT NBR SBL SBT SBRLane ConfigurationsTraffic Volume (vph) 138 357 88 45 242 59 50 849 32 60 689 97Future Volume (vph) 138 357 88 45 242 59 50 849 32 60 689 97Ideal Flow (vphpl) 1700 1800 1800 1700 1800 1800 1700 1800 1800 1700 1800 1800Total Lost time (s) 4.0 4.0 4.0 4.0 4.0 4.0 4.0 4.0Lane Util. Factor 1.00 0.95 1.00 0.95 1.00 0.95 1.00 0.95Frt 1.00 0.97 1.00 0.97 1.00 0.99 1.00 0.98Flt Protected 0.95 1.00 0.95 1.00 0.95 1.00 0.95 1.00Satd. Flow (prot) 1583 3253 1583 3254 1583 3335 1583 3291Flt Permitted 0.54 1.00 0.40 1.00 0.95 1.00 0.95 1.00Satd. Flow (perm) 901 3253 671 3254 1583 3335 1583 3291Peak-hour factor, PHF 0.94 0.94 0.94 0.94 0.94 0.94 0.94 0.94 0.94 0.94 0.94 0.94Adj. Flow (vph) 147 380 94 48 257 63 53 903 34 64 733 103RTOR Reduction (vph) 0 23 0 0 23 0 0 3 0 0 11 0Lane Group Flow (vph) 147 451 0 48 297 0 53 934 0 64 825 0Turn Type Perm NA Perm NA Prot NA Prot NAProtected Phases 4 8 5 2 1 6Permitted Phases 4 8Actuated Green, G (s) 19.5 19.5 19.5 19.5 3.8 28.1 4.5 28.8Effective Green, g (s) 19.5 19.5 19.5 19.5 3.8 28.1 4.5 28.8Actuated g/C Ratio 0.30 0.30 0.30 0.30 0.06 0.44 0.07 0.45Clearance Time (s) 4.0 4.0 4.0 4.0 4.0 4.0 4.0 4.0Vehicle Extension (s) 3.0 3.0 3.0 3.0 3.0 3.0 3.0 3.0Lane Grp Cap (vph) 274 989 204 989 93 1461 111 1478v/s Ratio Prot 0.14 0.09 0.03 c0.28 c0.04 0.25v/s Ratio Perm c0.16 0.07v/c Ratio 0.54 0.46 0.24 0.30 0.57 0.64 0.58 0.56Uniform Delay, d1 18.5 18.0 16.7 17.1 29.4 14.0 28.9 13.0Progression Factor 1.00 1.00 1.00 1.00 1.00 1.00 1.00 1.00Incremental Delay, d2 2.0 0.3 0.6 0.2 7.8 0.9 7.1 0.5Delay (s) 20.6 18.4 17.3 17.2 37.1 15.0 35.9 13.4Level of Service C B B B D B D BApproach Delay (s) 18.9 17.3 16.2 15.0Approach LOS B B B B
Intersection SummaryHCM 2000 Control Delay 16.5 HCM 2000 Level of Service BHCM 2000 Volume to Capacity ratio 0.60Actuated Cycle Length (s) 64.1 Sum of lost time (s) 12.0Intersection Capacity Utilization 60.5% ICU Level of Service BAnalysis Period (min) 15c Critical Lane Group
Agenda item No. 3

HCM Signalized Intersection Capacity Analysis 2040 Conditions29: Cactus Ave & Randall Ave 11/21/2016
Rialto Impact Fee Study Synchro 9 Report
Movement EBL EBT EBR WBL WBT WBR NBL NBT NBR SBL SBT SBRLane ConfigurationsTraffic Volume (vph) 7 85 28 51 118 59 50 781 60 64 771 15Future Volume (vph) 7 85 28 51 118 59 50 781 60 64 771 15Ideal Flow (vphpl) 1700 1800 1800 1700 1800 1800 1700 1800 1800 1700 1800 1800Total Lost time (s) 4.0 4.0 4.0 4.0 4.0 4.0 4.0 4.0Lane Util. Factor 1.00 1.00 1.00 1.00 1.00 0.95 1.00 0.95Frt 1.00 0.96 1.00 0.95 1.00 0.99 1.00 1.00Flt Protected 0.95 1.00 0.95 1.00 0.95 1.00 0.95 1.00Satd. Flow (prot) 1583 1699 1583 1677 1583 3317 1583 3343Flt Permitted 0.43 1.00 0.62 1.00 0.32 1.00 0.30 1.00Satd. Flow (perm) 715 1699 1034 1677 530 3317 494 3343Peak-hour factor, PHF 0.93 0.93 0.93 0.93 0.93 0.93 0.93 0.93 0.93 0.93 0.93 0.93Adj. Flow (vph) 8 91 30 55 127 63 54 840 65 69 829 16RTOR Reduction (vph) 0 14 0 0 22 0 0 4 0 0 1 0Lane Group Flow (vph) 8 107 0 55 168 0 54 901 0 69 844 0Turn Type Perm NA Perm NA Perm NA Perm NAProtected Phases 4 8 2 6Permitted Phases 4 8 2 6Actuated Green, G (s) 13.7 13.7 13.7 13.7 63.9 63.9 63.9 63.9Effective Green, g (s) 13.7 13.7 13.7 13.7 63.9 63.9 63.9 63.9Actuated g/C Ratio 0.16 0.16 0.16 0.16 0.75 0.75 0.75 0.75Clearance Time (s) 4.0 4.0 4.0 4.0 4.0 4.0 4.0 4.0Vehicle Extension (s) 3.0 3.0 3.0 3.0 3.0 3.0 3.0 3.0Lane Grp Cap (vph) 114 271 165 268 395 2476 368 2495v/s Ratio Prot 0.06 c0.10 c0.27 0.25v/s Ratio Perm 0.01 0.05 0.10 0.14v/c Ratio 0.07 0.39 0.33 0.63 0.14 0.36 0.19 0.34Uniform Delay, d1 30.5 32.2 31.9 33.6 3.1 3.8 3.2 3.7Progression Factor 1.00 1.00 1.00 1.00 1.00 1.00 1.00 1.00Incremental Delay, d2 0.3 0.9 1.2 4.5 0.7 0.4 1.1 0.4Delay (s) 30.8 33.2 33.1 38.1 3.8 4.2 4.3 4.0Level of Service C C C D A A A AApproach Delay (s) 33.0 37.0 4.2 4.1Approach LOS C D A A
Intersection SummaryHCM 2000 Control Delay 9.4 HCM 2000 Level of Service AHCM 2000 Volume to Capacity ratio 0.41Actuated Cycle Length (s) 85.6 Sum of lost time (s) 8.0Intersection Capacity Utilization 49.1% ICU Level of Service AAnalysis Period (min) 15c Critical Lane Group
Agenda item No. 3

HCM Unsignalized Intersection Capacity Analysis 2040 Conditions30: Cactus Ave & San Bernardino Ave 11/21/2016
Rialto Impact Fee Study Synchro 9 Report
Movement EBL EBT EBR WBL WBT WBR NBL NBT NBR SBL SBT SBRLane ConfigurationsSign Control Stop Stop Stop StopTraffic Volume (vph) 108 437 6 59 287 72 2 426 90 101 356 65Future Volume (vph) 108 437 6 59 287 72 2 426 90 101 356 65Peak Hour Factor 0.92 0.92 0.92 0.92 0.92 0.92 0.92 0.92 0.92 0.92 0.92 0.92Hourly flow rate (vph) 117 475 7 64 312 78 2 463 98 110 387 71
Direction, Lane # EB 1 EB 2 WB 1 WB 2 NB 1 NB 2 SB 1 SB 2Volume Total (vph) 355 245 220 234 2 561 110 458Volume Left (vph) 117 0 64 0 2 0 110 0Volume Right (vph) 0 7 0 78 0 98 0 71Hadj (s) 0.20 0.01 0.18 -0.20 0.53 -0.09 0.53 -0.07Departure Headway (s) 9.2 9.0 9.4 9.1 9.6 9.0 9.4 8.8Degree Utilization, x 0.91 0.61 0.58 0.59 0.01 1.00 0.29 1.00Capacity (veh/h) 379 389 370 386 367 561 376 458Control Delay (s) 54.6 24.1 23.3 23.1 11.4 74.3 15.0 73.7Approach Delay (s) 42.1 23.2 74.1 62.3Approach LOS E C F F
Intersection SummaryDelay 51.7Level of Service FIntersection Capacity Utilization 77.9% ICU Level of Service DAnalysis Period (min) 15
Agenda item No. 3
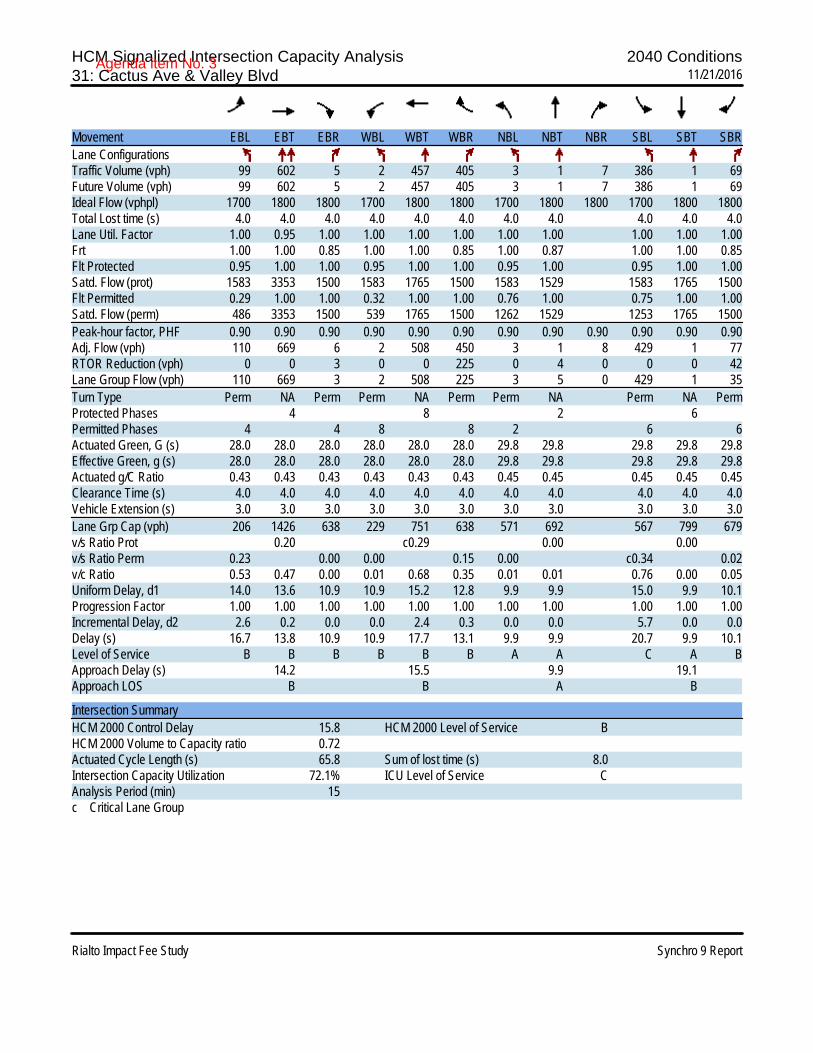
HCM Signalized Intersection Capacity Analysis 2040 Conditions31: Cactus Ave & Valley Blvd 11/21/2016
Rialto Impact Fee Study Synchro 9 Report
Movement EBL EBT EBR WBL WBT WBR NBL NBT NBR SBL SBT SBRLane ConfigurationsTraffic Volume (vph) 99 602 5 2 457 405 3 1 7 386 1 69Future Volume (vph) 99 602 5 2 457 405 3 1 7 386 1 69Ideal Flow (vphpl) 1700 1800 1800 1700 1800 1800 1700 1800 1800 1700 1800 1800Total Lost time (s) 4.0 4.0 4.0 4.0 4.0 4.0 4.0 4.0 4.0 4.0 4.0Lane Util. Factor 1.00 0.95 1.00 1.00 1.00 1.00 1.00 1.00 1.00 1.00 1.00Frt 1.00 1.00 0.85 1.00 1.00 0.85 1.00 0.87 1.00 1.00 0.85Flt Protected 0.95 1.00 1.00 0.95 1.00 1.00 0.95 1.00 0.95 1.00 1.00Satd. Flow (prot) 1583 3353 1500 1583 1765 1500 1583 1529 1583 1765 1500Flt Permitted 0.29 1.00 1.00 0.32 1.00 1.00 0.76 1.00 0.75 1.00 1.00Satd. Flow (perm) 486 3353 1500 539 1765 1500 1262 1529 1253 1765 1500Peak-hour factor, PHF 0.90 0.90 0.90 0.90 0.90 0.90 0.90 0.90 0.90 0.90 0.90 0.90Adj. Flow (vph) 110 669 6 2 508 450 3 1 8 429 1 77RTOR Reduction (vph) 0 0 3 0 0 225 0 4 0 0 0 42Lane Group Flow (vph) 110 669 3 2 508 225 3 5 0 429 1 35Turn Type Perm NA Perm Perm NA Perm Perm NA Perm NA PermProtected Phases 4 8 2 6Permitted Phases 4 4 8 8 2 6 6Actuated Green, G (s) 28.0 28.0 28.0 28.0 28.0 28.0 29.8 29.8 29.8 29.8 29.8Effective Green, g (s) 28.0 28.0 28.0 28.0 28.0 28.0 29.8 29.8 29.8 29.8 29.8Actuated g/C Ratio 0.43 0.43 0.43 0.43 0.43 0.43 0.45 0.45 0.45 0.45 0.45Clearance Time (s) 4.0 4.0 4.0 4.0 4.0 4.0 4.0 4.0 4.0 4.0 4.0Vehicle Extension (s) 3.0 3.0 3.0 3.0 3.0 3.0 3.0 3.0 3.0 3.0 3.0Lane Grp Cap (vph) 206 1426 638 229 751 638 571 692 567 799 679v/s Ratio Prot 0.20 c0.29 0.00 0.00v/s Ratio Perm 0.23 0.00 0.00 0.15 0.00 c0.34 0.02v/c Ratio 0.53 0.47 0.00 0.01 0.68 0.35 0.01 0.01 0.76 0.00 0.05Uniform Delay, d1 14.0 13.6 10.9 10.9 15.2 12.8 9.9 9.9 15.0 9.9 10.1Progression Factor 1.00 1.00 1.00 1.00 1.00 1.00 1.00 1.00 1.00 1.00 1.00Incremental Delay, d2 2.6 0.2 0.0 0.0 2.4 0.3 0.0 0.0 5.7 0.0 0.0Delay (s) 16.7 13.8 10.9 10.9 17.7 13.1 9.9 9.9 20.7 9.9 10.1Level of Service B B B B B B A A C A BApproach Delay (s) 14.2 15.5 9.9 19.1Approach LOS B B A B
Intersection SummaryHCM 2000 Control Delay 15.8 HCM 2000 Level of Service BHCM 2000 Volume to Capacity ratio 0.72Actuated Cycle Length (s) 65.8 Sum of lost time (s) 8.0Intersection Capacity Utilization 72.1% ICU Level of Service CAnalysis Period (min) 15c Critical Lane Group
Agenda item No. 3
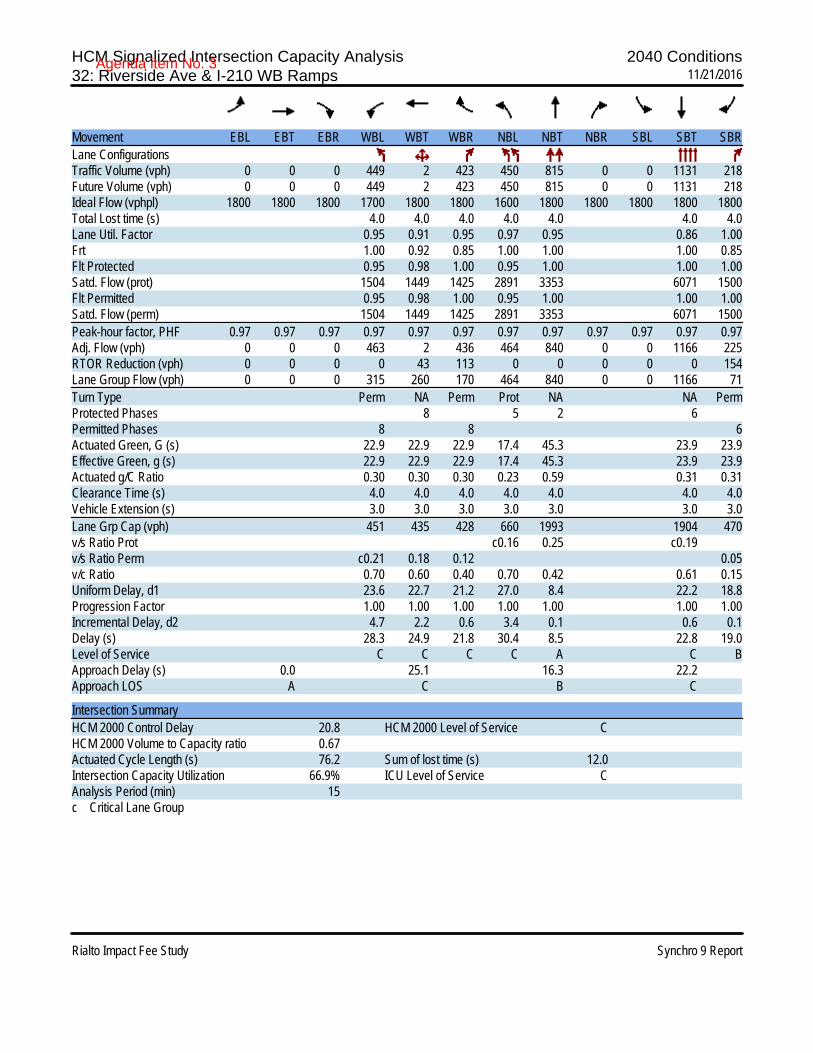
HCM Signalized Intersection Capacity Analysis 2040 Conditions32: Riverside Ave & I-210 WB Ramps 11/21/2016
Rialto Impact Fee Study Synchro 9 Report
Movement EBL EBT EBR WBL WBT WBR NBL NBT NBR SBL SBT SBRLane ConfigurationsTraffic Volume (vph) 0 0 0 449 2 423 450 815 0 0 1131 218Future Volume (vph) 0 0 0 449 2 423 450 815 0 0 1131 218Ideal Flow (vphpl) 1800 1800 1800 1700 1800 1800 1600 1800 1800 1800 1800 1800Total Lost time (s) 4.0 4.0 4.0 4.0 4.0 4.0 4.0Lane Util. Factor 0.95 0.91 0.95 0.97 0.95 0.86 1.00Frt 1.00 0.92 0.85 1.00 1.00 1.00 0.85Flt Protected 0.95 0.98 1.00 0.95 1.00 1.00 1.00Satd. Flow (prot) 1504 1449 1425 2891 3353 6071 1500Flt Permitted 0.95 0.98 1.00 0.95 1.00 1.00 1.00Satd. Flow (perm) 1504 1449 1425 2891 3353 6071 1500Peak-hour factor, PHF 0.97 0.97 0.97 0.97 0.97 0.97 0.97 0.97 0.97 0.97 0.97 0.97Adj. Flow (vph) 0 0 0 463 2 436 464 840 0 0 1166 225RTOR Reduction (vph) 0 0 0 0 43 113 0 0 0 0 0 154Lane Group Flow (vph) 0 0 0 315 260 170 464 840 0 0 1166 71Turn Type Perm NA Perm Prot NA NA PermProtected Phases 8 5 2 6Permitted Phases 8 8 6Actuated Green, G (s) 22.9 22.9 22.9 17.4 45.3 23.9 23.9Effective Green, g (s) 22.9 22.9 22.9 17.4 45.3 23.9 23.9Actuated g/C Ratio 0.30 0.30 0.30 0.23 0.59 0.31 0.31Clearance Time (s) 4.0 4.0 4.0 4.0 4.0 4.0 4.0Vehicle Extension (s) 3.0 3.0 3.0 3.0 3.0 3.0 3.0Lane Grp Cap (vph) 451 435 428 660 1993 1904 470v/s Ratio Prot c0.16 0.25 c0.19v/s Ratio Perm c0.21 0.18 0.12 0.05v/c Ratio 0.70 0.60 0.40 0.70 0.42 0.61 0.15Uniform Delay, d1 23.6 22.7 21.2 27.0 8.4 22.2 18.8Progression Factor 1.00 1.00 1.00 1.00 1.00 1.00 1.00Incremental Delay, d2 4.7 2.2 0.6 3.4 0.1 0.6 0.1Delay (s) 28.3 24.9 21.8 30.4 8.5 22.8 19.0Level of Service C C C C A C BApproach Delay (s) 0.0 25.1 16.3 22.2Approach LOS A C B C
Intersection SummaryHCM 2000 Control Delay 20.8 HCM 2000 Level of Service CHCM 2000 Volume to Capacity ratio 0.67Actuated Cycle Length (s) 76.2 Sum of lost time (s) 12.0Intersection Capacity Utilization 66.9% ICU Level of Service CAnalysis Period (min) 15c Critical Lane Group
Agenda item No. 3

HCM Signalized Intersection Capacity Analysis 2040 Conditions33: Riverside Ave & I-210 EB Ramps 11/21/2016
Rialto Impact Fee Study Synchro 9 Report
Movement EBL EBT EBR WBL WBT WBR NBL NBT NBR SBL SBT SBRLane ConfigurationsTraffic Volume (vph) 211 1 435 0 0 0 0 1053 394 534 1041 0Future Volume (vph) 211 1 435 0 0 0 0 1053 394 534 1041 0Ideal Flow (vphpl) 1700 1800 1800 1800 1800 1800 1800 1800 1800 1600 1800 1800Total Lost time (s) 4.0 4.0 4.0 4.0 4.0 4.0 4.0Lane Util. Factor 1.00 0.95 0.95 0.86 1.00 0.97 0.95Frt 1.00 0.85 0.85 1.00 0.85 1.00 1.00Flt Protected 0.95 1.00 1.00 1.00 1.00 0.95 1.00Satd. Flow (prot) 1583 1426 1425 6071 1500 2891 3353Flt Permitted 0.95 1.00 1.00 1.00 1.00 0.95 1.00Satd. Flow (perm) 1583 1426 1425 6071 1500 2891 3353Peak-hour factor, PHF 0.98 0.98 0.98 0.98 0.98 0.98 0.98 0.98 0.98 0.98 0.98 0.98Adj. Flow (vph) 215 1 444 0 0 0 0 1074 402 545 1062 0RTOR Reduction (vph) 0 100 100 0 0 0 0 0 264 0 0 0Lane Group Flow (vph) 215 123 122 0 0 0 0 1074 138 545 1062 0Turn Type Perm NA Perm NA Perm Prot NAProtected Phases 4 2 1 6Permitted Phases 4 4 2Actuated Green, G (s) 16.3 16.3 16.3 24.9 24.9 19.2 48.1Effective Green, g (s) 16.3 16.3 16.3 24.9 24.9 19.2 48.1Actuated g/C Ratio 0.23 0.23 0.23 0.34 0.34 0.27 0.66Clearance Time (s) 4.0 4.0 4.0 4.0 4.0 4.0 4.0Vehicle Extension (s) 3.0 3.0 3.0 3.0 3.0 3.0 3.0Lane Grp Cap (vph) 356 321 320 2087 515 766 2227v/s Ratio Prot 0.09 0.18 c0.19 c0.32v/s Ratio Perm c0.14 0.09 0.09v/c Ratio 0.60 0.38 0.38 0.51 0.27 0.71 0.48Uniform Delay, d1 25.2 23.8 23.8 18.9 17.2 24.1 6.0Progression Factor 1.00 1.00 1.00 1.00 1.00 1.00 1.00Incremental Delay, d2 2.9 0.8 0.8 0.2 0.3 3.1 0.2Delay (s) 28.0 24.6 24.5 19.1 17.4 27.2 6.1Level of Service C C C B B C AApproach Delay (s) 25.7 0.0 18.7 13.3Approach LOS C A B B
Intersection SummaryHCM 2000 Control Delay 17.6 HCM 2000 Level of Service BHCM 2000 Volume to Capacity ratio 0.61Actuated Cycle Length (s) 72.4 Sum of lost time (s) 12.0Intersection Capacity Utilization 66.9% ICU Level of Service CAnalysis Period (min) 15c Critical Lane Group
Agenda item No. 3
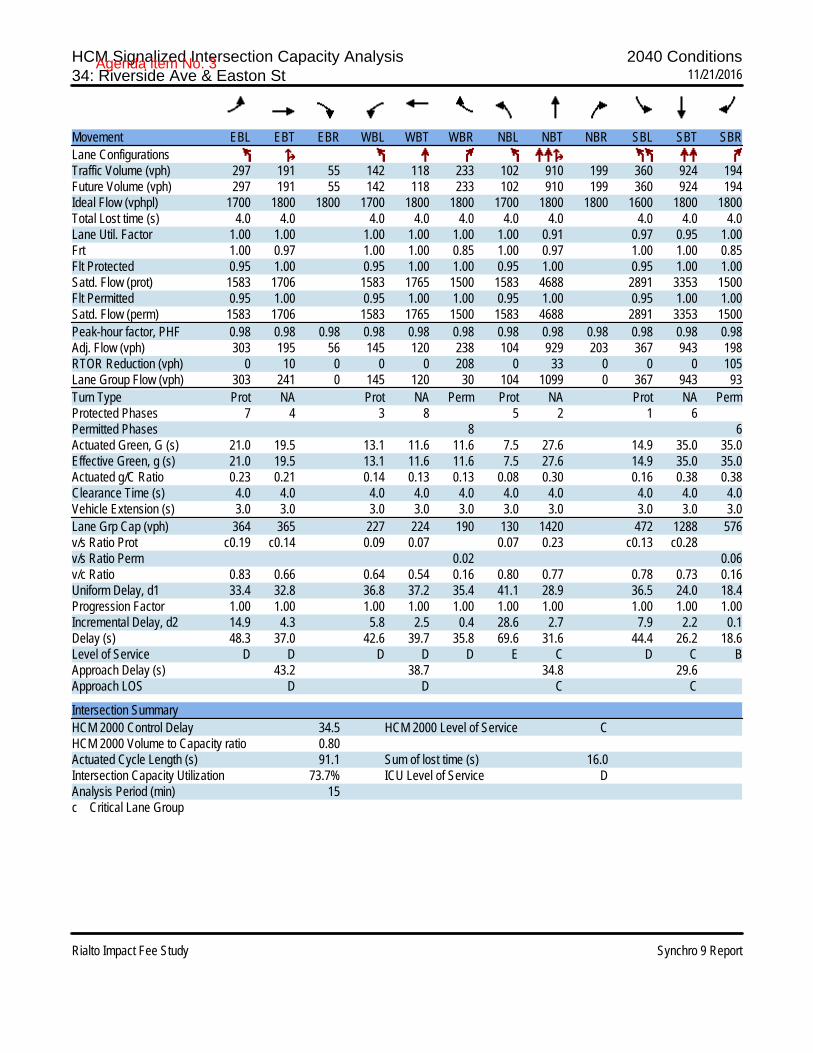
HCM Signalized Intersection Capacity Analysis 2040 Conditions34: Riverside Ave & Easton St 11/21/2016
Rialto Impact Fee Study Synchro 9 Report
Movement EBL EBT EBR WBL WBT WBR NBL NBT NBR SBL SBT SBRLane ConfigurationsTraffic Volume (vph) 297 191 55 142 118 233 102 910 199 360 924 194Future Volume (vph) 297 191 55 142 118 233 102 910 199 360 924 194Ideal Flow (vphpl) 1700 1800 1800 1700 1800 1800 1700 1800 1800 1600 1800 1800Total Lost time (s) 4.0 4.0 4.0 4.0 4.0 4.0 4.0 4.0 4.0 4.0Lane Util. Factor 1.00 1.00 1.00 1.00 1.00 1.00 0.91 0.97 0.95 1.00Frt 1.00 0.97 1.00 1.00 0.85 1.00 0.97 1.00 1.00 0.85Flt Protected 0.95 1.00 0.95 1.00 1.00 0.95 1.00 0.95 1.00 1.00Satd. Flow (prot) 1583 1706 1583 1765 1500 1583 4688 2891 3353 1500Flt Permitted 0.95 1.00 0.95 1.00 1.00 0.95 1.00 0.95 1.00 1.00Satd. Flow (perm) 1583 1706 1583 1765 1500 1583 4688 2891 3353 1500Peak-hour factor, PHF 0.98 0.98 0.98 0.98 0.98 0.98 0.98 0.98 0.98 0.98 0.98 0.98Adj. Flow (vph) 303 195 56 145 120 238 104 929 203 367 943 198RTOR Reduction (vph) 0 10 0 0 0 208 0 33 0 0 0 105Lane Group Flow (vph) 303 241 0 145 120 30 104 1099 0 367 943 93Turn Type Prot NA Prot NA Perm Prot NA Prot NA PermProtected Phases 7 4 3 8 5 2 1 6Permitted Phases 8 6Actuated Green, G (s) 21.0 19.5 13.1 11.6 11.6 7.5 27.6 14.9 35.0 35.0Effective Green, g (s) 21.0 19.5 13.1 11.6 11.6 7.5 27.6 14.9 35.0 35.0Actuated g/C Ratio 0.23 0.21 0.14 0.13 0.13 0.08 0.30 0.16 0.38 0.38Clearance Time (s) 4.0 4.0 4.0 4.0 4.0 4.0 4.0 4.0 4.0 4.0Vehicle Extension (s) 3.0 3.0 3.0 3.0 3.0 3.0 3.0 3.0 3.0 3.0Lane Grp Cap (vph) 364 365 227 224 190 130 1420 472 1288 576v/s Ratio Prot c0.19 c0.14 0.09 0.07 0.07 0.23 c0.13 c0.28v/s Ratio Perm 0.02 0.06v/c Ratio 0.83 0.66 0.64 0.54 0.16 0.80 0.77 0.78 0.73 0.16Uniform Delay, d1 33.4 32.8 36.8 37.2 35.4 41.1 28.9 36.5 24.0 18.4Progression Factor 1.00 1.00 1.00 1.00 1.00 1.00 1.00 1.00 1.00 1.00Incremental Delay, d2 14.9 4.3 5.8 2.5 0.4 28.6 2.7 7.9 2.2 0.1Delay (s) 48.3 37.0 42.6 39.7 35.8 69.6 31.6 44.4 26.2 18.6Level of Service D D D D D E C D C BApproach Delay (s) 43.2 38.7 34.8 29.6Approach LOS D D C C
Intersection SummaryHCM 2000 Control Delay 34.5 HCM 2000 Level of Service CHCM 2000 Volume to Capacity ratio 0.80Actuated Cycle Length (s) 91.1 Sum of lost time (s) 16.0Intersection Capacity Utilization 73.7% ICU Level of Service DAnalysis Period (min) 15c Critical Lane Group
Agenda item No. 3
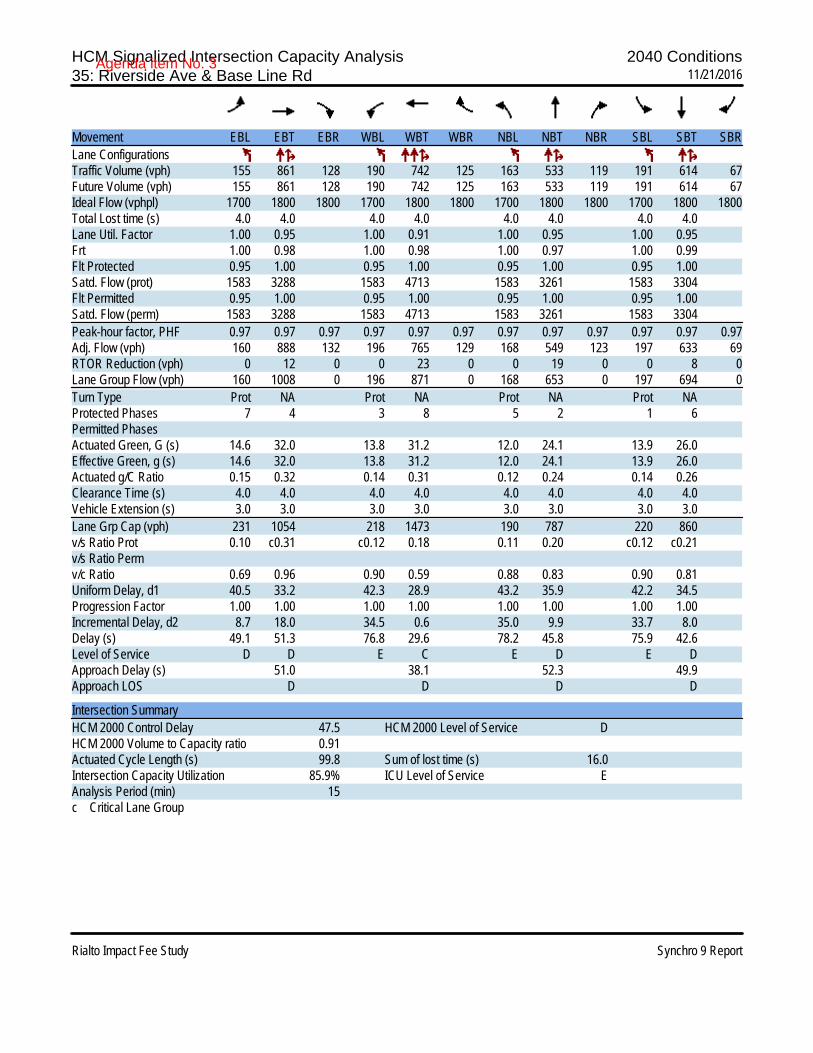
HCM Signalized Intersection Capacity Analysis 2040 Conditions35: Riverside Ave & Base Line Rd 11/21/2016
Rialto Impact Fee Study Synchro 9 Report
Movement EBL EBT EBR WBL WBT WBR NBL NBT NBR SBL SBT SBRLane ConfigurationsTraffic Volume (vph) 155 861 128 190 742 125 163 533 119 191 614 67Future Volume (vph) 155 861 128 190 742 125 163 533 119 191 614 67Ideal Flow (vphpl) 1700 1800 1800 1700 1800 1800 1700 1800 1800 1700 1800 1800Total Lost time (s) 4.0 4.0 4.0 4.0 4.0 4.0 4.0 4.0Lane Util. Factor 1.00 0.95 1.00 0.91 1.00 0.95 1.00 0.95Frt 1.00 0.98 1.00 0.98 1.00 0.97 1.00 0.99Flt Protected 0.95 1.00 0.95 1.00 0.95 1.00 0.95 1.00Satd. Flow (prot) 1583 3288 1583 4713 1583 3261 1583 3304Flt Permitted 0.95 1.00 0.95 1.00 0.95 1.00 0.95 1.00Satd. Flow (perm) 1583 3288 1583 4713 1583 3261 1583 3304Peak-hour factor, PHF 0.97 0.97 0.97 0.97 0.97 0.97 0.97 0.97 0.97 0.97 0.97 0.97Adj. Flow (vph) 160 888 132 196 765 129 168 549 123 197 633 69RTOR Reduction (vph) 0 12 0 0 23 0 0 19 0 0 8 0Lane Group Flow (vph) 160 1008 0 196 871 0 168 653 0 197 694 0Turn Type Prot NA Prot NA Prot NA Prot NAProtected Phases 7 4 3 8 5 2 1 6Permitted PhasesActuated Green, G (s) 14.6 32.0 13.8 31.2 12.0 24.1 13.9 26.0Effective Green, g (s) 14.6 32.0 13.8 31.2 12.0 24.1 13.9 26.0Actuated g/C Ratio 0.15 0.32 0.14 0.31 0.12 0.24 0.14 0.26Clearance Time (s) 4.0 4.0 4.0 4.0 4.0 4.0 4.0 4.0Vehicle Extension (s) 3.0 3.0 3.0 3.0 3.0 3.0 3.0 3.0Lane Grp Cap (vph) 231 1054 218 1473 190 787 220 860v/s Ratio Prot 0.10 c0.31 c0.12 0.18 0.11 0.20 c0.12 c0.21v/s Ratio Permv/c Ratio 0.69 0.96 0.90 0.59 0.88 0.83 0.90 0.81Uniform Delay, d1 40.5 33.2 42.3 28.9 43.2 35.9 42.2 34.5Progression Factor 1.00 1.00 1.00 1.00 1.00 1.00 1.00 1.00Incremental Delay, d2 8.7 18.0 34.5 0.6 35.0 9.9 33.7 8.0Delay (s) 49.1 51.3 76.8 29.6 78.2 45.8 75.9 42.6Level of Service D D E C E D E DApproach Delay (s) 51.0 38.1 52.3 49.9Approach LOS D D D D
Intersection SummaryHCM 2000 Control Delay 47.5 HCM 2000 Level of Service DHCM 2000 Volume to Capacity ratio 0.91Actuated Cycle Length (s) 99.8 Sum of lost time (s) 16.0Intersection Capacity Utilization 85.9% ICU Level of Service EAnalysis Period (min) 15c Critical Lane Group
Agenda item No. 3
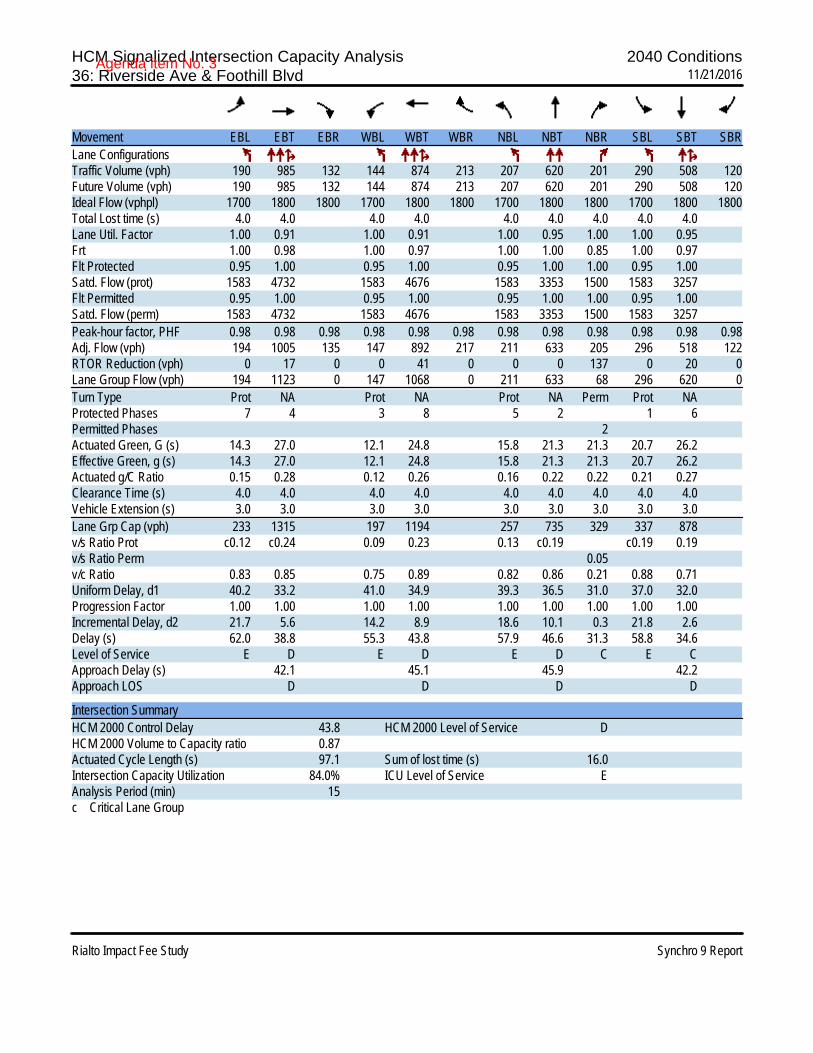
HCM Signalized Intersection Capacity Analysis 2040 Conditions36: Riverside Ave & Foothill Blvd 11/21/2016
Rialto Impact Fee Study Synchro 9 Report
Movement EBL EBT EBR WBL WBT WBR NBL NBT NBR SBL SBT SBRLane ConfigurationsTraffic Volume (vph) 190 985 132 144 874 213 207 620 201 290 508 120Future Volume (vph) 190 985 132 144 874 213 207 620 201 290 508 120Ideal Flow (vphpl) 1700 1800 1800 1700 1800 1800 1700 1800 1800 1700 1800 1800Total Lost time (s) 4.0 4.0 4.0 4.0 4.0 4.0 4.0 4.0 4.0Lane Util. Factor 1.00 0.91 1.00 0.91 1.00 0.95 1.00 1.00 0.95Frt 1.00 0.98 1.00 0.97 1.00 1.00 0.85 1.00 0.97Flt Protected 0.95 1.00 0.95 1.00 0.95 1.00 1.00 0.95 1.00Satd. Flow (prot) 1583 4732 1583 4676 1583 3353 1500 1583 3257Flt Permitted 0.95 1.00 0.95 1.00 0.95 1.00 1.00 0.95 1.00Satd. Flow (perm) 1583 4732 1583 4676 1583 3353 1500 1583 3257Peak-hour factor, PHF 0.98 0.98 0.98 0.98 0.98 0.98 0.98 0.98 0.98 0.98 0.98 0.98Adj. Flow (vph) 194 1005 135 147 892 217 211 633 205 296 518 122RTOR Reduction (vph) 0 17 0 0 41 0 0 0 137 0 20 0Lane Group Flow (vph) 194 1123 0 147 1068 0 211 633 68 296 620 0Turn Type Prot NA Prot NA Prot NA Perm Prot NAProtected Phases 7 4 3 8 5 2 1 6Permitted Phases 2Actuated Green, G (s) 14.3 27.0 12.1 24.8 15.8 21.3 21.3 20.7 26.2Effective Green, g (s) 14.3 27.0 12.1 24.8 15.8 21.3 21.3 20.7 26.2Actuated g/C Ratio 0.15 0.28 0.12 0.26 0.16 0.22 0.22 0.21 0.27Clearance Time (s) 4.0 4.0 4.0 4.0 4.0 4.0 4.0 4.0 4.0Vehicle Extension (s) 3.0 3.0 3.0 3.0 3.0 3.0 3.0 3.0 3.0Lane Grp Cap (vph) 233 1315 197 1194 257 735 329 337 878v/s Ratio Prot c0.12 c0.24 0.09 0.23 0.13 c0.19 c0.19 0.19v/s Ratio Perm 0.05v/c Ratio 0.83 0.85 0.75 0.89 0.82 0.86 0.21 0.88 0.71Uniform Delay, d1 40.2 33.2 41.0 34.9 39.3 36.5 31.0 37.0 32.0Progression Factor 1.00 1.00 1.00 1.00 1.00 1.00 1.00 1.00 1.00Incremental Delay, d2 21.7 5.6 14.2 8.9 18.6 10.1 0.3 21.8 2.6Delay (s) 62.0 38.8 55.3 43.8 57.9 46.6 31.3 58.8 34.6Level of Service E D E D E D C E CApproach Delay (s) 42.1 45.1 45.9 42.2Approach LOS D D D D
Intersection SummaryHCM 2000 Control Delay 43.8 HCM 2000 Level of Service DHCM 2000 Volume to Capacity ratio 0.87Actuated Cycle Length (s) 97.1 Sum of lost time (s) 16.0Intersection Capacity Utilization 84.0% ICU Level of Service EAnalysis Period (min) 15c Critical Lane Group
Agenda item No. 3

HCM Signalized Intersection Capacity Analysis 2040 Conditions37: Riverside Ave & Rialto Ave 11/21/2016
Rialto Impact Fee Study Synchro 9 Report
Movement EBL EBT EBR WBL WBT WBR NBL NBT NBR SBL SBT SBRLane ConfigurationsTraffic Volume (vph) 89 157 84 65 152 33 94 966 78 55 665 34Future Volume (vph) 89 157 84 65 152 33 94 966 78 55 665 34Ideal Flow (vphpl) 1800 1800 1800 1800 1800 1800 1700 1800 1800 1700 1800 1800Total Lost time (s) 4.0 4.0 4.0 4.0 4.0 4.0 4.0 4.0Lane Util. Factor 1.00 1.00 1.00 1.00 1.00 0.95 1.00 0.95Frt 1.00 0.85 1.00 0.85 1.00 0.99 1.00 0.99Flt Protected 0.98 1.00 0.99 1.00 0.95 1.00 0.95 1.00Satd. Flow (prot) 1733 1500 1739 1500 1583 3315 1583 3329Flt Permitted 0.98 1.00 0.99 1.00 0.95 1.00 0.95 1.00Satd. Flow (perm) 1733 1500 1739 1500 1583 3315 1583 3329Peak-hour factor, PHF 0.96 0.96 0.96 0.96 0.96 0.96 0.96 0.96 0.96 0.96 0.96 0.96Adj. Flow (vph) 93 164 88 68 158 34 98 1006 81 57 693 35RTOR Reduction (vph) 0 0 72 0 0 28 0 6 0 0 3 0Lane Group Flow (vph) 0 257 16 0 226 6 98 1081 0 57 725 0Turn Type Split NA Perm Split NA Perm Prot NA Prot NAProtected Phases 4 4 8 8 5 2 1 6Permitted Phases 4 8Actuated Green, G (s) 17.5 17.5 15.8 15.8 8.9 40.5 4.6 36.2Effective Green, g (s) 17.5 17.5 15.8 15.8 8.9 40.5 4.6 36.2Actuated g/C Ratio 0.19 0.19 0.17 0.17 0.09 0.43 0.05 0.38Clearance Time (s) 4.0 4.0 4.0 4.0 4.0 4.0 4.0 4.0Vehicle Extension (s) 3.0 3.0 3.0 3.0 3.0 3.0 3.0 3.0Lane Grp Cap (vph) 321 278 291 251 149 1422 77 1276v/s Ratio Prot c0.15 c0.13 c0.06 c0.33 0.04 0.22v/s Ratio Perm 0.01 0.00v/c Ratio 0.80 0.06 0.78 0.02 0.66 0.76 0.74 0.57Uniform Delay, d1 36.8 31.7 37.6 32.8 41.3 22.8 44.3 22.9Progression Factor 1.00 1.00 1.00 1.00 1.00 1.00 1.00 1.00Incremental Delay, d2 13.3 0.1 12.2 0.0 10.0 3.9 31.3 1.8Delay (s) 50.1 31.8 49.8 32.9 51.3 26.7 75.6 24.8Level of Service D C D C D C E CApproach Delay (s) 45.4 47.6 28.7 28.5Approach LOS D D C C
Intersection SummaryHCM 2000 Control Delay 32.8 HCM 2000 Level of Service CHCM 2000 Volume to Capacity ratio 0.78Actuated Cycle Length (s) 94.4 Sum of lost time (s) 16.0Intersection Capacity Utilization 73.7% ICU Level of Service DAnalysis Period (min) 15c Critical Lane Group
Agenda item No. 3
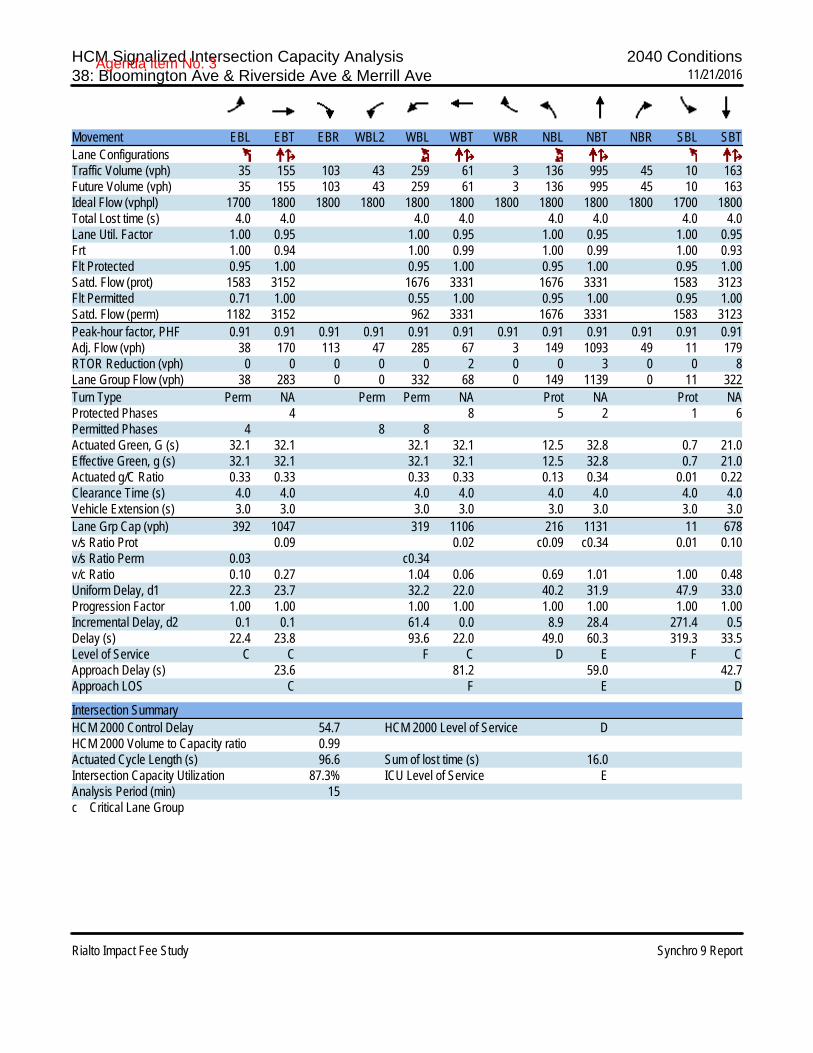
HCM Signalized Intersection Capacity Analysis 2040 Conditions38: Bloomington Ave & Riverside Ave & Merrill Ave 11/21/2016
Rialto Impact Fee Study Synchro 9 Report
Movement EBL EBT EBR WBL2 WBL WBT WBR NBL NBT NBR SBL SBTLane ConfigurationsTraffic Volume (vph) 35 155 103 43 259 61 3 136 995 45 10 163Future Volume (vph) 35 155 103 43 259 61 3 136 995 45 10 163Ideal Flow (vphpl) 1700 1800 1800 1800 1800 1800 1800 1800 1800 1800 1700 1800Total Lost time (s) 4.0 4.0 4.0 4.0 4.0 4.0 4.0 4.0Lane Util. Factor 1.00 0.95 1.00 0.95 1.00 0.95 1.00 0.95Frt 1.00 0.94 1.00 0.99 1.00 0.99 1.00 0.93Flt Protected 0.95 1.00 0.95 1.00 0.95 1.00 0.95 1.00Satd. Flow (prot) 1583 3152 1676 3331 1676 3331 1583 3123Flt Permitted 0.71 1.00 0.55 1.00 0.95 1.00 0.95 1.00Satd. Flow (perm) 1182 3152 962 3331 1676 3331 1583 3123Peak-hour factor, PHF 0.91 0.91 0.91 0.91 0.91 0.91 0.91 0.91 0.91 0.91 0.91 0.91Adj. Flow (vph) 38 170 113 47 285 67 3 149 1093 49 11 179RTOR Reduction (vph) 0 0 0 0 0 2 0 0 3 0 0 8Lane Group Flow (vph) 38 283 0 0 332 68 0 149 1139 0 11 322Turn Type Perm NA Perm Perm NA Prot NA Prot NAProtected Phases 4 8 5 2 1 6Permitted Phases 4 8 8Actuated Green, G (s) 32.1 32.1 32.1 32.1 12.5 32.8 0.7 21.0Effective Green, g (s) 32.1 32.1 32.1 32.1 12.5 32.8 0.7 21.0Actuated g/C Ratio 0.33 0.33 0.33 0.33 0.13 0.34 0.01 0.22Clearance Time (s) 4.0 4.0 4.0 4.0 4.0 4.0 4.0 4.0Vehicle Extension (s) 3.0 3.0 3.0 3.0 3.0 3.0 3.0 3.0Lane Grp Cap (vph) 392 1047 319 1106 216 1131 11 678v/s Ratio Prot 0.09 0.02 c0.09 c0.34 0.01 0.10v/s Ratio Perm 0.03 c0.34v/c Ratio 0.10 0.27 1.04 0.06 0.69 1.01 1.00 0.48Uniform Delay, d1 22.3 23.7 32.2 22.0 40.2 31.9 47.9 33.0Progression Factor 1.00 1.00 1.00 1.00 1.00 1.00 1.00 1.00Incremental Delay, d2 0.1 0.1 61.4 0.0 8.9 28.4 271.4 0.5Delay (s) 22.4 23.8 93.6 22.0 49.0 60.3 319.3 33.5Level of Service C C F C D E F CApproach Delay (s) 23.6 81.2 59.0 42.7Approach LOS C F E D
Intersection SummaryHCM 2000 Control Delay 54.7 HCM 2000 Level of Service DHCM 2000 Volume to Capacity ratio 0.99Actuated Cycle Length (s) 96.6 Sum of lost time (s) 16.0Intersection Capacity Utilization 87.3% ICU Level of Service EAnalysis Period (min) 15c Critical Lane Group
Agenda item No. 3
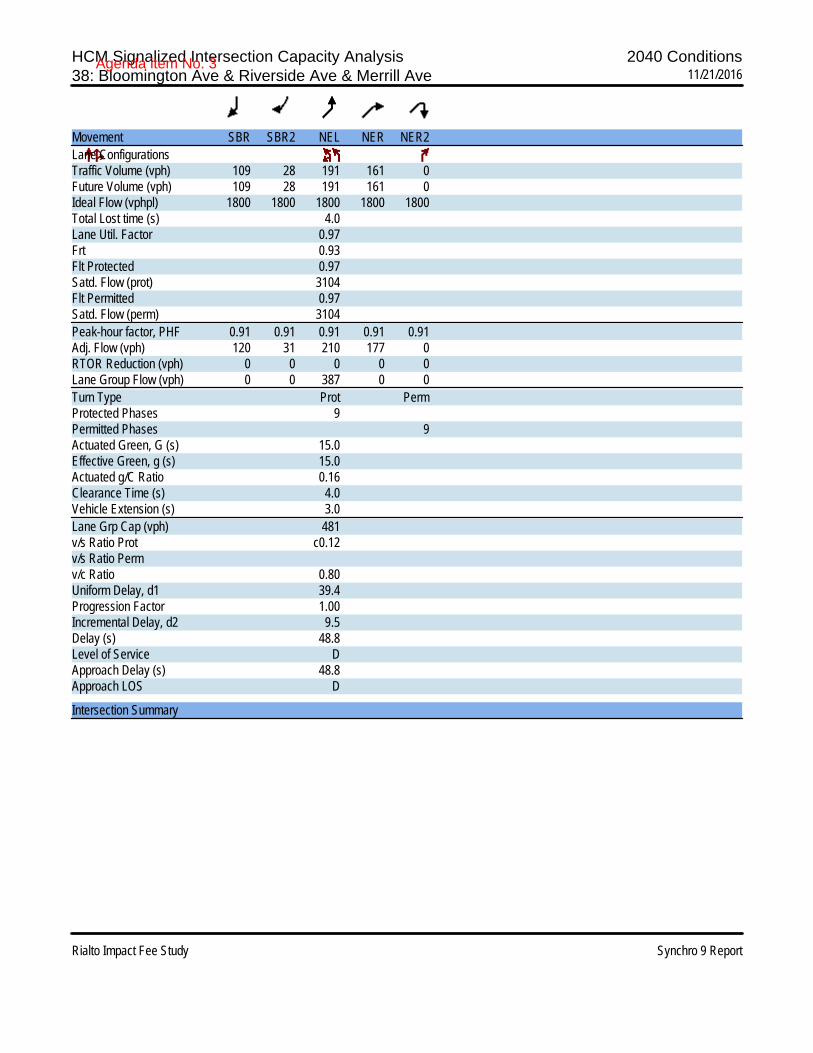
HCM Signalized Intersection Capacity Analysis 2040 Conditions38: Bloomington Ave & Riverside Ave & Merrill Ave 11/21/2016
Rialto Impact Fee Study Synchro 9 Report
Movement SBR SBR2 NEL NER NER2Lane ConfigurationsTraffic Volume (vph) 109 28 191 161 0Future Volume (vph) 109 28 191 161 0Ideal Flow (vphpl) 1800 1800 1800 1800 1800Total Lost time (s) 4.0Lane Util. Factor 0.97Frt 0.93Flt Protected 0.97Satd. Flow (prot) 3104Flt Permitted 0.97Satd. Flow (perm) 3104Peak-hour factor, PHF 0.91 0.91 0.91 0.91 0.91Adj. Flow (vph) 120 31 210 177 0RTOR Reduction (vph) 0 0 0 0 0Lane Group Flow (vph) 0 0 387 0 0Turn Type Prot PermProtected Phases 9Permitted Phases 9Actuated Green, G (s) 15.0Effective Green, g (s) 15.0Actuated g/C Ratio 0.16Clearance Time (s) 4.0Vehicle Extension (s) 3.0Lane Grp Cap (vph) 481v/s Ratio Prot c0.12v/s Ratio Permv/c Ratio 0.80Uniform Delay, d1 39.4Progression Factor 1.00Incremental Delay, d2 9.5Delay (s) 48.8Level of Service DApproach Delay (s) 48.8Approach LOS D
Intersection Summary
Agenda item No. 3
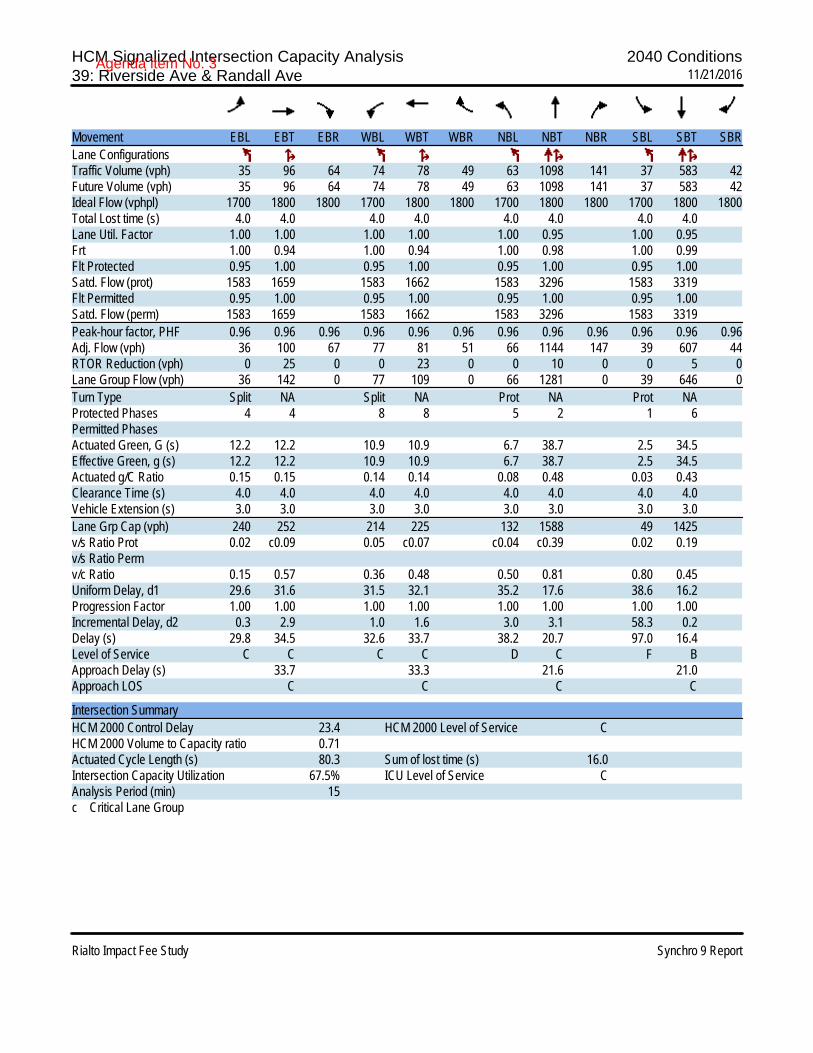
HCM Signalized Intersection Capacity Analysis 2040 Conditions39: Riverside Ave & Randall Ave 11/21/2016
Rialto Impact Fee Study Synchro 9 Report
Movement EBL EBT EBR WBL WBT WBR NBL NBT NBR SBL SBT SBRLane ConfigurationsTraffic Volume (vph) 35 96 64 74 78 49 63 1098 141 37 583 42Future Volume (vph) 35 96 64 74 78 49 63 1098 141 37 583 42Ideal Flow (vphpl) 1700 1800 1800 1700 1800 1800 1700 1800 1800 1700 1800 1800Total Lost time (s) 4.0 4.0 4.0 4.0 4.0 4.0 4.0 4.0Lane Util. Factor 1.00 1.00 1.00 1.00 1.00 0.95 1.00 0.95Frt 1.00 0.94 1.00 0.94 1.00 0.98 1.00 0.99Flt Protected 0.95 1.00 0.95 1.00 0.95 1.00 0.95 1.00Satd. Flow (prot) 1583 1659 1583 1662 1583 3296 1583 3319Flt Permitted 0.95 1.00 0.95 1.00 0.95 1.00 0.95 1.00Satd. Flow (perm) 1583 1659 1583 1662 1583 3296 1583 3319Peak-hour factor, PHF 0.96 0.96 0.96 0.96 0.96 0.96 0.96 0.96 0.96 0.96 0.96 0.96Adj. Flow (vph) 36 100 67 77 81 51 66 1144 147 39 607 44RTOR Reduction (vph) 0 25 0 0 23 0 0 10 0 0 5 0Lane Group Flow (vph) 36 142 0 77 109 0 66 1281 0 39 646 0Turn Type Split NA Split NA Prot NA Prot NAProtected Phases 4 4 8 8 5 2 1 6Permitted PhasesActuated Green, G (s) 12.2 12.2 10.9 10.9 6.7 38.7 2.5 34.5Effective Green, g (s) 12.2 12.2 10.9 10.9 6.7 38.7 2.5 34.5Actuated g/C Ratio 0.15 0.15 0.14 0.14 0.08 0.48 0.03 0.43Clearance Time (s) 4.0 4.0 4.0 4.0 4.0 4.0 4.0 4.0Vehicle Extension (s) 3.0 3.0 3.0 3.0 3.0 3.0 3.0 3.0Lane Grp Cap (vph) 240 252 214 225 132 1588 49 1425v/s Ratio Prot 0.02 c0.09 0.05 c0.07 c0.04 c0.39 0.02 0.19v/s Ratio Permv/c Ratio 0.15 0.57 0.36 0.48 0.50 0.81 0.80 0.45Uniform Delay, d1 29.6 31.6 31.5 32.1 35.2 17.6 38.6 16.2Progression Factor 1.00 1.00 1.00 1.00 1.00 1.00 1.00 1.00Incremental Delay, d2 0.3 2.9 1.0 1.6 3.0 3.1 58.3 0.2Delay (s) 29.8 34.5 32.6 33.7 38.2 20.7 97.0 16.4Level of Service C C C C D C F BApproach Delay (s) 33.7 33.3 21.6 21.0Approach LOS C C C C
Intersection SummaryHCM 2000 Control Delay 23.4 HCM 2000 Level of Service CHCM 2000 Volume to Capacity ratio 0.71Actuated Cycle Length (s) 80.3 Sum of lost time (s) 16.0Intersection Capacity Utilization 67.5% ICU Level of Service CAnalysis Period (min) 15c Critical Lane Group
Agenda item No. 3

HCM Signalized Intersection Capacity Analysis 2040 Conditions40: Riverside Ave & San Bernardinio Ave 11/21/2016
Rialto Impact Fee Study Synchro 9 Report
Movement EBL EBT EBR WBL WBT WBR NBL NBT NBR SBL SBT SBRLane ConfigurationsTraffic Volume (vph) 82 296 138 222 191 94 206 1039 417 85 394 38Future Volume (vph) 82 296 138 222 191 94 206 1039 417 85 394 38Ideal Flow (vphpl) 1700 1800 1800 1700 1800 1800 1700 1800 1800 1700 1800 1800Total Lost time (s) 4.0 4.0 4.0 4.0 4.0 4.0 4.0 4.0 4.0Lane Util. Factor 1.00 1.00 1.00 1.00 1.00 1.00 0.95 1.00 0.95Frt 1.00 0.95 1.00 1.00 0.85 1.00 0.96 1.00 0.99Flt Protected 0.95 1.00 0.95 1.00 1.00 0.95 1.00 0.95 1.00Satd. Flow (prot) 1583 1680 1583 1765 1500 1583 3209 1583 3308Flt Permitted 0.95 1.00 0.95 1.00 1.00 0.95 1.00 0.95 1.00Satd. Flow (perm) 1583 1680 1583 1765 1500 1583 3209 1583 3308Peak-hour factor, PHF 0.98 0.98 0.98 0.98 0.98 0.98 0.98 0.98 0.98 0.98 0.98 0.98Adj. Flow (vph) 84 302 141 227 195 96 210 1060 426 87 402 39RTOR Reduction (vph) 0 17 0 0 0 69 0 43 0 0 7 0Lane Group Flow (vph) 84 426 0 227 195 27 210 1443 0 87 434 0Turn Type Prot NA Prot NA Perm Prot NA Prot NAProtected Phases 7 4 3 8 5 2 1 6Permitted Phases 8Actuated Green, G (s) 8.3 22.8 14.0 28.5 28.5 18.0 42.0 6.0 30.0Effective Green, g (s) 8.3 22.8 14.0 28.5 28.5 18.0 42.0 6.0 30.0Actuated g/C Ratio 0.08 0.23 0.14 0.28 0.28 0.18 0.42 0.06 0.30Clearance Time (s) 4.0 4.0 4.0 4.0 4.0 4.0 4.0 4.0 4.0Vehicle Extension (s) 3.0 3.0 3.0 3.0 3.0 3.0 3.0 3.0 3.0Lane Grp Cap (vph) 130 380 219 499 424 282 1337 94 984v/s Ratio Prot 0.05 c0.25 c0.14 0.11 c0.13 c0.45 0.05 0.13v/s Ratio Perm 0.02v/c Ratio 0.65 1.12 1.04 0.39 0.06 0.74 1.08 0.93 0.44Uniform Delay, d1 44.8 39.0 43.4 29.1 26.4 39.2 29.4 47.2 28.6Progression Factor 1.00 1.00 1.00 1.00 1.00 1.00 1.00 1.00 1.00Incremental Delay, d2 10.5 83.2 70.7 0.5 0.1 10.2 49.0 68.3 0.3Delay (s) 55.4 122.2 114.1 29.7 26.5 49.4 78.4 115.5 28.9Level of Service E F F C C D E F CApproach Delay (s) 111.5 66.1 74.8 43.2Approach LOS F E E D
Intersection SummaryHCM 2000 Control Delay 74.2 HCM 2000 Level of Service EHCM 2000 Volume to Capacity ratio 1.07Actuated Cycle Length (s) 100.8 Sum of lost time (s) 16.0Intersection Capacity Utilization 102.1% ICU Level of Service GAnalysis Period (min) 15c Critical Lane Group
Agenda item No. 3

HCM Signalized Intersection Capacity Analysis 2040 Conditions41: Riverside Ave & Valley Blvd 11/21/2016
Rialto Impact Fee Study Synchro 9 Report
Movement EBL EBT EBR WBL WBT WBR NBL NBT NBR SBL SBT SBRLane ConfigurationsTraffic Volume (vph) 100 261 637 264 239 67 899 1514 516 65 685 45Future Volume (vph) 100 261 637 264 239 67 899 1514 516 65 685 45Ideal Flow (vphpl) 1700 1800 1800 1700 1800 1800 1600 1800 1800 1700 1800 1800Total Lost time (s) 4.0 4.0 4.0 4.0 4.0 4.0 4.0 4.0 4.0 4.0Lane Util. Factor 1.00 0.95 1.00 1.00 0.95 1.00 0.97 0.91 1.00 0.91Frt 1.00 1.00 0.85 1.00 1.00 0.85 1.00 0.96 1.00 0.99Flt Protected 0.95 1.00 1.00 0.95 1.00 1.00 0.95 1.00 0.95 1.00Satd. Flow (prot) 1583 3353 1500 1583 3353 1500 2891 4634 1583 4773Flt Permitted 0.95 1.00 1.00 0.95 1.00 1.00 0.95 1.00 0.95 1.00Satd. Flow (perm) 1583 3353 1500 1583 3353 1500 2891 4634 1583 4773Peak-hour factor, PHF 0.98 0.98 0.98 0.98 0.98 0.98 0.98 0.98 0.98 0.98 0.98 0.98Adj. Flow (vph) 102 266 650 269 244 68 917 1545 527 66 699 46RTOR Reduction (vph) 0 0 441 0 0 51 0 62 0 0 7 0Lane Group Flow (vph) 102 266 209 269 244 17 917 2010 0 66 738 0Turn Type Prot NA Perm Prot NA Perm Prot NA Prot NAProtected Phases 7 4 3 8 5 2 1 6Permitted Phases 4 8Actuated Green, G (s) 9.4 17.0 17.0 17.0 24.6 24.6 31.0 45.0 5.0 19.0Effective Green, g (s) 9.4 17.0 17.0 17.0 24.6 24.6 31.0 45.0 5.0 19.0Actuated g/C Ratio 0.09 0.17 0.17 0.17 0.25 0.25 0.31 0.45 0.05 0.19Clearance Time (s) 4.0 4.0 4.0 4.0 4.0 4.0 4.0 4.0 4.0 4.0Vehicle Extension (s) 3.0 3.0 3.0 3.0 3.0 3.0 3.0 3.0 3.0 3.0Lane Grp Cap (vph) 148 570 255 269 824 369 896 2085 79 906v/s Ratio Prot 0.06 0.08 c0.17 0.07 c0.32 c0.43 0.04 0.15v/s Ratio Perm c0.14 0.01v/c Ratio 0.69 0.47 0.82 1.00 0.30 0.05 1.02 0.96 0.84 0.81Uniform Delay, d1 43.9 37.4 40.0 41.5 30.7 28.7 34.5 26.7 47.1 38.8Progression Factor 1.00 1.00 1.00 1.00 1.00 1.00 1.00 1.00 1.00 1.00Incremental Delay, d2 12.6 0.6 18.7 54.9 0.2 0.1 36.1 12.3 50.2 5.7Delay (s) 56.5 38.0 58.7 96.4 30.9 28.8 70.6 39.0 97.3 44.5Level of Service E D E F C C E D F DApproach Delay (s) 53.1 61.0 48.7 48.8Approach LOS D E D D
Intersection SummaryHCM 2000 Control Delay 50.9 HCM 2000 Level of Service DHCM 2000 Volume to Capacity ratio 0.99Actuated Cycle Length (s) 100.0 Sum of lost time (s) 16.0Intersection Capacity Utilization 84.4% ICU Level of Service EAnalysis Period (min) 15c Critical Lane Group
Agenda item No. 3
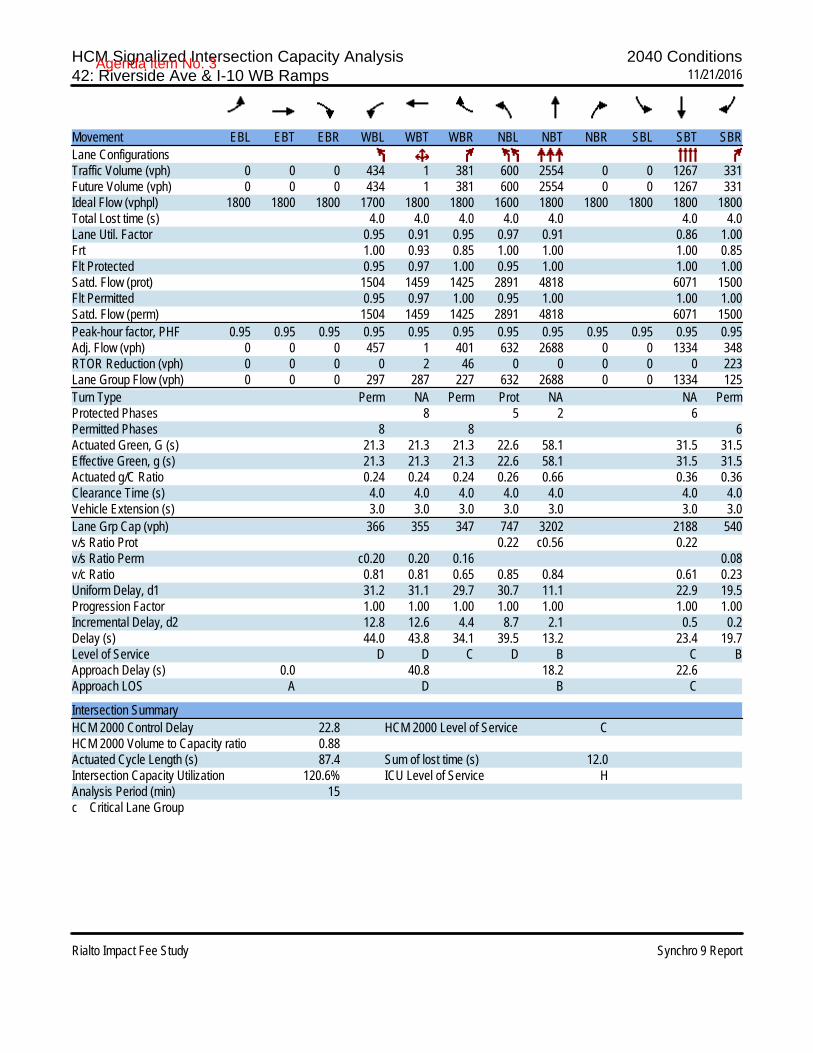
HCM Signalized Intersection Capacity Analysis 2040 Conditions42: Riverside Ave & I-10 WB Ramps 11/21/2016
Rialto Impact Fee Study Synchro 9 Report
Movement EBL EBT EBR WBL WBT WBR NBL NBT NBR SBL SBT SBRLane ConfigurationsTraffic Volume (vph) 0 0 0 434 1 381 600 2554 0 0 1267 331Future Volume (vph) 0 0 0 434 1 381 600 2554 0 0 1267 331Ideal Flow (vphpl) 1800 1800 1800 1700 1800 1800 1600 1800 1800 1800 1800 1800Total Lost time (s) 4.0 4.0 4.0 4.0 4.0 4.0 4.0Lane Util. Factor 0.95 0.91 0.95 0.97 0.91 0.86 1.00Frt 1.00 0.93 0.85 1.00 1.00 1.00 0.85Flt Protected 0.95 0.97 1.00 0.95 1.00 1.00 1.00Satd. Flow (prot) 1504 1459 1425 2891 4818 6071 1500Flt Permitted 0.95 0.97 1.00 0.95 1.00 1.00 1.00Satd. Flow (perm) 1504 1459 1425 2891 4818 6071 1500Peak-hour factor, PHF 0.95 0.95 0.95 0.95 0.95 0.95 0.95 0.95 0.95 0.95 0.95 0.95Adj. Flow (vph) 0 0 0 457 1 401 632 2688 0 0 1334 348RTOR Reduction (vph) 0 0 0 0 2 46 0 0 0 0 0 223Lane Group Flow (vph) 0 0 0 297 287 227 632 2688 0 0 1334 125Turn Type Perm NA Perm Prot NA NA PermProtected Phases 8 5 2 6Permitted Phases 8 8 6Actuated Green, G (s) 21.3 21.3 21.3 22.6 58.1 31.5 31.5Effective Green, g (s) 21.3 21.3 21.3 22.6 58.1 31.5 31.5Actuated g/C Ratio 0.24 0.24 0.24 0.26 0.66 0.36 0.36Clearance Time (s) 4.0 4.0 4.0 4.0 4.0 4.0 4.0Vehicle Extension (s) 3.0 3.0 3.0 3.0 3.0 3.0 3.0Lane Grp Cap (vph) 366 355 347 747 3202 2188 540v/s Ratio Prot 0.22 c0.56 0.22v/s Ratio Perm c0.20 0.20 0.16 0.08v/c Ratio 0.81 0.81 0.65 0.85 0.84 0.61 0.23Uniform Delay, d1 31.2 31.1 29.7 30.7 11.1 22.9 19.5Progression Factor 1.00 1.00 1.00 1.00 1.00 1.00 1.00Incremental Delay, d2 12.8 12.6 4.4 8.7 2.1 0.5 0.2Delay (s) 44.0 43.8 34.1 39.5 13.2 23.4 19.7Level of Service D D C D B C BApproach Delay (s) 0.0 40.8 18.2 22.6Approach LOS A D B C
Intersection SummaryHCM 2000 Control Delay 22.8 HCM 2000 Level of Service CHCM 2000 Volume to Capacity ratio 0.88Actuated Cycle Length (s) 87.4 Sum of lost time (s) 12.0Intersection Capacity Utilization 120.6% ICU Level of Service HAnalysis Period (min) 15c Critical Lane Group
Agenda item No. 3
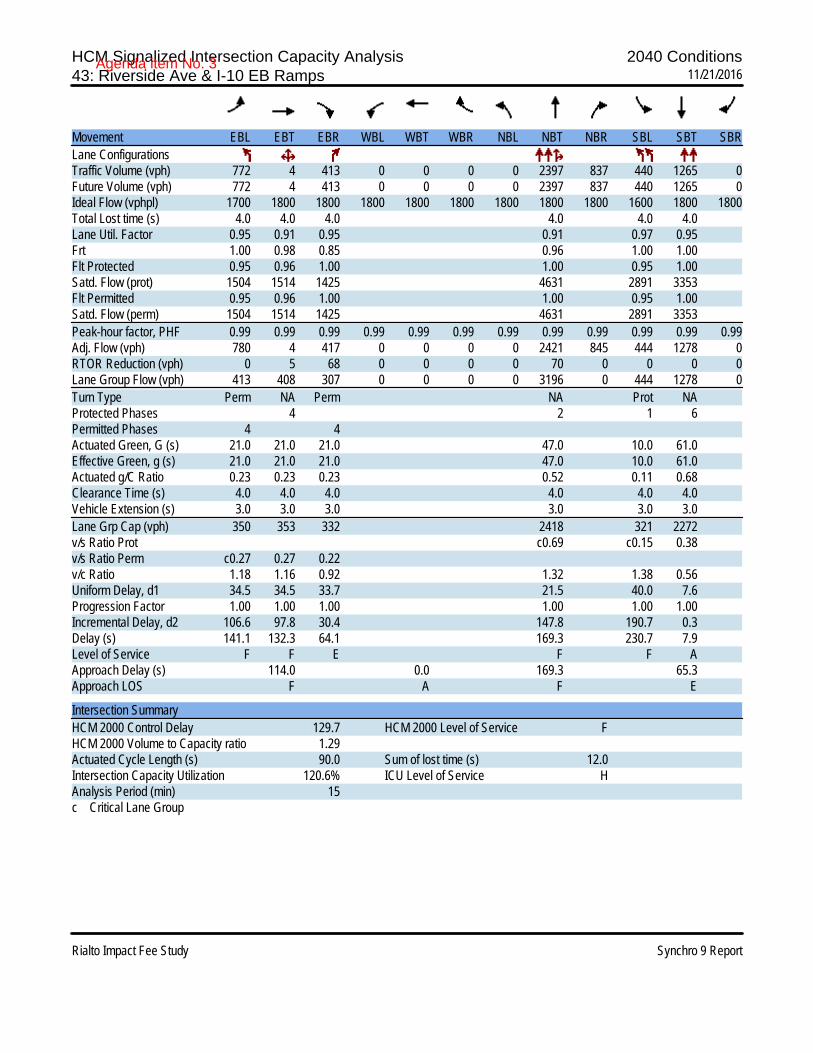
HCM Signalized Intersection Capacity Analysis 2040 Conditions43: Riverside Ave & I-10 EB Ramps 11/21/2016
Rialto Impact Fee Study Synchro 9 Report
Movement EBL EBT EBR WBL WBT WBR NBL NBT NBR SBL SBT SBRLane ConfigurationsTraffic Volume (vph) 772 4 413 0 0 0 0 2397 837 440 1265 0Future Volume (vph) 772 4 413 0 0 0 0 2397 837 440 1265 0Ideal Flow (vphpl) 1700 1800 1800 1800 1800 1800 1800 1800 1800 1600 1800 1800Total Lost time (s) 4.0 4.0 4.0 4.0 4.0 4.0Lane Util. Factor 0.95 0.91 0.95 0.91 0.97 0.95Frt 1.00 0.98 0.85 0.96 1.00 1.00Flt Protected 0.95 0.96 1.00 1.00 0.95 1.00Satd. Flow (prot) 1504 1514 1425 4631 2891 3353Flt Permitted 0.95 0.96 1.00 1.00 0.95 1.00Satd. Flow (perm) 1504 1514 1425 4631 2891 3353Peak-hour factor, PHF 0.99 0.99 0.99 0.99 0.99 0.99 0.99 0.99 0.99 0.99 0.99 0.99Adj. Flow (vph) 780 4 417 0 0 0 0 2421 845 444 1278 0RTOR Reduction (vph) 0 5 68 0 0 0 0 70 0 0 0 0Lane Group Flow (vph) 413 408 307 0 0 0 0 3196 0 444 1278 0Turn Type Perm NA Perm NA Prot NAProtected Phases 4 2 1 6Permitted Phases 4 4Actuated Green, G (s) 21.0 21.0 21.0 47.0 10.0 61.0Effective Green, g (s) 21.0 21.0 21.0 47.0 10.0 61.0Actuated g/C Ratio 0.23 0.23 0.23 0.52 0.11 0.68Clearance Time (s) 4.0 4.0 4.0 4.0 4.0 4.0Vehicle Extension (s) 3.0 3.0 3.0 3.0 3.0 3.0Lane Grp Cap (vph) 350 353 332 2418 321 2272v/s Ratio Prot c0.69 c0.15 0.38v/s Ratio Perm c0.27 0.27 0.22v/c Ratio 1.18 1.16 0.92 1.32 1.38 0.56Uniform Delay, d1 34.5 34.5 33.7 21.5 40.0 7.6Progression Factor 1.00 1.00 1.00 1.00 1.00 1.00Incremental Delay, d2 106.6 97.8 30.4 147.8 190.7 0.3Delay (s) 141.1 132.3 64.1 169.3 230.7 7.9Level of Service F F E F F AApproach Delay (s) 114.0 0.0 169.3 65.3Approach LOS F A F E
Intersection SummaryHCM 2000 Control Delay 129.7 HCM 2000 Level of Service FHCM 2000 Volume to Capacity ratio 1.29Actuated Cycle Length (s) 90.0 Sum of lost time (s) 12.0Intersection Capacity Utilization 120.6% ICU Level of Service HAnalysis Period (min) 15c Critical Lane Group
Agenda item No. 3
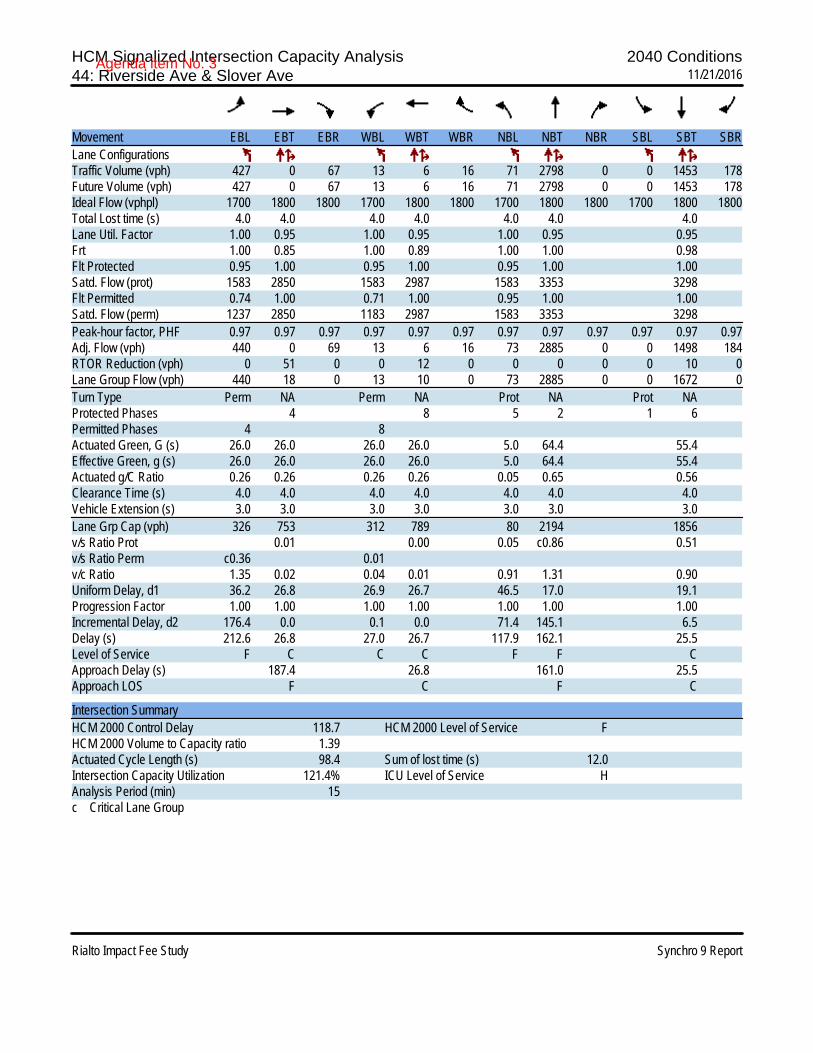
HCM Signalized Intersection Capacity Analysis 2040 Conditions44: Riverside Ave & Slover Ave 11/21/2016
Rialto Impact Fee Study Synchro 9 Report
Movement EBL EBT EBR WBL WBT WBR NBL NBT NBR SBL SBT SBRLane ConfigurationsTraffic Volume (vph) 427 0 67 13 6 16 71 2798 0 0 1453 178Future Volume (vph) 427 0 67 13 6 16 71 2798 0 0 1453 178Ideal Flow (vphpl) 1700 1800 1800 1700 1800 1800 1700 1800 1800 1700 1800 1800Total Lost time (s) 4.0 4.0 4.0 4.0 4.0 4.0 4.0Lane Util. Factor 1.00 0.95 1.00 0.95 1.00 0.95 0.95Frt 1.00 0.85 1.00 0.89 1.00 1.00 0.98Flt Protected 0.95 1.00 0.95 1.00 0.95 1.00 1.00Satd. Flow (prot) 1583 2850 1583 2987 1583 3353 3298Flt Permitted 0.74 1.00 0.71 1.00 0.95 1.00 1.00Satd. Flow (perm) 1237 2850 1183 2987 1583 3353 3298Peak-hour factor, PHF 0.97 0.97 0.97 0.97 0.97 0.97 0.97 0.97 0.97 0.97 0.97 0.97Adj. Flow (vph) 440 0 69 13 6 16 73 2885 0 0 1498 184RTOR Reduction (vph) 0 51 0 0 12 0 0 0 0 0 10 0Lane Group Flow (vph) 440 18 0 13 10 0 73 2885 0 0 1672 0Turn Type Perm NA Perm NA Prot NA Prot NAProtected Phases 4 8 5 2 1 6Permitted Phases 4 8Actuated Green, G (s) 26.0 26.0 26.0 26.0 5.0 64.4 55.4Effective Green, g (s) 26.0 26.0 26.0 26.0 5.0 64.4 55.4Actuated g/C Ratio 0.26 0.26 0.26 0.26 0.05 0.65 0.56Clearance Time (s) 4.0 4.0 4.0 4.0 4.0 4.0 4.0Vehicle Extension (s) 3.0 3.0 3.0 3.0 3.0 3.0 3.0Lane Grp Cap (vph) 326 753 312 789 80 2194 1856v/s Ratio Prot 0.01 0.00 0.05 c0.86 0.51v/s Ratio Perm c0.36 0.01v/c Ratio 1.35 0.02 0.04 0.01 0.91 1.31 0.90Uniform Delay, d1 36.2 26.8 26.9 26.7 46.5 17.0 19.1Progression Factor 1.00 1.00 1.00 1.00 1.00 1.00 1.00Incremental Delay, d2 176.4 0.0 0.1 0.0 71.4 145.1 6.5Delay (s) 212.6 26.8 27.0 26.7 117.9 162.1 25.5Level of Service F C C C F F CApproach Delay (s) 187.4 26.8 161.0 25.5Approach LOS F C F C
Intersection SummaryHCM 2000 Control Delay 118.7 HCM 2000 Level of Service FHCM 2000 Volume to Capacity ratio 1.39Actuated Cycle Length (s) 98.4 Sum of lost time (s) 12.0Intersection Capacity Utilization 121.4% ICU Level of Service HAnalysis Period (min) 15c Critical Lane Group
Agenda item No. 3

HCM Signalized Intersection Capacity Analysis 2040 Conditions45: Riverside Ave & Jurupa Ave 11/21/2016
Rialto Impact Fee Study Synchro 9 Report
Movement EBL EBR NBL NBT SBT SBRLane ConfigurationsTraffic Volume (vph) 61 135 213 2506 1557 105Future Volume (vph) 61 135 213 2506 1557 105Ideal Flow (vphpl) 1700 1800 1700 1800 1800 1800Total Lost time (s) 4.0 4.0 4.0 4.0 4.0Lane Util. Factor 1.00 1.00 1.00 0.91 0.95Frt 1.00 0.85 1.00 1.00 0.99Flt Protected 0.95 1.00 0.95 1.00 1.00Satd. Flow (prot) 1583 1500 1583 4818 3321Flt Permitted 0.95 1.00 0.95 1.00 1.00Satd. Flow (perm) 1583 1500 1583 4818 3321Peak-hour factor, PHF 0.97 0.97 0.97 0.97 0.97 0.97Adj. Flow (vph) 63 139 220 2584 1605 108RTOR Reduction (vph) 0 124 0 0 5 0Lane Group Flow (vph) 63 15 220 2584 1708 0Turn Type Prot Perm Prot NA NAProtected Phases 4 5 2 6Permitted Phases 4Actuated Green, G (s) 8.6 8.6 13.8 65.3 47.5Effective Green, g (s) 8.6 8.6 13.8 65.3 47.5Actuated g/C Ratio 0.11 0.11 0.17 0.80 0.58Clearance Time (s) 4.0 4.0 4.0 4.0 4.0Vehicle Extension (s) 3.0 3.0 3.0 3.0 3.0Lane Grp Cap (vph) 166 157 266 3841 1926v/s Ratio Prot c0.04 c0.14 0.54 c0.51v/s Ratio Perm 0.01v/c Ratio 0.38 0.09 0.83 0.67 0.89Uniform Delay, d1 34.2 33.1 32.9 3.6 14.9Progression Factor 1.00 1.00 1.00 1.00 1.00Incremental Delay, d2 1.5 0.3 18.6 0.5 5.4Delay (s) 35.6 33.4 51.5 4.1 20.2Level of Service D C D A CApproach Delay (s) 34.1 7.8 20.2Approach LOS C A C
Intersection SummaryHCM 2000 Control Delay 13.4 HCM 2000 Level of Service BHCM 2000 Volume to Capacity ratio 0.81Actuated Cycle Length (s) 81.9 Sum of lost time (s) 12.0Intersection Capacity Utilization 75.9% ICU Level of Service DAnalysis Period (min) 15c Critical Lane Group
Agenda item No. 3

HCM Signalized Intersection Capacity Analysis 2040 Conditions46: Riverside Ave & Agua Mansa Rd 11/21/2016
Rialto Impact Fee Study Synchro 9 Report
Movement EBL EBT EBR WBL WBT WBR NBL NBT NBR SBL SBT SBRLane ConfigurationsTraffic Volume (vph) 274 751 150 127 224 105 184 2172 288 94 1332 116Future Volume (vph) 274 751 150 127 224 105 184 2172 288 94 1332 116Ideal Flow (vphpl) 1700 1800 1800 1700 1800 1800 1700 1800 1800 1700 1800 1800Total Lost time (s) 4.0 4.0 4.0 4.0 4.0 4.0 4.0 4.0 4.0 4.0 4.0Lane Util. Factor 1.00 1.00 1.00 1.00 1.00 1.00 1.00 0.95 1.00 0.95 1.00Frt 1.00 1.00 0.85 1.00 1.00 0.85 1.00 0.98 1.00 1.00 0.85Flt Protected 0.95 1.00 1.00 0.95 1.00 1.00 0.95 1.00 0.95 1.00 1.00Satd. Flow (prot) 1583 1765 1500 1583 1765 1500 1583 3294 1583 3353 1500Flt Permitted 0.95 1.00 1.00 0.95 1.00 1.00 0.95 1.00 0.95 1.00 1.00Satd. Flow (perm) 1583 1765 1500 1583 1765 1500 1583 3294 1583 3353 1500Peak-hour factor, PHF 0.96 0.96 0.96 0.96 0.96 0.96 0.96 0.96 0.96 0.96 0.96 0.96Adj. Flow (vph) 285 782 156 132 233 109 192 2262 300 98 1388 121RTOR Reduction (vph) 0 0 71 0 0 92 0 10 0 0 0 71Lane Group Flow (vph) 285 782 85 132 233 17 192 2553 0 98 1388 50Turn Type Prot NA Perm Prot NA Perm Prot NA Prot NA PermProtected Phases 7 4 3 8 5 2 1 6Permitted Phases 4 8 6Actuated Green, G (s) 19.0 29.0 29.0 6.0 16.0 16.0 8.0 45.0 4.0 41.0 41.0Effective Green, g (s) 19.0 29.0 29.0 6.0 16.0 16.0 8.0 45.0 4.0 41.0 41.0Actuated g/C Ratio 0.19 0.29 0.29 0.06 0.16 0.16 0.08 0.45 0.04 0.41 0.41Clearance Time (s) 4.0 4.0 4.0 4.0 4.0 4.0 4.0 4.0 4.0 4.0 4.0Vehicle Extension (s) 3.0 3.0 3.0 3.0 3.0 3.0 3.0 3.0 3.0 3.0 3.0Lane Grp Cap (vph) 300 511 435 94 282 240 126 1482 63 1374 615v/s Ratio Prot 0.18 c0.44 c0.08 0.13 c0.12 c0.77 0.06 0.41v/s Ratio Perm 0.06 0.01 0.03v/c Ratio 0.95 1.53 0.20 1.40 0.83 0.07 1.52 1.72 1.56 1.01 0.08Uniform Delay, d1 40.0 35.5 26.7 47.0 40.7 35.7 46.0 27.5 48.0 29.5 18.0Progression Factor 1.00 1.00 1.00 1.00 1.00 1.00 1.00 1.00 1.00 1.00 1.00Incremental Delay, d2 38.2 248.4 0.2 233.7 17.6 0.1 271.8 327.9 313.7 26.8 0.1Delay (s) 78.2 283.9 26.9 280.7 58.3 35.8 317.8 355.4 361.7 56.3 18.1Level of Service E F C F E D F F F E BApproach Delay (s) 203.2 115.1 352.8 72.1Approach LOS F F F E
Intersection SummaryHCM 2000 Control Delay 229.5 HCM 2000 Level of Service FHCM 2000 Volume to Capacity ratio 1.65Actuated Cycle Length (s) 100.0 Sum of lost time (s) 16.0Intersection Capacity Utilization 141.8% ICU Level of Service HAnalysis Period (min) 15c Critical Lane Group
Agenda item No. 3

HCM Signalized Intersection Capacity Analysis 2040 Conditions47: Acacia Ave & Base Line Rd 11/21/2016
Rialto Impact Fee Study Synchro 9 Report
Movement EBL EBT EBR WBL WBT WBR NBL NBT NBR SBL SBT SBRLane ConfigurationsTraffic Volume (vph) 33 834 118 40 786 35 44 125 52 26 100 26Future Volume (vph) 33 834 118 40 786 35 44 125 52 26 100 26Ideal Flow (vphpl) 1700 1800 1800 1700 1800 1800 1800 1800 1800 1800 1800 1800Total Lost time (s) 4.0 4.0 4.0 4.0 4.0 4.0Lane Util. Factor 1.00 0.95 1.00 0.95 1.00 1.00Frt 1.00 0.98 1.00 0.99 0.97 0.98Flt Protected 0.95 1.00 0.95 1.00 0.99 0.99Satd. Flow (prot) 1583 3290 1583 3332 1692 1709Flt Permitted 0.28 1.00 0.22 1.00 0.91 0.92Satd. Flow (perm) 469 3290 375 3332 1562 1590Peak-hour factor, PHF 0.94 0.94 0.94 0.94 0.94 0.94 0.94 0.94 0.94 0.94 0.94 0.94Adj. Flow (vph) 35 887 126 43 836 37 47 133 55 28 106 28RTOR Reduction (vph) 0 12 0 0 3 0 0 12 0 0 9 0Lane Group Flow (vph) 35 1001 0 43 870 0 0 223 0 0 153 0Turn Type Perm NA Perm NA Perm NA Perm NAProtected Phases 4 8 2 6Permitted Phases 4 8 2 6Actuated Green, G (s) 22.9 22.9 22.9 22.9 12.7 12.7Effective Green, g (s) 22.9 22.9 22.9 22.9 12.7 12.7Actuated g/C Ratio 0.53 0.53 0.53 0.53 0.29 0.29Clearance Time (s) 4.0 4.0 4.0 4.0 4.0 4.0Vehicle Extension (s) 3.0 3.0 3.0 3.0 3.0 3.0Lane Grp Cap (vph) 246 1728 196 1750 454 463v/s Ratio Prot c0.30 0.26v/s Ratio Perm 0.07 0.11 c0.14 0.10v/c Ratio 0.14 0.58 0.22 0.50 0.49 0.33Uniform Delay, d1 5.3 7.1 5.6 6.6 12.8 12.1Progression Factor 1.00 1.00 1.00 1.00 1.00 1.00Incremental Delay, d2 0.3 0.5 0.6 0.2 0.8 0.4Delay (s) 5.6 7.5 6.1 6.9 13.6 12.5Level of Service A A A A B BApproach Delay (s) 7.5 6.8 13.6 12.5Approach LOS A A B B
Intersection SummaryHCM 2000 Control Delay 8.2 HCM 2000 Level of Service AHCM 2000 Volume to Capacity ratio 0.55Actuated Cycle Length (s) 43.6 Sum of lost time (s) 8.0Intersection Capacity Utilization 59.8% ICU Level of Service BAnalysis Period (min) 15c Critical Lane Group
Agenda item No. 3
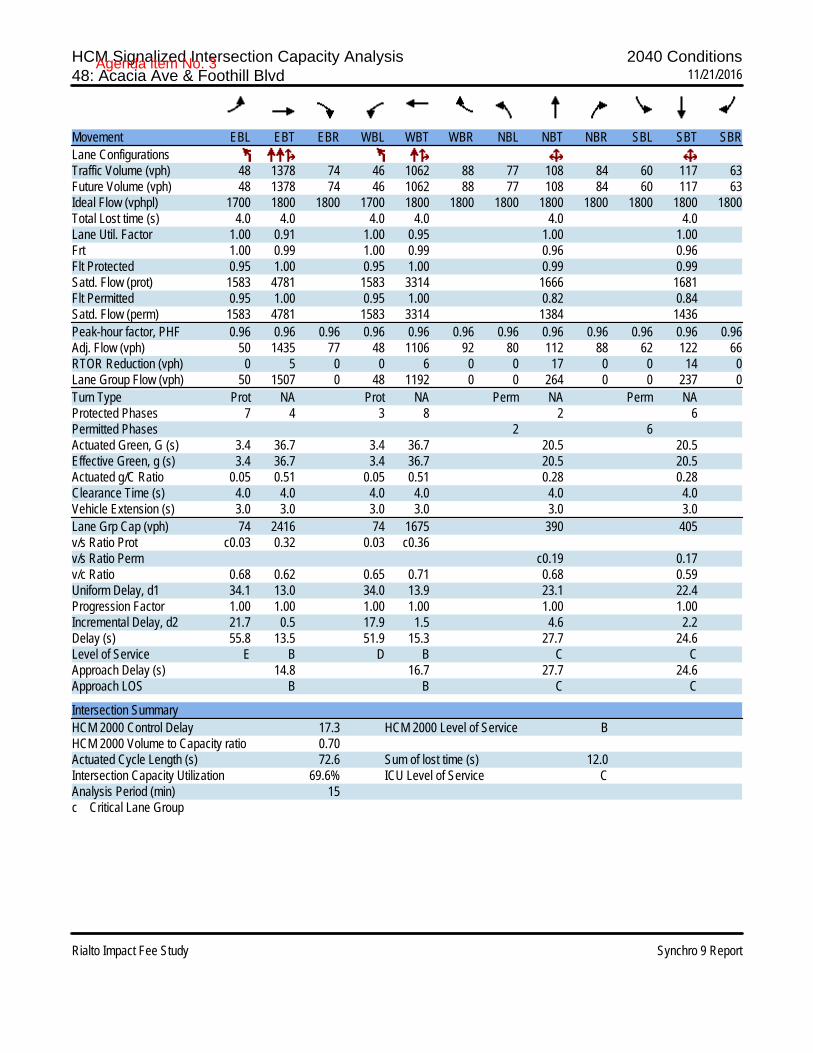
HCM Signalized Intersection Capacity Analysis 2040 Conditions48: Acacia Ave & Foothill Blvd 11/21/2016
Rialto Impact Fee Study Synchro 9 Report
Movement EBL EBT EBR WBL WBT WBR NBL NBT NBR SBL SBT SBRLane ConfigurationsTraffic Volume (vph) 48 1378 74 46 1062 88 77 108 84 60 117 63Future Volume (vph) 48 1378 74 46 1062 88 77 108 84 60 117 63Ideal Flow (vphpl) 1700 1800 1800 1700 1800 1800 1800 1800 1800 1800 1800 1800Total Lost time (s) 4.0 4.0 4.0 4.0 4.0 4.0Lane Util. Factor 1.00 0.91 1.00 0.95 1.00 1.00Frt 1.00 0.99 1.00 0.99 0.96 0.96Flt Protected 0.95 1.00 0.95 1.00 0.99 0.99Satd. Flow (prot) 1583 4781 1583 3314 1666 1681Flt Permitted 0.95 1.00 0.95 1.00 0.82 0.84Satd. Flow (perm) 1583 4781 1583 3314 1384 1436Peak-hour factor, PHF 0.96 0.96 0.96 0.96 0.96 0.96 0.96 0.96 0.96 0.96 0.96 0.96Adj. Flow (vph) 50 1435 77 48 1106 92 80 112 88 62 122 66RTOR Reduction (vph) 0 5 0 0 6 0 0 17 0 0 14 0Lane Group Flow (vph) 50 1507 0 48 1192 0 0 264 0 0 237 0Turn Type Prot NA Prot NA Perm NA Perm NAProtected Phases 7 4 3 8 2 6Permitted Phases 2 6Actuated Green, G (s) 3.4 36.7 3.4 36.7 20.5 20.5Effective Green, g (s) 3.4 36.7 3.4 36.7 20.5 20.5Actuated g/C Ratio 0.05 0.51 0.05 0.51 0.28 0.28Clearance Time (s) 4.0 4.0 4.0 4.0 4.0 4.0Vehicle Extension (s) 3.0 3.0 3.0 3.0 3.0 3.0Lane Grp Cap (vph) 74 2416 74 1675 390 405v/s Ratio Prot c0.03 0.32 0.03 c0.36v/s Ratio Perm c0.19 0.17v/c Ratio 0.68 0.62 0.65 0.71 0.68 0.59Uniform Delay, d1 34.1 13.0 34.0 13.9 23.1 22.4Progression Factor 1.00 1.00 1.00 1.00 1.00 1.00Incremental Delay, d2 21.7 0.5 17.9 1.5 4.6 2.2Delay (s) 55.8 13.5 51.9 15.3 27.7 24.6Level of Service E B D B C CApproach Delay (s) 14.8 16.7 27.7 24.6Approach LOS B B C C
Intersection SummaryHCM 2000 Control Delay 17.3 HCM 2000 Level of Service BHCM 2000 Volume to Capacity ratio 0.70Actuated Cycle Length (s) 72.6 Sum of lost time (s) 12.0Intersection Capacity Utilization 69.6% ICU Level of Service CAnalysis Period (min) 15c Critical Lane Group
Agenda item No. 3

HCM Signalized Intersection Capacity Analysis 2040 Conditions49: Pepper Ave & Base Line Rd 11/21/2016
Rialto Impact Fee Study Synchro 9 Report
Movement EBL EBT EBR WBL WBT WBR NBL NBT NBR SBL SBT SBRLane ConfigurationsTraffic Volume (vph) 275 430 208 30 317 110 258 687 64 319 379 348Future Volume (vph) 275 430 208 30 317 110 258 687 64 319 379 348Ideal Flow (vphpl) 1700 1800 1800 1700 1800 1800 1700 1800 1800 1700 1800 1800Total Lost time (s) 4.0 4.0 4.0 4.0 4.0 4.0 4.0 4.0Lane Util. Factor 1.00 0.95 1.00 0.95 1.00 0.95 1.00 0.95Frt 1.00 0.95 1.00 0.96 1.00 0.99 1.00 0.93Flt Protected 0.95 1.00 0.95 1.00 0.95 1.00 0.95 1.00Satd. Flow (prot) 1583 3189 1583 3223 1583 3310 1583 3112Flt Permitted 0.41 1.00 0.26 1.00 0.30 1.00 0.29 1.00Satd. Flow (perm) 678 3189 430 3223 508 3310 490 3112Peak-hour factor, PHF 0.94 0.94 0.94 0.94 0.94 0.94 0.94 0.94 0.94 0.94 0.94 0.94Adj. Flow (vph) 293 457 221 32 337 117 274 731 68 339 403 370RTOR Reduction (vph) 0 59 0 0 34 0 0 7 0 0 135 0Lane Group Flow (vph) 293 620 0 32 420 0 274 792 0 339 638 0Turn Type Perm NA Perm NA Perm NA Perm NAProtected Phases 4 8 2 6Permitted Phases 4 8 2 6Actuated Green, G (s) 35.0 35.0 35.0 35.0 57.0 57.0 57.0 57.0Effective Green, g (s) 35.0 35.0 35.0 35.0 57.0 57.0 57.0 57.0Actuated g/C Ratio 0.35 0.35 0.35 0.35 0.57 0.57 0.57 0.57Clearance Time (s) 4.0 4.0 4.0 4.0 4.0 4.0 4.0 4.0Vehicle Extension (s) 3.0 3.0 3.0 3.0 3.0 3.0 3.0 3.0Lane Grp Cap (vph) 237 1116 150 1128 289 1886 279 1773v/s Ratio Prot 0.19 0.13 0.24 0.21v/s Ratio Perm c0.43 0.07 0.54 c0.69v/c Ratio 1.24 0.56 0.21 0.37 0.95 0.42 1.22 0.36Uniform Delay, d1 32.5 26.2 22.8 24.3 20.1 12.2 21.5 11.6Progression Factor 1.00 1.00 1.00 1.00 1.00 1.00 1.00 1.00Incremental Delay, d2 137.1 0.6 0.7 0.2 41.2 0.7 125.0 0.6Delay (s) 169.6 26.8 23.5 24.5 61.3 12.8 146.5 12.2Level of Service F C C C E B F BApproach Delay (s) 69.9 24.4 25.2 53.1Approach LOS E C C D
Intersection SummaryHCM 2000 Control Delay 45.6 HCM 2000 Level of Service DHCM 2000 Volume to Capacity ratio 1.22Actuated Cycle Length (s) 100.0 Sum of lost time (s) 8.0Intersection Capacity Utilization 85.3% ICU Level of Service EAnalysis Period (min) 15c Critical Lane Group
Agenda item No. 3
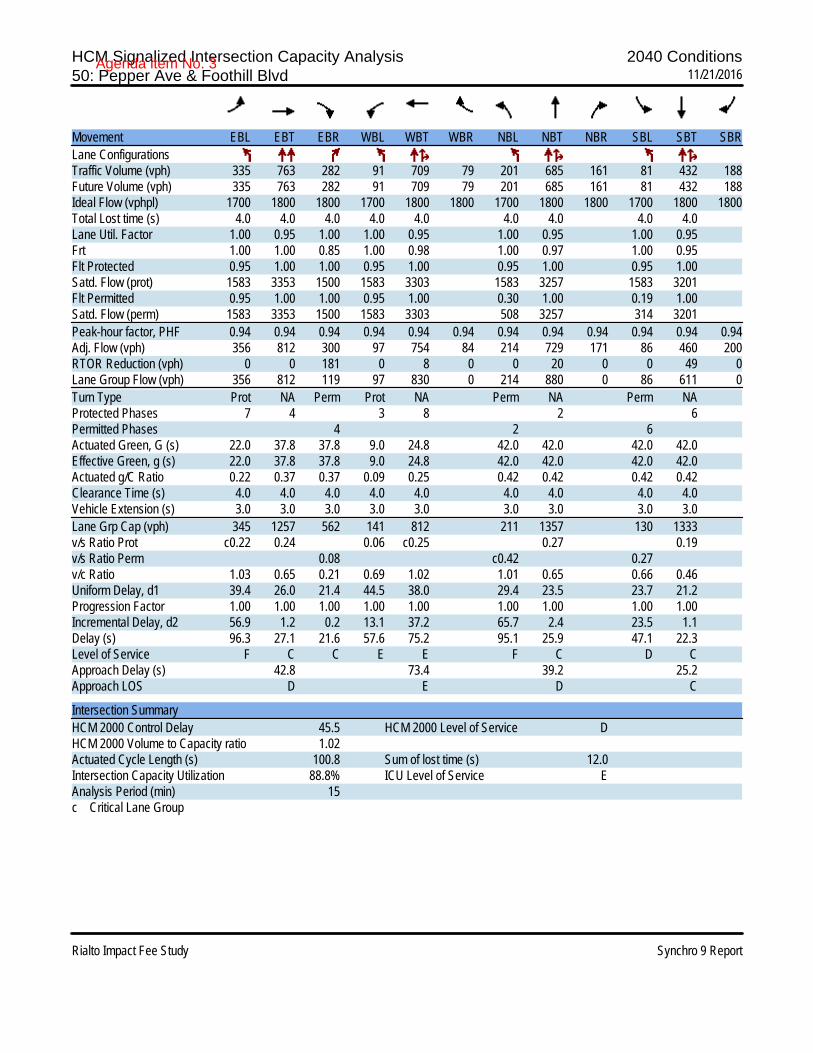
HCM Signalized Intersection Capacity Analysis 2040 Conditions50: Pepper Ave & Foothill Blvd 11/21/2016
Rialto Impact Fee Study Synchro 9 Report
Movement EBL EBT EBR WBL WBT WBR NBL NBT NBR SBL SBT SBRLane ConfigurationsTraffic Volume (vph) 335 763 282 91 709 79 201 685 161 81 432 188Future Volume (vph) 335 763 282 91 709 79 201 685 161 81 432 188Ideal Flow (vphpl) 1700 1800 1800 1700 1800 1800 1700 1800 1800 1700 1800 1800Total Lost time (s) 4.0 4.0 4.0 4.0 4.0 4.0 4.0 4.0 4.0Lane Util. Factor 1.00 0.95 1.00 1.00 0.95 1.00 0.95 1.00 0.95Frt 1.00 1.00 0.85 1.00 0.98 1.00 0.97 1.00 0.95Flt Protected 0.95 1.00 1.00 0.95 1.00 0.95 1.00 0.95 1.00Satd. Flow (prot) 1583 3353 1500 1583 3303 1583 3257 1583 3201Flt Permitted 0.95 1.00 1.00 0.95 1.00 0.30 1.00 0.19 1.00Satd. Flow (perm) 1583 3353 1500 1583 3303 508 3257 314 3201Peak-hour factor, PHF 0.94 0.94 0.94 0.94 0.94 0.94 0.94 0.94 0.94 0.94 0.94 0.94Adj. Flow (vph) 356 812 300 97 754 84 214 729 171 86 460 200RTOR Reduction (vph) 0 0 181 0 8 0 0 20 0 0 49 0Lane Group Flow (vph) 356 812 119 97 830 0 214 880 0 86 611 0Turn Type Prot NA Perm Prot NA Perm NA Perm NAProtected Phases 7 4 3 8 2 6Permitted Phases 4 2 6Actuated Green, G (s) 22.0 37.8 37.8 9.0 24.8 42.0 42.0 42.0 42.0Effective Green, g (s) 22.0 37.8 37.8 9.0 24.8 42.0 42.0 42.0 42.0Actuated g/C Ratio 0.22 0.37 0.37 0.09 0.25 0.42 0.42 0.42 0.42Clearance Time (s) 4.0 4.0 4.0 4.0 4.0 4.0 4.0 4.0 4.0Vehicle Extension (s) 3.0 3.0 3.0 3.0 3.0 3.0 3.0 3.0 3.0Lane Grp Cap (vph) 345 1257 562 141 812 211 1357 130 1333v/s Ratio Prot c0.22 0.24 0.06 c0.25 0.27 0.19v/s Ratio Perm 0.08 c0.42 0.27v/c Ratio 1.03 0.65 0.21 0.69 1.02 1.01 0.65 0.66 0.46Uniform Delay, d1 39.4 26.0 21.4 44.5 38.0 29.4 23.5 23.7 21.2Progression Factor 1.00 1.00 1.00 1.00 1.00 1.00 1.00 1.00 1.00Incremental Delay, d2 56.9 1.2 0.2 13.1 37.2 65.7 2.4 23.5 1.1Delay (s) 96.3 27.1 21.6 57.6 75.2 95.1 25.9 47.1 22.3Level of Service F C C E E F C D CApproach Delay (s) 42.8 73.4 39.2 25.2Approach LOS D E D C
Intersection SummaryHCM 2000 Control Delay 45.5 HCM 2000 Level of Service DHCM 2000 Volume to Capacity ratio 1.02Actuated Cycle Length (s) 100.8 Sum of lost time (s) 12.0Intersection Capacity Utilization 88.8% ICU Level of Service EAnalysis Period (min) 15c Critical Lane Group
Agenda item No. 3

Appendix
APPENDIX D: IMPROVEMENT COST ESTIMATES
Agenda item No. 3
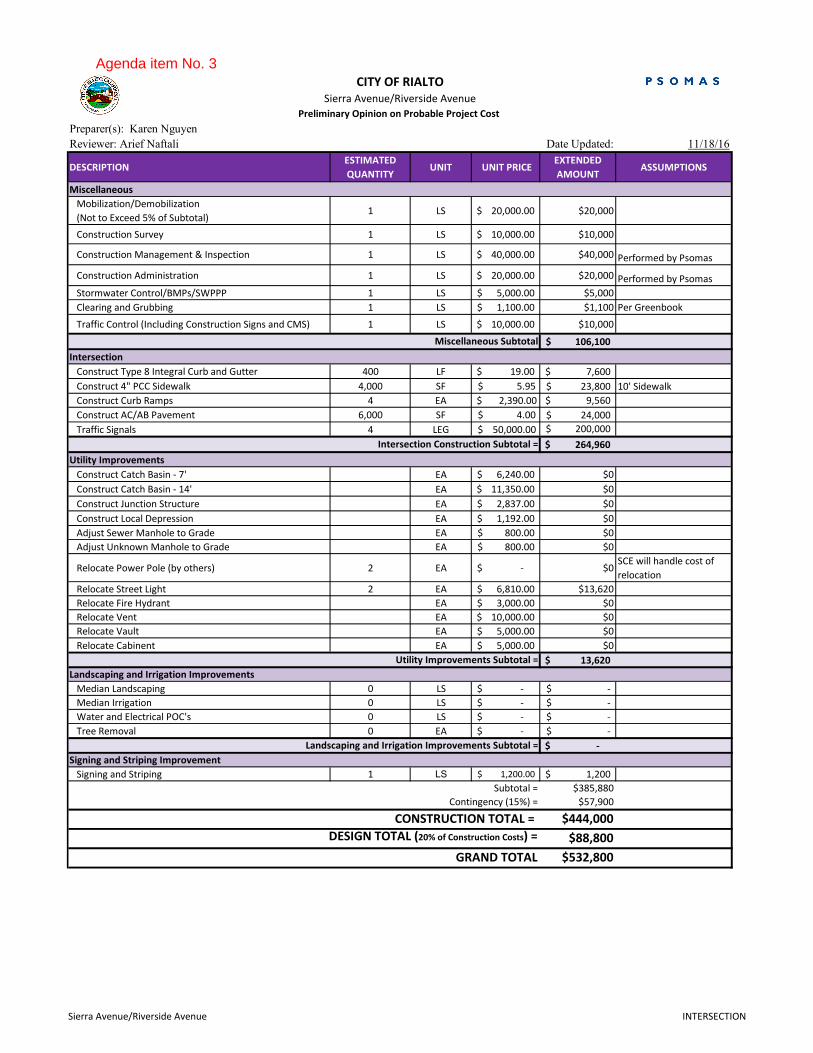
Preparer(s): Karen Nguyen
Reviewer: Arief Naftali Date Updated: 11/18/16
DESCRIPTIONESTIMATED
QUANTITYUNIT UNIT PRICE
EXTENDED
AMOUNTASSUMPTIONS
Mobilization/Demobilization
(Not to Exceed 5% of Subtotal)1 LS 20,000.00$ $20,000
Construction Survey 1 LS 10,000.00$ $10,000
Construction Management & Inspection 1 LS 40,000.00$ $40,000 Performed by Psomas
Construction Administration 1 LS 20,000.00$ $20,000 Performed by Psomas
Stormwater Control/BMPs/SWPPP 1 LS 5,000.00$ $5,000
Clearing and Grubbing 1 LS 1,100.00$ $1,100 Per Greenbook
Traffic Control (Including Construction Signs and CMS) 1 LS 10,000.00$ $10,000
106,100$
Construct Type 8 Integral Curb and Gutter 400 LF 19.00$ 7,600$
Construct 4" PCC Sidewalk 4,000 SF $ 5.95 23,800$ 10' Sidewalk
Construct Curb Ramps 4 EA $ 2,390.00 9,560$
Construct AC/AB Pavement 6,000 SF $ 4.00 24,000$
Traffic Signals 4 LEG $ 50,000.00 200,000$
264,960$
Construct Catch Basin - 7' EA 6,240.00$ $0
Construct Catch Basin - 14' EA 11,350.00$ $0
Construct Junction Structure EA 2,837.00$ $0
Construct Local Depression EA 1,192.00$ $0
Adjust Sewer Manhole to Grade EA 800.00$ $0
Adjust Unknown Manhole to Grade EA 800.00$ $0
Relocate Power Pole (by others) 2 EA -$ $0SCE will handle cost of
relocation
Relocate Street Light 2 EA 6,810.00$ $13,620
Relocate Fire Hydrant EA 3,000.00$ $0
Relocate Vent EA 10,000.00$ $0
Relocate Vault EA 5,000.00$ $0
Relocate Cabinent EA 5,000.00$ $0
13,620$
Median Landscaping 0 LS -$ -$
Median Irrigation 0 LS -$ -$
Water and Electrical POC's 0 LS -$ -$
Tree Removal 0 EA -$ -$
-$
Signing and Striping 1 LS 1,200.00$ 1,200$
Subtotal = $385,880
$57,900
CONSTRUCTION TOTAL = $444,000
DESIGN TOTAL (20% of Construction Costs) = $88,800
GRAND TOTAL $532,800
CITY OF RIALTO
Sierra Avenue/Riverside Avenue
Preliminary Opinion on Probable Project Cost
Miscellaneous
Contingency (15%) =
Intersection
Signing and Striping Improvement
Landscaping and Irrigation Improvements
Utility Improvements
Intersection Construction Subtotal =
Miscellaneous Subtotal
Utility Improvements Subtotal =
Landscaping and Irrigation Improvements Subtotal =
Sierra Avenue/Riverside Avenue INTERSECTION
Agenda item No. 3

Preparer(s): Karen Nguyen
Reviewer: Arief Naftali Date Updated: 11/18/16
DESCRIPTIONESTIMATED
QUANTITYUNIT UNIT PRICE
EXTENDED
AMOUNTASSUMPTIONS
Mobilization/Demobilization
(Not to Exceed 5% of Subtotal)1 LS 20,000.00$ 20,000$
Construction Survey 1 LS 10,000.00$ 10,000$
Construction Management & Inspection 1 LS 40,000.00$ 40,000$ Performed by Psomas
Construction Administration 1 LS 20,000.00$ 20,000$ Performed by Psomas
Stormwater Control/BMPs/SWPPP 1 LS 5,000.00$ 5,000$
Clearing and Grubbing 1 LS 400.00$ 400$ Per Greenbook
Traffic Control (Including Construction Signs and CMS) 1 LS 10,000.00$ 10,000$
105,400$
Construct Type 8 Integral Curb and Gutter 330 LF 19.00$ 6,270$
Construct 4" PCC Sidewalk 3,300 SF $ 5.95 19,635$ 10' Sidewalk
Construct Curb Ramps 3 EA $ 2,390.00 7,170$
Construct Ac/AB Pavement 4,700 SF $ 8.00 37,600$
Tentative ROW take 10,200 SF $ 15.00 153,000$
Traffic Signal Relocation Per Pole, PPB Pole 2 EA $ 3,225.00 6,450$
Traffic Signal Relocation Per Pole, 1A (10') Pole 4 EA $ 6,550.00 26,200$
Traffic Signal Relocation Per Pole, Pole With Mastarm 4 EA 13,100.00$ 52,400$
Relocate PB or Adj. Grade 14 EA 120.00$ 1,680$
Traffic Signal Loops 0 EA 450.00$ -$
310,405$
Construct Catch Basin - 7' 0 EA 6,240.00$ -$
Construct Catch Basin - 14' 0 EA 11,350.00$ -$
Construct Junction Structure 0 EA 2,837.00$ -$
Construct Local Depression 0 EA 1,192.00$ -$
Adjust Sewer Manhole to Grade 0 EA 800.00$ -$
Adjust Unknown Manhole to Grade 0 EA 800.00$ -$
Relocate Power Pole 4 EA -$ -$ SCE will handle cost of
relocation
Relocate Street Light 0 EA 6,810.00$ -$
Relocate Fire Hydrant 1 EA 3,000.00$ 3,000$
Relocate Vent 0 EA 10,000.00$ -$
Relocate Vault 0 EA 5,000.00$ -$
Relocate Cabinent 2 EA 5,000.00$ 10,000$
13,000$
Median Landscaping 0 LS -$ -$
Median Irrigation 0 LS -$ -$
Water and Electrical POC's 0 LS -$ -$
Tree Removal 0 EA -$ -$
-$
Signing and Striping 1 LS 4,000.00$ 4,000$
Subtotal = 432,805$
64,900$
CONSTRUCTION TOTAL = $498,000
DESIGN TOTAL (20% of Construction Costs) = $99,600
GRAND TOTAL $597,600
CITY OF RIALTO
Alder Avenue/Base Line Road
Preliminary Opinion on Probable Project Cost
Miscellaneous
Contingency (15%) =
Intersection
Signing and Striping Improvement
Landscaping and Irrigation Improvements
Utility Improvements
Intersection Construction Subtotal =
Miscellaneous Subtotal
Utility Improvements Subtotal =
Landscaping and Irrigation Improvements Subtotal =
Alder Avenue/Base Line Road INTERSECTION
Agenda item No. 3
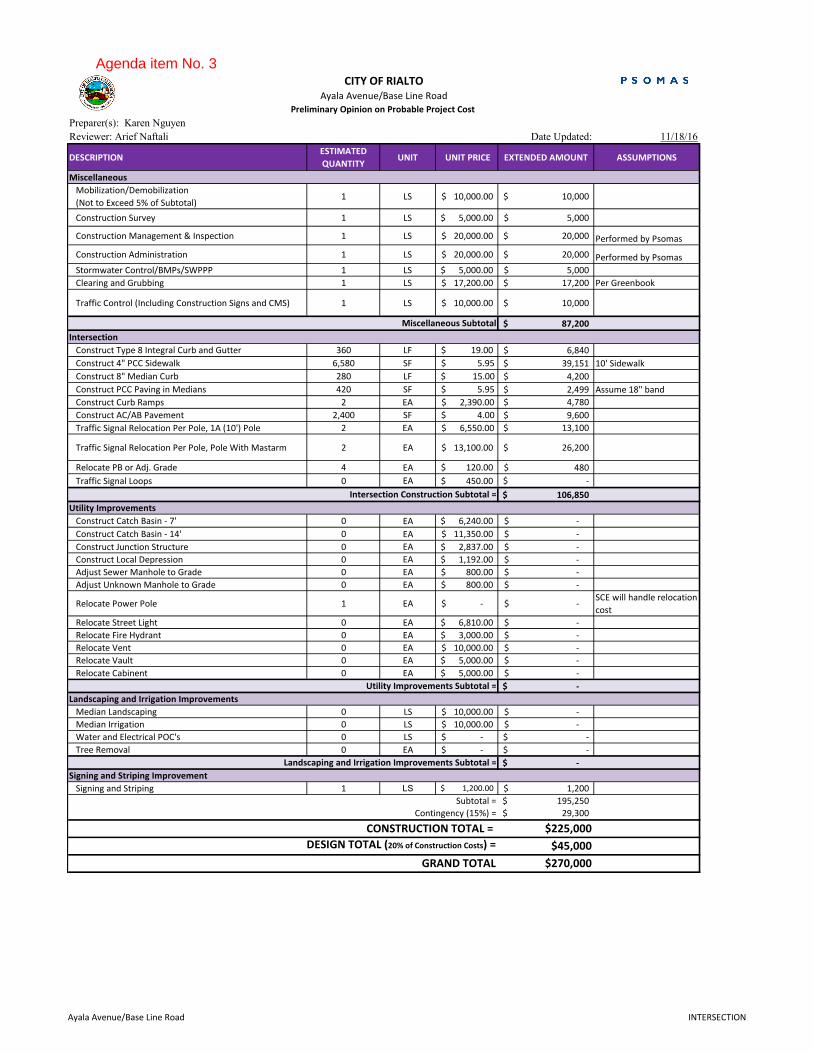
Preparer(s): Karen Nguyen
Reviewer: Arief Naftali Date Updated: 11/18/16
DESCRIPTIONESTIMATED
QUANTITYUNIT UNIT PRICE EXTENDED AMOUNT ASSUMPTIONS
Mobilization/Demobilization
(Not to Exceed 5% of Subtotal)1 LS 10,000.00$ 10,000$
Construction Survey 1 LS 5,000.00$ 5,000$
Construction Management & Inspection 1 LS 20,000.00$ 20,000$ Performed by Psomas
Construction Administration 1 LS 20,000.00$ 20,000$ Performed by Psomas
Stormwater Control/BMPs/SWPPP 1 LS 5,000.00$ 5,000$
Clearing and Grubbing 1 LS 17,200.00$ 17,200$ Per Greenbook
Traffic Control (Including Construction Signs and CMS) 1 LS 10,000.00$ 10,000$
87,200$
Construct Type 8 Integral Curb and Gutter 360 LF 19.00$ 6,840$
Construct 4" PCC Sidewalk 6,580 SF $ 5.95 39,151$ 10' Sidewalk
Construct 8" Median Curb 280 LF $ 15.00 4,200$
Construct PCC Paving in Medians 420 SF $ 5.95 2,499$ Assume 18" band
Construct Curb Ramps 2 EA $ 2,390.00 4,780$
Construct AC/AB Pavement 2,400 SF $ 4.00 9,600$
Traffic Signal Relocation Per Pole, 1A (10') Pole 2 EA $ 6,550.00 13,100$
Traffic Signal Relocation Per Pole, Pole With Mastarm 2 EA 13,100.00$ 26,200$
Relocate PB or Adj. Grade 4 EA 120.00$ 480$
Traffic Signal Loops 0 EA 450.00$ -$
106,850$
Construct Catch Basin - 7' 0 EA 6,240.00$ -$
Construct Catch Basin - 14' 0 EA 11,350.00$ -$
Construct Junction Structure 0 EA 2,837.00$ -$
Construct Local Depression 0 EA 1,192.00$ -$
Adjust Sewer Manhole to Grade 0 EA 800.00$ -$
Adjust Unknown Manhole to Grade 0 EA 800.00$ -$
Relocate Power Pole 1 EA -$ -$ SCE will handle relocation
cost
Relocate Street Light 0 EA 6,810.00$ -$
Relocate Fire Hydrant 0 EA 3,000.00$ -$
Relocate Vent 0 EA 10,000.00$ -$
Relocate Vault 0 EA 5,000.00$ -$
Relocate Cabinent 0 EA 5,000.00$ -$
-$
Median Landscaping 0 LS 10,000.00$ -$
Median Irrigation 0 LS 10,000.00$ -$
Water and Electrical POC's 0 LS -$ -$
Tree Removal 0 EA -$ -$
-$
Signing and Striping 1 LS 1,200.00$ 1,200$
Subtotal = 195,250$
29,300$
CONSTRUCTION TOTAL = $225,000
DESIGN TOTAL (20% of Construction Costs) = $45,000
GRAND TOTAL $270,000
Contingency (15%) =
Intersection
Signing and Striping Improvement
Landscaping and Irrigation Improvements
Utility Improvements
Intersection Construction Subtotal =
Miscellaneous Subtotal
Utility Improvements Subtotal =
Landscaping and Irrigation Improvements Subtotal =
CITY OF RIALTO
Ayala Avenue/Base Line Road
Preliminary Opinion on Probable Project Cost
Miscellaneous
Ayala Avenue/Base Line Road INTERSECTION
Agenda item No. 3

Preparer(s): Karen Nguyen
Reviewer: Arief Naftali Date Updated: 11/18/16
DESCRIPTIONESTIMATED
QUANTITYUNIT UNIT PRICE EXTENDED AMOUNT ASSUMPTIONS
Mobilization/Demobilization
(Not to Exceed 5% of Subtotal)1 LS 10,000.00$ 10,000$
Construction Survey 1 LS 5,000.00$ 5,000$
Construction Management & Inspection 1 LS 10,000.00$ 10,000$ Performed by Psomas
Construction Administration 1 LS 10,000.00$ 10,000$ Performed by Psomas
Stormwater Control/BMPs/SWPPP 1 LS 2,000.00$ 2,000$
Clearing and Grubbing 1 LS 4,600.00$ 4,600$ Per Greenbook
Traffic Control (Including Construction Signs and CMS) 1 LS 5,000.00$ 5,000$
46,600$
Construct Type 8 Integral Curb and Gutter 165 LF 19.00$ 3,135$
Construct 4" PCC Sidewalk 1,650 SF $ 5.95 9,818$ 10' Sidewalk
Construct Curb Ramps 1 EA $ 2,390.00 2,390$
Construct AC/AB Pavement 1,200 SF $ 4.00 4,800$
Tentative ROW Take 600 SF $ 15.00 9,000$
Traffic Signal Relocation Per Pole, 1A (10') Pole 1 EA $ 6,550.00 6,550$
Traffic Signal Relocation Per Pole, Pole With Mastarm 1 EA 13,100.00$ 13,100$
Relocate PB or Adj. Grade 4 EA 120.00$ 480$
Traffic Signal Loops 8 EA 450.00$ 3,600$
52,873$
Construct Catch Basin - 7' 0 EA 6,240.00$ -$
Construct Catch Basin - 14' 0 EA 11,350.00$ -$
Construct Junction Structure 0 EA 2,837.00$ -$
Construct Local Depression 0 EA 1,192.00$ -$
Adjust Sewer Manhole to Grade 0 EA 800.00$ -$
Adjust Unknown Manhole to Grade 3 EA 800.00$ 2,400$
Adjust Water Valve to Grade 5 EA 500.00$ 2,500$
Relocate Power Pole 1 EA -$ -$ SCE will handle relocation
cost
Relocate Street Light 0 EA 6,810.00$ -$
Relocate Fire Hydrant 1 EA 3,000.00$ 3,000$
Relocate Vent 0 EA 10,000.00$ -$
Relocate Vault 0 EA 5,000.00$ -$
Relocate Cabinent 2 EA 5,000.00$ 10,000$
17,900$
Median Landscaping 0 LS -$ -$
Median Irrigation 0 LS -$ -$
Water and Electrical POC's 0 LS -$ -$
Tree Removal 0 EA -$ -$
-$
Signing and Striping 1 LS 420.00$ 420$
Subtotal = 117,793$
17,700$
CONSTRUCTION TOTAL = $135,000
DESIGN TOTAL (20% of Construction Costs) = $27,000
GRAND TOTAL $162,000
CITY OF RIALTO
Cedar Avenue/Rialto Avenue
Preliminary Opinion on Probable Project Cost
Miscellaneous
Contingency (15%) =
Intersection
Signing and Striping Improvement
Landscaping and Irrigation Improvements
Utility Improvements
Intersection Construction Subtotal =
Miscellaneous Subtotal
Utility Improvements Subtotal =
Landscaping and Irrigation Improvements Subtotal =
Cedar Avenue/Rialto Avenue INTERSECTION
Agenda item No. 3
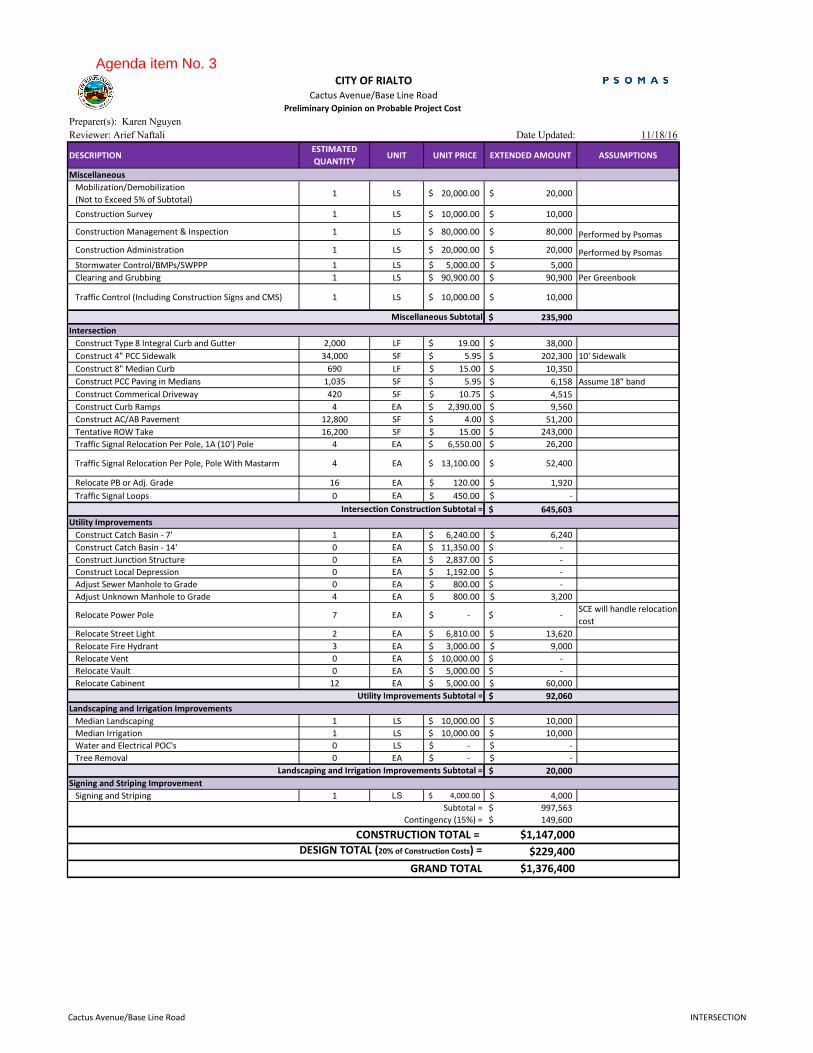
Preparer(s): Karen Nguyen
Reviewer: Arief Naftali Date Updated: 11/18/16
DESCRIPTIONESTIMATED
QUANTITYUNIT UNIT PRICE EXTENDED AMOUNT ASSUMPTIONS
Mobilization/Demobilization
(Not to Exceed 5% of Subtotal)1 LS 20,000.00$ 20,000$
Construction Survey 1 LS 10,000.00$ 10,000$
Construction Management & Inspection 1 LS 80,000.00$ 80,000$ Performed by Psomas
Construction Administration 1 LS 20,000.00$ 20,000$ Performed by Psomas
Stormwater Control/BMPs/SWPPP 1 LS 5,000.00$ 5,000$
Clearing and Grubbing 1 LS 90,900.00$ 90,900$ Per Greenbook
Traffic Control (Including Construction Signs and CMS) 1 LS 10,000.00$ 10,000$
235,900$
Construct Type 8 Integral Curb and Gutter 2,000 LF 19.00$ 38,000$
Construct 4" PCC Sidewalk 34,000 SF $ 5.95 202,300$ 10' Sidewalk
Construct 8" Median Curb 690 LF $ 15.00 10,350$
Construct PCC Paving in Medians 1,035 SF $ 5.95 6,158$ Assume 18" band
Construct Commerical Driveway 420 SF $ 10.75 4,515$
Construct Curb Ramps 4 EA $ 2,390.00 9,560$
Construct AC/AB Pavement 12,800 SF $ 4.00 51,200$
Tentative ROW Take 16,200 SF $ 15.00 243,000$
Traffic Signal Relocation Per Pole, 1A (10') Pole 4 EA $ 6,550.00 26,200$
Traffic Signal Relocation Per Pole, Pole With Mastarm 4 EA 13,100.00$ 52,400$
Relocate PB or Adj. Grade 16 EA 120.00$ 1,920$
Traffic Signal Loops 0 EA 450.00$ -$
645,603$
Construct Catch Basin - 7' 1 EA 6,240.00$ 6,240$
Construct Catch Basin - 14' 0 EA 11,350.00$ -$
Construct Junction Structure 0 EA 2,837.00$ -$
Construct Local Depression 0 EA 1,192.00$ -$
Adjust Sewer Manhole to Grade 0 EA 800.00$ -$
Adjust Unknown Manhole to Grade 4 EA 800.00$ 3,200$
Relocate Power Pole 7 EA -$ -$ SCE will handle relocation
cost
Relocate Street Light 2 EA 6,810.00$ 13,620$
Relocate Fire Hydrant 3 EA 3,000.00$ 9,000$
Relocate Vent 0 EA 10,000.00$ -$
Relocate Vault 0 EA 5,000.00$ -$
Relocate Cabinent 12 EA 5,000.00$ 60,000$
92,060$
Median Landscaping 1 LS 10,000.00$ 10,000$
Median Irrigation 1 LS 10,000.00$ 10,000$
Water and Electrical POC's 0 LS -$ -$
Tree Removal 0 EA -$ -$
20,000$
Signing and Striping 1 LS 4,000.00$ 4,000$
Subtotal = 997,563$
149,600$
CONSTRUCTION TOTAL = $1,147,000
DESIGN TOTAL (20% of Construction Costs) = $229,400
GRAND TOTAL $1,376,400
CITY OF RIALTO
Cactus Avenue/Base Line Road
Preliminary Opinion on Probable Project Cost
Miscellaneous
Contingency (15%) =
Intersection
Signing and Striping Improvement
Landscaping and Irrigation Improvements
Utility Improvements
Intersection Construction Subtotal =
Miscellaneous Subtotal
Utility Improvements Subtotal =
Landscaping and Irrigation Improvements Subtotal =
Cactus Avenue/Base Line Road INTERSECTION
Agenda item No. 3

Preparer(s): Karen Nguyen
Reviewer: Arief Naftali Date Updated: 11/18/16
DESCRIPTIONESTIMATED
QUANTITYUNIT UNIT PRICE EXTENDED AMOUNT ASSUMPTIONS
Mobilization/Demobilization
(Not to Exceed 5% of Subtotal)1 LS 20,000.00$ 20,000$
Construction Survey 1 LS 10,000.00$ 10,000$
Construction Management & Inspection 1 LS 40,000.00$ 40,000$ Performed by Psomas
Construction Administration 1 LS 20,000.00$ 20,000$ Performed by Psomas
Stormwater Control/BMPs/SWPPP 1 LS 5,000.00$ 5,000$
Clearing and Grubbing 1 LS 3,500.00$ 3,500$ Per Greenbook
Traffic Control (Including Construction Signs and CMS) 1 LS 15,000.00$ 15,000$
113,500$
Construct Type 8 Integral Curb and Gutter 190 LF 19.00$ 3,610$
Construct 4" PCC Sidewalk 1,900 SF $ 5.95 11,305$ 10' Sidewalk
Construct Curb Ramps 4 EA $ 2,390.00 9,560$
Traffic Signal Relocation Per Pole, 1A (10') Pole 4 EA $ 6,550.00 26,200$
Traffic Signal Relocation Per Pole, Pole With Mastarm 4 EA 13,100.00$ 52,400$
Relocate PB or Adj. Grade 8 EA 120.00$ 960$
Traffic Signal Loops 32 EA 450.00$ 14,400$
118,435$
Construct Catch Basin - 7' 1 EA 6,240.00$ 6,240$
Construct Catch Basin - 14' 1 EA 11,350.00$ 11,350$
Construct Junction Structure 0 EA 2,837.00$ -$
Construct Local Depression 0 EA 1,192.00$ -$
Adjust Sewer Manhole to Grade 2 EA 800.00$ 1,600$
Adjust Unknown Manhole to Grade 2 EA 800.00$ 1,600$
Adjust Water Valve to Grade 3 EA 500.00$ 1,500$
Relocate Power Pole 1 EA -$ SCE will handle
relocation cost
Relocate Street Light 0 EA 6,810.00$ -$
Relocate Fire Hydrant 1 EA 3,000.00$ 3,000$
Relocate Vent 0 EA 10,000.00$ -$
Relocate Vault 0 EA 5,000.00$ -$
Relocate Cabinent 0 EA 5,000.00$ -$
25,290$
Median Landscaping 0 LS -$ -$
Median Irrigation 0 LS -$ -$
Water and Electrical POC's 0 LS -$ -$
Tree Removal 0 EA -$ -$
-$
Signing and Striping 1 LS 310.00$ 310$
Subtotal = 257,535$
38,600$
CONSTRUCTION TOTAL = $296,000
DESIGN TOTAL (20% of Construction Costs) = $59,200
GRAND TOTAL $355,200
CITY OF RIALTO
Riverside Avenue/Slover Avenue
Preliminary Opinion on Probable Project Cost
Miscellaneous
Contingency (15%) =
Intersection
Signing and Striping Improvement
Landscaping and Irrigation Improvements
Utility Improvements
Intersection Construction Subtotal =
Miscellaneous Subtotal
Utility Improvements Subtotal =
Landscaping and Irrigation Improvements Subtotal =
Riverside Avenue/Slover Avenue INTERSECTION
Agenda item No. 3

Preparer(s): Karen Nguyen
Reviewer: Arief Naftali Date Updated: 11/17/16
DESCRIPTIONESTIMATED
QUANTITYUNIT UNIT PRICE EXTENDED AMOUNT ASSUMPTIONS
Mobilization/Demobilization
(Not to Exceed 5% of Subtotal)1 LS 10,000.00$ 10,000$
Construction Survey 1 LS 5,000.00$ 5,000$
Construction Management & Inspection 1 LS 10,000.00$ 10,000$ Performed by Psomas
Construction Administration 1 LS 10,000.00$ 10,000$ Performed by Psomas
Stormwater Control/BMPs/SWPPP 1 LS 2,000.00$ 2,000$
Clearing and Grubbing 1 LS 1,900.00$ 1,900$ Per Greenbook
Traffic Control (Including Construction Signs and CMS) 1 LS 10,000.00$ 10,000$
48,900$
Construct Type 8 Integral Curb and Gutter 70 LF 19.00$ 1,330$
Construct 4" PCC Sidewalk 700 SF $ 5.95 4,165$ 10' Sidewalk
Construct Curb Ramps 1 EA $ 2,390.00 2,390$
Traffic Signal Relocation Per Pole, 1A (10') Pole 1 EA $ 6,550.00 6,550$
Traffic Signal Relocation Per Pole, Pole With Mastarm 1 EA 13,100.00$ 13,100$
Relocate PB or Adj. Grade 2 EA 120.00$ 240$
Traffic Signal Loops 0 EA 450.00$ -$
27,775$
Construct Catch Basin - 7' 1 EA 6,240.00$ 6,240$
Construct Catch Basin - 14' 0 EA 11,350.00$ -$
Construct Junction Structure 0 EA 2,837.00$ -$
Construct Local Depression 0 EA 1,192.00$ -$
Adjust Sewer Manhole to Grade 0 EA 800.00$ -$
Adjust Unknown Manhole to Grade 0 EA 800.00$ -$
Adjust Water Valve to Grade 1 EA 500.00$ 500$
Relocate Power Pole 0 EA 50,000.00$ -$
Relocate Street Light 0 EA 6,810.00$ -$
Relocate Fire Hydrant 0 EA 3,000.00$ -$
Relocate Vent 0 EA 10,000.00$ -$
Relocate Vault 0 EA 5,000.00$ -$
Relocate Cabinent 1 EA 5,000.00$ 5,000$
11,740$
Median Landscaping 0 LS -$ -$
Median Irrigation 0 LS -$ -$
Water and Electrical POC's 0 LS -$ -$
Tree Removal 0 EA -$ -$
-$
Signing and Striping 1 LS 50.00$ 50$
Subtotal = 88,465$
13,300$
CONSTRUCTION TOTAL = $102,000
DESIGN TOTAL (20% of Construction Costs) = $20,400
GRAND TOTAL $122,400
Contingency (15%) =
Intersection
Signing and Striping Improvement
Landscaping and Irrigation Improvements
Utility Improvements
Intersection Construction Subtotal =
Miscellaneous Subtotal
Utility Improvements Subtotal =
Landscaping and Irrigation Improvements Subtotal =
CITY OF RIALTO
Riverside Avenue/Jurupa Avenue
Preliminary Opinion on Probable Project Cost
Miscellaneous
Riverside Avenue/Jurupa Avenue INTERSECTION
Agenda item No. 3
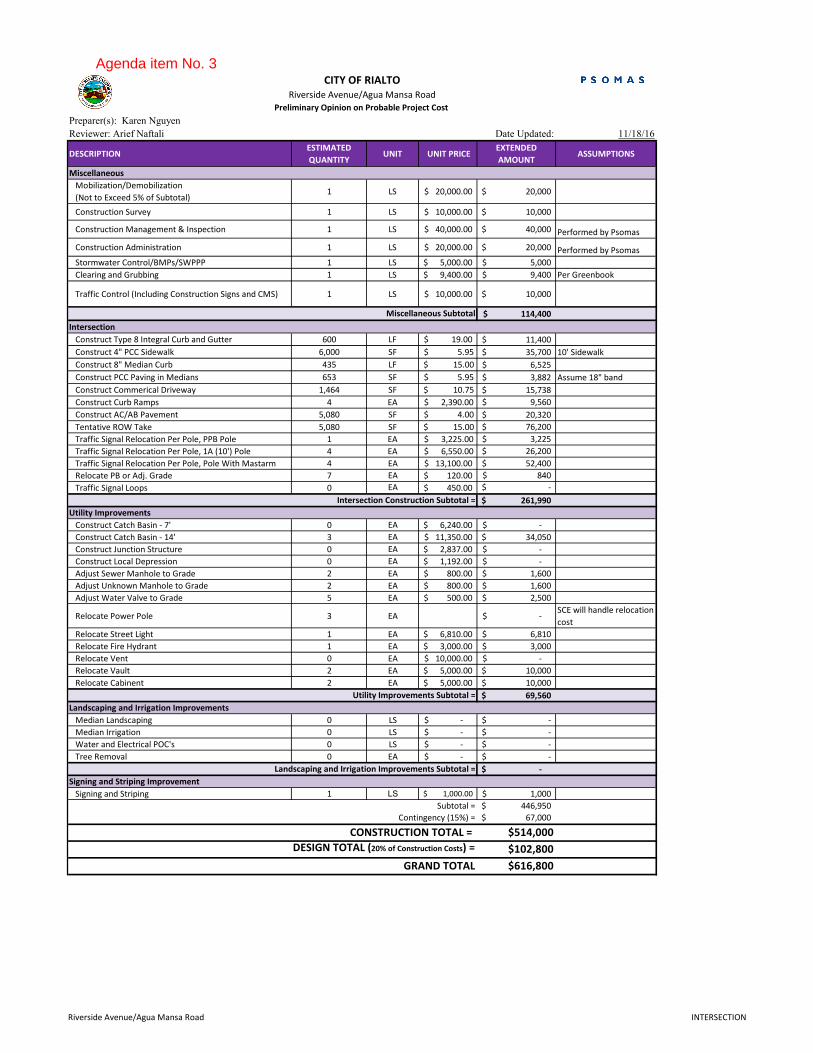
Preparer(s): Karen Nguyen
Reviewer: Arief Naftali Date Updated: 11/18/16
DESCRIPTIONESTIMATED
QUANTITYUNIT UNIT PRICE
EXTENDED
AMOUNTASSUMPTIONS
Mobilization/Demobilization
(Not to Exceed 5% of Subtotal)1 LS 20,000.00$ 20,000$
Construction Survey 1 LS 10,000.00$ 10,000$
Construction Management & Inspection 1 LS 40,000.00$ 40,000$ Performed by Psomas
Construction Administration 1 LS 20,000.00$ 20,000$ Performed by Psomas
Stormwater Control/BMPs/SWPPP 1 LS 5,000.00$ 5,000$
Clearing and Grubbing 1 LS 9,400.00$ 9,400$ Per Greenbook
Traffic Control (Including Construction Signs and CMS) 1 LS 10,000.00$ 10,000$
114,400$
Construct Type 8 Integral Curb and Gutter 600 LF 19.00$ 11,400$
Construct 4" PCC Sidewalk 6,000 SF $ 5.95 35,700$ 10' Sidewalk
Construct 8" Median Curb 435 LF $ 15.00 6,525$
Construct PCC Paving in Medians 653 SF $ 5.95 3,882$ Assume 18" band
Construct Commerical Driveway 1,464 SF $ 10.75 15,738$
Construct Curb Ramps 4 EA $ 2,390.00 9,560$
Construct AC/AB Pavement 5,080 SF $ 4.00 20,320$
Tentative ROW Take 5,080 SF $ 15.00 76,200$
Traffic Signal Relocation Per Pole, PPB Pole 1 EA $ 3,225.00 3,225$
Traffic Signal Relocation Per Pole, 1A (10') Pole 4 EA $ 6,550.00 26,200$
Traffic Signal Relocation Per Pole, Pole With Mastarm 4 EA 13,100.00$ 52,400$
Relocate PB or Adj. Grade 7 EA 120.00$ 840$
Traffic Signal Loops 0 EA 450.00$ -$
261,990$
Construct Catch Basin - 7' 0 EA 6,240.00$ -$
Construct Catch Basin - 14' 3 EA 11,350.00$ 34,050$
Construct Junction Structure 0 EA 2,837.00$ -$
Construct Local Depression 0 EA 1,192.00$ -$
Adjust Sewer Manhole to Grade 2 EA 800.00$ 1,600$
Adjust Unknown Manhole to Grade 2 EA 800.00$ 1,600$
Adjust Water Valve to Grade 5 EA 500.00$ 2,500$
Relocate Power Pole 3 EA -$ SCE will handle relocation
cost
Relocate Street Light 1 EA 6,810.00$ 6,810$
Relocate Fire Hydrant 1 EA 3,000.00$ 3,000$
Relocate Vent 0 EA 10,000.00$ -$
Relocate Vault 2 EA 5,000.00$ 10,000$
Relocate Cabinent 2 EA 5,000.00$ 10,000$
69,560$
Median Landscaping 0 LS -$ -$
Median Irrigation 0 LS -$ -$
Water and Electrical POC's 0 LS -$ -$
Tree Removal 0 EA -$ -$
-$
Signing and Striping 1 LS 1,000.00$ 1,000$
Subtotal = 446,950$
67,000$
CONSTRUCTION TOTAL = $514,000
DESIGN TOTAL (20% of Construction Costs) = $102,800
GRAND TOTAL $616,800
Contingency (15%) =
Intersection
Signing and Striping Improvement
Landscaping and Irrigation Improvements
Utility Improvements
Intersection Construction Subtotal =
Miscellaneous Subtotal
Utility Improvements Subtotal =
Landscaping and Irrigation Improvements Subtotal =
CITY OF RIALTO
Riverside Avenue/Agua Mansa Road
Preliminary Opinion on Probable Project Cost
Miscellaneous
Riverside Avenue/Agua Mansa Road INTERSECTION
Agenda item No. 3
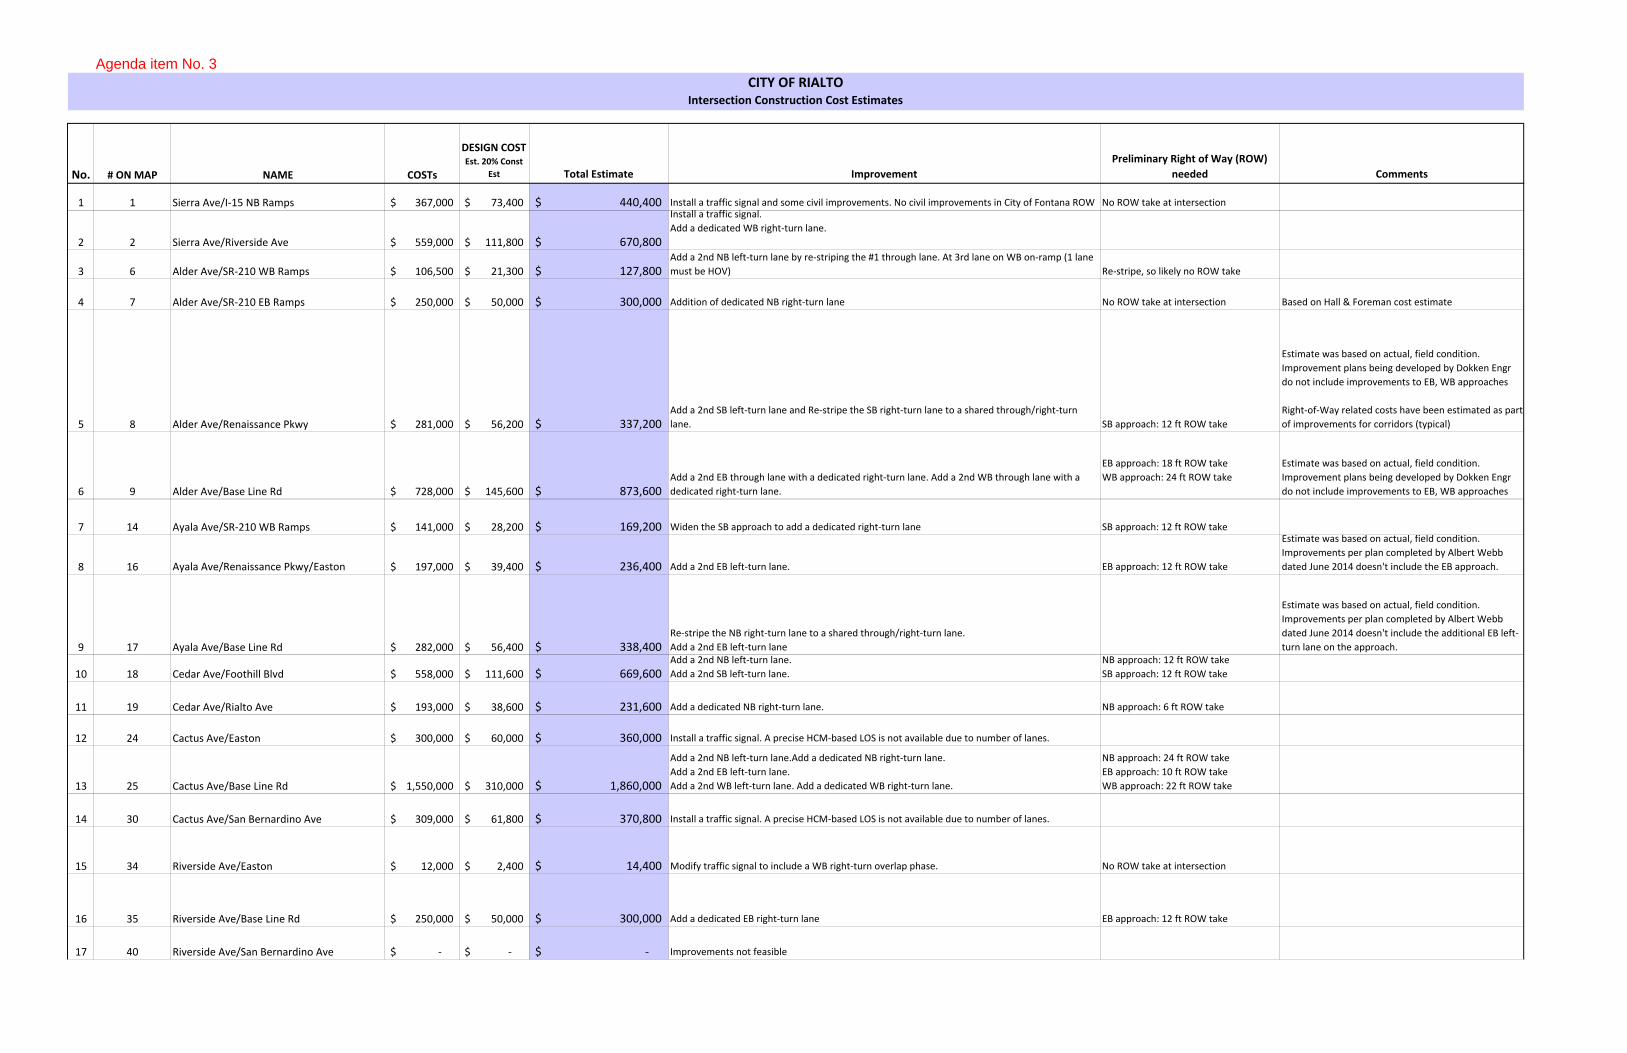
No. # ON MAP NAME COSTs
DESIGN COSTEst. 20% Const
Est Total Estimate Improvement
Preliminary Right of Way (ROW)
needed Comments
1 1 Sierra Ave/I-15 NB Ramps 367,000$ 73,400$ 440,400$ Install a traffic signal and some civil improvements. No civil improvements in City of Fontana ROW No ROW take at intersection
2 2 Sierra Ave/Riverside Ave 559,000$ 111,800$ 670,800$
Install a traffic signal.
Add a dedicated WB right-turn lane.
3 6 Alder Ave/SR-210 WB Ramps 106,500$ 21,300$ 127,800$ Add a 2nd NB left-turn lane by re-striping the #1 through lane. At 3rd lane on WB on-ramp (1 lane
must be HOV) Re-stripe, so likely no ROW take
4 7 Alder Ave/SR-210 EB Ramps 250,000$ 50,000$ 300,000$ Addition of dedicated NB right-turn lane No ROW take at intersection Based on Hall & Foreman cost estimate
5 8 Alder Ave/Renaissance Pkwy 281,000$ 56,200$ 337,200$ Add a 2nd SB left-turn lane and Re-stripe the SB right-turn lane to a shared through/right-turn
lane. SB approach: 12 ft ROW take
Estimate was based on actual, field condition.
Improvement plans being developed by Dokken Engr
do not include improvements to EB, WB approaches
Right-of-Way related costs have been estimated as part
of improvements for corridors (typical)
6 9 Alder Ave/Base Line Rd 728,000$ 145,600$ 873,600$ Add a 2nd EB through lane with a dedicated right-turn lane. Add a 2nd WB through lane with a
dedicated right-turn lane.
EB approach: 18 ft ROW take
WB approach: 24 ft ROW take
Estimate was based on actual, field condition.
Improvement plans being developed by Dokken Engr
do not include improvements to EB, WB approaches
7 14 Ayala Ave/SR-210 WB Ramps 141,000$ 28,200$ 169,200$ Widen the SB approach to add a dedicated right-turn lane SB approach: 12 ft ROW take
8 16 Ayala Ave/Renaissance Pkwy/Easton 197,000$ 39,400$ 236,400$ Add a 2nd EB left-turn lane. EB approach: 12 ft ROW take
Estimate was based on actual, field condition.
Improvements per plan completed by Albert Webb
dated June 2014 doesn't include the EB approach.
9 17 Ayala Ave/Base Line Rd 282,000$ 56,400$ 338,400$ Re-stripe the NB right-turn lane to a shared through/right-turn lane.
Add a 2nd EB left-turn lane
Estimate was based on actual, field condition.
Improvements per plan completed by Albert Webb
dated June 2014 doesn't include the additional EB left-
turn lane on the approach.
10 18 Cedar Ave/Foothill Blvd 558,000$ 111,600$ 669,600$ Add a 2nd NB left-turn lane.
Add a 2nd SB left-turn lane.
NB approach: 12 ft ROW take
SB approach: 12 ft ROW take
11 19 Cedar Ave/Rialto Ave 193,000$ 38,600$ 231,600$ Add a dedicated NB right-turn lane. NB approach: 6 ft ROW take
12 24 Cactus Ave/Easton 300,000$ 60,000$ 360,000$ Install a traffic signal. A precise HCM-based LOS is not available due to number of lanes.
13 25 Cactus Ave/Base Line Rd 1,550,000$ 310,000$ 1,860,000$
Add a 2nd NB left-turn lane.Add a dedicated NB right-turn lane.
Add a 2nd EB left-turn lane.
Add a 2nd WB left-turn lane. Add a dedicated WB right-turn lane.
NB approach: 24 ft ROW take
EB approach: 10 ft ROW take
WB approach: 22 ft ROW take
14 30 Cactus Ave/San Bernardino Ave 309,000$ 61,800$ 370,800$ Install a traffic signal. A precise HCM-based LOS is not available due to number of lanes.
15 34 Riverside Ave/Easton 12,000$ 2,400$ 14,400$ Modify traffic signal to include a WB right-turn overlap phase. No ROW take at intersection
16 35 Riverside Ave/Base Line Rd 250,000$ 50,000$ 300,000$ Add a dedicated EB right-turn lane EB approach: 12 ft ROW take
17 40 Riverside Ave/San Bernardino Ave -$ -$ -$ Improvements not feasible
CITY OF RIALTOIntersection Construction Cost Estimates
Agenda item No. 3

No. # ON MAP NAME COSTs
DESIGN COSTEst. 20% Const
Est Total Estimate Improvement
Preliminary Right of Way (ROW)
needed Comments
18 41 Riverside Ave/Valley Blvd 468,000$ 93,600$ 561,600$ Add a 2nd WB left-turn lane. Restripe the number two EB through lane to a shared through/right-
turn lane
WB approach: 12 ft ROW take
EB approach: No ROW take at
intersection
19 43 Riverside Ave/I-10 EB Ramps 16,826,400$ 3,365,300$ 20,191,700$ Add a dedicated NB right-turn lane. Add a 3rd SB through lane.
NB approach: widen bridge by 12 ft
SB approach: widen bridge by 10 ft
Estimate was based on additional improvements on-
top of prepared Exhibit by JL Patterson dated Aug 25,
2014.
20 44 Riverside Ave/Slover Ave 354,000$ 70,800$ 424,800$ Add a 3rd NB through lane and a 3rd SB through lane
NB approach: 12 ft ROW take
SB approach: 12 ft ROW take
Estimate was based on additional improvements on-
top of prepared Exhibit by JL Patterson dated Aug 25,
2014.
21 45 Riverside Ave/Jurupa Ave 102,000$ 20,400$ 122,400$ Add a 3rd SB through lane SB approach: 12 ft ROW take
22 46 Riverside Ave/Agua Mansa Rd 686,000$ 137,200$ 823,200$
Add a 3rd SB through lane
Add a 2nd EB through lane and a 2nd WB through lane by re-striping the dedicated right-turn lanes
into shared through/right-turn lanes.
Add a 2nd EB left-turn lane and a 2nd WB left-turn lane.
SB approach: 12 ft ROW take
EB approach: 12 ft ROW take
WB approach: 12 ft ROW take
29,423,900$
Agenda item No. 3
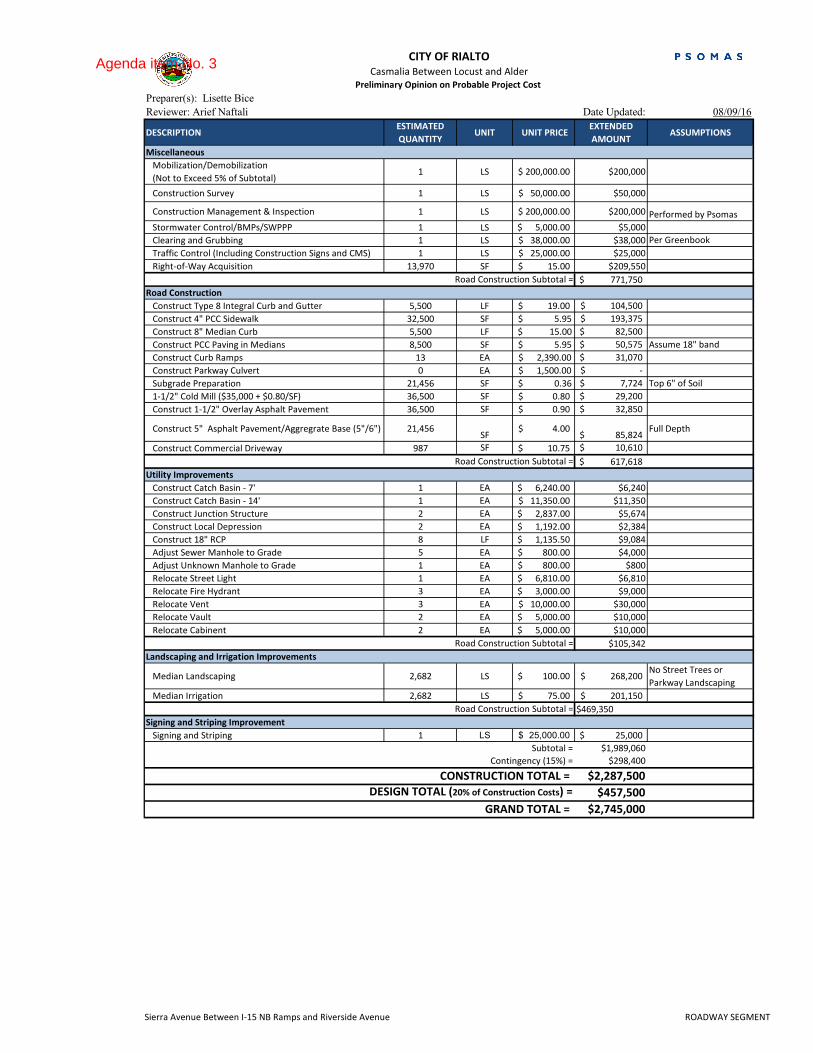
Preparer(s): Lisette Bice
Reviewer: Arief Naftali Date Updated: 08/09/16
DESCRIPTIONESTIMATED
QUANTITYUNIT UNIT PRICE
EXTENDED
AMOUNTASSUMPTIONS
Mobilization/Demobilization
(Not to Exceed 5% of Subtotal)1 LS 200,000.00$ $200,000
Construction Survey 1 LS 50,000.00$ $50,000
Construction Management & Inspection 1 LS 200,000.00$ $200,000 Performed by Psomas
Stormwater Control/BMPs/SWPPP 1 LS 5,000.00$ $5,000
Clearing and Grubbing 1 LS 38,000.00$ $38,000 Per Greenbook
Traffic Control (Including Construction Signs and CMS) 1 LS 25,000.00$ $25,000
Right-of-Way Acquisition 13,970 SF 15.00$ $209,550
771,750$
Construct Type 8 Integral Curb and Gutter 5,500 LF 19.00$ 104,500$
Construct 4" PCC Sidewalk 32,500 SF $ 5.95 193,375$
Construct 8" Median Curb 5,500 LF $ 15.00 82,500$
Construct PCC Paving in Medians 8,500 SF $ 5.95 50,575$ Assume 18" band
Construct Curb Ramps 13 EA $ 2,390.00 31,070$
Construct Parkway Culvert 0 EA $ 1,500.00 -$
Subgrade Preparation 21,456 SF $ 0.36 7,724$ Top 6" of Soil
1-1/2" Cold Mill ($35,000 + $0.80/SF) 36,500 SF 0.80$ 29,200$
Construct 1-1/2" Overlay Asphalt Pavement 36,500 SF 0.90$ 32,850$
Construct 5" Asphalt Pavement/Aggregrate Base (5"/6") 21,456SF
4.00$ 85,824$
Full Depth
Construct Commercial Driveway 987 SF 10.75$ 10,610$
617,618$
Construct Catch Basin - 7' 1 EA 6,240.00$ $6,240
Construct Catch Basin - 14' 1 EA 11,350.00$ $11,350
Construct Junction Structure 2 EA 2,837.00$ $5,674
Construct Local Depression 2 EA 1,192.00$ $2,384
Construct 18" RCP 8 LF 1,135.50$ $9,084
Adjust Sewer Manhole to Grade 5 EA 800.00$ $4,000
Adjust Unknown Manhole to Grade 1 EA 800.00$ $800
Relocate Street Light 1 EA 6,810.00$ $6,810
Relocate Fire Hydrant 3 EA 3,000.00$ $9,000
Relocate Vent 3 EA 10,000.00$ $30,000
Relocate Vault 2 EA 5,000.00$ $10,000
Relocate Cabinent 2 EA 5,000.00$ $10,000
$105,342
Median Landscaping 2,682 LS 100.00$ 268,200$ No Street Trees or
Parkway Landscaping
Median Irrigation 2,682 LS 75.00$ 201,150$
$469,350
Signing and Striping 1 LS 25,000.00$ 25,000$
Subtotal = $1,989,060
$298,400
CONSTRUCTION TOTAL = $2,287,500
DESIGN TOTAL (20% of Construction Costs) = $457,500
GRAND TOTAL = $2,745,000
CITY OF RIALTOCasmalia Between Locust and Alder
Preliminary Opinion on Probable Project Cost
Miscellaneous
Contingency (15%) =
Road Construction
Signing and Striping Improvement
Landscaping and Irrigation Improvements
Utility Improvements
Road Construction Subtotal =
Road Construction Subtotal =
Road Construction Subtotal =
Road Construction Subtotal =
Sierra Avenue Between I-15 NB Ramps and Riverside Avenue ROADWAY SEGMENT
Agenda item No. 3

Preparer(s): Lisette Bice
Reviewer: Arief Naftali Date Updated: 08/09/16
DESCRIPTIONESTIMATED
QUANTITYUNIT UNIT PRICE EXTENDED AMOUNT ASSUMPTIONS
Mobilization/Demobilization
(Not to Exceed 5% of Subtotal)1 LS 300,000.00$ $300,000
Construction Survey 1 LS 50,000.00$ $50,000
Construction Management & Inspection 1 LS 900,000.00$ $900,000Performed by Psomas
Stormwater Control/BMPs/SWPPP 1 LS 5,000.00$ $5,000
Clearing and Grubbing 1 LS 100,000.00$ $100,000 Per Greenbook
Traffic Control (Including Construction Signs and CMS) 1 LS 50,000.00$ $50,000
Right-of-Way Acquisition 55,042 SF 15.00$ $825,630
$2,274,830
Construct Type 8 Integral Curb and Gutter 5,500 LF 19.00$ 104,500$
Construct 4" PCC Sidewalk 127,000 SF $ 5.95 755,650$
Construct 8" Median Curb 5,300 LF $ 15.00 79,500$
Construct PCC Paving in Medians 8,000 SF $ 5.95 47,600$ Assume 18" band
Construct Curb Ramps 13 EA $ 2,390.00 31,070$
Subgrade Preparation 88,000 SF $ 0.36 31,680$ Top 6" of Soil
1-1/2" Cold Mill ($35,000 + $0.80/SF) 165,500 SF 0.80$ 132,400$
Construct 1-1/2" Overlay Asphalt Pavement 165,500 SF 0.90$ 148,950$
Construct 5" Asphalt Pavement/Aggregrate Base (5"/6") 88,000SF
4.00$ 352,000$
Full Depth
Construct Commercial Driveway 3,500 SF 10.75$ 37,625$
Construct Residential Driveway 400 SF 10.75$ 4,300$
Construct Cross Gutter 4 EA 5,000.00$ 20,000$
Construct Parkway Culvert 3 EA 1,500.00$ 4,500$
1,749,775$
Adjust Sewer Manhole to Grade 1 EA 800.00$ $800
Adjust Unknown Manhole to Grade 3 EA 800.00$ $2,400
Adjust Vault to Grade 1 EA 3,000.00$ $3,000
Adjust Water Valve to Grade 3 EA 500.00$ $1,500
Relocate Manhole 2 EA 5,000.00$ $10,000
Relocate Power Pole 9 EA -$ $0SCE will handle the cost
of relocation
Relocate Guy Wire 5 EA 15,000.00$ $75,000
Relocate Street Light 2 EA 6,810.00$ $13,620
Relocate Fire Hydrant 4 EA 3,000.00$ $12,000
Relocate Vent 3 EA 10,000.00$ $30,000
Relocate Vault 0 EA 5,000.00$ $0
Relocate Cabinent 0 EA 5,000.00$ $0
Relocate Mailbox 0 EA 300.00$ $0
Construct Catch Basin - 7' 4 EA 6,240.00$ $24,960
Construct Catch Basin - 14' 2 EA 11,350.00$ $22,700
Construct Local Depression 6 EA 1,192.00$ $7,152
Construct Concrete Collar 6 EA 2,980.00$ $17,880
Construct 18" RCP 0 LF 113.50$ $0
$221,012
Relocate Rail Signals 2 EA 250,000.00$ 500,000$
Relocate Rail Bungalow 1 EA 50,000.00$ 50,000$
$550,000
Median Landscaping 2,631 LF 100.00$ 263,100$ No Street Trees or
Parkway Landscaping
Median Irrigation 2,631 LF 75.00$ 197,325$ Mainline, conduit, POV
$460,425
Signing and Striping including Overhead Pedestrian
Crossing Signals1 LS 210,000.00$ 210,000$
$210,000
Subtotal = $5,466,042
$819,900
CONSTRUCTION TOTAL = $6,285,900
DESIGN TOTAL (20% OF Construction Costs) = $1,257,200
TOTAL = $7,543,100
Non Rialto R/W (25%) $1,885,775
GRAND TOTAL $5,657,325
Contingency (15%) =
Road Construction
Signing and Striping Improvement
Landscaping and Irrigation Improvements
Utility Improvements
Road Construction Subtotal =
Rail Improvements
Miscellaneous Subtotal =
Utility Subtotal =
Rail Subtotal =
Landscaping Subtotal =
Signing and Striping Subtotal =
CITY OF RIALTOPepper between Foothill and Rialto (2631 LF)
Preliminary Opinion on Probable Project Cost
Miscellaneous
Sierra Avenue Between I-15 NB Ramps and Riverside Avenue ROADWAY SEGMENT
Agenda item No. 3
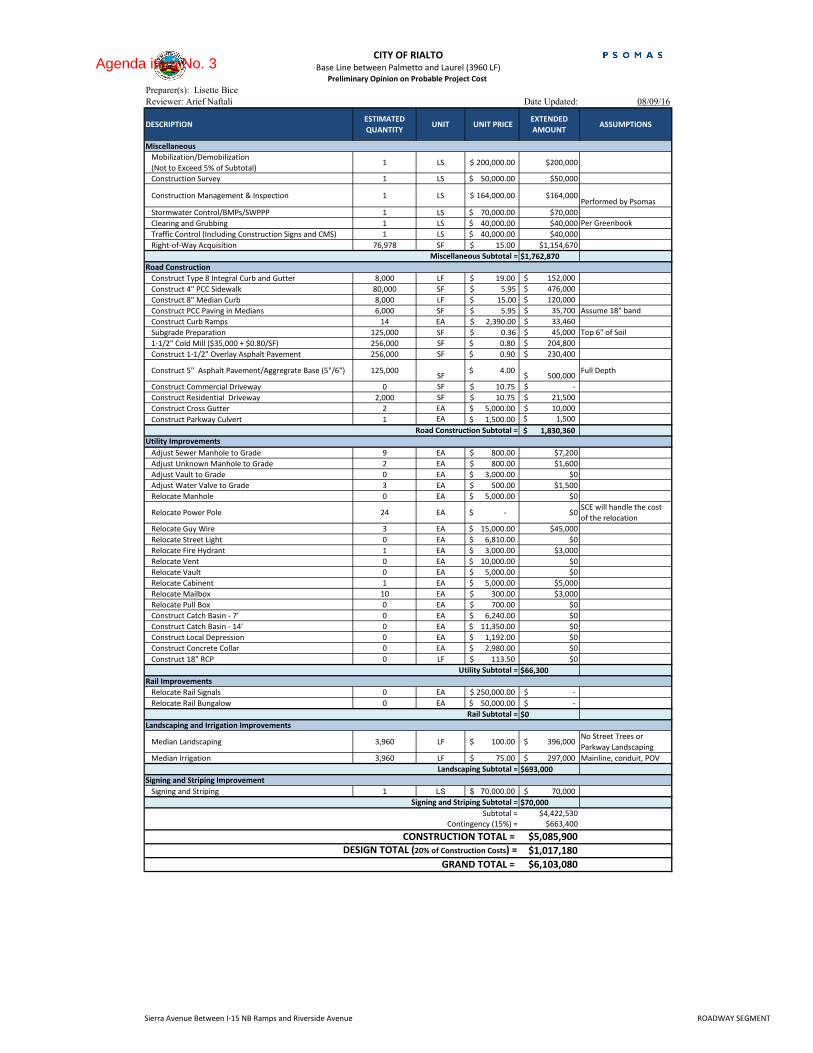
Preparer(s): Lisette Bice
Reviewer: Arief Naftali Date Updated: 08/09/16
DESCRIPTIONESTIMATED
QUANTITYUNIT UNIT PRICE
EXTENDED
AMOUNTASSUMPTIONS
Mobilization/Demobilization
(Not to Exceed 5% of Subtotal)1 LS 200,000.00$ $200,000
Construction Survey 1 LS 50,000.00$ $50,000
Construction Management & Inspection 1 LS 164,000.00$ $164,000Performed by Psomas
Stormwater Control/BMPs/SWPPP 1 LS 70,000.00$ $70,000
Clearing and Grubbing 1 LS 40,000.00$ $40,000 Per Greenbook
Traffic Control (Including Construction Signs and CMS) 1 LS 40,000.00$ $40,000
Right-of-Way Acquisition 76,978 SF 15.00$ $1,154,670
$1,762,870
Construct Type 8 Integral Curb and Gutter 8,000 LF 19.00$ 152,000$
Construct 4" PCC Sidewalk 80,000 SF $ 5.95 476,000$
Construct 8" Median Curb 8,000 LF $ 15.00 120,000$
Construct PCC Paving in Medians 6,000 SF $ 5.95 35,700$ Assume 18" band
Construct Curb Ramps 14 EA $ 2,390.00 33,460$
Subgrade Preparation 125,000 SF $ 0.36 45,000$ Top 6" of Soil
1-1/2" Cold Mill ($35,000 + $0.80/SF) 256,000 SF 0.80$ 204,800$
Construct 1-1/2" Overlay Asphalt Pavement 256,000 SF 0.90$ 230,400$
Construct 5" Asphalt Pavement/Aggregrate Base (5"/6") 125,000SF
4.00$ 500,000$
Full Depth
Construct Commercial Driveway 0 SF 10.75$ -$
Construct Residential Driveway 2,000 SF 10.75$ 21,500$
Construct Cross Gutter 2 EA 5,000.00$ 10,000$
Construct Parkway Culvert 1 EA 1,500.00$ 1,500$
1,830,360$
Adjust Sewer Manhole to Grade 9 EA 800.00$ $7,200
Adjust Unknown Manhole to Grade 2 EA 800.00$ $1,600
Adjust Vault to Grade 0 EA 3,000.00$ $0
Adjust Water Valve to Grade 3 EA 500.00$ $1,500
Relocate Manhole 0 EA 5,000.00$ $0
Relocate Power Pole 24 EA -$ $0SCE will handle the cost
of the relocation
Relocate Guy Wire 3 EA 15,000.00$ $45,000
Relocate Street Light 0 EA 6,810.00$ $0
Relocate Fire Hydrant 1 EA 3,000.00$ $3,000
Relocate Vent 0 EA 10,000.00$ $0
Relocate Vault 0 EA 5,000.00$ $0
Relocate Cabinent 1 EA 5,000.00$ $5,000
Relocate Mailbox 10 EA 300.00$ $3,000
Relocate Pull Box 0 EA 700.00$ $0
Construct Catch Basin - 7' 0 EA 6,240.00$ $0
Construct Catch Basin - 14' 0 EA 11,350.00$ $0
Construct Local Depression 0 EA 1,192.00$ $0
Construct Concrete Collar 0 EA 2,980.00$ $0
Construct 18" RCP 0 LF 113.50$ $0
$66,300
Relocate Rail Signals 0 EA 250,000.00$ -$
Relocate Rail Bungalow 0 EA 50,000.00$ -$
$0
Median Landscaping 3,960 LF 100.00$ 396,000$ No Street Trees or
Parkway Landscaping
Median Irrigation 3,960 LF 75.00$ 297,000$ Mainline, conduit, POV
$693,000
Signing and Striping 1 LS 70,000.00$ 70,000$
$70,000
Subtotal = $4,422,530
$663,400
CONSTRUCTION TOTAL = $5,085,900
DESIGN TOTAL (20% of Construction Costs) = $1,017,180
GRAND TOTAL = $6,103,080
CITY OF RIALTOBase Line between Palmetto and Laurel (3960 LF)
Preliminary Opinion on Probable Project Cost
Miscellaneous
Contingency (15%) =
Road Construction
Signing and Striping Improvement
Landscaping and Irrigation Improvements
Utility Improvements
Road Construction Subtotal =
Rail Improvements
Miscellaneous Subtotal =
Utility Subtotal =
Rail Subtotal =
Landscaping Subtotal =
Signing and Striping Subtotal =
Sierra Avenue Between I-15 NB Ramps and Riverside Avenue ROADWAY SEGMENT
Agenda item No. 3

Preparer(s): Lisette Bice
Reviewer: Arief Naftali Date Updated: 08/09/16
DESCRIPTIONESTIMATED
QUANTITYUNIT UNIT PRICE EXTENDED AMOUNT ASSUMPTIONS
Mobilization/Demobilization
(Not to Exceed 5% of Subtotal)1 LS 800,000.00$ $800,000
Construction Survey 1 LS 150,000.00$ $150,000
Construction Management & Inspection 1 LS 3,000,000.00$ $3,000,000Performed by Psomas
Stormwater Control/BMPs/SWPPP 1 LS 7,000.00$ $7,000
Clearing and Grubbing 1 LS 500,000.00$ $500,000 Per Greenbook
Traffic Control (Including Construction Signs and CMS) 1 LS 90,000.00$ $90,000
Right-of-Way Acquisition 140,643 SF 15.00$ $2,109,645
$6,700,845
Construct Type 8 Integral Curb and Gutter 22,000 LF 19.00$ 418,000$
Construct 4" PCC Sidewalk 253,440 SF $ 5.95 1,507,968$
Construct 8" Median Curb 21,500 LF $ 15.00 322,500$
Construct PCC Paving in Medians 16,000 SF $ 5.95 95,200$ Assume 18" band
Construct Curb Ramps 21 EA $ 2,390.00 50,190$
Subgrade Preparation 225,500 SF $ 0.36 81,180$ Top 6" of Soil
1-1/2" Cold Mill ($35,000 + $0.80/SF) 789,000 SF 0.80$ 631,200$
Construct 1-1/2" Overlay Asphalt Pavement 789,000 SF 0.90$ 710,100$
Construct 5" Asphalt Pavement/Aggregrate Base (5"/6") 225,500SF
4.00$ 902,000$
Full Depth
Construct Commercial Driveway 17,000 SF 10.75$ 182,750$
Construct Residential Driveway 0 SF 10.75$ -$
Construct Cross Gutter 1 EA 5,000.00$ 5,000$
Construct Parkway Culvert 3 EA 1,500.00$ 4,500$
construct Retaining Wall 575 LF 100.00$ 57,500$
Wide Overpass 15,000 SF 1,000.00$ 15,000,000$
19,968,088$
Adjust Sewer Manhole to Grade 0 EA 800.00$ $0
Adjust Unknown Manhole to Grade 0 EA 800.00$ $0
Adjust Vault to Grade 0 EA 3,000.00$ $0
Adjust Water Valve to Grade 3 EA 500.00$ $1,500
Relocate Manhole 0 EA 5,000.00$ $0
Relocate Power Pole 52 EA -$ $0SCE will cover the cost of
the relocation
Relocate Guy Wire 19 EA 15,000.00$ $285,000
Relocate Water Meter 19 EA 500.00$ $9,500
Relocate Street Light 21 EA 6,810.00$ $143,010
Relocate Fire Hydrant 32 EA 3,000.00$ $96,000
Relocate Vent 0 EA 10,000.00$ $0
Relocate Vault 0 EA 5,000.00$ $0
Relocate Cabinent 0 EA 5,000.00$ $0
Relocate Mailbox 3 EA 300.00$ $900
Relocate Pull Box 21 EA 700.00$ $14,700
Construct Catch Basin - 7' 0 EA 6,240.00$ $0
Construct Catch Basin - 14' 11 EA 11,350.00$ $124,850
Construct Local Depression 11 EA 1,192.00$ $13,112
Construct Concrete Collar 11 EA 2,980.00$ $32,780
Construct 18" RCP 165 LF 113.50$ $18,728
$740,080
Relocate Rail Signals 0 EA 250,000.00$ -$
Relocate Rail Bungalow 0 EA 50,000.00$ -$
$0
Median Landscaping 10,560 LF 100.00$ 1,056,000$ No Street Trees or
Parkway Landscaping
Median Irrigation 10,560 LF 75.00$ 792,000$ Mainline, conduit, POV
$1,848,000
Signing and Striping 1 LS 40,000.00$ 40,000$
$40,000
Subtotal = $29,297,013
$4,394,600
CONSTRUCTION TOTAL = $33,691,600
DESIGN TOTAL (20% of Construction Costs) = $6,738,320
GRAND TOTAL = $40,429,920
Contingency (15%) =
Road Construction
Signing and Striping Improvement
Landscaping and Irrigation Improvements
Utility Improvements
Road Construction Subtotal =
Rail Improvements
Miscellaneous Subtotal =
Utility Subtotal =
Rail Subtotal =
Landscaping Subtotal =
Signing and Striping Subtotal =
CITY OF RIALTO
Riverside between I-10 and Agua Mansa (2 mi)
Preliminary Opinion on Probable Project Cost
Miscellaneous
Sierra Avenue Between I-15 NB Ramps and Riverside Avenue ROADWAY SEGMENT
Agenda item No. 3
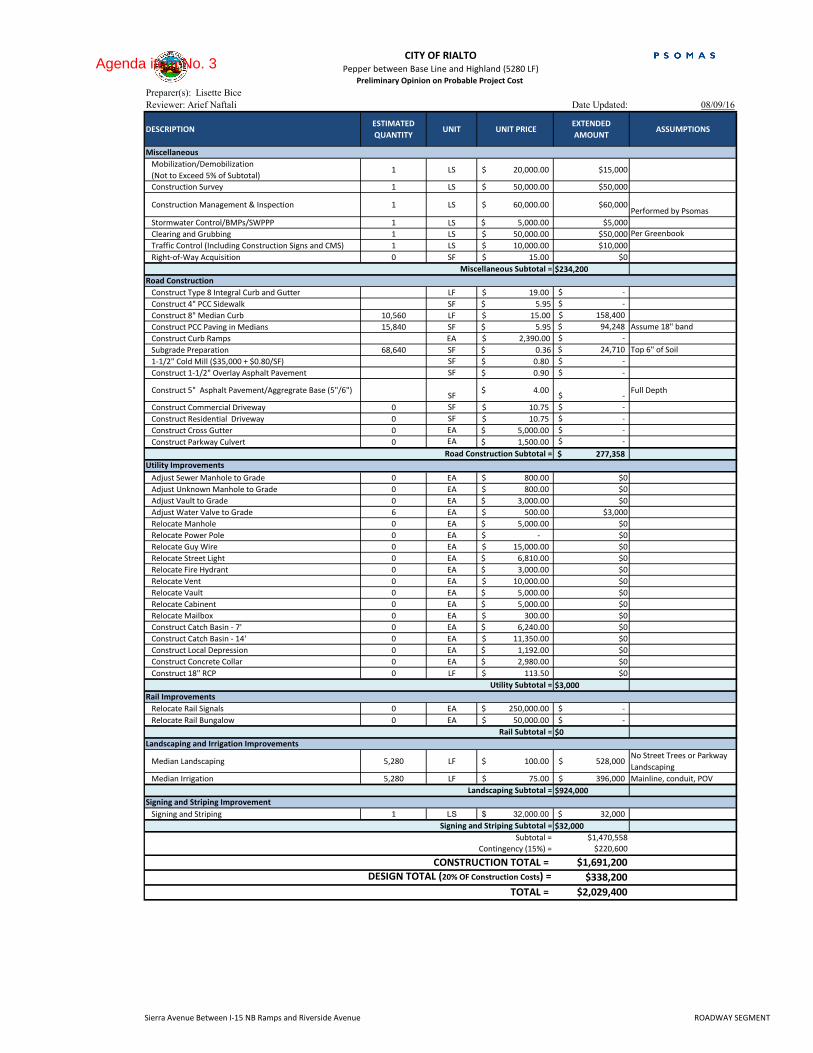
Preparer(s): Lisette Bice
Reviewer: Arief Naftali Date Updated: 08/09/16
DESCRIPTIONESTIMATED
QUANTITYUNIT UNIT PRICE
EXTENDED
AMOUNTASSUMPTIONS
Mobilization/Demobilization
(Not to Exceed 5% of Subtotal)1 LS 20,000.00$ $15,000
Construction Survey 1 LS 50,000.00$ $50,000
Construction Management & Inspection 1 LS 60,000.00$ $60,000Performed by Psomas
Stormwater Control/BMPs/SWPPP 1 LS 5,000.00$ $5,000
Clearing and Grubbing 1 LS 50,000.00$ $50,000 Per Greenbook
Traffic Control (Including Construction Signs and CMS) 1 LS 10,000.00$ $10,000
Right-of-Way Acquisition 0 SF 15.00$ $0
$234,200
Construct Type 8 Integral Curb and Gutter LF 19.00$ -$
Construct 4" PCC Sidewalk SF $ 5.95 -$
Construct 8" Median Curb 10,560 LF $ 15.00 158,400$
Construct PCC Paving in Medians 15,840 SF $ 5.95 94,248$ Assume 18" band
Construct Curb Ramps EA $ 2,390.00 -$
Subgrade Preparation 68,640 SF $ 0.36 24,710$ Top 6" of Soil
1-1/2" Cold Mill ($35,000 + $0.80/SF) SF 0.80$ -$
Construct 1-1/2" Overlay Asphalt Pavement SF 0.90$ -$
Construct 5" Asphalt Pavement/Aggregrate Base (5"/6")SF
4.00$ -$
Full Depth
Construct Commercial Driveway 0 SF 10.75$ -$
Construct Residential Driveway 0 SF 10.75$ -$
Construct Cross Gutter 0 EA 5,000.00$ -$
Construct Parkway Culvert 0 EA 1,500.00$ -$
277,358$
Adjust Sewer Manhole to Grade 0 EA 800.00$ $0
Adjust Unknown Manhole to Grade 0 EA 800.00$ $0
Adjust Vault to Grade 0 EA 3,000.00$ $0
Adjust Water Valve to Grade 6 EA 500.00$ $3,000
Relocate Manhole 0 EA 5,000.00$ $0
Relocate Power Pole 0 EA -$ $0
Relocate Guy Wire 0 EA 15,000.00$ $0
Relocate Street Light 0 EA 6,810.00$ $0
Relocate Fire Hydrant 0 EA 3,000.00$ $0
Relocate Vent 0 EA 10,000.00$ $0
Relocate Vault 0 EA 5,000.00$ $0
Relocate Cabinent 0 EA 5,000.00$ $0
Relocate Mailbox 0 EA 300.00$ $0
Construct Catch Basin - 7' 0 EA 6,240.00$ $0
Construct Catch Basin - 14' 0 EA 11,350.00$ $0
Construct Local Depression 0 EA 1,192.00$ $0
Construct Concrete Collar 0 EA 2,980.00$ $0
Construct 18" RCP 0 LF 113.50$ $0
$3,000
Relocate Rail Signals 0 EA 250,000.00$ -$
Relocate Rail Bungalow 0 EA 50,000.00$ -$
$0
Median Landscaping 5,280 LF 100.00$ 528,000$ No Street Trees or Parkway
Landscaping
Median Irrigation 5,280 LF 75.00$ 396,000$ Mainline, conduit, POV
$924,000
Signing and Striping 1 LS 32,000.00$ 32,000$
$32,000
Subtotal = $1,470,558
$220,600
CONSTRUCTION TOTAL = $1,691,200
DESIGN TOTAL (20% OF Construction Costs) = $338,200
TOTAL = $2,029,400
Contingency (15%) =
Road Construction
Signing and Striping Improvement
Landscaping and Irrigation Improvements
Utility Improvements
Road Construction Subtotal =
Rail Improvements
Miscellaneous Subtotal =
Utility Subtotal =
Rail Subtotal =
Landscaping Subtotal =
Signing and Striping Subtotal =
CITY OF RIALTO
Pepper between Base Line and Highland (5280 LF)
Preliminary Opinion on Probable Project Cost
Miscellaneous
Sierra Avenue Between I-15 NB Ramps and Riverside Avenue ROADWAY SEGMENT
Agenda item No. 3

Preparer(s): Lisette Bice
Reviewer: Arief Naftali Date Updated: 11/18/16
DESCRIPTIONESTIMATED
QUANTITYUNIT UNIT PRICE EXTENDED AMOUNT ASSUMPTIONS
Mobilization/Demobilization
(Not to Exceed 5% of Subtotal)1 LS 100,000.00$ $100,000
Construction Survey 1 LS 50,000.00$ $50,000
Construction Management & Inspection 1 LS 200,000.00$ $200,000 Performed by Psomas
Stormwater Control/BMPs/SWPPP 1 LS 5,000.00$ $5,000
Clearing and Grubbing 1 LS 22,000.00$ $22,000 Per Greenbook
Traffic Control (Including Construction Signs and CMS) 1 LS 25,000.00$ $25,000
Right-of-Way Acquisition 14,000 SF 15.00$ $210,000
656,200$
Construct Type 8 Integral Curb and Gutter 1,460 LF 19.00$ 27,740$
Construct 4" PCC Sidewalk 17,520 SF $ 5.95 104,244$
Construct Driveway SF $ 10.75
Construct 8" Median Curb 1,460 LF $ 15.00 21,900$
Construct PCC Paving in Medians 2,190 SF $ 5.95 13,031$ Assume 18" band
Subgrade Preparation 30,800 SF $ 0.36 11,088$ Top 6" of Soil
1-1/2" Cold Mill ($35,000 + $0.80/SF) 14,000 SF 0.80$ 11,200$
Construct 1-1/2" Overlay Asphalt Pavement 14,000 SF 0.90$ 12,600$
Construct 5" Asphalt Pavement/Aggregrate Base (5"/6") 30,800SF
4.00$ 123,200$
Full Depth
325,003$
Relocate Street Light 1 EA 6,810.00$ 6,810$
Relocate Power Pole 3 EA -$ -$ SCE will handle the cost
of relocation
Relocate Guy Wire 1 EA 15,000.00$ 15,000$
Relocate Cabinent 1 EA 5,000.00$ 5,000$
$26,810
Median Landscaping 2,382 LF 100.00$ 238,200$ No Street Trees or
Parkway Landscaping
Median Irrigation 2,382 LF 75.00$ 178,650$
$416,850
Signing and Striping 1 LS 20,000.00$ 20,000$
Subtotal = $1,444,863
$216,700
CONSTRUCTION TOTAL = $1,661,600
DESIGN TOTAL (20% of Construction Costs) = $332,300
GRAND TOTAL = $1,993,900
CITY OF RIALTO GRAND TOTAL = $996,950
CITY OF RIALTO
Sierra between I-15NB and Riverside Avenue (700 LF)
Preliminary Opinion on Probable Project Cost
Miscellaneous
50% OF COSTS TO BE SHARED WITH THE CITY OF FONTANA
Contingency (15%) =
Road Construction
Signing and Striping Improvement
Landscaping and Irrigation Improvements
Utility Improvements
Road Construction Subtotal =
Miscellaneous Subtotal =
Utility Subtotal Subtotal =
Utility Subtotal Subtotal =
Sierra Avenue Between I-15 NB Ramps and Riverside Avenue ROADWAY SEGMENT
Agenda item No. 3
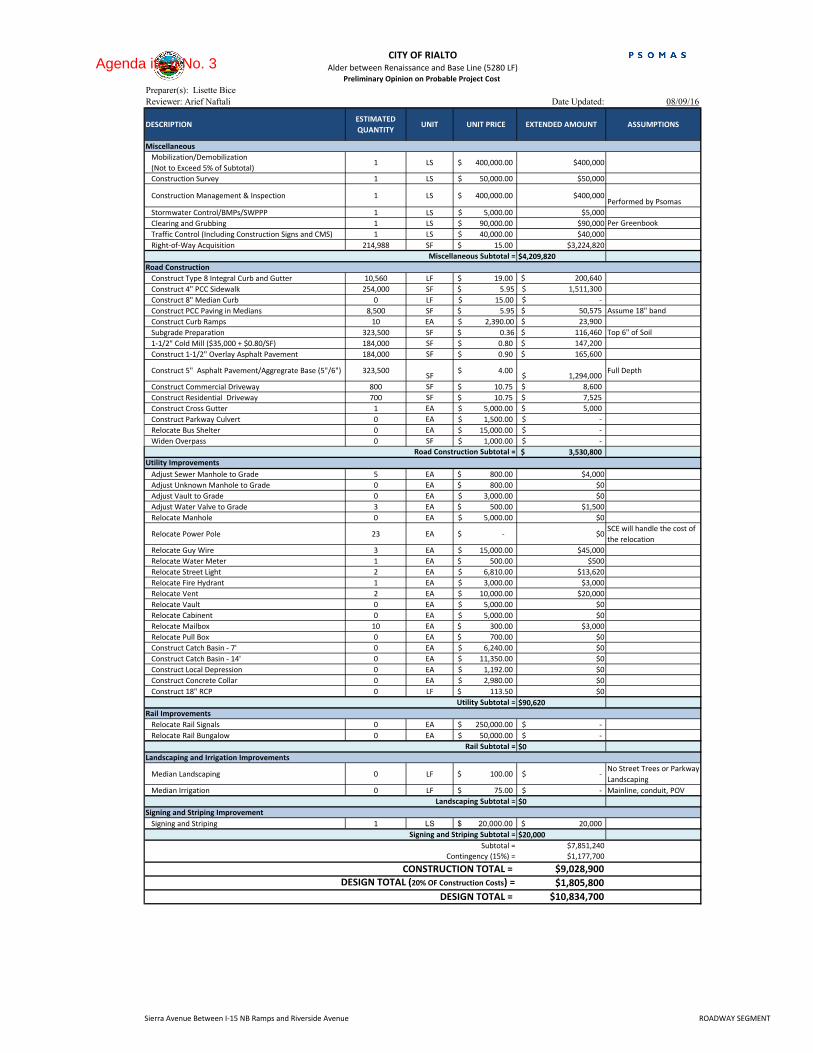
Preparer(s): Lisette Bice
Reviewer: Arief Naftali Date Updated: 08/09/16
DESCRIPTIONESTIMATED
QUANTITYUNIT UNIT PRICE EXTENDED AMOUNT ASSUMPTIONS
Mobilization/Demobilization
(Not to Exceed 5% of Subtotal)1 LS 400,000.00$ $400,000
Construction Survey 1 LS 50,000.00$ $50,000
Construction Management & Inspection 1 LS 400,000.00$ $400,000Performed by Psomas
Stormwater Control/BMPs/SWPPP 1 LS 5,000.00$ $5,000
Clearing and Grubbing 1 LS 90,000.00$ $90,000 Per Greenbook
Traffic Control (Including Construction Signs and CMS) 1 LS 40,000.00$ $40,000
Right-of-Way Acquisition 214,988 SF 15.00$ $3,224,820
$4,209,820
Construct Type 8 Integral Curb and Gutter 10,560 LF 19.00$ 200,640$
Construct 4" PCC Sidewalk 254,000 SF $ 5.95 1,511,300$
Construct 8" Median Curb 0 LF $ 15.00 -$
Construct PCC Paving in Medians 8,500 SF $ 5.95 50,575$ Assume 18" band
Construct Curb Ramps 10 EA $ 2,390.00 23,900$
Subgrade Preparation 323,500 SF $ 0.36 116,460$ Top 6" of Soil
1-1/2" Cold Mill ($35,000 + $0.80/SF) 184,000 SF 0.80$ 147,200$
Construct 1-1/2" Overlay Asphalt Pavement 184,000 SF 0.90$ 165,600$
Construct 5" Asphalt Pavement/Aggregrate Base (5"/6") 323,500SF
4.00$ 1,294,000$
Full Depth
Construct Commercial Driveway 800 SF 10.75$ 8,600$
Construct Residential Driveway 700 SF 10.75$ 7,525$
Construct Cross Gutter 1 EA 5,000.00$ 5,000$
Construct Parkway Culvert 0 EA 1,500.00$ -$
Relocate Bus Shelter 0 EA 15,000.00$ -$
Widen Overpass 0 SF 1,000.00$ -$
3,530,800$
Adjust Sewer Manhole to Grade 5 EA 800.00$ $4,000
Adjust Unknown Manhole to Grade 0 EA 800.00$ $0
Adjust Vault to Grade 0 EA 3,000.00$ $0
Adjust Water Valve to Grade 3 EA 500.00$ $1,500
Relocate Manhole 0 EA 5,000.00$ $0
Relocate Power Pole 23 EA -$ $0SCE will handle the cost of
the relocation
Relocate Guy Wire 3 EA 15,000.00$ $45,000
Relocate Water Meter 1 EA 500.00$ $500
Relocate Street Light 2 EA 6,810.00$ $13,620
Relocate Fire Hydrant 1 EA 3,000.00$ $3,000
Relocate Vent 2 EA 10,000.00$ $20,000
Relocate Vault 0 EA 5,000.00$ $0
Relocate Cabinent 0 EA 5,000.00$ $0
Relocate Mailbox 10 EA 300.00$ $3,000
Relocate Pull Box 0 EA 700.00$ $0
Construct Catch Basin - 7' 0 EA 6,240.00$ $0
Construct Catch Basin - 14' 0 EA 11,350.00$ $0
Construct Local Depression 0 EA 1,192.00$ $0
Construct Concrete Collar 0 EA 2,980.00$ $0
Construct 18" RCP 0 LF 113.50$ $0
$90,620
Relocate Rail Signals 0 EA 250,000.00$ -$
Relocate Rail Bungalow 0 EA 50,000.00$ -$
$0
Median Landscaping 0 LF 100.00$ -$ No Street Trees or Parkway
Landscaping
Median Irrigation 0 LF 75.00$ -$ Mainline, conduit, POV
$0
Signing and Striping 1 LS 20,000.00$ 20,000$
$20,000
Subtotal = $7,851,240
$1,177,700
CONSTRUCTION TOTAL = $9,028,900
DESIGN TOTAL (20% OF Construction Costs) = $1,805,800
DESIGN TOTAL = $10,834,700
Contingency (15%) =
Road Construction
Signing and Striping Improvement
Landscaping and Irrigation Improvements
Utility Improvements
Road Construction Subtotal =
Rail Improvements
Miscellaneous Subtotal =
Utility Subtotal =
Rail Subtotal =
Landscaping Subtotal =
Signing and Striping Subtotal =
CITY OF RIALTOAlder between Renaissance and Base Line (5280 LF)
Preliminary Opinion on Probable Project Cost
Miscellaneous
Sierra Avenue Between I-15 NB Ramps and Riverside Avenue ROADWAY SEGMENT
Agenda item No. 3
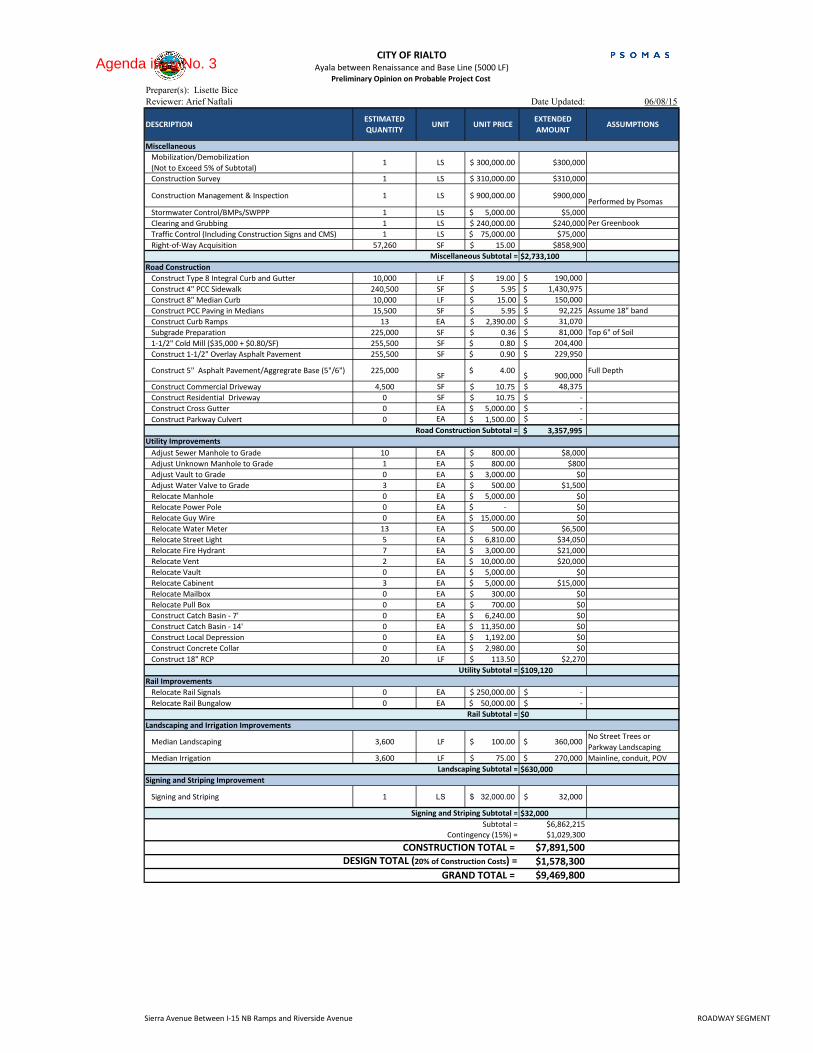
Preparer(s): Lisette Bice
Reviewer: Arief Naftali Date Updated: 06/08/15
DESCRIPTIONESTIMATED
QUANTITYUNIT UNIT PRICE
EXTENDED
AMOUNTASSUMPTIONS
Mobilization/Demobilization
(Not to Exceed 5% of Subtotal)1 LS 300,000.00$ $300,000
Construction Survey 1 LS 310,000.00$ $310,000
Construction Management & Inspection 1 LS 900,000.00$ $900,000Performed by Psomas
Stormwater Control/BMPs/SWPPP 1 LS 5,000.00$ $5,000
Clearing and Grubbing 1 LS 240,000.00$ $240,000 Per Greenbook
Traffic Control (Including Construction Signs and CMS) 1 LS 75,000.00$ $75,000
Right-of-Way Acquisition 57,260 SF 15.00$ $858,900
$2,733,100
Construct Type 8 Integral Curb and Gutter 10,000 LF 19.00$ 190,000$
Construct 4" PCC Sidewalk 240,500 SF $ 5.95 1,430,975$
Construct 8" Median Curb 10,000 LF $ 15.00 150,000$
Construct PCC Paving in Medians 15,500 SF $ 5.95 92,225$ Assume 18" band
Construct Curb Ramps 13 EA $ 2,390.00 31,070$
Subgrade Preparation 225,000 SF $ 0.36 81,000$ Top 6" of Soil
1-1/2" Cold Mill ($35,000 + $0.80/SF) 255,500 SF 0.80$ 204,400$
Construct 1-1/2" Overlay Asphalt Pavement 255,500 SF 0.90$ 229,950$
Construct 5" Asphalt Pavement/Aggregrate Base (5"/6") 225,000SF
4.00$ 900,000$
Full Depth
Construct Commercial Driveway 4,500 SF 10.75$ 48,375$
Construct Residential Driveway 0 SF 10.75$ -$
Construct Cross Gutter 0 EA 5,000.00$ -$
Construct Parkway Culvert 0 EA 1,500.00$ -$
3,357,995$
Adjust Sewer Manhole to Grade 10 EA 800.00$ $8,000
Adjust Unknown Manhole to Grade 1 EA 800.00$ $800
Adjust Vault to Grade 0 EA 3,000.00$ $0
Adjust Water Valve to Grade 3 EA 500.00$ $1,500
Relocate Manhole 0 EA 5,000.00$ $0
Relocate Power Pole 0 EA -$ $0
Relocate Guy Wire 0 EA 15,000.00$ $0
Relocate Water Meter 13 EA 500.00$ $6,500
Relocate Street Light 5 EA 6,810.00$ $34,050
Relocate Fire Hydrant 7 EA 3,000.00$ $21,000
Relocate Vent 2 EA 10,000.00$ $20,000
Relocate Vault 0 EA 5,000.00$ $0
Relocate Cabinent 3 EA 5,000.00$ $15,000
Relocate Mailbox 0 EA 300.00$ $0
Relocate Pull Box 0 EA 700.00$ $0
Construct Catch Basin - 7' 0 EA 6,240.00$ $0
Construct Catch Basin - 14' 0 EA 11,350.00$ $0
Construct Local Depression 0 EA 1,192.00$ $0
Construct Concrete Collar 0 EA 2,980.00$ $0
Construct 18" RCP 20 LF 113.50$ $2,270
$109,120
Relocate Rail Signals 0 EA 250,000.00$ -$
Relocate Rail Bungalow 0 EA 50,000.00$ -$
$0
Median Landscaping 3,600 LF 100.00$ 360,000$ No Street Trees or
Parkway Landscaping
Median Irrigation 3,600 LF 75.00$ 270,000$ Mainline, conduit, POV
$630,000
Signing and Striping 1 LS 32,000.00$ 32,000$
$32,000
Subtotal = $6,862,215
$1,029,300
CONSTRUCTION TOTAL = $7,891,500
DESIGN TOTAL (20% of Construction Costs) = $1,578,300
GRAND TOTAL = $9,469,800
Contingency (15%) =
Road Construction
Signing and Striping Improvement
Landscaping and Irrigation Improvements
Utility Improvements
Road Construction Subtotal =
Rail Improvements
Miscellaneous Subtotal =
Utility Subtotal =
Rail Subtotal =
Landscaping Subtotal =
Signing and Striping Subtotal =
CITY OF RIALTOAyala between Renaissance and Base Line (5000 LF)
Preliminary Opinion on Probable Project Cost
Miscellaneous
Sierra Avenue Between I-15 NB Ramps and Riverside Avenue ROADWAY SEGMENT
Agenda item No. 3
Appendix
APPENDIX E: FAIR SHARE CALCULATION SHEETS
Agenda item No. 3
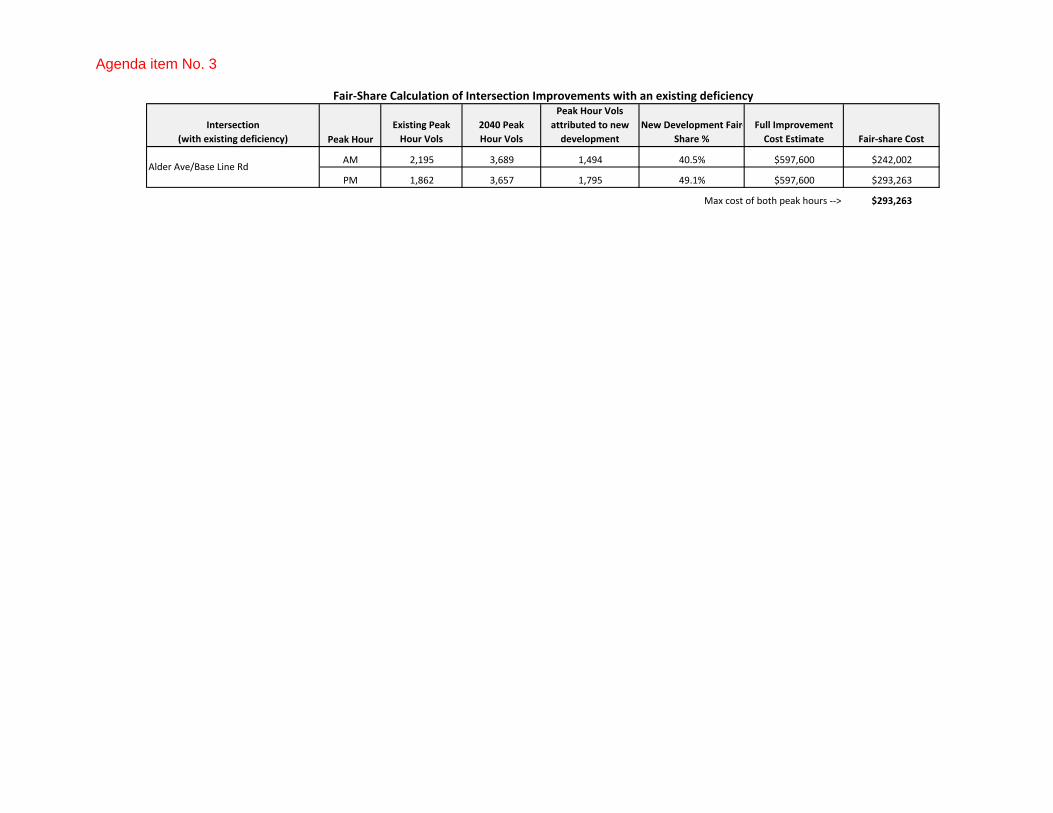
Intersection
(with existing deficiency) Peak Hour
Existing Peak
Hour Vols
2040 Peak
Hour Vols
Peak Hour Vols
attributed to new
development
New Development Fair‐
Share %
Full Improvement
Cost Estimate Fair‐share Cost
AM 2,195 3,689 1,494 40.5% $597,600 $242,002
PM 1,862 3,657 1,795 49.1% $597,600 $293,263
Max cost of both peak hours ‐‐> $293,263
Fair‐Share Calculation of Intersection Improvements with an existing deficiency
Alder Ave/Base Line Rd
Agenda item No. 3

Roadway (with existing deficiency) Existing ADT
2040 ADT
(post‐processed)
2040 Peak
Hour Vols
New Development
Fair‐Share %
Full Improvement Cost
Estimate Fair‐share Cost
Alder Ave between Renaissance Pkwy and Base Line Rd 15,983 20,553 4,570 22.2% $10,834,700 $2,409,075
Ayala Ave between Renaissance Pkwy and Base Line Rd 23,488 25,163 1,675 6.7% $9,469,800 $630,355
Total ‐‐> $3,039,430
Fair‐Share Calculation of Roadway Improvements with an existing deficiency
Agenda item No. 3
Traffic Signal Priority List Update Transportation Commission Page 1
CITY OF RIALTO
TRANSPORTATION COMMISSION STAFF REPORT For Commission Meeting of February 1, 2017
TO: Chair and Members of the Transportation Commission
FROM: Robert G. Eisenbeisz, P.E., Public Works Director/City Engineer
SUBJECT: Traffic Signal Prioritization Update
DATE: December 20, 2016
BACKGROUND: On November 19, 2003, the Transportation Commission adopted a City-Wide Traffic Signal Construction priority list. The list was based on a Transportation Commission policy and rating system that was adopted on September 17, 2003 that established rating criteria that considered accident rates, usage, volumes, speed and special conditions. At the May 16, 2007 meeting of the Transportation Commission, the priority list was updated. In 2008-2013, the list was reconsidered with little or no change in the rankings or the addition of streets and therefore remained relatively unchanged. The four highest-ranking locations were either done or are in progress and included Valley Boulevard/Cactus Avenue (done), Riverside Avenue/Locust Avenue (done), Valley Boulevard/Willow Avenue (in progress), Riverside Avenue/Linden Avenue (in progress). The creation of a priority list was based on the need to effectively and efficiently rank projects for the installation of traffic signals that employed some repeatable numerical ranking of the locations to be funded. Some developments within the City, as the result of a project specific Traffic Impact Analysis, may be conditioned to install signals that benefit their project or to address operational problems at nearby intersections resulting from the project. These signals are generally not on the priority list. The CMP Nexus study may provide partial funding for intersections along regionally significant arterials listed in the CMP, which may also receive funding from nearby developments. The traffic signal priority list is used primarily for the funding of traffic signals that are not related to specific development or that are on the Nexus list. These other locations within the City that are not on the CMP system and/or do not have significant development nearby that could contribute to a traffic signal are funded within the City budget. The priority list helps establish the budget and provide for funding the most needed locations. The rankings assist in this process but are by no means a list that provides the order in which improvements are made. Other factors are considered and the ranking order is not an absolute listing of the order in which improvements are made. In 2013, the Public Works Department engaged Willdan Engineering to review the current priority list and update the information in the ranking as well as add additional locations for consideration. In 2013, as the priority list was being considered, the ranking system that had been used in the past was not readily available. Willdan created a new ranking system that was proposed to be used once signal warrants had been met for an
Agenda Item No. 4

Traffic Signal Priority List Update Transportation Commission Page 2
intersection. The proposed new ranking system generated rankings that were inconsistent with all previous rankings the City had adopted. Review of the ranking system revealed what appeared to be an overweight ranking of factors not related to traffic issues. Willdan reviewed the existing traffic signal priority list in addition to several other locations at the request of the department and prepared a ranking of the intersections using the proposed new method. Many locations on the existing list had been completed or were in the process of being completed but as mentioned, the remaining locations were no longer consistent with previous rankings from 2003 forward. However, staff was able to locate the original ranking method as well as review methods used in other agencies to rank signal priority locations. Willdan successfully modified the ranking spreadsheet to reflect what had been done in the past as well as update with additional locations. The attached memo to file explains the ranking system and the factors that go into the rankings. ANALYSIS/DISCUSSION: In the adjusted ranking system, factors considered were 1) Interruption of Continuous traffic, 1) Accident experience, 2) Traffic Volume, 3) Speed, 4) Safety which considers the number of accidents and if they are injury or property damage, 5) Accident rate which considers the rate of accidents per million vehicles, 6) Pedestrian/bicycles, 7) Special Conditions which includes truck routes, percentage of trucks, schools and other special factors. Accident experience has no maximum points but considers only the previous 3 years of accident history. Pedestrian/Bicycles has a maximum of 5 points with equal point values for general pedestrian, school pedestrian and being on a bike or safe route to school designated route. Average daily traffic has 10 points maximum with the maximum being for streets with greater than 5,000. Interruption of traffic is maximum of 10 points and looks at the highest 4-hour period. Speed has a maximum of 4 points, which requires 51 mph or higher speed. Accident rate 10 point maximum and requires an accident rate above 2.01 to earn 10 points. Special conditions have a maximum of 5 points. This system comes very close to what was used in the past to rank intersections. It is worth noting that rankings can and do change with adjustments to traffic volumes. The total volume affects accident rate, volume rankings and other factors and data suggests that several streets have had reductions in overall traffic during the period of 2003 to 2016. As an example, Base Line Road at Tamarind Avenue in the 2008 ranking had a volume of 22,654 ADT but in 2016 the ADT was 12,733 a 44% reduction in overall traffic. Willdan has reviewed 14 intersections to see if signal warrants are met. Of the 14 intersections, only four locations met traffic signal warrants. Willdan then considered another location to see if protected left turn warrants might be met at a currently signalized intersection. The intersection checked did not meet warrants for protected left turns. In 2003, there were 18 intersections on the priority list. In 2007, when the list was updated, all but six of the locations had signals installed. The 2007 list carried over the six from the 2003 list and added eight new locations for a total of 14 locations. Today, eight of those locations remain without traffic signals. All eight of those intersections were checked but only two met warrants. Those two locations along with two new locations currently meet traffic signal warrants.
Agenda Item No. 4

Traffic Signal Priority List Update Transportation Commission Page 3
Intersections currently meeting a signal warrant or warrants are listed below with their point ranking.
1. Base Line Road at Tamarind Avenue* .......................... 27 points 2. Merrill Avenue at Lilac Avenue ..................................... 26 points 3. Base Line Road at Fitzgerald Avenue .......................... 23 points 4. Rialto Avenue at Acacia Avenue* ................................. 14 points
*included in 2008, 2009 and 2012 priority list
In the current priority list, the following intersection may rank higher in point value but do not currently meet traffic signal warrants:
1. Linden Avenue at Merrill Avenue .................................. 29 points 2. Spruce Avenue at Valley Boulevard ............................. 23 points 3. Rialto Avenue at Lilac Avenue ...................................... 22 points 4. Cedar Avenue at Hawthorne Street .............................. 22 points 5. Rialto Avenue at Eucalyptus Avenue ............................ 20 points 6. Pepper Avenue at Etiwanda Avenue ............................ 18 points 7. Rialto Avenue at Maple Avenue .................................... 18 points 8. Maple Avenue at Merrill Avenue ................................... 16 points 9. Sycamore Avenue at Randall Avenue .......................... 16 points 10. Larch Avenue at Foothill Boulevard .............................. 13 points The spreadsheet tabulation also shows that seven of the intersections are joint jurisdictional intersections with Fontana, San Bernardino or San Bernardino County. Of the original 2007 list, the six remaining intersections are:
A. Riverside Avenue at Linden Avenue (construction in progress) B. Rialto Avenue at Maple Avenues C. Cactus Avenue at Casmalia Street (not on current list but scored only 5 points from
2007 – 2012) D. Rialto Avenue at Lilac Avenue E. Pepper Avenue at Etiwanda Avenue F. Sycamore Avenue at Randall Avenue Many factors go into the decision of which signals will be installed and in what order. In some cases, the public is better served by the installation of a lower ranked signal when all factors are considered. It is also possible that joint jurisdictional signals require additional time to make arrangements between agencies to install and maintain the required traffic signals. In the proposed 2016 update, the additional intersections added for consideration that were not on previous years priority rankings are:
1. Merrill Avenue at Linden Avenue .................................. 29 points 2. Base Line Road at Fitzgerald Avenue .......................... 23 points 3. Spruce Avenue at Valley Boulevard ............................. 23 points 4. Cedar Avenue at Hawthorne Street .............................. 22 points 5. Rialto Avenue at Eucalyptus Avenue ............................ 20 points
Agenda Item No. 4
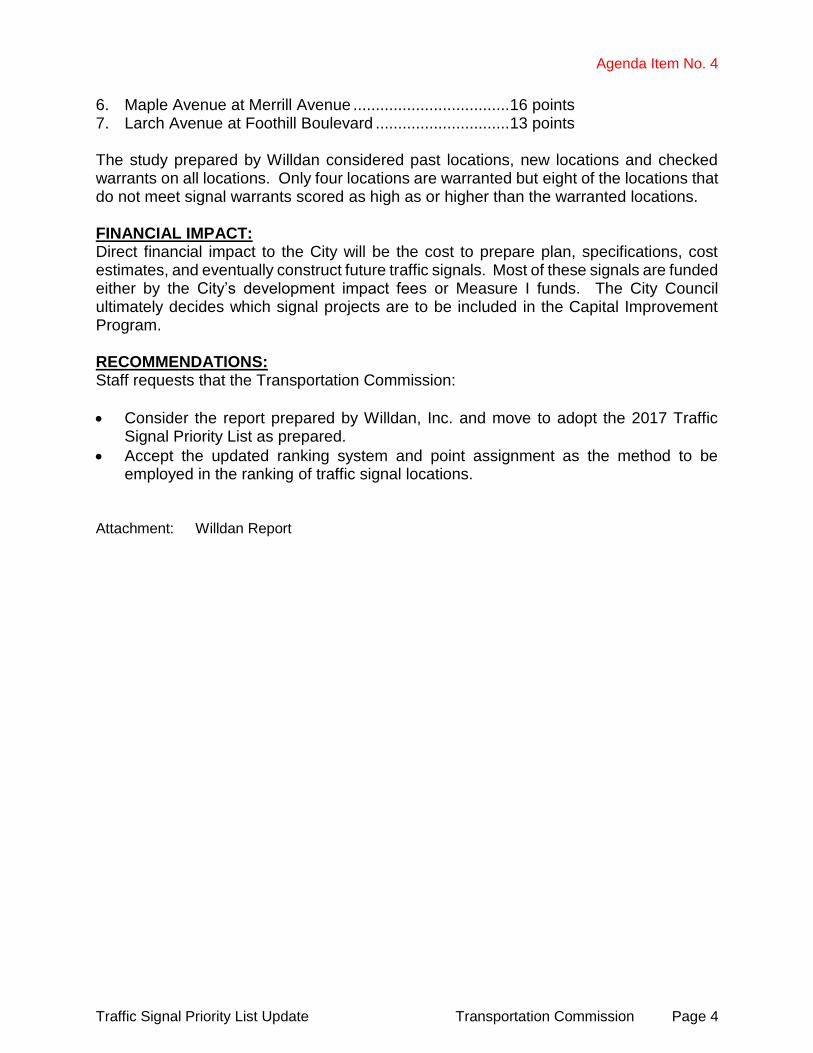
Traffic Signal Priority List Update Transportation Commission Page 4
6. Maple Avenue at Merrill Avenue ................................... 16 points 7. Larch Avenue at Foothill Boulevard .............................. 13 points The study prepared by Willdan considered past locations, new locations and checked warrants on all locations. Only four locations are warranted but eight of the locations that do not meet signal warrants scored as high as or higher than the warranted locations. FINANCIAL IMPACT: Direct financial impact to the City will be the cost to prepare plan, specifications, cost estimates, and eventually construct future traffic signals. Most of these signals are funded either by the City’s development impact fees or Measure I funds. The City Council ultimately decides which signal projects are to be included in the Capital Improvement Program. RECOMMENDATIONS: Staff requests that the Transportation Commission:
Consider the report prepared by Willdan, Inc. and move to adopt the 2017 Traffic Signal Priority List as prepared.
Accept the updated ranking system and point assignment as the method to be employed in the ranking of traffic signal locations.
Attachment: Willdan Report
Agenda Item No. 4

October 11, 2016 Mr. Robert Eisenbeisz, PE Public Works Director/ City Engineer City of Rialto 150 S. Palm Avenue Rialto, CA 92376 Subject: DRAFT: Traffic signal prioritization and ranking for traffic signal installation
for the City of Rialto. Dear Mr. Eisenbeisz: Willdan Engineering is pleased to submit the results from the traffic signal priority rating list for the un-signalized intersections provided by the City of Rialto. PROJECT DISCRIPTION The City tasked Willdan Engineering to analyze and rank intersections that are candidates for installation of new traffic signals. Willdan updated the ranking process that was developed in 2003 by the City, analyzed the intersections and developed a priority list of intersections. DATA To analyze and prioritize un-signalized intersections for possible traffic signal installation, we collected 24-hour traffic volume counts, pedestrian counts, and gap analysis data. 24-hour counts were used to perform traffic signal warrants analyses, which include 8-hour volume warrants, 4-hour volume warrants and peak hour volume warrants. Data were collected only for intersections that previously were not collected. The new 24-hour traffic volume counts are included in Appendix A. The pedestrian counts were collected for 2-hour periods; one hour in the morning and one hour in the afternoon. The data are included in Appendix B. Gap analysis data were collected for the school crossing warrant. The gap analysis was collected on December 9, 2014 and January 7, 2015 at 4 locations. The gap analysis data are presented in Appendix C. The accident data reviewed for the study was from the Statewide Integrated Traffic Records System database using data from January 2012 thru December 2014. The analysis included accidents involving vehicles, pedestrians and bicyclists within 250-feet from each crosswalk. The reported accident data is included in Appendix D.
Agenda Item No. 4 Attachment
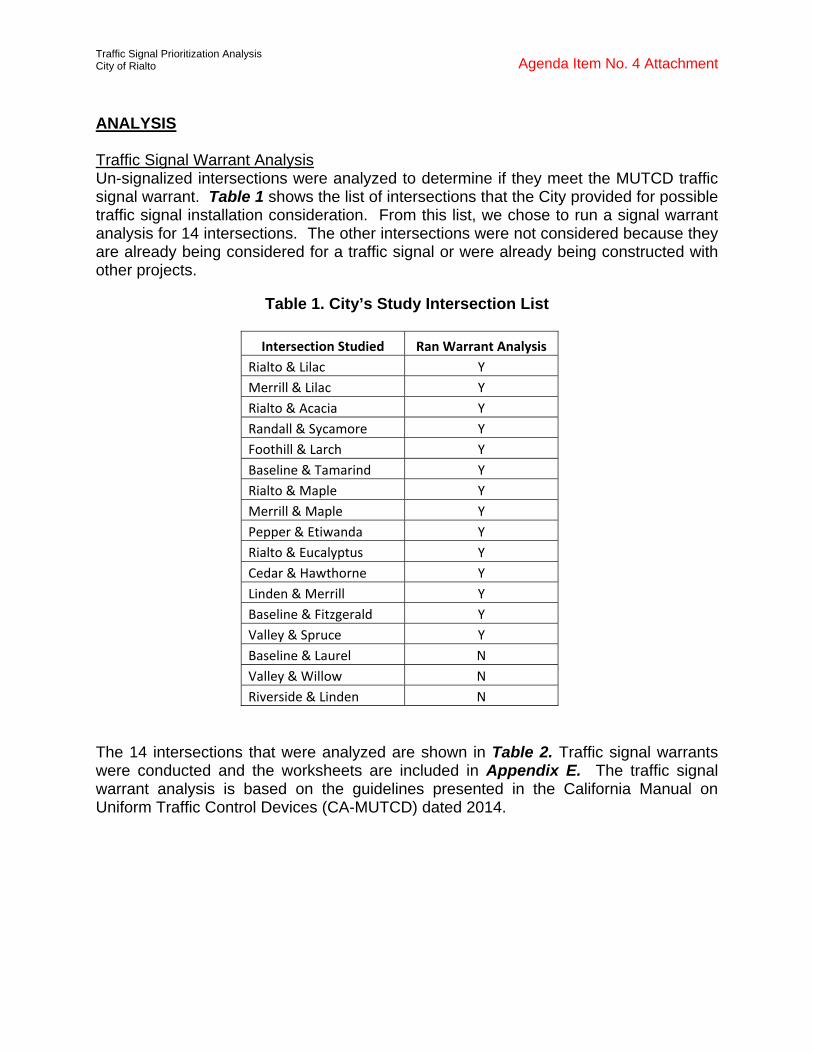
Traffic Signal Prioritization Analysis City of Rialto
ANALYSIS Traffic Signal Warrant Analysis Un-signalized intersections were analyzed to determine if they meet the MUTCD traffic signal warrant. Table 1 shows the list of intersections that the City provided for possible traffic signal installation consideration. From this list, we chose to run a signal warrant analysis for 14 intersections. The other intersections were not considered because they are already being considered for a traffic signal or were already being constructed with other projects.
Table 1. City’s Study Intersection List
Intersection Studied Ran Warrant Analysis
Rialto & Lilac Y
Merrill & Lilac Y
Rialto & Acacia Y
Randall & Sycamore Y
Foothill & Larch Y
Baseline & Tamarind Y
Rialto & Maple Y
Merrill & Maple Y
Pepper & Etiwanda Y
Rialto & Eucalyptus Y
Cedar & Hawthorne Y
Linden & Merrill Y
Baseline & Fitzgerald Y
Valley & Spruce Y
Baseline & Laurel N
Valley & Willow N
Riverside & Linden N
The 14 intersections that were analyzed are shown in Table 2. Traffic signal warrants were conducted and the worksheets are included in Appendix E. The traffic signal warrant analysis is based on the guidelines presented in the California Manual on Uniform Traffic Control Devices (CA-MUTCD) dated 2014.
Agenda Item No. 4 Attachment

Traffic Signal Prioritization Analysis City of Rialto
Table 2. Studied Intersections
Intersection # North-South Approach East-West Approach 1 S. Lilac Avenue W. Rialto Avenue
2 S. Lilac Avenue W. Merrill Avenue
3 N. Acacia Avenue E. Rialto Avenue
4 S. Sycamore Avenue E. Randall Avenue
5 N. Larch Avenue E. Foothill Boulevard
6 N. Tamarind Avenue E. Baseline Road
7 N. Maple Avenue W. Rialto Avenue
8 S. Maple Avenue Merrill Avenue
9 N. Pepper Avenue E. Etiwanda Avenue
10 S. Eucalyptus Avenue E. Rialto Avenue
11 Cedar Avenue Hawthorne Avenue
12 S. Linden Avenue W. Merrill Avenue
13 N. Fitzgerald Avenue E. Baseline Road
14 Spruce Avenue W. Valley Boulevard Of the intersections analyzed, only four met the traffic signal warrant requirements. The four that passed are shown in Table 3.
Table 3. Warranted Traffic Signal Locations
Intersection # North-South Approach East-West Approach Traffic Signal Warrant met
2 S. Lilac Avenue W. Merrill Avenue Yes
3 N. Acacia Avenue E. Rialto Avenue Yes
6 N. Tamarind Avenue E. Baseline Road Yes
13 N. Fitzgerald Avenue E. Baseline Road Yes
Traffic Signal Prioritization A traffic signal priority rating system, outlined in Appendix F was used for determining a ranking system for un-signalized intersections regardless of meeting traffic signal warrants or not. When multiple locations are considered for traffic signal installation it is desirable to establish a rating system that impartially ranks intersections based on variety of factors that carry points. the following factors are considered in the ranking system:
Interruption of Flow on the Main Roadway Traffic Volume
Agenda Item No. 4 Attachment
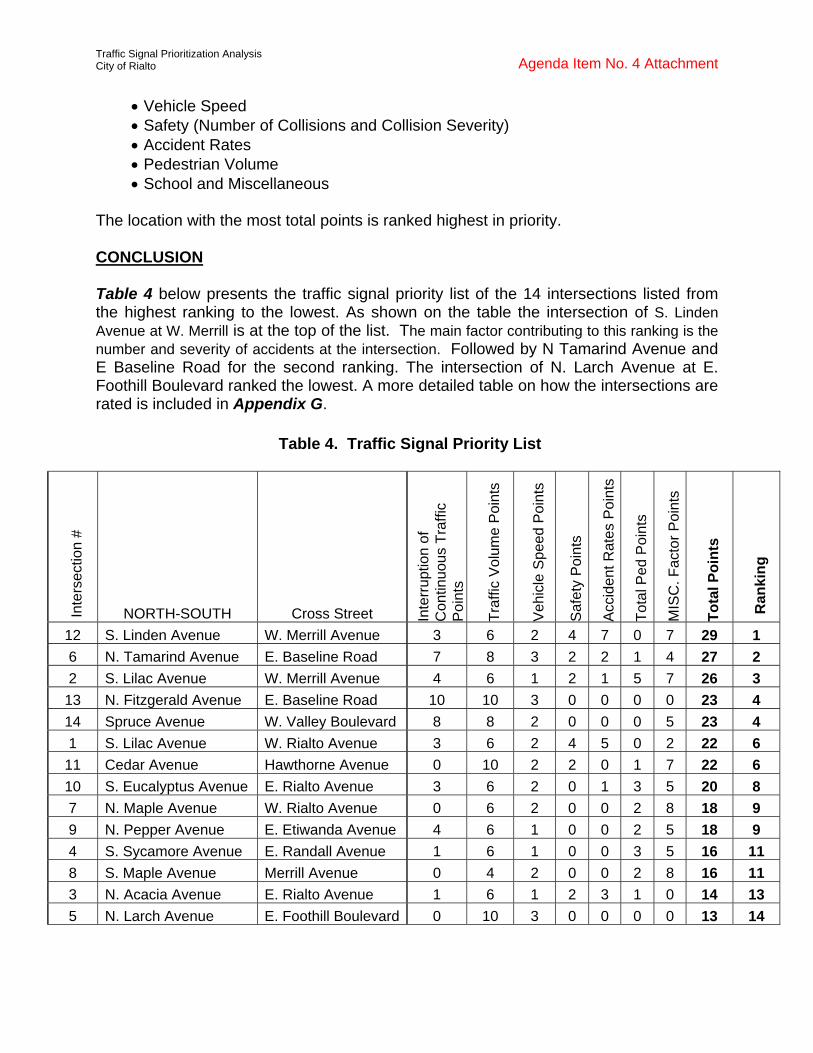
Traffic Signal Prioritization Analysis City of Rialto
Vehicle Speed Safety (Number of Collisions and Collision Severity) Accident Rates Pedestrian Volume School and Miscellaneous
The location with the most total points is ranked highest in priority. CONCLUSION Table 4 below presents the traffic signal priority list of the 14 intersections listed from the highest ranking to the lowest. As shown on the table the intersection of S. Linden Avenue at W. Merrill is at the top of the list. The main factor contributing to this ranking is the number and severity of accidents at the intersection. Followed by N Tamarind Avenue and E Baseline Road for the second ranking. The intersection of N. Larch Avenue at E. Foothill Boulevard ranked the lowest. A more detailed table on how the intersections are rated is included in Appendix G.
Table 4. Traffic Signal Priority List
Int
erse
ctio
n #
NORTH-SOUTH Cross Street Inte
rrup
tion
of
Con
tinuo
us T
raff
ic
Poi
nts
Tra
ffic
Vol
ume
Poi
nts
Veh
icle
Spe
ed P
oint
s
Saf
ety
Poi
nts
Acc
iden
t Rat
es P
oint
s
Tot
al P
ed P
oint
s
MIS
C. F
acto
r P
oint
s
To
tal P
oin
ts
Ran
kin
g
12 S. Linden Avenue W. Merrill Avenue 3 6 2 4 7 0 7 29 1
6 N. Tamarind Avenue E. Baseline Road 7 8 3 2 2 1 4 27 2
2 S. Lilac Avenue W. Merrill Avenue 4 6 1 2 1 5 7 26 3
13 N. Fitzgerald Avenue E. Baseline Road 10 10 3 0 0 0 0 23 4
14 Spruce Avenue W. Valley Boulevard 8 8 2 0 0 0 5 23 4
1 S. Lilac Avenue W. Rialto Avenue 3 6 2 4 5 0 2 22 6
11 Cedar Avenue Hawthorne Avenue 0 10 2 2 0 1 7 22 6
10 S. Eucalyptus Avenue E. Rialto Avenue 3 6 2 0 1 3 5 20 8
7 N. Maple Avenue W. Rialto Avenue 0 6 2 0 0 2 8 18 9
9 N. Pepper Avenue E. Etiwanda Avenue 4 6 1 0 0 2 5 18 9
4 S. Sycamore Avenue E. Randall Avenue 1 6 1 0 0 3 5 16 11
8 S. Maple Avenue Merrill Avenue 0 4 2 0 0 2 8 16 11
3 N. Acacia Avenue E. Rialto Avenue 1 6 1 2 3 1 0 14 13
5 N. Larch Avenue E. Foothill Boulevard 0 10 3 0 0 0 0 13 14
Agenda Item No. 4 Attachment
Traffic Signal Prioritization Analysis City of Rialto
We appreciate this opportunity to serve the City of Rialto and the assistance and cooperation afforded to us during the course of this study. Should you have any questions, please contact me at (562) 368-4848. Very truly yours, WILLDAN ENGINEERING Vanessa Munoz, PE, TE, PTOE Deputy Director of Engineering
Appendices A – 24-Hour ADT Counts B – Pedestrian Peak Hour Counts C – Pedestrian Gap Counts D – Turning Movement Counts E – Collisions F – CA MUTCD Traffic Signal Warrants Summary Reports G – Traffic Signal Priority Rating System H – Traffic Signal Priority Rating List
Agenda Item No. 4 Attachment
Traffic Signal Prioritization Analysis City of Rialto
APPENDIX A
24-Hour ADT Counts
Agenda Item No. 4 Attachment

Counts Unlimietd, Inc.PO Box 1178
Corona, CA 92878(951) 268-6268
City of Rialto N/S: Acacia Avenue E/W: Rialto Avenue 24 Hour Entering Volume Count
RLT003EWSite Code: 047-13055Date Start: 21-Feb-13Date End: 21-Feb-13
Page 1
Start21-Feb-
13Eastbound Hour Totals Westbound Hour Totals Combined Totals
Time Thu Morning Afternoon Morning Afternoon Morning Afternoon Morning Afternoon Morning Afternoon12:00 6 32 5 7212:15 6 49 4 5312:30 6 42 4 6512:45 7 39 25 162 4 64 17 254 42 41601:00 3 55 9 5501:15 2 43 1 5301:30 1 59 7 5501:45 1 57 7 214 1 75 18 238 25 45202:00 2 62 4 7902:15 4 57 1 7002:30 1 49 1 8602:45 3 47 10 215 5 91 11 326 21 54103:00 1 55 1 94
03:15 1 39 6 8803:30 3 63 3 8703:45 5 54 10 211 4 74 14 343 24 55404:00 4 60 6 7704:15 4 59 4 6604:30 4 57 20 7204:45 6 64 18 240 13 65 43 280 61 52005:00 7 63 12 7905:15 1 92 16 9505:30 12 44 21 8505:45 8 61 28 260 16 84 65 343 93 60306:00 10 67 8 7006:15 14 57 23 8406:30 26 37 31 6606:45 23 37 73 198 35 53 97 273 170 47107:00 32 43 54 4507:15 52 29 47 5907:30 80 36 79 4107:45 54 26 218 134 122 45 302 190 520 32408:00 54 39 55 3408:15 36 26 42 3008:30 30 30 41 4008:45 41 31 161 126 49 32 187 136 348 26209:00 37 20 44 2309:15 33 11 49 2209:30 40 20 37 1709:45 36 23 146 74 49 22 179 84 325 15810:00 30 18 55 2110:15 23 12 62 2010:30 34 4 35 1310:45 38 9 125 43 47 10 199 64 324 10711:00 38 11 45 511:15 41 9 67 1711:30 39 5 58 1211:45 43 8 161 33 50 9 220 43 381 76Total 982 1910 982 1910 1352 2574 1352 2574 2334 4484
Combined Total
2892 2892 3926 3926 6818
AM Peak 07:15 07:15 Vol. 240 303
P.H.F. 0.750 0.621 PM Peak 04:30 02:45
Vol. 276 360 P.H.F. 0.750 0.957
Percentag
e 34.0% 66.0% 34.4% 65.6%
ADT/AADT
ADT 6,818 AADT 6,818
Agenda Item No. 4 Attachment
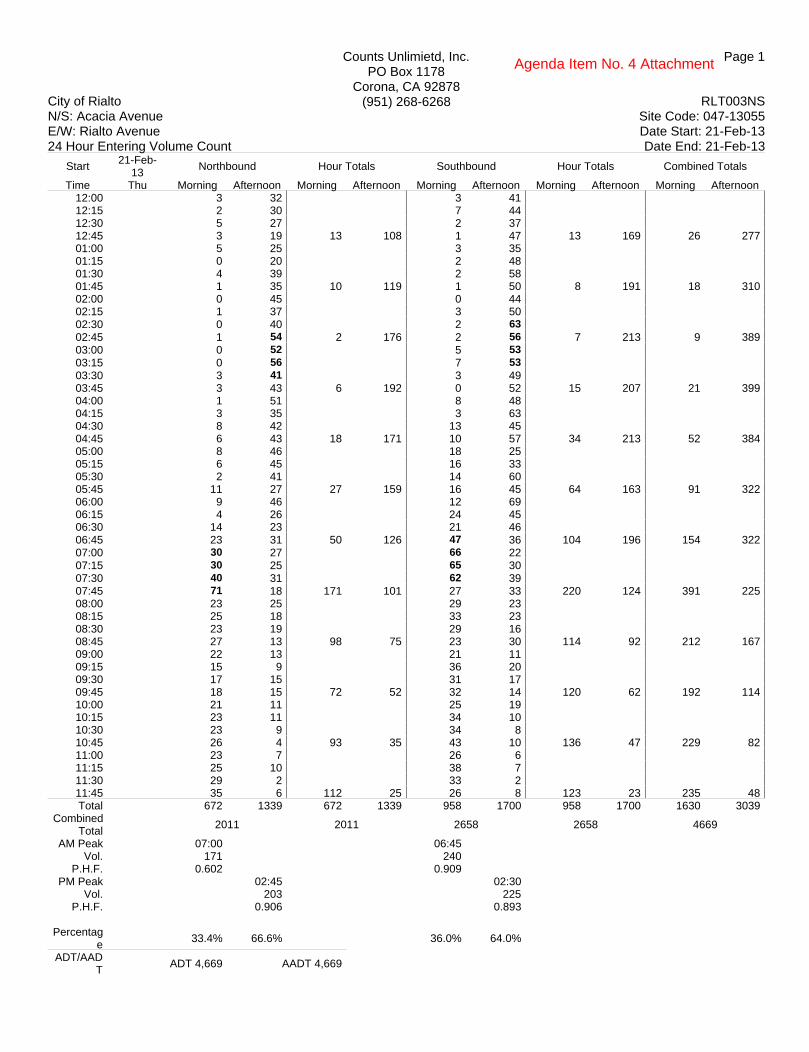
Counts Unlimietd, Inc.PO Box 1178
Corona, CA 92878(951) 268-6268
City of Rialto N/S: Acacia Avenue E/W: Rialto Avenue 24 Hour Entering Volume Count
RLT003NSSite Code: 047-13055Date Start: 21-Feb-13Date End: 21-Feb-13
Page 1
Start21-Feb-
13Northbound Hour Totals Southbound Hour Totals Combined Totals
Time Thu Morning Afternoon Morning Afternoon Morning Afternoon Morning Afternoon Morning Afternoon12:00 3 32 3 4112:15 2 30 7 4412:30 5 27 2 3712:45 3 19 13 108 1 47 13 169 26 27701:00 5 25 3 3501:15 0 20 2 4801:30 4 39 2 5801:45 1 35 10 119 1 50 8 191 18 31002:00 0 45 0 4402:15 1 37 3 5002:30 0 40 2 63
02:45 1 54 2 176 2 56 7 213 9 38903:00 0 52 5 53
03:15 0 56 7 53
03:30 3 41 3 4903:45 3 43 6 192 0 52 15 207 21 39904:00 1 51 8 4804:15 3 35 3 6304:30 8 42 13 4504:45 6 43 18 171 10 57 34 213 52 38405:00 8 46 18 2505:15 6 45 16 3305:30 2 41 14 6005:45 11 27 27 159 16 45 64 163 91 32206:00 9 46 12 6906:15 4 26 24 4506:30 14 23 21 4606:45 23 31 50 126 47 36 104 196 154 32207:00 30 27 66 2207:15 30 25 65 3007:30 40 31 62 3907:45 71 18 171 101 27 33 220 124 391 22508:00 23 25 29 2308:15 25 18 33 2308:30 23 19 29 1608:45 27 13 98 75 23 30 114 92 212 16709:00 22 13 21 1109:15 15 9 36 2009:30 17 15 31 1709:45 18 15 72 52 32 14 120 62 192 11410:00 21 11 25 1910:15 23 11 34 1010:30 23 9 34 810:45 26 4 93 35 43 10 136 47 229 8211:00 23 7 26 611:15 25 10 38 711:30 29 2 33 211:45 35 6 112 25 26 8 123 23 235 48Total 672 1339 672 1339 958 1700 958 1700 1630 3039
Combined Total
2011 2011 2658 2658 4669
AM Peak 07:00 06:45 Vol. 171 240
P.H.F. 0.602 0.909 PM Peak 02:45 02:30
Vol. 203 225 P.H.F. 0.906 0.893
Percentag
e 33.4% 66.6% 36.0% 64.0%
ADT/AADT
ADT 4,669 AADT 4,669
Agenda Item No. 4 Attachment
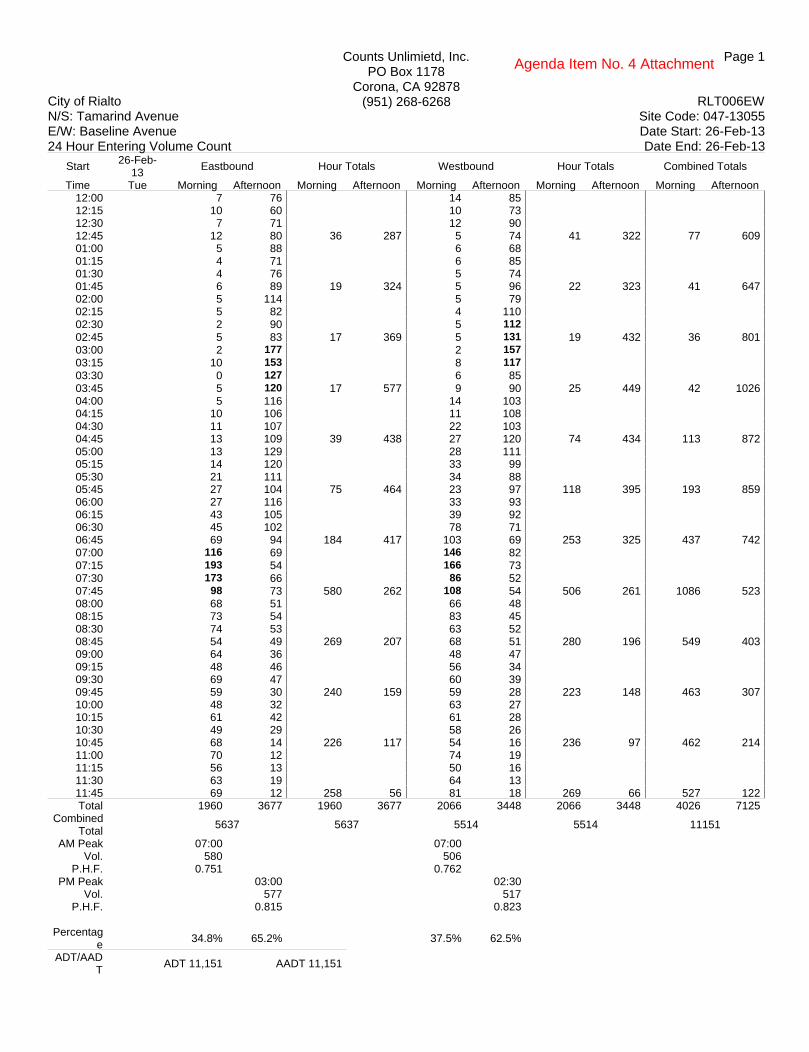
Counts Unlimietd, Inc.PO Box 1178
Corona, CA 92878(951) 268-6268
City of Rialto N/S: Tamarind Avenue E/W: Baseline Avenue 24 Hour Entering Volume Count
RLT006EWSite Code: 047-13055Date Start: 26-Feb-13Date End: 26-Feb-13
Page 1
Start26-Feb-
13Eastbound Hour Totals Westbound Hour Totals Combined Totals
Time Tue Morning Afternoon Morning Afternoon Morning Afternoon Morning Afternoon Morning Afternoon12:00 7 76 14 8512:15 10 60 10 7312:30 7 71 12 9012:45 12 80 36 287 5 74 41 322 77 60901:00 5 88 6 6801:15 4 71 6 8501:30 4 76 5 7401:45 6 89 19 324 5 96 22 323 41 64702:00 5 114 5 7902:15 5 82 4 11002:30 2 90 5 112
02:45 5 83 17 369 5 131 19 432 36 80103:00 2 177 2 157
03:15 10 153 8 117
03:30 0 127 6 8503:45 5 120 17 577 9 90 25 449 42 102604:00 5 116 14 10304:15 10 106 11 10804:30 11 107 22 10304:45 13 109 39 438 27 120 74 434 113 87205:00 13 129 28 11105:15 14 120 33 9905:30 21 111 34 8805:45 27 104 75 464 23 97 118 395 193 85906:00 27 116 33 9306:15 43 105 39 9206:30 45 102 78 7106:45 69 94 184 417 103 69 253 325 437 74207:00 116 69 146 8207:15 193 54 166 7307:30 173 66 86 5207:45 98 73 580 262 108 54 506 261 1086 52308:00 68 51 66 4808:15 73 54 83 4508:30 74 53 63 5208:45 54 49 269 207 68 51 280 196 549 40309:00 64 36 48 4709:15 48 46 56 3409:30 69 47 60 3909:45 59 30 240 159 59 28 223 148 463 30710:00 48 32 63 2710:15 61 42 61 2810:30 49 29 58 2610:45 68 14 226 117 54 16 236 97 462 21411:00 70 12 74 1911:15 56 13 50 1611:30 63 19 64 1311:45 69 12 258 56 81 18 269 66 527 122Total 1960 3677 1960 3677 2066 3448 2066 3448 4026 7125
Combined Total
5637 5637 5514 5514 11151
AM Peak 07:00 07:00 Vol. 580 506
P.H.F. 0.751 0.762 PM Peak 03:00 02:30
Vol. 577 517 P.H.F. 0.815 0.823
Percentag
e 34.8% 65.2% 37.5% 62.5%
ADT/AADT
ADT 11,151 AADT 11,151
Agenda Item No. 4 Attachment
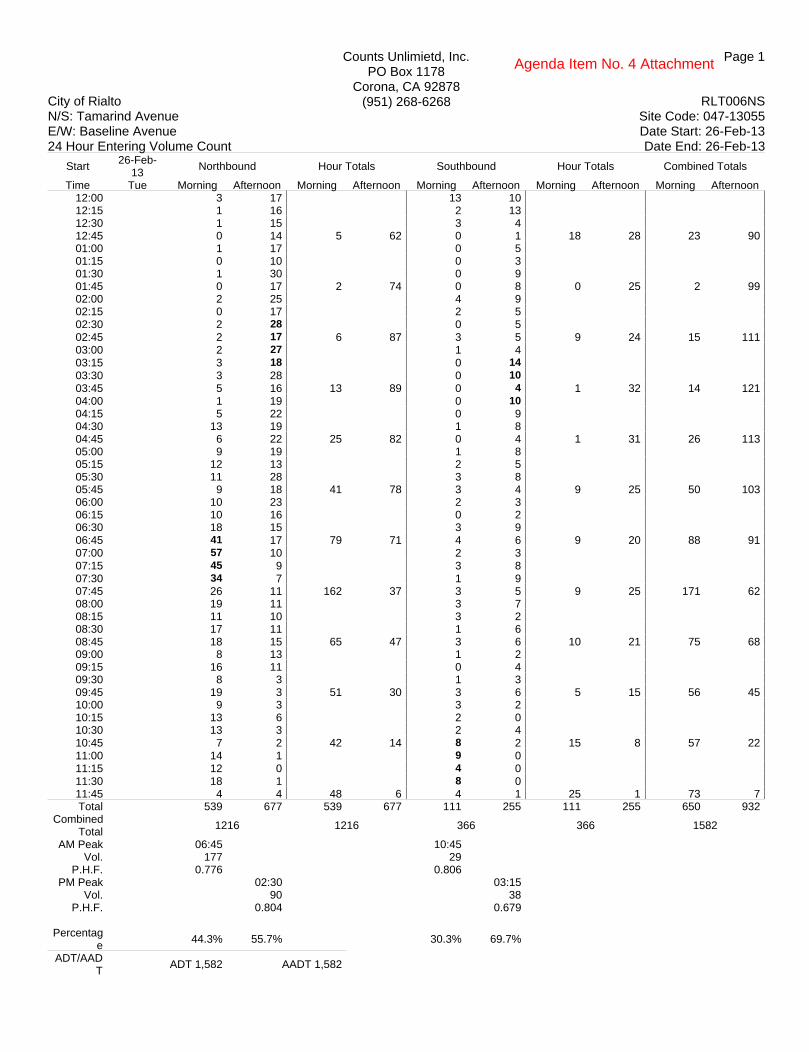
Counts Unlimietd, Inc.PO Box 1178
Corona, CA 92878(951) 268-6268
City of Rialto N/S: Tamarind Avenue E/W: Baseline Avenue 24 Hour Entering Volume Count
RLT006NSSite Code: 047-13055Date Start: 26-Feb-13Date End: 26-Feb-13
Page 1
Start26-Feb-
13Northbound Hour Totals Southbound Hour Totals Combined Totals
Time Tue Morning Afternoon Morning Afternoon Morning Afternoon Morning Afternoon Morning Afternoon12:00 3 17 13 1012:15 1 16 2 1312:30 1 15 3 412:45 0 14 5 62 0 1 18 28 23 9001:00 1 17 0 501:15 0 10 0 301:30 1 30 0 901:45 0 17 2 74 0 8 0 25 2 9902:00 2 25 4 902:15 0 17 2 502:30 2 28 0 502:45 2 17 6 87 3 5 9 24 15 11103:00 2 27 1 403:15 3 18 0 14
03:30 3 28 0 10
03:45 5 16 13 89 0 4 1 32 14 12104:00 1 19 0 1004:15 5 22 0 904:30 13 19 1 804:45 6 22 25 82 0 4 1 31 26 11305:00 9 19 1 805:15 12 13 2 505:30 11 28 3 805:45 9 18 41 78 3 4 9 25 50 10306:00 10 23 2 306:15 10 16 0 206:30 18 15 3 906:45 41 17 79 71 4 6 9 20 88 9107:00 57 10 2 307:15 45 9 3 807:30 34 7 1 907:45 26 11 162 37 3 5 9 25 171 6208:00 19 11 3 708:15 11 10 3 208:30 17 11 1 608:45 18 15 65 47 3 6 10 21 75 6809:00 8 13 1 209:15 16 11 0 409:30 8 3 1 309:45 19 3 51 30 3 6 5 15 56 4510:00 9 3 3 210:15 13 6 2 010:30 13 3 2 410:45 7 2 42 14 8 2 15 8 57 2211:00 14 1 9 011:15 12 0 4 011:30 18 1 8 011:45 4 4 48 6 4 1 25 1 73 7Total 539 677 539 677 111 255 111 255 650 932
Combined Total
1216 1216 366 366 1582
AM Peak 06:45 10:45 Vol. 177 29
P.H.F. 0.776 0.806 PM Peak 02:30 03:15
Vol. 90 38 P.H.F. 0.804 0.679
Percentag
e 44.3% 55.7% 30.3% 69.7%
ADT/AADT
ADT 1,582 AADT 1,582
Agenda Item No. 4 Attachment

Counts Unlimietd, Inc.PO Box 1178
Corona, CA 92878(951) 268-6268
City of Rialto N/S: Cedar Avenue E/W: Hawthorne Avenue 24 Hour Entering Volume Count
RLT011EWSite Code: 047-13055Date Start: 26-Feb-13Date End: 26-Feb-13
Page 1
Start26-Feb-
13Eastbound Hour Totals Westbound Hour Totals Combined Totals
Time Tue Morning Afternoon Morning Afternoon Morning Afternoon Morning Afternoon Morning Afternoon12:00 0 2 0 312:15 0 1 0 012:30 1 5 0 212:45 1 3 2 11 0 5 0 10 2 2101:00 1 7 0 401:15 0 6 0 501:30 0 6 0 301:45 2 4 3 23 0 3 0 15 3 3802:00 0 3 0 5
02:15 0 7 0 4
02:30 0 10 0 7
02:45 0 66 0 86 1 7 1 23 1 10903:00 1 21 0 103:15 0 8 0 403:30 2 8 2 703:45 1 11 4 48 2 3 4 15 8 6304:00 0 10 2 304:15 2 4 1 304:30 4 6 3 104:45 5 5 11 25 3 1 9 8 20 3305:00 3 1 2 505:15 0 4 7 305:30 0 6 7 505:45 4 4 7 15 6 9 22 22 29 3706:00 2 11 4 306:15 3 6 3 306:30 6 1 8 406:45 2 4 13 22 8 2 23 12 36 3407:00 3 7 6 207:15 10 4 8 107:30 13 2 4 107:45 22 2 48 15 7 0 25 4 73 1908:00 22 1 14 408:15 33 4 9 108:30 9 0 3 508:45 4 2 68 7 4 2 30 12 98 1909:00 6 1 4 309:15 0 3 3 009:30 4 1 3 309:45 3 3 13 8 1 3 11 9 24 1710:00 5 1 1 010:15 4 3 2 110:30 3 2 3 110:45 2 3 14 9 6 0 12 2 26 1111:00 4 0 1 011:15 2 0 5 111:30 5 0 8 011:45 5 0 16 0 4 1 18 2 34 2Total 199 269 199 269 155 134 155 134 354 403
Combined Total
468 468 289 289 757
AM Peak 07:30 07:30 Vol. 90 34
P.H.F. 0.682 0.607 PM Peak 02:30 02:00
Vol. 105 23 P.H.F. 0.398 0.821
Percentag
e 42.5% 57.5% 53.6% 46.4%
ADT/AADT
ADT 757 AADT 757
Agenda Item No. 4 Attachment
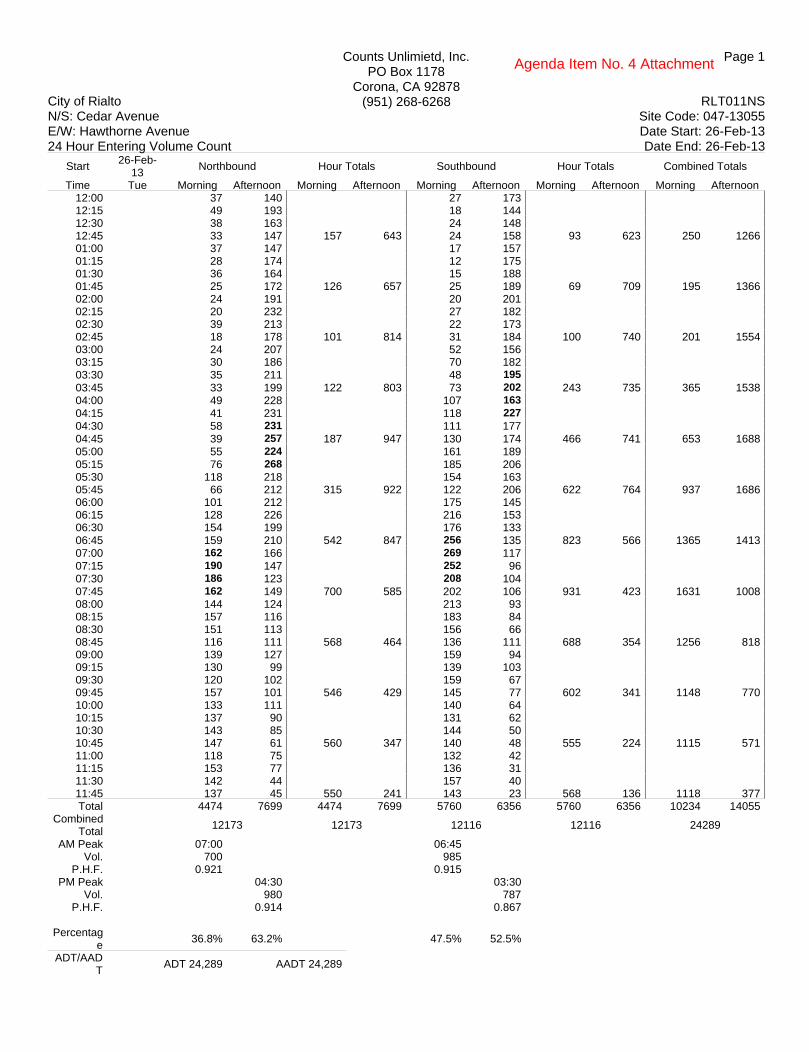
Counts Unlimietd, Inc.PO Box 1178
Corona, CA 92878(951) 268-6268
City of Rialto N/S: Cedar Avenue E/W: Hawthorne Avenue 24 Hour Entering Volume Count
RLT011NSSite Code: 047-13055Date Start: 26-Feb-13Date End: 26-Feb-13
Page 1
Start26-Feb-
13Northbound Hour Totals Southbound Hour Totals Combined Totals
Time Tue Morning Afternoon Morning Afternoon Morning Afternoon Morning Afternoon Morning Afternoon12:00 37 140 27 17312:15 49 193 18 14412:30 38 163 24 14812:45 33 147 157 643 24 158 93 623 250 126601:00 37 147 17 15701:15 28 174 12 17501:30 36 164 15 18801:45 25 172 126 657 25 189 69 709 195 136602:00 24 191 20 20102:15 20 232 27 18202:30 39 213 22 17302:45 18 178 101 814 31 184 100 740 201 155403:00 24 207 52 15603:15 30 186 70 18203:30 35 211 48 195
03:45 33 199 122 803 73 202 243 735 365 153804:00 49 228 107 163
04:15 41 231 118 227
04:30 58 231 111 17704:45 39 257 187 947 130 174 466 741 653 168805:00 55 224 161 18905:15 76 268 185 20605:30 118 218 154 16305:45 66 212 315 922 122 206 622 764 937 168606:00 101 212 175 14506:15 128 226 216 15306:30 154 199 176 13306:45 159 210 542 847 256 135 823 566 1365 141307:00 162 166 269 11707:15 190 147 252 9607:30 186 123 208 10407:45 162 149 700 585 202 106 931 423 1631 100808:00 144 124 213 9308:15 157 116 183 8408:30 151 113 156 6608:45 116 111 568 464 136 111 688 354 1256 81809:00 139 127 159 9409:15 130 99 139 10309:30 120 102 159 6709:45 157 101 546 429 145 77 602 341 1148 77010:00 133 111 140 6410:15 137 90 131 6210:30 143 85 144 5010:45 147 61 560 347 140 48 555 224 1115 57111:00 118 75 132 4211:15 153 77 136 3111:30 142 44 157 4011:45 137 45 550 241 143 23 568 136 1118 377Total 4474 7699 4474 7699 5760 6356 5760 6356 10234 14055
Combined Total
12173 12173 12116 12116 24289
AM Peak 07:00 06:45 Vol. 700 985
P.H.F. 0.921 0.915 PM Peak 04:30 03:30
Vol. 980 787 P.H.F. 0.914 0.867
Percentag
e 36.8% 63.2% 47.5% 52.5%
ADT/AADT
ADT 24,289 AADT 24,289
Agenda Item No. 4 Attachment

Counts Unlimietd, Inc.PO Box 1178
Corona, CA 92878(951) 268-6268
City of Rialto N/S: Eucalyptus Avenue E/W: Rialto Avenue 24 Hour Entering Volume Count
RLT010EWSite Code: 047-13055Date Start: 21-Feb-13Date End: 21-Feb-13
Page 1
Start21-Feb-
13Eastbound Hour Totals Westbound Hour Totals Combined Totals
Time Thu Morning Afternoon Morning Afternoon Morning Afternoon Morning Afternoon Morning Afternoon12:00 4 48 6 7112:15 2 58 5 6312:30 7 40 5 7612:45 1 57 14 203 6 67 22 277 36 48001:00 2 50 9 6301:15 1 69 6 7201:30 2 70 7 8601:45 2 72 7 261 3 85 25 306 32 56702:00 3 66 4 10102:15 1 57 2 8002:30 2 64 4 8002:45 3 74 9 261 5 102 15 363 24 62403:00 2 55 4 10403:15 4 73 5 9503:30 5 59 6 9603:45 3 67 14 254 3 86 18 381 32 63504:00 6 64 4 8004:15 8 66 7 7804:30 8 77 23 9004:45 8 63 30 270 11 84 45 332 75 60205:00 12 96 12 107
05:15 16 64 12 97
05:30 9 60 23 110
05:45 17 65 54 285 15 90 62 404 116 68906:00 17 69 11 8706:15 33 42 22 8606:30 29 37 33 7006:45 55 47 134 195 42 62 108 305 242 50007:00 74 30 91 6207:15 91 34 94 5507:30 85 27 119 4707:45 56 41 306 132 130 51 434 215 740 34708:00 35 24 60 3808:15 39 32 48 3408:30 50 38 51 4208:45 39 32 163 126 48 41 207 155 370 28109:00 37 11 44 3509:15 45 20 48 2309:30 33 25 45 2509:45 36 22 151 78 52 24 189 107 340 18510:00 32 18 68 2610:15 42 5 67 2210:30 40 8 57 1710:45 51 9 165 40 55 17 247 82 412 12211:00 38 12 55 711:15 43 5 84 1711:30 40 7 65 1111:45 31 9 152 33 57 9 261 44 413 77Total 1199 2138 1199 2138 1633 2971 1633 2971 2832 5109
Combined Total
3337 3337 4604 4604 7941
AM Peak 07:00 07:00 Vol. 306 434
P.H.F. 0.841 0.835 PM Peak 04:15 05:00
Vol. 302 404 P.H.F. 0.786 0.918
Percentag
e 35.9% 64.1% 35.5% 64.5%
ADT/AADT
ADT 7,941 AADT 7,941
Agenda Item No. 4 Attachment

Counts Unlimietd, Inc.PO Box 1178
Corona, CA 92878(951) 268-6268
City of Rialto N/S: Eucalyptus Avenue E/W: Rialto Avenue 24 Hour Entering Volume Count
RLT010NSSite Code: 047-13055Date Start: 21-Feb-13Date End: 21-Feb-13
Page 1
Start21-Feb-
13Northbound Hour Totals Southbound Hour Totals Combined Totals
Time Thu Morning Afternoon Morning Afternoon Morning Afternoon Morning Afternoon Morning Afternoon12:00 3 23 3 2212:15 5 28 1 5212:30 3 34 0 3112:45 2 23 13 108 1 43 5 148 18 25601:00 1 33 2 3701:15 3 39 0 4001:30 3 36 2 6601:45 2 39 9 147 2 61 6 204 15 35102:00 0 49 2 6302:15 3 64 4 6602:30 1 55 0 6102:45 2 50 6 218 3 66 9 256 15 47403:00 0 104 5 5803:15 1 58 3 4503:30 1 55 1 6103:45 0 62 2 279 4 56 13 220 15 49904:00 1 66 5 5704:15 6 54 6 5404:30 10 41 3 5104:45 7 55 24 216 9 58 23 220 47 43605:00 9 55 13 67
05:15 8 56 16 75
05:30 16 55 17 7805:45 6 62 39 228 19 52 65 272 104 50006:00 6 60 12 5906:15 14 40 33 4106:30 13 50 29 4006:45 22 30 55 180 56 33 130 173 185 35307:00 39 42 57 3507:15 52 39 59 4107:30 59 24 73 3207:45 93 35 243 140 44 32 233 140 476 28008:00 46 37 33 4208:15 39 20 27 3008:30 22 24 30 2008:45 22 27 129 108 19 26 109 118 238 22609:00 24 20 26 2609:15 28 15 32 1509:30 18 20 35 809:45 17 9 87 64 34 14 127 63 214 12710:00 33 9 32 610:15 28 10 42 1110:30 33 9 20 510:45 36 8 130 36 35 11 129 33 259 6911:00 33 7 34 811:15 29 9 56 411:30 34 5 25 311:45 33 3 129 24 36 5 151 20 280 44Total 866 1748 866 1748 1000 1867 1000 1867 1866 3615
Combined Total
2614 2614 2867 2867 5481
AM Peak 07:15 06:45 Vol. 250 245
P.H.F. 0.672 0.839 PM Peak 03:00 04:45
Vol. 279 278 P.H.F. 0.671 0.891
Percentag
e 33.1% 66.9% 34.9% 65.1%
ADT/AADT
ADT 5,481 AADT 5,481
Agenda Item No. 4 Attachment

Counts Unlimietd, Inc.PO Box 1178
Corona, CA 92878(951) 268-6268
City of Rialto N/S: Larch Avenue E/W: Foothill Boulevard 24 Hour Entering Volume Count
RLT005EWSite Code: 047-13055Date Start: 26-Feb-13Date End: 26-Feb-13
Page 1
Start26-Feb-
13Eastbound Hour Totals Westbound Hour Totals Combined Totals
Time Tue Morning Afternoon Morning Afternoon Morning Afternoon Morning Afternoon Morning Afternoon12:00 21 156 25 19112:15 24 162 20 18012:30 20 172 14 19412:45 16 146 81 636 13 176 72 741 153 137701:00 20 151 16 17801:15 6 181 10 17601:30 10 168 9 16701:45 14 169 50 669 18 183 53 704 103 137302:00 6 184 17 14902:15 10 157 7 20802:30 10 197 8 17602:45 9 200 35 738 11 212 43 745 78 148303:00 6 214 8 16303:15 13 194 12 20503:30 15 227 8 177
03:45 14 200 48 835 16 206 44 751 92 158604:00 10 190 14 17604:15 12 207 29 18704:30 24 222 49 16704:45 22 205 68 824 48 173 140 703 208 152705:00 10 191 39 19005:15 27 199 56 17705:30 27 191 58 18305:45 37 181 101 762 66 204 219 754 320 151606:00 47 173 61 17906:15 28 180 55 18506:30 44 192 96 14106:45 70 166 189 711 81 148 293 653 482 136407:00 87 144 104 14207:15 112 125 123 12107:30 144 97 151 11007:45 158 101 501 467 180 110 558 483 1059 95008:00 135 105 131 10908:15 115 97 125 8708:30 137 89 134 8808:45 122 84 509 375 134 87 524 371 1033 74609:00 128 97 137 8709:15 135 59 138 6909:30 118 62 133 5509:45 117 49 498 267 134 56 542 267 1040 53410:00 146 56 118 6610:15 135 54 159 4810:30 135 47 150 3310:45 142 48 558 205 152 35 579 182 1137 38711:00 137 36 168 3011:15 155 33 189 3011:30 170 39 145 2611:45 164 21 626 129 170 23 672 109 1298 238Total 3264 6618 3264 6618 3739 6463 3739 6463 7003 13081
Combined Total
9882 9882 10202 10202 20084
AM Peak 11:00 11:00 Vol. 626 672
P.H.F. 0.921 0.889 PM Peak 02:45 03:15
Vol. 835 764 P.H.F. 0.920 0.901
Percentag
e 33.0% 67.0% 36.6% 63.4%
ADT/AADT
ADT 20,084 AADT 20,084
Agenda Item No. 4 Attachment
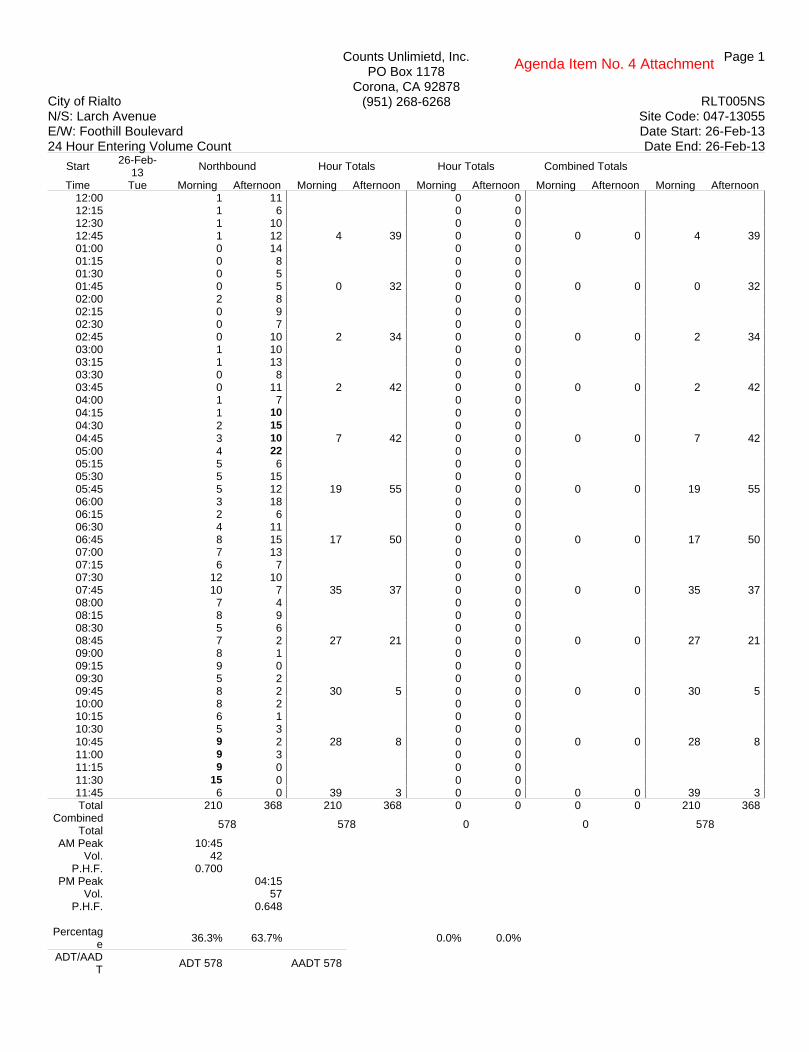
Counts Unlimietd, Inc.PO Box 1178
Corona, CA 92878(951) 268-6268
City of Rialto N/S: Larch Avenue E/W: Foothill Boulevard 24 Hour Entering Volume Count
RLT005NSSite Code: 047-13055Date Start: 26-Feb-13Date End: 26-Feb-13
Page 1
Start26-Feb-
13Northbound Hour Totals Hour Totals Combined Totals
Time Tue Morning Afternoon Morning Afternoon Morning Afternoon Morning Afternoon Morning Afternoon12:00 1 11 0 012:15 1 6 0 012:30 1 10 0 012:45 1 12 4 39 0 0 0 0 4 3901:00 0 14 0 001:15 0 8 0 001:30 0 5 0 001:45 0 5 0 32 0 0 0 0 0 3202:00 2 8 0 002:15 0 9 0 002:30 0 7 0 002:45 0 10 2 34 0 0 0 0 2 3403:00 1 10 0 003:15 1 13 0 003:30 0 8 0 003:45 0 11 2 42 0 0 0 0 2 4204:00 1 7 0 004:15 1 10 0 004:30 2 15 0 004:45 3 10 7 42 0 0 0 0 7 4205:00 4 22 0 005:15 5 6 0 005:30 5 15 0 005:45 5 12 19 55 0 0 0 0 19 5506:00 3 18 0 006:15 2 6 0 006:30 4 11 0 006:45 8 15 17 50 0 0 0 0 17 5007:00 7 13 0 007:15 6 7 0 007:30 12 10 0 007:45 10 7 35 37 0 0 0 0 35 3708:00 7 4 0 008:15 8 9 0 008:30 5 6 0 008:45 7 2 27 21 0 0 0 0 27 2109:00 8 1 0 009:15 9 0 0 009:30 5 2 0 009:45 8 2 30 5 0 0 0 0 30 510:00 8 2 0 010:15 6 1 0 010:30 5 3 0 010:45 9 2 28 8 0 0 0 0 28 811:00 9 3 0 011:15 9 0 0 011:30 15 0 0 011:45 6 0 39 3 0 0 0 0 39 3Total 210 368 210 368 0 0 0 0 210 368
Combined Total
578 578 0 0 578
AM Peak 10:45 Vol. 42
P.H.F. 0.700 PM Peak 04:15
Vol. 57 P.H.F. 0.648
Percentag
e 36.3% 63.7% 0.0% 0.0%
ADT/AADT
ADT 578 AADT 578
Agenda Item No. 4 Attachment

Counts Unlimietd, Inc.PO Box 1178
Corona, CA 92878(951) 268-6268
City of Rialto N/S: Lilac Avenue E/W: Merrill Avenue 24 Hour Entering Volume Count
RLT002EWSite Code: 047-13055Date Start: 21-Feb-13Date End: 21-Feb-13
Page 1
Start21-Feb-
13Eastbound Hour Totals Westbound Hour Totals Combined Totals
Time Thu Morning Afternoon Morning Afternoon Morning Afternoon Morning Afternoon Morning Afternoon12:00 7 50 10 9012:15 10 50 9 6412:30 5 61 8 8812:45 5 58 27 219 8 52 35 294 62 51301:00 5 56 6 8201:15 9 67 2 7301:30 6 104 5 8501:45 1 88 21 315 1 82 14 322 35 63702:00 5 69 4 10102:15 6 64 5 7402:30 2 88 5 8202:45 2 112 15 333 3 127 17 384 32 71703:00 4 105 5 142
03:15 3 101 5 120
03:30 5 76 9 8803:45 6 97 18 379 5 81 24 431 42 81004:00 4 79 8 8604:15 9 87 18 7204:30 10 78 19 8004:45 13 91 36 335 25 100 70 338 106 67305:00 9 106 18 8605:15 14 92 17 8705:30 21 92 16 6705:45 16 76 60 366 42 87 93 327 153 69306:00 27 83 25 7606:15 17 75 33 8006:30 33 82 29 6806:45 31 65 108 305 38 91 125 315 233 62007:00 43 49 42 6807:15 106 41 106 6107:30 106 47 130 6007:45 83 48 338 185 111 64 389 253 727 43808:00 57 37 86 5908:15 51 23 57 5808:30 68 32 46 5108:45 46 26 222 118 42 62 231 230 453 34809:00 48 31 44 4209:15 50 28 66 4309:30 43 38 52 3209:45 51 31 192 128 51 29 213 146 405 27410:00 51 33 55 2310:15 70 13 39 2410:30 62 12 58 1410:45 58 19 241 77 53 15 205 76 446 15311:00 57 22 55 2211:15 59 7 72 911:30 57 12 56 911:45 51 12 224 53 53 16 236 56 460 109Total 1502 2813 1502 2813 1652 3172 1652 3172 3154 5985
Combined Total
4315 4315 4824 4824 9139
AM Peak 07:15 07:15 Vol. 352 433
P.H.F. 0.830 0.833 PM Peak 02:30 02:45
Vol. 406 477 P.H.F. 0.906 0.840
Percentag
e 34.8% 65.2% 34.2% 65.8%
ADT/AADT
ADT 9,139 AADT 9,139
Agenda Item No. 4 Attachment
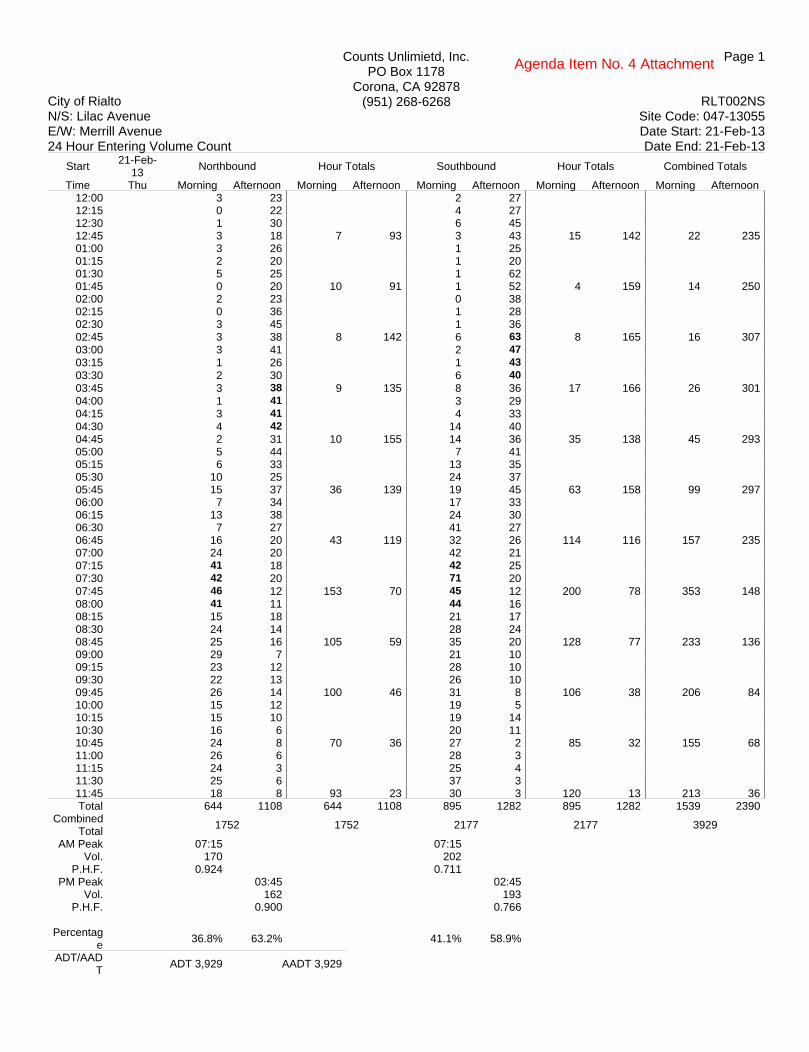
Counts Unlimietd, Inc.PO Box 1178
Corona, CA 92878(951) 268-6268
City of Rialto N/S: Lilac Avenue E/W: Merrill Avenue 24 Hour Entering Volume Count
RLT002NSSite Code: 047-13055Date Start: 21-Feb-13Date End: 21-Feb-13
Page 1
Start21-Feb-
13Northbound Hour Totals Southbound Hour Totals Combined Totals
Time Thu Morning Afternoon Morning Afternoon Morning Afternoon Morning Afternoon Morning Afternoon12:00 3 23 2 2712:15 0 22 4 2712:30 1 30 6 4512:45 3 18 7 93 3 43 15 142 22 23501:00 3 26 1 2501:15 2 20 1 2001:30 5 25 1 6201:45 0 20 10 91 1 52 4 159 14 25002:00 2 23 0 3802:15 0 36 1 2802:30 3 45 1 3602:45 3 38 8 142 6 63 8 165 16 30703:00 3 41 2 47
03:15 1 26 1 4303:30 2 30 6 40
03:45 3 38 9 135 8 36 17 166 26 30104:00 1 41 3 2904:15 3 41 4 3304:30 4 42 14 4004:45 2 31 10 155 14 36 35 138 45 29305:00 5 44 7 4105:15 6 33 13 3505:30 10 25 24 3705:45 15 37 36 139 19 45 63 158 99 29706:00 7 34 17 3306:15 13 38 24 3006:30 7 27 41 2706:45 16 20 43 119 32 26 114 116 157 23507:00 24 20 42 2107:15 41 18 42 2507:30 42 20 71 2007:45 46 12 153 70 45 12 200 78 353 14808:00 41 11 44 1608:15 15 18 21 1708:30 24 14 28 2408:45 25 16 105 59 35 20 128 77 233 13609:00 29 7 21 1009:15 23 12 28 1009:30 22 13 26 1009:45 26 14 100 46 31 8 106 38 206 8410:00 15 12 19 510:15 15 10 19 1410:30 16 6 20 1110:45 24 8 70 36 27 2 85 32 155 6811:00 26 6 28 311:15 24 3 25 411:30 25 6 37 311:45 18 8 93 23 30 3 120 13 213 36Total 644 1108 644 1108 895 1282 895 1282 1539 2390
Combined Total
1752 1752 2177 2177 3929
AM Peak 07:15 07:15 Vol. 170 202
P.H.F. 0.924 0.711 PM Peak 03:45 02:45
Vol. 162 193 P.H.F. 0.900 0.766
Percentag
e 36.8% 63.2% 41.1% 58.9%
ADT/AADT
ADT 3,929 AADT 3,929
Agenda Item No. 4 Attachment
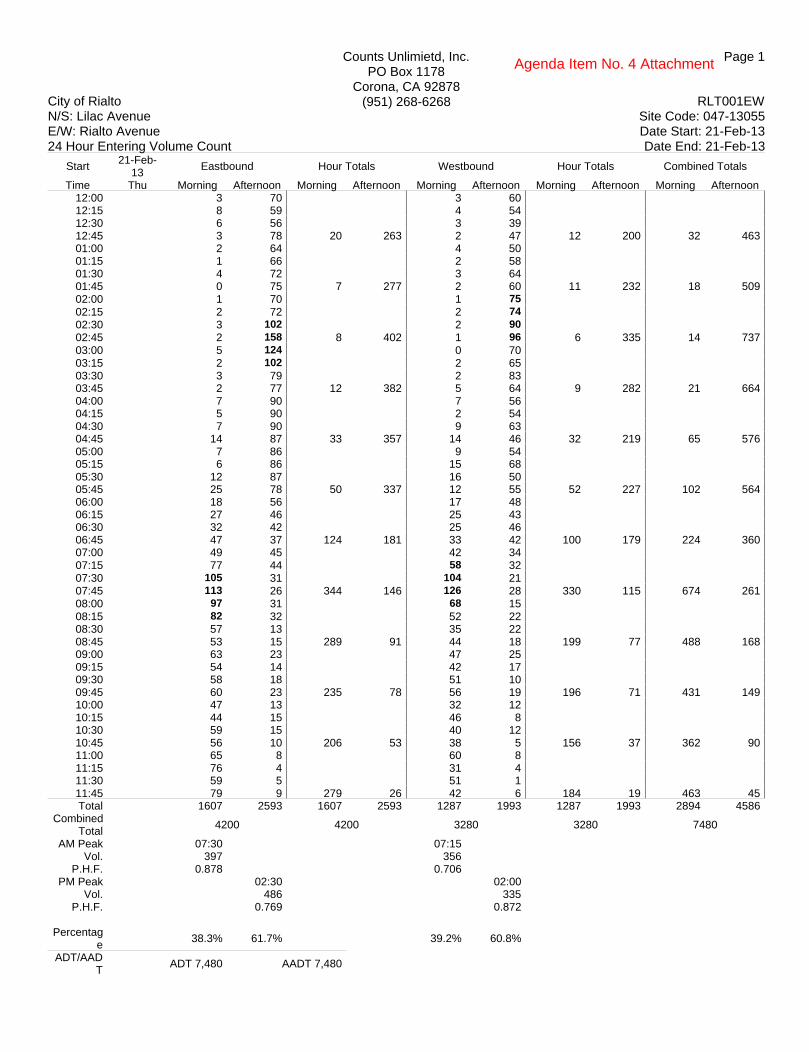
Counts Unlimietd, Inc.PO Box 1178
Corona, CA 92878(951) 268-6268
City of Rialto N/S: Lilac Avenue E/W: Rialto Avenue 24 Hour Entering Volume Count
RLT001EWSite Code: 047-13055Date Start: 21-Feb-13Date End: 21-Feb-13
Page 1
Start21-Feb-
13Eastbound Hour Totals Westbound Hour Totals Combined Totals
Time Thu Morning Afternoon Morning Afternoon Morning Afternoon Morning Afternoon Morning Afternoon12:00 3 70 3 6012:15 8 59 4 5412:30 6 56 3 3912:45 3 78 20 263 2 47 12 200 32 46301:00 2 64 4 5001:15 1 66 2 5801:30 4 72 3 6401:45 0 75 7 277 2 60 11 232 18 50902:00 1 70 1 75
02:15 2 72 2 74
02:30 3 102 2 90
02:45 2 158 8 402 1 96 6 335 14 73703:00 5 124 0 7003:15 2 102 2 6503:30 3 79 2 8303:45 2 77 12 382 5 64 9 282 21 66404:00 7 90 7 5604:15 5 90 2 5404:30 7 90 9 6304:45 14 87 33 357 14 46 32 219 65 57605:00 7 86 9 5405:15 6 86 15 6805:30 12 87 16 5005:45 25 78 50 337 12 55 52 227 102 56406:00 18 56 17 4806:15 27 46 25 4306:30 32 42 25 4606:45 47 37 124 181 33 42 100 179 224 36007:00 49 45 42 3407:15 77 44 58 3207:30 105 31 104 2107:45 113 26 344 146 126 28 330 115 674 26108:00 97 31 68 1508:15 82 32 52 2208:30 57 13 35 2208:45 53 15 289 91 44 18 199 77 488 16809:00 63 23 47 2509:15 54 14 42 1709:30 58 18 51 1009:45 60 23 235 78 56 19 196 71 431 14910:00 47 13 32 1210:15 44 15 46 810:30 59 15 40 1210:45 56 10 206 53 38 5 156 37 362 9011:00 65 8 60 811:15 76 4 31 411:30 59 5 51 111:45 79 9 279 26 42 6 184 19 463 45Total 1607 2593 1607 2593 1287 1993 1287 1993 2894 4586
Combined Total
4200 4200 3280 3280 7480
AM Peak 07:30 07:15 Vol. 397 356
P.H.F. 0.878 0.706 PM Peak 02:30 02:00
Vol. 486 335 P.H.F. 0.769 0.872
Percentag
e 38.3% 61.7% 39.2% 60.8%
ADT/AADT
ADT 7,480 AADT 7,480
Agenda Item No. 4 Attachment

Counts Unlimietd, Inc.PO Box 1178
Corona, CA 92878(951) 268-6268
City of Rialto N/S: Lilac Avenue E/W: Rialto Avenue 24 Hour Entering Volume Count
RLT001NSSite Code: 047-13055Date Start: 21-Feb-13Date End: 21-Feb-13
Page 1
Start21-Feb-
13Northbound Hour Totals Southbound Hour Totals Combined Totals
Time Thu Morning Afternoon Morning Afternoon Morning Afternoon Morning Afternoon Morning Afternoon12:00 5 31 3 3412:15 3 34 5 3412:30 2 43 8 3412:45 3 28 13 136 1 41 17 143 30 27901:00 6 27 1 2901:15 2 28 1 4101:30 4 51 0 3101:45 0 45 12 151 1 52 3 153 15 30402:00 1 42 1 46
02:15 2 42 2 42
02:30 2 54 1 4702:45 2 58 7 196 6 46 10 181 17 37703:00 2 49 2 4703:15 1 45 1 3903:30 2 41 6 3603:45 2 42 7 177 10 40 19 162 26 33904:00 1 50 3 3604:15 4 50 6 4104:30 3 46 15 4504:45 4 51 12 197 18 31 42 153 54 35005:00 3 68 8 3605:15 3 47 18 4905:30 7 35 20 3805:45 10 47 23 197 26 48 72 171 95 36806:00 6 36 27 3606:15 21 45 30 3606:30 13 35 39 2806:45 16 28 56 144 37 28 133 128 189 27207:00 17 22 45 2007:15 60 24 44 2507:30 101 17 52 2307:45 57 17 235 80 49 14 190 82 425 16208:00 31 18 51 1308:15 27 21 27 2108:30 30 16 31 3008:45 23 20 111 75 31 20 140 84 251 15909:00 32 10 18 1309:15 26 18 38 1309:30 29 19 33 1209:45 33 16 120 63 25 14 114 52 234 11510:00 22 6 25 910:15 20 12 25 1310:30 24 6 24 1010:45 26 8 92 32 32 7 106 39 198 7111:00 25 8 29 311:15 33 4 32 711:30 23 4 37 311:45 19 10 100 26 30 2 128 15 228 41Total 788 1474 788 1474 974 1363 974 1363 1762 2837
Combined Total
2262 2262 2337 2337 4599
AM Peak 07:15 07:15 Vol. 249 196
P.H.F. 0.616 0.942 PM Peak 04:15 01:45
Vol. 215 187 P.H.F. 0.790 0.899
Percentag
e 34.8% 65.2% 41.7% 58.3%
ADT/AADT
ADT 4,599 AADT 4,599
Agenda Item No. 4 Attachment
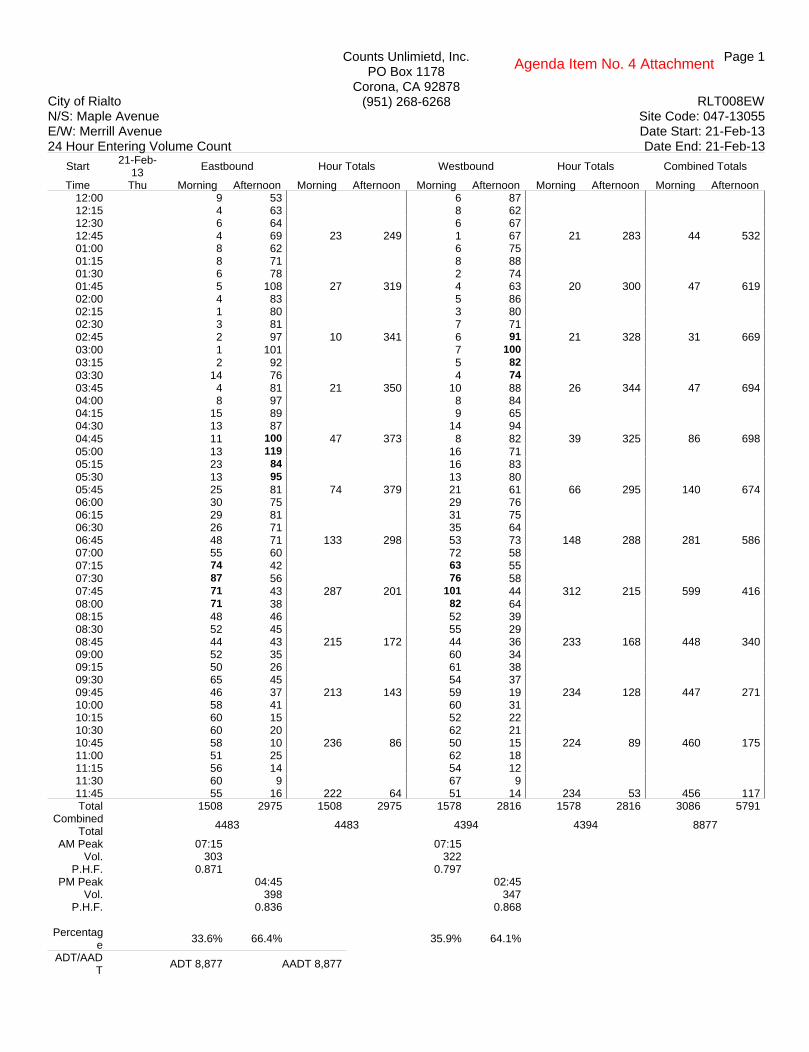
Counts Unlimietd, Inc.PO Box 1178
Corona, CA 92878(951) 268-6268
City of Rialto N/S: Maple Avenue E/W: Merrill Avenue 24 Hour Entering Volume Count
RLT008EWSite Code: 047-13055Date Start: 21-Feb-13Date End: 21-Feb-13
Page 1
Start21-Feb-
13Eastbound Hour Totals Westbound Hour Totals Combined Totals
Time Thu Morning Afternoon Morning Afternoon Morning Afternoon Morning Afternoon Morning Afternoon12:00 9 53 6 8712:15 4 63 8 6212:30 6 64 6 6712:45 4 69 23 249 1 67 21 283 44 53201:00 8 62 6 7501:15 8 71 8 8801:30 6 78 2 7401:45 5 108 27 319 4 63 20 300 47 61902:00 4 83 5 8602:15 1 80 3 8002:30 3 81 7 7102:45 2 97 10 341 6 91 21 328 31 66903:00 1 101 7 100
03:15 2 92 5 8203:30 14 76 4 7403:45 4 81 21 350 10 88 26 344 47 69404:00 8 97 8 8404:15 15 89 9 6504:30 13 87 14 9404:45 11 100 47 373 8 82 39 325 86 69805:00 13 119 16 7105:15 23 84 16 8305:30 13 95 13 8005:45 25 81 74 379 21 61 66 295 140 67406:00 30 75 29 7606:15 29 81 31 7506:30 26 71 35 6406:45 48 71 133 298 53 73 148 288 281 58607:00 55 60 72 5807:15 74 42 63 5507:30 87 56 76 5807:45 71 43 287 201 101 44 312 215 599 41608:00 71 38 82 6408:15 48 46 52 3908:30 52 45 55 2908:45 44 43 215 172 44 36 233 168 448 34009:00 52 35 60 3409:15 50 26 61 3809:30 65 45 54 3709:45 46 37 213 143 59 19 234 128 447 27110:00 58 41 60 3110:15 60 15 52 2210:30 60 20 62 2110:45 58 10 236 86 50 15 224 89 460 17511:00 51 25 62 1811:15 56 14 54 1211:30 60 9 67 911:45 55 16 222 64 51 14 234 53 456 117Total 1508 2975 1508 2975 1578 2816 1578 2816 3086 5791
Combined Total
4483 4483 4394 4394 8877
AM Peak 07:15 07:15 Vol. 303 322
P.H.F. 0.871 0.797 PM Peak 04:45 02:45
Vol. 398 347 P.H.F. 0.836 0.868
Percentag
e 33.6% 66.4% 35.9% 64.1%
ADT/AADT
ADT 8,877 AADT 8,877
Agenda Item No. 4 Attachment
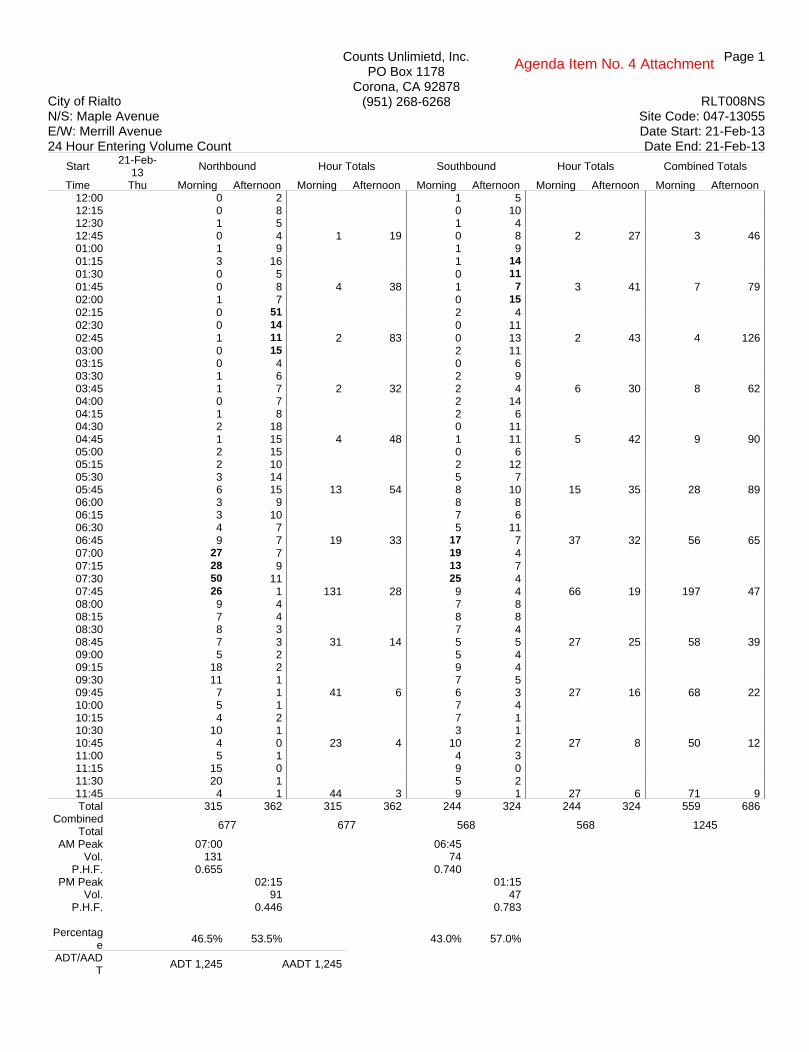
Counts Unlimietd, Inc.PO Box 1178
Corona, CA 92878(951) 268-6268
City of Rialto N/S: Maple Avenue E/W: Merrill Avenue 24 Hour Entering Volume Count
RLT008NSSite Code: 047-13055Date Start: 21-Feb-13Date End: 21-Feb-13
Page 1
Start21-Feb-
13Northbound Hour Totals Southbound Hour Totals Combined Totals
Time Thu Morning Afternoon Morning Afternoon Morning Afternoon Morning Afternoon Morning Afternoon12:00 0 2 1 512:15 0 8 0 1012:30 1 5 1 412:45 0 4 1 19 0 8 2 27 3 4601:00 1 9 1 901:15 3 16 1 14
01:30 0 5 0 11
01:45 0 8 4 38 1 7 3 41 7 7902:00 1 7 0 15
02:15 0 51 2 402:30 0 14 0 1102:45 1 11 2 83 0 13 2 43 4 12603:00 0 15 2 1103:15 0 4 0 603:30 1 6 2 903:45 1 7 2 32 2 4 6 30 8 6204:00 0 7 2 1404:15 1 8 2 604:30 2 18 0 1104:45 1 15 4 48 1 11 5 42 9 9005:00 2 15 0 605:15 2 10 2 1205:30 3 14 5 705:45 6 15 13 54 8 10 15 35 28 8906:00 3 9 8 806:15 3 10 7 606:30 4 7 5 1106:45 9 7 19 33 17 7 37 32 56 6507:00 27 7 19 407:15 28 9 13 707:30 50 11 25 407:45 26 1 131 28 9 4 66 19 197 4708:00 9 4 7 808:15 7 4 8 808:30 8 3 7 408:45 7 3 31 14 5 5 27 25 58 3909:00 5 2 5 409:15 18 2 9 409:30 11 1 7 509:45 7 1 41 6 6 3 27 16 68 2210:00 5 1 7 410:15 4 2 7 110:30 10 1 3 110:45 4 0 23 4 10 2 27 8 50 1211:00 5 1 4 311:15 15 0 9 011:30 20 1 5 211:45 4 1 44 3 9 1 27 6 71 9Total 315 362 315 362 244 324 244 324 559 686
Combined Total
677 677 568 568 1245
AM Peak 07:00 06:45 Vol. 131 74
P.H.F. 0.655 0.740 PM Peak 02:15 01:15
Vol. 91 47 P.H.F. 0.446 0.783
Percentag
e 46.5% 53.5% 43.0% 57.0%
ADT/AADT
ADT 1,245 AADT 1,245
Agenda Item No. 4 Attachment

Counts Unlimietd, Inc.PO Box 1178
Corona, CA 92878(951) 268-6268
City of Rialto N/S: Maple Avenue E/W: Rialto Avenue 24 Hour Entering Volume Count
RLT007EWSite Code: 047-13055Date Start: 21-Feb-13Date End: 21-Feb-13
Page 1
Start21-Feb-
13Eastbound Hour Totals Westbound Hour Totals Combined Totals
Time Thu Morning Afternoon Morning Afternoon Morning Afternoon Morning Afternoon Morning Afternoon12:00 11 68 13 8112:15 8 70 5 8512:30 11 76 10 5212:45 8 65 38 279 8 62 36 280 74 55901:00 4 70 14 8101:15 5 57 8 9301:30 5 72 3 5701:45 2 88 16 287 5 91 30 322 46 60902:00 0 93 1 115
02:15 5 83 2 94
02:30 4 79 4 124
02:45 7 137 16 392 2 134 9 467 25 85903:00 4 111 1 10903:15 3 91 2 10003:30 7 102 7 8803:45 6 93 20 397 7 99 17 396 37 79304:00 8 125 11 8504:15 9 126 16 7704:30 9 67 25 9104:45 12 111 38 429 21 82 73 335 111 76405:00 7 127 29 8205:15 15 141 24 9905:30 18 130 42 10605:45 25 118 65 516 32 85 127 372 192 88806:00 22 108 39 8206:15 32 104 44 8406:30 28 67 51 7006:45 38 67 120 346 68 74 202 310 322 65607:00 39 73 96 7407:15 68 72 81 5307:30 66 62 121 7107:45 81 56 254 263 175 54 473 252 727 51508:00 110 57 116 3708:15 64 54 78 4208:30 47 40 72 4508:45 54 50 275 201 72 41 338 165 613 36609:00 46 46 55 4109:15 46 44 77 3809:30 47 43 63 2509:45 59 48 198 181 66 29 261 133 459 31410:00 67 32 70 1910:15 64 41 81 2810:30 88 31 66 1410:45 56 20 275 124 60 24 277 85 552 20911:00 49 10 62 1711:15 55 9 72 2011:30 62 14 60 1311:45 74 15 240 48 74 9 268 59 508 107Total 1555 3463 1555 3463 2111 3176 2111 3176 3666 6639
Combined Total
5018 5018 5287 5287 10305
AM Peak 07:15 07:15 Vol. 325 493
P.H.F. 0.739 0.704 PM Peak 05:00 02:00
Vol. 516 467 P.H.F. 0.915 0.871
Percentag
e 31.0% 69.0% 39.9% 60.1%
ADT/AADT
ADT 10,305 AADT 10,305
Agenda Item No. 4 Attachment
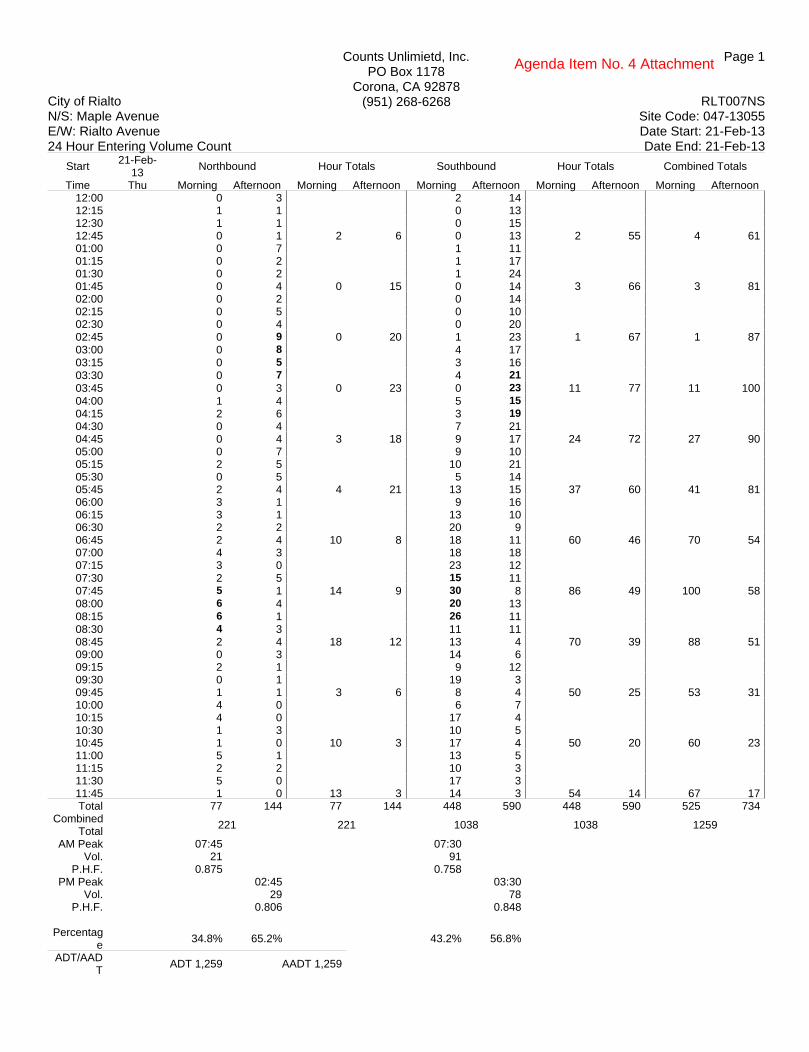
Counts Unlimietd, Inc.PO Box 1178
Corona, CA 92878(951) 268-6268
City of Rialto N/S: Maple Avenue E/W: Rialto Avenue 24 Hour Entering Volume Count
RLT007NSSite Code: 047-13055Date Start: 21-Feb-13Date End: 21-Feb-13
Page 1
Start21-Feb-
13Northbound Hour Totals Southbound Hour Totals Combined Totals
Time Thu Morning Afternoon Morning Afternoon Morning Afternoon Morning Afternoon Morning Afternoon12:00 0 3 2 1412:15 1 1 0 1312:30 1 1 0 1512:45 0 1 2 6 0 13 2 55 4 6101:00 0 7 1 1101:15 0 2 1 1701:30 0 2 1 2401:45 0 4 0 15 0 14 3 66 3 8102:00 0 2 0 1402:15 0 5 0 1002:30 0 4 0 2002:45 0 9 0 20 1 23 1 67 1 8703:00 0 8 4 1703:15 0 5 3 1603:30 0 7 4 21
03:45 0 3 0 23 0 23 11 77 11 10004:00 1 4 5 15
04:15 2 6 3 1904:30 0 4 7 2104:45 0 4 3 18 9 17 24 72 27 9005:00 0 7 9 1005:15 2 5 10 2105:30 0 5 5 1405:45 2 4 4 21 13 15 37 60 41 8106:00 3 1 9 1606:15 3 1 13 1006:30 2 2 20 906:45 2 4 10 8 18 11 60 46 70 5407:00 4 3 18 1807:15 3 0 23 1207:30 2 5 15 1107:45 5 1 14 9 30 8 86 49 100 5808:00 6 4 20 1308:15 6 1 26 1108:30 4 3 11 1108:45 2 4 18 12 13 4 70 39 88 5109:00 0 3 14 609:15 2 1 9 1209:30 0 1 19 309:45 1 1 3 6 8 4 50 25 53 3110:00 4 0 6 710:15 4 0 17 410:30 1 3 10 510:45 1 0 10 3 17 4 50 20 60 2311:00 5 1 13 511:15 2 2 10 311:30 5 0 17 311:45 1 0 13 3 14 3 54 14 67 17Total 77 144 77 144 448 590 448 590 525 734
Combined Total
221 221 1038 1038 1259
AM Peak 07:45 07:30 Vol. 21 91
P.H.F. 0.875 0.758 PM Peak 02:45 03:30
Vol. 29 78 P.H.F. 0.806 0.848
Percentag
e 34.8% 65.2% 43.2% 56.8%
ADT/AADT
ADT 1,259 AADT 1,259
Agenda Item No. 4 Attachment

Counts Unlimietd, Inc.PO Box 1178
Corona, CA 92878(951) 268-6268
City of Rialto N/S: Pepper Avenue E/W: Etiwanda Avenue 24 Hour Entering Volume Count
RLT009EWSite Code: 047-13055Date Start: 26-Feb-13Date End: 26-Feb-13
Page 1
Start26-Feb-
13Eastbound Hour Totals Westbound Hour Totals Combined Totals
Time Tue Morning Afternoon Morning Afternoon Morning Afternoon Morning Afternoon Morning Afternoon12:00 1 19 2 1312:15 0 10 7 2212:30 3 15 4 912:45 0 18 4 62 2 15 15 59 19 12101:00 0 11 4 1501:15 1 17 0 2201:30 0 17 1 2201:45 0 16 1 61 1 24 6 83 7 14402:00 0 19 0 2702:15 0 58 1 54
02:30 1 28 1 36
02:45 0 43 1 148 2 29 4 146 5 29403:00 1 27 1 3003:15 1 27 2 3103:30 3 24 2 1703:45 0 27 5 105 3 14 8 92 13 19704:00 1 24 4 2204:15 1 26 5 1704:30 3 21 4 2304:45 2 22 7 93 12 19 25 81 32 17405:00 1 24 7 2605:15 2 42 11 2205:30 5 32 4 2105:45 2 32 10 130 10 21 32 90 42 22006:00 4 27 7 2706:15 6 17 10 1706:30 8 19 13 2706:45 11 23 29 86 19 15 49 86 78 17207:00 18 15 38 1407:15 37 13 29 1707:30 34 12 30 607:45 28 15 117 55 49 15 146 52 263 10708:00 49 8 39 1408:15 21 9 19 1308:30 15 6 9 508:45 9 11 94 34 19 8 86 40 180 7409:00 11 10 16 709:15 5 8 13 509:30 7 9 13 509:45 15 4 38 31 15 5 57 22 95 5310:00 19 7 9 610:15 20 7 16 610:30 18 3 13 810:45 16 3 73 20 16 8 54 28 127 4811:00 19 0 18 411:15 21 4 10 311:30 20 3 19 411:45 19 6 79 13 21 2 68 13 147 26Total 458 838 458 838 550 792 550 792 1008 1630
Combined Total
1296 1296 1342 1342 2638
AM Peak 07:15 07:15 Vol. 148 147
P.H.F. 0.755 0.750 PM Peak 02:15 02:15
Vol. 156 149 P.H.F. 0.672 0.690
Percentag
e 35.3% 64.7% 41.0% 59.0%
ADT/AADT
ADT 2,638 AADT 2,638
Agenda Item No. 4 Attachment

Counts Unlimietd, Inc.PO Box 1178
Corona, CA 92878(951) 268-6268
City of Rialto N/S: Pepper Avenue E/W: Etiwanda Avenue 24 Hour Entering Volume Count
RLT009NSSite Code: 047-13055Date Start: 26-Feb-13Date End: 26-Feb-13
Page 1
Start26-Feb-
13Northbound Hour Totals Southbound Hour Totals Combined Totals
Time Tue Morning Afternoon Morning Afternoon Morning Afternoon Morning Afternoon Morning Afternoon12:00 15 58 8 6212:15 11 65 9 6212:30 13 61 4 6312:45 8 69 47 253 11 56 32 243 79 49601:00 10 52 2 5801:15 9 61 4 7401:30 4 55 4 6101:45 7 74 30 242 3 79 13 272 43 51402:00 3 104 2 6602:15 3 100 5 8102:30 4 90 7 108
02:45 9 103 19 397 2 71 16 326 35 72303:00 5 107 8 147
03:15 12 113 9 8903:30 9 109 16 6403:45 7 99 33 428 6 73 39 373 72 80104:00 9 93 18 7104:15 17 96 16 5904:30 12 97 18 7804:45 18 113 56 399 18 55 70 263 126 66205:00 21 114 18 6505:15 15 128 28 7205:30 26 86 34 7005:45 21 108 83 436 41 80 121 287 204 72306:00 23 87 31 7306:15 33 95 44 4906:30 27 74 52 6506:45 48 79 131 335 81 63 208 250 339 58507:00 57 73 97 5407:15 74 52 117 2907:30 91 55 142 4207:45 128 46 350 226 160 31 516 156 866 38208:00 86 57 129 2808:15 65 57 90 3508:30 46 35 74 2908:45 47 45 244 194 54 33 347 125 591 31909:00 53 57 52 3409:15 62 45 41 2209:30 45 43 65 3209:45 59 40 219 185 56 22 214 110 433 29510:00 45 25 53 1810:15 35 34 49 1610:30 37 26 55 810:45 57 27 174 112 55 20 212 62 386 17411:00 62 27 52 2011:15 59 25 64 1611:30 59 25 51 1711:45 49 16 229 93 58 6 225 59 454 152Total 1615 3300 1615 3300 2013 2526 2013 2526 3628 5826
Combined Total
4915 4915 4539 4539 9454
AM Peak 07:15 07:15 Vol. 379 548
P.H.F. 0.740 0.856 PM Peak 04:30 02:30
Vol. 452 415 P.H.F. 0.883 0.706
Percentag
e 32.9% 67.1% 44.3% 55.7%
ADT/AADT
ADT 9,454 AADT 9,454
Agenda Item No. 4 Attachment
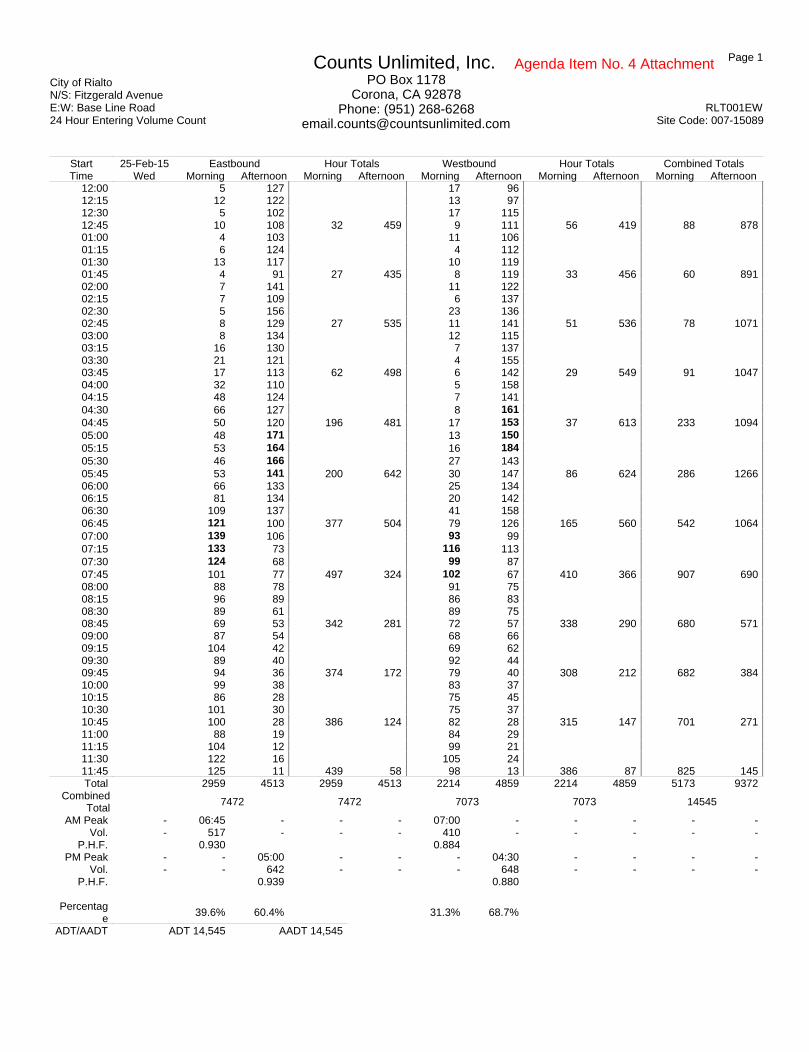
Page 1 City of RialtoN/S: Fitzgerald AvenueE:W: Base Line Road24 Hour Entering Volume Count
RLT001EWSite Code: 007-15089
Counts Unlimited, Inc.PO Box 1178
Corona, CA 92878Phone: (951) 268-6268
Start 25-Feb-15 Eastbound Hour Totals Westbound Hour Totals Combined TotalsTime Wed Morning Afternoon Morning Afternoon Morning Afternoon Morning Afternoon Morning Afternoon
12:00 5 127 17 9612:15 12 122 13 9712:30 5 102 17 11512:45 10 108 32 459 9 111 56 419 88 87801:00 4 103 11 10601:15 6 124 4 11201:30 13 117 10 11901:45 4 91 27 435 8 119 33 456 60 89102:00 7 141 11 12202:15 7 109 6 13702:30 5 156 23 13602:45 8 129 27 535 11 141 51 536 78 107103:00 8 134 12 11503:15 16 130 7 13703:30 21 121 4 15503:45 17 113 62 498 6 142 29 549 91 104704:00 32 110 5 15804:15 48 124 7 14104:30 66 127 8 16104:45 50 120 196 481 17 153 37 613 233 109405:00 48 171 13 15005:15 53 164 16 18405:30 46 166 27 14305:45 53 141 200 642 30 147 86 624 286 126606:00 66 133 25 13406:15 81 134 20 14206:30 109 137 41 15806:45 121 100 377 504 79 126 165 560 542 106407:00 139 106 93 9907:15 133 73 116 11307:30 124 68 99 8707:45 101 77 497 324 102 67 410 366 907 69008:00 88 78 91 7508:15 96 89 86 8308:30 89 61 89 7508:45 69 53 342 281 72 57 338 290 680 57109:00 87 54 68 6609:15 104 42 69 6209:30 89 40 92 4409:45 94 36 374 172 79 40 308 212 682 38410:00 99 38 83 3710:15 86 28 75 4510:30 101 30 75 3710:45 100 28 386 124 82 28 315 147 701 27111:00 88 19 84 2911:15 104 12 99 2111:30 122 16 105 2411:45 125 11 439 58 98 13 386 87 825 145Total 2959 4513 2959 4513 2214 4859 2214 4859 5173 9372
CombinedTotal
7472 7472 7073 7073 14545
AM Peak - 06:45 - - - 07:00 - - - - -Vol. - 517 - - - 410 - - - - -
P.H.F. 0.930 0.884 PM Peak - - 05:00 - - - 04:30 - - - -
Vol. - - 642 - - - 648 - - - -P.H.F. 0.939 0.880
Percentag
e 39.6% 60.4% 31.3% 68.7%
ADT/AADT ADT 14,545 AADT 14,545
Agenda Item No. 4 Attachment

Page 1 City of RialtoN/S: Fitzgerald AvenueE:W: Base Line Road24 Hour Entering Volume Count
RLT001NSSite Code: 007-15089
Counts Unlimited, Inc.PO Box 1178
Corona, CA 92878Phone: (951) 268-6268
Start 25-Feb-15 Southbound Hour Totals Hour Totals Combined TotalsTime Wed Morning Afternoon Morning Afternoon Morning Afternoon Morning Afternoon Morning Afternoon
12:00 5 25 0 012:15 8 39 0 012:30 4 34 0 012:45 2 34 19 132 0 0 0 0 19 13201:00 7 35 0 001:15 4 28 0 001:30 5 34 0 001:45 3 35 19 132 0 0 0 0 19 13202:00 5 43 0 002:15 4 64 0 002:30 4 35 0 002:45 3 52 16 194 0 0 0 0 16 19403:00 0 38 0 003:15 2 59 0 003:30 2 46 0 003:45 3 47 7 190 0 0 0 0 7 19004:00 0 51 0 004:15 3 64 0 004:30 8 38 0 004:45 2 50 13 203 0 0 0 0 13 20305:00 5 46 0 005:15 7 48 0 005:30 9 55 0 005:45 15 56 36 205 0 0 0 0 36 20506:00 17 49 0 006:15 15 47 0 006:30 23 45 0 006:45 39 35 94 176 0 0 0 0 94 17607:00 47 43 0 007:15 37 35 0 007:30 28 34 0 007:45 29 36 141 148 0 0 0 0 141 14808:00 20 47 0 008:15 29 32 0 008:30 23 31 0 008:45 24 36 96 146 0 0 0 0 96 14609:00 22 22 0 009:15 15 29 0 009:30 22 17 0 009:45 22 19 81 87 0 0 0 0 81 8710:00 29 16 0 010:15 20 14 0 010:30 28 16 0 010:45 27 13 104 59 0 0 0 0 104 5911:00 21 8 0 011:15 32 9 0 011:30 29 9 0 011:45 24 5 106 31 0 0 0 0 106 31Total 732 1703 732 1703 0 0 0 0 732 1703
CombinedTotal
2435 2435 0 0 2435
AM Peak - 06:45 - - - - - - - - -Vol. - 151 - - - - - - - - -
P.H.F. 0.803 PM Peak - - 03:30 - - - - - - - -
Vol. - - 208 - - - - - - - -P.H.F. 0.813
Percentag
e 30.1% 69.9% 0.0% 0.0%
ADT/AADT ADT 2,435 AADT 2,435
Agenda Item No. 4 Attachment
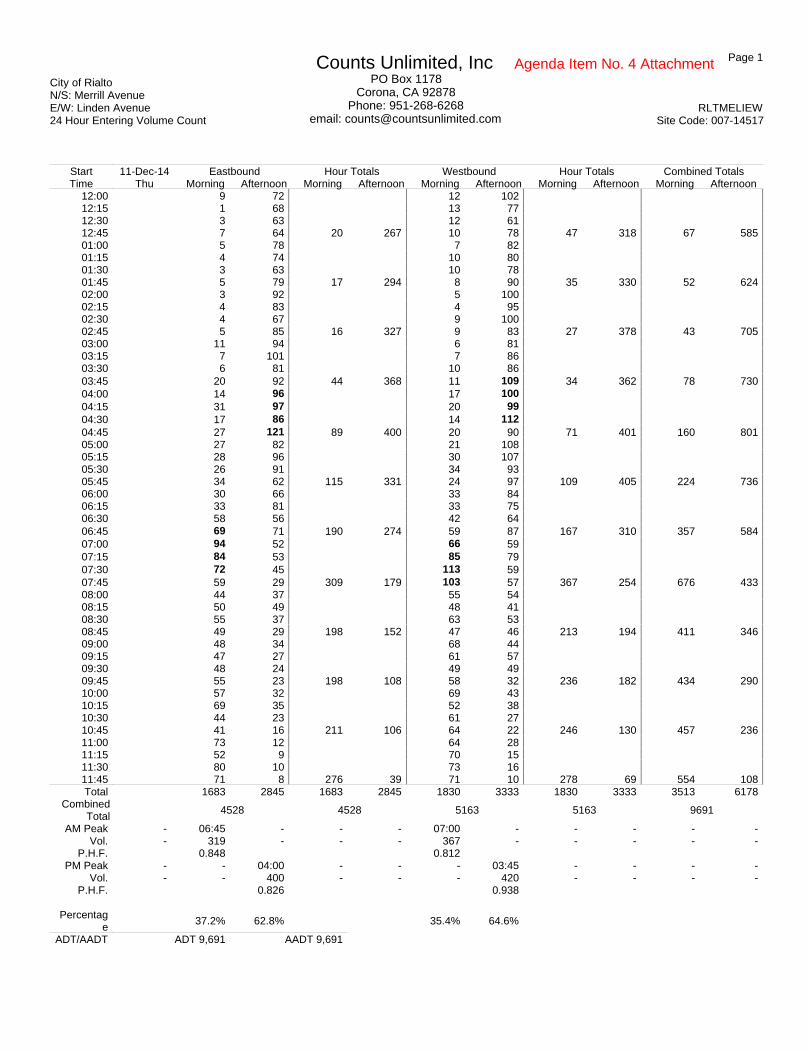
Page 1 City of RialtoN/S: Merrill AvenueE/W: Linden Avenue24 Hour Entering Volume Count
RLTMELIEWSite Code: 007-14517
Counts Unlimited, IncPO Box 1178
Corona, CA 92878Phone: 951-268-6268
email: [email protected]
Start 11-Dec-14 Eastbound Hour Totals Westbound Hour Totals Combined TotalsTime Thu Morning Afternoon Morning Afternoon Morning Afternoon Morning Afternoon Morning Afternoon
12:00 9 72 12 10212:15 1 68 13 7712:30 3 63 12 6112:45 7 64 20 267 10 78 47 318 67 58501:00 5 78 7 8201:15 4 74 10 8001:30 3 63 10 7801:45 5 79 17 294 8 90 35 330 52 62402:00 3 92 5 10002:15 4 83 4 9502:30 4 67 9 10002:45 5 85 16 327 9 83 27 378 43 70503:00 11 94 6 8103:15 7 101 7 8603:30 6 81 10 8603:45 20 92 44 368 11 109 34 362 78 73004:00 14 96 17 10004:15 31 97 20 9904:30 17 86 14 11204:45 27 121 89 400 20 90 71 401 160 80105:00 27 82 21 10805:15 28 96 30 10705:30 26 91 34 9305:45 34 62 115 331 24 97 109 405 224 73606:00 30 66 33 8406:15 33 81 33 7506:30 58 56 42 6406:45 69 71 190 274 59 87 167 310 357 58407:00 94 52 66 5907:15 84 53 85 7907:30 72 45 113 5907:45 59 29 309 179 103 57 367 254 676 43308:00 44 37 55 5408:15 50 49 48 4108:30 55 37 63 5308:45 49 29 198 152 47 46 213 194 411 34609:00 48 34 68 4409:15 47 27 61 5709:30 48 24 49 4909:45 55 23 198 108 58 32 236 182 434 29010:00 57 32 69 4310:15 69 35 52 3810:30 44 23 61 2710:45 41 16 211 106 64 22 246 130 457 23611:00 73 12 64 2811:15 52 9 70 1511:30 80 10 73 1611:45 71 8 276 39 71 10 278 69 554 108Total 1683 2845 1683 2845 1830 3333 1830 3333 3513 6178
CombinedTotal
4528 4528 5163 5163 9691
AM Peak - 06:45 - - - 07:00 - - - - -Vol. - 319 - - - 367 - - - - -
P.H.F. 0.848 0.812 PM Peak - - 04:00 - - - 03:45 - - - -
Vol. - - 400 - - - 420 - - - -P.H.F. 0.826 0.938
Percentag
e 37.2% 62.8% 35.4% 64.6%
ADT/AADT ADT 9,691 AADT 9,691
Agenda Item No. 4 Attachment
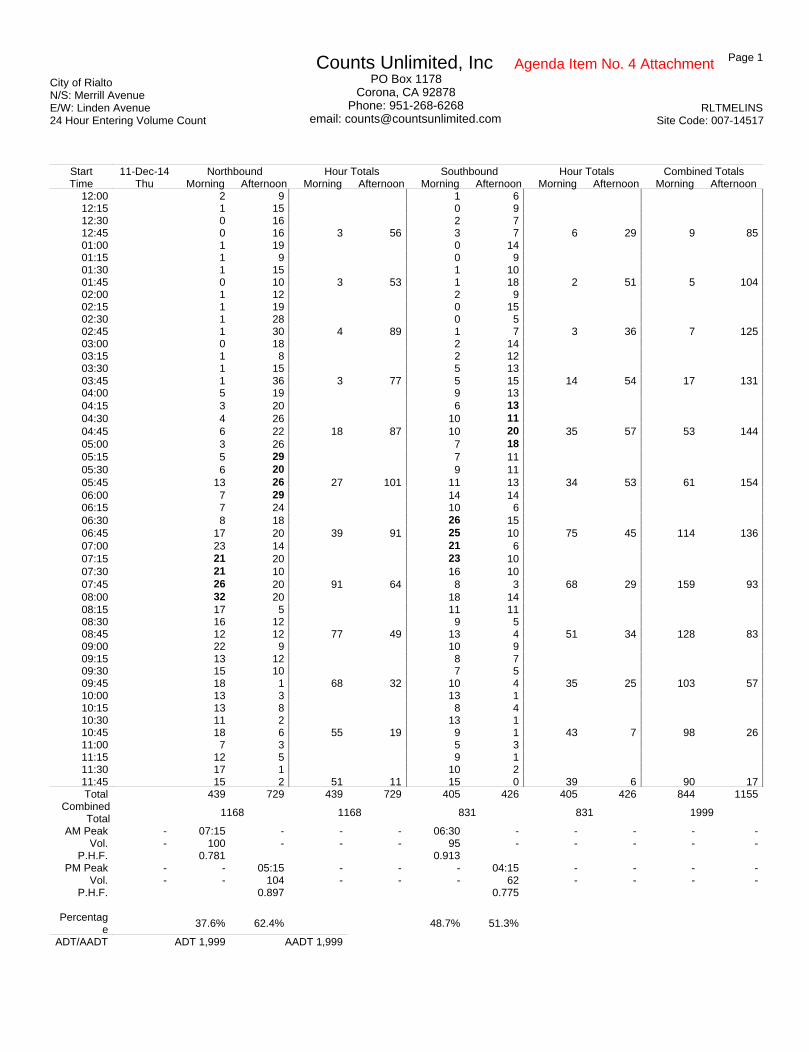
Page 1 City of RialtoN/S: Merrill AvenueE/W: Linden Avenue24 Hour Entering Volume Count
RLTMELINSSite Code: 007-14517
Counts Unlimited, IncPO Box 1178
Corona, CA 92878Phone: 951-268-6268
email: [email protected]
Start 11-Dec-14 Northbound Hour Totals Southbound Hour Totals Combined TotalsTime Thu Morning Afternoon Morning Afternoon Morning Afternoon Morning Afternoon Morning Afternoon
12:00 2 9 1 612:15 1 15 0 912:30 0 16 2 712:45 0 16 3 56 3 7 6 29 9 8501:00 1 19 0 1401:15 1 9 0 901:30 1 15 1 1001:45 0 10 3 53 1 18 2 51 5 10402:00 1 12 2 902:15 1 19 0 1502:30 1 28 0 502:45 1 30 4 89 1 7 3 36 7 12503:00 0 18 2 1403:15 1 8 2 1203:30 1 15 5 1303:45 1 36 3 77 5 15 14 54 17 13104:00 5 19 9 1304:15 3 20 6 1304:30 4 26 10 1104:45 6 22 18 87 10 20 35 57 53 14405:00 3 26 7 1805:15 5 29 7 1105:30 6 20 9 1105:45 13 26 27 101 11 13 34 53 61 15406:00 7 29 14 1406:15 7 24 10 606:30 8 18 26 1506:45 17 20 39 91 25 10 75 45 114 13607:00 23 14 21 607:15 21 20 23 1007:30 21 10 16 1007:45 26 20 91 64 8 3 68 29 159 9308:00 32 20 18 1408:15 17 5 11 1108:30 16 12 9 508:45 12 12 77 49 13 4 51 34 128 8309:00 22 9 10 909:15 13 12 8 709:30 15 10 7 509:45 18 1 68 32 10 4 35 25 103 5710:00 13 3 13 110:15 13 8 8 410:30 11 2 13 110:45 18 6 55 19 9 1 43 7 98 2611:00 7 3 5 311:15 12 5 9 111:30 17 1 10 211:45 15 2 51 11 15 0 39 6 90 17Total 439 729 439 729 405 426 405 426 844 1155
CombinedTotal
1168 1168 831 831 1999
AM Peak - 07:15 - - - 06:30 - - - - -Vol. - 100 - - - 95 - - - - -
P.H.F. 0.781 0.913 PM Peak - - 05:15 - - - 04:15 - - - -
Vol. - - 104 - - - 62 - - - -P.H.F. 0.897 0.775
Percentag
e 37.6% 62.4% 48.7% 51.3%
ADT/AADT ADT 1,999 AADT 1,999
Agenda Item No. 4 Attachment

Page 1 City of RialtoN/S: Spruce AvenueE:W: Valley Boulevard24 Hour Entering Volume Count
RLT003EWSite Code: 001508631414
Counts Unlimited, Inc.PO Box 1178
Corona, CA 92878Phone: (951) 268-6268
Start 25-Feb-15 Eastbound Hour Totals Westbound Hour Totals Combined TotalsTime Wed Morning Afternoon Morning Afternoon Morning Afternoon Morning Afternoon Morning Afternoon
12:00 16 118 9 10012:15 12 140 11 11312:30 12 143 7 10412:45 17 127 57 528 8 83 35 400 92 92801:00 11 128 7 10201:15 7 145 7 9701:30 3 156 5 14401:45 13 155 34 584 2 159 21 502 55 108602:00 6 167 9 10902:15 7 155 6 13102:30 4 127 5 11202:45 7 165 24 614 5 124 25 476 49 109003:00 7 138 8 11203:15 8 146 6 12203:30 9 143 16 11803:45 13 180 37 607 14 123 44 475 81 108204:00 15 137 8 10504:15 15 163 15 11504:30 17 48 29 12704:45 26 0 73 348 22 142 74 489 147 83705:00 19 0 31 10105:15 24 0 38 11705:30 24 0 35 12605:45 22 0 89 0 38 129 142 473 231 47306:00 35 0 31 10906:15 30 0 46 9506:30 37 0 49 9406:45 40 0 142 0 65 85 191 383 333 38307:00 45 0 58 7307:15 82 0 73 6707:30 99 0 118 7307:45 121 0 347 0 161 51 410 264 757 26408:00 90 0 190 5208:15 60 0 123 4808:30 86 0 89 4008:45 103 0 339 0 97 35 499 175 838 17509:00 101 45 106 4709:15 109 51 103 4909:30 111 51 89 4209:45 100 27 421 174 95 27 393 165 814 33910:00 113 29 90 2510:15 113 35 98 2010:30 106 28 89 910:45 143 22 475 114 106 19 383 73 858 18711:00 124 19 93 1011:15 125 14 88 1311:30 122 13 106 1811:45 120 18 491 64 104 16 391 57 882 121Total 2529 3033 2529 3033 2608 3932 2608 3932 5137 6965
CombinedTotal
5562 5562 6540 6540 12102
AM Peak - 10:45 - - - 07:30 - - - - -Vol. - 514 - - - 592 - - - - -
P.H.F. 0.899 0.779 PM Peak - - 01:30 - - - 01:30 - - - -
Vol. - - 633 - - - 543 - - - -P.H.F. 0.948 0.854
Percentag
e 45.5% 54.5% 39.9% 60.1%
ADT/AADT ADT 12,102 AADT 12,102
Agenda Item No. 4 Attachment
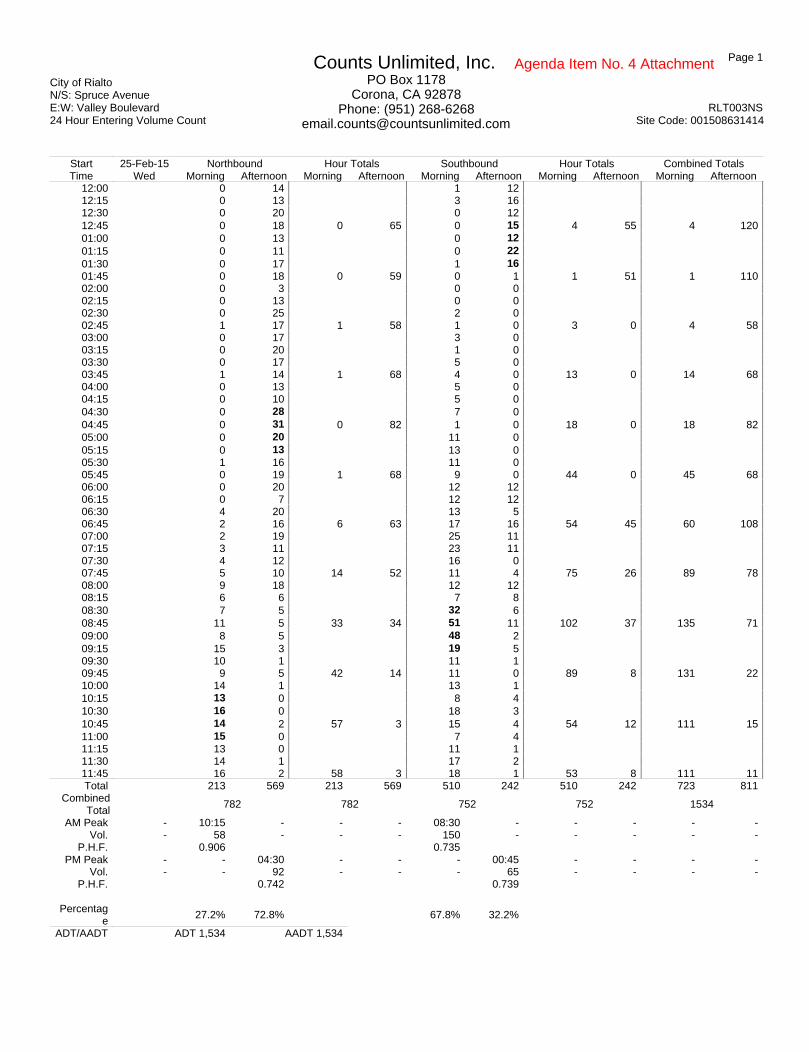
Page 1 City of RialtoN/S: Spruce AvenueE:W: Valley Boulevard24 Hour Entering Volume Count
RLT003NSSite Code: 001508631414
Counts Unlimited, Inc.PO Box 1178
Corona, CA 92878Phone: (951) 268-6268
Start 25-Feb-15 Northbound Hour Totals Southbound Hour Totals Combined TotalsTime Wed Morning Afternoon Morning Afternoon Morning Afternoon Morning Afternoon Morning Afternoon
12:00 0 14 1 1212:15 0 13 3 1612:30 0 20 0 1212:45 0 18 0 65 0 15 4 55 4 12001:00 0 13 0 1201:15 0 11 0 2201:30 0 17 1 1601:45 0 18 0 59 0 1 1 51 1 11002:00 0 3 0 002:15 0 13 0 002:30 0 25 2 002:45 1 17 1 58 1 0 3 0 4 5803:00 0 17 3 003:15 0 20 1 003:30 0 17 5 003:45 1 14 1 68 4 0 13 0 14 6804:00 0 13 5 004:15 0 10 5 004:30 0 28 7 004:45 0 31 0 82 1 0 18 0 18 8205:00 0 20 11 005:15 0 13 13 005:30 1 16 11 005:45 0 19 1 68 9 0 44 0 45 6806:00 0 20 12 1206:15 0 7 12 1206:30 4 20 13 506:45 2 16 6 63 17 16 54 45 60 10807:00 2 19 25 1107:15 3 11 23 1107:30 4 12 16 007:45 5 10 14 52 11 4 75 26 89 7808:00 9 18 12 1208:15 6 6 7 808:30 7 5 32 608:45 11 5 33 34 51 11 102 37 135 7109:00 8 5 48 209:15 15 3 19 509:30 10 1 11 109:45 9 5 42 14 11 0 89 8 131 2210:00 14 1 13 110:15 13 0 8 410:30 16 0 18 310:45 14 2 57 3 15 4 54 12 111 1511:00 15 0 7 411:15 13 0 11 111:30 14 1 17 211:45 16 2 58 3 18 1 53 8 111 11Total 213 569 213 569 510 242 510 242 723 811
CombinedTotal
782 782 752 752 1534
AM Peak - 10:15 - - - 08:30 - - - - -Vol. - 58 - - - 150 - - - - -
P.H.F. 0.906 0.735 PM Peak - - 04:30 - - - 00:45 - - - -
Vol. - - 92 - - - 65 - - - -P.H.F. 0.742 0.739
Percentag
e 27.2% 72.8% 67.8% 32.2%
ADT/AADT ADT 1,534 AADT 1,534
Agenda Item No. 4 Attachment
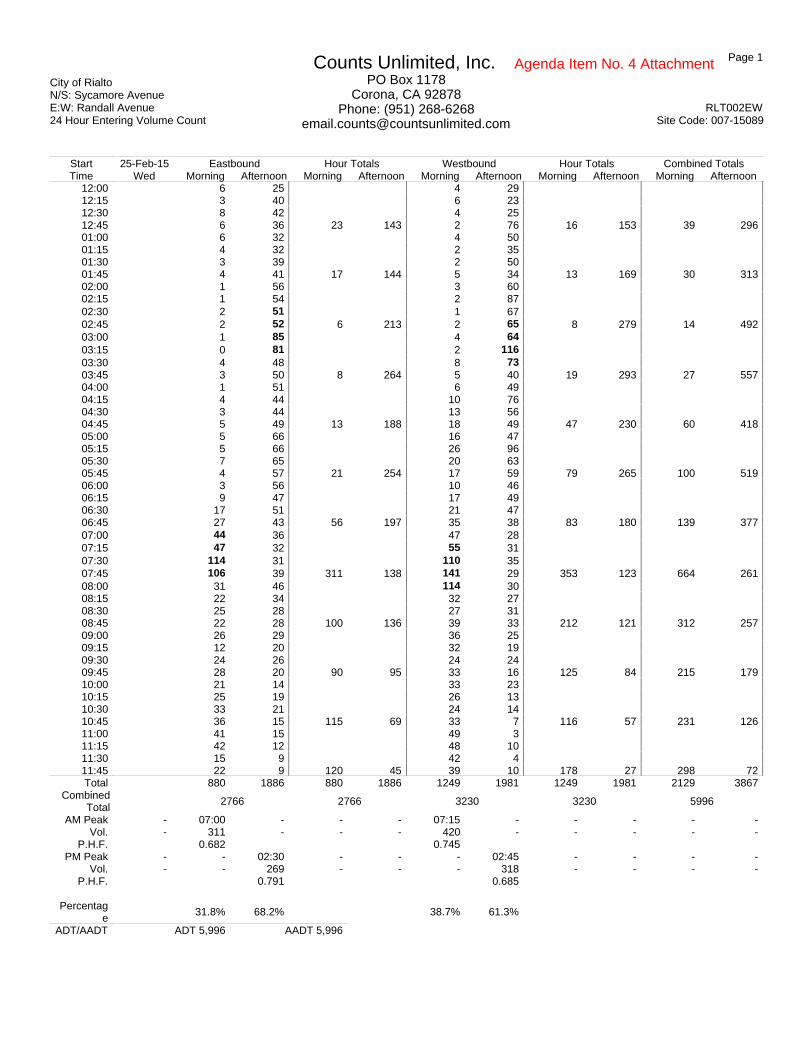
Page 1 City of RialtoN/S: Sycamore AvenueE:W: Randall Avenue24 Hour Entering Volume Count
RLT002EWSite Code: 007-15089
Counts Unlimited, Inc.PO Box 1178
Corona, CA 92878Phone: (951) 268-6268
Start 25-Feb-15 Eastbound Hour Totals Westbound Hour Totals Combined TotalsTime Wed Morning Afternoon Morning Afternoon Morning Afternoon Morning Afternoon Morning Afternoon
12:00 6 25 4 2912:15 3 40 6 2312:30 8 42 4 2512:45 6 36 23 143 2 76 16 153 39 29601:00 6 32 4 5001:15 4 32 2 3501:30 3 39 2 5001:45 4 41 17 144 5 34 13 169 30 31302:00 1 56 3 6002:15 1 54 2 8702:30 2 51 1 6702:45 2 52 6 213 2 65 8 279 14 49203:00 1 85 4 6403:15 0 81 2 11603:30 4 48 8 7303:45 3 50 8 264 5 40 19 293 27 55704:00 1 51 6 4904:15 4 44 10 7604:30 3 44 13 5604:45 5 49 13 188 18 49 47 230 60 41805:00 5 66 16 4705:15 5 66 26 9605:30 7 65 20 6305:45 4 57 21 254 17 59 79 265 100 51906:00 3 56 10 4606:15 9 47 17 4906:30 17 51 21 4706:45 27 43 56 197 35 38 83 180 139 37707:00 44 36 47 2807:15 47 32 55 3107:30 114 31 110 3507:45 106 39 311 138 141 29 353 123 664 26108:00 31 46 114 3008:15 22 34 32 2708:30 25 28 27 3108:45 22 28 100 136 39 33 212 121 312 25709:00 26 29 36 2509:15 12 20 32 1909:30 24 26 24 2409:45 28 20 90 95 33 16 125 84 215 17910:00 21 14 33 2310:15 25 19 26 1310:30 33 21 24 1410:45 36 15 115 69 33 7 116 57 231 12611:00 41 15 49 311:15 42 12 48 1011:30 15 9 42 411:45 22 9 120 45 39 10 178 27 298 72Total 880 1886 880 1886 1249 1981 1249 1981 2129 3867
CombinedTotal
2766 2766 3230 3230 5996
AM Peak - 07:00 - - - 07:15 - - - - -Vol. - 311 - - - 420 - - - - -
P.H.F. 0.682 0.745 PM Peak - - 02:30 - - - 02:45 - - - -
Vol. - - 269 - - - 318 - - - -P.H.F. 0.791 0.685
Percentag
e 31.8% 68.2% 38.7% 61.3%
ADT/AADT ADT 5,996 AADT 5,996
Agenda Item No. 4 Attachment

Page 1 City of RialtoN/S: Sycamore AvenueE:W: Randall Avenue24 Hour Entering Volume Count
RLT002NSSite Code: 007-15089
Counts Unlimited, Inc.PO Box 1178
Corona, CA 92878Phone: (951) 268-6268
Start 25-Feb-15 Northbound Hour Totals Southbound Hour Totals Combined TotalsTime Wed Morning Afternoon Morning Afternoon Morning Afternoon Morning Afternoon Morning Afternoon
12:00 6 19 10 4112:15 5 19 8 5312:30 0 34 4 4712:45 6 46 17 118 3 47 25 188 42 30601:00 3 31 5 4501:15 3 24 1 4701:30 5 23 3 5001:45 2 27 13 105 5 45 14 187 27 29202:00 2 49 0 5702:15 1 53 4 5802:30 0 35 3 5202:45 3 62 6 199 3 56 10 223 16 42203:00 1 53 6 6003:15 1 55 10 5703:30 1 53 9 5203:45 2 60 5 221 6 46 31 215 36 43604:00 3 46 13 6904:15 3 51 25 4204:30 6 61 27 6704:45 3 74 15 232 18 55 83 233 98 46505:00 3 61 28 6505:15 7 61 20 6005:30 8 69 45 5505:45 6 61 24 252 27 65 120 245 144 49706:00 13 68 31 6206:15 5 48 36 4906:30 12 40 42 4906:45 15 35 45 191 56 47 165 207 210 39807:00 26 36 55 5207:15 41 52 96 4107:30 58 29 76 3307:45 42 30 167 147 75 39 302 165 469 31208:00 20 34 63 3108:15 13 28 40 2608:30 9 25 40 2708:45 22 18 64 105 35 38 178 122 242 22709:00 19 25 48 3109:15 17 32 48 3009:30 15 15 40 3109:45 27 19 78 91 40 18 176 110 254 20110:00 24 15 36 1910:15 22 8 33 1910:30 28 24 32 1410:45 24 15 98 62 43 11 144 63 242 12511:00 34 9 48 1311:15 31 12 36 611:30 20 7 28 511:45 27 5 112 33 55 11 167 35 279 68Total 644 1756 644 1756 1415 1993 1415 1993 2059 3749
CombinedTotal
2400 2400 3408 3408 5808
AM Peak - 07:00 - - - 07:15 - - - - -Vol. - 167 - - - 310 - - - - -
P.H.F. 0.720 0.807 PM Peak - - 04:45 - - - 04:30 - - - -
Vol. - - 265 - - - 247 - - - -P.H.F. 0.895 0.922
Percentag
e 26.8% 73.2% 41.5% 58.5%
ADT/AADT ADT 5,808 AADT 5,808
Agenda Item No. 4 Attachment
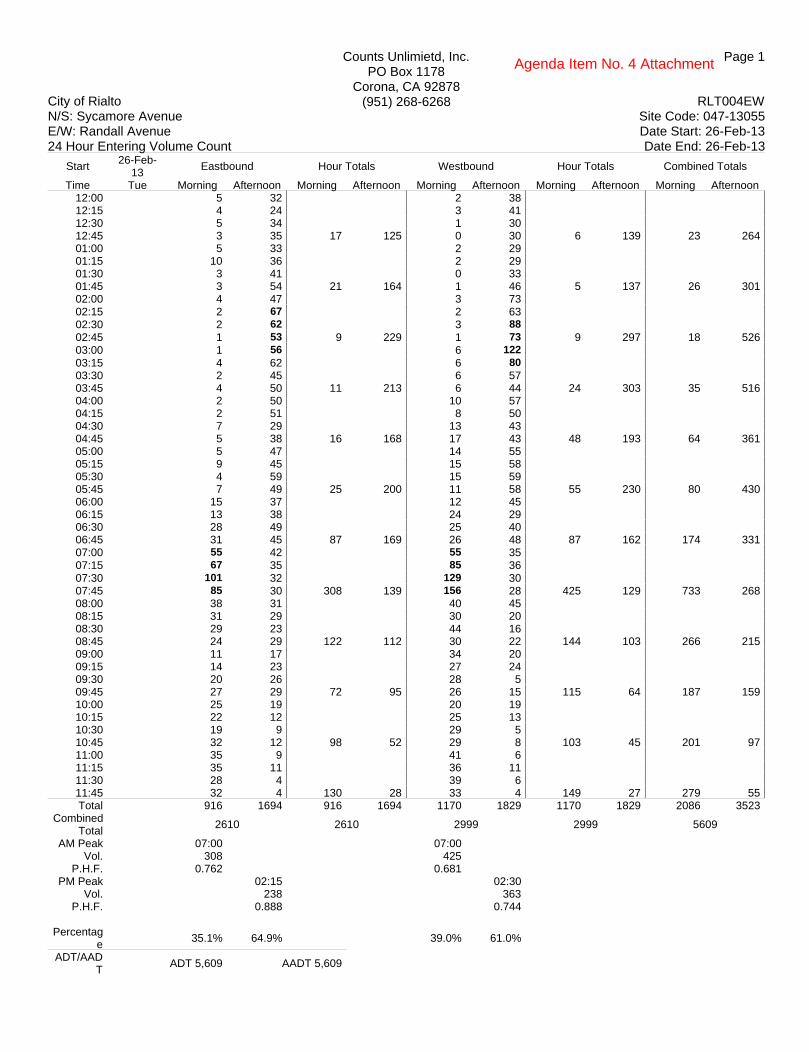
Counts Unlimietd, Inc.PO Box 1178
Corona, CA 92878(951) 268-6268
City of Rialto N/S: Sycamore Avenue E/W: Randall Avenue 24 Hour Entering Volume Count
RLT004EWSite Code: 047-13055Date Start: 26-Feb-13Date End: 26-Feb-13
Page 1
Start26-Feb-
13Eastbound Hour Totals Westbound Hour Totals Combined Totals
Time Tue Morning Afternoon Morning Afternoon Morning Afternoon Morning Afternoon Morning Afternoon12:00 5 32 2 3812:15 4 24 3 4112:30 5 34 1 3012:45 3 35 17 125 0 30 6 139 23 26401:00 5 33 2 2901:15 10 36 2 2901:30 3 41 0 3301:45 3 54 21 164 1 46 5 137 26 30102:00 4 47 3 7302:15 2 67 2 6302:30 2 62 3 88
02:45 1 53 9 229 1 73 9 297 18 52603:00 1 56 6 122
03:15 4 62 6 8003:30 2 45 6 5703:45 4 50 11 213 6 44 24 303 35 51604:00 2 50 10 5704:15 2 51 8 5004:30 7 29 13 4304:45 5 38 16 168 17 43 48 193 64 36105:00 5 47 14 5505:15 9 45 15 5805:30 4 59 15 5905:45 7 49 25 200 11 58 55 230 80 43006:00 15 37 12 4506:15 13 38 24 2906:30 28 49 25 4006:45 31 45 87 169 26 48 87 162 174 33107:00 55 42 55 3507:15 67 35 85 3607:30 101 32 129 3007:45 85 30 308 139 156 28 425 129 733 26808:00 38 31 40 4508:15 31 29 30 2008:30 29 23 44 1608:45 24 29 122 112 30 22 144 103 266 21509:00 11 17 34 2009:15 14 23 27 2409:30 20 26 28 509:45 27 29 72 95 26 15 115 64 187 15910:00 25 19 20 1910:15 22 12 25 1310:30 19 9 29 510:45 32 12 98 52 29 8 103 45 201 9711:00 35 9 41 611:15 35 11 36 1111:30 28 4 39 611:45 32 4 130 28 33 4 149 27 279 55Total 916 1694 916 1694 1170 1829 1170 1829 2086 3523
Combined Total
2610 2610 2999 2999 5609
AM Peak 07:00 07:00 Vol. 308 425
P.H.F. 0.762 0.681 PM Peak 02:15 02:30
Vol. 238 363 P.H.F. 0.888 0.744
Percentag
e 35.1% 64.9% 39.0% 61.0%
ADT/AADT
ADT 5,609 AADT 5,609
Agenda Item No. 4 Attachment

Counts Unlimietd, Inc.PO Box 1178
Corona, CA 92878(951) 268-6268
City of Rialto N/S: Sycamore Avenue E/W: Randall Avenue 24 Hour Entering Volume Count
RLT004NSSite Code: 047-13055Date Start: 26-Feb-13Date End: 26-Feb-13
Page 1
Start26-Feb-
13Northbound Hour Totals Southbound Hour Totals Combined Totals
Time Tue Morning Afternoon Morning Afternoon Morning Afternoon Morning Afternoon Morning Afternoon12:00 4 26 6 4412:15 4 30 3 3512:30 9 33 9 4112:45 1 29 18 118 3 54 21 174 39 29201:00 2 21 3 4101:15 2 27 2 5101:30 1 30 2 4901:45 2 33 7 111 2 49 9 190 16 30102:00 2 50 4 67
02:15 1 47 2 70
02:30 0 60 2 71
02:45 4 37 7 194 3 73 11 281 18 47503:00 1 40 4 5903:15 0 50 5 5803:30 1 53 4 5903:45 3 53 5 196 7 45 20 221 25 41704:00 0 69 15 6604:15 2 62 18 6904:30 5 55 22 6104:45 4 66 11 252 14 64 69 260 80 51205:00 8 61 26 5505:15 3 57 24 5505:30 2 67 41 5305:45 6 53 19 238 23 70 114 233 133 47106:00 4 47 27 4506:15 8 51 31 6306:30 14 34 57 6406:45 13 49 39 181 41 59 156 231 195 41207:00 20 36 60 4707:15 40 29 86 3207:30 49 24 96 3007:45 44 23 153 112 71 36 313 145 466 25708:00 28 27 53 2408:15 22 26 45 3608:30 13 20 25 3208:45 23 16 86 89 45 22 168 114 254 20309:00 18 16 38 2309:15 22 19 38 2309:30 27 21 40 2709:45 31 14 98 70 30 15 146 88 244 15810:00 14 23 40 1610:15 24 15 25 1210:30 26 8 32 1510:45 35 7 99 53 54 8 151 51 250 10411:00 17 12 41 811:15 34 8 45 1011:30 29 11 52 711:45 31 6 111 37 31 4 169 29 280 66Total 653 1651 653 1651 1347 2017 1347 2017 2000 3668
Combined Total
2304 2304 3364 3364 5668
AM Peak 07:15 07:00 Vol. 161 313
P.H.F. 0.821 0.815 PM Peak 04:00 02:00
Vol. 252 281 P.H.F. 0.913 0.962
Percentag
e 28.3% 71.7% 40.0% 60.0%
ADT/AADT
ADT 5,668 AADT 5,668
Agenda Item No. 4 Attachment

Traffic Signal Prioritization Analysis City of Rialto
APPENDIX B
Pedestrian Peak Hour Counts
Agenda Item No. 4 Attachment

Location: Date: 1/21/2015
N/S: Weather: Clear
E/W:
North Leg East Leg South Leg West LegAcacia Avenue Rialto Avenue Acacia Avenue Rialto Avenue
School Age Peds School Age Peds School Age Peds School Age Peds TOTAL
0 0 0 1 1
0 0 0 0 0
0 0 0 0 0
0 0 1 0 1
0 0 5 3 8
0 0 0 0 0
1 2 1 0 40 1 0 0 1
1 3 7 4 15
North Leg East Leg South Leg West LegAcacia Avenue Rialto Avenue Acacia Avenue Rialto Avenue
School Age Peds School Age Peds School Age Peds School Age Peds TOTAL
0 0 0 0 0
0 0 0 0 0
0 0 0 1 1
0 0 0 1 1
0 0 1 0 1
1 0 0 1 2
0 0 0 0 00 0 0 0 0
1 0 1 3 5TOTAL VOLUMES:
2:00 PM2:15 PM
1:15 PM
8:00 AM8:15 AM
TOTAL VOLUMES:
1:00 PM
Rialto
Acacia Avenue
Rialto Avenue
7:00 AM
1:30 PM
1:45 PM
4:45 PM
5:45 PM
School Age Peds
6:30 AM
7:15 AM
7:30 AM
7:45 AM
6:45 AM
Counts Unlimited, Inc.
PO Box 1178
Corona, CA 92878
951‐268‐6268
Agenda Item No. 4 Attachment

Location: Date: 1/21/2015
N/S: Weather: Clear
E/W:
North Leg East Leg South Leg West LegAcacia Avenue Rialto Avenue Acacia Avenue Rialto Avenue
Non‐School Age Peds Non‐School Age Peds Non‐School Age Peds Non‐School Age Peds TOTAL
1 1 0 0 2
0 1 0 0 1
0 0 0 0 0
0 0 0 0 0
0 1 1 1 3
0 0 0 0 0
0 0 0 0 00 0 2 0 2
1 3 3 1 8
North Leg East Leg South Leg West LegAcacia Avenue Rialto Avenue Acacia Avenue Rialto Avenue
Non‐School Age Peds Non‐School Age Peds Non‐School Age Peds Non‐School Age Peds TOTAL
1 0 0 0 1
2 0 1 0 3
1 0 0 3 4
0 0 2 0 2
0 0 0 1 1
0 0 1 1 2
0 0 0 0 00 0 0 0 0
4 0 4 5 13
1:00 PM
Non‐School Age Peds
8:15 AM
6:45 AM
7:00 AM
7:15 AM
7:30 AM
7:45 AM
8:00 AM
TOTAL VOLUMES:
Rialto
Acacia Avenue
Rialto Avenue
6:30 AM
TOTAL VOLUMES:
1:15 PM
2:00 PM2:15 PM
1:30 PM
1:45 PM
4:45 PM
5:45 PM
Counts Unlimited, Inc.
PO Box 1178
Corona, CA 92878
951‐268‐6268
Agenda Item No. 4 Attachment
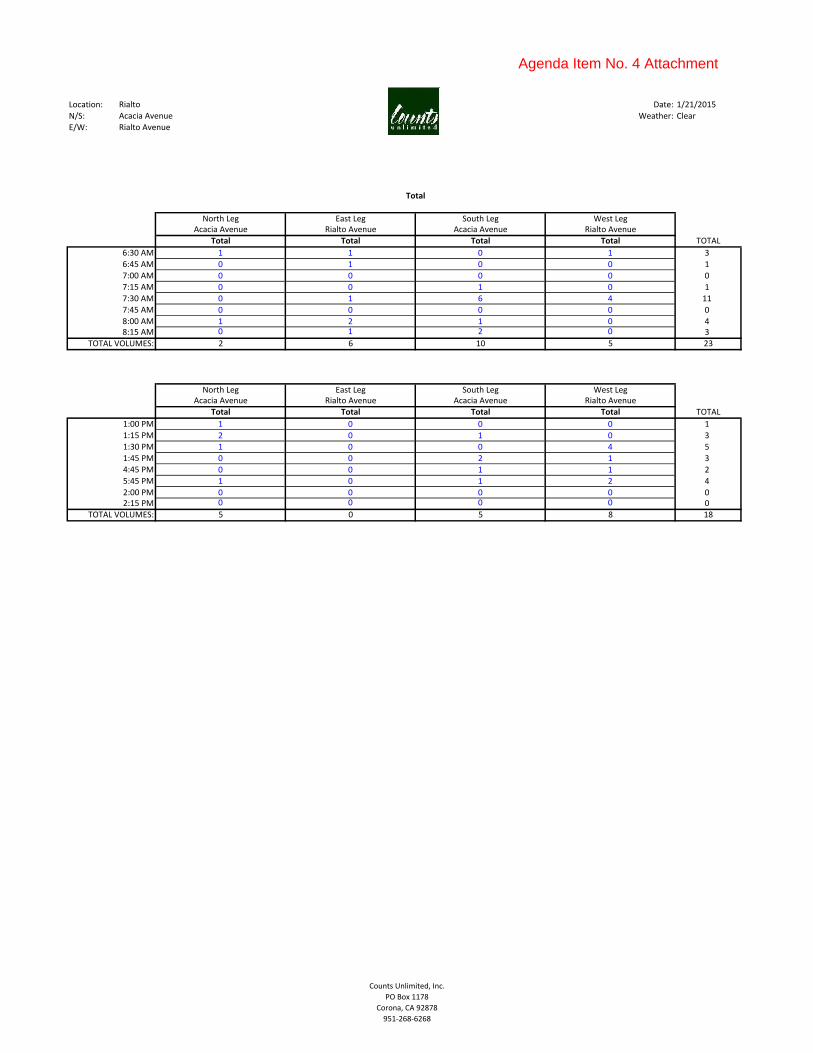
Location: Date: 1/21/2015
N/S: Weather: Clear
E/W:
North Leg East Leg South Leg West LegAcacia Avenue Rialto Avenue Acacia Avenue Rialto Avenue
Total Total Total Total TOTAL
1 1 0 1 3
0 1 0 0 1
0 0 0 0 0
0 0 1 0 1
0 1 6 4 11
0 0 0 0 0
1 2 1 0 40 1 2 0 3
2 6 10 5 23
North Leg East Leg South Leg West LegAcacia Avenue Rialto Avenue Acacia Avenue Rialto Avenue
Total Total Total Total TOTAL
1 0 0 0 1
2 0 1 0 3
1 0 0 4 5
0 0 2 1 3
0 0 1 1 2
1 0 1 2 4
0 0 0 0 00 0 0 0 0
5 0 5 8 18
Total
6:30 AM
8:00 AM
Rialto
Acacia Avenue
Rialto Avenue
6:45 AM
7:00 AM
7:15 AM
7:30 AM
7:45 AM
8:15 AM
TOTAL VOLUMES:
1:00 PM
1:15 PM
2:00 PM2:15 PM
1:30 PM
1:45 PM
4:45 PM
5:45 PM
TOTAL VOLUMES:
Counts Unlimited, Inc.
PO Box 1178
Corona, CA 92878
951‐268‐6268
Agenda Item No. 4 Attachment
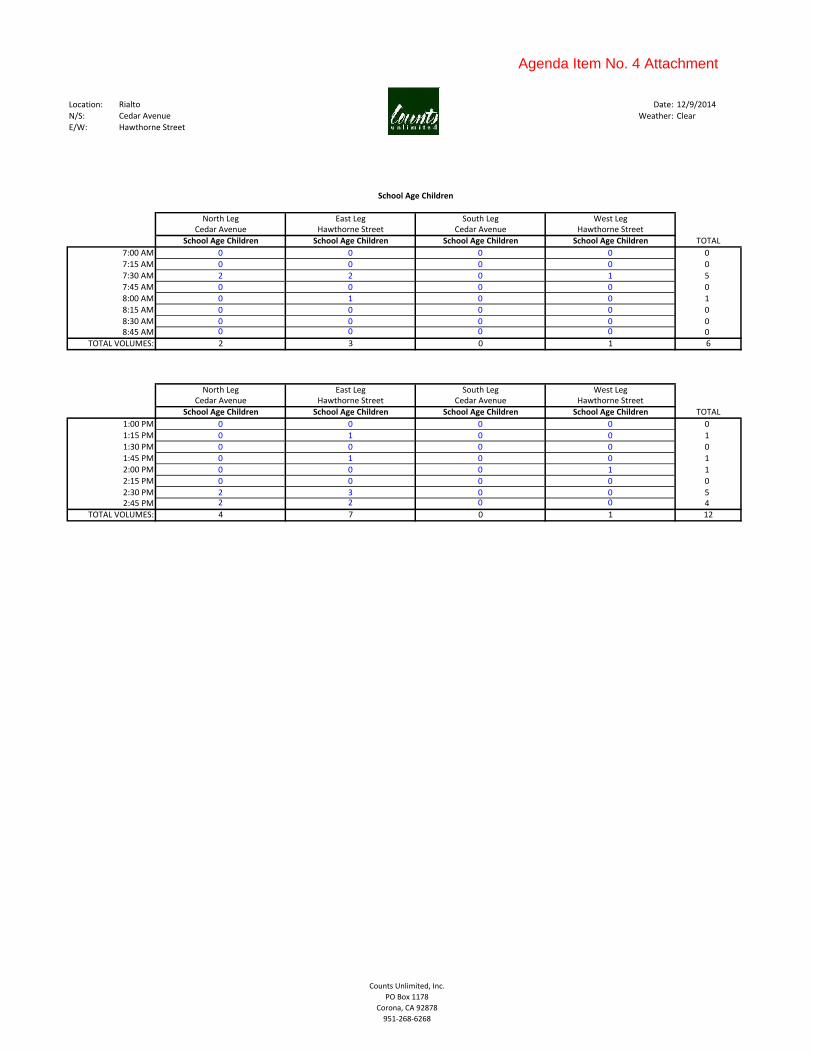
Location: Date: 12/9/2014
N/S: Weather: Clear
E/W:
North Leg East Leg South Leg West LegCedar Avenue Hawthorne Street Cedar Avenue Hawthorne Street
School Age Children School Age Children School Age Children School Age Children TOTAL
0 0 0 0 0
0 0 0 0 0
2 2 0 1 5
0 0 0 0 0
0 1 0 0 1
0 0 0 0 0
0 0 0 0 00 0 0 0 0
2 3 0 1 6
North Leg East Leg South Leg West LegCedar Avenue Hawthorne Street Cedar Avenue Hawthorne Street
School Age Children School Age Children School Age Children School Age Children TOTAL
0 0 0 0 0
0 1 0 0 1
0 0 0 0 0
0 1 0 0 1
0 0 0 1 1
0 0 0 0 0
2 3 0 0 52 2 0 0 4
4 7 0 1 12
School Age Children
7:00 AM
7:45 AM
8:00 AM
8:15 AM
7:15 AM
1:15 PM
2:00 PM
Rialto
Cedar Avenue
Hawthorne Street
7:30 AM
8:30 AM8:45 AM
TOTAL VOLUMES:
1:00 PM
2:15 PM
2:30 PM
1:30 PM
1:45 PM
2:45 PM
TOTAL VOLUMES:
Counts Unlimited, Inc.
PO Box 1178
Corona, CA 92878
951‐268‐6268
Agenda Item No. 4 Attachment

Location: Date: 12/9/2014
N/S: Weather: Clear
E/W:
North Leg East Leg South Leg West LegCedar Avenue Hawthorne Street Cedar Avenue Hawthorne Street
Adults Adults Adults Adults TOTAL
0 0 0 1 1
0 0 0 0 0
0 0 0 0 0
0 2 1 0 3
0 0 0 0 0
0 0 0 0 0
0 0 0 0 00 1 0 0 1
0 3 1 1 5
North Leg East Leg South Leg West LegCedar Avenue Hawthorne Street Cedar Avenue Hawthorne Street
Adults Adults Adults Adults TOTAL
0 0 0 0 0
0 1 0 0 1
0 0 0 0 0
0 0 0 0 0
0 1 0 1 2
0 1 0 0 1
0 0 0 0 00 0 0 0 0
0 3 0 1 4
2:30 PM2:45 PM
TOTAL VOLUMES:
1:15 PM
1:30 PM
1:45 PM
2:00 PM
1:00 PM
Adults
2:15 PM
8:45 AM
Rialto
Cedar Avenue
Hawthorne Street
7:00 AM
7:15 AM
7:30 AM
7:45 AM
8:00 AM
8:15 AM
8:30 AM
TOTAL VOLUMES:
Counts Unlimited, Inc.
PO Box 1178
Corona, CA 92878
951‐268‐6268
Agenda Item No. 4 Attachment
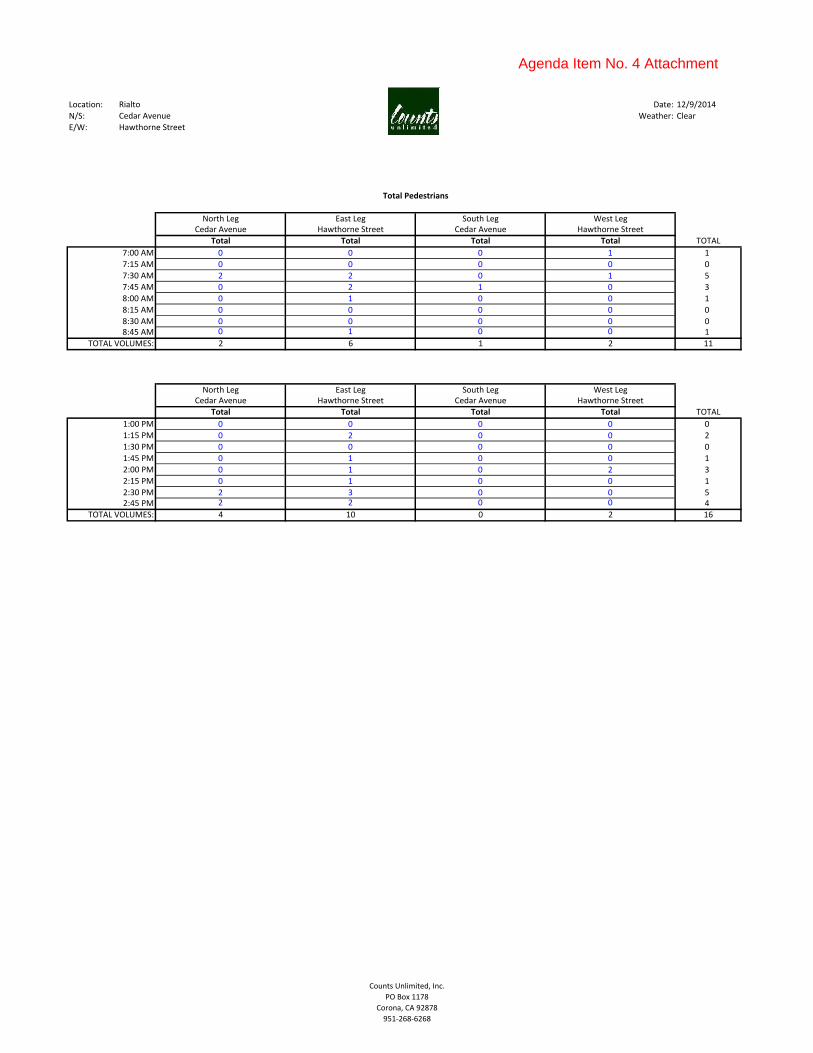
Location: Date: 12/9/2014
N/S: Weather: Clear
E/W:
North Leg East Leg South Leg West LegCedar Avenue Hawthorne Street Cedar Avenue Hawthorne Street
Total Total Total Total TOTAL
0 0 0 1 1
0 0 0 0 0
2 2 0 1 5
0 2 1 0 3
0 1 0 0 1
0 0 0 0 0
0 0 0 0 00 1 0 0 1
2 6 1 2 11
North Leg East Leg South Leg West LegCedar Avenue Hawthorne Street Cedar Avenue Hawthorne Street
Total Total Total Total TOTAL
0 0 0 0 0
0 2 0 0 2
0 0 0 0 0
0 1 0 0 1
0 1 0 2 3
0 1 0 0 1
2 3 0 0 52 2 0 0 4
4 10 0 2 16
2:00 PM
2:15 PM
2:30 PM2:45 PM
TOTAL VOLUMES:
8:45 AM
TOTAL VOLUMES:
1:00 PM
1:15 PM
1:30 PM
1:45 PM
7:15 AM
7:30 AM
7:45 AM
8:00 AM
8:15 AM
8:30 AM
Rialto
Cedar Avenue
Hawthorne Street
Total Pedestrians
7:00 AM
Counts Unlimited, Inc.
PO Box 1178
Corona, CA 92878
951‐268‐6268
Agenda Item No. 4 Attachment

Location: Date: 12/9/2014
N/S: Weather: Clear
E/W:
North Leg East Leg South Leg West LegEucalyptus Avenue Rialto Avenue Eucalyptus Avenue Rialto Avenue
School Age Children School Age Children School Age Children School Age Children TOTAL
0 2 0 3 5
0 0 0 0 0
0 1 0 0 1
0 1 0 2 3
0 11 0 3 14
1 2 1 1 5
0 2 1 1 40 0 0 0 0
1 19 2 10 32
North Leg East Leg South Leg West LegEucalyptus Avenue Rialto Avenue Eucalyptus Avenue Rialto Avenue
School Age Children School Age Children School Age Children School Age Children TOTAL
3 0 0 0 3
0 0 0 0 0
0 0 0 0 0
0 0 0 0 0
0 1 0 1 2
1 1 0 1 3
0 1 0 2 30 5 0 1 6
4 8 0 5 17TOTAL VOLUMES:
Rialto
Eucalyptus Avenue
Rialto Avenue
7:00 AM
8:00 AM8:15 AM
TOTAL VOLUMES:
1:00 PM
2:15 PM
2:30 PM
1:30 PM
1:45 PM
2:45 PM
School Age Children
6:30 AM
7:15 AM
7:30 AM
7:45 AM
6:45 AM
1:15 PM
2:00 PM
Counts Unlimited, Inc.
PO Box 1178
Corona, CA 92878
951‐268‐6268
Agenda Item No. 4 Attachment

Location: Date: 12/9/2014
N/S: Weather: Clear
E/W:
North Leg East Leg South Leg West LegEucalyptus Avenue Rialto Avenue Eucalyptus Avenue Rialto Avenue
Adults Adults Adults Adults TOTAL
1 0 0 1 2
1 0 0 0 1
0 1 1 0 2
0 1 1 1 3
0 3 0 0 3
1 0 0 3 4
1 1 3 0 50 5 1 4 10
4 11 6 9 30
North Leg East Leg South Leg West LegEucalyptus Avenue Rialto Avenue Eucalyptus Avenue Rialto Avenue
Adults Adults Adults Adults TOTAL
2 0 0 0 2
1 1 0 1 3
1 0 0 0 1
1 1 2 3 7
1 5 1 1 8
0 0 0 2 2
2 0 0 2 40 1 1 0 2
8 8 4 9 29
1:00 PM
Adults
2:15 PM
8:15 AM
Rialto
Eucalyptus Avenue
Rialto Avenue
6:30 AM
6:45 AM
7:00 AM
7:15 AM
7:30 AM
7:45 AM
8:00 AM
TOTAL VOLUMES:
2:30 PM2:45 PM
TOTAL VOLUMES:
1:15 PM
1:30 PM
1:45 PM
2:00 PM
Counts Unlimited, Inc.
PO Box 1178
Corona, CA 92878
951‐268‐6268
Agenda Item No. 4 Attachment

Location: Date: 12/9/2014
N/S: Weather: Clear
E/W:
North Leg East Leg South Leg West LegEucalyptus Avenue Rialto Avenue Eucalyptus Avenue Rialto Avenue
Total Total Total Total TOTAL
1 2 0 4 7
1 0 0 0 1
0 2 1 0 3
0 2 1 3 6
0 14 0 3 17
2 2 1 4 9
1 3 4 1 90 5 1 4 10
5 30 8 19 62
North Leg East Leg South Leg West LegEucalyptus Avenue Rialto Avenue Eucalyptus Avenue Rialto Avenue
Total Total Total Total TOTAL
5 0 0 0 5
1 1 0 1 3
1 0 0 0 1
1 1 2 3 7
1 6 1 2 10
1 1 0 3 5
2 1 0 4 70 6 1 1 8
12 16 4 14 46
Total Pedestrians
6:30 AM
8:00 AM
Rialto
Eucalyptus Avenue
Rialto Avenue
6:45 AM
7:00 AM
7:15 AM
7:30 AM
7:45 AM
8:15 AM
TOTAL VOLUMES:
1:00 PM
1:15 PM
1:30 PM
1:45 PM
2:00 PM
2:15 PM
2:30 PM2:45 PM
TOTAL VOLUMES:
Counts Unlimited, Inc.
PO Box 1178
Corona, CA 92878
951‐268‐6268
Agenda Item No. 4 Attachment

Location: Date: 4/7/2015
N/S: Weather: Clear
E/W:
North Leg East Leg South Leg West LegFitzgerald Avenue Base Line Road Fitzgerald Avenue Base Line Road
0 0 0 0 0
0 0 0 0 0
0 0 0 0 0
0 0 0 0 0
0 0 0 0 0
0 0 0 0 0
0 0 0 0 00 0 0 0 0
0 0 0 0 0
North Leg East Leg South Leg West LegFitzgerald Avenue Base Line Road Fitzgerald Avenue Base Line Road
0 0 0 0 0
0 0 0 0 0
1 0 0 0 1
0 0 0 0 0
0 0 0 0 0
0 0 0 0 0
0 0 0 0 00 0 0 0 0
1 0 0 0 1TOTAL VOLUMES:
5:30 PM5:45 PM
TOTAL VOLUMES:
4:00 PM
4:15 PM
5:00 PM
5:15 PM
4:30 PM
4:45 PM
School Age Pedestrians
8:15 AM
8:30 AM8:45 AM
Rialto
Fitzgerald Avenue
Base Line Road
7:00 AM
7:15 AM
7:30 AM
7:45 AM
8:00 AM
Counts Unlimited, Inc.
PO Box 1178
Corona, CA 92878
951‐268‐6268
Agenda Item No. 4 Attachment

Location: Date: 4/7/2015
N/S: Weather: Clear
E/W:
North Leg East Leg South Leg West LegFitzgerald Avenue Base Line Road Fitzgerald Avenue Base Line Road
0 0 0 0 0
0 0 0 0 0
0 0 0 0 0
0 0 0 0 0
0 0 0 0 0
0 0 0 0 0
0 0 0 0 00 0 0 0 0
0 0 0 0 0
North Leg East Leg South Leg West LegFitzgerald Avenue Base Line Road Fitzgerald Avenue Base Line Road
0 0 0 0 0
0 0 0 0 0
0 0 0 0 0
1 0 0 0 1
0 0 0 0 0
1 0 0 0 1
0 0 0 0 00 0 0 0 0
2 0 0 0 2
5:00 PM
5:15 PM
5:30 PM5:45 PM
TOTAL VOLUMES:
8:45 AM
TOTAL VOLUMES:
4:00 PM
4:15 PM
4:30 PM
4:45 PM
7:15 AM
7:30 AM
7:45 AM
8:00 AM
8:15 AM
8:30 AM
Rialto
Fitzgerald Avenue
Base Line Road
Adult Pedestrians
7:00 AM
Counts Unlimited, Inc.
PO Box 1178
Corona, CA 92878
951‐268‐6268
Agenda Item No. 4 Attachment

Location: Date: 4/7/2015
N/S: Weather: Clear
E/W:
North Leg East Leg South Leg West LegFitzgerald Avenue Base Line Road Fitzgerald Avenue Base Line Road
0 0 0 0 0
0 0 0 0 0
0 0 0 0 0
0 0 0 0 0
0 0 0 0 0
0 0 0 0 0
0 0 0 0 00 0 0 0 0
0 0 0 0 0
North Leg East Leg South Leg West LegFitzgerald Avenue Base Line Road Fitzgerald Avenue Base Line Road
0 0 0 0 0
0 0 0 0 0
1 0 0 0 1
1 0 0 0 1
0 0 0 0 0
1 0 0 0 1
0 0 0 0 00 0 0 0 0
3 0 0 0 3
5:00 PM
5:15 PM
5:30 PM5:45 PM
TOTAL VOLUMES:
8:45 AM
TOTAL VOLUMES:
4:00 PM
4:15 PM
4:30 PM
4:45 PM
7:15 AM
7:30 AM
7:45 AM
8:00 AM
8:15 AM
8:30 AM
Rialto
Fitzgerald Avenue
Base Line Road
Total Pedestrians
7:00 AM
Counts Unlimited, Inc.
PO Box 1178
Corona, CA 92878
951‐268‐6268
Agenda Item No. 4 Attachment

Location: Date: 12/9/2014
N/S: Weather: Clear
E/W:
North Leg East Leg South Leg West LegLilac Avenue Merrill Avenue Lilac Avenue Merrill Avenue
School Age Children School Age Children School Age Children School Age Children TOTAL
0 1 0 0 1
0 2 4 0 6
0 12 2 0 14
0 6 2 0 8
0 0 0 0 0
0 0 0 0 0
1 0 0 0 10 0 0 0 0
1 21 8 0 30
North Leg East Leg South Leg West LegLilac Avenue Merrill Avenue Lilac Avenue Merrill Avenue
School Age Children School Age Children School Age Children School Age Children TOTAL
0 0 0 0 0
0 0 0 0 0
0 0 0 0 0
0 10 1 0 11
0 13 8 0 21
0 10 3 0 13
0 0 0 0 00 3 4 0 7
0 36 16 0 52
School Age Children
7:00 AM
7:45 AM
8:00 AM
8:15 AM
7:15 AM
1:15 PM
2:00 PM
Rialto
Lilac Avenue
Merrill Avenue
7:30 AM
8:30 AM8:45 AM
TOTAL VOLUMES:
1:00 PM
2:15 PM
2:30 PM
1:30 PM
1:45 PM
2:45 PM
TOTAL VOLUMES:
Counts Unlimited, Inc.
PO Box 1178
Corona, CA 92878
951‐268‐6268
Agenda Item No. 4 Attachment

Location: Date: 12/9/2014
N/S: Weather: Clear
E/W:
North Leg East Leg South Leg West LegLilac Avenue Merrill Avenue Lilac Avenue Merrill Avenue
Adults Adults Adults Adults TOTAL
0 1 0 0 1
0 2 2 0 4
0 6 2 0 8
0 5 1 0 6
0 4 3 0 7
1 0 0 0 1
2 0 0 1 33 0 0 0 3
6 18 8 1 33
North Leg East Leg South Leg West LegLilac Avenue Merrill Avenue Lilac Avenue Merrill Avenue
Adults Adults Adults Adults TOTAL
0 0 2 0 2
0 1 0 0 1
0 7 6 0 13
0 18 6 0 24
0 10 6 0 16
0 12 4 0 16
0 1 0 0 10 3 3 0 6
0 52 27 0 79
2:30 PM2:45 PM
TOTAL VOLUMES:
1:15 PM
1:30 PM
1:45 PM
2:00 PM
1:00 PM
Adults
2:15 PM
8:45 AM
Rialto
Lilac Avenue
Merrill Avenue
7:00 AM
7:15 AM
7:30 AM
7:45 AM
8:00 AM
8:15 AM
8:30 AM
TOTAL VOLUMES:
Counts Unlimited, Inc.
PO Box 1178
Corona, CA 92878
951‐268‐6268
Agenda Item No. 4 Attachment
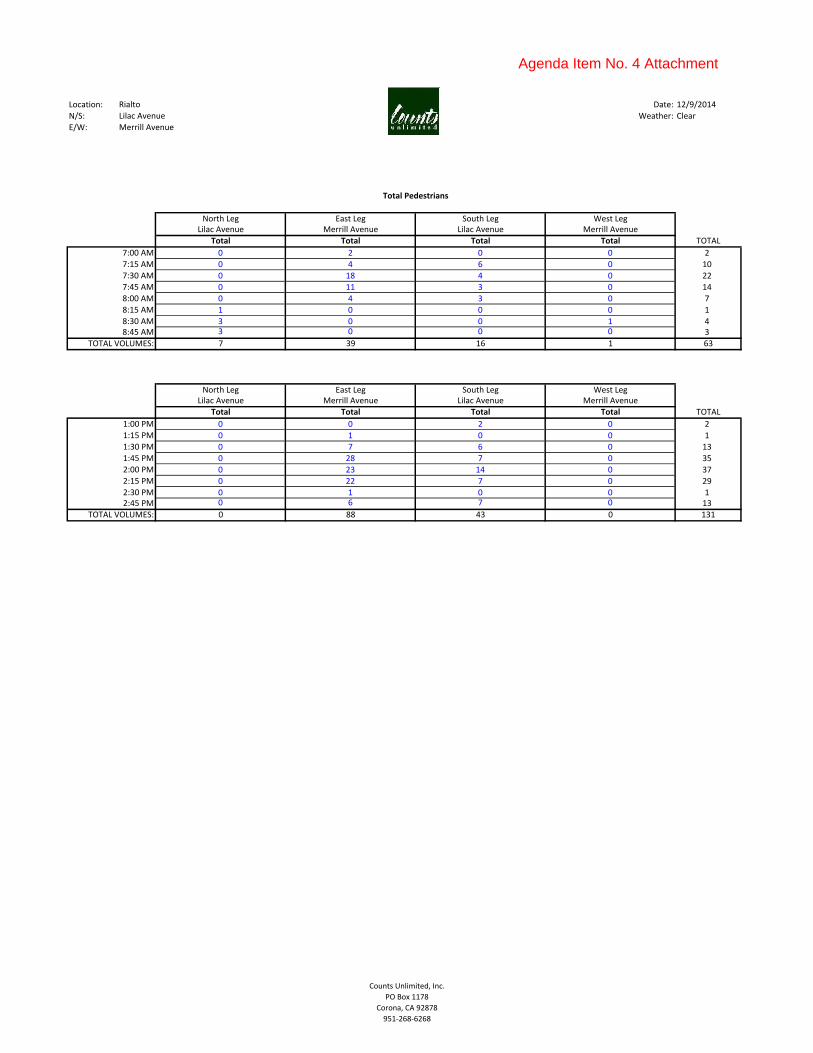
Location: Date: 12/9/2014
N/S: Weather: Clear
E/W:
North Leg East Leg South Leg West LegLilac Avenue Merrill Avenue Lilac Avenue Merrill Avenue
Total Total Total Total TOTAL
0 2 0 0 2
0 4 6 0 10
0 18 4 0 22
0 11 3 0 14
0 4 3 0 7
1 0 0 0 1
3 0 0 1 43 0 0 0 3
7 39 16 1 63
North Leg East Leg South Leg West LegLilac Avenue Merrill Avenue Lilac Avenue Merrill Avenue
Total Total Total Total TOTAL
0 0 2 0 2
0 1 0 0 1
0 7 6 0 13
0 28 7 0 35
0 23 14 0 37
0 22 7 0 29
0 1 0 0 10 6 7 0 13
0 88 43 0 131
2:00 PM
2:15 PM
2:30 PM2:45 PM
TOTAL VOLUMES:
8:45 AM
TOTAL VOLUMES:
1:00 PM
1:15 PM
1:30 PM
1:45 PM
7:15 AM
7:30 AM
7:45 AM
8:00 AM
8:15 AM
8:30 AM
Rialto
Lilac Avenue
Merrill Avenue
Total Pedestrians
7:00 AM
Counts Unlimited, Inc.
PO Box 1178
Corona, CA 92878
951‐268‐6268
Agenda Item No. 4 Attachment

Location: Date: 12/9/2014
N/S: Weather: Clear
E/W:
North Leg East Leg South Leg West LegMaple Avenue Merrill Avenue Maple Avenue Merrill Avenue
School Age Children School Age Children School Age Children School Age Children TOTAL
0 0 0 0 0
0 1 0 0 1
1 1 0 0 2
0 2 0 0 2
0 0 0 0 0
0 0 0 0 0
0 0 0 0 00 0 0 0 0
1 4 0 0 5
North Leg East Leg South Leg West LegMaple Avenue Merrill Avenue Maple Avenue Merrill Avenue
School Age Children School Age Children School Age Children School Age Children TOTAL
0 0 0 0 0
0 0 1 0 1
0 0 0 0 0
0 0 0 0 0
0 3 0 0 3
1 7 0 0 8
2 4 0 0 60 3 0 0 3
3 17 1 0 21
School Age Children
7:00 AM
7:45 AM
8:00 AM
8:15 AM
7:15 AM
1:15 PM
2:00 PM
Rialto
Maple Avenue
Merrill Avenue
7:30 AM
8:30 AM8:45 AM
TOTAL VOLUMES:
1:00 PM
2:15 PM
2:30 PM
1:30 PM
1:45 PM
2:45 PM
TOTAL VOLUMES:
Counts Unlimited, Inc.
PO Box 1178
Corona, CA 92878
951‐268‐6268
Agenda Item No. 4 Attachment

Location: Date: 12/9/2014
N/S: Weather: Clear
E/W:
North Leg East Leg South Leg West LegMaple Avenue Merrill Avenue Maple Avenue Merrill Avenue
Adults Adults Adults Adults TOTAL
1 0 0 0 1
2 3 0 0 5
1 1 0 0 2
4 5 0 0 9
2 1 0 0 3
1 0 0 0 1
0 0 0 0 01 0 0 0 1
12 10 0 0 22
North Leg East Leg South Leg West LegMaple Avenue Merrill Avenue Maple Avenue Merrill Avenue
Adults Adults Adults Adults TOTAL
0 0 0 0 0
0 1 0 0 1
1 2 1 0 4
1 0 2 0 3
1 1 0 0 2
2 3 0 0 5
2 1 0 0 31 4 0 0 5
8 12 3 0 23
2:30 PM2:45 PM
TOTAL VOLUMES:
1:15 PM
1:30 PM
1:45 PM
2:00 PM
1:00 PM
Adults
2:15 PM
8:45 AM
Rialto
Maple Avenue
Merrill Avenue
7:00 AM
7:15 AM
7:30 AM
7:45 AM
8:00 AM
8:15 AM
8:30 AM
TOTAL VOLUMES:
Counts Unlimited, Inc.
PO Box 1178
Corona, CA 92878
951‐268‐6268
Agenda Item No. 4 Attachment
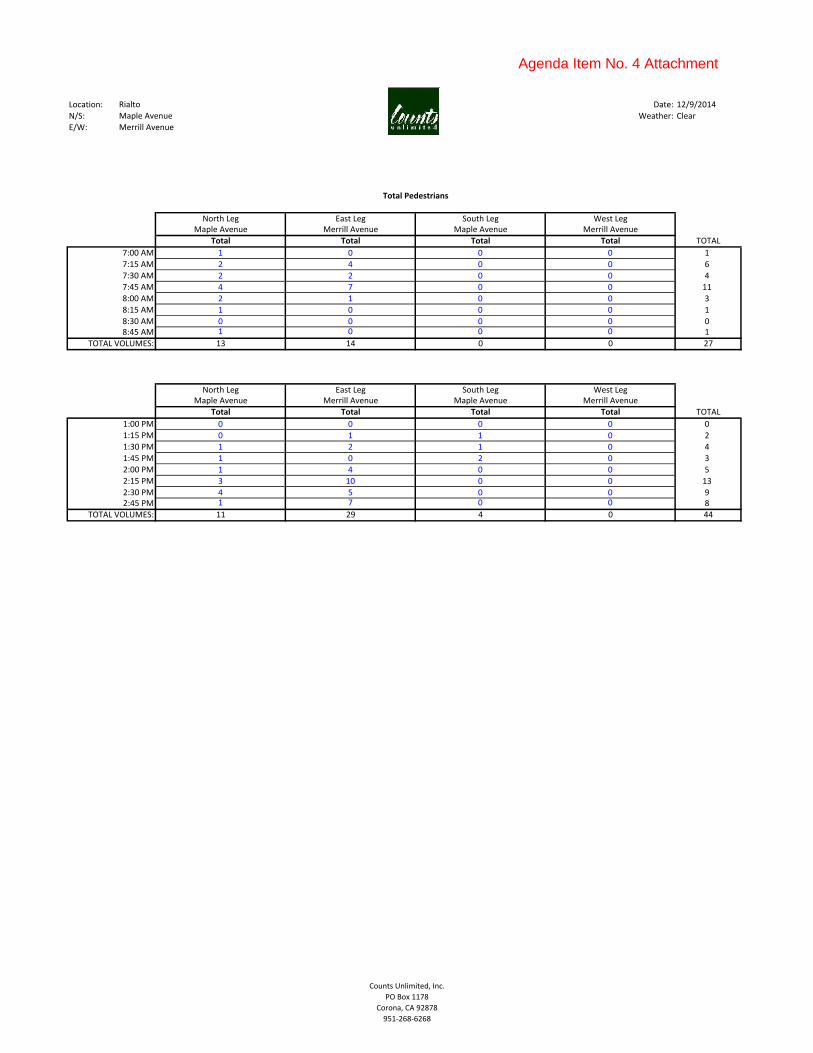
Location: Date: 12/9/2014
N/S: Weather: Clear
E/W:
North Leg East Leg South Leg West LegMaple Avenue Merrill Avenue Maple Avenue Merrill Avenue
Total Total Total Total TOTAL
1 0 0 0 1
2 4 0 0 6
2 2 0 0 4
4 7 0 0 11
2 1 0 0 3
1 0 0 0 1
0 0 0 0 01 0 0 0 1
13 14 0 0 27
North Leg East Leg South Leg West LegMaple Avenue Merrill Avenue Maple Avenue Merrill Avenue
Total Total Total Total TOTAL
0 0 0 0 0
0 1 1 0 2
1 2 1 0 4
1 0 2 0 3
1 4 0 0 5
3 10 0 0 13
4 5 0 0 91 7 0 0 8
11 29 4 0 44
2:00 PM
2:15 PM
2:30 PM2:45 PM
TOTAL VOLUMES:
8:45 AM
TOTAL VOLUMES:
1:00 PM
1:15 PM
1:30 PM
1:45 PM
7:15 AM
7:30 AM
7:45 AM
8:00 AM
8:15 AM
8:30 AM
Rialto
Maple Avenue
Merrill Avenue
Total Pedestrians
7:00 AM
Counts Unlimited, Inc.
PO Box 1178
Corona, CA 92878
951‐268‐6268
Agenda Item No. 4 Attachment

Location: Date: 12/9/2014
N/S: Weather: Clear
E/W:
North Leg East Leg South Leg West LegMaple Avenue Rialto Avenue Maple Avenue Rialto Avenue
School Age Children School Age Children School Age Children School Age Children TOTAL
0 0 0 0 0
3 0 0 1 4
1 0 8 3 12
0 0 1 0 1
0 0 0 0 0
0 0 1 0 1
0 0 0 0 00 0 0 0 0
4 0 10 4 18
North Leg East Leg South Leg West LegMaple Avenue Rialto Avenue Maple Avenue Rialto Avenue
School Age Children School Age Children School Age Children School Age Children TOTAL
0 0 0 0 0
0 0 0 0 0
0 0 0 0 0
0 0 3 0 3
0 0 2 2 4
0 4 2 0 6
0 0 0 1 12 0 0 0 2
2 4 7 3 16TOTAL VOLUMES:
Rialto
Maple Avenue
Rialto Avenue
7:30 AM
8:30 AM8:45 AM
TOTAL VOLUMES:
1:00 PM
2:15 PM
2:30 PM
1:30 PM
1:45 PM
2:45 PM
School Age Children
7:00 AM
7:45 AM
8:00 AM
8:15 AM
7:15 AM
1:15 PM
2:00 PM
Counts Unlimited, Inc.
PO Box 1178
Corona, CA 92878
951‐268‐6268
Agenda Item No. 4 Attachment

Location: Date: 12/9/2014
N/S: Weather: Clear
E/W:
North Leg East Leg South Leg West LegMaple Avenue Rialto Avenue Maple Avenue Rialto Avenue
Adults Adults Adults Adults TOTAL
0 0 1 2 3
1 0 0 0 1
1 0 4 3 8
0 0 1 1 2
1 0 3 1 5
1 0 1 1 3
0 0 0 0 01 0 0 0 1
5 0 10 8 23
North Leg East Leg South Leg West LegMaple Avenue Rialto Avenue Maple Avenue Rialto Avenue
Adults Adults Adults Adults TOTAL
0 0 1 0 1
1 0 0 0 1
1 0 2 2 5
0 0 0 0 0
1 0 4 4 9
2 0 0 0 2
2 0 3 6 112 0 2 0 4
9 0 12 12 33
1:00 PM
Adults
2:15 PM
8:45 AM
Rialto
Maple Avenue
Rialto Avenue
7:00 AM
7:15 AM
7:30 AM
7:45 AM
8:00 AM
8:15 AM
8:30 AM
TOTAL VOLUMES:
2:30 PM2:45 PM
TOTAL VOLUMES:
1:15 PM
1:30 PM
1:45 PM
2:00 PM
Counts Unlimited, Inc.
PO Box 1178
Corona, CA 92878
951‐268‐6268
Agenda Item No. 4 Attachment

Location: Date: 12/9/2014
N/S: Weather: Clear
E/W:
North Leg East Leg South Leg West LegMaple Avenue Rialto Avenue Maple Avenue Rialto Avenue
Total Total Total Total TOTAL
0 0 1 2 3
4 0 0 1 5
2 0 12 6 20
0 0 2 1 3
1 0 3 1 5
1 0 2 1 4
0 0 0 0 01 0 0 0 1
9 0 20 12 41
North Leg East Leg South Leg West LegMaple Avenue Rialto Avenue Maple Avenue Rialto Avenue
Total Total Total Total TOTAL
0 0 1 0 1
1 0 0 0 1
1 0 2 2 5
0 0 3 0 3
1 0 6 6 13
2 4 2 0 8
2 0 3 7 124 0 2 0 6
11 4 19 15 49
Total Pedestrians
7:00 AM
8:30 AM
Rialto
Maple Avenue
Rialto Avenue
7:15 AM
7:30 AM
7:45 AM
8:00 AM
8:15 AM
8:45 AM
TOTAL VOLUMES:
1:00 PM
1:15 PM
1:30 PM
1:45 PM
2:00 PM
2:15 PM
2:30 PM2:45 PM
TOTAL VOLUMES:
Counts Unlimited, Inc.
PO Box 1178
Corona, CA 92878
951‐268‐6268
Agenda Item No. 4 Attachment

Location: Date: 12/9/2014
N/S: Weather: Clear
E/W:
North Leg East Leg South Leg West LegPepper Avenue Etiwanda Avenue Pepper Avenue Etiwanda Avenue
School Age Children School Age Children School Age Children School Age Children TOTAL
0 1 0 1 2
3 3 0 0 6
1 0 0 1 2
2 1 1 0 4
0 1 0 0 1
0 1 0 0 1
0 1 0 0 10 0 0 0 0
6 8 1 2 17
North Leg East Leg South Leg West LegPepper Avenue Etiwanda Avenue Pepper Avenue Etiwanda Avenue
School Age Children School Age Children School Age Children School Age Children TOTAL
0 1 0 1 2
1 0 0 0 1
1 0 0 1 2
0 0 0 1 1
3 3 1 0 7
8 0 0 0 8
2 0 1 0 32 0 0 1 3
17 4 2 4 27
School Age Children
7:00 AM
7:45 AM
8:00 AM
8:15 AM
7:15 AM
1:15 PM
2:00 PM
Rialto
Pepper Avenue
Etiwanda Avenue
7:30 AM
8:30 AM8:45 AM
TOTAL VOLUMES:
1:00 PM
2:15 PM
2:30 PM
1:30 PM
1:45 PM
2:45 PM
TOTAL VOLUMES:
Counts Unlimited, Inc.
PO Box 1178
Corona, CA 92878
951‐268‐6268
Agenda Item No. 4 Attachment
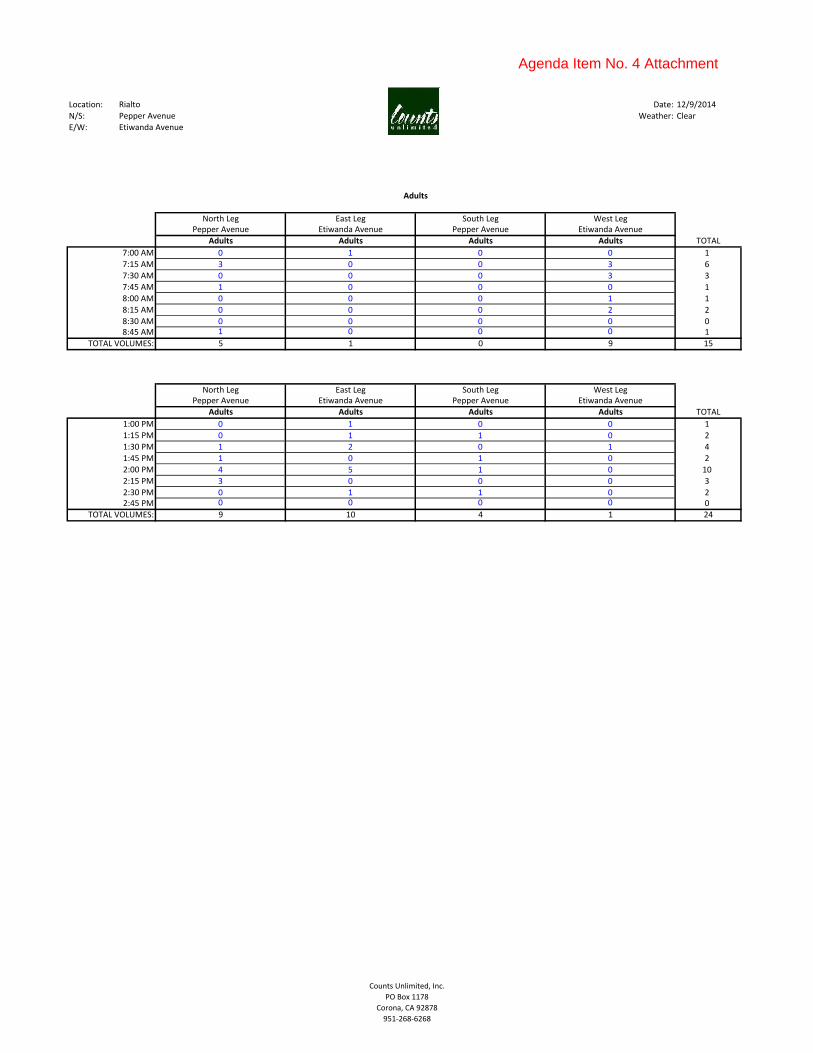
Location: Date: 12/9/2014
N/S: Weather: Clear
E/W:
North Leg East Leg South Leg West LegPepper Avenue Etiwanda Avenue Pepper Avenue Etiwanda Avenue
Adults Adults Adults Adults TOTAL
0 1 0 0 1
3 0 0 3 6
0 0 0 3 3
1 0 0 0 1
0 0 0 1 1
0 0 0 2 2
0 0 0 0 01 0 0 0 1
5 1 0 9 15
North Leg East Leg South Leg West LegPepper Avenue Etiwanda Avenue Pepper Avenue Etiwanda Avenue
Adults Adults Adults Adults TOTAL
0 1 0 0 1
0 1 1 0 2
1 2 0 1 4
1 0 1 0 2
4 5 1 0 10
3 0 0 0 3
0 1 1 0 20 0 0 0 0
9 10 4 1 24
2:30 PM2:45 PM
TOTAL VOLUMES:
1:15 PM
1:30 PM
1:45 PM
2:00 PM
1:00 PM
Adults
2:15 PM
8:45 AM
Rialto
Pepper Avenue
Etiwanda Avenue
7:00 AM
7:15 AM
7:30 AM
7:45 AM
8:00 AM
8:15 AM
8:30 AM
TOTAL VOLUMES:
Counts Unlimited, Inc.
PO Box 1178
Corona, CA 92878
951‐268‐6268
Agenda Item No. 4 Attachment
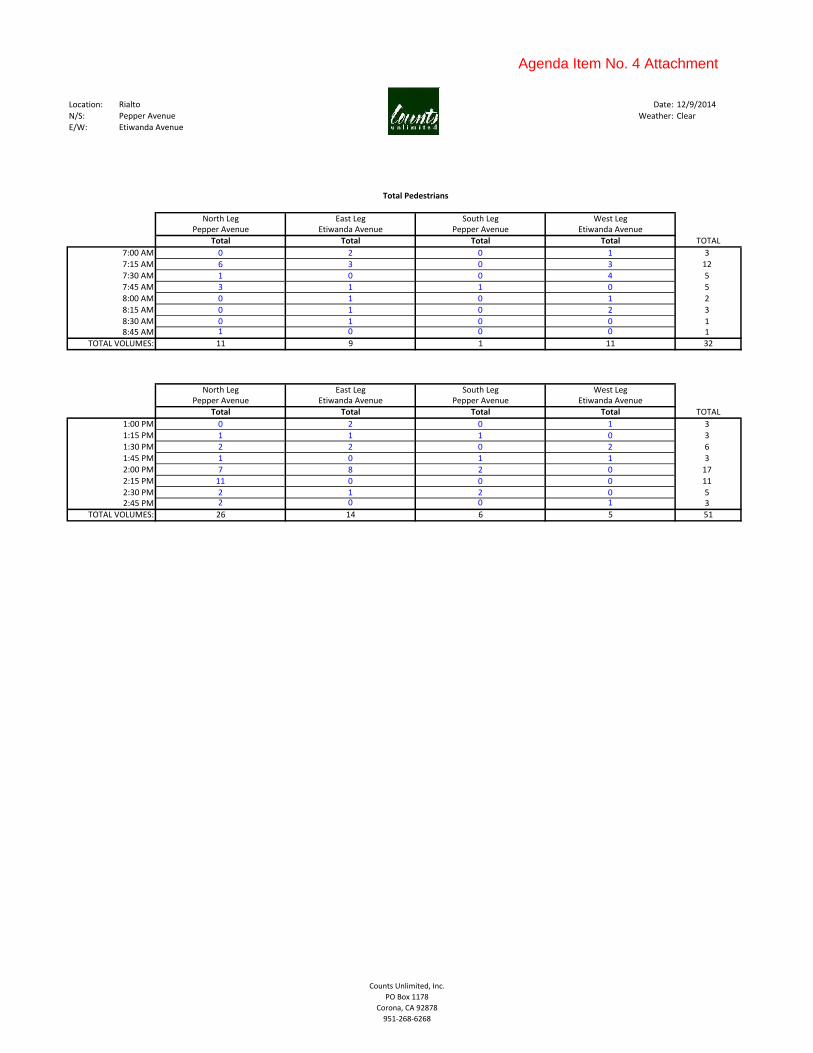
Location: Date: 12/9/2014
N/S: Weather: Clear
E/W:
North Leg East Leg South Leg West LegPepper Avenue Etiwanda Avenue Pepper Avenue Etiwanda Avenue
Total Total Total Total TOTAL
0 2 0 1 3
6 3 0 3 12
1 0 0 4 5
3 1 1 0 5
0 1 0 1 2
0 1 0 2 3
0 1 0 0 11 0 0 0 1
11 9 1 11 32
North Leg East Leg South Leg West LegPepper Avenue Etiwanda Avenue Pepper Avenue Etiwanda Avenue
Total Total Total Total TOTAL
0 2 0 1 3
1 1 1 0 3
2 2 0 2 6
1 0 1 1 3
7 8 2 0 17
11 0 0 0 11
2 1 2 0 52 0 0 1 3
26 14 6 5 51
2:00 PM
2:15 PM
2:30 PM2:45 PM
TOTAL VOLUMES:
8:45 AM
TOTAL VOLUMES:
1:00 PM
1:15 PM
1:30 PM
1:45 PM
7:15 AM
7:30 AM
7:45 AM
8:00 AM
8:15 AM
8:30 AM
Rialto
Pepper Avenue
Etiwanda Avenue
Total Pedestrians
7:00 AM
Counts Unlimited, Inc.
PO Box 1178
Corona, CA 92878
951‐268‐6268
Agenda Item No. 4 Attachment
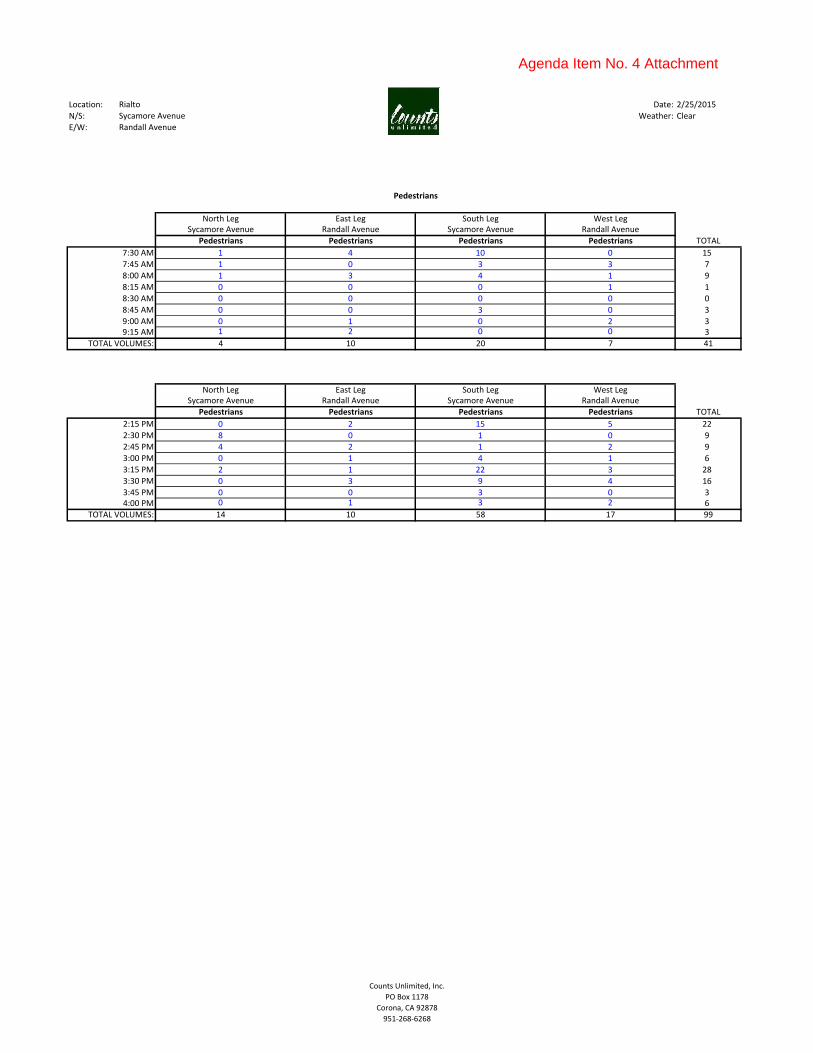
Location: Date: 2/25/2015
N/S: Weather: Clear
E/W:
North Leg East Leg South Leg West LegSycamore Avenue Randall Avenue Sycamore Avenue Randall Avenue
Pedestrians Pedestrians Pedestrians Pedestrians TOTAL
1 4 10 0 15
1 0 3 3 7
1 3 4 1 9
0 0 0 1 1
0 0 0 0 0
0 0 3 0 3
0 1 0 2 31 2 0 0 3
4 10 20 7 41
North Leg East Leg South Leg West LegSycamore Avenue Randall Avenue Sycamore Avenue Randall Avenue
Pedestrians Pedestrians Pedestrians Pedestrians TOTAL
0 2 15 5 22
8 0 1 0 9
4 2 1 2 9
0 1 4 1 6
2 1 22 3 28
0 3 9 4 16
0 0 3 0 30 1 3 2 6
14 10 58 17 99
2:30 PM
2:45 PM
3:00 PM
3:15 PM
Pedestrians
7:30 AM
8:15 AM
7:45 AM
Rialto
Sycamore Avenue
Randall Avenue
8:00 AM
TOTAL VOLUMES:
8:30 AM
8:45 AM
9:00 AM9:15 AM
3:45 PM4:00 PM
3:30 PM
TOTAL VOLUMES:
2:15 PM
Counts Unlimited, Inc.
PO Box 1178
Corona, CA 92878
951‐268‐6268
Agenda Item No. 4 Attachment

Location: Date: 1/21/2015
N/S: Weather: Clear
E/W:
North Leg East Leg South Leg West LegTamarind Avenue Base Line Road Tamarind Avenue Base Line Road
School Age Peds School Age Peds School Age Peds School Age Peds TOTAL
0 0 0 0 0
0 0 0 1 1
0 1 0 0 1
0 0 0 0 0
0 0 0 0 0
0 0 0 0 0
0 0 0 0 00 0 0 0 0
0 1 0 1 2
North Leg East Leg South Leg West LegTamarind Avenue Base Line Road Tamarind Avenue Base Line Road
School Age Peds School Age Peds School Age Peds School Age Peds TOTAL
0 0 0 0 0
0 0 0 0 0
0 0 0 0 0
0 0 0 0 0
0 0 0 0 0
0 0 0 0 0
0 0 0 0 00 0 1 0 1
0 0 1 0 1TOTAL VOLUMES:
8:30 AM8:45 AM
5:30 PM5:45 PM
4:15 PM
TOTAL VOLUMES:
4:00 PM
Rialto
Tamarind Avenue
Base Line Road
7:30 AM
4:30 PM
4:45 PM
5:00 PM
5:15 PM
School Age Peds
7:00 AM
7:45 AM
8:00 AM
8:15 AM
7:15 AM
Counts Unlimited, Inc.
PO Box 1178
Corona, CA 92878
951‐268‐6268
Agenda Item No. 4 Attachment

Location: Date: 1/21/2015
N/S: Weather: Clear
E/W:
North Leg East Leg South Leg West LegTamarind Avenue Base Line Road Tamarind Avenue Base Line Road
Non‐School Age Peds Non‐School Age Peds Non‐School Age Peds Non‐School Age Peds TOTAL
0 0 1 0 1
0 0 0 0 0
0 0 1 0 1
0 0 1 0 1
0 0 0 0 0
0 0 0 0 0
0 0 0 0 00 0 0 0 0
0 0 3 0 3
North Leg East Leg South Leg West LegTamarind Avenue Base Line Road Tamarind Avenue Base Line Road
Non‐School Age Peds Non‐School Age Peds Non‐School Age Peds Non‐School Age Peds TOTAL
0 1 0 0 1
0 0 0 1 1
0 0 0 0 0
0 0 0 0 0
0 0 0 0 0
0 0 0 0 0
0 0 0 0 00 0 0 0 0
0 1 0 1 2
4:00 PM
Non‐School Age Peds
8:45 AM
7:15 AM
7:30 AM
7:45 AM
8:00 AM
8:15 AM
8:30 AM
TOTAL VOLUMES:
Rialto
Tamarind Avenue
Base Line Road
7:00 AM
TOTAL VOLUMES:
4:15 PM
5:30 PM5:45 PM
4:30 PM
4:45 PM
5:00 PM
5:15 PM
Counts Unlimited, Inc.
PO Box 1178
Corona, CA 92878
951‐268‐6268
Agenda Item No. 4 Attachment
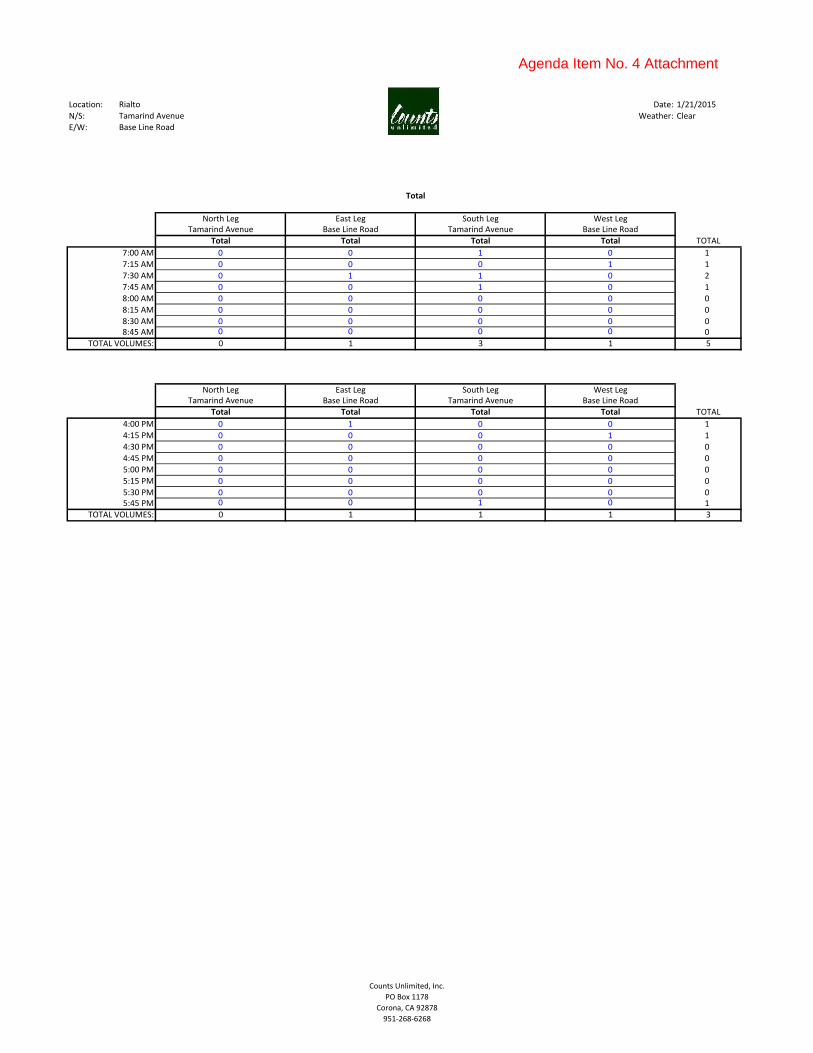
Location: Date: 1/21/2015
N/S: Weather: Clear
E/W:
North Leg East Leg South Leg West LegTamarind Avenue Base Line Road Tamarind Avenue Base Line Road
Total Total Total Total TOTAL
0 0 1 0 1
0 0 0 1 1
0 1 1 0 2
0 0 1 0 1
0 0 0 0 0
0 0 0 0 0
0 0 0 0 00 0 0 0 0
0 1 3 1 5
North Leg East Leg South Leg West LegTamarind Avenue Base Line Road Tamarind Avenue Base Line Road
Total Total Total Total TOTAL
0 1 0 0 1
0 0 0 1 1
0 0 0 0 0
0 0 0 0 0
0 0 0 0 0
0 0 0 0 0
0 0 0 0 00 0 1 0 1
0 1 1 1 3
Total
7:00 AM
8:30 AM
Rialto
Tamarind Avenue
Base Line Road
7:15 AM
7:30 AM
7:45 AM
8:00 AM
8:15 AM
8:45 AM
TOTAL VOLUMES:
4:00 PM
4:15 PM
5:30 PM5:45 PM
4:30 PM
4:45 PM
5:00 PM
5:15 PM
TOTAL VOLUMES:
Counts Unlimited, Inc.
PO Box 1178
Corona, CA 92878
951‐268‐6268
Agenda Item No. 4 Attachment

Traffic Signal Prioritization Analysis City of Rialto
APPENDIX C
Pedestrian Gap Counts
Agenda Item No. 4 Attachment

File Name : RLT_Cedar_Hawthorne_AMSite Code : 00714517Start Date : 12/9/2014Page No : 1
City of RialtoN/S: Cedar AvenueE/W: Hawthorne AvenueWeather: Clear
Directions Printed: Northbound
Start Time Volume 2 - 3 4 - 5 6 - 7 8 - 9 10 - 11 12 - 13 14 - 15 16 - 17 18 - 19 20 - 21 22 - 23 24 - 25 26 - 27 28 - 29 >29Int.
Total Average
07:00 AM 139 13 2 2 0 0 2 1 1 1 1 2 0 1 0 10 36 12 - 1307:15 AM 183 23 6 4 2 0 3 3 5 0 2 1 0 0 2 5 56 4 - 507:30 AM 167 23 12 3 2 3 1 2 1 0 1 1 0 0 0 9 58 4 - 507:45 AM 154 29 6 2 2 0 0 1 1 3 0 1 1 0 1 8 55 2 - 3
Total 643 88 26 11 6 3 6 7 8 4 4 5 1 1 3 32 205 4 - 5
08:00 AM 139 26 5 2 7 0 0 1 0 1 1 0 2 0 0 10 55 4 - 508:15 AM 140 17 8 5 1 0 1 3 0 1 1 1 1 2 0 9 50 6 - 708:30 AM 143 18 10 7 4 0 2 4 0 2 1 0 0 0 1 7 56 6 - 708:45 AM 147 20 9 6 3 6 1 2 0 0 2 2 0 1 1 8 61 6 - 7
Total 569 81 32 20 15 6 4 10 0 4 5 3 3 3 2 34 222 4 - 5
Grand Total 1212 169 58 31 21 9 10 17 8 8 9 8 4 4 5 66 427 4 - 5Total % 39.6 13.6 7.3 4.9 2.1 2.3 4.0 1.9 1.9 2.1 1.9 0.9 0.9 1.2 15.5
Peak Hour Analysis From 07:00 AM to 08:45 AM - Peak 1 of 1Peak Occurred: 07:00 AM
Volume 643High Int. 07:15 AMVolume 183
PHF 0.878
Counts Unlimited, Inc.PO Box 1178
Corona, CA 92878(951) 268-6268
Agenda Item No. 4 Attachment

File Name : RLT_Cedar_Hawthorne_AMSite Code : 00714517Start Date : 12/9/2014Page No : 1
City of RialtoN/S: Cedar AvenueE/W: Hawthorne AvenueWeather: Clear
Directions Printed: Southbound
Start Time Volume 2 - 3 4 - 5 6 - 7 8 - 9 10 - 11 12 - 13 14 - 15 16 - 17 18 - 19 20 - 21 22 - 23 24 - 25 26 - 27 28 - 29 >29Int.
Total Average
07:00 AM 240 25 12 13 8 3 2 0 2 1 1 1 0 0 1 4 73 4 - 507:15 AM 253 25 9 8 5 1 6 0 1 1 1 0 0 0 0 7 64 4 - 507:30 AM 236 26 8 4 4 6 1 3 1 2 1 1 3 0 2 4 66 4 - 507:45 AM 188 25 13 6 7 3 4 2 0 1 1 1 0 0 1 6 70 4 - 5
Total 917 101 42 31 24 13 13 5 4 5 4 3 3 0 4 21 273 4 - 5
08:00 AM 233 33 11 7 11 1 2 0 0 2 0 0 1 1 0 6 75 4 - 508:15 AM 181 24 12 7 6 3 3 2 1 0 2 1 1 1 2 5 70 4 - 508:30 AM 132 18 11 8 5 3 3 0 1 0 0 4 1 1 1 7 63 6 - 708:45 AM 177 25 12 6 4 5 4 0 0 0 1 0 0 1 0 8 66 4 - 5
Total 723 100 46 28 26 12 12 2 2 2 3 5 3 4 3 26 274 4 - 5
Grand Total 1640 201 88 59 50 25 25 7 6 7 7 8 6 4 7 47 547 4 - 5Total % 36.7 16.1 10.8 9.1 4.6 4.6 1.3 1.1 1.3 1.3 1.5 1.1 0.7 1.3 8.6
Peak Hour Analysis From 07:00 AM to 08:45 AM - Peak 1 of 1Peak Occurred: 07:00 AM
Volume 917High Int. 07:15 AMVolume 253
PHF 0.906
Counts Unlimited, Inc.PO Box 1178
Corona, CA 92878(951) 268-6268
Agenda Item No. 4 Attachment

File Name : RLT_Cedar_Hawthorne_AMSite Code : 00714517Start Date : 12/9/2014Page No : 1
City of RialtoN/S: Cedar AvenueE/W: Hawthorne AvenueWeather: Clear
Directions Printed: Combined
Start Time Volume 2 - 3 4 - 5 6 - 7 8 - 9 10 - 11 12 - 13 14 - 15 16 - 17 18 - 19 20 - 21 22 - 23 24 - 25 26 - 27 28 - 29 >29Int.
Total Average
07:00 AM 379 31 12 8 7 4 3 2 2 1 1 1 0 0 0 0 72 4 - 507:15 AM 436 42 10 11 5 2 5 2 0 0 1 0 0 1 0 1 80 2 - 307:30 AM 403 51 21 7 4 5 1 3 1 1 0 0 0 0 1 0 95 2 - 307:45 AM 342 43 17 5 5 6 5 0 0 1 2 0 1 0 0 0 85 2 - 3
Total 1560 167 60 31 21 17 14 7 3 3 4 1 1 1 1 1 332 2 - 3
08:00 AM 372 40 13 6 10 2 2 2 0 2 0 0 2 1 1 1 82 4 - 508:15 AM 321 43 16 10 8 1 2 1 1 1 1 3 1 0 0 2 90 4 - 508:30 AM 275 38 18 17 8 3 1 3 2 0 0 0 1 1 0 2 94 4 - 508:45 AM 324 46 11 11 6 4 2 3 1 0 2 0 2 1 0 1 90 2 - 3
Total 1292 167 58 44 32 10 7 9 4 3 3 3 6 3 1 6 356 4 - 5
Grand Total 2852 334 118 75 53 27 21 16 7 6 7 4 7 4 2 7 688 4 - 5Total % 48.5 17.2 10.9 7.7 3.9 3.1 2.3 1.0 0.9 1.0 0.6 1.0 0.6 0.3 1.0
Peak Hour Analysis From 07:00 AM to 08:45 AM - Peak 1 of 1Peak Occurred: 07:00 AM
Volume 1560High Int. 07:15 AMVolume 436
PHF 0.894
Counts Unlimited, Inc.PO Box 1178
Corona, CA 92878(951) 268-6268
Agenda Item No. 4 Attachment
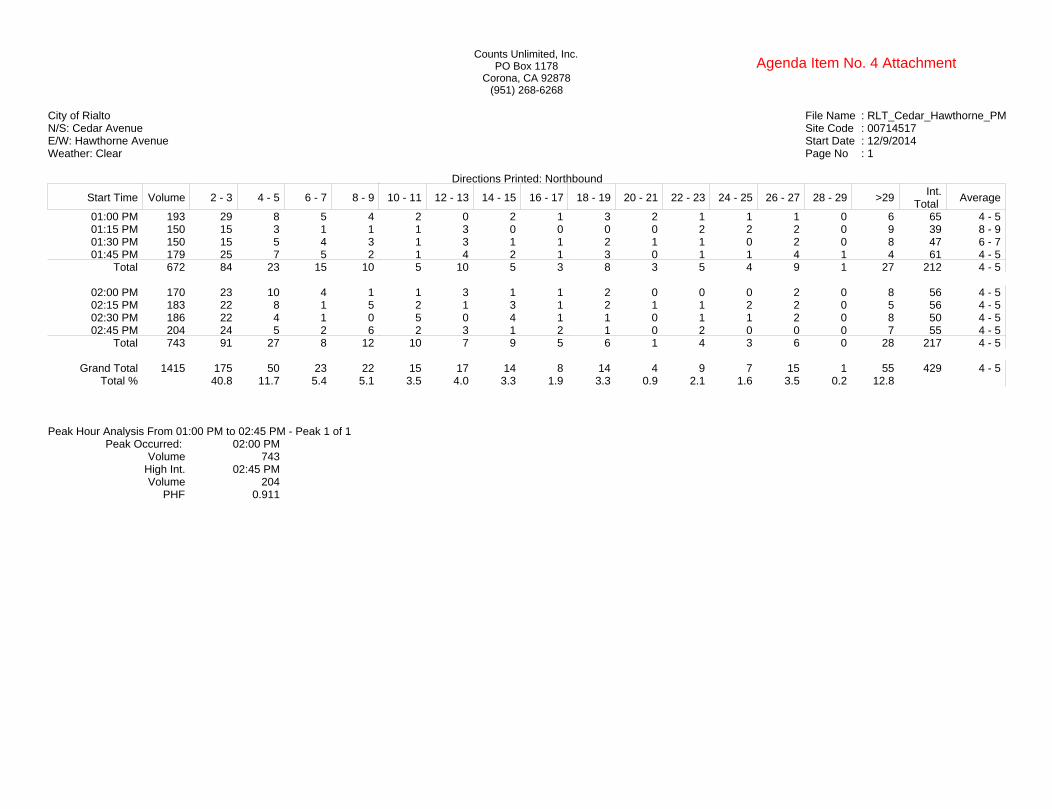
File Name : RLT_Cedar_Hawthorne_PMSite Code : 00714517Start Date : 12/9/2014Page No : 1
City of RialtoN/S: Cedar AvenueE/W: Hawthorne AvenueWeather: Clear
Directions Printed: Northbound
Start Time Volume 2 - 3 4 - 5 6 - 7 8 - 9 10 - 11 12 - 13 14 - 15 16 - 17 18 - 19 20 - 21 22 - 23 24 - 25 26 - 27 28 - 29 >29Int.
Total Average
01:00 PM 193 29 8 5 4 2 0 2 1 3 2 1 1 1 0 6 65 4 - 501:15 PM 150 15 3 1 1 1 3 0 0 0 0 2 2 2 0 9 39 8 - 901:30 PM 150 15 5 4 3 1 3 1 1 2 1 1 0 2 0 8 47 6 - 701:45 PM 179 25 7 5 2 1 4 2 1 3 0 1 1 4 1 4 61 4 - 5
Total 672 84 23 15 10 5 10 5 3 8 3 5 4 9 1 27 212 4 - 5
02:00 PM 170 23 10 4 1 1 3 1 1 2 0 0 0 2 0 8 56 4 - 502:15 PM 183 22 8 1 5 2 1 3 1 2 1 1 2 2 0 5 56 4 - 502:30 PM 186 22 4 1 0 5 0 4 1 1 0 1 1 2 0 8 50 4 - 502:45 PM 204 24 5 2 6 2 3 1 2 1 0 2 0 0 0 7 55 4 - 5
Total 743 91 27 8 12 10 7 9 5 6 1 4 3 6 0 28 217 4 - 5
Grand Total 1415 175 50 23 22 15 17 14 8 14 4 9 7 15 1 55 429 4 - 5Total % 40.8 11.7 5.4 5.1 3.5 4.0 3.3 1.9 3.3 0.9 2.1 1.6 3.5 0.2 12.8
Peak Hour Analysis From 01:00 PM to 02:45 PM - Peak 1 of 1Peak Occurred: 02:00 PM
Volume 743High Int. 02:45 PMVolume 204
PHF 0.911
Counts Unlimited, Inc.PO Box 1178
Corona, CA 92878(951) 268-6268
Agenda Item No. 4 Attachment

File Name : RLT_Cedar_Hawthorne_PMSite Code : 00714517Start Date : 12/9/2014Page No : 1
City of RialtoN/S: Cedar AvenueE/W: Hawthorne AvenueWeather: Clear
Directions Printed: Southbound
Start Time Volume 2 - 3 4 - 5 6 - 7 8 - 9 10 - 11 12 - 13 14 - 15 16 - 17 18 - 19 20 - 21 22 - 23 24 - 25 26 - 27 28 - 29 >29Int.
Total Average
01:00 PM 155 17 5 4 4 1 3 1 2 1 3 3 2 0 2 5 53 8 - 901:15 PM 199 21 13 4 1 3 0 2 1 0 1 2 3 0 0 8 59 4 - 501:30 PM 151 26 9 3 2 2 4 2 1 4 1 1 2 2 1 4 64 4 - 501:45 PM 162 18 9 4 6 0 0 3 2 2 0 1 1 1 0 8 55 6 - 7
Total 667 82 36 15 13 6 7 8 6 7 5 7 8 3 3 25 231 4 - 5
02:00 PM 18 26 16 2 3 2 1 2 3 4 3 1 3 1 2 2 71 4 - 502:15 PM 184 27 10 1 4 0 2 0 3 1 1 1 2 0 2 6 60 4 - 502:30 PM 232 26 10 3 2 2 3 4 3 0 3 2 2 0 0 4 64 4 - 502:45 PM 157 24 14 7 7 2 2 2 0 0 2 0 0 1 1 7 69 4 - 5
Total 591 103 50 13 16 6 8 8 9 5 9 4 7 2 5 19 264 4 - 5
Grand Total 1258 185 86 28 29 12 15 16 15 12 14 11 15 5 8 44 495 4 - 5Total % 37.4 17.4 5.7 5.9 2.4 3.0 3.2 3.0 2.4 2.8 2.2 3.0 1.0 1.6 8.9
Peak Hour Analysis From 01:00 PM to 02:45 PM - Peak 1 of 1Peak Occurred: 01:00 PM
Volume 667High Int. 01:15 PMVolume 199
PHF 0.838
Counts Unlimited, Inc.PO Box 1178
Corona, CA 92878(951) 268-6268
Agenda Item No. 4 Attachment

File Name : RLT_Cedar_Hawthorne_PMSite Code : 00714517Start Date : 12/9/2014Page No : 1
City of RialtoN/S: Cedar AvenueE/W: Hawthorne AvenueWeather: Clear
Directions Printed: Combined
Start Time Volume 2 - 3 4 - 5 6 - 7 8 - 9 10 - 11 12 - 13 14 - 15 16 - 17 18 - 19 20 - 21 22 - 23 24 - 25 26 - 27 28 - 29 >29Int.
Total Average
01:00 PM 348 42 9 7 3 2 0 0 2 3 2 1 1 0 2 1 75 2 - 301:15 PM 349 34 15 4 3 3 1 2 1 0 0 2 2 1 0 2 70 4 - 501:30 PM 301 36 13 5 6 2 1 3 1 2 3 1 1 0 0 2 76 4 - 501:45 PM 341 33 15 5 6 2 5 2 2 3 0 1 0 2 0 0 76 4 - 5
Total 1339 145 52 21 18 9 7 7 6 8 5 5 4 3 2 5 297 4 - 5
02:00 PM 350 42 14 4 5 5 4 4 3 1 1 0 0 1 0 0 84 4 - 502:15 PM 367 44 12 3 6 2 2 2 3 0 1 2 1 0 0 0 78 2 - 302:30 PM 418 33 15 5 2 2 3 3 2 1 0 0 1 0 0 0 67 4 - 502:45 PM 361 33 20 7 6 1 4 1 1 2 0 0 0 1 0 1 77 4 - 5
Total 1496 152 61 19 19 10 13 10 9 4 2 2 2 2 0 1 306 4 - 5
Grand Total 2835 297 113 40 37 19 20 17 15 12 7 7 6 5 2 6 603 4 - 5Total % 49.3 18.7 6.6 6.1 3.2 3.3 2.8 2.5 2.0 1.2 1.2 1.0 0.8 0.3 1.0
Peak Hour Analysis From 01:00 PM to 02:45 PM - Peak 1 of 1Peak Occurred: 02:00 PM
Volume 1496High Int. 02:30 PMVolume 418
PHF 0.895
Counts Unlimited, Inc.PO Box 1178
Corona, CA 92878(951) 268-6268
Agenda Item No. 4 Attachment
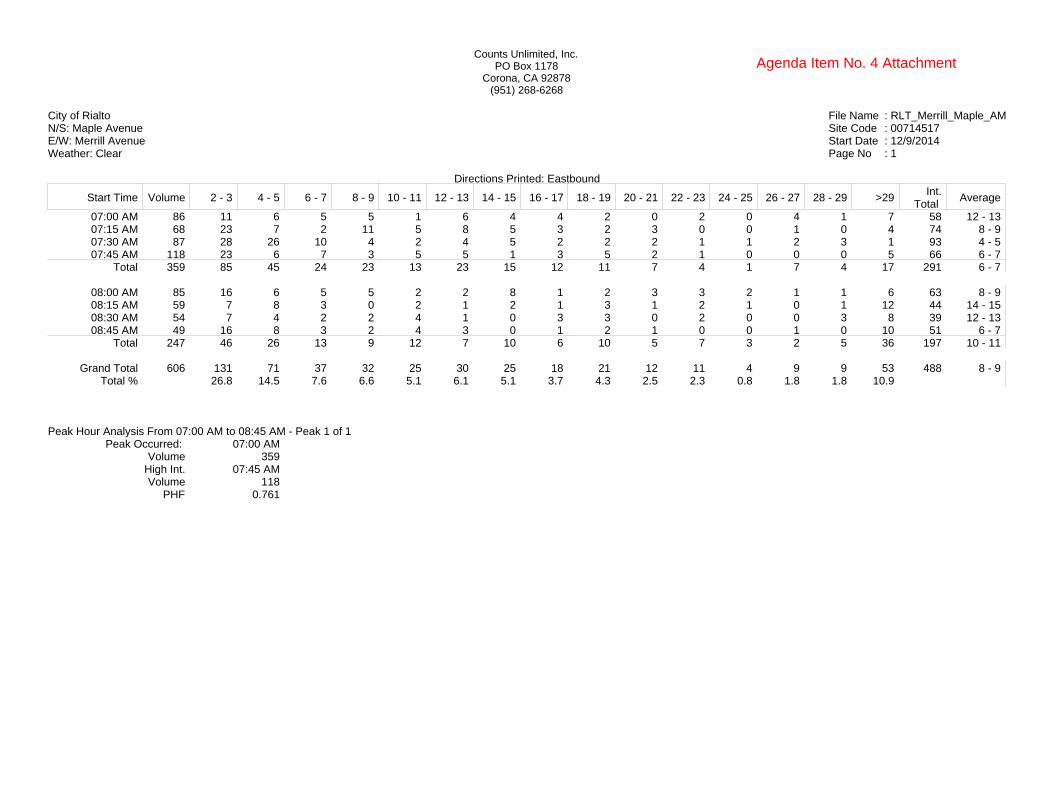
File Name : RLT_Merrill_Maple_AMSite Code : 00714517Start Date : 12/9/2014Page No : 1
City of RialtoN/S: Maple AvenueE/W: Merrill AvenueWeather: Clear
Directions Printed: Eastbound
Start Time Volume 2 - 3 4 - 5 6 - 7 8 - 9 10 - 11 12 - 13 14 - 15 16 - 17 18 - 19 20 - 21 22 - 23 24 - 25 26 - 27 28 - 29 >29Int.
Total Average
07:00 AM 86 11 6 5 5 1 6 4 4 2 0 2 0 4 1 7 58 12 - 1307:15 AM 68 23 7 2 11 5 8 5 3 2 3 0 0 1 0 4 74 8 - 907:30 AM 87 28 26 10 4 2 4 5 2 2 2 1 1 2 3 1 93 4 - 507:45 AM 118 23 6 7 3 5 5 1 3 5 2 1 0 0 0 5 66 6 - 7
Total 359 85 45 24 23 13 23 15 12 11 7 4 1 7 4 17 291 6 - 7
08:00 AM 85 16 6 5 5 2 2 8 1 2 3 3 2 1 1 6 63 8 - 908:15 AM 59 7 8 3 0 2 1 2 1 3 1 2 1 0 1 12 44 14 - 1508:30 AM 54 7 4 2 2 4 1 0 3 3 0 2 0 0 3 8 39 12 - 1308:45 AM 49 16 8 3 2 4 3 0 1 2 1 0 0 1 0 10 51 6 - 7
Total 247 46 26 13 9 12 7 10 6 10 5 7 3 2 5 36 197 10 - 11
Grand Total 606 131 71 37 32 25 30 25 18 21 12 11 4 9 9 53 488 8 - 9Total % 26.8 14.5 7.6 6.6 5.1 6.1 5.1 3.7 4.3 2.5 2.3 0.8 1.8 1.8 10.9
Peak Hour Analysis From 07:00 AM to 08:45 AM - Peak 1 of 1Peak Occurred: 07:00 AM
Volume 359High Int. 07:45 AMVolume 118
PHF 0.761
Counts Unlimited, Inc.PO Box 1178
Corona, CA 92878(951) 268-6268
Agenda Item No. 4 Attachment

File Name : RLT_Merrill_Maple_AMSite Code : 00714517Start Date : 12/9/2014Page No : 1
City of RialtoN/S: Maple AvenueE/W: Merrill AvenueWeather: Clear
Directions Printed: Westbound
Start Time Volume 2 - 3 4 - 5 6 - 7 8 - 9 10 - 11 12 - 13 14 - 15 16 - 17 18 - 19 20 - 21 22 - 23 24 - 25 26 - 27 28 - 29 >29Int.
Total Average
07:00 AM 62 16 3 6 7 3 4 2 4 5 2 2 0 1 1 5 61 8 - 907:15 AM 89 17 4 6 4 4 1 3 0 0 2 3 2 0 0 7 53 6 - 707:30 AM 101 15 13 11 4 6 2 0 1 2 3 2 1 0 1 7 68 6 - 707:45 AM 86 33 18 7 8 7 2 1 1 2 3 1 0 0 0 4 87 4 - 5
Total 338 81 38 30 23 20 9 6 6 9 10 8 3 1 2 23 269 6 - 7
08:00 AM 71 18 6 6 5 4 8 3 2 3 1 0 1 1 1 6 65 8 - 908:15 AM 49 10 3 7 4 2 0 1 2 6 2 0 2 0 0 9 48 10 - 1108:30 AM 40 9 8 2 5 2 2 4 1 0 1 0 2 2 0 9 47 8 - 908:45 AM 61 6 4 4 4 0 3 0 1 0 2 1 1 2 1 10 39 12 - 13
Total 221 43 21 19 18 8 13 8 6 9 6 1 6 5 2 34 199 8 - 9
Grand Total 559 124 59 49 41 28 22 14 12 18 16 9 9 6 4 57 468 8 - 9Total % 26.5 12.6 10.5 8.8 6.0 4.7 3.0 2.6 3.8 3.4 1.9 1.9 1.3 0.9 12.2
Peak Hour Analysis From 07:00 AM to 08:45 AM - Peak 1 of 1Peak Occurred: 07:15 AM
Volume 347High Int. 07:30 AMVolume 101
PHF 0.859
Counts Unlimited, Inc.PO Box 1178
Corona, CA 92878(951) 268-6268
Agenda Item No. 4 Attachment

File Name : RLT_Merrill_Maple_AMSite Code : 00714517Start Date : 12/9/2014Page No : 1
City of RialtoN/S: Maple AvenueE/W: Merrill AvenueWeather: Clear
Directions Printed: Combined
Start Time Volume 2 - 3 4 - 5 6 - 7 8 - 9 10 - 11 12 - 13 14 - 15 16 - 17 18 - 19 20 - 21 22 - 23 24 - 25 26 - 27 28 - 29 >29Int.
Total Average
07:00 AM 148 36 14 12 12 5 8 3 2 1 1 1 0 2 0 1 98 4 - 507:15 AM 157 30 16 6 15 7 5 4 2 1 1 0 0 1 0 1 89 4 - 507:30 AM 188 47 35 11 7 2 3 1 2 2 2 0 1 0 0 1 114 4 - 507:45 AM 204 45 22 9 10 5 3 1 1 1 3 0 1 0 0 0 101 4 - 5
Total 697 158 87 38 44 19 19 9 7 5 7 1 2 3 0 3 402 4 - 5
08:00 AM 156 37 15 8 13 6 7 6 1 1 2 0 0 1 1 1 99 4 - 508:15 AM 108 25 12 10 2 6 3 3 5 4 4 0 2 0 0 4 80 6 - 708:30 AM 94 25 9 6 8 7 2 4 3 2 1 2 3 2 1 4 79 6 - 708:45 AM 110 20 12 10 5 5 5 2 0 3 3 1 0 2 0 6 74 6 - 7
Total 468 107 48 34 28 24 17 15 9 10 10 3 5 5 2 15 332 6 - 7
Grand Total 1165 265 135 72 72 43 36 24 16 15 17 4 7 8 2 18 734 4 - 5Total % 36.1 18.4 9.8 9.8 5.9 4.9 3.3 2.2 2.0 2.3 0.5 1.0 1.1 0.3 2.5
Peak Hour Analysis From 07:00 AM to 08:45 AM - Peak 1 of 1Peak Occurred: 07:15 AM
Volume 705High Int. 07:45 AMVolume 204
PHF 0.864
Counts Unlimited, Inc.PO Box 1178
Corona, CA 92878(951) 268-6268
Agenda Item No. 4 Attachment
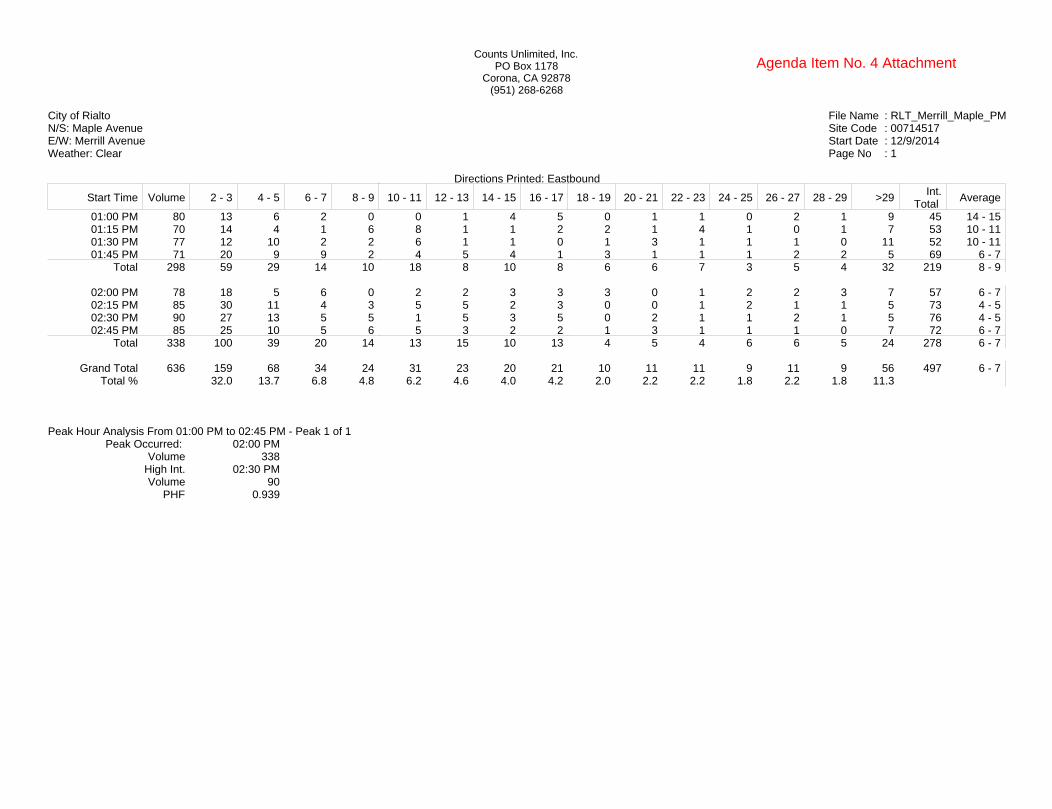
File Name : RLT_Merrill_Maple_PMSite Code : 00714517Start Date : 12/9/2014Page No : 1
City of RialtoN/S: Maple AvenueE/W: Merrill AvenueWeather: Clear
Directions Printed: Eastbound
Start Time Volume 2 - 3 4 - 5 6 - 7 8 - 9 10 - 11 12 - 13 14 - 15 16 - 17 18 - 19 20 - 21 22 - 23 24 - 25 26 - 27 28 - 29 >29Int.
Total Average
01:00 PM 80 13 6 2 0 0 1 4 5 0 1 1 0 2 1 9 45 14 - 1501:15 PM 70 14 4 1 6 8 1 1 2 2 1 4 1 0 1 7 53 10 - 1101:30 PM 77 12 10 2 2 6 1 1 0 1 3 1 1 1 0 11 52 10 - 1101:45 PM 71 20 9 9 2 4 5 4 1 3 1 1 1 2 2 5 69 6 - 7
Total 298 59 29 14 10 18 8 10 8 6 6 7 3 5 4 32 219 8 - 9
02:00 PM 78 18 5 6 0 2 2 3 3 3 0 1 2 2 3 7 57 6 - 702:15 PM 85 30 11 4 3 5 5 2 3 0 0 1 2 1 1 5 73 4 - 502:30 PM 90 27 13 5 5 1 5 3 5 0 2 1 1 2 1 5 76 4 - 502:45 PM 85 25 10 5 6 5 3 2 2 1 3 1 1 1 0 7 72 6 - 7
Total 338 100 39 20 14 13 15 10 13 4 5 4 6 6 5 24 278 6 - 7
Grand Total 636 159 68 34 24 31 23 20 21 10 11 11 9 11 9 56 497 6 - 7Total % 32.0 13.7 6.8 4.8 6.2 4.6 4.0 4.2 2.0 2.2 2.2 1.8 2.2 1.8 11.3
Peak Hour Analysis From 01:00 PM to 02:45 PM - Peak 1 of 1Peak Occurred: 02:00 PM
Volume 338High Int. 02:30 PMVolume 90
PHF 0.939
Counts Unlimited, Inc.PO Box 1178
Corona, CA 92878(951) 268-6268
Agenda Item No. 4 Attachment

File Name : RLT_Merrill_Maple_PMSite Code : 00714517Start Date : 12/9/2014Page No : 1
City of RialtoN/S: Maple AvenueE/W: Merrill AvenueWeather: Clear
Directions Printed: Westbound
Start Time Volume 2 - 3 4 - 5 6 - 7 8 - 9 10 - 11 12 - 13 14 - 15 16 - 17 18 - 19 20 - 21 22 - 23 24 - 25 26 - 27 28 - 29 >29Int.
Total Average
01:00 PM 61 12 10 4 6 6 3 3 1 3 1 0 1 2 2 6 60 8 - 901:15 PM 67 15 4 6 3 9 1 1 2 4 1 3 1 0 0 9 59 10 - 1101:30 PM 62 15 9 7 4 4 4 1 4 3 2 3 3 3 2 2 66 8 - 901:45 PM 94 13 8 2 6 2 4 2 0 2 2 0 5 0 0 9 55 8 - 9
Total 284 55 31 19 19 21 12 7 7 12 6 6 10 5 4 26 240 8 - 9
02:00 PM 71 19 6 9 7 3 5 3 5 1 0 3 0 0 1 6 68 8 - 902:15 PM 89 31 9 6 3 2 1 2 2 1 0 0 1 3 0 7 68 4 - 502:30 PM 89 22 15 7 3 5 4 4 1 5 2 2 1 1 0 4 76 6 - 702:45 PM 95 14 5 12 2 7 7 0 1 3 4 0 1 1 3 4 64 8 - 9
Total 344 86 35 34 15 17 17 9 9 10 6 5 3 5 4 21 276 6 - 7
Grand Total 628 141 66 53 34 38 29 16 16 22 12 11 13 10 8 47 516 6 - 7Total % 27.3 12.8 10.3 6.6 7.4 5.6 3.1 3.1 4.3 2.3 2.1 2.5 1.9 1.6 9.1
Peak Hour Analysis From 01:00 PM to 02:45 PM - Peak 1 of 1Peak Occurred: 02:00 PM
Volume 344High Int. 02:45 PMVolume 95
PHF 0.905
Counts Unlimited, Inc.PO Box 1178
Corona, CA 92878(951) 268-6268
Agenda Item No. 4 Attachment
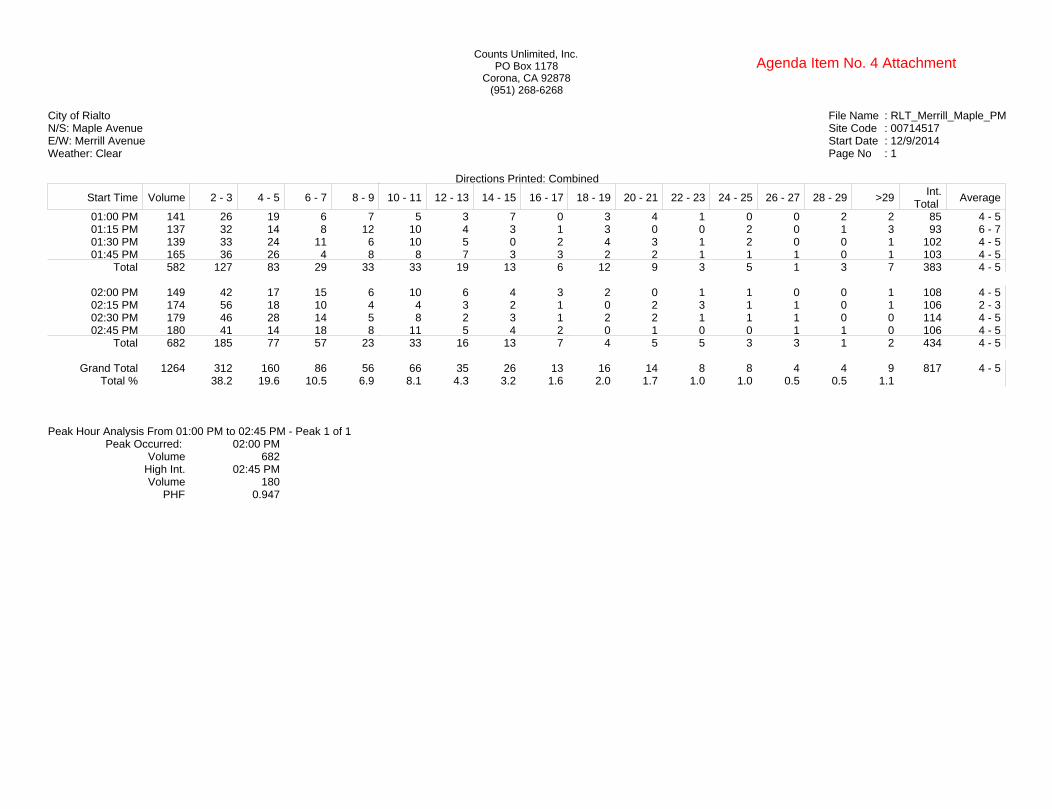
File Name : RLT_Merrill_Maple_PMSite Code : 00714517Start Date : 12/9/2014Page No : 1
City of RialtoN/S: Maple AvenueE/W: Merrill AvenueWeather: Clear
Directions Printed: Combined
Start Time Volume 2 - 3 4 - 5 6 - 7 8 - 9 10 - 11 12 - 13 14 - 15 16 - 17 18 - 19 20 - 21 22 - 23 24 - 25 26 - 27 28 - 29 >29Int.
Total Average
01:00 PM 141 26 19 6 7 5 3 7 0 3 4 1 0 0 2 2 85 4 - 501:15 PM 137 32 14 8 12 10 4 3 1 3 0 0 2 0 1 3 93 6 - 701:30 PM 139 33 24 11 6 10 5 0 2 4 3 1 2 0 0 1 102 4 - 501:45 PM 165 36 26 4 8 8 7 3 3 2 2 1 1 1 0 1 103 4 - 5
Total 582 127 83 29 33 33 19 13 6 12 9 3 5 1 3 7 383 4 - 5
02:00 PM 149 42 17 15 6 10 6 4 3 2 0 1 1 0 0 1 108 4 - 502:15 PM 174 56 18 10 4 4 3 2 1 0 2 3 1 1 0 1 106 2 - 302:30 PM 179 46 28 14 5 8 2 3 1 2 2 1 1 1 0 0 114 4 - 502:45 PM 180 41 14 18 8 11 5 4 2 0 1 0 0 1 1 0 106 4 - 5
Total 682 185 77 57 23 33 16 13 7 4 5 5 3 3 1 2 434 4 - 5
Grand Total 1264 312 160 86 56 66 35 26 13 16 14 8 8 4 4 9 817 4 - 5Total % 38.2 19.6 10.5 6.9 8.1 4.3 3.2 1.6 2.0 1.7 1.0 1.0 0.5 0.5 1.1
Peak Hour Analysis From 01:00 PM to 02:45 PM - Peak 1 of 1Peak Occurred: 02:00 PM
Volume 682High Int. 02:45 PMVolume 180
PHF 0.947
Counts Unlimited, Inc.PO Box 1178
Corona, CA 92878(951) 268-6268
Agenda Item No. 4 Attachment

File Name : RLTMELIMDGAPSite Code : 00700028Start Date : 1/7/2015Page No : 1
City of RialtoN/S: Lilac AvenueE/W: Merrill AvenueWeather: Clear
Directions Printed: Eastbound
Start Time Volume 2 - 3 4 - 5 6 - 7 8 - 9 10 - 11 12 - 13 14 - 15 16 - 17 18 - 19 20 - 21 22 - 23 24 - 25 26 - 27 28 - 29 >29Int.
Total Average
1:45:00 PM 86 3 2 2 3 0 1 2 0 1 0 3 0 1 0 2 20 12 - 132:00:00 PM 106 4 4 4 3 0 0 2 1 0 0 1 0 0 0 1 20 6 - 72:15:00 PM 92 6 2 3 3 3 1 3 3 0 0 0 0 2 0 3 29 10 - 112:30:00 PM 82 2 11 3 4 1 3 0 1 0 0 4 0 2 1 3 35 8 - 92:45:00 PM 77 4 5 3 4 2 4 1 1 3 1 0 0 0 0 6 34 10 - 11
Grand Total 443 19 24 15 17 6 9 8 6 4 1 8 0 5 1 15 138 8 - 9Total % 13.8 17.4 10.9 12.3 4.3 6.5 5.8 4.3 2.9 0.7 5.8 0.0 3.6 0.7 10.9
Peak Hour Analysis From 01:45 PM to 02:55 PM - Peak 1 of 1Peak Occurred: 01:50 PM
Volume 379High Int. 01:55 PMVolume 44
PHF 0.718
Counts Unlimited, Inc.PO Box 1178
Corona, CA 92878(951) 268-6268
Agenda Item No. 4 Attachment

File Name : RLTMELIMDGAPSite Code : 00700028Start Date : 1/7/2015Page No : 1
City of RialtoN/S: Lilac AvenueE/W: Merrill AvenueWeather: Clear
Directions Printed: Westbound
Start Time Volume 2 - 3 4 - 5 6 - 7 8 - 9 10 - 11 12 - 13 14 - 15 16 - 17 18 - 19 20 - 21 22 - 23 24 - 25 26 - 27 28 - 29 >29Int.
Total Average
1:45:00 PM 98 19 9 11 7 3 2 2 1 3 1 0 2 1 0 2 63 6 - 72:00:00 PM 81 20 17 15 5 2 3 1 3 0 0 1 3 0 0 3 73 4 - 52:15:00 PM 80 14 7 11 3 5 3 4 1 2 0 3 2 0 0 5 60 6 - 72:30:00 PM 73 13 15 6 7 5 0 2 0 1 2 2 3 2 2 4 64 6 - 72:45:00 PM 117 22 17 15 4 5 4 3 1 2 3 2 1 1 0 1 81 6 - 7
Grand Total 449 88 65 58 26 20 12 12 6 8 6 8 11 4 2 15 341 6 - 7Total % 25.8 19.1 17.0 7.6 5.9 3.5 3.5 1.8 2.3 1.8 2.3 3.2 1.2 0.6 4.4
Peak Hour Analysis From 01:45 PM to 02:55 PM - Peak 1 of 1Peak Occurred: 02:00 PM
Volume 351High Int. 02:55 PMVolume 54
PHF 0.542
Counts Unlimited, Inc.PO Box 1178
Corona, CA 92878(951) 268-6268
Agenda Item No. 4 Attachment

File Name : RLTMELIMDGAPSite Code : 00700028Start Date : 1/7/2015Page No : 1
City of RialtoN/S: Lilac AvenueE/W: Merrill AvenueWeather: Clear
Directions Printed: Combined
Start Time Volume 2 - 3 4 - 5 6 - 7 8 - 9 10 - 11 12 - 13 14 - 15 16 - 17 18 - 19 20 - 21 22 - 23 24 - 25 26 - 27 28 - 29 >29Int.
Total Average
1:45:00 PM 184 6 7 7 5 1 1 2 1 0 0 0 2 0 0 0 32 6 - 72:00:00 PM 187 8 12 5 2 1 1 0 0 0 0 0 0 0 0 0 29 4 - 52:15:00 PM 172 16 9 7 4 2 3 3 1 0 0 1 0 0 0 2 48 4 - 52:30:00 PM 155 14 19 4 10 5 1 1 1 2 0 2 1 0 0 0 60 4 - 52:45:00 PM 194 29 13 8 4 3 5 3 0 0 1 1 0 0 1 0 68 4 - 5
Grand Total 892 73 60 31 25 12 11 9 3 2 1 4 3 0 1 2 237 4 - 5Total % 30.8 25.3 13.1 10.5 5.1 4.6 3.8 1.3 0.8 0.4 1.7 1.3 0.0 0.4 0.8
Peak Hour Analysis From 01:45 PM to 02:55 PM - Peak 1 of 1Peak Occurred: 01:55 PM
Volume 711High Int. 02:15 PMVolume 83
PHF 0.714
Counts Unlimited, Inc.PO Box 1178
Corona, CA 92878(951) 268-6268
Agenda Item No. 4 Attachment
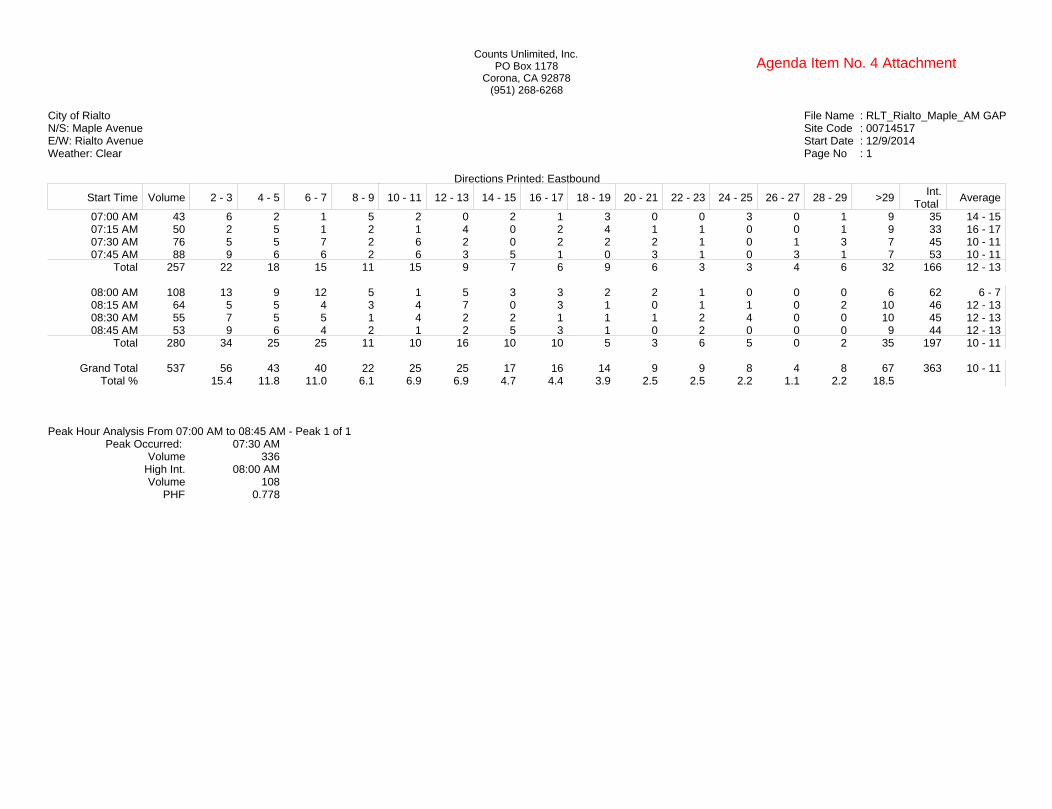
File Name : RLT_Rialto_Maple_AM GAPSite Code : 00714517Start Date : 12/9/2014Page No : 1
City of RialtoN/S: Maple AvenueE/W: Rialto AvenueWeather: Clear
Directions Printed: Eastbound
Start Time Volume 2 - 3 4 - 5 6 - 7 8 - 9 10 - 11 12 - 13 14 - 15 16 - 17 18 - 19 20 - 21 22 - 23 24 - 25 26 - 27 28 - 29 >29Int.
Total Average
07:00 AM 43 6 2 1 5 2 0 2 1 3 0 0 3 0 1 9 35 14 - 1507:15 AM 50 2 5 1 2 1 4 0 2 4 1 1 0 0 1 9 33 16 - 1707:30 AM 76 5 5 7 2 6 2 0 2 2 2 1 0 1 3 7 45 10 - 1107:45 AM 88 9 6 6 2 6 3 5 1 0 3 1 0 3 1 7 53 10 - 11
Total 257 22 18 15 11 15 9 7 6 9 6 3 3 4 6 32 166 12 - 13
08:00 AM 108 13 9 12 5 1 5 3 3 2 2 1 0 0 0 6 62 6 - 708:15 AM 64 5 5 4 3 4 7 0 3 1 0 1 1 0 2 10 46 12 - 1308:30 AM 55 7 5 5 1 4 2 2 1 1 1 2 4 0 0 10 45 12 - 1308:45 AM 53 9 6 4 2 1 2 5 3 1 0 2 0 0 0 9 44 12 - 13
Total 280 34 25 25 11 10 16 10 10 5 3 6 5 0 2 35 197 10 - 11
Grand Total 537 56 43 40 22 25 25 17 16 14 9 9 8 4 8 67 363 10 - 11Total % 15.4 11.8 11.0 6.1 6.9 6.9 4.7 4.4 3.9 2.5 2.5 2.2 1.1 2.2 18.5
Peak Hour Analysis From 07:00 AM to 08:45 AM - Peak 1 of 1Peak Occurred: 07:30 AM
Volume 336High Int. 08:00 AMVolume 108
PHF 0.778
Counts Unlimited, Inc.PO Box 1178
Corona, CA 92878(951) 268-6268
Agenda Item No. 4 Attachment
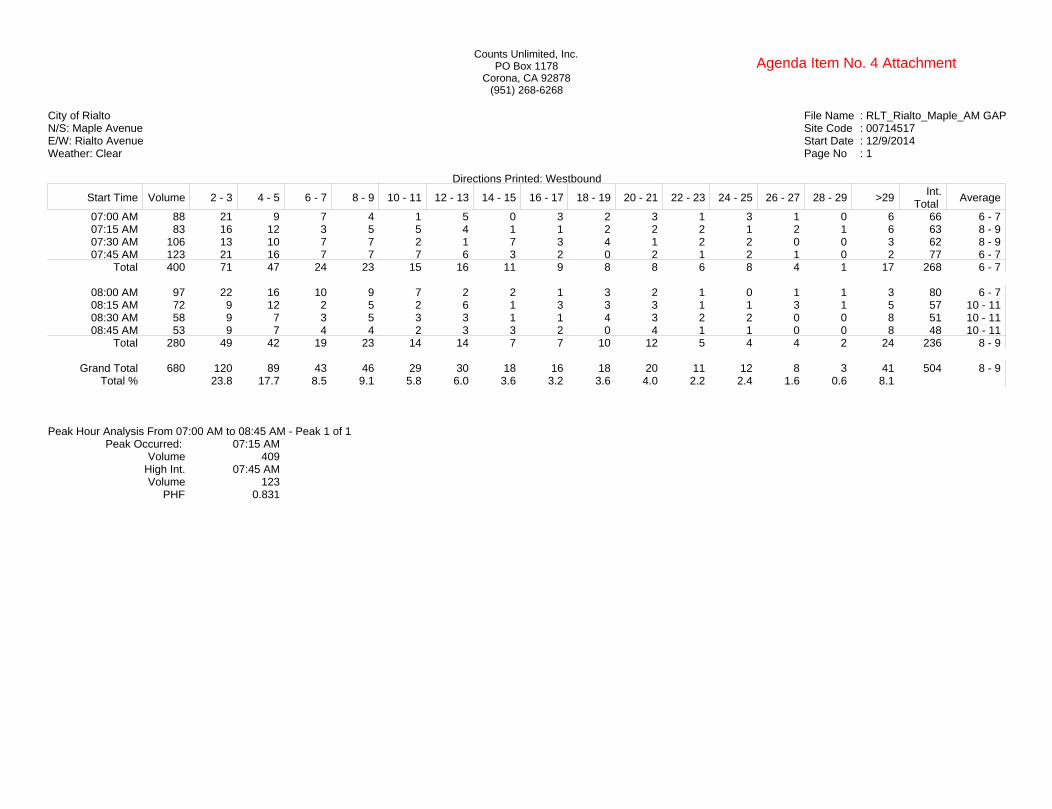
File Name : RLT_Rialto_Maple_AM GAPSite Code : 00714517Start Date : 12/9/2014Page No : 1
City of RialtoN/S: Maple AvenueE/W: Rialto AvenueWeather: Clear
Directions Printed: Westbound
Start Time Volume 2 - 3 4 - 5 6 - 7 8 - 9 10 - 11 12 - 13 14 - 15 16 - 17 18 - 19 20 - 21 22 - 23 24 - 25 26 - 27 28 - 29 >29Int.
Total Average
07:00 AM 88 21 9 7 4 1 5 0 3 2 3 1 3 1 0 6 66 6 - 707:15 AM 83 16 12 3 5 5 4 1 1 2 2 2 1 2 1 6 63 8 - 907:30 AM 106 13 10 7 7 2 1 7 3 4 1 2 2 0 0 3 62 8 - 907:45 AM 123 21 16 7 7 7 6 3 2 0 2 1 2 1 0 2 77 6 - 7
Total 400 71 47 24 23 15 16 11 9 8 8 6 8 4 1 17 268 6 - 7
08:00 AM 97 22 16 10 9 7 2 2 1 3 2 1 0 1 1 3 80 6 - 708:15 AM 72 9 12 2 5 2 6 1 3 3 3 1 1 3 1 5 57 10 - 1108:30 AM 58 9 7 3 5 3 3 1 1 4 3 2 2 0 0 8 51 10 - 1108:45 AM 53 9 7 4 4 2 3 3 2 0 4 1 1 0 0 8 48 10 - 11
Total 280 49 42 19 23 14 14 7 7 10 12 5 4 4 2 24 236 8 - 9
Grand Total 680 120 89 43 46 29 30 18 16 18 20 11 12 8 3 41 504 8 - 9Total % 23.8 17.7 8.5 9.1 5.8 6.0 3.6 3.2 3.6 4.0 2.2 2.4 1.6 0.6 8.1
Peak Hour Analysis From 07:00 AM to 08:45 AM - Peak 1 of 1Peak Occurred: 07:15 AM
Volume 409High Int. 07:45 AMVolume 123
PHF 0.831
Counts Unlimited, Inc.PO Box 1178
Corona, CA 92878(951) 268-6268
Agenda Item No. 4 Attachment
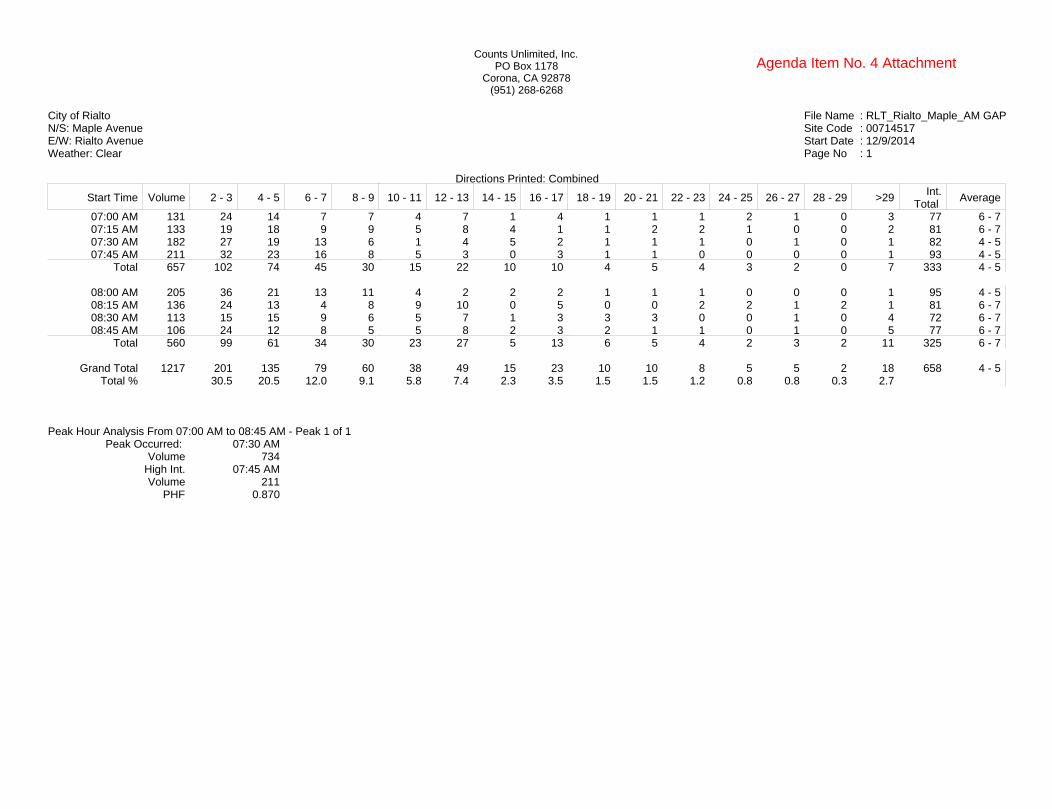
File Name : RLT_Rialto_Maple_AM GAPSite Code : 00714517Start Date : 12/9/2014Page No : 1
City of RialtoN/S: Maple AvenueE/W: Rialto AvenueWeather: Clear
Directions Printed: Combined
Start Time Volume 2 - 3 4 - 5 6 - 7 8 - 9 10 - 11 12 - 13 14 - 15 16 - 17 18 - 19 20 - 21 22 - 23 24 - 25 26 - 27 28 - 29 >29Int.
Total Average
07:00 AM 131 24 14 7 7 4 7 1 4 1 1 1 2 1 0 3 77 6 - 707:15 AM 133 19 18 9 9 5 8 4 1 1 2 2 1 0 0 2 81 6 - 707:30 AM 182 27 19 13 6 1 4 5 2 1 1 1 0 1 0 1 82 4 - 507:45 AM 211 32 23 16 8 5 3 0 3 1 1 0 0 0 0 1 93 4 - 5
Total 657 102 74 45 30 15 22 10 10 4 5 4 3 2 0 7 333 4 - 5
08:00 AM 205 36 21 13 11 4 2 2 2 1 1 1 0 0 0 1 95 4 - 508:15 AM 136 24 13 4 8 9 10 0 5 0 0 2 2 1 2 1 81 6 - 708:30 AM 113 15 15 9 6 5 7 1 3 3 3 0 0 1 0 4 72 6 - 708:45 AM 106 24 12 8 5 5 8 2 3 2 1 1 0 1 0 5 77 6 - 7
Total 560 99 61 34 30 23 27 5 13 6 5 4 2 3 2 11 325 6 - 7
Grand Total 1217 201 135 79 60 38 49 15 23 10 10 8 5 5 2 18 658 4 - 5Total % 30.5 20.5 12.0 9.1 5.8 7.4 2.3 3.5 1.5 1.5 1.2 0.8 0.8 0.3 2.7
Peak Hour Analysis From 07:00 AM to 08:45 AM - Peak 1 of 1Peak Occurred: 07:30 AM
Volume 734High Int. 07:45 AMVolume 211
PHF 0.870
Counts Unlimited, Inc.PO Box 1178
Corona, CA 92878(951) 268-6268
Agenda Item No. 4 Attachment
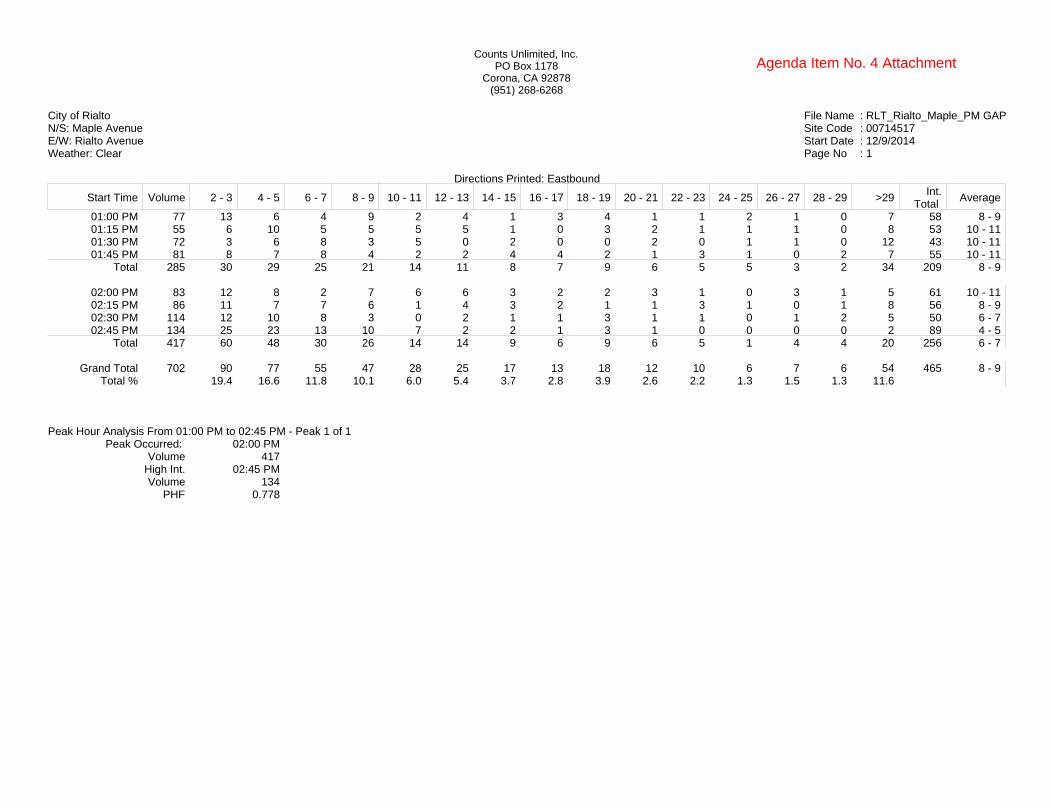
File Name : RLT_Rialto_Maple_PM GAPSite Code : 00714517Start Date : 12/9/2014Page No : 1
City of RialtoN/S: Maple AvenueE/W: Rialto AvenueWeather: Clear
Directions Printed: Eastbound
Start Time Volume 2 - 3 4 - 5 6 - 7 8 - 9 10 - 11 12 - 13 14 - 15 16 - 17 18 - 19 20 - 21 22 - 23 24 - 25 26 - 27 28 - 29 >29Int.
Total Average
01:00 PM 77 13 6 4 9 2 4 1 3 4 1 1 2 1 0 7 58 8 - 901:15 PM 55 6 10 5 5 5 5 1 0 3 2 1 1 1 0 8 53 10 - 1101:30 PM 72 3 6 8 3 5 0 2 0 0 2 0 1 1 0 12 43 10 - 1101:45 PM 81 8 7 8 4 2 2 4 4 2 1 3 1 0 2 7 55 10 - 11
Total 285 30 29 25 21 14 11 8 7 9 6 5 5 3 2 34 209 8 - 9
02:00 PM 83 12 8 2 7 6 6 3 2 2 3 1 0 3 1 5 61 10 - 1102:15 PM 86 11 7 7 6 1 4 3 2 1 1 3 1 0 1 8 56 8 - 902:30 PM 114 12 10 8 3 0 2 1 1 3 1 1 0 1 2 5 50 6 - 702:45 PM 134 25 23 13 10 7 2 2 1 3 1 0 0 0 0 2 89 4 - 5
Total 417 60 48 30 26 14 14 9 6 9 6 5 1 4 4 20 256 6 - 7
Grand Total 702 90 77 55 47 28 25 17 13 18 12 10 6 7 6 54 465 8 - 9Total % 19.4 16.6 11.8 10.1 6.0 5.4 3.7 2.8 3.9 2.6 2.2 1.3 1.5 1.3 11.6
Peak Hour Analysis From 01:00 PM to 02:45 PM - Peak 1 of 1Peak Occurred: 02:00 PM
Volume 417High Int. 02:45 PMVolume 134
PHF 0.778
Counts Unlimited, Inc.PO Box 1178
Corona, CA 92878(951) 268-6268
Agenda Item No. 4 Attachment
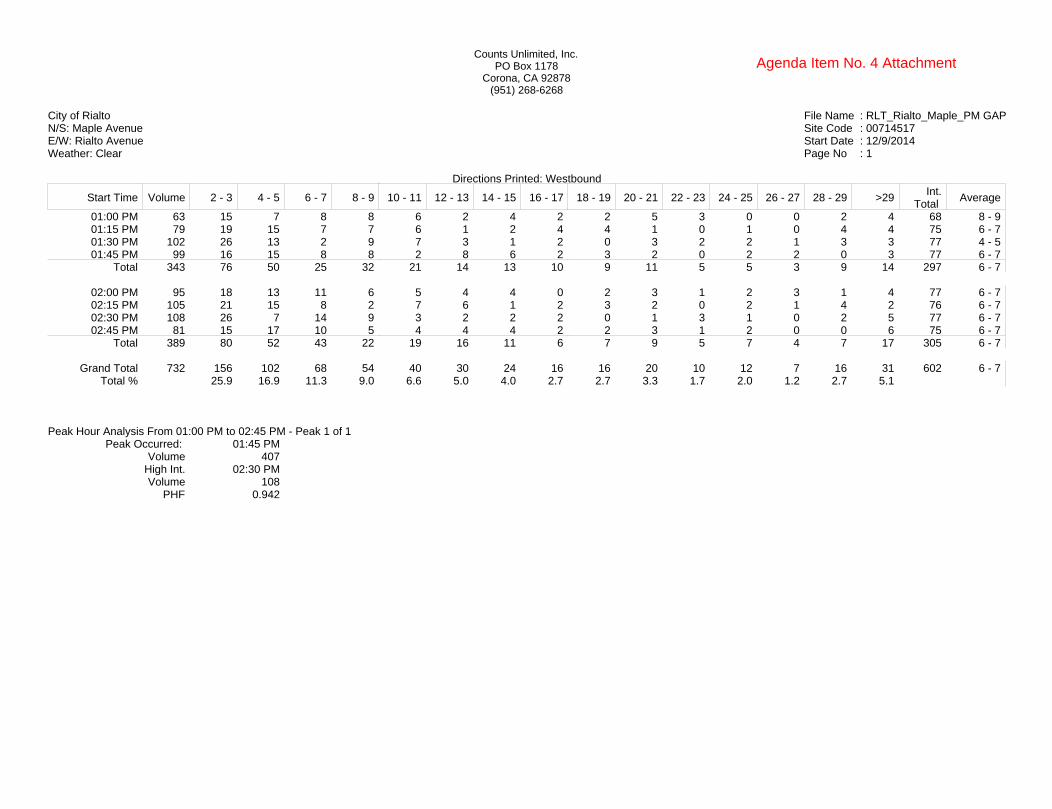
File Name : RLT_Rialto_Maple_PM GAPSite Code : 00714517Start Date : 12/9/2014Page No : 1
City of RialtoN/S: Maple AvenueE/W: Rialto AvenueWeather: Clear
Directions Printed: Westbound
Start Time Volume 2 - 3 4 - 5 6 - 7 8 - 9 10 - 11 12 - 13 14 - 15 16 - 17 18 - 19 20 - 21 22 - 23 24 - 25 26 - 27 28 - 29 >29Int.
Total Average
01:00 PM 63 15 7 8 8 6 2 4 2 2 5 3 0 0 2 4 68 8 - 901:15 PM 79 19 15 7 7 6 1 2 4 4 1 0 1 0 4 4 75 6 - 701:30 PM 102 26 13 2 9 7 3 1 2 0 3 2 2 1 3 3 77 4 - 501:45 PM 99 16 15 8 8 2 8 6 2 3 2 0 2 2 0 3 77 6 - 7
Total 343 76 50 25 32 21 14 13 10 9 11 5 5 3 9 14 297 6 - 7
02:00 PM 95 18 13 11 6 5 4 4 0 2 3 1 2 3 1 4 77 6 - 702:15 PM 105 21 15 8 2 7 6 1 2 3 2 0 2 1 4 2 76 6 - 702:30 PM 108 26 7 14 9 3 2 2 2 0 1 3 1 0 2 5 77 6 - 702:45 PM 81 15 17 10 5 4 4 4 2 2 3 1 2 0 0 6 75 6 - 7
Total 389 80 52 43 22 19 16 11 6 7 9 5 7 4 7 17 305 6 - 7
Grand Total 732 156 102 68 54 40 30 24 16 16 20 10 12 7 16 31 602 6 - 7Total % 25.9 16.9 11.3 9.0 6.6 5.0 4.0 2.7 2.7 3.3 1.7 2.0 1.2 2.7 5.1
Peak Hour Analysis From 01:00 PM to 02:45 PM - Peak 1 of 1Peak Occurred: 01:45 PM
Volume 407High Int. 02:30 PMVolume 108
PHF 0.942
Counts Unlimited, Inc.PO Box 1178
Corona, CA 92878(951) 268-6268
Agenda Item No. 4 Attachment

File Name : RLT_Rialto_Maple_PM GAPSite Code : 00714517Start Date : 12/9/2014Page No : 1
City of RialtoN/S: Maple AvenueE/W: Rialto AvenueWeather: Clear
Directions Printed: Combined
Start Time Volume 2 - 3 4 - 5 6 - 7 8 - 9 10 - 11 12 - 13 14 - 15 16 - 17 18 - 19 20 - 21 22 - 23 24 - 25 26 - 27 28 - 29 >29Int.
Total Average
01:00 PM 140 31 17 14 7 9 6 2 4 2 2 2 1 0 0 0 97 6 - 701:15 PM 134 33 25 15 8 11 7 2 3 2 2 0 0 0 0 0 108 4 - 501:30 PM 174 33 22 8 8 6 3 0 2 1 2 0 3 1 2 0 91 4 - 501:45 PM 180 26 22 17 11 6 4 2 2 3 2 1 0 1 1 0 98 6 - 7
Total 628 123 86 54 34 32 20 6 11 8 8 3 4 2 3 0 394 4 - 5
02:00 PM 178 35 19 8 13 7 4 1 3 5 1 0 1 0 0 1 98 4 - 502:15 PM 191 36 25 15 8 8 7 0 1 3 0 2 1 0 0 0 106 4 - 502:30 PM 222 37 13 16 4 2 2 2 3 1 1 0 0 0 1 1 83 4 - 502:45 PM 215 52 29 13 10 2 3 0 0 0 0 0 0 0 0 1 110 4 - 5
Total 806 160 86 52 35 19 16 3 7 9 2 2 2 0 1 3 397 4 - 5
Grand Total 1434 283 172 106 69 51 36 9 18 17 10 5 6 2 4 3 791 4 - 5Total % 35.8 21.7 13.4 8.7 6.4 4.6 1.1 2.3 2.1 1.3 0.6 0.8 0.3 0.5 0.4
Peak Hour Analysis From 01:00 PM to 02:45 PM - Peak 1 of 1Peak Occurred: 02:00 PM
Volume 806High Int. 02:30 PMVolume 222
PHF 0.908
Counts Unlimited, Inc.PO Box 1178
Corona, CA 92878(951) 268-6268
Agenda Item No. 4 Attachment
Traffic Signal Prioritization Analysis City of Rialto
APPENDIX D
Collisions
Agenda Item No. 4 Attachment

01/01/2012 thru 12/31/2012
Report Run On: 08/14/2014
Total Count: 418
Include State Highways cases
Jurisdiction(s): Rialto
2 DRVR 38 F H HNBD PROC ST N D 2200 GMC 2000 - 3 N - M G
Primary Rd ACACIA AV Distance (ft) 99 Direction S Secondary Rd FOOTHILL BL NCIC 3609 State Hwy? N Route Postmile Prefix Postmile Side of HwyCity Rialto County San Bernardino Population 5 Rpt Dist 129 Beat 003 Type 0 CalTrans Badge 1041 Collision Date 20120404 Time 1238 Day WEDPrimary Collision Factor UNSAFE SPEED Violation 22350 Collision Type REAR END Severity INJURY #Killed 0 #Injured 1 Tow Away? N Process Date 20130817Weather1 CLEAR Weather2 Rdwy Surface DRY Rdwy Cond1 NO UNUSL CND Rdwy Cond2 Spec Cond 0Hit and Run Motor Vehicle Involved WithOTHER MV Lighting DAYLIGHT Ped Action Cntrl Dev FNCTNG Loc Type Ramp/Int
1F DRVR 85 M B HNBD PROC ST N D 2200 NISSA 2008 - - N - M G2 DRVR 75 M H HNBD STOPPED N A 0100 NISSA 2005 - - N - M G DRVR COMP PN 75 M 1 3 M G
Party InfoParty Type Age Sex Race Sobriety1 Sobriety2 Move Pre Dir SW Veh CHP Veh Make Year SP Info OAF1 Viol OAF2 Safety Equip ROLE Ext Of Inj AGE Sex Seat Pos Safety EQUIP Ejected
Victim Info
Primary Rd ACACIA AV Distance (ft) 0 Direction Secondary Rd FOOTHILL BL NCIC 3609 State Hwy? N Route Postmile Prefix Postmile Side of HwyCity Rialto County San Bernardino Population 5 Rpt Dist 128 Beat Type 0 CalTrans Badge 3077 Collision Date 20120908 Time 1013 Day SATPrimary Collision Factor UNSAFE SPEED Violation 22350 Collision Type REAR END Severity INJURY #Killed 0 #Injured 2 Tow Away? Y Process Date 20131211Weather1 CLEAR Weather2 Rdwy Surface DRY Rdwy Cond1 NO UNUSL CND Rdwy Cond2 Spec Cond 0Hit and Run Motor Vehicle Involved WithOTHER MV Lighting DAYLIGHT Ped Action Cntrl Dev NT PRS/FCTR Loc Type Ramp/Int
1F DRVR 50 M H HNBD PROC ST S I 1100 GMC - 3 N - M G2 DRVR 33 F H HNBD LFT TURN S I 1100 CHEVR 1989 - 3 N - M G DRVR OTH VIS 33 F 1 0 M G
PASS OTH VIS 37 M 3 0 M G
Party InfoParty Type Age Sex Race Sobriety1 Sobriety2 Move Pre Dir SW Veh CHP Veh Make Year SP Info OAF1 Viol OAF2 Safety Equip ROLE Ext Of Inj AGE Sex Seat Pos Safety EQUIP Ejected
Victim Info
Primary Rd ACACIA AV Distance (ft) 10 Direction S Secondary Rd RAMONA DR NCIC 3609 State Hwy? N Route Postmile Prefix Postmile Side of HwyCity Rialto County San Bernardino Population 5 Rpt Dist 129 Beat 002 Type 0 CalTrans Badge 7379 Collision Date 20120818 Time 1210 Day SATPrimary Collision Factor UNSAFE SPEED Violation 22350 Collision Type HEAD-ON Severity PDO #Killed 0 #Injured 0 Tow Away? N Process Date 20140310Weather1 CLEAR Weather2 Rdwy Surface DRY Rdwy Cond1 NO UNUSL CND Rdwy Cond2 Spec Cond 0Hit and Run Motor Vehicle Involved WithFIXED OBJ Lighting DAYLIGHT Ped Action Cntrl Dev NT PRS/FCTR Loc Type Ramp/Int
1F DRVR 38 F HNBD PROC ST N A 0700 CHEVR 2009 - - - - M G
Party InfoParty Type Age Sex Race Sobriety1 Sobriety2 Move Pre Dir SW Veh CHP Veh Make Year SP Info OAF1 Viol OAF2 Safety Equip ROLE Ext Of Inj AGE Sex Seat Pos Safety EQUIP Ejected
Victim Info
Primary Rd AGUA MANSA RD Distance (ft) 0 Direction Secondary Rd ENTERPRISE DR NCIC 3609 State Hwy? N Route Postmile Prefix Postmile Side of HwyCity Rialto County San Bernardino Population 5 Rpt Dist 230 Beat 004 Type 0 CalTrans Badge 9222 Collision Date 20120328 Time 2100 Day WEDPrimary Collision Factor IMPROP TURN Violation 22107 Collision Type SIDESWIPE Severity INJURY #Killed 0 #Injured 2 Tow Away? N Process Date 20130806Weather1 CLEAR Weather2 Rdwy Surface DRY Rdwy Cond1 NO UNUSL CND Rdwy Cond2 Spec Cond 0Hit and Run Motor Vehicle Involved WithOTHER MV Lighting DARK - ST Ped Action Cntrl Dev FNCTNG Loc Type Ramp/Int
1F DRVR 29 M H HNBD RGT TURN S A 0100 FORD 1995 - - F - M G PASS COMP PN 15 M 3 0 M GPASS 16 M 4 3 M G
2 DRVR 41 M H HNBD PROC ST E A 0700 FORD 1998 - - N - M G DRVR COMP PN 41 M 1 0 M G
Party InfoParty Type Age Sex Race Sobriety1 Sobriety2 Move Pre Dir SW Veh CHP Veh Make Year SP Info OAF1 Viol OAF2 Safety Equip ROLE Ext Of Inj AGE Sex Seat Pos Safety EQUIP Ejected
Victim Info
Primary Rd ALDER Distance (ft) 123 Direction S Secondary Rd RT 210 NCIC 3609 State Hwy? Y Route Postmile Prefix Postmile Side of HwyCity Rialto County San Bernardino Population 5 Rpt Dist 68 Beat 001 Type 0 CalTrans Badge 1431 Collision Date 20120826 Time 0445 Day SUNPrimary Collision Factor IMPROP TURN Violation 22107 Collision Type HIT OBJECT Severity INJURY #Killed 0 #Injured 1 Tow Away? Y Process Date 20131120Weather1 CLEAR Weather2 Rdwy Surface DRY Rdwy Cond1 NO UNUSL CND Rdwy Cond2 Spec Cond 0Hit and Run Motor Vehicle Involved WithFIXED OBJ Lighting DARK - ST Ped Action Cntrl Dev FNCTNG Loc Type Ramp/Int
1F DRVR 26 F H HBD-UI UNS TURN N A 0100 NISSA 2008 - - A 22107 - L G DRVR OTH VIS 26 F 1 0 L G
Party InfoParty Type Age Sex Race Sobriety1 Sobriety2 Move Pre Dir SW Veh CHP Veh Make Year SP Info OAF1 Viol OAF2 Safety Equip ROLE Ext Of Inj AGE Sex Seat Pos Safety EQUIP Ejected
Victim Info
Page 2 This report is accepted subject to the Terms of Use. Due to collision records processing backlogs, SWITRS data is typically seven months behind. Data requested for dates seven months prior to the current date will be incomplete.
Agenda Item No. 4 Attachment

01/01/2012 thru 12/31/2012
Report Run On: 08/14/2014
Total Count: 418
Include State Highways cases
Jurisdiction(s): Rialto
PASS COMP PN 52 M 6 0 P G2 DRVR 26 M B HBD-UI UNS TURN W A 0700 CHEVR 2000 - - A 23152 - M G
Primary Rd BASELINE RD Distance (ft) 60 Direction W Secondary Rd AYALA AV NCIC 3609 State Hwy? N Route Postmile Prefix Postmile Side of HwyCity Rialto County San Bernardino Population 5 Rpt Dist 105 Beat 001 Type 0 CalTrans Badge 1514 Collision Date 20120802 Time 2245 Day THUPrimary Collision Factor DRVR ALC|DRG Violation 23152 Collision Type BROADSIDE Severity INJURY #Killed 0 #Injured 1 Tow Away? N Process Date 20131126Weather1 CLEAR Weather2 Rdwy Surface DRY Rdwy Cond1 NO UNUSL CND Rdwy Cond2 Spec Cond 0Hit and Run Motor Vehicle Involved WithOTHER MV Lighting DARK - ST Ped Action Cntrl Dev FNCTNG Loc Type Ramp/Int
1F DRVR 61 F H HBD-UI OPPOS LN E A 0100 LEXUS 2008 - - A 22107 - L G2 DRVR 40 M H HNBD PROC ST W D 2200 FORD 2000 - - N - M G DRVR COMP PN 40 M 1 0 M G
Party InfoParty Type Age Sex Race Sobriety1 Sobriety2 Move Pre Dir SW Veh CHP Veh Make Year SP Info OAF1 Viol OAF2 Safety Equip ROLE Ext Of Inj AGE Sex Seat Pos Safety EQUIP Ejected
Victim Info
Primary Rd BASELINE RD Distance (ft) 445 Direction W Secondary Rd CACTUS AV NCIC 3609 State Hwy? N Route Postmile Prefix Postmile Side of HwyCity Rialto County San Bernardino Population 5 Rpt Dist 108 Beat 001 Type 0 CalTrans Badge 3156 Collision Date 20120722 Time 2138 Day SUNPrimary Collision Factor PED VIOL Violation 21956A Collision Type AUTO/PED Severity INJURY #Killed 0 #Injured 1 Tow Away? N Process Date 20131019Weather1 CLEAR Weather2 Rdwy Surface DRY Rdwy Cond1 NO UNUSL CND Rdwy Cond2 Spec Cond 0Hit and Run Motor Vehicle Involved WithPED Lighting DARK - ST Ped Action IN RD, Cntrl Dev NT PRS/FCTR Loc Type Ramp/Int
1F PED 26 M W HNBD OTHER W N 6000 - - - N - - - PED OTH VIS 26 M 9 3 - -2 DRVR 38 F H HNBD PROC ST W A 0100 SCION 2008 - - N - M G PASS 11 M 3 3 L G
PASS 998 F 4 3 P G
Party InfoParty Type Age Sex Race Sobriety1 Sobriety2 Move Pre Dir SW Veh CHP Veh Make Year SP Info OAF1 Viol OAF2 Safety Equip ROLE Ext Of Inj AGE Sex Seat Pos Safety EQUIP Ejected
Victim Info
Primary Rd BASELINE RD Distance (ft) 120 Direction W Secondary Rd CEDAR AV NCIC 3609 State Hwy? N Route Postmile Prefix Postmile Side of HwyCity Rialto County San Bernardino Population 5 Rpt Dist 105 Beat 001 Type 0 CalTrans Badge 1514 Collision Date 20120504 Time 0417 Day FRIPrimary Collision Factor UNSAFE SPEED Violation 22350 Collision Type HIT OBJECT Severity PDO #Killed 0 #Injured 0 Tow Away? Y Process Date 20140128Weather1 CLEAR Weather2 Rdwy Surface DRY Rdwy Cond1 NO UNUSL CND Rdwy Cond2 Spec Cond 0Hit and Run Motor Vehicle Involved WithOTHER OBJ Lighting DARK - ST Ped Action Cntrl Dev FNCTNG Loc Type Ramp/Int
1F DRVR 47 M B HNBD PROC ST E A 0100 CHRYS 2001 - - L - L G
Party InfoParty Type Age Sex Race Sobriety1 Sobriety2 Move Pre Dir SW Veh CHP Veh Make Year SP Info OAF1 Viol OAF2 Safety Equip ROLE Ext Of Inj AGE Sex Seat Pos Safety EQUIP Ejected
Victim Info
Primary Rd BASELINE RD Distance (ft) 0 Direction Secondary Rd EUCALYPTUS AV NCIC 3609 State Hwy? N Route Postmile Prefix Postmile Side of HwyCity Rialto County San Bernardino Population 5 Rpt Dist 102 Beat 002 Type 0 CalTrans Badge 9156 Collision Date 20120422 Time 1715 Day SUNPrimary Collision Factor R-O-W AUTO Violation 21801A Collision Type BROADSIDE Severity INJURY #Killed 0 #Injured 2 Tow Away? Y Process Date 20130816Weather1 CLEAR Weather2 Rdwy Surface DRY Rdwy Cond1 NO UNUSL CND Rdwy Cond2 Spec Cond 0Hit and Run Motor Vehicle Involved WithOTHER MV Lighting DAYLIGHT Ped Action Cntrl Dev FNCTNG Loc Type Ramp/Int
1F DRVR 29 M H HNBD LFT TURN W D 2200 DODGE 2010 - - N - L G2 DRVR 22 F B HNBD PROC ST E A 0100 CADIL 1991 - - N - L G DRVR COMP PN 22 F 1 0 L G
PASS SEVERE 36 M 3 0 P G3 DRVR 21 F B HNBD STOPPED N A 0700 FORD 2011 - - N - M G
Party InfoParty Type Age Sex Race Sobriety1 Sobriety2 Move Pre Dir SW Veh CHP Veh Make Year SP Info OAF1 Viol OAF2 Safety Equip ROLE Ext Of Inj AGE Sex Seat Pos Safety EQUIP Ejected
Victim Info
Page 6 This report is accepted subject to the Terms of Use. Due to collision records processing backlogs, SWITRS data is typically seven months behind. Data requested for dates seven months prior to the current date will be incomplete.
Agenda Item No. 4 Attachment
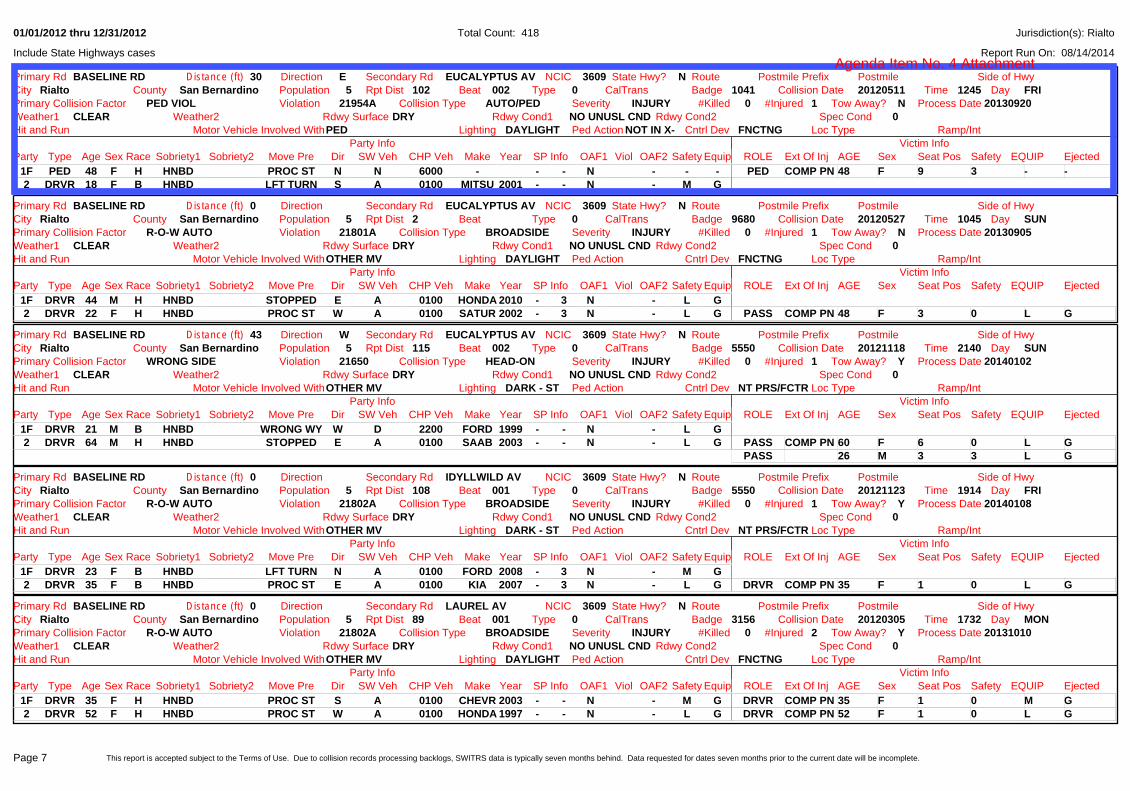
01/01/2012 thru 12/31/2012
Report Run On: 08/14/2014
Total Count: 418
Include State Highways cases
Jurisdiction(s): Rialto
Primary Rd BASELINE RD Distance (ft) 30 Direction E Secondary Rd EUCALYPTUS AV NCIC 3609 State Hwy? N Route Postmile Prefix Postmile Side of HwyCity Rialto County San Bernardino Population 5 Rpt Dist 102 Beat 002 Type 0 CalTrans Badge 1041 Collision Date 20120511 Time 1245 Day FRIPrimary Collision Factor PED VIOL Violation 21954A Collision Type AUTO/PED Severity INJURY #Killed 0 #Injured 1 Tow Away? N Process Date 20130920Weather1 CLEAR Weather2 Rdwy Surface DRY Rdwy Cond1 NO UNUSL CND Rdwy Cond2 Spec Cond 0Hit and Run Motor Vehicle Involved WithPED Lighting DAYLIGHT Ped Action NOT IN X- Cntrl Dev FNCTNG Loc Type Ramp/Int
1F PED 48 F H HNBD PROC ST N N 6000 - - - N - - - PED COMP PN 48 F 9 3 - -2 DRVR 18 F B HNBD LFT TURN S A 0100 MITSU 2001 - - N - M G
Party InfoParty Type Age Sex Race Sobriety1 Sobriety2 Move Pre Dir SW Veh CHP Veh Make Year SP Info OAF1 Viol OAF2 Safety Equip ROLE Ext Of Inj AGE Sex Seat Pos Safety EQUIP Ejected
Victim Info
Primary Rd BASELINE RD Distance (ft) 0 Direction Secondary Rd EUCALYPTUS AV NCIC 3609 State Hwy? N Route Postmile Prefix Postmile Side of HwyCity Rialto County San Bernardino Population 5 Rpt Dist 2 Beat Type 0 CalTrans Badge 9680 Collision Date 20120527 Time 1045 Day SUNPrimary Collision Factor R-O-W AUTO Violation 21801A Collision Type BROADSIDE Severity INJURY #Killed 0 #Injured 1 Tow Away? N Process Date 20130905Weather1 CLEAR Weather2 Rdwy Surface DRY Rdwy Cond1 NO UNUSL CND Rdwy Cond2 Spec Cond 0Hit and Run Motor Vehicle Involved WithOTHER MV Lighting DAYLIGHT Ped Action Cntrl Dev FNCTNG Loc Type Ramp/Int
1F DRVR 44 M H HNBD STOPPED E A 0100 HONDA 2010 - 3 N - L G2 DRVR 22 F H HNBD PROC ST W A 0100 SATUR 2002 - 3 N - L G PASS COMP PN 48 F 3 0 L G
Party InfoParty Type Age Sex Race Sobriety1 Sobriety2 Move Pre Dir SW Veh CHP Veh Make Year SP Info OAF1 Viol OAF2 Safety Equip ROLE Ext Of Inj AGE Sex Seat Pos Safety EQUIP Ejected
Victim Info
Primary Rd BASELINE RD Distance (ft) 43 Direction W Secondary Rd EUCALYPTUS AV NCIC 3609 State Hwy? N Route Postmile Prefix Postmile Side of HwyCity Rialto County San Bernardino Population 5 Rpt Dist 115 Beat 002 Type 0 CalTrans Badge 5550 Collision Date 20121118 Time 2140 Day SUNPrimary Collision Factor WRONG SIDE Violation 21650 Collision Type HEAD-ON Severity INJURY #Killed 0 #Injured 1 Tow Away? Y Process Date 20140102Weather1 CLEAR Weather2 Rdwy Surface DRY Rdwy Cond1 NO UNUSL CND Rdwy Cond2 Spec Cond 0Hit and Run Motor Vehicle Involved WithOTHER MV Lighting DARK - ST Ped Action Cntrl Dev NT PRS/FCTR Loc Type Ramp/Int
1F DRVR 21 M B HNBD WRONG WY W D 2200 FORD 1999 - - N - L G2 DRVR 64 M H HNBD STOPPED E A 0100 SAAB 2003 - - N - L G PASS COMP PN 60 F 6 0 L G
PASS 26 M 3 3 L G
Party InfoParty Type Age Sex Race Sobriety1 Sobriety2 Move Pre Dir SW Veh CHP Veh Make Year SP Info OAF1 Viol OAF2 Safety Equip ROLE Ext Of Inj AGE Sex Seat Pos Safety EQUIP Ejected
Victim Info
Primary Rd BASELINE RD Distance (ft) 0 Direction Secondary Rd IDYLLWILD AV NCIC 3609 State Hwy? N Route Postmile Prefix Postmile Side of HwyCity Rialto County San Bernardino Population 5 Rpt Dist 108 Beat 001 Type 0 CalTrans Badge 5550 Collision Date 20121123 Time 1914 Day FRIPrimary Collision Factor R-O-W AUTO Violation 21802A Collision Type BROADSIDE Severity INJURY #Killed 0 #Injured 1 Tow Away? Y Process Date 20140108Weather1 CLEAR Weather2 Rdwy Surface DRY Rdwy Cond1 NO UNUSL CND Rdwy Cond2 Spec Cond 0Hit and Run Motor Vehicle Involved WithOTHER MV Lighting DARK - ST Ped Action Cntrl Dev NT PRS/FCTR Loc Type Ramp/Int
1F DRVR 23 F B HNBD LFT TURN N A 0100 FORD 2008 - 3 N - M G2 DRVR 35 F B HNBD PROC ST E A 0100 KIA 2007 - 3 N - L G DRVR COMP PN 35 F 1 0 L G
Party InfoParty Type Age Sex Race Sobriety1 Sobriety2 Move Pre Dir SW Veh CHP Veh Make Year SP Info OAF1 Viol OAF2 Safety Equip ROLE Ext Of Inj AGE Sex Seat Pos Safety EQUIP Ejected
Victim Info
Primary Rd BASELINE RD Distance (ft) 0 Direction Secondary Rd LAUREL AV NCIC 3609 State Hwy? N Route Postmile Prefix Postmile Side of HwyCity Rialto County San Bernardino Population 5 Rpt Dist 89 Beat 001 Type 0 CalTrans Badge 3156 Collision Date 20120305 Time 1732 Day MONPrimary Collision Factor R-O-W AUTO Violation 21802A Collision Type BROADSIDE Severity INJURY #Killed 0 #Injured 2 Tow Away? Y Process Date 20131010Weather1 CLEAR Weather2 Rdwy Surface DRY Rdwy Cond1 NO UNUSL CND Rdwy Cond2 Spec Cond 0Hit and Run Motor Vehicle Involved WithOTHER MV Lighting DAYLIGHT Ped Action Cntrl Dev FNCTNG Loc Type Ramp/Int
1F DRVR 35 F H HNBD PROC ST S A 0100 CHEVR 2003 - - N - M G DRVR COMP PN 35 F 1 0 M G2 DRVR 52 F H HNBD PROC ST W A 0100 HONDA 1997 - - N - L G DRVR COMP PN 52 F 1 0 L G
Party InfoParty Type Age Sex Race Sobriety1 Sobriety2 Move Pre Dir SW Veh CHP Veh Make Year SP Info OAF1 Viol OAF2 Safety Equip ROLE Ext Of Inj AGE Sex Seat Pos Safety EQUIP Ejected
Victim Info
Page 7 This report is accepted subject to the Terms of Use. Due to collision records processing backlogs, SWITRS data is typically seven months behind. Data requested for dates seven months prior to the current date will be incomplete.
Agenda Item No. 4 Attachment

01/01/2012 thru 12/31/2012
Report Run On: 08/14/2014
Total Count: 418
Include State Highways cases
Jurisdiction(s): Rialto
Primary Rd BASELINE RD Distance (ft) 0 Direction Secondary Rd MERIDIAN AV NCIC 3609 State Hwy? N Route Postmile Prefix Postmile Side of HwyCity Rialto County San Bernardino Population 5 Rpt Dist 116 Beat 116 Type 0 CalTrans Badge 5550 Collision Date 20121202 Time 2320 Day SUNPrimary Collision Factor DRVR ALC|DRG Violation 23152A Collision Type BROADSIDE Severity INJURY #Killed 0 #Injured 3 Tow Away? Y Process Date 20140116Weather1 RAINING Weather2 Rdwy Surface WET Rdwy Cond1 NO UNUSL CND Rdwy Cond2 Spec Cond 0Hit and Run Motor Vehicle Involved WithOTHER MV Lighting DARK - ST Ped Action Cntrl Dev FNCTNG Loc Type Ramp/Int
1F DRVR 25 M H HBD-UI DRUG PROC ST E A 0700 FORD 1992 - 3 A 21453 - P H DRVR COMP PN 25 M 1 0 P H2 DRVR 43 M H HNBD LFT TURN S A 0800 TOYOT 2005 - 3 N - L G PASS COMP PN 42 F 3 0 L G
PASS COMP PN 10 M 6 0 M G
Party InfoParty Type Age Sex Race Sobriety1 Sobriety2 Move Pre Dir SW Veh CHP Veh Make Year SP Info OAF1 Viol OAF2 Safety Equip ROLE Ext Of Inj AGE Sex Seat Pos Safety EQUIP Ejected
Victim Info
Primary Rd BASELINE RD Distance (ft) 230 Direction W Secondary Rd PEPPER AV NCIC 3609 State Hwy? N Route Postmile Prefix Postmile Side of HwyCity Rialto County San Bernardino Population 5 Rpt Dist 103 Beat 002 Type 0 CalTrans Badge 5550 Collision Date 20120127 Time 0328 Day FRIPrimary Collision Factor STOP SGN|SIG Violation 21453A Collision Type HIT OBJECT Severity INJURY #Killed 0 #Injured 1 Tow Away? Y Process Date 20130624Weather1 CLEAR Weather2 Rdwy Surface DRY Rdwy Cond1 NO UNUSL CND Rdwy Cond2 Spec Cond 0Hit and Run Motor Vehicle Involved WithFIXED OBJ Lighting DARK - ST Ped Action Cntrl Dev FNCTNG Loc Type Ramp/Int
1F DRVR 34 M B IMP UNK IMP UNK PROC ST W A 0100 CHRYS 2008 - - A 22350 - M G DRVR SEVERE 34 M 1 0 M G
Party InfoParty Type Age Sex Race Sobriety1 Sobriety2 Move Pre Dir SW Veh CHP Veh Make Year SP Info OAF1 Viol OAF2 Safety Equip ROLE Ext Of Inj AGE Sex Seat Pos Safety EQUIP Ejected
Victim Info
Primary Rd BASELINE RD Distance (ft) 0 Direction Secondary Rd PEPPER AV NCIC 3609 State Hwy? N Route Postmile Prefix Postmile Side of HwyCity Rialto County San Bernardino Population 5 Rpt Dist 103 Beat 002 Type 0 CalTrans Badge 1041 Collision Date 20120614 Time 0853 Day THUPrimary Collision Factor WRONG SIDE Violation 216501 Collision Type BROADSIDE Severity INJURY #Killed 0 #Injured 1 Tow Away? N Process Date 20131015Weather1 CLEAR Weather2 Rdwy Surface DRY Rdwy Cond1 NO UNUSL CND Rdwy Cond2 Spec Cond 0Hit and Run Motor Vehicle Involved WithBICYCLE Lighting DAYLIGHT Ped Action Cntrl Dev FNCTNG Loc Type Ramp/Int
1F BICY 53 F W HNBD ENT TRAF W L 0400 - - - N - - - BICY COMP PN 53 F 1 3 P V2 DRVR 30 F H HNBD RGT TURN N A 0100 CHEVR 2003 - - N - M G PASS 10 M 3 3 M G
Party InfoParty Type Age Sex Race Sobriety1 Sobriety2 Move Pre Dir SW Veh CHP Veh Make Year SP Info OAF1 Viol OAF2 Safety Equip ROLE Ext Of Inj AGE Sex Seat Pos Safety EQUIP Ejected
Victim Info
Primary Rd BASELINE RD Distance (ft) 0 Direction Secondary Rd PEPPER AV NCIC 3609 State Hwy? N Route Postmile Prefix Postmile Side of HwyCity Rialto County San Bernardino Population 5 Rpt Dist 116 Beat 002 Type 0 CalTrans Badge 3156 Collision Date 20120716 Time 1703 Day MONPrimary Collision Factor UNKNOWN Violation Collision Type BROADSIDE Severity INJURY #Killed 0 #Injured 1 Tow Away? Y Process Date 20131031Weather1 CLEAR Weather2 Rdwy Surface DRY Rdwy Cond1 NO UNUSL CND Rdwy Cond2 Spec Cond 0Hit and Run Motor Vehicle Involved WithOTHER MV Lighting DAYLIGHT Ped Action Cntrl Dev FNCTNG Loc Type Ramp/Int
1 DRVR 36 F H HNBD PROC ST E A 0800 NISSA 1997 - - N - L G2 DRVR 35 M H HNBD PROC ST S A 0700 FORD 2002 - - N - L G DRVR OTH VIS 35 M 1 0 L G
Party InfoParty Type Age Sex Race Sobriety1 Sobriety2 Move Pre Dir SW Veh CHP Veh Make Year SP Info OAF1 Viol OAF2 Safety Equip ROLE Ext Of Inj AGE Sex Seat Pos Safety EQUIP Ejected
Victim Info
Primary Rd BASELINE RD Distance (ft) 0 Direction Secondary Rd PEPPER AV NCIC 3609 State Hwy? N Route Postmile Prefix Postmile Side of HwyCity Rialto County San Bernardino Population 5 Rpt Dist 116 Beat 002 Type 0 CalTrans Badge 7274 Collision Date 20121212 Time 1423 Day WEDPrimary Collision Factor NOT STATED Violation Collision Type HEAD-ON Severity INJURY #Killed 0 #Injured 4 Tow Away? N Process Date 20140111Weather1 CLOUDY Weather2 Rdwy Surface DRY Rdwy Cond1 NO UNUSL CND Rdwy Cond2 Spec Cond 0Hit and Run Motor Vehicle Involved WithOTHER MV Lighting DAYLIGHT Ped Action Cntrl Dev FNCTNG Loc Type Ramp/Int
1F DRVR 23 M B HNBD LFT TURN W B 0101 NISSA 2004 - - N - M G DRVR COMP PN 23 M 1 0 M G2 DRVR 32 F H HNBD PROC ST E B 0101 DODGE 2000 - - N - L G DRVR COMP PN 32 F 1 0 L G
PASS COMP PN 75 F 3 0 L GPASS COMP PN 3 F 4 0 P Q
Party InfoParty Type Age Sex Race Sobriety1 Sobriety2 Move Pre Dir SW Veh CHP Veh Make Year SP Info OAF1 Viol OAF2 Safety Equip ROLE Ext Of Inj AGE Sex Seat Pos Safety EQUIP Ejected
Victim Info
Page 9 This report is accepted subject to the Terms of Use. Due to collision records processing backlogs, SWITRS data is typically seven months behind. Data requested for dates seven months prior to the current date will be incomplete.
Agenda Item No. 4 Attachment

01/01/2012 thru 12/31/2012
Report Run On: 08/14/2014
Total Count: 418
Include State Highways cases
Jurisdiction(s): Rialto
Primary Rd BASELINE RD Distance (ft) 600 Direction E Secondary Rd RIVERSIDE AV NCIC 3609 State Hwy? N Route Postmile Prefix Postmile Side of HwyCity Rialto County San Bernardino Population 5 Rpt Dist 099 Beat 002 Type 0 CalTrans Badge 0510 Collision Date 20120906 Time 2106 Day THUPrimary Collision Factor PED VIOL Violation 21955 Collision Type AUTO/PED Severity INJURY #Killed 0 #Injured 1 Tow Away? N Process Date 20131206Weather1 CLEAR Weather2 Rdwy Surface DRY Rdwy Cond1 NO UNUSL CND Rdwy Cond2 Spec Cond 0Hit and Run Motor Vehicle Involved WithPED Lighting DARK - ST Ped Action X-WLK NT Cntrl Dev FNCTNG Loc Type Ramp/Int
1F DRVR 35 F H HNBD PROC ST W A 0100 NISSA 2003 - - N - M G PASS 8 F 3 3 M G2 PED 54 M B HBD-UI S N 6000 - - - N - - - PED SEVERE 54 M 9 3 - -
Party InfoParty Type Age Sex Race Sobriety1 Sobriety2 Move Pre Dir SW Veh CHP Veh Make Year SP Info OAF1 Viol OAF2 Safety Equip ROLE Ext Of Inj AGE Sex Seat Pos Safety EQUIP Ejected
Victim Info
Primary Rd BASELINE RD Distance (ft) 50 Direction W Secondary Rd RIVERSIDE AV NCIC 3609 State Hwy? N Route Postmile Prefix Postmile Side of HwyCity Rialto County San Bernardino Population 5 Rpt Dist 98 Beat 002 Type 0 CalTrans Badge 3156 Collision Date 20121114 Time 1939 Day WEDPrimary Collision Factor PED VIOL Violation 21950B Collision Type AUTO/PED Severity INJURY #Killed 0 #Injured 1 Tow Away? N Process Date 20140108Weather1 CLEAR Weather2 Rdwy Surface DRY Rdwy Cond1 NO UNUSL CND Rdwy Cond2 Spec Cond 0Hit and Run Motor Vehicle Involved WithPED Lighting DARK - ST Ped Action IN RD, Cntrl Dev FNCTNG Loc Type Ramp/Int
1F PED 19 F W HNBD - N 6000 - - - N - - - PED OTH VIS 19 F 9 3 - -2 DRVR 83 M W HNBD PROC ST W A 0100 TOYOT 2004 - - N - M G
Party InfoParty Type Age Sex Race Sobriety1 Sobriety2 Move Pre Dir SW Veh CHP Veh Make Year SP Info OAF1 Viol OAF2 Safety Equip ROLE Ext Of Inj AGE Sex Seat Pos Safety EQUIP Ejected
Victim Info
Primary Rd BASELINE RD Distance (ft) 110 Direction W Secondary Rd SYCAMORE AV NCIC 3609 State Hwy? N Route Postmile Prefix Postmile Side of HwyCity Rialto County San Bernardino Population 5 Rpt Dist 99 Beat 002 Type 0 CalTrans Badge 1041 Collision Date 20120412 Time 1420 Day THUPrimary Collision Factor R-O-W AUTO Violation 21804A Collision Type BROADSIDE Severity INJURY #Killed 0 #Injured 2 Tow Away? N Process Date 20130824Weather1 CLEAR Weather2 Rdwy Surface DRY Rdwy Cond1 NO UNUSL CND Rdwy Cond2 Spec Cond 0Hit and Run Motor Vehicle Involved WithOTHER MV Lighting DAYLIGHT Ped Action Cntrl Dev NT PRS/FCTR Loc Type Ramp/Int
1F DRVR 32 F H HNBD ENT TRAF N A 0100 NISSA 2003 - - N - M G DRVR COMP PN 32 F 1 0 M GPASS 11 F 3 0 M GPASS 2 F 4 0 P QPASS 7 M 6 0 P G
2 DRVR 20 M B HNBD PROC ST E A 0100 CHEVR 2007 - - N - M G DRVR COMP PN 20 M 1 0 M G
Party InfoParty Type Age Sex Race Sobriety1 Sobriety2 Move Pre Dir SW Veh CHP Veh Make Year SP Info OAF1 Viol OAF2 Safety Equip ROLE Ext Of Inj AGE Sex Seat Pos Safety EQUIP Ejected
Victim Info
Primary Rd BASELINE RD Distance (ft) 0 Direction Secondary Rd SYCAMORE AV NCIC 3609 State Hwy? N Route Postmile Prefix Postmile Side of HwyCity Rialto County San Bernardino Population 5 Rpt Dist 100 Beat 002 Type 0 CalTrans Badge 5550 Collision Date 20121124 Time 1929 Day SATPrimary Collision Factor R-O-W AUTO Violation 21801A Collision Type BROADSIDE Severity INJURY #Killed 0 #Injured 1 Tow Away? Y Process Date 20140108Weather1 CLEAR Weather2 Rdwy Surface DRY Rdwy Cond1 NO UNUSL CND Rdwy Cond2 Spec Cond 0Hit and Run Motor Vehicle Involved WithOTHER MV Lighting DARK - ST Ped Action Cntrl Dev FNCTNG Loc Type Ramp/Int
1F DRVR 23 F H HNBD LFT TURN S A 0100 CHEVR 2004 - - N - M G PASS 31 M 3 3 M G2 DRVR 36 F HNBD PROC ST E A 0100 HONDA 2004 - - N - M G DRVR COMP PN 36 F 1 0 M G
Party InfoParty Type Age Sex Race Sobriety1 Sobriety2 Move Pre Dir SW Veh CHP Veh Make Year SP Info OAF1 Viol OAF2 Safety Equip ROLE Ext Of Inj AGE Sex Seat Pos Safety EQUIP Ejected
Victim Info
Primary Rd BASELINE RD Distance (ft) 0 Direction Secondary Rd TAMARIND AV NCIC 3609 State Hwy? N Route Postmile Prefix Postmile Side of HwyCity Rialto County San Bernardino Population 5 Rpt Dist 86 Beat 001 Type 0 CalTrans Badge 1899 Collision Date 20120611 Time 1806 Day MONPrimary Collision Factor R-O-W AUTO Violation 21801B Collision Type BROADSIDE Severity INJURY #Killed 0 #Injured 2 Tow Away? Y Process Date 20131001Weather1 CLEAR Weather2 Rdwy Surface DRY Rdwy Cond1 NO UNUSL CND Rdwy Cond2 Spec Cond 0Hit and Run FELONY Motor Vehicle Involved WithOTHER MV Lighting DAYLIGHT Ped Action Cntrl Dev NT PRS/FCTR Loc Type Ramp/Int
1F DRVR 998 M H IMP UNK IMP UNK PROC ST W A 0100 HONDA - - A 22350 N - -2 DRVR 50 M B HNBD STOPPED E A 0100 NISSA 2004 - 3 N - L G DRVR OTH VIS 50 M 1 0 L G
Party InfoParty Type Age Sex Race Sobriety1 Sobriety2 Move Pre Dir SW Veh CHP Veh Make Year SP Info OAF1 Viol OAF2 Safety Equip ROLE Ext Of Inj AGE Sex Seat Pos Safety EQUIP Ejected
Victim Info
Page 11 This report is accepted subject to the Terms of Use. Due to collision records processing backlogs, SWITRS data is typically seven months behind. Data requested for dates seven months prior to the current date will be incomplete.
Agenda Item No. 4 Attachment

01/01/2012 thru 12/31/2012
Report Run On: 08/14/2014
Total Count: 418
Include State Highways cases
Jurisdiction(s): Rialto
PASS 85 M 3 3 L GPASS COMP PN 49 F 4 0 L G
Primary Rd BASELINE RD Distance (ft) 0 Direction Secondary Rd TAMARIND AV NCIC 3609 State Hwy? N Route Postmile Prefix Postmile Side of HwyCity Rialto County San Bernardino Population 5 Rpt Dist 087 Beat 001 Type 0 CalTrans Badge 7274 Collision Date 20121011 Time 1511 Day THUPrimary Collision Factor R-O-W AUTO Violation 21802A Collision Type BROADSIDE Severity INJURY #Killed 0 #Injured 1 Tow Away? N Process Date 20131214Weather1 CLOUDY Weather2 Rdwy Surface DRY Rdwy Cond1 NO UNUSL CND Rdwy Cond2 Spec Cond 0Hit and Run Motor Vehicle Involved WithOTHER MV Lighting DAYLIGHT Ped Action Cntrl Dev FNCTNG Loc Type Ramp/Int
1F DRVR 65 F B HNBD PROC ST S A 0800 FORD 1997 - 3 N - M G2 DRVR 42 M H HNBD PROC ST W A 0800 TOYOT 2004 - 3 N - L G DRVR COMP PN 42 M 1 0 L G
Party InfoParty Type Age Sex Race Sobriety1 Sobriety2 Move Pre Dir SW Veh CHP Veh Make Year SP Info OAF1 Viol OAF2 Safety Equip ROLE Ext Of Inj AGE Sex Seat Pos Safety EQUIP Ejected
Victim Info
Primary Rd BASELINE RD Distance (ft) 210 Direction E Secondary Rd WILLOW NCIC 3609 State Hwy? N Route Postmile Prefix Postmile Side of HwyCity Rialto County San Bernardino Population 5 Rpt Dist 97 Beat 002 Type 0 CalTrans Badge 3156 Collision Date 20120320 Time 1709 Day TUEPrimary Collision Factor UNSAFE SPEED Violation 22350 Collision Type REAR END Severity INJURY #Killed 0 #Injured 2 Tow Away? N Process Date 20130813Weather1 CLEAR Weather2 Rdwy Surface DRY Rdwy Cond1 NO UNUSL CND Rdwy Cond2 Spec Cond 0Hit and Run Motor Vehicle Involved WithOTHER MV Lighting DAYLIGHT Ped Action Cntrl Dev NT PRS/FCTR Loc Type Ramp/Int
1F DRVR 57 F H HNBD PROC ST E D 2200 CHEVR 1996 - - N - M G2 DRVR 27 M H HNBD RGT TURN E A 0100 TOYOT 1988 - - N - P G DRVR COMP PN 27 M 1 0 P G
PASS COMP PN 67 M 3 0 P GPASS 4 M 4 3 P QPASS 6 F 5 3 P GPASS 27 - 6 3 P G
Party InfoParty Type Age Sex Race Sobriety1 Sobriety2 Move Pre Dir SW Veh CHP Veh Make Year SP Info OAF1 Viol OAF2 Safety Equip ROLE Ext Of Inj AGE Sex Seat Pos Safety EQUIP Ejected
Victim Info
Primary Rd BASELINE RD Distance (ft) 300 Direction E Secondary Rd WILLOW AV NCIC 3609 State Hwy? N Route Postmile Prefix Postmile Side of HwyCity Rialto County San Bernardino Population 5 Rpt Dist 110 Beat 002 Type 0 CalTrans Badge 0510 Collision Date 20120225 Time 1819 Day SATPrimary Collision Factor DRVR ALC|DRG Violation 23152A Collision Type REAR END Severity INJURY #Killed 0 #Injured 1 Tow Away? N Process Date 20130722Weather1 CLEAR Weather2 Rdwy Surface DRY Rdwy Cond1 NO UNUSL CND Rdwy Cond2 Spec Cond 0Hit and Run Motor Vehicle Involved WithOTHER MV Lighting DARK - ST Ped Action Cntrl Dev FNCTNG Loc Type Ramp/Int
1F DRVR 41 F B HBD-UI PROC ST W A 0100 KIA 2000 - 1 F - M G2 DRVR 41 F B HNBD PROC ST W A 0100 TOYOT 2000 - - N - M G DRVR COMP PN 41 F 1 0 M G
Party InfoParty Type Age Sex Race Sobriety1 Sobriety2 Move Pre Dir SW Veh CHP Veh Make Year SP Info OAF1 Viol OAF2 Safety Equip ROLE Ext Of Inj AGE Sex Seat Pos Safety EQUIP Ejected
Victim Info
Primary Rd BASELINE RD Distance (ft) 590 Direction W Secondary Rd WILLOW AV NCIC 3609 State Hwy? N Route Postmile Prefix Postmile Side of HwyCity Rialto County San Bernardino Population 5 Rpt Dist 97 Beat 001 Type 0 CalTrans Badge 3156 Collision Date 20121126 Time 1614 Day MONPrimary Collision Factor UNSAFE SPEED Violation 22350 Collision Type REAR END Severity INJURY #Killed 0 #Injured 1 Tow Away? N Process Date 20140102Weather1 CLEAR Weather2 Rdwy Surface DRY Rdwy Cond1 NO UNUSL CND Rdwy Cond2 Spec Cond 0Hit and Run Motor Vehicle Involved WithOTHER MV Lighting DAYLIGHT Ped Action Cntrl Dev NT PRS/FCTR Loc Type Ramp/Int
1F DRVR 20 M W HNBD PROC ST E C 0200 HARLE 2004 - - N - P W DRVR COMP PN 20 M 1 1 P W2 DRVR 44 M H HNBD PROC ST E A 0100 HONDA 2011 - - N - M G
Party InfoParty Type Age Sex Race Sobriety1 Sobriety2 Move Pre Dir SW Veh CHP Veh Make Year SP Info OAF1 Viol OAF2 Safety Equip ROLE Ext Of Inj AGE Sex Seat Pos Safety EQUIP Ejected
Victim Info
Page 12 This report is accepted subject to the Terms of Use. Due to collision records processing backlogs, SWITRS data is typically seven months behind. Data requested for dates seven months prior to the current date will be incomplete.
Agenda Item No. 4 Attachment

01/01/2012 thru 12/31/2012
Report Run On: 08/14/2014
Total Count: 418
Include State Highways cases
Jurisdiction(s): Rialto
Primary Rd CEDAR AV Distance (ft) 441 Direction N Secondary Rd FOOTHILL BL NCIC 3609 State Hwy? N Route Postmile Prefix Postmile Side of HwyCity Rialto County San Bernardino Population 5 Rpt Dist 121 Beat 001 Type 0 CalTrans Badge 2517 Collision Date 20120825 Time 1205 Day SATPrimary Collision Factor R-O-W AUTO Violation 21804A Collision Type BROADSIDE Severity INJURY #Killed 0 #Injured 2 Tow Away? N Process Date 20131120Weather1 CLEAR Weather2 Rdwy Surface DRY Rdwy Cond1 NO UNUSL CND Rdwy Cond2 Spec Cond 0Hit and Run Motor Vehicle Involved WithOTHER MV Lighting DAYLIGHT Ped Action Cntrl Dev FNCTNG Loc Type Ramp/Int
1F DRVR 19 F B HNBD ENT TRAF E A 0100 NISSA 2005 - - A 21804 - M G2 DRVR 21 M HNBD PROC ST S A 0100 NISSA 2012 - - - - L G DRVR OTH VIS 21 M 1 0 L G
PASS OTH VIS 19 F 3 0 L G3 DRVR 26 M B HNBD STOPPED N A 0100 LEXUS 1991 - - - - M G
Party InfoParty Type Age Sex Race Sobriety1 Sobriety2 Move Pre Dir SW Veh CHP Veh Make Year SP Info OAF1 Viol OAF2 Safety Equip ROLE Ext Of Inj AGE Sex Seat Pos Safety EQUIP Ejected
Victim Info
Primary Rd CEDAR AV Distance (ft) 253 Direction N Secondary Rd FOOTHILL BL NCIC 3609 State Hwy? N Route Postmile Prefix Postmile Side of HwyCity Rialto County San Bernardino Population 5 Rpt Dist 132 Beat 001 Type 0 CalTrans Badge 9133 Collision Date 20120905 Time 1955 Day WEDPrimary Collision Factor DRVR ALC|DRG Violation 23152A Collision Type REAR END Severity INJURY #Killed 0 #Injured 1 Tow Away? N Process Date 20131209Weather1 CLEAR Weather2 Rdwy Surface DRY Rdwy Cond1 NO UNUSL CND Rdwy Cond2 Spec Cond 0Hit and Run Motor Vehicle Involved WithOTHER MV Lighting DARK - ST Ped Action Cntrl Dev FNCTNG Loc Type Ramp/Int
1F DRVR 43 M HBD-UI PROC ST S A 0100 DODGE 2011 - - A 22350 N M G2 DRVR 29 F B HNBD STOPPED S A 0100 MITSU 1995 - - N - L G DRVR OTH VIS 29 F 1 0 L G3 DRVR 21 F H HNBD STOPPED S A 0100 TOYOT 2000 - - N - M G4 DRVR 48 F H null S A 0700 NISSA 2011 - - - - M G PASS 25 M 6 3 M G
PASS 12 F 4 3 M G
Party InfoParty Type Age Sex Race Sobriety1 Sobriety2 Move Pre Dir SW Veh CHP Veh Make Year SP Info OAF1 Viol OAF2 Safety Equip ROLE Ext Of Inj AGE Sex Seat Pos Safety EQUIP Ejected
Victim Info
Primary Rd CEDAR AV Distance (ft) 6 Direction S Secondary Rd GROVE ST NCIC 3609 State Hwy? N Route Postmile Prefix Postmile Side of HwyCity Rialto County San Bernardino Population 5 Rpt Dist 121 Beat 001 Type 0 CalTrans Badge 6367 Collision Date 20120927 Time 2007 Day THUPrimary Collision Factor UNSAFE SPEED Violation 22350 Collision Type REAR END Severity PDO #Killed 0 #Injured 0 Tow Away? N Process Date 20140312Weather1 CLEAR Weather2 Rdwy Surface DRY Rdwy Cond1 NO UNUSL CND Rdwy Cond2 Spec Cond 0Hit and Run MSDMNR Motor Vehicle Involved WithOTHER MV Lighting DARK - ST Ped Action Cntrl Dev FNCTNG Loc Type Ramp/Int
1F DRVR 998 - IMP UNK IMP UNK PROC ST - A 0100 FORD 2000 - - O - - -2 DRVR 35 M H HNBD SLOWING N A 0100 DODGE 2009 - - - - M G
Party InfoParty Type Age Sex Race Sobriety1 Sobriety2 Move Pre Dir SW Veh CHP Veh Make Year SP Info OAF1 Viol OAF2 Safety Equip ROLE Ext Of Inj AGE Sex Seat Pos Safety EQUIP Ejected
Victim Info
Primary Rd CEDAR AV Distance (ft) 138 Direction S Secondary Rd HAWTHORNE AV NCIC 3609 State Hwy? N Route Postmile Prefix Postmile Side of HwyCity Rialto County San Bernardino Population 5 Rpt Dist 167 Beat 003 Type 0 CalTrans Badge 1041 Collision Date 20120928 Time 1454 Day FRIPrimary Collision Factor UNSAFE SPEED Violation 22350 Collision Type REAR END Severity INJURY #Killed 0 #Injured 1 Tow Away? Y Process Date 20131210Weather1 CLEAR Weather2 Rdwy Surface DRY Rdwy Cond1 NO UNUSL CND Rdwy Cond2 Spec Cond 0Hit and Run Motor Vehicle Involved WithOTHER MV Lighting DAYLIGHT Ped Action Cntrl Dev FNCTNG Loc Type Ramp/Int
1F DRVR 33 F B HNBD SLOWING N A 0100 MITSU 2008 - - N - M G DRVR COMP PN 33 F 1 3 M G2 DRVR 19 F H HNBD STOPPED N A 0100 HONDA 2005 - - N - M G3 DRVR 45 F O HNBD STOPPED N A 0100 DODGE 2010 - - N - M G
Party InfoParty Type Age Sex Race Sobriety1 Sobriety2 Move Pre Dir SW Veh CHP Veh Make Year SP Info OAF1 Viol OAF2 Safety Equip ROLE Ext Of Inj AGE Sex Seat Pos Safety EQUIP Ejected
Victim Info
Page 21 This report is accepted subject to the Terms of Use. Due to collision records processing backlogs, SWITRS data is typically seven months behind. Data requested for dates seven months prior to the current date will be incomplete.
Agenda Item No. 4 Attachment
01/01/2012 thru 12/31/2012
Report Run On: 08/14/2014
Total Count: 418
Include State Highways cases
Jurisdiction(s): Rialto
Primary Rd FOOTHILL BL Distance (ft) 17 Direction E Secondary Rd OLIVE AV NCIC 3609 State Hwy? N Route Postmile Prefix Postmile Side of HwyCity Rialto County San Bernardino Population 5 Rpt Dist 127 Beat 004 Type 0 CalTrans Badge 7379 Collision Date 20120218 Time 1831 Day SATPrimary Collision Factor IMPROP TURN Violation 22107 Collision Type REAR END Severity INJURY #Killed 0 #Injured 1 Tow Away? N Process Date 20130919Weather1 CLEAR Weather2 Rdwy Surface DRY Rdwy Cond1 NO UNUSL CND Rdwy Cond2 Spec Cond 0Hit and Run Motor Vehicle Involved WithBICYCLE Lighting DARK - ST Ped Action Cntrl Dev NT PRS/FCTR Loc Type Ramp/Int
1F BICY 20 M W HNBD MERGING W L 0400 - - - - - - - BICY SEVERE 20 M 1 1 P V2 DRVR 55 M B HNBD PROC ST W A 0100 TOYOT 1989 - - - - M G
Party InfoParty Type Age Sex Race Sobriety1 Sobriety2 Move Pre Dir SW Veh CHP Veh Make Year SP Info OAF1 Viol OAF2 Safety Equip ROLE Ext Of Inj AGE Sex Seat Pos Safety EQUIP Ejected
Victim Info
Primary Rd FOOTHILL BL Distance (ft) 21 Direction W Secondary Rd PALM AV NCIC 3609 State Hwy? N Route Postmile Prefix Postmile Side of HwyCity Rialto County San Bernardino Population 5 Rpt Dist 126 Beat 004 Type 0 CalTrans Badge 1186 Collision Date 20120111 Time 1504 Day WEDPrimary Collision Factor R-O-W AUTO Violation 21802A Collision Type SIDESWIPE Severity INJURY #Killed 0 #Injured 1 Tow Away? Y Process Date 20130612Weather1 CLEAR Weather2 Rdwy Surface DRY Rdwy Cond1 NO UNUSL CND Rdwy Cond2 Spec Cond 0Hit and Run Motor Vehicle Involved WithOTHER MV Lighting DAYLIGHT Ped Action Cntrl Dev FNCTNG Loc Type Ramp/Int
1F DRVR 23 M W HNBD LFT TURN N A 0100 HONDA 1990 - 3 N - M G DRVR OTH VIS 23 M 1 0 M G2 DRVR 22 M B HNBD PROC ST E A 0100 BUICK 1995 - 3 N - M G
Party InfoParty Type Age Sex Race Sobriety1 Sobriety2 Move Pre Dir SW Veh CHP Veh Make Year SP Info OAF1 Viol OAF2 Safety Equip ROLE Ext Of Inj AGE Sex Seat Pos Safety EQUIP Ejected
Victim Info
Primary Rd FOOTHILL BL Distance (ft) 0 Direction Secondary Rd PEPPER AV NCIC 3609 State Hwy? N Route Postmile Prefix Postmile Side of HwyCity Rialto County San Bernardino Population 5 Rpt Dist 130 Beat 003 Type 0 CalTrans Badge 1186 Collision Date 20120215 Time 1231 Day WEDPrimary Collision Factor R-O-W AUTO Violation 21801A Collision Type BROADSIDE Severity INJURY #Killed 0 #Injured 3 Tow Away? N Process Date 20130709Weather1 RAINING Weather2 Rdwy Surface WET Rdwy Cond1 NO UNUSL CND Rdwy Cond2 Spec Cond 0Hit and Run Motor Vehicle Involved WithOTHER MV Lighting DAYLIGHT Ped Action Cntrl Dev FNCTNG Loc Type Ramp/Int
1F DRVR 39 F HNBD LFT TURN N A 0100 NISSA 2007 - 3 N - L G DRVR COMP PN 39 F 1 0 L G2 DRVR 76 M B HNBD PROC ST S A 0700 NISSA 2005 - 3 N - L G PASS COMP PN 74 F 3 0 M G
PASS 16 F 6 0 M GPASS OTH VIS 3 M 4 0 M U
Party InfoParty Type Age Sex Race Sobriety1 Sobriety2 Move Pre Dir SW Veh CHP Veh Make Year SP Info OAF1 Viol OAF2 Safety Equip ROLE Ext Of Inj AGE Sex Seat Pos Safety EQUIP Ejected
Victim Info
Primary Rd FOOTHILL BL Distance (ft) 300 Direction W Secondary Rd PEPPER AV NCIC 3609 State Hwy? N Route Postmile Prefix Postmile Side of HwyCity Rialto County San Bernardino Population 5 Rpt Dist 130 Beat 002 Type 0 CalTrans Badge 3322 Collision Date 20120323 Time 2217 Day FRIPrimary Collision Factor R-O-W AUTO Violation 21801A Collision Type BROADSIDE Severity INJURY #Killed 0 #Injured 1 Tow Away? Y Process Date 20130729Weather1 CLEAR Weather2 Rdwy Surface DRY Rdwy Cond1 NO UNUSL CND Rdwy Cond2 Spec Cond 0Hit and Run Motor Vehicle Involved WithOTHER MV Lighting DARK - ST Ped Action Cntrl Dev FNCTNG Loc Type Ramp/Int
1F DRVR 49 F B HNBD LFT TURN S A 0700 GMC 1991 - - N - M G PASS 65 M 3 0 P GPASS COMP PN 13 F 6 0 P G
2 DRVR 23 M H HNBD PROC ST E A 0100 HONDA 1998 - - N - L G
Party InfoParty Type Age Sex Race Sobriety1 Sobriety2 Move Pre Dir SW Veh CHP Veh Make Year SP Info OAF1 Viol OAF2 Safety Equip ROLE Ext Of Inj AGE Sex Seat Pos Safety EQUIP Ejected
Victim Info
Primary Rd FOOTHILL BL Distance (ft) 0 Direction Secondary Rd PEPPER AV NCIC 3609 State Hwy? N Route Postmile Prefix Postmile Side of HwyCity Rialto County San Bernardino Population 5 Rpt Dist 510 Beat 004 Type 0 CalTrans Badge 6137 Collision Date 20121007 Time 1222 Day SUNPrimary Collision Factor IMPROP TURN Violation 22107 Collision Type HEAD-ON Severity INJURY #Killed 0 #Injured 2 Tow Away? N Process Date 20131214Weather1 CLEAR Weather2 Rdwy Surface DRY Rdwy Cond1 NO UNUSL CND Rdwy Cond2 Spec Cond 0Hit and Run Motor Vehicle Involved WithOTHER MV Lighting DAYLIGHT Ped Action Cntrl Dev FNCTNG Loc Type Ramp/Int
1F DRVR 23 M H HNBD LFT TURN N A 0100 FORD - - - - L G DRVR COMP PN 23 M 1 0 L G2 DRVR 21 F H HNBD PROC ST S A 0100 FORD 2005 - - - - L G DRVR COMP PN 21 F 1 0 L G
Party InfoParty Type Age Sex Race Sobriety1 Sobriety2 Move Pre Dir SW Veh CHP Veh Make Year SP Info OAF1 Viol OAF2 Safety Equip ROLE Ext Of Inj AGE Sex Seat Pos Safety EQUIP Ejected
Victim Info
Page 33 This report is accepted subject to the Terms of Use. Due to collision records processing backlogs, SWITRS data is typically seven months behind. Data requested for dates seven months prior to the current date will be incomplete.
Agenda Item No. 4 Attachment
01/01/2012 thru 12/31/2012
Report Run On: 08/14/2014
Total Count: 418
Include State Highways cases
Jurisdiction(s): Rialto
Primary Rd LILAC AV Distance (ft) 0 Direction Secondary Rd RIALTO AV NCIC 3609 State Hwy? N Route Postmile Prefix Postmile Side of HwyCity Rialto County San Bernardino Population 5 Rpt Dist 136 Beat 004 Type 0 CalTrans Badge 2803 Collision Date 20120510 Time 1706 Day THUPrimary Collision Factor R-O-W AUTO Violation 21802B Collision Type BROADSIDE Severity INJURY #Killed 0 #Injured 1 Tow Away? N Process Date 20140102Weather1 CLEAR Weather2 Rdwy Surface DRY Rdwy Cond1 Rdwy Cond2 Spec Cond 0Hit and Run Motor Vehicle Involved WithOTHER MV Lighting DAYLIGHT Ped Action Cntrl Dev Loc Type Ramp/Int
1 DRVR 28 M H PROC ST N A 0100 HONDA 2002 - - A 21802 - M G2 DRVR 30 F B PROC ST E A 0100 FORD 2012 - - A 21802 - M G3 DRVR 33 F H STOPPED W A 0100 HONDA 2001 - - - - M B DRVR COMP PN 33 F 1 3 M B
Party InfoParty Type Age Sex Race Sobriety1 Sobriety2 Move Pre Dir SW Veh CHP Veh Make Year SP Info OAF1 Viol OAF2 Safety Equip ROLE Ext Of Inj AGE Sex Seat Pos Safety EQUIP Ejected
Victim Info
Primary Rd LILAC AV Distance (ft) 0 Direction Secondary Rd SHAMROCK ST NCIC 3609 State Hwy? N Route Postmile Prefix Postmile Side of HwyCity Rialto County San Bernardino Population 5 Rpt Dist 605 Beat 001 Type 0 CalTrans Badge 6137 Collision Date 20120304 Time 1804 Day SUNPrimary Collision Factor IMPROP TURN Violation 22107 Collision Type BROADSIDE Severity INJURY #Killed 0 #Injured 1 Tow Away? N Process Date 20130729Weather1 CLEAR Weather2 Rdwy Surface DRY Rdwy Cond1 NO UNUSL CND Rdwy Cond2 Spec Cond 0Hit and Run Motor Vehicle Involved WithOTHER MV Lighting DARK - ST Ped Action Cntrl Dev FNCTNG Loc Type Ramp/Int
1F DRVR 59 M H HNBD LFT TURN N D 2200 CHEVR 2007 - - A 22107 - M G2 DRVR 19 M H HNBD PROC ST S C 0200 SUZUK 2005 - - N - M W DRVR OTH VIS 19 M 1 0 M W
Party InfoParty Type Age Sex Race Sobriety1 Sobriety2 Move Pre Dir SW Veh CHP Veh Make Year SP Info OAF1 Viol OAF2 Safety Equip ROLE Ext Of Inj AGE Sex Seat Pos Safety EQUIP Ejected
Victim Info
Primary Rd LINDEN AV Distance (ft) 25 Direction N Secondary Rd 2ND ST NCIC 3609 State Hwy? N Route Postmile Prefix Postmile Side of HwyCity Rialto County San Bernardino Population 5 Rpt Dist 131 Beat 003 Type 0 CalTrans Badge 3156 Collision Date 20121116 Time 2140 Day FRIPrimary Collision Factor DRVR ALC|DRG Violation 23152A Collision Type SIDESWIPE Severity PDO #Killed 0 #Injured 0 Tow Away? N Process Date 20140509Weather1 CLEAR Weather2 Rdwy Surface DRY Rdwy Cond1 NO UNUSL CND Rdwy Cond2 Spec Cond 0Hit and Run MSDMNR Motor Vehicle Involved WithPKD MV Lighting DARK - ST Ped Action Cntrl Dev NT PRS/FCTR Loc Type Ramp/Int
1F DRVR 38 M B HBD-UI UNS TURN N A 0100 FORD 1994 - - A 22107 - M B2 PRKD 998 - PARKED N D 2200 FORD 1984 - - N - - -
Party InfoParty Type Age Sex Race Sobriety1 Sobriety2 Move Pre Dir SW Veh CHP Veh Make Year SP Info OAF1 Viol OAF2 Safety Equip ROLE Ext Of Inj AGE Sex Seat Pos Safety EQUIP Ejected
Victim Info
Primary Rd LINDEN AV Distance (ft) 0 Direction Secondary Rd ATHOL AV NCIC 3609 State Hwy? N Route Postmile Prefix Postmile Side of HwyCity Rialto County San Bernardino Population 5 Rpt Dist 154 Beat 003 Type 0 CalTrans Badge 7274 Collision Date 20121004 Time 1743 Day THUPrimary Collision Factor WRONG SIDE Violation 216501 Collision Type BROADSIDE Severity INJURY #Killed 0 #Injured 1 Tow Away? N Process Date 20131214Weather1 CLEAR Weather2 Rdwy Surface DRY Rdwy Cond1 NO UNUSL CND Rdwy Cond2 Spec Cond 0Hit and Run Motor Vehicle Involved WithBICYCLE Lighting DAYLIGHT Ped Action Cntrl Dev FNCTNG Loc Type Ramp/Int
1F BICY 7 M H HNBD PROC ST E L 0400 - - - A 21650 N - - BICY OTH VIS 7 M 1 0 P V2 DRVR 39 F H HNBD PROC ST S A 0700 FORD 2000 - 3 N - M G
Party InfoParty Type Age Sex Race Sobriety1 Sobriety2 Move Pre Dir SW Veh CHP Veh Make Year SP Info OAF1 Viol OAF2 Safety Equip ROLE Ext Of Inj AGE Sex Seat Pos Safety EQUIP Ejected
Victim Info
Primary Rd LINDEN AV Distance (ft) 240 Direction N Secondary Rd FIXED FIRE NCIC 3609 State Hwy? N Route Postmile Prefix Postmile Side of HwyCity Rialto County San Bernardino Population 5 Rpt Dist 052 Beat 001 Type 0 CalTrans Badge 7274 Collision Date 20121206 Time 0708 Day THUPrimary Collision Factor R-O-W AUTO Violation 21804A Collision Type BROADSIDE Severity INJURY #Killed 0 #Injured 1 Tow Away? N Process Date 20140111Weather1 FOG Weather2 Rdwy Surface WET Rdwy Cond1 NO UNUSL CND Rdwy Cond2 Spec Cond 0Hit and Run Motor Vehicle Involved WithOTHER MV Lighting DAYLIGHT Ped Action IN RD, Cntrl Dev NT PRS/FCTR Loc Type Ramp/Int
1F DRVR 38 M H HNBD LFT TURN N B 0101 HONDA 1999 - - N - M G2 DRVR 54 F W HNBD PROC ST S B 0101 TOYOT 2001 - - N - M G3 PED 49 M B HNBD S N 6000 - - - N - - - PED COMP PN 49 M 9 3 - -
Party InfoParty Type Age Sex Race Sobriety1 Sobriety2 Move Pre Dir SW Veh CHP Veh Make Year SP Info OAF1 Viol OAF2 Safety Equip ROLE Ext Of Inj AGE Sex Seat Pos Safety EQUIP Ejected
Victim Info
Page 41 This report is accepted subject to the Terms of Use. Due to collision records processing backlogs, SWITRS data is typically seven months behind. Data requested for dates seven months prior to the current date will be incomplete.
Agenda Item No. 4 Attachment
01/01/2012 thru 12/31/2012
Report Run On: 08/14/2014
Total Count: 418
Include State Highways cases
Jurisdiction(s): Rialto
Primary Rd MERRILL Distance (ft) 0 Direction Secondary Rd MAPLE NCIC 3609 State Hwy? N Route Postmile Prefix Postmile Side of HwyCity Rialto County San Bernardino Population 5 Rpt Dist 143 Beat 003 Type 0 CalTrans Badge 8717 Collision Date 20120126 Time 0750 Day THUPrimary Collision Factor NOT STATED Violation Collision Type AUTO/PED Severity INJURY #Killed 0 #Injured 1 Tow Away? N Process Date 20130613Weather1 CLEAR Weather2 Rdwy Surface DRY Rdwy Cond1 NO UNUSL CND Rdwy Cond2 Spec Cond 0Hit and Run Motor Vehicle Involved WithPED Lighting DAYLIGHT Ped Action X-WLK AT Cntrl Dev NT PRS/FCTR Loc Type Ramp/Int
1F DRVR 64 M H HNBD LFT TURN E D 2200 NISSA 1995 - - A 22350 - M G2 PED 34 M B HNBD E N 6000 - - - - - - - PED COMP PN 34 M 9 3 - -
Party InfoParty Type Age Sex Race Sobriety1 Sobriety2 Move Pre Dir SW Veh CHP Veh Make Year SP Info OAF1 Viol OAF2 Safety Equip ROLE Ext Of Inj AGE Sex Seat Pos Safety EQUIP Ejected
Victim Info
Primary Rd MERRILL Distance (ft) 0 Direction Secondary Rd WILLOW AV NCIC 3609 State Hwy? N Route Postmile Prefix Postmile Side of HwyCity Rialto County San Bernardino Population 5 Rpt Dist 160 Beat 003 Type 0 CalTrans Badge 8717 Collision Date 20120104 Time 1126 Day WEDPrimary Collision Factor UNSAFE SPEED Violation 22350 Collision Type REAR END Severity INJURY #Killed 0 #Injured 1 Tow Away? N Process Date 20130608Weather1 CLEAR Weather2 Rdwy Surface DRY Rdwy Cond1 NO UNUSL CND Rdwy Cond2 Spec Cond 0Hit and Run Motor Vehicle Involved WithOTHER MV Lighting DAYLIGHT Ped Action Cntrl Dev FNCTNG Loc Type Ramp/Int
1F DRVR 53 M W HNBD PROC ST W I 1100 FORD 2007 - - N - M G2 DRVR 38 F B HNBD PROC ST W A 0100 CHEVR 2007 - - N - M G DRVR COMP PN 38 F 1 0 M G
PASS 21 F 3 3 M GPASS 1 F 5 3 P G
Party InfoParty Type Age Sex Race Sobriety1 Sobriety2 Move Pre Dir SW Veh CHP Veh Make Year SP Info OAF1 Viol OAF2 Safety Equip ROLE Ext Of Inj AGE Sex Seat Pos Safety EQUIP Ejected
Victim Info
Primary Rd MERRILL Distance (ft) 0 Direction Secondary Rd WILLOW AV NCIC 3609 State Hwy? N Route Postmile Prefix Postmile Side of HwyCity Rialto County San Bernardino Population 5 Rpt Dist 160 Beat 004 Type 0 CalTrans Badge 6367 Collision Date 20120615 Time 2005 Day FRIPrimary Collision Factor DRVR ALC|DRG Violation 23152A Collision Type SIDESWIPE Severity PDO #Killed 0 #Injured 0 Tow Away? N Process Date 20140204Weather1 CLEAR Weather2 Rdwy Surface DRY Rdwy Cond1 NO UNUSL CND Rdwy Cond2 Spec Cond 0Hit and Run Motor Vehicle Involved WithOTHER MV Lighting DAYLIGHT Ped Action Cntrl Dev FNCTNG Loc Type Ramp/Int
1F DRVR 45 M B HBD-UI LFT TURN N A 0700 GMC 2002 - - A 22107 - M G2 DRVR 65 M O HNBD PROC ST W A 0700 TOYOT 1999 - - - - M G
Party InfoParty Type Age Sex Race Sobriety1 Sobriety2 Move Pre Dir SW Veh CHP Veh Make Year SP Info OAF1 Viol OAF2 Safety Equip ROLE Ext Of Inj AGE Sex Seat Pos Safety EQUIP Ejected
Victim Info
Primary Rd MERRILL AV Distance (ft) 0 Direction Secondary Rd CACTUS AV NCIC 3609 State Hwy? N Route Postmile Prefix Postmile Side of HwyCity Rialto County San Bernardino Population 5 Rpt Dist 158 Beat 003 Type 0 CalTrans Badge 1041 Collision Date 20120403 Time 1321 Day TUEPrimary Collision Factor STOP SGN|SIG Violation 21453A Collision Type BROADSIDE Severity INJURY #Killed 0 #Injured 2 Tow Away? Y Process Date 20130817Weather1 CLEAR Weather2 Rdwy Surface DRY Rdwy Cond1 NO UNUSL CND Rdwy Cond2 Spec Cond 0Hit and Run Motor Vehicle Involved WithOTHER MV Lighting DAYLIGHT Ped Action Cntrl Dev FNCTNG Loc Type Ramp/Int
1F DRVR 71 F W PROC ST W A 0100 FORD 2008 - - M - M G DRVR OTH VIS 71 F 1 0 M G2 DRVR 59 M W HNBD PROC ST S D 2200 TOYOT 2001 - - N - M G DRVR COMP PN 59 M 1 0 M G
Party InfoParty Type Age Sex Race Sobriety1 Sobriety2 Move Pre Dir SW Veh CHP Veh Make Year SP Info OAF1 Viol OAF2 Safety Equip ROLE Ext Of Inj AGE Sex Seat Pos Safety EQUIP Ejected
Victim Info
Primary Rd MERRILL AV Distance (ft) 160 Direction E Secondary Rd CEDAR AV NCIC 3609 State Hwy? N Route Postmile Prefix Postmile Side of HwyCity Rialto County San Bernardino Population 5 Rpt Dist 146 Beat 003 Type 0 CalTrans Badge 1041 Collision Date 20120314 Time 0742 Day WEDPrimary Collision Factor R-O-W AUTO Violation 21804A Collision Type BROADSIDE Severity INJURY #Killed 0 #Injured 1 Tow Away? Y Process Date 20130726Weather1 CLEAR Weather2 Rdwy Surface DRY Rdwy Cond1 NO UNUSL CND Rdwy Cond2 Spec Cond 0Hit and Run Motor Vehicle Involved WithOTHER MV Lighting DAYLIGHT Ped Action Cntrl Dev NT PRS/FCTR Loc Type Ramp/Int
1F DRVR 48 M B HNBD ENT TRAF S A 0100 DODGE 1999 - - N - M G2 DRVR 58 F H HNBD PROC ST W A 0100 KIA 2005 - - N - L G DRVR COMP PN 58 F 1 3 L G
Party InfoParty Type Age Sex Race Sobriety1 Sobriety2 Move Pre Dir SW Veh CHP Veh Make Year SP Info OAF1 Viol OAF2 Safety Equip ROLE Ext Of Inj AGE Sex Seat Pos Safety EQUIP Ejected
Victim Info
Page 45 This report is accepted subject to the Terms of Use. Due to collision records processing backlogs, SWITRS data is typically seven months behind. Data requested for dates seven months prior to the current date will be incomplete.
Agenda Item No. 4 Attachment

01/01/2012 thru 12/31/2012
Report Run On: 08/14/2014
Total Count: 418
Include State Highways cases
Jurisdiction(s): Rialto
Primary Rd MERRILL AV Distance (ft) 0 Direction Secondary Rd CEDAR AV NCIC 3609 State Hwy? N Route Postmile Prefix Postmile Side of HwyCity Rialto County San Bernardino Population 5 Rpt Dist 155 Beat 002 Type 0 CalTrans Badge 8717 Collision Date 20120703 Time 0937 Day TUEPrimary Collision Factor STOP SGN|SIG Violation 21453A Collision Type BROADSIDE Severity INJURY #Killed 0 #Injured 2 Tow Away? N Process Date 20131031Weather1 CLEAR Weather2 Rdwy Surface DRY Rdwy Cond1 NO UNUSL CND Rdwy Cond2 Spec Cond 0Hit and Run Motor Vehicle Involved WithOTHER MV Lighting DAYLIGHT Ped Action Cntrl Dev FNCTNG Loc Type Ramp/Int
1F DRVR 57 M H HNBD PROC ST N A 0100 TOYOT 2002 - - N - L G DRVR COMP PN 57 M 1 0 L G2 DRVR 20 M H HNBD PROC ST E C 0200 HONDA 2007 - - N - W - DRVR COMP PN 20 M 1 1 W -
Party InfoParty Type Age Sex Race Sobriety1 Sobriety2 Move Pre Dir SW Veh CHP Veh Make Year SP Info OAF1 Viol OAF2 Safety Equip ROLE Ext Of Inj AGE Sex Seat Pos Safety EQUIP Ejected
Victim Info
Primary Rd MERRILL AV Distance (ft) 100 Direction E Secondary Rd CHURCH AV NCIC 3609 State Hwy? N Route Postmile Prefix Postmile Side of HwyCity Rialto County San Bernardino Population 5 Rpt Dist Beat Type 0 CalTrans Badge Collision Date 20121203 Time 1723 Day MONPrimary Collision Factor DRVR ALC|DRG Violation 23152A Collision Type REAR END Severity INJURY #Killed 0 #Injured 2 Tow Away? Y Process Date 20130129Weather1 CLOUDY Weather2 Rdwy Surface DRY Rdwy Cond1 NO UNUSL CND Rdwy Cond2 Spec Cond 0Hit and Run Motor Vehicle Involved WithOTHER MV Lighting DARK - ST Ped Action Cntrl Dev NT PRS/FCTR Loc Type Ramp/Int
1F DRVR 69 M W HBD-UI PROC ST E A 0100 MERCE 2001 - 3 A 22350 - M G2 DRVR 36 F H HNBD STOPPED E A 0100 NISSA 2012 - 3 N - M G DRVR COMP PN 36 F 1 0 M G3 DRVR 38 M A HNBD STOPPED E J 4800 FORD 2013 - 3 N - M G DRVR COMP PN 38 M 1 0 M G
Party InfoParty Type Age Sex Race Sobriety1 Sobriety2 Move Pre Dir SW Veh CHP Veh Make Year SP Info OAF1 Viol OAF2 Safety Equip ROLE Ext Of Inj AGE Sex Seat Pos Safety EQUIP Ejected
Victim Info
Primary Rd MERRILL AV Distance (ft) 0 Direction Secondary Rd LILAC AV NCIC 3609 State Hwy? N Route Postmile Prefix Postmile Side of HwyCity Rialto County San Bernardino Population 5 Rpt Dist 159 Beat 003 Type 0 CalTrans Badge 7285 Collision Date 20120909 Time 0302 Day SUNPrimary Collision Factor UNSAFE SPEED Violation 22350 Collision Type REAR END Severity PDO #Killed 0 #Injured 0 Tow Away? N Process Date 20140317Weather1 CLEAR Weather2 Rdwy Surface DRY Rdwy Cond1 NO UNUSL CND Rdwy Cond2 Spec Cond 0Hit and Run Motor Vehicle Involved WithOTHER MV Lighting DARK - ST Ped Action Cntrl Dev FNCTNG Loc Type Ramp/Int
1F DRVR 18 M H HNBD PROC ST E A 0100 TOYOT 2006 - - A 23152 - M G2 DRVR 18 M H HNBD STOPPED E A 0100 CHEVR 2008 - - - - M G PASS 998 M 3 3 M G
Party InfoParty Type Age Sex Race Sobriety1 Sobriety2 Move Pre Dir SW Veh CHP Veh Make Year SP Info OAF1 Viol OAF2 Safety Equip ROLE Ext Of Inj AGE Sex Seat Pos Safety EQUIP Ejected
Victim Info
Primary Rd MERRILL AV Distance (ft) 500 Direction E Secondary Rd RIVERSIDE AV NCIC 3609 State Hwy? N Route Postmile Prefix Postmile Side of HwyCity Rialto County San Bernardino Population 5 Rpt Dist 162 Beat 004 Type 0 CalTrans Badge 1041 Collision Date 20120307 Time 1425 Day WEDPrimary Collision Factor R-O-W AUTO Violation 21804A Collision Type BROADSIDE Severity INJURY #Killed 0 #Injured 2 Tow Away? N Process Date 20130726Weather1 CLEAR Weather2 Rdwy Surface DRY Rdwy Cond1 NO UNUSL CND Rdwy Cond2 Spec Cond 0Hit and Run Motor Vehicle Involved WithOTHER MV Lighting DAYLIGHT Ped Action Cntrl Dev NT PRS/FCTR Loc Type Ramp/Int
1F DRVR 16 M H HNBD ENT TRAF N A 0100 ACURA 2006 - - N - M G DRVR COMP PN 16 M 1 3 M G2 DRVR 43 F B HNBD PROC ST E A 0100 HYUND 2001 - - N - L G DRVR COMP PN 43 F 1 3 L G
Party InfoParty Type Age Sex Race Sobriety1 Sobriety2 Move Pre Dir SW Veh CHP Veh Make Year SP Info OAF1 Viol OAF2 Safety Equip ROLE Ext Of Inj AGE Sex Seat Pos Safety EQUIP Ejected
Victim Info
Primary Rd MERRILL AV Distance (ft) 195 Direction E Secondary Rd RIVERSIDE AV NCIC 3609 State Hwy? N Route Postmile Prefix Postmile Side of HwyCity Rialto County San Bernardino Population 5 Rpt Dist 162 Beat 004 Type 0 CalTrans Badge 3322 Collision Date 20120409 Time 1744 Day MONPrimary Collision Factor DRVR ALC|DRG Violation 23152A Collision Type REAR END Severity INJURY #Killed 0 #Injured 1 Tow Away? Y Process Date 20130824Weather1 CLEAR Weather2 Rdwy Surface DRY Rdwy Cond1 NO UNUSL CND Rdwy Cond2 Spec Cond 0Hit and Run Motor Vehicle Involved WithOTHER MV Lighting DAYLIGHT Ped Action Cntrl Dev FNCTNG Loc Type Ramp/Int
1F DRVR 44 M H HBD-UI PROC ST W A 0700 NISSA 1998 - 3 A 22350 - M G PASS 30 M 3 0 M H2 DRVR 31 F B HNBD STOPPED W A 0100 HONDA 2001 - 3 N - M G DRVR COMP PN 31 F 1 0 M G
Party InfoParty Type Age Sex Race Sobriety1 Sobriety2 Move Pre Dir SW Veh CHP Veh Make Year SP Info OAF1 Viol OAF2 Safety Equip ROLE Ext Of Inj AGE Sex Seat Pos Safety EQUIP Ejected
Victim Info
Page 46 This report is accepted subject to the Terms of Use. Due to collision records processing backlogs, SWITRS data is typically seven months behind. Data requested for dates seven months prior to the current date will be incomplete.
Agenda Item No. 4 Attachment

01/01/2012 thru 12/31/2012
Report Run On: 08/14/2014
Total Count: 418
Include State Highways cases
Jurisdiction(s): Rialto
Primary Rd N WILLOW AV Distance (ft) 129 Direction N Secondary Rd ETIWANDA AV NCIC 3609 State Hwy? N Route Postmile Prefix Postmile Side of HwyCity Rialto County San Bernardino Population 5 Rpt Dist 1252 Beat 002 Type 0 CalTrans Badge 1899 Collision Date 20120625 Time 0122 Day MONPrimary Collision Factor DRVR ALC|DRG Violation 23152A Collision Type REAR END Severity PDO #Killed 0 #Injured 0 Tow Away? Y Process Date 20140124Weather1 CLEAR Weather2 Rdwy Surface DRY Rdwy Cond1 NO UNUSL CND Rdwy Cond2 Spec Cond 0Hit and Run Motor Vehicle Involved WithPKD MV Lighting DARK - NO Ped Action Cntrl Dev NT PRS/FCTR Loc Type Ramp/Int
1F DRVR 19 M H HBD-UI PROC ST N A 0100 HONDA 2002 - 2 A 22350 - M G2 PRKD 998 - PARKED N A 0100 NISSA 2002 - 3 - - - - PASS 51 F 1 3 M G
Party InfoParty Type Age Sex Race Sobriety1 Sobriety2 Move Pre Dir SW Veh CHP Veh Make Year SP Info OAF1 Viol OAF2 Safety Equip ROLE Ext Of Inj AGE Sex Seat Pos Safety EQUIP Ejected
Victim Info
Primary Rd PALMETTO AV Distance (ft) 0 Direction Secondary Rd SUNRISE DR NCIC 3609 State Hwy? N Route Postmile Prefix Postmile Side of HwyCity Rialto County San Bernardino Population 5 Rpt Dist 04 Beat 001 Type 0 CalTrans Badge 9133 Collision Date 20120202 Time 0553 Day THUPrimary Collision Factor R-O-W AUTO Violation 21801A Collision Type BROADSIDE Severity INJURY #Killed 0 #Injured 1 Tow Away? Y Process Date 20130702Weather1 CLEAR Weather2 Rdwy Surface DRY Rdwy Cond1 NO UNUSL CND Rdwy Cond2 Spec Cond 0Hit and Run Motor Vehicle Involved WithOTHER MV Lighting DUSK/DAWNPed Action Cntrl Dev FNCTNG Loc Type Ramp/Int
1F DRVR 49 F H HNBD LFT TURN E A 0100 MERCE 2011 - - N - M G2 DRVR 33 M W HNBD PROC ST S A 0100 CHEVR 1991 - - N - M G DRVR COMP PN 33 M 1 0 M G
Party InfoParty Type Age Sex Race Sobriety1 Sobriety2 Move Pre Dir SW Veh CHP Veh Make Year SP Info OAF1 Viol OAF2 Safety Equip ROLE Ext Of Inj AGE Sex Seat Pos Safety EQUIP Ejected
Victim Info
Primary Rd PEPPER AV Distance (ft) 0 Direction Secondary Rd BASELINE RD NCIC 3609 State Hwy? N Route Postmile Prefix Postmile Side of HwyCity Rialto County San Bernardino Population 5 Rpt Dist 116 Beat 002 Type 0 CalTrans Badge 5550 Collision Date 20120731 Time 1916 Day TUEPrimary Collision Factor R-O-W AUTO Violation 21801A Collision Type BROADSIDE Severity INJURY #Killed 0 #Injured 2 Tow Away? Y Process Date 20131023Weather1 CLEAR Weather2 Rdwy Surface DRY Rdwy Cond1 NO UNUSL CND Rdwy Cond2 Spec Cond 0Hit and Run Motor Vehicle Involved WithOTHER MV Lighting DAYLIGHT Ped Action Cntrl Dev FNCTNG Loc Type Ramp/Int
1F DRVR 57 M H HBD-NUI LFT TURN W D 2200 NISSA 1990 - - N - P G DRVR COMP PN 57 M 1 0 P G2 DRVR 38 F B HNBD PROC ST S A 0100 FORD 2012 - - N - L G DRVR COMP PN 38 F 1 0 L G
Party InfoParty Type Age Sex Race Sobriety1 Sobriety2 Move Pre Dir SW Veh CHP Veh Make Year SP Info OAF1 Viol OAF2 Safety Equip ROLE Ext Of Inj AGE Sex Seat Pos Safety EQUIP Ejected
Victim Info
Primary Rd PEPPER AV Distance (ft) 0 Direction Secondary Rd FOOTHILL BL NCIC 3609 State Hwy? N Route Postmile Prefix Postmile Side of HwyCity Rialto County San Bernardino Population 5 Rpt Dist 3609 Beat 002 Type 0 CalTrans Badge 0451 Collision Date 20120205 Time 1848 Day SUNPrimary Collision Factor R-O-W AUTO Violation 21801A Collision Type SIDESWIPE Severity INJURY #Killed 0 #Injured 1 Tow Away? Y Process Date 20130713Weather1 CLEAR Weather2 Rdwy Surface DRY Rdwy Cond1 NO UNUSL CND Rdwy Cond2 Spec Cond 0Hit and Run Motor Vehicle Involved WithOTHER MV Lighting DARK - ST Ped Action Cntrl Dev FNCTNG Loc Type Ramp/Int
1F DRVR 20 F H HNBD LFT TURN N A 0100 TOYOT 2007 - - N - L A PASS OTH VIS 11 F 3 0 L G2 DRVR 33 M A HNBD PROC ST S A 0100 HONDA 2009 - - N - L G
Party InfoParty Type Age Sex Race Sobriety1 Sobriety2 Move Pre Dir SW Veh CHP Veh Make Year SP Info OAF1 Viol OAF2 Safety Equip ROLE Ext Of Inj AGE Sex Seat Pos Safety EQUIP Ejected
Victim Info
Primary Rd PEPPER AV Distance (ft) 405 Direction N Secondary Rd FOOTHILL BL NCIC 3609 State Hwy? N Route Postmile Prefix Postmile Side of HwyCity Rialto County San Bernardino Population 5 Rpt Dist 510 Beat 002 Type 0 CalTrans Badge 9505 Collision Date 20121121 Time 1725 Day WEDPrimary Collision Factor NOT DRIVER Violation Collision Type BROADSIDE Severity INJURY #Killed 0 #Injured 1 Tow Away? Y Process Date 20140110Weather1 CLEAR Weather2 Rdwy Surface DRY Rdwy Cond1 NO UNUSL CND Rdwy Cond2 Spec Cond 0Hit and Run Motor Vehicle Involved WithOTHER MV Lighting DARK - ST Ped Action Cntrl Dev FNCTNG Loc Type Ramp/Int
1 DRVR 56 M B HNBD OPPOS LN S B 0722 CHEVR 1994 - - M - M G DRVR COMP PN 56 M 1 0 M G2 PRKD 998 - PARKED W D 2200 CHEVR 1993 - - - - - -
Party InfoParty Type Age Sex Race Sobriety1 Sobriety2 Move Pre Dir SW Veh CHP Veh Make Year SP Info OAF1 Viol OAF2 Safety Equip ROLE Ext Of Inj AGE Sex Seat Pos Safety EQUIP Ejected
Victim Info
Page 49 This report is accepted subject to the Terms of Use. Due to collision records processing backlogs, SWITRS data is typically seven months behind. Data requested for dates seven months prior to the current date will be incomplete.
Agenda Item No. 4 Attachment

01/01/2012 thru 12/31/2012
Report Run On: 08/14/2014
Total Count: 418
Include State Highways cases
Jurisdiction(s): Rialto
Primary Rd RIALTO AV Distance (ft) 0 Direction Secondary Rd ACACIA AV NCIC 3609 State Hwy? N Route Postmile Prefix Postmile Side of HwyCity Rialto County San Bernardino Population 5 Rpt Dist 153 Beat 004 Type 0 CalTrans Badge 9632 Collision Date 20121105 Time 1910 Day MONPrimary Collision Factor UNSAFE SPEED Violation 22350 Collision Type REAR END Severity INJURY #Killed 0 #Injured 3 Tow Away? N Process Date 20140108Weather1 CLEAR Weather2 Rdwy Surface DRY Rdwy Cond1 NO UNUSL CND Rdwy Cond2 Spec Cond 0Hit and Run Motor Vehicle Involved WithOTHER MV Lighting DARK - ST Ped Action Cntrl Dev FNCTNG Loc Type Ramp/Int
1F DRVR 22 M H IMP UNK IMP UNK PROC ST W A 0100 PONTI 1987 - - A 22350 - P G DRVR SEVERE 22 M 1 0 P GPASS SEVERE 21 M 3 0 P H
2 DRVR 39 F H HNBD PROC ST W A 0700 FORD 2002 - - N - M G DRVR OTH VIS 39 F 1 0 M G3 PRKD 998 - PARKED W A 0700 LINCO 2003 - - - - - -
Party InfoParty Type Age Sex Race Sobriety1 Sobriety2 Move Pre Dir SW Veh CHP Veh Make Year SP Info OAF1 Viol OAF2 Safety Equip ROLE Ext Of Inj AGE Sex Seat Pos Safety EQUIP Ejected
Victim Info
Primary Rd RIALTO AV Distance (ft) 0 Direction Secondary Rd ACACIA AV NCIC 3609 State Hwy? N Route Postmile Prefix Postmile Side of HwyCity Rialto County San Bernardino Population 5 Rpt Dist 141 Beat 004 Type 0 CalTrans Badge 3156 Collision Date 20121220 Time 2137 Day THUPrimary Collision Factor DRVR ALC|DRG Violation 23152A Collision Type HEAD-ON Severity PDO #Killed 0 #Injured 0 Tow Away? N Process Date 20140602Weather1 CLEAR Weather2 Rdwy Surface DRY Rdwy Cond1 NO UNUSL CND Rdwy Cond2 Spec Cond 0Hit and Run MSDMNR Motor Vehicle Involved WithOTHER MV Lighting DARK - ST Ped Action Cntrl Dev FNCTNG Loc Type Ramp/Int
1F DRVR 19 M H HBD-UI PROC ST E A 0700 CHEVR 1995 - - A 21650 - M B2 DRVR 42 - H HNBD PROC ST W A 0700 CHEVR 2004 - - N - M G PASS 22 - 3 3 M G
PASS 9 M 4 3 P GPASS 12 F 4 3 P G
Party InfoParty Type Age Sex Race Sobriety1 Sobriety2 Move Pre Dir SW Veh CHP Veh Make Year SP Info OAF1 Viol OAF2 Safety Equip ROLE Ext Of Inj AGE Sex Seat Pos Safety EQUIP Ejected
Victim Info
Primary Rd RIALTO AV Distance (ft) 127 Direction E Secondary Rd ARROWHEAD AV NCIC 3609 State Hwy? N Route Postmile Prefix Postmile Side of HwyCity Rialto County San Bernardino Population 5 Rpt Dist 135 Beat 003 Type 0 CalTrans Badge 1186 Collision Date 20120208 Time 1334 Day WEDPrimary Collision Factor NOT STATED Violation Collision Type AUTO/PED Severity INJURY #Killed 0 #Injured 1 Tow Away? N Process Date 20130629Weather1 CLEAR Weather2 Rdwy Surface DRY Rdwy Cond1 NO UNUSL CND Rdwy Cond2 Spec Cond 0Hit and Run Motor Vehicle Involved WithPED Lighting DAYLIGHT Ped Action NOT IN X- Cntrl Dev NT PRS/FCTR Loc Type Ramp/Int
1F PED 14 M W HNBD PROC ST N N 6000 - - 3 N - - - PED COMP PN 14 M 9 3 - -2 DRVR 52 M W HNBD PROC ST E D 2200 CHEVR 1990 - 3 N - M G
Party InfoParty Type Age Sex Race Sobriety1 Sobriety2 Move Pre Dir SW Veh CHP Veh Make Year SP Info OAF1 Viol OAF2 Safety Equip ROLE Ext Of Inj AGE Sex Seat Pos Safety EQUIP Ejected
Victim Info
Primary Rd RIALTO AV Distance (ft) 122 Direction E Secondary Rd CACTUS AV NCIC 3609 State Hwy? N Route Postmile Prefix Postmile Side of HwyCity Rialto County San Bernardino Population 5 Rpt Dist 136 Beat 003 Type 0 CalTrans Badge 3156 Collision Date 20120729 Time 1943 Day SUNPrimary Collision Factor DRVR ALC|DRG Violation 23152A Collision Type HIT OBJECT Severity PDO #Killed 0 #Injured 0 Tow Away? N Process Date 20140130Weather1 CLEAR Weather2 Rdwy Surface DRY Rdwy Cond1 NO UNUSL CND Rdwy Cond2 Spec Cond 0Hit and Run MSDMNR Motor Vehicle Involved WithFIXED OBJ Lighting DUSK/DAWNPed Action Cntrl Dev NT PRS/FCTR Loc Type Ramp/Int
1F DRVR 47 M H HBD-UI UNS TURN W D 2200 FORD 1999 - - A 22107 - M B
Party InfoParty Type Age Sex Race Sobriety1 Sobriety2 Move Pre Dir SW Veh CHP Veh Make Year SP Info OAF1 Viol OAF2 Safety Equip ROLE Ext Of Inj AGE Sex Seat Pos Safety EQUIP Ejected
Victim Info
Primary Rd RIALTO AV Distance (ft) 426 Direction W Secondary Rd LARCH AV NCIC 3609 State Hwy? N Route Postmile Prefix Postmile Side of HwyCity Rialto County San Bernardino Population 5 Rpt Dist 136 Beat 003 Type 0 CalTrans Badge 3322 Collision Date 20120501 Time 0750 Day TUEPrimary Collision Factor R-O-W AUTO Violation 21804A Collision Type BROADSIDE Severity PDO #Killed 0 #Injured 0 Tow Away? N Process Date 20131211Weather1 CLOUDY Weather2 Rdwy Surface DRY Rdwy Cond1 NO UNUSL CND Rdwy Cond2 Spec Cond 0Hit and Run MSDMNR Motor Vehicle Involved WithOTHER MV Lighting DAYLIGHT Ped Action Cntrl Dev NT PRS/FCTR Loc Type Ramp/Int
1F DRVR 998 F H IMP UNK IMP UNK RGT TURN W A 0800 NISSA 1995 - - N - - -2 DRVR 25 F B HNBD PROC ST W A 0100 FORD 2002 - 3 N - M G
Party InfoParty Type Age Sex Race Sobriety1 Sobriety2 Move Pre Dir SW Veh CHP Veh Make Year SP Info OAF1 Viol OAF2 Safety Equip ROLE Ext Of Inj AGE Sex Seat Pos Safety EQUIP Ejected
Victim Info
Page 51 This report is accepted subject to the Terms of Use. Due to collision records processing backlogs, SWITRS data is typically seven months behind. Data requested for dates seven months prior to the current date will be incomplete.
Agenda Item No. 4 Attachment

01/01/2012 thru 12/31/2012
Report Run On: 08/14/2014
Total Count: 418
Include State Highways cases
Jurisdiction(s): Rialto
Primary Rd RIVERSIDE AV Distance (ft) 0 Direction Secondary Rd JURUPA AV NCIC 3609 State Hwy? N Route Postmile Prefix Postmile Side of HwyCity Rialto County San Bernardino Population 5 Rpt Dist 230 Beat 004 Type 0 CalTrans Badge 5550 Collision Date 20120129 Time 2117 Day SUNPrimary Collision Factor STOP SGN|SIG Violation 21453A Collision Type BROADSIDE Severity INJURY #Killed 0 #Injured 2 Tow Away? Y Process Date 20130708Weather1 CLEAR Weather2 Rdwy Surface DRY Rdwy Cond1 NO UNUSL CND Rdwy Cond2 Spec Cond 0Hit and Run Motor Vehicle Involved WithOTHER MV Lighting DARK - ST Ped Action Cntrl Dev FNCTNG Loc Type Ramp/Int
1F DRVR 27 M H HNBD LFT TURN N A 0100 TOYOT 1996 - - N - L H DRVR OTH VIS 27 M 1 0 L H2 DRVR 33 F H HNBD PROC ST S D 2200 CHEVR 2005 - - N - L G DRVR COMP PN 33 F 1 0 L G
Party InfoParty Type Age Sex Race Sobriety1 Sobriety2 Move Pre Dir SW Veh CHP Veh Make Year SP Info OAF1 Viol OAF2 Safety Equip ROLE Ext Of Inj AGE Sex Seat Pos Safety EQUIP Ejected
Victim Info
Primary Rd RIVERSIDE AV Distance (ft) 0 Direction Secondary Rd JURUPA AV NCIC 3609 State Hwy? N Route Postmile Prefix Postmile Side of HwyCity Rialto County San Bernardino Population 5 Rpt Dist 230 Beat 004 Type 0 CalTrans Badge 2517 Collision Date 20121110 Time 1327 Day SATPrimary Collision Factor STOP SGN|SIG Violation 21453A Collision Type BROADSIDE Severity INJURY #Killed 0 #Injured 1 Tow Away? N Process Date 20140108Weather1 CLEAR Weather2 Rdwy Surface DRY Rdwy Cond1 NO UNUSL CND Rdwy Cond2 Spec Cond 0Hit and Run FELONY Motor Vehicle Involved WithOTHER MV Lighting DAYLIGHT Ped Action Cntrl Dev FNCTNG Loc Type Ramp/Int
1F DRVR 998 - IMP UNK IMP UNK PROC ST S A 0100 - - - A 21453 - - -2 DRVR 68 F W HNBD LFT TURN E A 0100 NISSA 1999 - - - - M G DRVR COMP PN 68 F 1 0 M G
Party InfoParty Type Age Sex Race Sobriety1 Sobriety2 Move Pre Dir SW Veh CHP Veh Make Year SP Info OAF1 Viol OAF2 Safety Equip ROLE Ext Of Inj AGE Sex Seat Pos Safety EQUIP Ejected
Victim Info
Primary Rd RIVERSIDE AV Distance (ft) 0 Direction Secondary Rd LINDEN AV NCIC 3609 State Hwy? N Route Postmile Prefix Postmile Side of HwyCity Rialto County San Bernardino Population 5 Rpt Dist 03 Beat 001 Type 0 CalTrans Badge 3156 Collision Date 20120501 Time 1731 Day TUEPrimary Collision Factor R-O-W AUTO Violation 21802A Collision Type SIDESWIPE Severity INJURY #Killed 0 #Injured 1 Tow Away? Y Process Date 20130914Weather1 CLEAR Weather2 Rdwy Surface DRY Rdwy Cond1 NO UNUSL CND Rdwy Cond2 Spec Cond 0Hit and Run Motor Vehicle Involved WithOTHER MV Lighting DAYLIGHT Ped Action Cntrl Dev FNCTNG Loc Type Ramp/Int
1F DRVR 19 M H HNBD LFT TURN N A 0100 HYUND 1998 - - F - L G2 DRVR 19 M H HNBD PROC ST E A 0100 TOYOT 1991 - - N - L G DRVR COMP PN 19 M 1 0 L G
Party InfoParty Type Age Sex Race Sobriety1 Sobriety2 Move Pre Dir SW Veh CHP Veh Make Year SP Info OAF1 Viol OAF2 Safety Equip ROLE Ext Of Inj AGE Sex Seat Pos Safety EQUIP Ejected
Victim Info
Primary Rd RIVERSIDE AV Distance (ft) 225 Direction E Secondary Rd LOCUST AV NCIC 3609 State Hwy? N Route Postmile Prefix Postmile Side of HwyCity Rialto County San Bernardino Population 5 Rpt Dist 003 Beat 001 Type 0 CalTrans Badge 1514 Collision Date 20120823 Time 0440 Day THUPrimary Collision Factor DRVR ALC|DRG Violation 23152A Collision Type OTHER Severity INJURY #Killed 0 #Injured 1 Tow Away? Y Process Date 20131004Weather1 CLEAR Weather2 Rdwy Surface DRY Rdwy Cond1 NO UNUSL CND Rdwy Cond2 Spec Cond 0Hit and Run Motor Vehicle Involved WithNON-CLSN Lighting DUSK/DAWNPed Action Cntrl Dev FNCTNG Loc Type Ramp/Int
1F DRVR 32 M H HBD-UI RAN OFF RD N A 0800 DODGE 2001 - - A 23152 - L B DRVR OTH VIS 32 M 1 0 L B
Party InfoParty Type Age Sex Race Sobriety1 Sobriety2 Move Pre Dir SW Veh CHP Veh Make Year SP Info OAF1 Viol OAF2 Safety Equip ROLE Ext Of Inj AGE Sex Seat Pos Safety EQUIP Ejected
Victim Info
Primary Rd RIVERSIDE AV Distance (ft) 250 Direction N Secondary Rd MERRILL AV NCIC 3609 State Hwy? N Route Postmile Prefix Postmile Side of HwyCity Rialto County San Bernardino Population 5 Rpt Dist 162 Beat 004 Type 0 CalTrans Badge 4081 Collision Date 20120121 Time 1210 Day SATPrimary Collision Factor UNSAFE SPEED Violation 22350 Collision Type REAR END Severity INJURY #Killed 0 #Injured 2 Tow Away? N Process Date 20130608Weather1 CLOUDY Weather2 Rdwy Surface WET Rdwy Cond1 NO UNUSL CND Rdwy Cond2 Spec Cond 0Hit and Run Motor Vehicle Involved WithOTHER MV Lighting DAYLIGHT Ped Action Cntrl Dev FNCTNG Loc Type Ramp/Int
1F DRVR 43 M W HNBD PROC ST S A 0700 CHEVR 1996 - 3 N - M G2 DRVR 40 F H HNBD STOPPED S A 0800 CHEVR 1996 - 3 N - M G DRVR COMP PN 40 F 1 0 M G
PASS COMP PN 67 F 3 0 M G
Party InfoParty Type Age Sex Race Sobriety1 Sobriety2 Move Pre Dir SW Veh CHP Veh Make Year SP Info OAF1 Viol OAF2 Safety Equip ROLE Ext Of Inj AGE Sex Seat Pos Safety EQUIP Ejected
Victim Info
Page 62 This report is accepted subject to the Terms of Use. Due to collision records processing backlogs, SWITRS data is typically seven months behind. Data requested for dates seven months prior to the current date will be incomplete.
Agenda Item No. 4 Attachment

01/01/2014 thru 12/31/2014
Report Run On: 08/22/2016
Total Count: 530
Include State Highways cases
Jurisdiction(s): Rialto
Primary Rd ACACIA AV Distance (ft) 75 Direction S Secondary Rd RANDALL AV NCIC 3609 State Hwy? N Route Postmile Prefix Postmile Side of HwyCity Rialto County San Bernardino Population 5 Rpt Dist 174 Beat 004 Type 0 CalTrans Badge 9632 Collision Date 20140104 Time 2137 Day SATPrimary Collision Factor DRVR ALC|DRG Violation 23152A Collision Type BROADSIDE Severity PDO #Killed 0 #Injured 0 Tow Away? Y Process Date 20150123Weather1 CLEAR Weather2 Rdwy Surface DRY Rdwy Cond1 NO UNUSL CND Rdwy Cond2 Spec Cond 0Hit and Run Motor Vehicle Involved WithOTHER MV Lighting DARK - ST Ped Action Cntrl Dev NT PRS/FCTR Loc Type Ramp/Int
1F DRVR 37 M H HBD-UI LFT TURN N A 0100 CHEVR 2008 - 3 A 22350 - L B PASS 32 M 3 3 L B2 PRKD 998 - PARKED N A 0100 BMW 2011 - 3 N - - -3 PRKD 998 - PARKED N A 0700 GMC 1980 - 3 N - - -
Party InfoParty Type Age Sex Race Sobriety1 Sobriety2 Move Pre Dir SW Veh CHP Veh Make Year SP Info OAF1 Viol OAF2 Safety Equip ROLE Ext Of Inj AGE Sex Seat Pos Safety EQUIP Ejected
Victim Info
Primary Rd ACACIA AV Distance (ft) 75 Direction S Secondary Rd RANDALL AV NCIC 3609 State Hwy? N Route Postmile Prefix Postmile Side of HwyCity Rialto County San Bernardino Population 5 Rpt Dist 174 Beat 004 Type 0 CalTrans Badge 9632 Collision Date 20140404 Time 2137 Day FRIPrimary Collision Factor DRVR ALC|DRG Violation 23152A Collision Type BROADSIDE Severity PDO #Killed 0 #Injured 0 Tow Away? Y Process Date 20150116Weather1 CLEAR Weather2 Rdwy Surface DRY Rdwy Cond1 NO UNUSL CND Rdwy Cond2 Spec Cond 0Hit and Run Motor Vehicle Involved WithOTHER MV Lighting DARK - ST Ped Action Cntrl Dev NT PRS/FCTR Loc Type Ramp/Int
1F DRVR 37 M H HBD-UI LFT TURN N A 0100 CHEVR 2008 - 3 A 22350 - L B PASS 32 M 3 0 L B2 PRKD 998 - PARKED N A 0100 BMW 2011 - 3 N - - -3 PRKD 998 - PARKED N A 0700 GMC 1980 - 3 N - - -
Party InfoParty Type Age Sex Race Sobriety1 Sobriety2 Move Pre Dir SW Veh CHP Veh Make Year SP Info OAF1 Viol OAF2 Safety Equip ROLE Ext Of Inj AGE Sex Seat Pos Safety EQUIP Ejected
Victim Info
Primary Rd ACACIA AV Distance (ft) 0 Direction Secondary Rd RIALTO AV NCIC 3609 State Hwy? N Route Postmile Prefix Postmile Side of HwyCity Rialto County San Bernardino Population 5 Rpt Dist 141 Beat 004 Type 0 CalTrans Badge 9632 Collision Date 20141019 Time 1911 Day SUNPrimary Collision Factor DRVR ALC|DRG Violation 23152A Collision Type BROADSIDE Severity INJURY #Killed 0 #Injured 3 Tow Away? Y Process Date 20150106Weather1 CLEAR Weather2 Rdwy Surface DRY Rdwy Cond1 NO UNUSL CND Rdwy Cond2 Spec Cond 0Hit and Run Motor Vehicle Involved WithOTHER MV Lighting DARK - ST Ped Action Cntrl Dev FNCTNG Loc Type Ramp/Int
1F DRVR 29 M H HBD-UI PROC ST S A 0100 CHEVR 2003 - 3 A 22450 - M H DRVR OTH VIS 29 M 1 0 M HPASS OTH VIS 21 F 3 0 M G
2 DRVR 74 M H HNBD PROC ST E D 2200 FORD 2014 - 3 N - L G DRVR OTH VIS 74 M 1 0 L GPASS 66 F 3 3 L G
3 PRKD 998 - PARKED N A 0100 HONDA 1992 - 3 N - - -
Party InfoParty Type Age Sex Race Sobriety1 Sobriety2 Move Pre Dir SW Veh CHP Veh Make Year SP Info OAF1 Viol OAF2 Safety Equip ROLE Ext Of Inj AGE Sex Seat Pos Safety EQUIP Ejected
Victim Info
Primary Rd ACACIA AV Distance (ft) 35 Direction N Secondary Rd RT 66 NCIC 3609 State Hwy? N Route Postmile Prefix Postmile Side of HwyCity Rialto County San Bernardino Population 5 Rpt Dist 129 Beat 002 Type 0 CalTrans Badge 3156 Collision Date 20141017 Time 1929 Day FRIPrimary Collision Factor DRVR ALC|DRG Violation 23152A Collision Type REAR END Severity PDO #Killed 0 #Injured 0 Tow Away? N Process Date 20160321Weather1 CLEAR Weather2 Rdwy Surface DRY Rdwy Cond1 NO UNUSL CND Rdwy Cond2 Spec Cond 0Hit and Run Motor Vehicle Involved WithOTHER MV Lighting DARK - ST Ped Action Cntrl Dev FNCTNG Loc Type Ramp/Int
1F DRVR 25 M H HBD-UI PROC ST S A 0100 HONDA 1996 - - A 22350 - M B2 DRVR 59 F H HNBD STOPPED S A 0700 HONDA 1998 - - N - M G PASS 28 F 3 3 M G
Party InfoParty Type Age Sex Race Sobriety1 Sobriety2 Move Pre Dir SW Veh CHP Veh Make Year SP Info OAF1 Viol OAF2 Safety Equip ROLE Ext Of Inj AGE Sex Seat Pos Safety EQUIP Ejected
Victim Info
Page 3 This report is accepted subject to the Terms of Use. Due to collision records processing backlogs, SWITRS data is typically seven months behind. Data requested for dates seven months prior to the current date will be incomplete.
Agenda Item No. 4 Attachment

01/01/2014 thru 12/31/2014
Report Run On: 08/22/2016
Total Count: 530
Include State Highways cases
Jurisdiction(s): Rialto
Primary Rd BASELINE RD Distance (ft) 0 Direction Secondary Rd EUCALYPTUS AV NCIC 3609 State Hwy? N Route Postmile Prefix Postmile Side of HwyCity Rialto County San Bernardino Population 5 Rpt Dist 102 Beat 002 Type 0 CalTrans Badge 3802 Collision Date 20140523 Time 2226 Day FRIPrimary Collision Factor R-O-W AUTO Violation 21801A Collision Type BROADSIDE Severity INJURY #Killed 0 #Injured 2 Tow Away? Y Process Date 20140805Weather1 CLEAR Weather2 Rdwy Surface DRY Rdwy Cond1 NO UNUSL CND Rdwy Cond2 Spec Cond 0Hit and Run Motor Vehicle Involved WithOTHER MV Lighting DARK - ST Ped Action Cntrl Dev FNCTNG Loc Type Ramp/Int
1F DRVR 23 F H HNBD LFT TURN W A 0100 CHEVR 1994 - - N - L G DRVR OTH VIS 23 F 1 0 L G2 DRVR 44 M B HNBD PROC ST E A 0700 GMC 1996 - - N - M G DRVR COMP PN 44 M 1 0 M G
Party InfoParty Type Age Sex Race Sobriety1 Sobriety2 Move Pre Dir SW Veh CHP Veh Make Year SP Info OAF1 Viol OAF2 Safety Equip ROLE Ext Of Inj AGE Sex Seat Pos Safety EQUIP Ejected
Victim Info
Primary Rd BASELINE RD Distance (ft) 0 Direction Secondary Rd EUCALYPTUS AV NCIC 3609 State Hwy? N Route Postmile Prefix Postmile Side of HwyCity Rialto County San Bernardino Population 5 Rpt Dist 102 Beat 002 Type 0 CalTrans Badge 9632 Collision Date 20140801 Time 2304 Day FRIPrimary Collision Factor R-O-W AUTO Violation 21801A Collision Type BROADSIDE Severity INJURY #Killed 0 #Injured 1 Tow Away? Y Process Date 20140908Weather1 CLEAR Weather2 Rdwy Surface DRY Rdwy Cond1 NO UNUSL CND Rdwy Cond2 Spec Cond 0Hit and Run Motor Vehicle Involved WithOTHER MV Lighting DARK - ST Ped Action Cntrl Dev FNCTNG Loc Type Ramp/Int
1F DRVR 39 F H HNBD LFT TURN N - 0000 CHEVR 2014 - 3 N - M G PASS 35 M 3 3 M GPASS 6 F 2 3 M GPASS 15 F 4 3 M GPASS 9 F 5 3 P GPASS 13 M 6 3 M G
2 DRVR 58 F B HNBD PROC ST W A 0100 KIA 2013 - 3 N - L G DRVR COMP PN 58 M 1 0 L G
Party InfoParty Type Age Sex Race Sobriety1 Sobriety2 Move Pre Dir SW Veh CHP Veh Make Year SP Info OAF1 Viol OAF2 Safety Equip ROLE Ext Of Inj AGE Sex Seat Pos Safety EQUIP Ejected
Victim Info
Primary Rd BASELINE RD Distance (ft) 0 Direction Secondary Rd EUCALYPTUS AV NCIC 3609 State Hwy? N Route Postmile Prefix Postmile Side of HwyCity Rialto County San Bernardino Population 5 Rpt Dist 102 Beat 002 Type 0 CalTrans Badge 9632 Collision Date 20140819 Time 2132 Day TUEPrimary Collision Factor R-O-W AUTO Violation 21801A Collision Type HEAD-ON Severity INJURY #Killed 0 #Injured 1 Tow Away? Y Process Date 20140916Weather1 CLEAR Weather2 Rdwy Surface DRY Rdwy Cond1 NO UNUSL CND Rdwy Cond2 Spec Cond 0Hit and Run Motor Vehicle Involved WithOTHER MV Lighting DARK - ST Ped Action Cntrl Dev FNCTNG Loc Type Ramp/Int
1F DRVR 20 F H HNBD LFT TURN S A 0100 NISSA 2013 - 3 N - L G DRVR COMP PN 20 F 1 0 L G2 DRVR 41 F H HNBD PROC ST E A 0700 NISSA 2005 - 3 N - M G
Party InfoParty Type Age Sex Race Sobriety1 Sobriety2 Move Pre Dir SW Veh CHP Veh Make Year SP Info OAF1 Viol OAF2 Safety Equip ROLE Ext Of Inj AGE Sex Seat Pos Safety EQUIP Ejected
Victim Info
Primary Rd BASELINE RD Distance (ft) 3 Direction E Secondary Rd EUCALYPTUS AV NCIC 3609 State Hwy? N Route Postmile Prefix Postmile Side of HwyCity Rialto County San Bernardino Population 5 Rpt Dist 115 Beat 002 Type 0 CalTrans Badge 9632 Collision Date 20140823 Time 0014 Day SATPrimary Collision Factor DRVR ALC|DRG Violation 23152A Collision Type HIT OBJECT Severity INJURY #Killed 0 #Injured 1 Tow Away? Y Process Date 20141002Weather1 CLEAR Weather2 Rdwy Surface DRY Rdwy Cond1 NO UNUSL CND Rdwy Cond2 Spec Cond 0Hit and Run Motor Vehicle Involved WithFIXED OBJ Lighting DARK - ST Ped Action Cntrl Dev NT PRS/FCTR Loc Type Ramp/Int
1F DRVR 52 M H HBD-UI PROC ST W D 2200 CHEVR 1999 - 3 A 22350 - M B DRVR COMP PN 52 M 1 0 M B
Party InfoParty Type Age Sex Race Sobriety1 Sobriety2 Move Pre Dir SW Veh CHP Veh Make Year SP Info OAF1 Viol OAF2 Safety Equip ROLE Ext Of Inj AGE Sex Seat Pos Safety EQUIP Ejected
Victim Info
Primary Rd BASELINE RD Distance (ft) 0 Direction Secondary Rd FITZGERALD AV NCIC 3609 State Hwy? N Route Postmile Prefix Postmile Side of HwyCity Rialto County San Bernardino Population 5 Rpt Dist 95 Beat 001 Type 0 CalTrans Badge 6367 Collision Date 20141030 Time 1218 Day THUPrimary Collision Factor IMPROP TURN Violation 22107 Collision Type BROADSIDE Severity INJURY #Killed 0 #Injured 2 Tow Away? Y Process Date 20150106Weather1 CLEAR Weather2 Rdwy Surface DRY Rdwy Cond1 NO UNUSL CND Rdwy Cond2 Spec Cond 0Hit and Run Motor Vehicle Involved WithOTHER MV Lighting DAYLIGHT Ped Action Cntrl Dev FNCTNG Loc Type Ramp/Int
1F DRVR 58 F W HNBD LFT TURN S A 0100 TOYOT 2014 - 3 N - M G DRVR COMP PN 58 F 1 0 M GPASS 998 F 3 0 L G
Party InfoParty Type Age Sex Race Sobriety1 Sobriety2 Move Pre Dir SW Veh CHP Veh Make Year SP Info OAF1 Viol OAF2 Safety Equip ROLE Ext Of Inj AGE Sex Seat Pos Safety EQUIP Ejected
Victim Info
Page 12 This report is accepted subject to the Terms of Use. Due to collision records processing backlogs, SWITRS data is typically seven months behind. Data requested for dates seven months prior to the current date will be incomplete.
Agenda Item No. 4 Attachment
01/01/2014 thru 12/31/2014
Report Run On: 08/22/2016
Total Count: 530
Include State Highways cases
Jurisdiction(s): Rialto
Primary Rd LILAC AV Distance (ft) 168 Direction N Secondary Rd 2ND ST NCIC 3609 State Hwy? N Route Postmile Prefix Postmile Side of HwyCity Rialto County San Bernardino Population 5 Rpt Dist 136 Beat 003 Type 0 CalTrans Badge 6367 Collision Date 20140708 Time 1413 Day TUEPrimary Collision Factor IMPROP TURN Violation 22107 Collision Type HIT OBJECT Severity INJURY #Killed 0 #Injured 2 Tow Away? Y Process Date 20140828Weather1 CLEAR Weather2 Rdwy Surface DRY Rdwy Cond1 NO UNUSL CND Rdwy Cond2 Spec Cond 0Hit and Run Motor Vehicle Involved WithFIXED OBJ Lighting DAYLIGHT Ped Action Cntrl Dev FNCTNG Loc Type Ramp/Int
1F DRVR 20 M H HNBD PROC ST S A 0100 SATUR 2001 - 3 N - L G DRVR COMP PN 20 M 1 2 L GPASS COMP PN 17 F 3 0 L G
Party InfoParty Type Age Sex Race Sobriety1 Sobriety2 Move Pre Dir SW Veh CHP Veh Make Year SP Info OAF1 Viol OAF2 Safety Equip ROLE Ext Of Inj AGE Sex Seat Pos Safety EQUIP Ejected
Victim Info
Primary Rd LILAC AV Distance (ft) 0 Direction N Secondary Rd BASELINE RD NCIC 3609 State Hwy? N Route Postmile Prefix Postmile Side of HwyCity Rialto County San Bernardino Population 5 Rpt Dist 097 Beat 001 Type 0 CalTrans Badge 1041 Collision Date 20141212 Time 1239 Day FRIPrimary Collision Factor STRTNG|BCKNG Violation 22106 Collision Type BROADSIDE Severity PDO #Killed 0 #Injured 0 Tow Away? N Process Date 20150728Weather1 RAINING Weather2 Rdwy Surface WET Rdwy Cond1 NO UNUSL CND Rdwy Cond2 Spec Cond 0Hit and Run Motor Vehicle Involved WithOTHER MV Lighting DAYLIGHT Ped Action Cntrl Dev NT PRS/FCTR Loc Type Ramp/Int
1F DRVR 23 M H HNBD ENT TRAF N A 0100 MITSU 2001 - - N - M G PASS 48 F 3 3 M GPASS 16 M 6 3 P G
2 DRVR 67 M H HNBD PROC ST N D 2200 FORD 2000 - - N - M G
Party InfoParty Type Age Sex Race Sobriety1 Sobriety2 Move Pre Dir SW Veh CHP Veh Make Year SP Info OAF1 Viol OAF2 Safety Equip ROLE Ext Of Inj AGE Sex Seat Pos Safety EQUIP Ejected
Victim Info
Primary Rd LILAC AV Distance (ft) 18 Direction N Secondary Rd JAMES ST NCIC 3609 State Hwy? N Route Postmile Prefix Postmile Side of HwyCity Rialto County San Bernardino Population 5 Rpt Dist 160 Beat 004 Type 0 CalTrans Badge 3156 Collision Date 20140315 Time 0124 Day SATPrimary Collision Factor DRVR ALC|DRG Violation 23152A Collision Type SIDESWIPE Severity PDO #Killed 0 #Injured 0 Tow Away? Y Process Date 20150223Weather1 CLEAR Weather2 Rdwy Surface DRY Rdwy Cond1 NO UNUSL CND Rdwy Cond2 Spec Cond 0Hit and Run Motor Vehicle Involved WithPKD MV Lighting DARK - ST Ped Action Cntrl Dev NT PRS/FCTR Loc Type Ramp/Int
1F DRVR 39 F H HBD-UI PROC ST N A 0100 TOYOT 2003 - - A 22350 - M E2 PRKD 998 - PARKED N A 0700 GMC 2006 - - N - - -
Party InfoParty Type Age Sex Race Sobriety1 Sobriety2 Move Pre Dir SW Veh CHP Veh Make Year SP Info OAF1 Viol OAF2 Safety Equip ROLE Ext Of Inj AGE Sex Seat Pos Safety EQUIP Ejected
Victim Info
Primary Rd LILAC AV Distance (ft) 240 Direction N Secondary Rd MARIPOSA NCIC 3609 State Hwy? Y Route Postmile Prefix Postmile Side of HwyCity Rialto County San Bernardino Population 5 Rpt Dist 97 Beat 001 Type 0 CalTrans Badge 1074 Collision Date 20140117 Time 1417 Day FRIPrimary Collision Factor TOO CLOSE Violation 21703 Collision Type REAR END Severity INJURY #Killed 0 #Injured 2 Tow Away? N Process Date 20140610Weather1 CLEAR Weather2 Rdwy Surface DRY Rdwy Cond1 NO UNUSL CND Rdwy Cond2 Spec Cond 0Hit and Run Motor Vehicle Involved WithOTHER MV Lighting DAYLIGHT Ped Action Cntrl Dev NT PRS/FCTR Loc Type Ramp/Int
1F DRVR 22 M H HNBD PROC ST S A 0100 HONDA 2012 - 3 A 21703 - M G2 DRVR 33 F B HNBD STOPPED S A 0100 HONDA 2008 - 3 N - M G DRVR COMP PN 33 F 1 1 M G
PASS 26 M 3 3 M GPASS 23 F 5 3 M GPASS COMP PN 31 F 4 0 M G
Party InfoParty Type Age Sex Race Sobriety1 Sobriety2 Move Pre Dir SW Veh CHP Veh Make Year SP Info OAF1 Viol OAF2 Safety Equip ROLE Ext Of Inj AGE Sex Seat Pos Safety EQUIP Ejected
Victim Info
Primary Rd LILAC AV Distance (ft) 0 Direction Secondary Rd MERRILL AV NCIC 3609 State Hwy? N Route Postmile Prefix Postmile Side of HwyCity Rialto County San Bernardino Population 5 Rpt Dist 159 Beat 003 Type 0 CalTrans Badge 1041 Collision Date 20141218 Time 0735 Day THUPrimary Collision Factor R-O-W AUTO Violation 21800A Collision Type BROADSIDE Severity INJURY #Killed 0 #Injured 1 Tow Away? N Process Date 20150209Weather1 CLEAR Weather2 Rdwy Surface DRY Rdwy Cond1 NO UNUSL CND Rdwy Cond2 Spec Cond 0Hit and Run Motor Vehicle Involved WithOTHER MV Lighting DAYLIGHT Ped Action Cntrl Dev FNCTNG Loc Type Ramp/Int
1F DRVR 38 F H HNBD PROC ST S A 0100 SCION 2006 - - N - M G
Party InfoParty Type Age Sex Race Sobriety1 Sobriety2 Move Pre Dir SW Veh CHP Veh Make Year SP Info OAF1 Viol OAF2 Safety Equip ROLE Ext Of Inj AGE Sex Seat Pos Safety EQUIP Ejected
Victim Info
Page 49 This report is accepted subject to the Terms of Use. Due to collision records processing backlogs, SWITRS data is typically seven months behind. Data requested for dates seven months prior to the current date will be incomplete.
Agenda Item No. 4 Attachment

01/01/2014 thru 12/31/2014
Report Run On: 08/22/2016
Total Count: 530
Include State Highways cases
Jurisdiction(s): Rialto
2 DRVR 68 M B HNBD PROC ST W A 0100 TOYOT 2005 - - N - M G DRVR COMP PN 68 M 1 0 M G
Primary Rd LILAC AV Distance (ft) 0 Direction Secondary Rd MORGAN AV NCIC 3609 State Hwy? N Route Postmile Prefix Postmile Side of HwyCity Rialto County San Bernardino Population 5 Rpt Dist 125 Beat 002 Type 0 CalTrans Badge 4369 Collision Date 20140817 Time 1029 Day SUNPrimary Collision Factor R-O-W AUTO Violation 21801A Collision Type SIDESWIPE Severity INJURY #Killed 0 #Injured 1 Tow Away? Y Process Date 20140916Weather1 CLEAR Weather2 Rdwy Surface DRY Rdwy Cond1 NO UNUSL CND Rdwy Cond2 Spec Cond 0Hit and Run Motor Vehicle Involved WithOTHER MV Lighting DAYLIGHT Ped Action Cntrl Dev FNCTNG Loc Type Ramp/Int
1F DRVR 26 F H HNBD LFT TURN W A 0700 FORD 1995 - - N - L G PASS 6 F 5 3 L GPASS 0 M 6 3 L Q
2 DRVR 21 M H HNBD PROC ST N D 2200 TOYOT 1985 - - - - M G PASS OTH VIS 21 M 1 0 M G
Party InfoParty Type Age Sex Race Sobriety1 Sobriety2 Move Pre Dir SW Veh CHP Veh Make Year SP Info OAF1 Viol OAF2 Safety Equip ROLE Ext Of Inj AGE Sex Seat Pos Safety EQUIP Ejected
Victim Info
Primary Rd LILAC AV Distance (ft) 0 Direction Secondary Rd RAMONA DR NCIC 3609 State Hwy? N Route Postmile Prefix Postmile Side of HwyCity Rialto County San Bernardino Population 5 Rpt Dist 124 Beat 002 Type 0 CalTrans Badge 9632 Collision Date 20140306 Time 1759 Day THUPrimary Collision Factor DRVR ALC|DRG Violation 23152A Collision Type REAR END Severity INJURY #Killed 0 #Injured 1 Tow Away? Y Process Date 20140626Weather1 CLEAR Weather2 Rdwy Surface DRY Rdwy Cond1 NO UNUSL CND Rdwy Cond2 Spec Cond 0Hit and Run Motor Vehicle Involved WithOTHER MV Lighting DAYLIGHT Ped Action Cntrl Dev NT PRS/FCTR Loc Type Ramp/Int
1F DRVR 34 F W HBD-UI PROC ST N A 0800 CHRYS 2001 - 3 A 22350 - M -2 DRVR 33 M H HNBD STOPPED N A 0100 JEEP 1996 - 3 N - M G DRVR COMP PN 33 M 1 0 M G
Party InfoParty Type Age Sex Race Sobriety1 Sobriety2 Move Pre Dir SW Veh CHP Veh Make Year SP Info OAF1 Viol OAF2 Safety Equip ROLE Ext Of Inj AGE Sex Seat Pos Safety EQUIP Ejected
Victim Info
Primary Rd LILAC AV Distance (ft) 0 Direction Secondary Rd RAMONA DR NCIC 3609 State Hwy? N Route Postmile Prefix Postmile Side of HwyCity Rialto County San Bernardino Population 5 Rpt Dist 125 Beat 001 Type 0 CalTrans Badge 3156 Collision Date 20140716 Time 2142 Day WEDPrimary Collision Factor WRONG SIDE Violation 216501 Collision Type BROADSIDE Severity INJURY #Killed 0 #Injured 1 Tow Away? N Process Date 20140828Weather1 CLEAR Weather2 Rdwy Surface DRY Rdwy Cond1 NO UNUSL CND Rdwy Cond2 Spec Cond 0Hit and Run Motor Vehicle Involved WithBICYCLE Lighting DARK - ST Ped Action Cntrl Dev FNCTNG Loc Type Ramp/Int
1F BICY 9 M B HNBD PROC ST S L 0400 - - - N - - - BICY COMP PN 9 M 1 1 P V2 DRVR 28 M H HNBD STOPPED E A 0700 SCION 2004 - - N - M B PASS 23 F 3 3 M B
Party InfoParty Type Age Sex Race Sobriety1 Sobriety2 Move Pre Dir SW Veh CHP Veh Make Year SP Info OAF1 Viol OAF2 Safety Equip ROLE Ext Of Inj AGE Sex Seat Pos Safety EQUIP Ejected
Victim Info
Primary Rd LILAC AV Distance (ft) 0 Direction Secondary Rd RIALTO NCIC 3609 State Hwy? N Route Postmile Prefix Postmile Side of HwyCity Rialto County San Bernardino Population 5 Rpt Dist 137 Beat 003 Type 0 CalTrans Badge 6935 Collision Date 20140105 Time 1630 Day SUNPrimary Collision Factor R-O-W AUTO Violation 21802A Collision Type BROADSIDE Severity INJURY #Killed 0 #Injured 2 Tow Away? N Process Date 20140606Weather1 CLEAR Weather2 Rdwy Surface DRY Rdwy Cond1 NO UNUSL CND Rdwy Cond2 Spec Cond 0Hit and Run FELONY Motor Vehicle Involved WithOTHER MV Lighting DAYLIGHT Ped Action Cntrl Dev NT PRS/FCTR Loc Type Ramp/Int
1F DRVR 998 - IMP UNK IMP UNK PROC ST W E 2301 TOYOT - - N - - -2 DRVR 63 F W HNBD PROC ST N A 0100 TOYOT 2005 - 3 N - M C DRVR COMP PN 63 F 1 0 M C
PASS COMP PN 42 F 3 0 M C
Party InfoParty Type Age Sex Race Sobriety1 Sobriety2 Move Pre Dir SW Veh CHP Veh Make Year SP Info OAF1 Viol OAF2 Safety Equip ROLE Ext Of Inj AGE Sex Seat Pos Safety EQUIP Ejected
Victim Info
Primary Rd LILAC AV Distance (ft) 0 Direction Secondary Rd RIALTO AV NCIC 3609 State Hwy? N Route Postmile Prefix Postmile Side of HwyCity Rialto County San Bernardino Population 5 Rpt Dist 136 Beat 004 Type 0 CalTrans Badge 9632 Collision Date 20140206 Time 1826 Day THUPrimary Collision Factor STOP SGN|SIG Violation 22450A Collision Type BROADSIDE Severity INJURY #Killed 0 #Injured 2 Tow Away? N Process Date 20140628Weather1 CLOUDY Weather2 RAINING Rdwy Surface WET Rdwy Cond1 NO UNUSL CND Rdwy Cond2 Spec Cond 0Hit and Run Motor Vehicle Involved WithOTHER MV Lighting DUSK/DAWNPed Action Cntrl Dev FNCTNG Loc Type Ramp/Int
1F DRVR 24 F W HNBD PROC ST E A 0100 HONDA 1994 - 3 F - M G DRVR COMP PN 24 F 1 0 M GPASS COMP PN 21 M 3 0 M G
Party InfoParty Type Age Sex Race Sobriety1 Sobriety2 Move Pre Dir SW Veh CHP Veh Make Year SP Info OAF1 Viol OAF2 Safety Equip ROLE Ext Of Inj AGE Sex Seat Pos Safety EQUIP Ejected
Victim Info
Page 50 This report is accepted subject to the Terms of Use. Due to collision records processing backlogs, SWITRS data is typically seven months behind. Data requested for dates seven months prior to the current date will be incomplete.
Agenda Item No. 4 Attachment

01/01/2014 thru 12/31/2014
Report Run On: 08/22/2016
Total Count: 530
Include State Highways cases
Jurisdiction(s): Rialto
PASS COMP PN 11 M 4 0 M GPASS COMP PN 12 M 5 0 P GPASS OTH VIS 11 M 6 0 M G
2 DRVR 80 F HNBD PROC ST E A 0100 FORD 1999 - 3 N - L G DRVR COMP PN 80 F 1 0 L G
Primary Rd MERRILL AV Distance (ft) 99 Direction E Secondary Rd EDISON POLE NCIC 3609 State Hwy? N Route Postmile Prefix Postmile Side of HwyCity Rialto County San Bernardino Population 5 Rpt Dist 144 Beat 003 Type 0 CalTrans Badge 9632 Collision Date 20141001 Time 1946 Day WEDPrimary Collision Factor PED VIOL Violation 21956A Collision Type AUTO/PED Severity INJURY #Killed 0 #Injured 1 Tow Away? N Process Date 20141217Weather1 CLEAR Weather2 Rdwy Surface DRY Rdwy Cond1 NO UNUSL CND Rdwy Cond2 Spec Cond 0Hit and Run Motor Vehicle Involved WithPED Lighting DARK - ST Ped Action IN RD, Cntrl Dev NT PRS/FCTR Loc Type Ramp/Int
1F PED 12 M H HNBD PROC ST E N 6000 - - 3 N - - - PED OTH VIS 12 M 9 1 - -2 DRVR 18 M H HNBD PROC ST E A 0100 HONDA 2001 - 3 N - M G PASS 18 F 3 3 M G
Party InfoParty Type Age Sex Race Sobriety1 Sobriety2 Move Pre Dir SW Veh CHP Veh Make Year SP Info OAF1 Viol OAF2 Safety Equip ROLE Ext Of Inj AGE Sex Seat Pos Safety EQUIP Ejected
Victim Info
Primary Rd MERRILL AV Distance (ft) 0 Direction Secondary Rd LINDEN AV NCIC 3609 State Hwy? N Route Postmile Prefix Postmile Side of HwyCity Rialto County San Bernardino Population 5 Rpt Dist 155 Beat 003 Type 0 CalTrans Badge 3156 Collision Date 20140722 Time 2156 Day TUEPrimary Collision Factor R-O-W AUTO Violation 21802A Collision Type BROADSIDE Severity INJURY #Killed 0 #Injured 1 Tow Away? Y Process Date 20140814Weather1 CLEAR Weather2 Rdwy Surface DRY Rdwy Cond1 NO UNUSL CND Rdwy Cond2 Spec Cond 0Hit and Run Motor Vehicle Involved WithOTHER MV Lighting DARK - ST Ped Action Cntrl Dev FNCTNG Loc Type Ramp/Int
1F DRVR 20 F H HNBD PROC ST N A 0100 TOYOT 2003 - - N - M G PASS 19 M 3 3 M G2 DRVR 23 F B HNBD PROC ST E A 0100 HONDA 1996 - - N - L G DRVR COMP PN 23 F 1 0 L G
PASS 14 M 3 3 L G
Party InfoParty Type Age Sex Race Sobriety1 Sobriety2 Move Pre Dir SW Veh CHP Veh Make Year SP Info OAF1 Viol OAF2 Safety Equip ROLE Ext Of Inj AGE Sex Seat Pos Safety EQUIP Ejected
Victim Info
Primary Rd MERRILL AV Distance (ft) 84 Direction E Secondary Rd LINDEN AV NCIC 3609 State Hwy? N Route Postmile Prefix Postmile Side of HwyCity Rialto County San Bernardino Population 5 Rpt Dist 144 Beat Type 0 CalTrans Badge 4384 Collision Date 20140829 Time 0321 Day FRIPrimary Collision Factor DRVR ALC|DRG Violation 23152A Collision Type HIT OBJECT Severity PDO #Killed 0 #Injured 0 Tow Away? Y Process Date 20150429Weather1 CLEAR Weather2 Rdwy Surface DRY Rdwy Cond1 NO UNUSL CND Rdwy Cond2 Spec Cond 0Hit and Run Motor Vehicle Involved WithFIXED OBJ Lighting DARK - ST Ped Action Cntrl Dev NT PRS/FCTR Loc Type Ramp/Int
1F DRVR 21 M H HBD-UI LFT TURN E A 0100 BMW 1995 - 3 A 22107 - M B
Party InfoParty Type Age Sex Race Sobriety1 Sobriety2 Move Pre Dir SW Veh CHP Veh Make Year SP Info OAF1 Viol OAF2 Safety Equip ROLE Ext Of Inj AGE Sex Seat Pos Safety EQUIP Ejected
Victim Info
Primary Rd MERRILL AV Distance (ft) 0 Direction Secondary Rd LINDEN AV NCIC 3609 State Hwy? N Route Postmile Prefix Postmile Side of HwyCity Rialto County San Bernardino Population 5 Rpt Dist 155 Beat 003 Type 0 CalTrans Badge 6935 Collision Date 20141025 Time 1213 Day SATPrimary Collision Factor R-O-W AUTO Violation 21804A Collision Type BROADSIDE Severity INJURY #Killed 0 #Injured 1 Tow Away? Y Process Date 20141229Weather1 CLEAR Weather2 Rdwy Surface DRY Rdwy Cond1 NO UNUSL CND Rdwy Cond2 Spec Cond 0Hit and Run Motor Vehicle Involved WithMV ON OTHER RD Lighting DAYLIGHT Ped Action Cntrl Dev FNCTNG Loc Type Ramp/Int
1F DRVR 38 M H HNBD LFT TURN E A 0100 GMC 2003 - 3 A 21804 - M G2 DRVR 38 F W HNBD PROC ST E A 0100 HYUND 2013 - 3 N - L G DRVR COMP PN 38 F 1 0 L G
Party InfoParty Type Age Sex Race Sobriety1 Sobriety2 Move Pre Dir SW Veh CHP Veh Make Year SP Info OAF1 Viol OAF2 Safety Equip ROLE Ext Of Inj AGE Sex Seat Pos Safety EQUIP Ejected
Victim Info
Page 58 This report is accepted subject to the Terms of Use. Due to collision records processing backlogs, SWITRS data is typically seven months behind. Data requested for dates seven months prior to the current date will be incomplete.
Agenda Item No. 4 Attachment

01/01/2014 thru 12/31/2014
Report Run On: 08/22/2016
Total Count: 530
Include State Highways cases
Jurisdiction(s): Rialto
Primary Rd MERRILL AV Distance (ft) 0 Direction Secondary Rd LINDEN AV NCIC 3609 State Hwy? N Route Postmile Prefix Postmile Side of HwyCity Rialto County San Bernardino Population 5 Rpt Dist 143 Beat 003 Type 0 CalTrans Badge 5550 Collision Date 20141027 Time 1552 Day MONPrimary Collision Factor STOP SGN|SIG Violation 22450A Collision Type BROADSIDE Severity INJURY #Killed 0 #Injured 2 Tow Away? Y Process Date 20141230Weather1 CLEAR Weather2 Rdwy Surface DRY Rdwy Cond1 NO UNUSL CND Rdwy Cond2 Spec Cond 0Hit and Run Motor Vehicle Involved WithOTHER MV Lighting DAYLIGHT Ped Action Cntrl Dev FNCTNG Loc Type Ramp/Int
1F DRVR 76 M H HNBD PROC ST N D 2200 NISSA 2004 - 3 J - M G2 DRVR 57 F W HNBD PROC ST W A 0100 CHEVR 2014 - 3 N - L G DRVR COMP PN 57 F 1 0 L G
PASS OTH VIS 71 M 3 0 L GPASS 8 M 6 3 M G
Party InfoParty Type Age Sex Race Sobriety1 Sobriety2 Move Pre Dir SW Veh CHP Veh Make Year SP Info OAF1 Viol OAF2 Safety Equip ROLE Ext Of Inj AGE Sex Seat Pos Safety EQUIP Ejected
Victim Info
Primary Rd MERRILL AV Distance (ft) 0 Direction Secondary Rd LINDEN AV NCIC 3609 State Hwy? N Route Postmile Prefix Postmile Side of HwyCity Rialto County San Bernardino Population 5 Rpt Dist 143 Beat 003 Type 0 CalTrans Badge 1589 Collision Date 20141117 Time 0250 Day MONPrimary Collision Factor DRVR ALC|DRG Violation 23152 Collision Type REAR END Severity PDO #Killed 0 #Injured 0 Tow Away? N Process Date 20150702Weather1 CLEAR Weather2 WIND Rdwy Surface DRY Rdwy Cond1 NO UNUSL CND Rdwy Cond2 Spec Cond 0Hit and Run Motor Vehicle Involved WithOTHER MV Lighting DARK - ST Ped Action Cntrl Dev FNCTNG Loc Type Ramp/Int
1F DRVR 22 M H HBD-UI PROC ST E A 0100 HONDA 1997 - - A 22350 - L B2 DRVR 47 M H HNBD PROC ST E - 0035 CHEVR 2001 - - N - M G
Party InfoParty Type Age Sex Race Sobriety1 Sobriety2 Move Pre Dir SW Veh CHP Veh Make Year SP Info OAF1 Viol OAF2 Safety Equip ROLE Ext Of Inj AGE Sex Seat Pos Safety EQUIP Ejected
Victim Info
Primary Rd MERRILL AV Distance (ft) 0 Direction Secondary Rd LINDEN AV NCIC 3609 State Hwy? N Route Postmile Prefix Postmile Side of HwyCity Rialto County San Bernardino Population 5 Rpt Dist 155 Beat 003 Type 0 CalTrans Badge 3156 Collision Date 20141125 Time 1852 Day TUEPrimary Collision Factor R-O-W AUTO Violation 21802A Collision Type BROADSIDE Severity INJURY #Killed 0 #Injured 2 Tow Away? N Process Date 20150122Weather1 CLEAR Weather2 Rdwy Surface DRY Rdwy Cond1 NO UNUSL CND Rdwy Cond2 Spec Cond 0Hit and Run Motor Vehicle Involved WithOTHER MV Lighting DARK - ST Ped Action Cntrl Dev FNCTNG Loc Type Ramp/Int
1F DRVR 40 F B HNBD PROC ST S A 0100 HYUND 2013 - - N - M G DRVR COMP PN 40 F 1 0 M G2 DRVR 55 M H HNBD PROC ST W C 0200 YAMAH 2013 - - N - P W DRVR OTH VIS 55 M 1 1 P W
Party InfoParty Type Age Sex Race Sobriety1 Sobriety2 Move Pre Dir SW Veh CHP Veh Make Year SP Info OAF1 Viol OAF2 Safety Equip ROLE Ext Of Inj AGE Sex Seat Pos Safety EQUIP Ejected
Victim Info
Primary Rd MERRILL AV Distance (ft) 0 Direction Secondary Rd RIVERSIDE AV NCIC 3609 State Hwy? N Route Postmile Prefix Postmile Side of HwyCity Rialto County San Bernardino Population 5 Rpt Dist 162 Beat 004 Type 0 CalTrans Badge 9632 Collision Date 20140428 Time 1807 Day MONPrimary Collision Factor UNSAFE SPEED Violation 22350 Collision Type REAR END Severity PDO #Killed 0 #Injured 0 Tow Away? N Process Date 20150403Weather1 CLEAR Weather2 Rdwy Surface DRY Rdwy Cond1 NO UNUSL CND Rdwy Cond2 Spec Cond 0Hit and Run MSDMNR Motor Vehicle Involved WithOTHER MV Lighting DAYLIGHT Ped Action Cntrl Dev FNCTNG Loc Type Ramp/Int
1F DRVR 998 F H IMP UNK IMP UNK PROC ST W A 0100 CHRYS 2004 - 3 A 22350 G M B2 DRVR 54 M H HNBD STOPPED W A 0100 DODGE 2001 - 3 N - M G PASS 57 F 3 3 M G3 DRVR 62 M H HNBD STOPPED W A 0700 FORD 2000 - 3 N - M G
Party InfoParty Type Age Sex Race Sobriety1 Sobriety2 Move Pre Dir SW Veh CHP Veh Make Year SP Info OAF1 Viol OAF2 Safety Equip ROLE Ext Of Inj AGE Sex Seat Pos Safety EQUIP Ejected
Victim Info
Primary Rd MERRILL AV Distance (ft) 388 Direction E Secondary Rd RIVERSIDE AV NCIC 3609 State Hwy? N Route Postmile Prefix Postmile Side of HwyCity Rialto County San Bernardino Population 5 Rpt Dist 162 Beat 004 Type 0 CalTrans Badge 6367 Collision Date 20140811 Time 0709 Day MONPrimary Collision Factor R-O-W AUTO Violation 21804A Collision Type BROADSIDE Severity INJURY #Killed 0 #Injured 1 Tow Away? N Process Date 20140926Weather1 CLEAR Weather2 Rdwy Surface DRY Rdwy Cond1 NO UNUSL CND Rdwy Cond2 Spec Cond 0Hit and Run Motor Vehicle Involved WithOTHER MV Lighting DAYLIGHT Ped Action Cntrl Dev FNCTNG Loc Type Ramp/Int
1F DRVR 30 F H HNBD LFT TURN N A 0100 BUICK 2013 - 3 N - M G2 DRVR 59 F H HNBD PROC ST E A 0100 TOYOT 1994 - 3 N - M G PASS 12 F 3 3 M G
Party InfoParty Type Age Sex Race Sobriety1 Sobriety2 Move Pre Dir SW Veh CHP Veh Make Year SP Info OAF1 Viol OAF2 Safety Equip ROLE Ext Of Inj AGE Sex Seat Pos Safety EQUIP Ejected
Victim Info
Page 59 This report is accepted subject to the Terms of Use. Due to collision records processing backlogs, SWITRS data is typically seven months behind. Data requested for dates seven months prior to the current date will be incomplete.
Agenda Item No. 4 Attachment
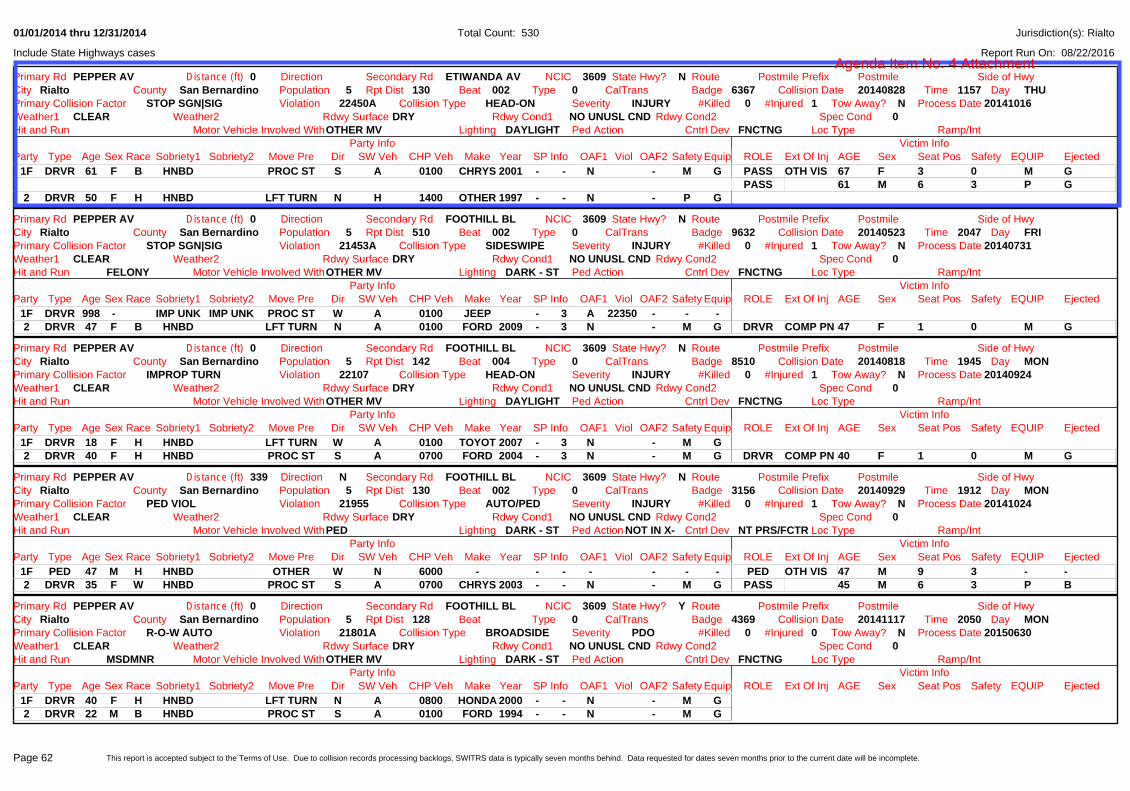
01/01/2014 thru 12/31/2014
Report Run On: 08/22/2016
Total Count: 530
Include State Highways cases
Jurisdiction(s): Rialto
Primary Rd PEPPER AV Distance (ft) 0 Direction Secondary Rd ETIWANDA AV NCIC 3609 State Hwy? N Route Postmile Prefix Postmile Side of HwyCity Rialto County San Bernardino Population 5 Rpt Dist 130 Beat 002 Type 0 CalTrans Badge 6367 Collision Date 20140828 Time 1157 Day THUPrimary Collision Factor STOP SGN|SIG Violation 22450A Collision Type HEAD-ON Severity INJURY #Killed 0 #Injured 1 Tow Away? N Process Date 20141016Weather1 CLEAR Weather2 Rdwy Surface DRY Rdwy Cond1 NO UNUSL CND Rdwy Cond2 Spec Cond 0Hit and Run Motor Vehicle Involved WithOTHER MV Lighting DAYLIGHT Ped Action Cntrl Dev FNCTNG Loc Type Ramp/Int
1F DRVR 61 F B HNBD PROC ST S A 0100 CHRYS 2001 - - N - M G PASS OTH VIS 67 F 3 0 M GPASS 61 M 6 3 P G
2 DRVR 50 F H HNBD LFT TURN N H 1400 OTHER 1997 - - N - P G
Party InfoParty Type Age Sex Race Sobriety1 Sobriety2 Move Pre Dir SW Veh CHP Veh Make Year SP Info OAF1 Viol OAF2 Safety Equip ROLE Ext Of Inj AGE Sex Seat Pos Safety EQUIP Ejected
Victim Info
Primary Rd PEPPER AV Distance (ft) 0 Direction Secondary Rd FOOTHILL BL NCIC 3609 State Hwy? N Route Postmile Prefix Postmile Side of HwyCity Rialto County San Bernardino Population 5 Rpt Dist 510 Beat 002 Type 0 CalTrans Badge 9632 Collision Date 20140523 Time 2047 Day FRIPrimary Collision Factor STOP SGN|SIG Violation 21453A Collision Type SIDESWIPE Severity INJURY #Killed 0 #Injured 1 Tow Away? N Process Date 20140731Weather1 CLEAR Weather2 Rdwy Surface DRY Rdwy Cond1 NO UNUSL CND Rdwy Cond2 Spec Cond 0Hit and Run FELONY Motor Vehicle Involved WithOTHER MV Lighting DARK - ST Ped Action Cntrl Dev FNCTNG Loc Type Ramp/Int
1F DRVR 998 - IMP UNK IMP UNK PROC ST W A 0100 JEEP - 3 A 22350 - - -2 DRVR 47 F B HNBD LFT TURN N A 0100 FORD 2009 - 3 N - M G DRVR COMP PN 47 F 1 0 M G
Party InfoParty Type Age Sex Race Sobriety1 Sobriety2 Move Pre Dir SW Veh CHP Veh Make Year SP Info OAF1 Viol OAF2 Safety Equip ROLE Ext Of Inj AGE Sex Seat Pos Safety EQUIP Ejected
Victim Info
Primary Rd PEPPER AV Distance (ft) 0 Direction Secondary Rd FOOTHILL BL NCIC 3609 State Hwy? N Route Postmile Prefix Postmile Side of HwyCity Rialto County San Bernardino Population 5 Rpt Dist 142 Beat 004 Type 0 CalTrans Badge 8510 Collision Date 20140818 Time 1945 Day MONPrimary Collision Factor IMPROP TURN Violation 22107 Collision Type HEAD-ON Severity INJURY #Killed 0 #Injured 1 Tow Away? N Process Date 20140924Weather1 CLEAR Weather2 Rdwy Surface DRY Rdwy Cond1 NO UNUSL CND Rdwy Cond2 Spec Cond 0Hit and Run Motor Vehicle Involved WithOTHER MV Lighting DAYLIGHT Ped Action Cntrl Dev FNCTNG Loc Type Ramp/Int
1F DRVR 18 F H HNBD LFT TURN W A 0100 TOYOT 2007 - 3 N - M G2 DRVR 40 F H HNBD PROC ST S A 0700 FORD 2004 - 3 N - M G DRVR COMP PN 40 F 1 0 M G
Party InfoParty Type Age Sex Race Sobriety1 Sobriety2 Move Pre Dir SW Veh CHP Veh Make Year SP Info OAF1 Viol OAF2 Safety Equip ROLE Ext Of Inj AGE Sex Seat Pos Safety EQUIP Ejected
Victim Info
Primary Rd PEPPER AV Distance (ft) 339 Direction N Secondary Rd FOOTHILL BL NCIC 3609 State Hwy? N Route Postmile Prefix Postmile Side of HwyCity Rialto County San Bernardino Population 5 Rpt Dist 130 Beat 002 Type 0 CalTrans Badge 3156 Collision Date 20140929 Time 1912 Day MONPrimary Collision Factor PED VIOL Violation 21955 Collision Type AUTO/PED Severity INJURY #Killed 0 #Injured 1 Tow Away? N Process Date 20141024Weather1 CLEAR Weather2 Rdwy Surface DRY Rdwy Cond1 NO UNUSL CND Rdwy Cond2 Spec Cond 0Hit and Run Motor Vehicle Involved WithPED Lighting DARK - ST Ped Action NOT IN X- Cntrl Dev NT PRS/FCTR Loc Type Ramp/Int
1F PED 47 M H HNBD OTHER W N 6000 - - - - - - - PED OTH VIS 47 M 9 3 - -2 DRVR 35 F W HNBD PROC ST S A 0700 CHRYS 2003 - - N - M G PASS 45 M 6 3 P B
Party InfoParty Type Age Sex Race Sobriety1 Sobriety2 Move Pre Dir SW Veh CHP Veh Make Year SP Info OAF1 Viol OAF2 Safety Equip ROLE Ext Of Inj AGE Sex Seat Pos Safety EQUIP Ejected
Victim Info
Primary Rd PEPPER AV Distance (ft) 0 Direction Secondary Rd FOOTHILL BL NCIC 3609 State Hwy? Y Route Postmile Prefix Postmile Side of HwyCity Rialto County San Bernardino Population 5 Rpt Dist 128 Beat Type 0 CalTrans Badge 4369 Collision Date 20141117 Time 2050 Day MONPrimary Collision Factor R-O-W AUTO Violation 21801A Collision Type BROADSIDE Severity PDO #Killed 0 #Injured 0 Tow Away? N Process Date 20150630Weather1 CLEAR Weather2 Rdwy Surface DRY Rdwy Cond1 NO UNUSL CND Rdwy Cond2 Spec Cond 0Hit and Run MSDMNR Motor Vehicle Involved WithOTHER MV Lighting DARK - ST Ped Action Cntrl Dev FNCTNG Loc Type Ramp/Int
1F DRVR 40 F H HNBD LFT TURN N A 0800 HONDA 2000 - - N - M G2 DRVR 22 M B HNBD PROC ST S A 0100 FORD 1994 - - N - M G
Party InfoParty Type Age Sex Race Sobriety1 Sobriety2 Move Pre Dir SW Veh CHP Veh Make Year SP Info OAF1 Viol OAF2 Safety Equip ROLE Ext Of Inj AGE Sex Seat Pos Safety EQUIP Ejected
Victim Info
Page 62 This report is accepted subject to the Terms of Use. Due to collision records processing backlogs, SWITRS data is typically seven months behind. Data requested for dates seven months prior to the current date will be incomplete.
Agenda Item No. 4 Attachment

01/01/2014 thru 12/31/2014
Report Run On: 08/22/2016
Total Count: 530
Include State Highways cases
Jurisdiction(s): Rialto
Primary Rd RIALTO AV Distance (ft) 0 Direction E Secondary Rd CACTUS AV NCIC 3609 State Hwy? N Route Postmile Prefix Postmile Side of HwyCity Rialto County San Bernardino Population 5 Rpt Dist 148 Beat 003 Type 0 CalTrans Badge 1041 Collision Date 20140429 Time 0810 Day TUEPrimary Collision Factor R-O-W AUTO Violation 21804A Collision Type BROADSIDE Severity INJURY #Killed 0 #Injured 2 Tow Away? Y Process Date 20140714Weather1 CLEAR Weather2 Rdwy Surface DRY Rdwy Cond1 NO UNUSL CND Rdwy Cond2 Spec Cond 0Hit and Run Motor Vehicle Involved WithOTHER MV Lighting DAYLIGHT Ped Action Cntrl Dev NT PRS/FCTR Loc Type Ramp/Int
1F DRVR 52 M W HNBD ENT TRAF N D 2200 GMC 2013 - - N - M G DRVR OTH VIS 52 M 1 3 M G2 DRVR 55 F W HNBD PROC ST E A 0100 OLDSM 2000 - - N - M G DRVR COMP PN 55 F 1 3 M G
Party InfoParty Type Age Sex Race Sobriety1 Sobriety2 Move Pre Dir SW Veh CHP Veh Make Year SP Info OAF1 Viol OAF2 Safety Equip ROLE Ext Of Inj AGE Sex Seat Pos Safety EQUIP Ejected
Victim Info
Primary Rd RIALTO AV Distance (ft) 76 Direction E Secondary Rd CACTUS AV NCIC 3609 State Hwy? N Route Postmile Prefix Postmile Side of HwyCity Rialto County San Bernardino Population 5 Rpt Dist 95 Beat 003 Type 0 CalTrans Badge 6367 Collision Date 20141107 Time 0618 Day FRIPrimary Collision Factor STRTNG|BCKNG Violation 22106 Collision Type REAR END Severity PDO #Killed 0 #Injured 0 Tow Away? N Process Date 20141219Weather1 CLEAR Weather2 Rdwy Surface DRY Rdwy Cond1 NO UNUSL CND Rdwy Cond2 Spec Cond 0Hit and Run Motor Vehicle Involved WithOTHER MV Lighting DAYLIGHT Ped Action Cntrl Dev NT PRS/FCTR Loc Type Ramp/Int
1F DRVR 54 M B HNBD BACKING W A 0800 FORD 2010 - 3 N - M H2 PRKD 998 - HNBD PARKED E J 4800 FORD 2013 - 3 N - - -
Party InfoParty Type Age Sex Race Sobriety1 Sobriety2 Move Pre Dir SW Veh CHP Veh Make Year SP Info OAF1 Viol OAF2 Safety Equip ROLE Ext Of Inj AGE Sex Seat Pos Safety EQUIP Ejected
Victim Info
Primary Rd RIALTO AV Distance (ft) 0 Direction Secondary Rd ENCINA AV NCIC 3609 State Hwy? N Route Postmile Prefix Postmile Side of HwyCity Rialto County San Bernardino Population 5 Rpt Dist 153 Beat 004 Type 0 CalTrans Badge 1041 Collision Date 20140521 Time 1444 Day WEDPrimary Collision Factor UNSAFE SPEED Violation 22350 Collision Type REAR END Severity INJURY #Killed 0 #Injured 1 Tow Away? N Process Date 20140801Weather1 CLEAR Weather2 Rdwy Surface DRY Rdwy Cond1 NO UNUSL CND Rdwy Cond2 Spec Cond 0Hit and Run FELONY Motor Vehicle Involved WithOTHER MV Lighting DAYLIGHT Ped Action Cntrl Dev NT PRS/FCTR Loc Type Ramp/Int
1F DRVR 998 M H IMP UNK IMP UNK PROC ST E A 0100 CHEVR - - N - N B2 DRVR 36 F H HNBD STOPPED E A 0100 DODGE 2005 - - N - M G PASS COMP PN 11 F 3 3 M G
Party InfoParty Type Age Sex Race Sobriety1 Sobriety2 Move Pre Dir SW Veh CHP Veh Make Year SP Info OAF1 Viol OAF2 Safety Equip ROLE Ext Of Inj AGE Sex Seat Pos Safety EQUIP Ejected
Victim Info
Primary Rd RIALTO AV Distance (ft) 54 Direction E Secondary Rd EUCALYPTUS AV NCIC 3609 State Hwy? N Route Postmile Prefix Postmile Side of HwyCity Rialto County San Bernardino Population 5 Rpt Dist 142 Beat 004 Type 0 CalTrans Badge 8510 Collision Date 20140403 Time 1512 Day THUPrimary Collision Factor UNSAFE SPEED Violation 22350 Collision Type REAR END Severity PDO #Killed 0 #Injured 0 Tow Away? N Process Date 20140825Weather1 CLEAR Weather2 Rdwy Surface DRY Rdwy Cond1 NO UNUSL CND Rdwy Cond2 Spec Cond 0Hit and Run Motor Vehicle Involved WithOTHER MV Lighting DAYLIGHT Ped Action Cntrl Dev FNCTNG Loc Type Ramp/Int
1F DRVR 18 M H HNBD PROC ST W A 0100 TOYOT 2009 - 3 F - L G2 DRVR 43 M W HNBD STOPPED W E 2233 FORD 2008 - 3 N - M G
Party InfoParty Type Age Sex Race Sobriety1 Sobriety2 Move Pre Dir SW Veh CHP Veh Make Year SP Info OAF1 Viol OAF2 Safety Equip ROLE Ext Of Inj AGE Sex Seat Pos Safety EQUIP Ejected
Victim Info
Primary Rd RIALTO AV Distance (ft) 0 Direction Secondary Rd EUCALYPTUS AV NCIC 3609 State Hwy? N Route Postmile Prefix Postmile Side of HwyCity Rialto County San Bernardino Population 5 Rpt Dist 142 Beat 004 Type 0 CalTrans Badge 8626 Collision Date 20140628 Time 1321 Day SATPrimary Collision Factor R-O-W AUTO Violation 21802A Collision Type BROADSIDE Severity INJURY #Killed 0 #Injured 1 Tow Away? N Process Date 20140811Weather1 CLEAR Weather2 Rdwy Surface DRY Rdwy Cond1 NO UNUSL CND Rdwy Cond2 Spec Cond 0Hit and Run Motor Vehicle Involved WithOTHER MV Lighting DAYLIGHT Ped Action Cntrl Dev FNCTNG Loc Type Ramp/Int
1 DRVR 56 M H HNBD PROC ST W F 2600 DODGE 2004 - - N - M E2 DRVR 52 M H HNBD PROC ST N C 0200 HARLE 2013 - - N - P W DRVR COMP PN 52 M 1 1 P W
Party InfoParty Type Age Sex Race Sobriety1 Sobriety2 Move Pre Dir SW Veh CHP Veh Make Year SP Info OAF1 Viol OAF2 Safety Equip ROLE Ext Of Inj AGE Sex Seat Pos Safety EQUIP Ejected
Victim Info
Page 67 This report is accepted subject to the Terms of Use. Due to collision records processing backlogs, SWITRS data is typically seven months behind. Data requested for dates seven months prior to the current date will be incomplete.
Agenda Item No. 4 Attachment

01/01/2014 thru 12/31/2014
Report Run On: 08/22/2016
Total Count: 530
Include State Highways cases
Jurisdiction(s): Rialto
Primary Rd RIALTO AV Distance (ft) 395 Direction E Secondary Rd LARCH AV NCIC 3609 State Hwy? N Route Postmile Prefix Postmile Side of HwyCity Rialto County San Bernardino Population 5 Rpt Dist 3609 Beat 146 Type 0 CalTrans Badge 0773 Collision Date 20140108 Time 1050 Day WEDPrimary Collision Factor R-O-W AUTO Violation 21804 Collision Type BROADSIDE Severity INJURY #Killed 0 #Injured 3 Tow Away? N Process Date 20140609Weather1 CLEAR Weather2 Rdwy Surface DRY Rdwy Cond1 NO UNUSL CND Rdwy Cond2 Spec Cond 0Hit and Run Motor Vehicle Involved WithOTHER MV Lighting DAYLIGHT Ped Action Cntrl Dev FNCTNG Loc Type Ramp/Int
1F DRVR 28 M B HNBD LFT TURN S A 0700 PONTI 2004 - 3 N - M G DRVR COMP PN 28 M 1 0 M GPASS COMP PN 5 M 5 0 M Q
2 DRVR 55 M H HNBD PROC ST W A 0700 HONDA 1990 - 3 N - M G DRVR COMP PN 55 M 1 0 M G
Party InfoParty Type Age Sex Race Sobriety1 Sobriety2 Move Pre Dir SW Veh CHP Veh Make Year SP Info OAF1 Viol OAF2 Safety Equip ROLE Ext Of Inj AGE Sex Seat Pos Safety EQUIP Ejected
Victim Info
Primary Rd RIALTO AV Distance (ft) 0 Direction Secondary Rd LARCH AV NCIC 3609 State Hwy? N Route Postmile Prefix Postmile Side of HwyCity Rialto County San Bernardino Population 5 Rpt Dist 146 Beat 003 Type 0 CalTrans Badge 6367 Collision Date 20140701 Time 1524 Day TUEPrimary Collision Factor OTHER IMPROP DRV Violation Collision Type HIT OBJECT Severity PDO #Killed 0 #Injured 0 Tow Away? N Process Date 20150415Weather1 CLEAR Weather2 Rdwy Surface DRY Rdwy Cond1 NO UNUSL CND Rdwy Cond2 Spec Cond 0Hit and Run Motor Vehicle Involved WithFIXED OBJ Lighting DAYLIGHT Ped Action Cntrl Dev FNCTNG Loc Type Ramp/Int
1F DRVR 24 M O HNBD RGT TURN E - 0032 FREIG 2012 - 3 N - M G
Party InfoParty Type Age Sex Race Sobriety1 Sobriety2 Move Pre Dir SW Veh CHP Veh Make Year SP Info OAF1 Viol OAF2 Safety Equip ROLE Ext Of Inj AGE Sex Seat Pos Safety EQUIP Ejected
Victim Info
Primary Rd RIALTO AV Distance (ft) 0 Direction Secondary Rd LILAC AV NCIC 3609 State Hwy? N Route Postmile Prefix Postmile Side of HwyCity Rialto County San Bernardino Population 5 Rpt Dist 136 Beat 003 Type 0 CalTrans Badge 5550 Collision Date 20140423 Time 1210 Day WEDPrimary Collision Factor STOP SGN|SIG Violation 22450A Collision Type BROADSIDE Severity PDO #Killed 0 #Injured 0 Tow Away? Y Process Date 20140625Weather1 CLEAR Weather2 Rdwy Surface DRY Rdwy Cond1 NO UNUSL CND Rdwy Cond2 Spec Cond 0Hit and Run Motor Vehicle Involved WithOTHER MV Lighting DAYLIGHT Ped Action Cntrl Dev FNCTNG Loc Type Ramp/Int
1F DRVR 20 F H HNBD PROC ST S A 0100 FORD 2006 - - - - M G PASS 21 F 3 3 M G2 DRVR 56 M H HNBD SLOWING E J 4800 CHEVR 2013 - - N - M G3 PRKD 998 - PARKED S A 0100 TOYOT 2013 - - N - - -
Party InfoParty Type Age Sex Race Sobriety1 Sobriety2 Move Pre Dir SW Veh CHP Veh Make Year SP Info OAF1 Viol OAF2 Safety Equip ROLE Ext Of Inj AGE Sex Seat Pos Safety EQUIP Ejected
Victim Info
Primary Rd RIALTO AV Distance (ft) 315 Direction E Secondary Rd LILAC AV NCIC 3609 State Hwy? N Route Postmile Prefix Postmile Side of HwyCity Rialto County San Bernardino Population 5 Rpt Dist 149 Beat 004 Type 0 CalTrans Badge 6367 Collision Date 20140507 Time 0805 Day WEDPrimary Collision Factor OTHER EQPMNT Violation 29003B Collision Type REAR END Severity PDO #Killed 0 #Injured 0 Tow Away? N Process Date 20140825Weather1 CLEAR Weather2 Rdwy Surface DRY Rdwy Cond1 NO UNUSL CND Rdwy Cond2 Spec Cond 0Hit and Run Motor Vehicle Involved WithOTHER MV Lighting DAYLIGHT Ped Action Cntrl Dev NT PRS/FCTR Loc Type Ramp/Int
1F DRVR 54 M W HNBD RGT TURN E J 4800 FORD 2011 - 3 N - L G
Party InfoParty Type Age Sex Race Sobriety1 Sobriety2 Move Pre Dir SW Veh CHP Veh Make Year SP Info OAF1 Viol OAF2 Safety Equip ROLE Ext Of Inj AGE Sex Seat Pos Safety EQUIP Ejected
Victim Info
Primary Rd RIALTO AV Distance (ft) 0 Direction Secondary Rd LILAC AV NCIC 3609 State Hwy? N Route Postmile Prefix Postmile Side of HwyCity Rialto County San Bernardino Population 5 Rpt Dist 136 Beat 003 Type 0 CalTrans Badge 5550 Collision Date 20140605 Time 1348 Day THUPrimary Collision Factor UNKNOWN Violation Collision Type BROADSIDE Severity INJURY #Killed 0 #Injured 1 Tow Away? Y Process Date 20140805Weather1 CLEAR Weather2 Rdwy Surface DRY Rdwy Cond1 NO UNUSL CND Rdwy Cond2 Spec Cond 0Hit and Run Motor Vehicle Involved WithOTHER MV Lighting DAYLIGHT Ped Action Cntrl Dev FNCTNG Loc Type Ramp/Int
1 DRVR 64 M W HNBD PROC ST S A 0700 TOYOT 2004 - - N - M G DRVR COMP PN 64 M 1 0 M G2 DRVR 46 F H HNBD PROC ST E A 0700 NISSA 2006 - - N - M G PASS 13 M 3 3 M G
Party InfoParty Type Age Sex Race Sobriety1 Sobriety2 Move Pre Dir SW Veh CHP Veh Make Year SP Info OAF1 Viol OAF2 Safety Equip ROLE Ext Of Inj AGE Sex Seat Pos Safety EQUIP Ejected
Victim Info
Page 68 This report is accepted subject to the Terms of Use. Due to collision records processing backlogs, SWITRS data is typically seven months behind. Data requested for dates seven months prior to the current date will be incomplete.
Agenda Item No. 4 Attachment
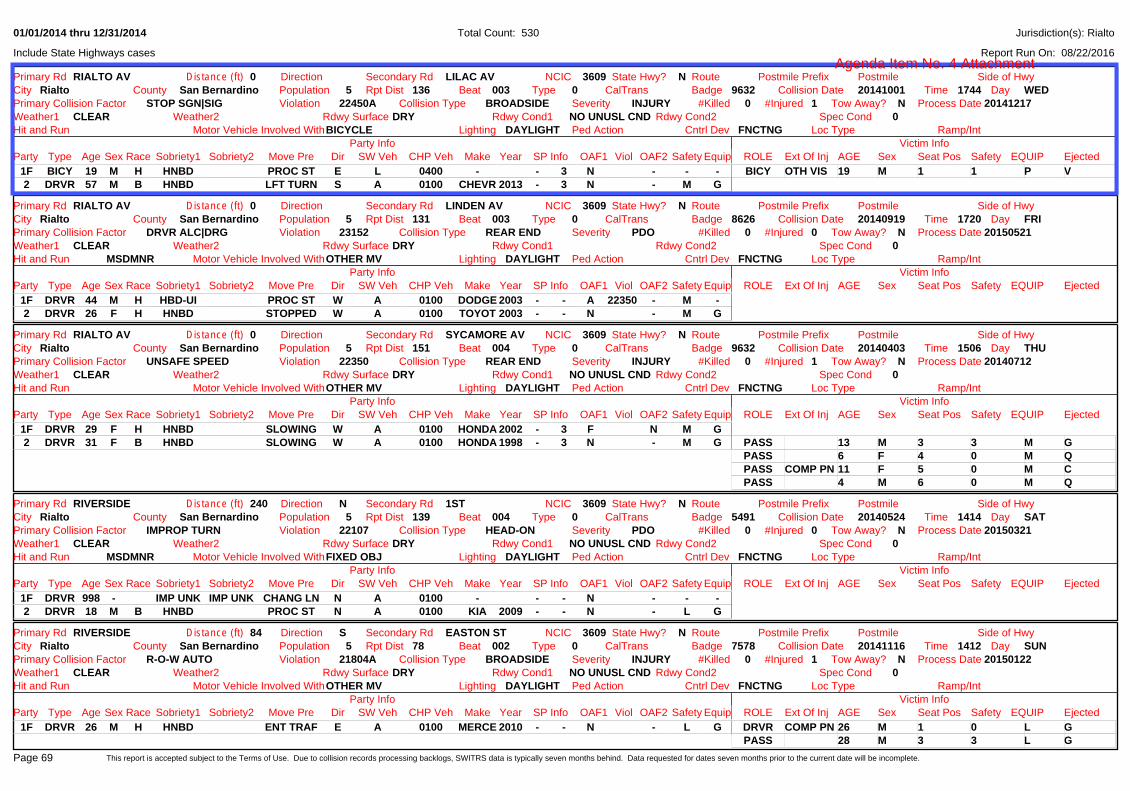
01/01/2014 thru 12/31/2014
Report Run On: 08/22/2016
Total Count: 530
Include State Highways cases
Jurisdiction(s): Rialto
Primary Rd RIALTO AV Distance (ft) 0 Direction Secondary Rd LILAC AV NCIC 3609 State Hwy? N Route Postmile Prefix Postmile Side of HwyCity Rialto County San Bernardino Population 5 Rpt Dist 136 Beat 003 Type 0 CalTrans Badge 9632 Collision Date 20141001 Time 1744 Day WEDPrimary Collision Factor STOP SGN|SIG Violation 22450A Collision Type BROADSIDE Severity INJURY #Killed 0 #Injured 1 Tow Away? N Process Date 20141217Weather1 CLEAR Weather2 Rdwy Surface DRY Rdwy Cond1 NO UNUSL CND Rdwy Cond2 Spec Cond 0Hit and Run Motor Vehicle Involved WithBICYCLE Lighting DAYLIGHT Ped Action Cntrl Dev FNCTNG Loc Type Ramp/Int
1F BICY 19 M H HNBD PROC ST E L 0400 - - 3 N - - - BICY OTH VIS 19 M 1 1 P V2 DRVR 57 M B HNBD LFT TURN S A 0100 CHEVR 2013 - 3 N - M G
Party InfoParty Type Age Sex Race Sobriety1 Sobriety2 Move Pre Dir SW Veh CHP Veh Make Year SP Info OAF1 Viol OAF2 Safety Equip ROLE Ext Of Inj AGE Sex Seat Pos Safety EQUIP Ejected
Victim Info
Primary Rd RIALTO AV Distance (ft) 0 Direction Secondary Rd LINDEN AV NCIC 3609 State Hwy? N Route Postmile Prefix Postmile Side of HwyCity Rialto County San Bernardino Population 5 Rpt Dist 131 Beat 003 Type 0 CalTrans Badge 8626 Collision Date 20140919 Time 1720 Day FRIPrimary Collision Factor DRVR ALC|DRG Violation 23152 Collision Type REAR END Severity PDO #Killed 0 #Injured 0 Tow Away? N Process Date 20150521Weather1 CLEAR Weather2 Rdwy Surface DRY Rdwy Cond1 Rdwy Cond2 Spec Cond 0Hit and Run MSDMNR Motor Vehicle Involved WithOTHER MV Lighting DAYLIGHT Ped Action Cntrl Dev FNCTNG Loc Type Ramp/Int
1F DRVR 44 M H HBD-UI PROC ST W A 0100 DODGE 2003 - - A 22350 - M -2 DRVR 26 F H HNBD STOPPED W A 0100 TOYOT 2003 - - N - M G
Party InfoParty Type Age Sex Race Sobriety1 Sobriety2 Move Pre Dir SW Veh CHP Veh Make Year SP Info OAF1 Viol OAF2 Safety Equip ROLE Ext Of Inj AGE Sex Seat Pos Safety EQUIP Ejected
Victim Info
Primary Rd RIALTO AV Distance (ft) 0 Direction Secondary Rd SYCAMORE AV NCIC 3609 State Hwy? N Route Postmile Prefix Postmile Side of HwyCity Rialto County San Bernardino Population 5 Rpt Dist 151 Beat 004 Type 0 CalTrans Badge 9632 Collision Date 20140403 Time 1506 Day THUPrimary Collision Factor UNSAFE SPEED Violation 22350 Collision Type REAR END Severity INJURY #Killed 0 #Injured 1 Tow Away? N Process Date 20140712Weather1 CLEAR Weather2 Rdwy Surface DRY Rdwy Cond1 NO UNUSL CND Rdwy Cond2 Spec Cond 0Hit and Run Motor Vehicle Involved WithOTHER MV Lighting DAYLIGHT Ped Action Cntrl Dev FNCTNG Loc Type Ramp/Int
1F DRVR 29 F H HNBD SLOWING W A 0100 HONDA 2002 - 3 F N M G2 DRVR 31 F B HNBD SLOWING W A 0100 HONDA 1998 - 3 N - M G PASS 13 M 3 3 M G
PASS 6 F 4 0 M QPASS COMP PN 11 F 5 0 M CPASS 4 M 6 0 M Q
Party InfoParty Type Age Sex Race Sobriety1 Sobriety2 Move Pre Dir SW Veh CHP Veh Make Year SP Info OAF1 Viol OAF2 Safety Equip ROLE Ext Of Inj AGE Sex Seat Pos Safety EQUIP Ejected
Victim Info
Primary Rd RIVERSIDE Distance (ft) 240 Direction N Secondary Rd 1ST NCIC 3609 State Hwy? N Route Postmile Prefix Postmile Side of HwyCity Rialto County San Bernardino Population 5 Rpt Dist 139 Beat 004 Type 0 CalTrans Badge 5491 Collision Date 20140524 Time 1414 Day SATPrimary Collision Factor IMPROP TURN Violation 22107 Collision Type HEAD-ON Severity PDO #Killed 0 #Injured 0 Tow Away? N Process Date 20150321Weather1 CLEAR Weather2 Rdwy Surface DRY Rdwy Cond1 NO UNUSL CND Rdwy Cond2 Spec Cond 0Hit and Run MSDMNR Motor Vehicle Involved WithFIXED OBJ Lighting DAYLIGHT Ped Action Cntrl Dev FNCTNG Loc Type Ramp/Int
1F DRVR 998 - IMP UNK IMP UNK CHANG LN N A 0100 - - - N - - -2 DRVR 18 M B HNBD PROC ST N A 0100 KIA 2009 - - N - L G
Party InfoParty Type Age Sex Race Sobriety1 Sobriety2 Move Pre Dir SW Veh CHP Veh Make Year SP Info OAF1 Viol OAF2 Safety Equip ROLE Ext Of Inj AGE Sex Seat Pos Safety EQUIP Ejected
Victim Info
Primary Rd RIVERSIDE Distance (ft) 84 Direction S Secondary Rd EASTON ST NCIC 3609 State Hwy? N Route Postmile Prefix Postmile Side of HwyCity Rialto County San Bernardino Population 5 Rpt Dist 78 Beat 002 Type 0 CalTrans Badge 7578 Collision Date 20141116 Time 1412 Day SUNPrimary Collision Factor R-O-W AUTO Violation 21804A Collision Type BROADSIDE Severity INJURY #Killed 0 #Injured 1 Tow Away? N Process Date 20150122Weather1 CLEAR Weather2 Rdwy Surface DRY Rdwy Cond1 NO UNUSL CND Rdwy Cond2 Spec Cond 0Hit and Run Motor Vehicle Involved WithOTHER MV Lighting DAYLIGHT Ped Action Cntrl Dev FNCTNG Loc Type Ramp/Int
1F DRVR 26 M H HNBD ENT TRAF E A 0100 MERCE 2010 - - N - L G DRVR COMP PN 26 M 1 0 L GPASS 28 M 3 3 L G
Party InfoParty Type Age Sex Race Sobriety1 Sobriety2 Move Pre Dir SW Veh CHP Veh Make Year SP Info OAF1 Viol OAF2 Safety Equip ROLE Ext Of Inj AGE Sex Seat Pos Safety EQUIP Ejected
Victim Info
Page 69 This report is accepted subject to the Terms of Use. Due to collision records processing backlogs, SWITRS data is typically seven months behind. Data requested for dates seven months prior to the current date will be incomplete.
Agenda Item No. 4 Attachment
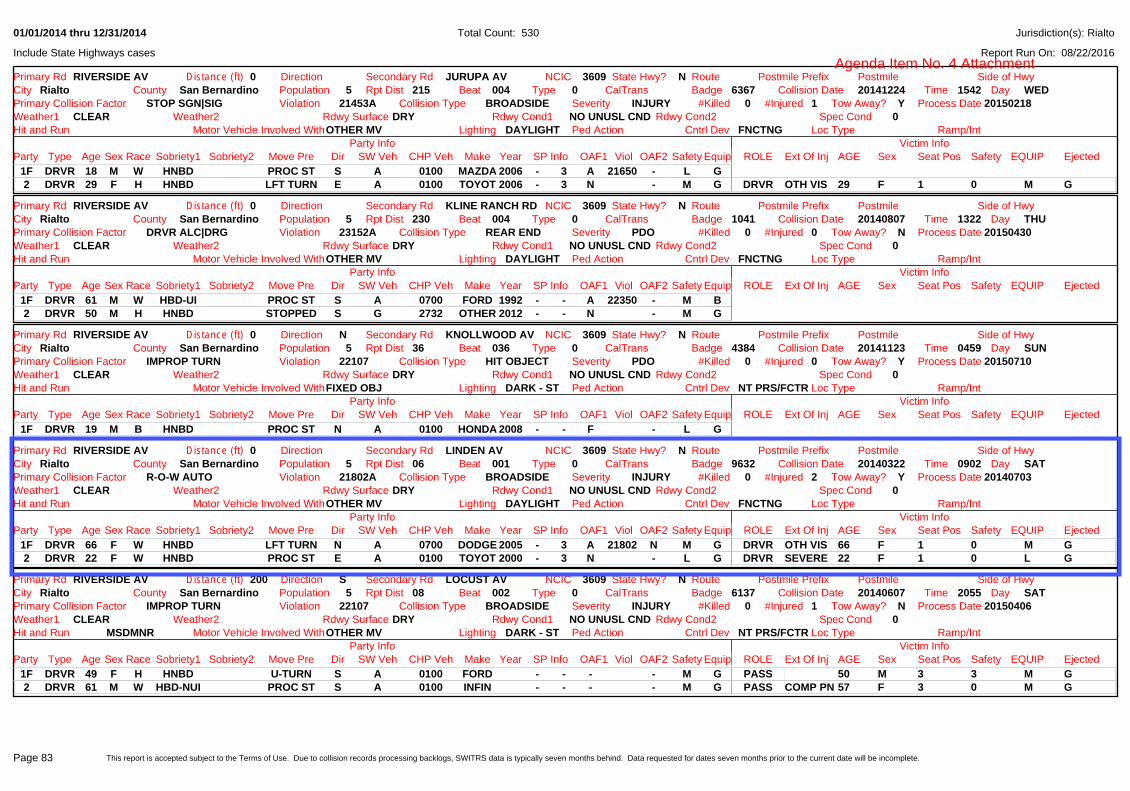
01/01/2014 thru 12/31/2014
Report Run On: 08/22/2016
Total Count: 530
Include State Highways cases
Jurisdiction(s): Rialto
Primary Rd RIVERSIDE AV Distance (ft) 0 Direction Secondary Rd JURUPA AV NCIC 3609 State Hwy? N Route Postmile Prefix Postmile Side of HwyCity Rialto County San Bernardino Population 5 Rpt Dist 215 Beat 004 Type 0 CalTrans Badge 6367 Collision Date 20141224 Time 1542 Day WEDPrimary Collision Factor STOP SGN|SIG Violation 21453A Collision Type BROADSIDE Severity INJURY #Killed 0 #Injured 1 Tow Away? Y Process Date 20150218Weather1 CLEAR Weather2 Rdwy Surface DRY Rdwy Cond1 NO UNUSL CND Rdwy Cond2 Spec Cond 0Hit and Run Motor Vehicle Involved WithOTHER MV Lighting DAYLIGHT Ped Action Cntrl Dev FNCTNG Loc Type Ramp/Int
1F DRVR 18 M W HNBD PROC ST S A 0100 MAZDA 2006 - 3 A 21650 - L G2 DRVR 29 F H HNBD LFT TURN E A 0100 TOYOT 2006 - 3 N - M G DRVR OTH VIS 29 F 1 0 M G
Party InfoParty Type Age Sex Race Sobriety1 Sobriety2 Move Pre Dir SW Veh CHP Veh Make Year SP Info OAF1 Viol OAF2 Safety Equip ROLE Ext Of Inj AGE Sex Seat Pos Safety EQUIP Ejected
Victim Info
Primary Rd RIVERSIDE AV Distance (ft) 0 Direction Secondary Rd KLINE RANCH RD NCIC 3609 State Hwy? N Route Postmile Prefix Postmile Side of HwyCity Rialto County San Bernardino Population 5 Rpt Dist 230 Beat 004 Type 0 CalTrans Badge 1041 Collision Date 20140807 Time 1322 Day THUPrimary Collision Factor DRVR ALC|DRG Violation 23152A Collision Type REAR END Severity PDO #Killed 0 #Injured 0 Tow Away? N Process Date 20150430Weather1 CLEAR Weather2 Rdwy Surface DRY Rdwy Cond1 NO UNUSL CND Rdwy Cond2 Spec Cond 0Hit and Run Motor Vehicle Involved WithOTHER MV Lighting DAYLIGHT Ped Action Cntrl Dev FNCTNG Loc Type Ramp/Int
1F DRVR 61 M W HBD-UI PROC ST S A 0700 FORD 1992 - - A 22350 - M B2 DRVR 50 M H HNBD STOPPED S G 2732 OTHER 2012 - - N - M G
Party InfoParty Type Age Sex Race Sobriety1 Sobriety2 Move Pre Dir SW Veh CHP Veh Make Year SP Info OAF1 Viol OAF2 Safety Equip ROLE Ext Of Inj AGE Sex Seat Pos Safety EQUIP Ejected
Victim Info
Primary Rd RIVERSIDE AV Distance (ft) 0 Direction N Secondary Rd KNOLLWOOD AV NCIC 3609 State Hwy? N Route Postmile Prefix Postmile Side of HwyCity Rialto County San Bernardino Population 5 Rpt Dist 36 Beat 036 Type 0 CalTrans Badge 4384 Collision Date 20141123 Time 0459 Day SUNPrimary Collision Factor IMPROP TURN Violation 22107 Collision Type HIT OBJECT Severity PDO #Killed 0 #Injured 0 Tow Away? Y Process Date 20150710Weather1 CLEAR Weather2 Rdwy Surface DRY Rdwy Cond1 NO UNUSL CND Rdwy Cond2 Spec Cond 0Hit and Run Motor Vehicle Involved WithFIXED OBJ Lighting DARK - ST Ped Action Cntrl Dev NT PRS/FCTR Loc Type Ramp/Int
1F DRVR 19 M B HNBD PROC ST N A 0100 HONDA 2008 - - F - L G
Party InfoParty Type Age Sex Race Sobriety1 Sobriety2 Move Pre Dir SW Veh CHP Veh Make Year SP Info OAF1 Viol OAF2 Safety Equip ROLE Ext Of Inj AGE Sex Seat Pos Safety EQUIP Ejected
Victim Info
Primary Rd RIVERSIDE AV Distance (ft) 0 Direction Secondary Rd LINDEN AV NCIC 3609 State Hwy? N Route Postmile Prefix Postmile Side of HwyCity Rialto County San Bernardino Population 5 Rpt Dist 06 Beat 001 Type 0 CalTrans Badge 9632 Collision Date 20140322 Time 0902 Day SATPrimary Collision Factor R-O-W AUTO Violation 21802A Collision Type BROADSIDE Severity INJURY #Killed 0 #Injured 2 Tow Away? Y Process Date 20140703Weather1 CLEAR Weather2 Rdwy Surface DRY Rdwy Cond1 NO UNUSL CND Rdwy Cond2 Spec Cond 0Hit and Run Motor Vehicle Involved WithOTHER MV Lighting DAYLIGHT Ped Action Cntrl Dev FNCTNG Loc Type Ramp/Int
1F DRVR 66 F W HNBD LFT TURN N A 0700 DODGE 2005 - 3 A 21802 N M G DRVR OTH VIS 66 F 1 0 M G2 DRVR 22 F W HNBD PROC ST E A 0100 TOYOT 2000 - 3 N - L G DRVR SEVERE 22 F 1 0 L G
Party InfoParty Type Age Sex Race Sobriety1 Sobriety2 Move Pre Dir SW Veh CHP Veh Make Year SP Info OAF1 Viol OAF2 Safety Equip ROLE Ext Of Inj AGE Sex Seat Pos Safety EQUIP Ejected
Victim Info
Primary Rd RIVERSIDE AV Distance (ft) 200 Direction S Secondary Rd LOCUST AV NCIC 3609 State Hwy? N Route Postmile Prefix Postmile Side of HwyCity Rialto County San Bernardino Population 5 Rpt Dist 08 Beat 002 Type 0 CalTrans Badge 6137 Collision Date 20140607 Time 2055 Day SATPrimary Collision Factor IMPROP TURN Violation 22107 Collision Type BROADSIDE Severity INJURY #Killed 0 #Injured 1 Tow Away? N Process Date 20150406Weather1 CLEAR Weather2 Rdwy Surface DRY Rdwy Cond1 NO UNUSL CND Rdwy Cond2 Spec Cond 0Hit and Run MSDMNR Motor Vehicle Involved WithOTHER MV Lighting DARK - ST Ped Action Cntrl Dev NT PRS/FCTR Loc Type Ramp/Int
1F DRVR 49 F H HNBD U-TURN S A 0100 FORD - - - - M G PASS 50 M 3 3 M G2 DRVR 61 M W HBD-NUI PROC ST S A 0100 INFIN - - - - M G PASS COMP PN 57 F 3 0 M G
Party InfoParty Type Age Sex Race Sobriety1 Sobriety2 Move Pre Dir SW Veh CHP Veh Make Year SP Info OAF1 Viol OAF2 Safety Equip ROLE Ext Of Inj AGE Sex Seat Pos Safety EQUIP Ejected
Victim Info
Page 83 This report is accepted subject to the Terms of Use. Due to collision records processing backlogs, SWITRS data is typically seven months behind. Data requested for dates seven months prior to the current date will be incomplete.
Agenda Item No. 4 Attachment

01/01/2013 thru 12/31/2013
Report Run On: 01/14/2015
Total Count: 455
Include State Highways cases
Jurisdiction(s): Rialto
Primary Rd BASELINE RD Distance (ft) 141 Direction W Secondary Rd SYCAMORE AV NCIC 3609 State Hwy? N Route Postmile Prefix Postmile Side of HwyCity Rialto County San Bernardino Population 5 Rpt Dist 112 Beat 002 Type 0 CalTrans Badge 3156 Collision Date 20130418 Time 2030 Day THUPrimary Collision Factor PED VIOL Violation 21955 Collision Type AUTO/PED Severity PDO #Killed 0 #Injured 0 Tow Away? N Process Date 20140818Weather1 CLEAR Weather2 Rdwy Surface DRY Rdwy Cond1 NO UNUSL CND Rdwy Cond2 Spec Cond 0Hit and Run MSDMNR Motor Vehicle Involved WithPED Lighting DARK - ST Ped Action NOT IN X- Cntrl Dev NT PRS/FCTR Loc Type Ramp/Int
1F PED 30 F W HNBD S N 6000 - - - N - - -2 DRVR 998 - IMP UNK IMP UNK PROC ST E A 0100 - - - N - - -
Party InfoParty Type Age Sex Race Sobriety1 Sobriety2 Move Pre Dir SW Veh CHP Veh Make Year SP Info OAF1 Viol OAF2 Safety Equip ROLE Ext Of Inj AGE Sex Seat Pos Safety EQUIP Ejected
Victim Info
Primary Rd BASELINE RD Distance (ft) 0 Direction Secondary Rd SYCAMORE AV NCIC 3609 State Hwy? N Route Postmile Prefix Postmile Side of HwyCity Rialto County San Bernardino Population 5 Rpt Dist 100 Beat 002 Type 0 CalTrans Badge 3156 Collision Date 20130517 Time 2009 Day FRIPrimary Collision Factor OTHER HAZ Violation 24250 Collision Type BROADSIDE Severity INJURY #Killed 0 #Injured 1 Tow Away? N Process Date 20140225Weather1 CLEAR Weather2 Rdwy Surface DRY Rdwy Cond1 NO UNUSL CND Rdwy Cond2 Spec Cond 0Hit and Run Motor Vehicle Involved WithOTHER MV Lighting DARK - ST Ped Action Cntrl Dev FNCTNG Loc Type Ramp/Int
1F DRVR 23 M B HNBD PROC ST E C 0200 KAWA 2013 - - N - P Y DRVR OTH VIS 23 M 1 2 P Y2 DRVR 34 F H HNBD LFT TURN W A 0100 TOYOT 2011 - - N - M G PASS 34 F 3 3 M G
Party InfoParty Type Age Sex Race Sobriety1 Sobriety2 Move Pre Dir SW Veh CHP Veh Make Year SP Info OAF1 Viol OAF2 Safety Equip ROLE Ext Of Inj AGE Sex Seat Pos Safety EQUIP Ejected
Victim Info
Primary Rd BASELINE RD Distance (ft) 0 Direction Secondary Rd TAMARIND AV NCIC 3609 State Hwy? N Route Postmile Prefix Postmile Side of HwyCity Rialto County San Bernardino Population 5 Rpt Dist 86 Beat 001 Type 0 CalTrans Badge 9632 Collision Date 20130118 Time 1915 Day FRIPrimary Collision Factor R-O-W AUTO Violation 21804A Collision Type BROADSIDE Severity INJURY #Killed 0 #Injured 3 Tow Away? N Process Date 20140118Weather1 CLEAR Weather2 WIND Rdwy Surface DRY Rdwy Cond1 NO UNUSL CND Rdwy Cond2 Spec Cond 0Hit and Run Motor Vehicle Involved WithOTHER MV Lighting DARK - ST Ped Action Cntrl Dev FNCTNG Loc Type Ramp/Int
1F DRVR 38 F H HNBD PROC ST N A 0100 TOYOT 1994 - - A 21804 - M G DRVR COMP PN 38 F 1 0 M G2 DRVR 37 M H HNBD PROC ST W A 0100 HONDA 2005 - - - - L G DRVR COMP PN 37 M 1 3 L G
PASS COMP PN 17 M 3 0 L G
Party InfoParty Type Age Sex Race Sobriety1 Sobriety2 Move Pre Dir SW Veh CHP Veh Make Year SP Info OAF1 Viol OAF2 Safety Equip ROLE Ext Of Inj AGE Sex Seat Pos Safety EQUIP Ejected
Victim Info
Primary Rd BASELINE RD Distance (ft) 0 Direction Secondary Rd TAMARIND AV NCIC 3609 State Hwy? N Route Postmile Prefix Postmile Side of HwyCity Rialto County San Bernardino Population 5 Rpt Dist 86 Beat 001 Type 0 CalTrans Badge 7397 Collision Date 20131006 Time 0225 Day SUNPrimary Collision Factor IMPROP TURN Violation 22107 Collision Type BROADSIDE Severity PDO #Killed 0 #Injured 0 Tow Away? N Process Date 20140710Weather1 CLEAR Weather2 WIND Rdwy Surface DRY Rdwy Cond1 NO UNUSL CND Rdwy Cond2 Spec Cond 0Hit and Run Motor Vehicle Involved WithOTHER MV Lighting DARK - ST Ped Action Cntrl Dev NT PRS/FCTR Loc Type Ramp/Int
1F DRVR 20 F H HNBD LFT TURN N A 0100 NISSA 2005 - - A 22107 - M E2 DRVR 23 M H HNBD PROC ST E C 0200 SUZUK 1979 - - N - P A
Party InfoParty Type Age Sex Race Sobriety1 Sobriety2 Move Pre Dir SW Veh CHP Veh Make Year SP Info OAF1 Viol OAF2 Safety Equip ROLE Ext Of Inj AGE Sex Seat Pos Safety EQUIP Ejected
Victim Info
Primary Rd BASELINE RD Distance (ft) 0 Direction Secondary Rd WILLOW AV NCIC 3609 State Hwy? N Route Postmile Prefix Postmile Side of HwyCity Rialto County San Bernardino Population 5 Rpt Dist 100 Beat 002 Type 0 CalTrans Badge 9632 Collision Date 20130304 Time 1910 Day MONPrimary Collision Factor STOP SGN|SIG Violation 21453A Collision Type HEAD-ON Severity INJURY #Killed 0 #Injured 1 Tow Away? N Process Date 20140205Weather1 CLEAR Weather2 Rdwy Surface DRY Rdwy Cond1 NO UNUSL CND Rdwy Cond2 Spec Cond 0Hit and Run Motor Vehicle Involved WithOTHER MV Lighting DARK - ST Ped Action Cntrl Dev FNCTNG Loc Type Ramp/Int
1F DRVR 19 M H HNBD LFT TURN S A 0100 HONDA 1994 - 3 A 21453 N L G PASS 29 M 3 3 L G2 DRVR 65 F H HNBD PROC ST E A 0100 TOYOT 2010 - 3 N - L G DRVR COMP PN 65 F 1 0 L G
Party InfoParty Type Age Sex Race Sobriety1 Sobriety2 Move Pre Dir SW Veh CHP Veh Make Year SP Info OAF1 Viol OAF2 Safety Equip ROLE Ext Of Inj AGE Sex Seat Pos Safety EQUIP Ejected
Victim Info
Page 13 This report is accepted subject to the Terms of Use. Due to collision records processing backlogs, SWITRS data is typically seven months behind. Data requested for dates seven months prior to the current date will be incomplete.
Agenda Item No. 4 Attachment

01/01/2013 thru 12/31/2013
Report Run On: 01/14/2015
Total Count: 455
Include State Highways cases
Jurisdiction(s): Rialto
Primary Rd CEDAR AV Distance (ft) 0 Direction Secondary Rd FOOTHILL BL NCIC 3609 State Hwy? N Route Postmile Prefix Postmile Side of HwyCity Rialto County San Bernardino Population 5 Rpt Dist 132 Beat 003 Type 0 CalTrans Badge 9632 Collision Date 20130701 Time 2009 Day MONPrimary Collision Factor UNSAFE SPEED Violation 22350 Collision Type REAR END Severity INJURY #Killed 0 #Injured 1 Tow Away? N Process Date 20140311Weather1 CLEAR Weather2 Rdwy Surface DRY Rdwy Cond1 NO UNUSL CND Rdwy Cond2 Spec Cond 0Hit and Run Motor Vehicle Involved WithOTHER MV Lighting DARK - ST Ped Action Cntrl Dev FNCTNG Loc Type Ramp/Int
1F DRVR 32 M B HNBD PROC ST N A 0100 MERCE 1983 - 3 A N M G PASS 28 M 3 0 M G2 DRVR 42 M B HNBD STOPPED N A 0100 FORD 2006 - 3 N - M G PASS COMP PN 47 M 3 0 M G3 DRVR 50 M H HNBD STOPPED N D 2200 TOYOT 2008 - 3 N - M G
Party InfoParty Type Age Sex Race Sobriety1 Sobriety2 Move Pre Dir SW Veh CHP Veh Make Year SP Info OAF1 Viol OAF2 Safety Equip ROLE Ext Of Inj AGE Sex Seat Pos Safety EQUIP Ejected
Victim Info
Primary Rd CEDAR AV Distance (ft) 0 Direction Secondary Rd FOOTHILL BL NCIC 3609 State Hwy? N Route Postmile Prefix Postmile Side of HwyCity Rialto County San Bernardino Population 5 Rpt Dist 121 Beat 001 Type 0 CalTrans Badge 5667 Collision Date 20130720 Time 1400 Day SATPrimary Collision Factor UNSAFE SPEED Violation 22350 Collision Type HEAD-ON Severity PDO #Killed 0 #Injured 0 Tow Away? N Process Date 20140929Weather1 CLOUDY Weather2 RAINING Rdwy Surface WET Rdwy Cond1 NO UNUSL CND Rdwy Cond2 Spec Cond 0Hit and Run Motor Vehicle Involved WithFIXED OBJ Lighting DAYLIGHT Ped Action Cntrl Dev FNCTNG Loc Type Ramp/Int
1F DRVR 28 F B HNBD RAN OFF RD S A 0100 TOYOT 2008 - - N - M C
Party InfoParty Type Age Sex Race Sobriety1 Sobriety2 Move Pre Dir SW Veh CHP Veh Make Year SP Info OAF1 Viol OAF2 Safety Equip ROLE Ext Of Inj AGE Sex Seat Pos Safety EQUIP Ejected
Victim Info
Primary Rd CEDAR AV Distance (ft) 0 Direction Secondary Rd FOOTHILL BL NCIC 3609 State Hwy? N Route Postmile Prefix Postmile Side of HwyCity Rialto County San Bernardino Population 5 Rpt Dist 132 Beat 003 Type 0 CalTrans Badge 6367 Collision Date 20131216 Time 0635 Day MONPrimary Collision Factor IMPROP TURN Violation 22107 Collision Type HIT OBJECT Severity PDO #Killed 0 #Injured 0 Tow Away? N Process Date 20150107Weather1 CLEAR Weather2 Rdwy Surface DRY Rdwy Cond1 NO UNUSL CND Rdwy Cond2 Spec Cond 0Hit and Run Motor Vehicle Involved WithFIXED OBJ Lighting DAYLIGHT Ped Action Cntrl Dev FNCTNG Loc Type Ramp/Int
1F DRVR 50 M HNBD PROC ST S A 0100 MERCE 2007 - 3 - - L G
Party InfoParty Type Age Sex Race Sobriety1 Sobriety2 Move Pre Dir SW Veh CHP Veh Make Year SP Info OAF1 Viol OAF2 Safety Equip ROLE Ext Of Inj AGE Sex Seat Pos Safety EQUIP Ejected
Victim Info
Primary Rd CEDAR AV Distance (ft) 0 Direction Secondary Rd GROVE ST NCIC 3609 State Hwy? N Route Postmile Prefix Postmile Side of HwyCity Rialto County San Bernardino Population 5 Rpt Dist 120 Beat 001 Type 0 CalTrans Badge 9732 Collision Date 20131229 Time 2203 Day SUNPrimary Collision Factor R-O-W AUTO Violation 21801A Collision Type BROADSIDE Severity INJURY #Killed 0 #Injured 1 Tow Away? Y Process Date 20140516Weather1 CLEAR Weather2 Rdwy Surface DRY Rdwy Cond1 NO UNUSL CND Rdwy Cond2 Spec Cond 0Hit and Run Motor Vehicle Involved WithOTHER MV Lighting DARK - ST Ped Action Cntrl Dev FNCTNG Loc Type Ramp/Int
1F DRVR 21 F B HNBD LFT TURN S A 0100 OLDSM 1993 - 3 N - M G DRVR COMP PN 21 F 1 0 M G2 DRVR 29 M H HNBD PROC ST N A 0700 MERCE 2010 - 3 N - L G
Party InfoParty Type Age Sex Race Sobriety1 Sobriety2 Move Pre Dir SW Veh CHP Veh Make Year SP Info OAF1 Viol OAF2 Safety Equip ROLE Ext Of Inj AGE Sex Seat Pos Safety EQUIP Ejected
Victim Info
Primary Rd CEDAR AV Distance (ft) 0 Direction Secondary Rd HAWTHORNE ST NCIC 3609 State Hwy? N Route Postmile Prefix Postmile Side of HwyCity Rialto County San Bernardino Population 5 Rpt Dist 167 Beat 003 Type 0 CalTrans Badge 3156 Collision Date 20130501 Time 2110 Day WEDPrimary Collision Factor OTHER HAZ Violation 22109 Collision Type REAR END Severity INJURY #Killed 0 #Injured 1 Tow Away? N Process Date 20140226Weather1 CLEAR Weather2 Rdwy Surface DRY Rdwy Cond1 NO UNUSL CND Rdwy Cond2 Spec Cond 0Hit and Run Motor Vehicle Involved WithOTHER MV Lighting DARK - ST Ped Action Cntrl Dev NT PRS/FCTR Loc Type Ramp/Int
1F DRVR 42 M H HNBD STOPPED N A 0100 HONDA 1992 - - N - M G DRVR COMP PN 42 M 1 0 M G2 DRVR 21 M B HNBD PROC ST N A 0100 KIA 2003 - - N - M G
Party InfoParty Type Age Sex Race Sobriety1 Sobriety2 Move Pre Dir SW Veh CHP Veh Make Year SP Info OAF1 Viol OAF2 Safety Equip ROLE Ext Of Inj AGE Sex Seat Pos Safety EQUIP Ejected
Victim Info
Page 20 This report is accepted subject to the Terms of Use. Due to collision records processing backlogs, SWITRS data is typically seven months behind. Data requested for dates seven months prior to the current date will be incomplete.
Agenda Item No. 4 Attachment

01/01/2013 thru 12/31/2013
Report Run On: 01/14/2015
Total Count: 455
Include State Highways cases
Jurisdiction(s): Rialto
Primary Rd ETIWANDA AV Distance (ft) 0 Direction Secondary Rd PEPPER AV NCIC 3609 State Hwy? N Route Postmile Prefix Postmile Side of HwyCity Rialto County San Bernardino Population 5 Rpt Dist 115 Beat 002 Type 0 CalTrans Badge 1041 Collision Date 20130731 Time 0932 Day WEDPrimary Collision Factor NOT DRIVER Violation Collision Type HIT OBJECT Severity PDO #Killed 0 #Injured 0 Tow Away? Y Process Date 20140929Weather1 CLEAR Weather2 Rdwy Surface DRY Rdwy Cond1 NO UNUSL CND Rdwy Cond2 Spec Cond 0Hit and Run Motor Vehicle Involved WithFIXED OBJ Lighting DAYLIGHT Ped Action Cntrl Dev FNCTNG Loc Type Ramp/Int
1 DRVR 22 F B HNBD RAN OFF RD S A 0100 CHEVR 1997 - - A 26453 K L G
Party InfoParty Type Age Sex Race Sobriety1 Sobriety2 Move Pre Dir SW Veh CHP Veh Make Year SP Info OAF1 Viol OAF2 Safety Equip ROLE Ext Of Inj AGE Sex Seat Pos Safety EQUIP Ejected
Victim Info
Primary Rd ETIWANDA AV Distance (ft) 0 Direction Secondary Rd RIVERSIDE AV NCIC 3609 State Hwy? N Route Postmile Prefix Postmile Side of HwyCity Rialto County San Bernardino Population 5 Rpt Dist 111 Beat 002 Type 0 CalTrans Badge 0515 Collision Date 20130609 Time 1546 Day SUNPrimary Collision Factor STOP SGN|SIG Violation 21453A Collision Type BROADSIDE Severity INJURY #Killed 0 #Injured 1 Tow Away? N Process Date 20140305Weather1 CLEAR Weather2 Rdwy Surface DRY Rdwy Cond1 NO UNUSL CND Rdwy Cond2 Spec Cond 0Hit and Run Motor Vehicle Involved WithOTHER MV Lighting DAYLIGHT Ped Action Cntrl Dev FNCTNG Loc Type Ramp/Int
1F DRVR 43 F H HNBD PROC ST S A 0100 NISSA - - N - M G PASS 67 F 3 3 M GPASS 15 F 4 3 P GPASS 11 F 6 3 P G
2 DRVR 21 M H HNBD PROC ST E A 0100 TOYOT 2011 - - N - M G DRVR COMP PN 21 M 1 0 M GPASS 21 M 3 3 M G
Party InfoParty Type Age Sex Race Sobriety1 Sobriety2 Move Pre Dir SW Veh CHP Veh Make Year SP Info OAF1 Viol OAF2 Safety Equip ROLE Ext Of Inj AGE Sex Seat Pos Safety EQUIP Ejected
Victim Info
Primary Rd EUCALPTUS AV Distance (ft) 105 Direction N Secondary Rd BONNIE VIEW DR NCIC 3609 State Hwy? N Route Postmile Prefix Postmile Side of HwyCity Rialto County San Bernardino Population 5 Rpt Dist 142 Beat 004 Type 0 CalTrans Badge 5733 Collision Date 20130311 Time 0919 Day MONPrimary Collision Factor IMPROP TURN Violation 22107 Collision Type HIT OBJECT Severity INJURY #Killed 0 #Injured 1 Tow Away? Y Process Date 20140204Weather1 CLEAR Weather2 Rdwy Surface DRY Rdwy Cond1 NO UNUSL CND Rdwy Cond2 Spec Cond 0Hit and Run Motor Vehicle Involved WithFIXED OBJ Lighting DAYLIGHT Ped Action Cntrl Dev NT PRS/FCTR Loc Type Ramp/Int
1F DRVR 80 M B HNBD PROC ST N A 0800 DODGE 1994 - - M N M G DRVR COMP PN 80 M 1 0 M G
Party InfoParty Type Age Sex Race Sobriety1 Sobriety2 Move Pre Dir SW Veh CHP Veh Make Year SP Info OAF1 Viol OAF2 Safety Equip ROLE Ext Of Inj AGE Sex Seat Pos Safety EQUIP Ejected
Victim Info
Primary Rd EUCALYPTUS Distance (ft) 27 Direction S Secondary Rd BASELINE NCIC 3609 State Hwy? Y Route Postmile Prefix Postmile Side of HwyCity Rialto County San Bernardino Population 5 Rpt Dist 101 Beat 002 Type 0 CalTrans Badge 1431 Collision Date 20131103 Time 2035 Day SUNPrimary Collision Factor PED VIOL Violation 21954A Collision Type AUTO/PED Severity INJURY #Killed 0 #Injured 1 Tow Away? N Process Date 20140506Weather1 CLEAR Weather2 Rdwy Surface DRY Rdwy Cond1 NO UNUSL CND Rdwy Cond2 Spec Cond 0Hit and Run Motor Vehicle Involved WithPED Lighting DARK - ST Ped Action NOT IN X- Cntrl Dev FNCTNG Loc Type Ramp/Int
1 DRVR 48 M H HNBD PROC ST S A 0100 KIA 2008 - - N - M G2F PED 24 M B HNBD ENT TRAF E N 6000 - - - N - - - PED OTH VIS 24 M 9 3 - -
Party InfoParty Type Age Sex Race Sobriety1 Sobriety2 Move Pre Dir SW Veh CHP Veh Make Year SP Info OAF1 Viol OAF2 Safety Equip ROLE Ext Of Inj AGE Sex Seat Pos Safety EQUIP Ejected
Victim Info
Primary Rd EUCALYPTUS Distance (ft) 39 Direction N Secondary Rd WILSON NCIC 3609 State Hwy? N Route Postmile Prefix Postmile Side of HwyCity Rialto County San Bernardino Population 5 Rpt Dist 153 Beat 004 Type 0 CalTrans Badge 6367 Collision Date 20130114 Time 0124 Day MONPrimary Collision Factor IMPROP TURN Violation 22107 Collision Type BROADSIDE Severity INJURY #Killed 0 #Injured 1 Tow Away? N Process Date 20140124Weather1 CLEAR Weather2 Rdwy Surface DRY Rdwy Cond1 NO UNUSL CND Rdwy Cond2 Spec Cond 0Hit and Run Motor Vehicle Involved WithOTHER MV Lighting DAYLIGHT Ped Action Cntrl Dev FNCTNG Loc Type Ramp/Int
1F DRVR 21 M H HNBD LFT TURN N A 0100 ACURA 1997 - - N - M G2 DRVR 54 M H HNBD PROC ST S A 0100 PONTI 2006 - - N - L G DRVR COMP PN 54 M 1 0 L G
Party InfoParty Type Age Sex Race Sobriety1 Sobriety2 Move Pre Dir SW Veh CHP Veh Make Year SP Info OAF1 Viol OAF2 Safety Equip ROLE Ext Of Inj AGE Sex Seat Pos Safety EQUIP Ejected
Victim Info
Page 26 This report is accepted subject to the Terms of Use. Due to collision records processing backlogs, SWITRS data is typically seven months behind. Data requested for dates seven months prior to the current date will be incomplete.
Agenda Item No. 4 Attachment
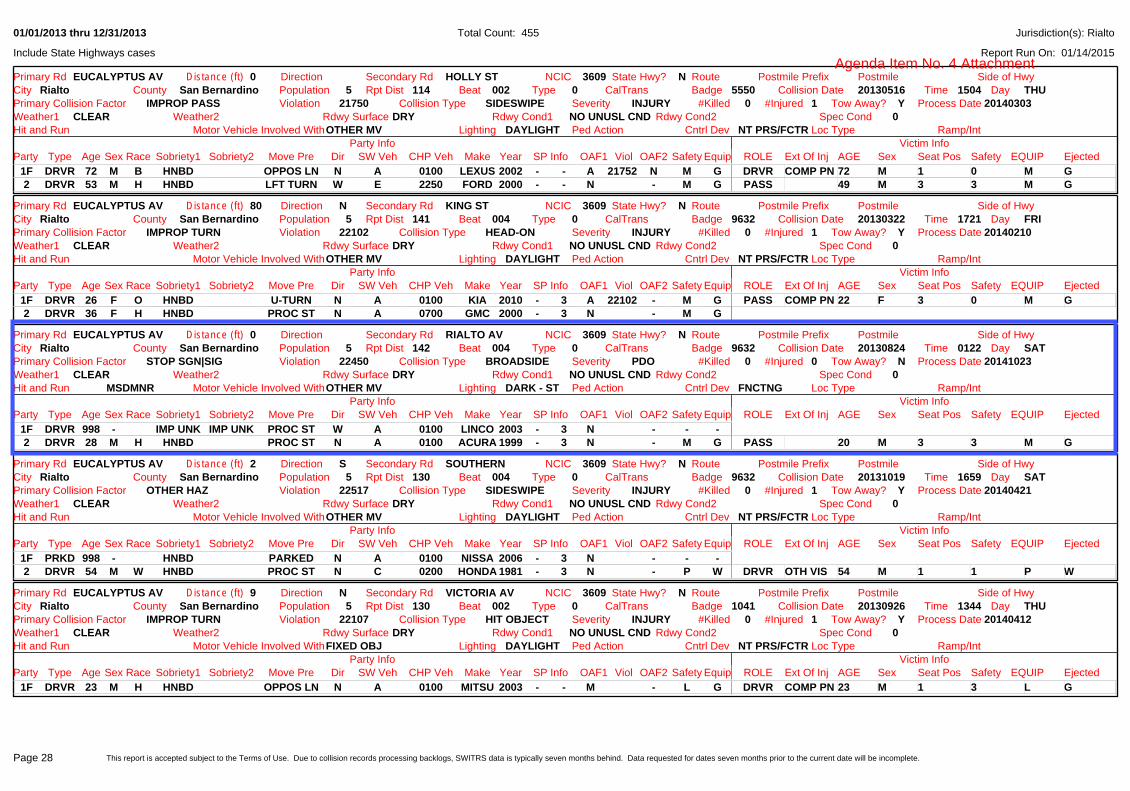
01/01/2013 thru 12/31/2013
Report Run On: 01/14/2015
Total Count: 455
Include State Highways cases
Jurisdiction(s): Rialto
Primary Rd EUCALYPTUS AV Distance (ft) 0 Direction Secondary Rd HOLLY ST NCIC 3609 State Hwy? N Route Postmile Prefix Postmile Side of HwyCity Rialto County San Bernardino Population 5 Rpt Dist 114 Beat 002 Type 0 CalTrans Badge 5550 Collision Date 20130516 Time 1504 Day THUPrimary Collision Factor IMPROP PASS Violation 21750 Collision Type SIDESWIPE Severity INJURY #Killed 0 #Injured 1 Tow Away? Y Process Date 20140303Weather1 CLEAR Weather2 Rdwy Surface DRY Rdwy Cond1 NO UNUSL CND Rdwy Cond2 Spec Cond 0Hit and Run Motor Vehicle Involved WithOTHER MV Lighting DAYLIGHT Ped Action Cntrl Dev NT PRS/FCTR Loc Type Ramp/Int
1F DRVR 72 M B HNBD OPPOS LN N A 0100 LEXUS 2002 - - A 21752 N M G DRVR COMP PN 72 M 1 0 M G2 DRVR 53 M H HNBD LFT TURN W E 2250 FORD 2000 - - N - M G PASS 49 M 3 3 M G
Party InfoParty Type Age Sex Race Sobriety1 Sobriety2 Move Pre Dir SW Veh CHP Veh Make Year SP Info OAF1 Viol OAF2 Safety Equip ROLE Ext Of Inj AGE Sex Seat Pos Safety EQUIP Ejected
Victim Info
Primary Rd EUCALYPTUS AV Distance (ft) 80 Direction N Secondary Rd KING ST NCIC 3609 State Hwy? N Route Postmile Prefix Postmile Side of HwyCity Rialto County San Bernardino Population 5 Rpt Dist 141 Beat 004 Type 0 CalTrans Badge 9632 Collision Date 20130322 Time 1721 Day FRIPrimary Collision Factor IMPROP TURN Violation 22102 Collision Type HEAD-ON Severity INJURY #Killed 0 #Injured 1 Tow Away? Y Process Date 20140210Weather1 CLEAR Weather2 Rdwy Surface DRY Rdwy Cond1 NO UNUSL CND Rdwy Cond2 Spec Cond 0Hit and Run Motor Vehicle Involved WithOTHER MV Lighting DAYLIGHT Ped Action Cntrl Dev NT PRS/FCTR Loc Type Ramp/Int
1F DRVR 26 F O HNBD U-TURN N A 0100 KIA 2010 - 3 A 22102 - M G PASS COMP PN 22 F 3 0 M G2 DRVR 36 F H HNBD PROC ST N A 0700 GMC 2000 - 3 N - M G
Party InfoParty Type Age Sex Race Sobriety1 Sobriety2 Move Pre Dir SW Veh CHP Veh Make Year SP Info OAF1 Viol OAF2 Safety Equip ROLE Ext Of Inj AGE Sex Seat Pos Safety EQUIP Ejected
Victim Info
Primary Rd EUCALYPTUS AV Distance (ft) 0 Direction Secondary Rd RIALTO AV NCIC 3609 State Hwy? N Route Postmile Prefix Postmile Side of HwyCity Rialto County San Bernardino Population 5 Rpt Dist 142 Beat 004 Type 0 CalTrans Badge 9632 Collision Date 20130824 Time 0122 Day SATPrimary Collision Factor STOP SGN|SIG Violation 22450 Collision Type BROADSIDE Severity PDO #Killed 0 #Injured 0 Tow Away? N Process Date 20141023Weather1 CLEAR Weather2 Rdwy Surface DRY Rdwy Cond1 NO UNUSL CND Rdwy Cond2 Spec Cond 0Hit and Run MSDMNR Motor Vehicle Involved WithOTHER MV Lighting DARK - ST Ped Action Cntrl Dev FNCTNG Loc Type Ramp/Int
1F DRVR 998 - IMP UNK IMP UNK PROC ST W A 0100 LINCO 2003 - 3 N - - -2 DRVR 28 M H HNBD PROC ST N A 0100 ACURA 1999 - 3 N - M G PASS 20 M 3 3 M G
Party InfoParty Type Age Sex Race Sobriety1 Sobriety2 Move Pre Dir SW Veh CHP Veh Make Year SP Info OAF1 Viol OAF2 Safety Equip ROLE Ext Of Inj AGE Sex Seat Pos Safety EQUIP Ejected
Victim Info
Primary Rd EUCALYPTUS AV Distance (ft) 2 Direction S Secondary Rd SOUTHERN NCIC 3609 State Hwy? N Route Postmile Prefix Postmile Side of HwyCity Rialto County San Bernardino Population 5 Rpt Dist 130 Beat 004 Type 0 CalTrans Badge 9632 Collision Date 20131019 Time 1659 Day SATPrimary Collision Factor OTHER HAZ Violation 22517 Collision Type SIDESWIPE Severity INJURY #Killed 0 #Injured 1 Tow Away? Y Process Date 20140421Weather1 CLEAR Weather2 Rdwy Surface DRY Rdwy Cond1 NO UNUSL CND Rdwy Cond2 Spec Cond 0Hit and Run Motor Vehicle Involved WithOTHER MV Lighting DAYLIGHT Ped Action Cntrl Dev NT PRS/FCTR Loc Type Ramp/Int
1F PRKD 998 - HNBD PARKED N A 0100 NISSA 2006 - 3 N - - -2 DRVR 54 M W HNBD PROC ST N C 0200 HONDA 1981 - 3 N - P W DRVR OTH VIS 54 M 1 1 P W
Party InfoParty Type Age Sex Race Sobriety1 Sobriety2 Move Pre Dir SW Veh CHP Veh Make Year SP Info OAF1 Viol OAF2 Safety Equip ROLE Ext Of Inj AGE Sex Seat Pos Safety EQUIP Ejected
Victim Info
Primary Rd EUCALYPTUS AV Distance (ft) 9 Direction N Secondary Rd VICTORIA AV NCIC 3609 State Hwy? N Route Postmile Prefix Postmile Side of HwyCity Rialto County San Bernardino Population 5 Rpt Dist 130 Beat 002 Type 0 CalTrans Badge 1041 Collision Date 20130926 Time 1344 Day THUPrimary Collision Factor IMPROP TURN Violation 22107 Collision Type HIT OBJECT Severity INJURY #Killed 0 #Injured 1 Tow Away? Y Process Date 20140412Weather1 CLEAR Weather2 Rdwy Surface DRY Rdwy Cond1 NO UNUSL CND Rdwy Cond2 Spec Cond 0Hit and Run Motor Vehicle Involved WithFIXED OBJ Lighting DAYLIGHT Ped Action Cntrl Dev NT PRS/FCTR Loc Type Ramp/Int
1F DRVR 23 M H HNBD OPPOS LN N A 0100 MITSU 2003 - - M - L G DRVR COMP PN 23 M 1 3 L G
Party InfoParty Type Age Sex Race Sobriety1 Sobriety2 Move Pre Dir SW Veh CHP Veh Make Year SP Info OAF1 Viol OAF2 Safety Equip ROLE Ext Of Inj AGE Sex Seat Pos Safety EQUIP Ejected
Victim Info
Page 28 This report is accepted subject to the Terms of Use. Due to collision records processing backlogs, SWITRS data is typically seven months behind. Data requested for dates seven months prior to the current date will be incomplete.
Agenda Item No. 4 Attachment

01/01/2013 thru 12/31/2013
Report Run On: 01/14/2015
Total Count: 455
Include State Highways cases
Jurisdiction(s): Rialto
Primary Rd LILAC AV Distance (ft) 93 Direction S Secondary Rd GROVE ST NCIC 3609 State Hwy? N Route Postmile Prefix Postmile Side of HwyCity Rialto County San Bernardino Population 5 Rpt Dist 124 Beat 002 Type 0 CalTrans Badge 5550 Collision Date 20130702 Time 1355 Day TUEPrimary Collision Factor R-O-W AUTO Violation 21801A Collision Type BROADSIDE Severity INJURY #Killed 0 #Injured 1 Tow Away? N Process Date 20140319Weather1 CLEAR Weather2 Rdwy Surface DRY Rdwy Cond1 NO UNUSL CND Rdwy Cond2 Spec Cond 0Hit and Run Motor Vehicle Involved WithOTHER MV Lighting DAYLIGHT Ped Action Cntrl Dev NT PRS/FCTR Loc Type Ramp/Int
1F DRVR 24 M B HNBD LFT TURN W A 0100 NISSA 2006 - - N - M B DRVR COMP PN 24 M 1 0 M B2 DRVR 51 M H HNBD PROC ST N F 2700 VOLVO 2001 - - N - P B
Party InfoParty Type Age Sex Race Sobriety1 Sobriety2 Move Pre Dir SW Veh CHP Veh Make Year SP Info OAF1 Viol OAF2 Safety Equip ROLE Ext Of Inj AGE Sex Seat Pos Safety EQUIP Ejected
Victim Info
Primary Rd LILAC AV Distance (ft) 28 Direction N Secondary Rd RIALTO AV NCIC 3609 State Hwy? N Route Postmile Prefix Postmile Side of HwyCity Rialto County San Bernardino Population 5 Rpt Dist 136 Beat 003 Type 0 CalTrans Badge 3156 Collision Date 20130221 Time 2215 Day THUPrimary Collision Factor DRVR ALC|DRG Violation 23152A Collision Type SIDESWIPE Severity PDO #Killed 0 #Injured 0 Tow Away? N Process Date 20140709Weather1 RAINING Weather2 Rdwy Surface DRY Rdwy Cond1 NO UNUSL CND Rdwy Cond2 Spec Cond 0Hit and Run MSDMNR Motor Vehicle Involved WithOTHER MV Lighting DAYLIGHT Ped Action Cntrl Dev FNCTNG Loc Type Ramp/Int
1F DRVR 54 M B HBD-UI UNS TURN N A 0100 LEXUS 1990 - - A 22107 - M B2 DRVR 39 F H HNBD STOPPED S A 0100 DODGE 2003 - - N - M G
Party InfoParty Type Age Sex Race Sobriety1 Sobriety2 Move Pre Dir SW Veh CHP Veh Make Year SP Info OAF1 Viol OAF2 Safety Equip ROLE Ext Of Inj AGE Sex Seat Pos Safety EQUIP Ejected
Victim Info
Primary Rd LILAC AV Distance (ft) 0 Direction Secondary Rd SHAMROCK ST NCIC 3609 State Hwy? N Route Postmile Prefix Postmile Side of HwyCity Rialto County San Bernardino Population 5 Rpt Dist 109 Beat 001 Type 0 CalTrans Badge 4548 Collision Date 20130803 Time 1329 Day SATPrimary Collision Factor IMPROP TURN Violation 22103 Collision Type BROADSIDE Severity INJURY #Killed 0 #Injured 4 Tow Away? N Process Date 20140327Weather1 CLEAR Weather2 Rdwy Surface DRY Rdwy Cond1 NO UNUSL CND Rdwy Cond2 Spec Cond 0Hit and Run Motor Vehicle Involved WithOTHER MV Lighting DAYLIGHT Ped Action Cntrl Dev NT PRS/FCTR Loc Type Ramp/Int
1F DRVR 46 F B HNBD U-TURN N A 0100 NISSA 2000 - - A 22103 - M G DRVR COMP PN 46 F 1 0 M GPASS COMP PN 19 F 3 0 M GPASS 16 F 6 3 M G
2 DRVR 39 M H HNBD PROC ST N A 0100 CHEVR 1996 - - N - L G DRVR COMP PN 39 M 1 0 L GPASS OTH VIS 14 M 3 0 M H
Party InfoParty Type Age Sex Race Sobriety1 Sobriety2 Move Pre Dir SW Veh CHP Veh Make Year SP Info OAF1 Viol OAF2 Safety Equip ROLE Ext Of Inj AGE Sex Seat Pos Safety EQUIP Ejected
Victim Info
Primary Rd LILAC AV Distance (ft) 0 Direction Secondary Rd VALLEY BL NCIC 3609 State Hwy? N Route Postmile Prefix Postmile Side of HwyCity Rialto County San Bernardino Population 5 Rpt Dist 181 Beat 003 Type 0 CalTrans Badge 1041 Collision Date 20130628 Time 2500 Day FRIPrimary Collision Factor IMPROP TURN Violation 22100A Collision Type HIT OBJECT Severity PDO #Killed 0 #Injured 0 Tow Away? N Process Date 20140911Weather1 CLEAR Weather2 Rdwy Surface DRY Rdwy Cond1 NO UNUSL CND Rdwy Cond2 Spec Cond 0Hit and Run MSDMNR Motor Vehicle Involved WithFIXED OBJ Lighting DAYLIGHT Ped Action Cntrl Dev FNCTNG Loc Type Ramp/Int
1F DRVR 998 - IMP UNK IMP UNK RGT TURN N G 2531 - - - N - N B
Party InfoParty Type Age Sex Race Sobriety1 Sobriety2 Move Pre Dir SW Veh CHP Veh Make Year SP Info OAF1 Viol OAF2 Safety Equip ROLE Ext Of Inj AGE Sex Seat Pos Safety EQUIP Ejected
Victim Info
Primary Rd LILAC AV Distance (ft) 0 Direction Secondary Rd VALLEY BL NCIC 3609 State Hwy? N Route Postmile Prefix Postmile Side of HwyCity Rialto County San Bernardino Population 5 Rpt Dist 190 Beat 003 Type 0 CalTrans Badge 9632 Collision Date 20130913 Time 1817 Day FRIPrimary Collision Factor STOP SGN|SIG Violation 21453A Collision Type BROADSIDE Severity INJURY #Killed 0 #Injured 2 Tow Away? Y Process Date 20140403Weather1 CLEAR Weather2 Rdwy Surface DRY Rdwy Cond1 NO UNUSL CND Rdwy Cond2 Spec Cond 0Hit and Run Motor Vehicle Involved WithOTHER MV Lighting DAYLIGHT Ped Action Cntrl Dev FNCTNG Loc Type Ramp/Int
1F DRVR 56 F W HNBD PROC ST W A 0100 DODGE 1988 - 3 E N P G DRVR COMP PN 56 F 1 0 P G2 DRVR 49 M H HNBD LFT TURN S D 2200 DODGE 2006 - 3 N - M G DRVR COMP PN 49 M 1 0 M G
Party InfoParty Type Age Sex Race Sobriety1 Sobriety2 Move Pre Dir SW Veh CHP Veh Make Year SP Info OAF1 Viol OAF2 Safety Equip ROLE Ext Of Inj AGE Sex Seat Pos Safety EQUIP Ejected
Victim Info
Page 43 This report is accepted subject to the Terms of Use. Due to collision records processing backlogs, SWITRS data is typically seven months behind. Data requested for dates seven months prior to the current date will be incomplete.
Agenda Item No. 4 Attachment

01/01/2013 thru 12/31/2013
Report Run On: 01/14/2015
Total Count: 455
Include State Highways cases
Jurisdiction(s): Rialto
Primary Rd LILAC AVE Distance (ft) 0 Direction Secondary Rd MERRILL AV NCIC 3609 State Hwy? N Route Postmile Prefix Postmile Side of HwyCity Rialto County San Bernardino Population 5 Rpt Dist 159 Beat 004 Type 0 CalTrans Badge 3156 Collision Date 20130410 Time 1803 Day WEDPrimary Collision Factor R-O-W AUTO Violation 21804A Collision Type BROADSIDE Severity INJURY #Killed 0 #Injured 3 Tow Away? N Process Date 20140218Weather1 CLEAR Weather2 Rdwy Surface DRY Rdwy Cond1 NO UNUSL CND Rdwy Cond2 Spec Cond 0Hit and Run Motor Vehicle Involved WithOTHER MV Lighting DAYLIGHT Ped Action Cntrl Dev FNCTNG Loc Type Ramp/Int
1F DRVR 49 F H HNBD PROC ST W A 0100 ACURA 1992 - - N - M G DRVR COMP PN 49 F 1 0 M G2 DRVR 41 F H HNBD PROC ST N A 0100 NISSA 2005 - - N - M G DRVR COMP PN 41 F 1 0 M G
PASS COMP PN 21 F 3 0 L G
Party InfoParty Type Age Sex Race Sobriety1 Sobriety2 Move Pre Dir SW Veh CHP Veh Make Year SP Info OAF1 Viol OAF2 Safety Equip ROLE Ext Of Inj AGE Sex Seat Pos Safety EQUIP Ejected
Victim Info
Primary Rd LILAC CT Distance (ft) 0 Direction Secondary Rd HOLLADAY PL NCIC 3609 State Hwy? N Route Postmile Prefix Postmile Side of HwyCity Rialto County San Bernardino Population 5 Rpt Dist 137 Beat 003 Type 0 CalTrans Badge 9632 Collision Date 20130318 Time 1935 Day MONPrimary Collision Factor PED VIOL Violation 21954A Collision Type HEAD-ON Severity INJURY #Killed 0 #Injured 1 Tow Away? N Process Date 20140212Weather1 CLEAR Weather2 Rdwy Surface DRY Rdwy Cond1 NO UNUSL CND Rdwy Cond2 Spec Cond 0Hit and Run Motor Vehicle Involved WithPED Lighting DARK - ST Ped Action NOT IN X- Cntrl Dev FNCTNG Loc Type Ramp/Int
1F PED 16 M H IMP UNK IMP UNK PROC ST W N 6000 - - 3 A 21954 - - - PED SEVERE 16 M 9 0 - -2 DRVR 22 F H HNBD PROC ST S A 0100 ACURA 1998 - 3 E N M G
Party InfoParty Type Age Sex Race Sobriety1 Sobriety2 Move Pre Dir SW Veh CHP Veh Make Year SP Info OAF1 Viol OAF2 Safety Equip ROLE Ext Of Inj AGE Sex Seat Pos Safety EQUIP Ejected
Victim Info
Primary Rd LINDEN AV Distance (ft) 0 Direction Secondary Rd 2ND ST NCIC 3609 State Hwy? N Route Postmile Prefix Postmile Side of HwyCity Rialto County San Bernardino Population 5 Rpt Dist 131 Beat 003 Type 0 CalTrans Badge 2517 Collision Date 20131206 Time 0617 Day FRIPrimary Collision Factor R-O-W AUTO Violation 21801A Collision Type BROADSIDE Severity INJURY #Killed 0 #Injured 1 Tow Away? Y Process Date 20140529Weather1 CLEAR Weather2 Rdwy Surface DRY Rdwy Cond1 NO UNUSL CND Rdwy Cond2 Spec Cond 0Hit and Run Motor Vehicle Involved WithOTHER MV Lighting DAYLIGHT Ped Action Cntrl Dev FNCTNG Loc Type Ramp/Int
1F DRVR 27 M H HNBD LFT TURN W A 0100 JEEP 1996 - - N - M G PASS 25 M 3 3 M G2 DRVR 46 M H HNBD PROC ST S A 0100 HONDA 1990 - - N - M G DRVR COMP PN 46 M 1 0 M G
Party InfoParty Type Age Sex Race Sobriety1 Sobriety2 Move Pre Dir SW Veh CHP Veh Make Year SP Info OAF1 Viol OAF2 Safety Equip ROLE Ext Of Inj AGE Sex Seat Pos Safety EQUIP Ejected
Victim Info
Primary Rd LINDEN AV Distance (ft) 0 Direction Secondary Rd BOHNERT AV NCIC 3609 State Hwy? N Route Postmile Prefix Postmile Side of HwyCity Rialto County San Bernardino Population 5 Rpt Dist 036 Beat 001 Type 0 CalTrans Badge 6367 Collision Date 20130923 Time 0727 Day MONPrimary Collision Factor R-O-W PED Violation 21950A Collision Type AUTO/PED Severity INJURY #Killed 0 #Injured 1 Tow Away? N Process Date 20140403Weather1 CLEAR Weather2 Rdwy Surface DRY Rdwy Cond1 NO UNUSL CND Rdwy Cond2 Spec Cond 0Hit and Run Motor Vehicle Involved WithPED Lighting DAYLIGHT Ped Action X-WLK AT Cntrl Dev FNCTNG Loc Type Ramp/Int
1F DRVR 45 F H HNBD PROC ST E A 0100 TOYOT 2010 - 3 - - M G2 PED 16 M H HNBD N N 6000 - - 1 F - - - PED COMP PN 16 M 9 0 - -
Party InfoParty Type Age Sex Race Sobriety1 Sobriety2 Move Pre Dir SW Veh CHP Veh Make Year SP Info OAF1 Viol OAF2 Safety Equip ROLE Ext Of Inj AGE Sex Seat Pos Safety EQUIP Ejected
Victim Info
Primary Rd LINDEN AV Distance (ft) 0 Direction Secondary Rd CASMALIA ST NCIC 3609 State Hwy? N Route Postmile Prefix Postmile Side of HwyCity Rialto County San Bernardino Population 5 Rpt Dist 053 Beat 001 Type 0 CalTrans Badge 1514 Collision Date 20130331 Time 1700 Day SUNPrimary Collision Factor STOP SGN|SIG Violation 21453A Collision Type BROADSIDE Severity INJURY #Killed 0 #Injured 1 Tow Away? N Process Date 20140210Weather1 CLEAR Weather2 Rdwy Surface DRY Rdwy Cond1 NO UNUSL CND Rdwy Cond2 Spec Cond 0Hit and Run Motor Vehicle Involved WithOTHER MV Lighting DAYLIGHT Ped Action Cntrl Dev FNCTNG Loc Type Ramp/Int
1F DRVR 39 M B HNBD PROC ST E A 0100 LEXUS 2004 - - - - L H DRVR COMP PN 39 M 1 0 L G2 DRVR 49 M H HNBD PROC ST S A 0100 SUZUK 2004 - - A 12500 - M G
Party InfoParty Type Age Sex Race Sobriety1 Sobriety2 Move Pre Dir SW Veh CHP Veh Make Year SP Info OAF1 Viol OAF2 Safety Equip ROLE Ext Of Inj AGE Sex Seat Pos Safety EQUIP Ejected
Victim Info
Page 44 This report is accepted subject to the Terms of Use. Due to collision records processing backlogs, SWITRS data is typically seven months behind. Data requested for dates seven months prior to the current date will be incomplete.
Agenda Item No. 4 Attachment
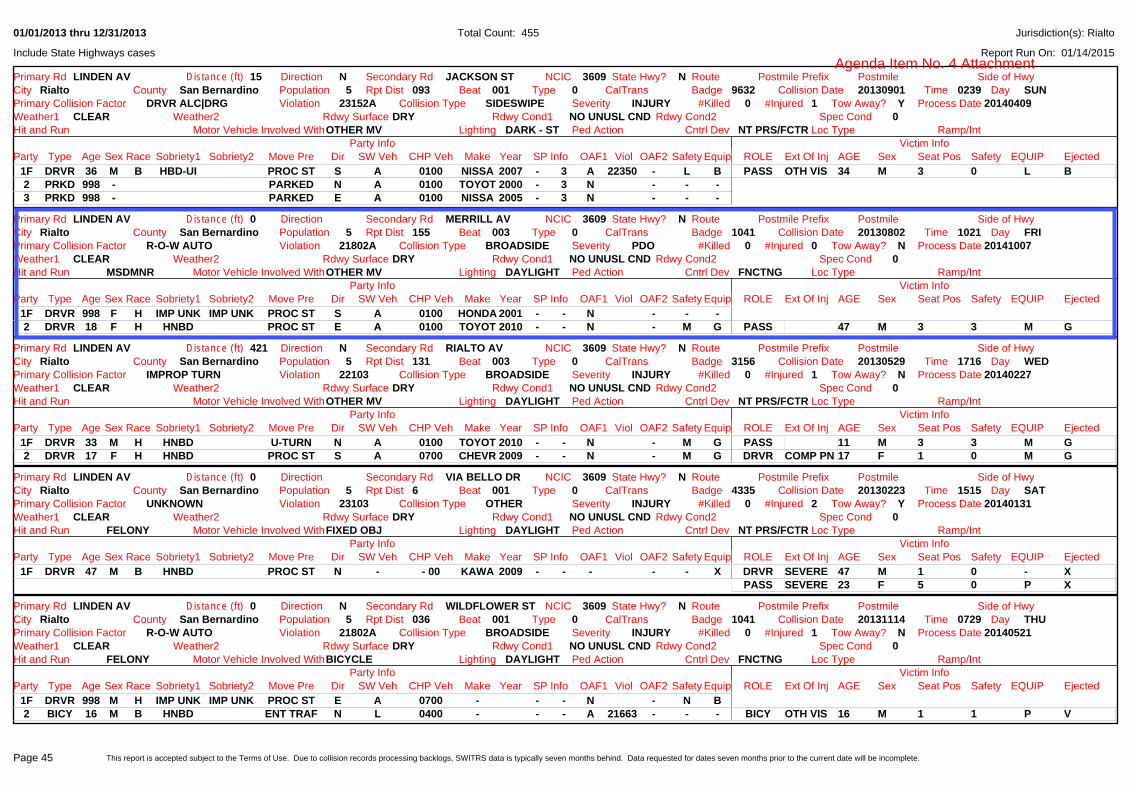
01/01/2013 thru 12/31/2013
Report Run On: 01/14/2015
Total Count: 455
Include State Highways cases
Jurisdiction(s): Rialto
Primary Rd LINDEN AV Distance (ft) 15 Direction N Secondary Rd JACKSON ST NCIC 3609 State Hwy? N Route Postmile Prefix Postmile Side of HwyCity Rialto County San Bernardino Population 5 Rpt Dist 093 Beat 001 Type 0 CalTrans Badge 9632 Collision Date 20130901 Time 0239 Day SUNPrimary Collision Factor DRVR ALC|DRG Violation 23152A Collision Type SIDESWIPE Severity INJURY #Killed 0 #Injured 1 Tow Away? Y Process Date 20140409Weather1 CLEAR Weather2 Rdwy Surface DRY Rdwy Cond1 NO UNUSL CND Rdwy Cond2 Spec Cond 0Hit and Run Motor Vehicle Involved WithOTHER MV Lighting DARK - ST Ped Action Cntrl Dev NT PRS/FCTR Loc Type Ramp/Int
1F DRVR 36 M B HBD-UI PROC ST S A 0100 NISSA 2007 - 3 A 22350 - L B PASS OTH VIS 34 M 3 0 L B2 PRKD 998 - PARKED N A 0100 TOYOT 2000 - 3 N - - -3 PRKD 998 - PARKED E A 0100 NISSA 2005 - 3 N - - -
Party InfoParty Type Age Sex Race Sobriety1 Sobriety2 Move Pre Dir SW Veh CHP Veh Make Year SP Info OAF1 Viol OAF2 Safety Equip ROLE Ext Of Inj AGE Sex Seat Pos Safety EQUIP Ejected
Victim Info
Primary Rd LINDEN AV Distance (ft) 0 Direction Secondary Rd MERRILL AV NCIC 3609 State Hwy? N Route Postmile Prefix Postmile Side of HwyCity Rialto County San Bernardino Population 5 Rpt Dist 155 Beat 003 Type 0 CalTrans Badge 1041 Collision Date 20130802 Time 1021 Day FRIPrimary Collision Factor R-O-W AUTO Violation 21802A Collision Type BROADSIDE Severity PDO #Killed 0 #Injured 0 Tow Away? N Process Date 20141007Weather1 CLEAR Weather2 Rdwy Surface DRY Rdwy Cond1 NO UNUSL CND Rdwy Cond2 Spec Cond 0Hit and Run MSDMNR Motor Vehicle Involved WithOTHER MV Lighting DAYLIGHT Ped Action Cntrl Dev FNCTNG Loc Type Ramp/Int
1F DRVR 998 F H IMP UNK IMP UNK PROC ST S A 0100 HONDA 2001 - - N - - -2 DRVR 18 F H HNBD PROC ST E A 0100 TOYOT 2010 - - N - M G PASS 47 M 3 3 M G
Party InfoParty Type Age Sex Race Sobriety1 Sobriety2 Move Pre Dir SW Veh CHP Veh Make Year SP Info OAF1 Viol OAF2 Safety Equip ROLE Ext Of Inj AGE Sex Seat Pos Safety EQUIP Ejected
Victim Info
Primary Rd LINDEN AV Distance (ft) 421 Direction N Secondary Rd RIALTO AV NCIC 3609 State Hwy? N Route Postmile Prefix Postmile Side of HwyCity Rialto County San Bernardino Population 5 Rpt Dist 131 Beat 003 Type 0 CalTrans Badge 3156 Collision Date 20130529 Time 1716 Day WEDPrimary Collision Factor IMPROP TURN Violation 22103 Collision Type BROADSIDE Severity INJURY #Killed 0 #Injured 1 Tow Away? N Process Date 20140227Weather1 CLEAR Weather2 Rdwy Surface DRY Rdwy Cond1 NO UNUSL CND Rdwy Cond2 Spec Cond 0Hit and Run Motor Vehicle Involved WithOTHER MV Lighting DAYLIGHT Ped Action Cntrl Dev NT PRS/FCTR Loc Type Ramp/Int
1F DRVR 33 M H HNBD U-TURN N A 0100 TOYOT 2010 - - N - M G PASS 11 M 3 3 M G2 DRVR 17 F H HNBD PROC ST S A 0700 CHEVR 2009 - - N - M G DRVR COMP PN 17 F 1 0 M G
Party InfoParty Type Age Sex Race Sobriety1 Sobriety2 Move Pre Dir SW Veh CHP Veh Make Year SP Info OAF1 Viol OAF2 Safety Equip ROLE Ext Of Inj AGE Sex Seat Pos Safety EQUIP Ejected
Victim Info
Primary Rd LINDEN AV Distance (ft) 0 Direction Secondary Rd VIA BELLO DR NCIC 3609 State Hwy? N Route Postmile Prefix Postmile Side of HwyCity Rialto County San Bernardino Population 5 Rpt Dist 6 Beat 001 Type 0 CalTrans Badge 4335 Collision Date 20130223 Time 1515 Day SATPrimary Collision Factor UNKNOWN Violation 23103 Collision Type OTHER Severity INJURY #Killed 0 #Injured 2 Tow Away? Y Process Date 20140131Weather1 CLEAR Weather2 Rdwy Surface DRY Rdwy Cond1 NO UNUSL CND Rdwy Cond2 Spec Cond 0Hit and Run FELONY Motor Vehicle Involved WithFIXED OBJ Lighting DAYLIGHT Ped Action Cntrl Dev NT PRS/FCTR Loc Type Ramp/Int
1F DRVR 47 M B HNBD PROC ST N - - 00 KAWA 2009 - - - - - X DRVR SEVERE 47 M 1 0 - XPASS SEVERE 23 F 5 0 P X
Party InfoParty Type Age Sex Race Sobriety1 Sobriety2 Move Pre Dir SW Veh CHP Veh Make Year SP Info OAF1 Viol OAF2 Safety Equip ROLE Ext Of Inj AGE Sex Seat Pos Safety EQUIP Ejected
Victim Info
Primary Rd LINDEN AV Distance (ft) 0 Direction N Secondary Rd WILDFLOWER ST NCIC 3609 State Hwy? N Route Postmile Prefix Postmile Side of HwyCity Rialto County San Bernardino Population 5 Rpt Dist 036 Beat 001 Type 0 CalTrans Badge 1041 Collision Date 20131114 Time 0729 Day THUPrimary Collision Factor R-O-W AUTO Violation 21802A Collision Type BROADSIDE Severity INJURY #Killed 0 #Injured 1 Tow Away? N Process Date 20140521Weather1 CLEAR Weather2 Rdwy Surface DRY Rdwy Cond1 NO UNUSL CND Rdwy Cond2 Spec Cond 0Hit and Run FELONY Motor Vehicle Involved WithBICYCLE Lighting DAYLIGHT Ped Action Cntrl Dev FNCTNG Loc Type Ramp/Int
1F DRVR 998 M H IMP UNK IMP UNK PROC ST E A 0700 - - - N - N B2 BICY 16 M B HNBD ENT TRAF N L 0400 - - - A 21663 - - - BICY OTH VIS 16 M 1 1 P V
Party InfoParty Type Age Sex Race Sobriety1 Sobriety2 Move Pre Dir SW Veh CHP Veh Make Year SP Info OAF1 Viol OAF2 Safety Equip ROLE Ext Of Inj AGE Sex Seat Pos Safety EQUIP Ejected
Victim Info
Page 45 This report is accepted subject to the Terms of Use. Due to collision records processing backlogs, SWITRS data is typically seven months behind. Data requested for dates seven months prior to the current date will be incomplete.
Agenda Item No. 4 Attachment

01/01/2013 thru 12/31/2013
Report Run On: 01/14/2015
Total Count: 455
Include State Highways cases
Jurisdiction(s): Rialto
Primary Rd LOCUST AV Distance (ft) 529 Direction N Secondary Rd CASMALIA AV NCIC 3609 State Hwy? Y Route Postmile Prefix Postmile Side of HwyCity Rialto County San Bernardino Population 5 Rpt Dist 11 Beat 001 Type 0 CalTrans Badge 3156 Collision Date 20131029 Time 1644 Day TUEPrimary Collision Factor IMPROP TURN Violation 22107 Collision Type HIT OBJECT Severity INJURY #Killed 0 #Injured 1 Tow Away? N Process Date 20140428Weather1 CLEAR Weather2 Rdwy Surface DRY Rdwy Cond1 NO UNUSL CND Rdwy Cond2 Spec Cond 0Hit and Run Motor Vehicle Involved WithFIXED OBJ Lighting DAYLIGHT Ped Action Cntrl Dev NT PRS/FCTR Loc Type Ramp/Int
1F DRVR 26 M H HNBD UNS TURN S A 0100 ACURA 2003 - - N - L G DRVR OTH VIS 26 M 1 0 L G
Party InfoParty Type Age Sex Race Sobriety1 Sobriety2 Move Pre Dir SW Veh CHP Veh Make Year SP Info OAF1 Viol OAF2 Safety Equip ROLE Ext Of Inj AGE Sex Seat Pos Safety EQUIP Ejected
Victim Info
Primary Rd LORRAINE PL Distance (ft) 60 Direction E Secondary Rd CEDAR AV NCIC 3609 State Hwy? N Route Postmile Prefix Postmile Side of HwyCity Rialto County San Bernardino Population 5 Rpt Dist 133 Beat 003 Type 0 CalTrans Badge 9632 Collision Date 20130210 Time 0028 Day SUNPrimary Collision Factor DRVR ALC|DRG Violation 23152 Collision Type REAR END Severity PDO #Killed 0 #Injured 0 Tow Away? N Process Date 20140627Weather1 CLEAR Weather2 Rdwy Surface DRY Rdwy Cond1 NO UNUSL CND Rdwy Cond2 Spec Cond 0Hit and Run MSDMNR Motor Vehicle Involved WithOTHER MV Lighting DARK - ST Ped Action Cntrl Dev NT PRS/FCTR Loc Type Ramp/Int
1F DRVR 21 M H HBD-UI PROC ST E A 0800 GMC 1997 - 1 A 22350 - M G2 PRKD 998 - PARKED E A 0100 JEEP 2001 - 3 N - - -
Party InfoParty Type Age Sex Race Sobriety1 Sobriety2 Move Pre Dir SW Veh CHP Veh Make Year SP Info OAF1 Viol OAF2 Safety Equip ROLE Ext Of Inj AGE Sex Seat Pos Safety EQUIP Ejected
Victim Info
Primary Rd MAPLE AV Distance (ft) 0 Direction N Secondary Rd ATHOL ST NCIC 3609 State Hwy? N Route Postmile Prefix Postmile Side of HwyCity Rialto County San Bernardino Population 5 Rpt Dist 154 Beat 003 Type 0 CalTrans Badge 1041 Collision Date 20131122 Time 0753 Day FRIPrimary Collision Factor R-O-W AUTO Violation 21804A Collision Type BROADSIDE Severity PDO #Killed 0 #Injured 0 Tow Away? N Process Date 20141202Weather1 CLOUDY Weather2 Rdwy Surface DRY Rdwy Cond1 NO UNUSL CND Rdwy Cond2 Spec Cond 0Hit and Run MSDMNR Motor Vehicle Involved WithOTHER MV Lighting DAYLIGHT Ped Action Cntrl Dev NT PRS/FCTR Loc Type Ramp/Int
1F DRVR 39 F H HNBD ENT TRAF S A 0700 FORD 1999 - - N - M G2 DRVR 29 M W HNBD PROC ST N A 0100 CHEVR 2008 - - N - M G
Party InfoParty Type Age Sex Race Sobriety1 Sobriety2 Move Pre Dir SW Veh CHP Veh Make Year SP Info OAF1 Viol OAF2 Safety Equip ROLE Ext Of Inj AGE Sex Seat Pos Safety EQUIP Ejected
Victim Info
Primary Rd MERIDIAN AV Distance (ft) 0 Direction Secondary Rd BASELINE RD NCIC 3609 State Hwy? N Route Postmile Prefix Postmile Side of HwyCity Rialto County San Bernardino Population 5 Rpt Dist 116 Beat 002 Type 0 CalTrans Badge 6367 Collision Date 20130906 Time 1503 Day FRIPrimary Collision Factor WRONG SIDE Violation 216501 Collision Type AUTO/PED Severity INJURY #Killed 0 #Injured 1 Tow Away? N Process Date 20140407Weather1 CLEAR Weather2 Rdwy Surface DRY Rdwy Cond1 NO UNUSL CND Rdwy Cond2 Spec Cond 0Hit and Run Motor Vehicle Involved WithBICYCLE Lighting DAYLIGHT Ped Action Cntrl Dev FNCTNG Loc Type Ramp/Int
1F BICY 15 M H HNBD RGT TURN E L 0400 - - 3 N - - - BICY OTH VIS 15 M 1 0 P V2 DRVR 51 M O HNBD RGT TURN N D 2200 TOYOT 2003 - 3 N - M G
Party InfoParty Type Age Sex Race Sobriety1 Sobriety2 Move Pre Dir SW Veh CHP Veh Make Year SP Info OAF1 Viol OAF2 Safety Equip ROLE Ext Of Inj AGE Sex Seat Pos Safety EQUIP Ejected
Victim Info
Primary Rd MERRILL Distance (ft) 30 Direction E Secondary Rd LINDEN AV NCIC 3609 State Hwy? N Route Postmile Prefix Postmile Side of HwyCity Rialto County San Bernardino Population 5 Rpt Dist 155 Beat 003 Type 0 CalTrans Badge 3281 Collision Date 20131117 Time 2135 Day SUNPrimary Collision Factor R-O-W AUTO Violation 21802A Collision Type BROADSIDE Severity INJURY #Killed 0 #Injured 2 Tow Away? N Process Date 20140521Weather1 CLEAR Weather2 Rdwy Surface DRY Rdwy Cond1 NO UNUSL CND Rdwy Cond2 Spec Cond 0Hit and Run Motor Vehicle Involved WithOTHER MV Lighting DARK - ST Ped Action Cntrl Dev FNCTNG Loc Type Ramp/Int
1F DRVR 26 M H HNBD PROC ST N A 0100 HONDA 2007 - 3 F - L C DRVR COMP PN 26 M 1 0 L CPASS COMP PN 22 F 3 0 M CPASS 3 F 6 3 L QPASS 1 M 4 3 M Q
2 DRVR 43 F H HNBD PROC ST E A 0100 HYUND 2013 - 3 - - L C PASS 35 F 3 3 M CPASS 11 F 6 3 M C
Party InfoParty Type Age Sex Race Sobriety1 Sobriety2 Move Pre Dir SW Veh CHP Veh Make Year SP Info OAF1 Viol OAF2 Safety Equip ROLE Ext Of Inj AGE Sex Seat Pos Safety EQUIP Ejected
Victim Info
Page 47 This report is accepted subject to the Terms of Use. Due to collision records processing backlogs, SWITRS data is typically seven months behind. Data requested for dates seven months prior to the current date will be incomplete.
Agenda Item No. 4 Attachment
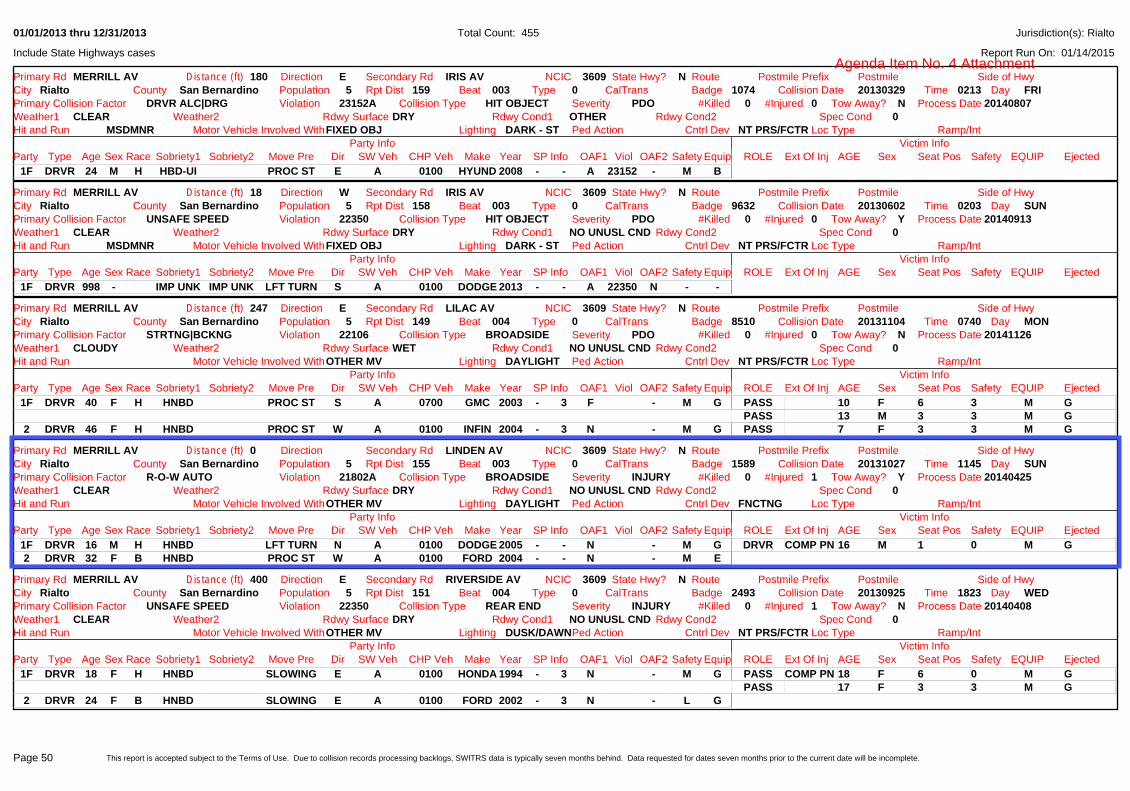
01/01/2013 thru 12/31/2013
Report Run On: 01/14/2015
Total Count: 455
Include State Highways cases
Jurisdiction(s): Rialto
Primary Rd MERRILL AV Distance (ft) 180 Direction E Secondary Rd IRIS AV NCIC 3609 State Hwy? N Route Postmile Prefix Postmile Side of HwyCity Rialto County San Bernardino Population 5 Rpt Dist 159 Beat 003 Type 0 CalTrans Badge 1074 Collision Date 20130329 Time 0213 Day FRIPrimary Collision Factor DRVR ALC|DRG Violation 23152A Collision Type HIT OBJECT Severity PDO #Killed 0 #Injured 0 Tow Away? N Process Date 20140807Weather1 CLEAR Weather2 Rdwy Surface DRY Rdwy Cond1 OTHER Rdwy Cond2 Spec Cond 0Hit and Run MSDMNR Motor Vehicle Involved WithFIXED OBJ Lighting DARK - ST Ped Action Cntrl Dev NT PRS/FCTR Loc Type Ramp/Int
1F DRVR 24 M H HBD-UI PROC ST E A 0100 HYUND 2008 - - A 23152 - M B
Party InfoParty Type Age Sex Race Sobriety1 Sobriety2 Move Pre Dir SW Veh CHP Veh Make Year SP Info OAF1 Viol OAF2 Safety Equip ROLE Ext Of Inj AGE Sex Seat Pos Safety EQUIP Ejected
Victim Info
Primary Rd MERRILL AV Distance (ft) 18 Direction W Secondary Rd IRIS AV NCIC 3609 State Hwy? N Route Postmile Prefix Postmile Side of HwyCity Rialto County San Bernardino Population 5 Rpt Dist 158 Beat 003 Type 0 CalTrans Badge 9632 Collision Date 20130602 Time 0203 Day SUNPrimary Collision Factor UNSAFE SPEED Violation 22350 Collision Type HIT OBJECT Severity PDO #Killed 0 #Injured 0 Tow Away? Y Process Date 20140913Weather1 CLEAR Weather2 Rdwy Surface DRY Rdwy Cond1 NO UNUSL CND Rdwy Cond2 Spec Cond 0Hit and Run MSDMNR Motor Vehicle Involved WithFIXED OBJ Lighting DARK - ST Ped Action Cntrl Dev NT PRS/FCTR Loc Type Ramp/Int
1F DRVR 998 - IMP UNK IMP UNK LFT TURN S A 0100 DODGE 2013 - - A 22350 N - -
Party InfoParty Type Age Sex Race Sobriety1 Sobriety2 Move Pre Dir SW Veh CHP Veh Make Year SP Info OAF1 Viol OAF2 Safety Equip ROLE Ext Of Inj AGE Sex Seat Pos Safety EQUIP Ejected
Victim Info
Primary Rd MERRILL AV Distance (ft) 247 Direction E Secondary Rd LILAC AV NCIC 3609 State Hwy? N Route Postmile Prefix Postmile Side of HwyCity Rialto County San Bernardino Population 5 Rpt Dist 149 Beat 004 Type 0 CalTrans Badge 8510 Collision Date 20131104 Time 0740 Day MONPrimary Collision Factor STRTNG|BCKNG Violation 22106 Collision Type BROADSIDE Severity PDO #Killed 0 #Injured 0 Tow Away? N Process Date 20141126Weather1 CLOUDY Weather2 Rdwy Surface WET Rdwy Cond1 NO UNUSL CND Rdwy Cond2 Spec Cond 0Hit and Run Motor Vehicle Involved WithOTHER MV Lighting DAYLIGHT Ped Action Cntrl Dev NT PRS/FCTR Loc Type Ramp/Int
1F DRVR 40 F H HNBD PROC ST S A 0700 GMC 2003 - 3 F - M G PASS 10 F 6 3 M GPASS 13 M 3 3 M G
2 DRVR 46 F H HNBD PROC ST W A 0100 INFIN 2004 - 3 N - M G PASS 7 F 3 3 M G
Party InfoParty Type Age Sex Race Sobriety1 Sobriety2 Move Pre Dir SW Veh CHP Veh Make Year SP Info OAF1 Viol OAF2 Safety Equip ROLE Ext Of Inj AGE Sex Seat Pos Safety EQUIP Ejected
Victim Info
Primary Rd MERRILL AV Distance (ft) 0 Direction Secondary Rd LINDEN AV NCIC 3609 State Hwy? N Route Postmile Prefix Postmile Side of HwyCity Rialto County San Bernardino Population 5 Rpt Dist 155 Beat 003 Type 0 CalTrans Badge 1589 Collision Date 20131027 Time 1145 Day SUNPrimary Collision Factor R-O-W AUTO Violation 21802A Collision Type BROADSIDE Severity INJURY #Killed 0 #Injured 1 Tow Away? Y Process Date 20140425Weather1 CLEAR Weather2 Rdwy Surface DRY Rdwy Cond1 NO UNUSL CND Rdwy Cond2 Spec Cond 0Hit and Run Motor Vehicle Involved WithOTHER MV Lighting DAYLIGHT Ped Action Cntrl Dev FNCTNG Loc Type Ramp/Int
1F DRVR 16 M H HNBD LFT TURN N A 0100 DODGE 2005 - - N - M G DRVR COMP PN 16 M 1 0 M G2 DRVR 32 F B HNBD PROC ST W A 0100 FORD 2004 - - N - M E
Party InfoParty Type Age Sex Race Sobriety1 Sobriety2 Move Pre Dir SW Veh CHP Veh Make Year SP Info OAF1 Viol OAF2 Safety Equip ROLE Ext Of Inj AGE Sex Seat Pos Safety EQUIP Ejected
Victim Info
Primary Rd MERRILL AV Distance (ft) 400 Direction E Secondary Rd RIVERSIDE AV NCIC 3609 State Hwy? N Route Postmile Prefix Postmile Side of HwyCity Rialto County San Bernardino Population 5 Rpt Dist 151 Beat 004 Type 0 CalTrans Badge 2493 Collision Date 20130925 Time 1823 Day WEDPrimary Collision Factor UNSAFE SPEED Violation 22350 Collision Type REAR END Severity INJURY #Killed 0 #Injured 1 Tow Away? N Process Date 20140408Weather1 CLEAR Weather2 Rdwy Surface DRY Rdwy Cond1 NO UNUSL CND Rdwy Cond2 Spec Cond 0Hit and Run Motor Vehicle Involved WithOTHER MV Lighting DUSK/DAWNPed Action Cntrl Dev NT PRS/FCTR Loc Type Ramp/Int
1F DRVR 18 F H HNBD SLOWING E A 0100 HONDA 1994 - 3 N - M G PASS COMP PN 18 F 6 0 M GPASS 17 F 3 3 M G
2 DRVR 24 F B HNBD SLOWING E A 0100 FORD 2002 - 3 N - L G
Party InfoParty Type Age Sex Race Sobriety1 Sobriety2 Move Pre Dir SW Veh CHP Veh Make Year SP Info OAF1 Viol OAF2 Safety Equip ROLE Ext Of Inj AGE Sex Seat Pos Safety EQUIP Ejected
Victim Info
Page 50 This report is accepted subject to the Terms of Use. Due to collision records processing backlogs, SWITRS data is typically seven months behind. Data requested for dates seven months prior to the current date will be incomplete.
Agenda Item No. 4 Attachment

01/01/2013 thru 12/31/2013
Report Run On: 01/14/2015
Total Count: 455
Include State Highways cases
Jurisdiction(s): Rialto
PASS 9 F 7 3 P GPASS 7 M 7 3 P G
2 DRVR 31 F H HNBD PROC ST W A 0100 NISSA 2008 - - N - M G DRVR COMP PN 31 F 1 3 M G
Primary Rd RESOURCE DR Distance (ft) 0 Direction Secondary Rd S ENTERPRISE NCIC 3609 State Hwy? N Route Postmile Prefix Postmile Side of HwyCity Rialto County San Bernardino Population 5 Rpt Dist 230 Beat 004 Type 0 CalTrans Badge 8082 Collision Date 20130218 Time 1855 Day MONPrimary Collision Factor UNSAFE SPEED Violation 22350 Collision Type BROADSIDE Severity INJURY #Killed 0 #Injured 1 Tow Away? Y Process Date 20140131Weather1 CLEAR Weather2 Rdwy Surface DRY Rdwy Cond1 NO UNUSL CND Rdwy Cond2 Spec Cond 0Hit and Run Motor Vehicle Involved WithOTHER MV Lighting DARK - ST Ped Action Cntrl Dev FNCTNG Loc Type Ramp/Int
1 DRVR 25 M H HNBD PROC ST E C 0200 YAMAH 2002 - - A 22350 - P N DRVR SEVERE 25 M 1 0 P N2F DRVR 25 M W HNBD LFT TURN N A 0100 SCION 2007 - - - - M G
Party InfoParty Type Age Sex Race Sobriety1 Sobriety2 Move Pre Dir SW Veh CHP Veh Make Year SP Info OAF1 Viol OAF2 Safety Equip ROLE Ext Of Inj AGE Sex Seat Pos Safety EQUIP Ejected
Victim Info
Primary Rd RESOURCE ST Distance (ft) 118 Direction W Secondary Rd ENTERPRISE ST NCIC 3609 State Hwy? N Route Postmile Prefix Postmile Side of HwyCity Rialto County San Bernardino Population 5 Rpt Dist 230 Beat 004 Type 0 CalTrans Badge 3156 Collision Date 20130528 Time 2125 Day TUEPrimary Collision Factor UNSAFE SPEED Violation 22350 Collision Type REAR END Severity INJURY #Killed 0 #Injured 1 Tow Away? Y Process Date 20140301Weather1 CLEAR Weather2 Rdwy Surface DRY Rdwy Cond1 NO UNUSL CND Rdwy Cond2 Spec Cond 0Hit and Run Motor Vehicle Involved WithPKD MV Lighting DARK - ST Ped Action Cntrl Dev NT PRS/FCTR Loc Type Ramp/Int
1F DRVR 42 M H HNBD PROC ST E F 2500 VOLVO 2009 - - N - G -2 DRVR 58 M H HNBD PARKED E F 2500 VOLVO 2010 - - N - B - DRVR COMP PN 58 M 1 0 B -
Party InfoParty Type Age Sex Race Sobriety1 Sobriety2 Move Pre Dir SW Veh CHP Veh Make Year SP Info OAF1 Viol OAF2 Safety Equip ROLE Ext Of Inj AGE Sex Seat Pos Safety EQUIP Ejected
Victim Info
Primary Rd RIALTO Distance (ft) 0 Direction Secondary Rd ACACIA AV NCIC 3609 State Hwy? N Route Postmile Prefix Postmile Side of HwyCity Rialto County San Bernardino Population 5 Rpt Dist 153 Beat 004 Type 0 CalTrans Badge 7770 Collision Date 20130418 Time 0730 Day THUPrimary Collision Factor UNSAFE SPEED Violation 22350 Collision Type REAR END Severity PDO #Killed 0 #Injured 0 Tow Away? N Process Date 20140815Weather1 CLEAR Weather2 Rdwy Surface DRY Rdwy Cond1 Rdwy Cond2 Spec Cond 0Hit and Run MSDMNR Motor Vehicle Involved WithOTHER MV Lighting DAYLIGHT Ped Action Cntrl Dev FNCTNG Loc Type Ramp/Int
1F DRVR 998 - IMP UNK IMP UNK PROC ST W B 0101 FORD 1999 - - N - - -2 DRVR 43 F B HNBD STOPPED W B 0101 DODGE 2006 - - N - M G
Party InfoParty Type Age Sex Race Sobriety1 Sobriety2 Move Pre Dir SW Veh CHP Veh Make Year SP Info OAF1 Viol OAF2 Safety Equip ROLE Ext Of Inj AGE Sex Seat Pos Safety EQUIP Ejected
Victim Info
Primary Rd RIALTO Distance (ft) 0 Direction Secondary Rd JOYCE NCIC 3609 State Hwy? N Route Postmile Prefix Postmile Side of HwyCity Rialto County San Bernardino Population 5 Rpt Dist 152 Beat 004 Type 0 CalTrans Badge 6367 Collision Date 20130507 Time 1520 Day TUEPrimary Collision Factor UNSAFE SPEED Violation 22350 Collision Type REAR END Severity INJURY #Killed 0 #Injured 1 Tow Away? N Process Date 20140227Weather1 CLEAR Weather2 Rdwy Surface DRY Rdwy Cond1 NO UNUSL CND Rdwy Cond2 Spec Cond 0Hit and Run Motor Vehicle Involved WithOTHER MV Lighting DAYLIGHT Ped Action Cntrl Dev FNCTNG Loc Type Ramp/Int
1F DRVR 62 F W HNBD PROC ST W A 0100 HYUND 2006 - 3 - - L G2 DRVR 64 F H HNBD PROC ST W A 0100 TOYOT 1997 - 3 - - M G DRVR COMP PN 64 F 1 0 M G3 DRVR 18 F H HNBD PROC ST W A 0100 FORD 1997 - 3 - - L G PASS 998 F 3 3 M G
Party InfoParty Type Age Sex Race Sobriety1 Sobriety2 Move Pre Dir SW Veh CHP Veh Make Year SP Info OAF1 Viol OAF2 Safety Equip ROLE Ext Of Inj AGE Sex Seat Pos Safety EQUIP Ejected
Victim Info
Page 55 This report is accepted subject to the Terms of Use. Due to collision records processing backlogs, SWITRS data is typically seven months behind. Data requested for dates seven months prior to the current date will be incomplete.
Agenda Item No. 4 Attachment

01/01/2013 thru 12/31/2013
Report Run On: 01/14/2015
Total Count: 455
Include State Highways cases
Jurisdiction(s): Rialto
Primary Rd RIALTO AV Distance (ft) 30 Direction W Secondary Rd CACTUS AV NCIC 3609 State Hwy? N Route Postmile Prefix Postmile Side of HwyCity Rialto County San Bernardino Population 5 Rpt Dist 3609 Beat 003 Type 0 CalTrans Badge 0216 Collision Date 20130313 Time 1618 Day WEDPrimary Collision Factor OTHER IMPROP DRV Violation Collision Type SIDESWIPE Severity PDO #Killed 0 #Injured 0 Tow Away? N Process Date 20140722Weather1 CLEAR Weather2 Rdwy Surface DRY Rdwy Cond1 NO UNUSL CND Rdwy Cond2 Spec Cond 0Hit and Run Motor Vehicle Involved WithOTHER MV Lighting DAYLIGHT Ped Action Cntrl Dev FNCTNG Loc Type Ramp/Int
1F DRVR 30 M W HNBD PROC ST E K 4500 INTER 2006 - 3 N - P G2 DRVR 53 M W HNBD PROC ST E D 2200 FORD 2000 - 3 N - L G PASS 54 M 3 3 M G
Party InfoParty Type Age Sex Race Sobriety1 Sobriety2 Move Pre Dir SW Veh CHP Veh Make Year SP Info OAF1 Viol OAF2 Safety Equip ROLE Ext Of Inj AGE Sex Seat Pos Safety EQUIP Ejected
Victim Info
Primary Rd RIALTO AV Distance (ft) 0 Direction Secondary Rd CEDAR AV NCIC 3609 State Hwy? N Route Postmile Prefix Postmile Side of HwyCity Rialto County San Bernardino Population 5 Rpt Dist 143 Beat 003 Type 0 CalTrans Badge 9632 Collision Date 20130812 Time 1840 Day MONPrimary Collision Factor UNKNOWN Violation Collision Type REAR END Severity INJURY #Killed 0 #Injured 1 Tow Away? N Process Date 20141008Weather1 CLEAR Weather2 Rdwy Surface DRY Rdwy Cond1 NO UNUSL CND Rdwy Cond2 Spec Cond 0Hit and Run MSDMNR Motor Vehicle Involved WithOTHER MV Lighting DAYLIGHT Ped Action Cntrl Dev FNCTNG Loc Type Ramp/Int
1 DRVR 998 - IMP UNK IMP UNK PROC ST W D 2200 FORD 1999 - 3 N - - -2 DRVR 37 M H HNBD RGT TURN W A 0100 TOYOT 1998 - 3 N - M B DRVR COMP PN 37 M 1 0 M B
Party InfoParty Type Age Sex Race Sobriety1 Sobriety2 Move Pre Dir SW Veh CHP Veh Make Year SP Info OAF1 Viol OAF2 Safety Equip ROLE Ext Of Inj AGE Sex Seat Pos Safety EQUIP Ejected
Victim Info
Primary Rd RIALTO AV Distance (ft) 0 Direction Secondary Rd EUCALYPTUS AV NCIC 3609 State Hwy? N Route Postmile Prefix Postmile Side of HwyCity Rialto County San Bernardino Population 5 Rpt Dist 142 Beat 004 Type 0 CalTrans Badge 9632 Collision Date 20130222 Time 1841 Day FRIPrimary Collision Factor DRVR ALC|DRG Violation 23152 Collision Type REAR END Severity PDO #Killed 0 #Injured 0 Tow Away? N Process Date 20140708Weather1 CLEAR Weather2 Rdwy Surface DRY Rdwy Cond1 NO UNUSL CND Rdwy Cond2 Spec Cond 0Hit and Run MSDMNR Motor Vehicle Involved WithOTHER MV Lighting DARK - ST Ped Action Cntrl Dev FNCTNG Loc Type Ramp/Int
1F DRVR 55 M W HBD-UI PROC ST W A 0100 HONDA 2006 - 3 A 23152 - M B2 DRVR 25 F W HNBD STOPPED W A 0100 HONDA 1992 - 3 N - M G PASS 28 F 3 3 M G
Party InfoParty Type Age Sex Race Sobriety1 Sobriety2 Move Pre Dir SW Veh CHP Veh Make Year SP Info OAF1 Viol OAF2 Safety Equip ROLE Ext Of Inj AGE Sex Seat Pos Safety EQUIP Ejected
Victim Info
Primary Rd RIALTO AV Distance (ft) 0 Direction Secondary Rd LINDEN AV NCIC 3609 State Hwy? N Route Postmile Prefix Postmile Side of HwyCity Rialto County San Bernardino Population 5 Rpt Dist 143 Beat 003 Type 0 CalTrans Badge 9632 Collision Date 20130224 Time 1934 Day SUNPrimary Collision Factor STOP SGN|SIG Violation 21453A Collision Type BROADSIDE Severity INJURY #Killed 0 #Injured 2 Tow Away? Y Process Date 20140127Weather1 CLEAR Weather2 Rdwy Surface DRY Rdwy Cond1 NO UNUSL CND Rdwy Cond2 Spec Cond 0Hit and Run Motor Vehicle Involved WithOTHER MV Lighting DARK - ST Ped Action Cntrl Dev FNCTNG Loc Type Ramp/Int
1F DRVR 18 M H HBD-NUI PROC ST S A 0100 NISSA 1998 - 3 A 21453 N L G DRVR COMP PN 18 M 1 0 L G2 DRVR 46 F H HBD-NUI PROC ST E A 0100 LEXUS 1992 - 3 N - L G DRVR COMP PN 46 F 1 0 L G
PASS 12 M 3 0 L G
Party InfoParty Type Age Sex Race Sobriety1 Sobriety2 Move Pre Dir SW Veh CHP Veh Make Year SP Info OAF1 Viol OAF2 Safety Equip ROLE Ext Of Inj AGE Sex Seat Pos Safety EQUIP Ejected
Victim Info
Primary Rd RIALTO AV Distance (ft) 120 Direction W Secondary Rd LINDEN AV NCIC 3609 State Hwy? N Route Postmile Prefix Postmile Side of HwyCity Rialto County San Bernardino Population 5 Rpt Dist 3609 Beat 131 Type 0 CalTrans Badge 1589 Collision Date 20130406 Time 0600 Day SATPrimary Collision Factor DRVR ALC|DRG Violation 23152A Collision Type REAR END Severity PDO #Killed 0 #Injured 0 Tow Away? Y Process Date 20140807Weather1 CLOUDY Weather2 Rdwy Surface WET Rdwy Cond1 NO UNUSL CND Rdwy Cond2 Spec Cond 0Hit and Run Motor Vehicle Involved WithPKD MV Lighting DARK - ST Ped Action Cntrl Dev NT PRS/FCTR Loc Type Ramp/Int
1F DRVR 21 M H HBD-UI PROC ST W A 0100 FORD 2003 - - A 23152 - L B PASS 21 M 3 3 L H2 PRKD 998 - PARKED W A 0100 PONTI - - - - - -
Party InfoParty Type Age Sex Race Sobriety1 Sobriety2 Move Pre Dir SW Veh CHP Veh Make Year SP Info OAF1 Viol OAF2 Safety Equip ROLE Ext Of Inj AGE Sex Seat Pos Safety EQUIP Ejected
Victim Info
Page 56 This report is accepted subject to the Terms of Use. Due to collision records processing backlogs, SWITRS data is typically seven months behind. Data requested for dates seven months prior to the current date will be incomplete.
Agenda Item No. 4 Attachment

01/01/2013 thru 12/31/2013
Report Run On: 01/14/2015
Total Count: 455
Include State Highways cases
Jurisdiction(s): Rialto
Primary Rd RIALTO AV Distance (ft) 630 Direction W Secondary Rd LINDEN AV NCIC 3609 State Hwy? N Route Postmile Prefix Postmile Side of HwyCity Rialto County San Bernardino Population 5 Rpt Dist 143 Beat 003 Type 0 CalTrans Badge 2517 Collision Date 20131129 Time 1015 Day FRIPrimary Collision Factor R-O-W AUTO Violation 21804A Collision Type BROADSIDE Severity INJURY #Killed 0 #Injured 1 Tow Away? N Process Date 20140507Weather1 RAINING Weather2 Rdwy Surface WET Rdwy Cond1 NO UNUSL CND Rdwy Cond2 Spec Cond 0Hit and Run Motor Vehicle Involved WithOTHER MV Lighting DAYLIGHT Ped Action Cntrl Dev FNCTNG Loc Type Ramp/Int
1F DRVR 28 M H HNBD ENT TRAF N A 0100 CHEVR 2005 - - - - M G DRVR COMP PN 28 M 1 0 M G2 DRVR 30 F H HNBD PROC ST E A 0100 CHEVR 2007 - - - - M G
Party InfoParty Type Age Sex Race Sobriety1 Sobriety2 Move Pre Dir SW Veh CHP Veh Make Year SP Info OAF1 Viol OAF2 Safety Equip ROLE Ext Of Inj AGE Sex Seat Pos Safety EQUIP Ejected
Victim Info
Primary Rd RIALTO AV Distance (ft) 157 Direction E Secondary Rd MAPLE AV NCIC 3609 State Hwy? N Route Postmile Prefix Postmile Side of HwyCity Rialto County San Bernardino Population 5 Rpt Dist 143 Beat 003 Type 0 CalTrans Badge 3156 Collision Date 20130620 Time 1858 Day THUPrimary Collision Factor IMPROP TURN Violation 22107 Collision Type HEAD-ON Severity PDO #Killed 0 #Injured 0 Tow Away? Y Process Date 20140920Weather1 CLEAR Weather2 Rdwy Surface DRY Rdwy Cond1 NO UNUSL CND Rdwy Cond2 Spec Cond 0Hit and Run MSDMNR Motor Vehicle Involved WithFIXED OBJ Lighting DAYLIGHT Ped Action Cntrl Dev NT PRS/FCTR Loc Type Ramp/Int
1F DRVR 998 M H IMP UNK IMP UNK PROC ST E A 0100 FORD 2005 - - N - M B
Party InfoParty Type Age Sex Race Sobriety1 Sobriety2 Move Pre Dir SW Veh CHP Veh Make Year SP Info OAF1 Viol OAF2 Safety Equip ROLE Ext Of Inj AGE Sex Seat Pos Safety EQUIP Ejected
Victim Info
Primary Rd RIALTO AV Distance (ft) 462 Direction E Secondary Rd MAPLE AV NCIC 3609 State Hwy? N Route Postmile Prefix Postmile Side of HwyCity Rialto County San Bernardino Population 5 Rpt Dist 143 Beat 003 Type 0 CalTrans Badge 2517 Collision Date 20131116 Time 1749 Day SATPrimary Collision Factor R-O-W AUTO Violation 21804A Collision Type BROADSIDE Severity INJURY #Killed 0 #Injured 1 Tow Away? Y Process Date 20140521Weather1 CLEAR Weather2 Rdwy Surface DRY Rdwy Cond1 NO UNUSL CND Rdwy Cond2 Spec Cond 0Hit and Run Motor Vehicle Involved WithOTHER MV Lighting DARK - ST Ped Action Cntrl Dev NT PRS/FCTR Loc Type Ramp/Int
1F DRVR 26 M H HNBD ENT TRAF N A 0100 HONDA 2000 - - - - M G2 DRVR 23 F H HNBD PROC ST E A 0100 NISSA 1998 - - - - M G DRVR COMP PN 53 F 1 0 M G
Party InfoParty Type Age Sex Race Sobriety1 Sobriety2 Move Pre Dir SW Veh CHP Veh Make Year SP Info OAF1 Viol OAF2 Safety Equip ROLE Ext Of Inj AGE Sex Seat Pos Safety EQUIP Ejected
Victim Info
Primary Rd RIALTO AV Distance (ft) 0 Direction Secondary Rd SPRUCE AV NCIC 3609 State Hwy? N Route Postmile Prefix Postmile Side of HwyCity Rialto County San Bernardino Population 5 Rpt Dist 135 Beat 003 Type 0 CalTrans Badge 5550 Collision Date 20130603 Time 1120 Day MONPrimary Collision Factor STRTNG|BCKNG Violation 22106 Collision Type SIDESWIPE Severity INJURY #Killed 0 #Injured 2 Tow Away? Y Process Date 20140304Weather1 CLEAR Weather2 Rdwy Surface DRY Rdwy Cond1 NO UNUSL CND Rdwy Cond2 Spec Cond 0Hit and Run Motor Vehicle Involved WithOTHER MV Lighting DAYLIGHT Ped Action Cntrl Dev NT PRS/FCTR Loc Type Ramp/Int
1F DRVR 54 M H HNBD BACKING N G 2540 KENW 2008 - - N - P G2 DRVR 80 M W HNBD PROC ST E A 0100 HYUND 2009 - - N - M G DRVR OTH VIS 80 M 1 0 M G
PASS COMP PN 77 M 3 0 M G
Party InfoParty Type Age Sex Race Sobriety1 Sobriety2 Move Pre Dir SW Veh CHP Veh Make Year SP Info OAF1 Viol OAF2 Safety Equip ROLE Ext Of Inj AGE Sex Seat Pos Safety EQUIP Ejected
Victim Info
Primary Rd RIALTO AV Distance (ft) 29 Direction W Secondary Rd WILLOW AV NCIC 3609 State Hwy? N Route Postmile Prefix Postmile Side of HwyCity Rialto County San Bernardino Population 5 Rpt Dist 138 Beat 004 Type 0 CalTrans Badge 5550 Collision Date 20131204 Time 1147 Day WEDPrimary Collision Factor DRVR ALC|DRG Violation 23152A Collision Type REAR END Severity PDO #Killed 0 #Injured 0 Tow Away? Y Process Date 20141231Weather1 CLEAR Weather2 Rdwy Surface DRY Rdwy Cond1 NO UNUSL CND Rdwy Cond2 Spec Cond 0Hit and Run Motor Vehicle Involved WithOTHER MV Lighting DAYLIGHT Ped Action Cntrl Dev NT PRS/FCTR Loc Type Ramp/Int
1F DRVR 54 M W HBD-UI PROC ST E D 2200 NISSA 2000 - - A 22350 - M B2 DRVR 28 M H HNBD STOPPED E A 0100 NISSA 1998 - - N - M G
Party InfoParty Type Age Sex Race Sobriety1 Sobriety2 Move Pre Dir SW Veh CHP Veh Make Year SP Info OAF1 Viol OAF2 Safety Equip ROLE Ext Of Inj AGE Sex Seat Pos Safety EQUIP Ejected
Victim Info
Page 57 This report is accepted subject to the Terms of Use. Due to collision records processing backlogs, SWITRS data is typically seven months behind. Data requested for dates seven months prior to the current date will be incomplete.
Agenda Item No. 4 Attachment

01/01/2013 thru 12/31/2013
Report Run On: 01/14/2015
Total Count: 455
Include State Highways cases
Jurisdiction(s): Rialto
Primary Rd RIVERSIDE AV Distance (ft) 30 Direction S Secondary Rd JURUPA AV NCIC 3609 State Hwy? Y Route Postmile Prefix Postmile Side of HwyCity Rialto County San Bernardino Population 5 Rpt Dist Beat 004 Type 0 CalTrans Badge 7490 Collision Date 20130704 Time 2125 Day THUPrimary Collision Factor NOT DRIVER Violation Collision Type HIT OBJECT Severity PDO #Killed 0 #Injured 0 Tow Away? N Process Date 20141007Weather1 CLEAR Weather2 Rdwy Surface DRY Rdwy Cond1 NO UNUSL CND Rdwy Cond2 Spec Cond 0Hit and Run Motor Vehicle Involved WithFIXED OBJ Lighting DARK - NO Ped Action Cntrl Dev Loc Type Ramp/Int
1 DRVR 21 M W HNBD PROC ST N A 0800 FORD 2007 - - M - L -
Party InfoParty Type Age Sex Race Sobriety1 Sobriety2 Move Pre Dir SW Veh CHP Veh Make Year SP Info OAF1 Viol OAF2 Safety Equip ROLE Ext Of Inj AGE Sex Seat Pos Safety EQUIP Ejected
Victim Info
Primary Rd RIVERSIDE AV Distance (ft) 260 Direction S Secondary Rd JURUPA AV NCIC 3609 State Hwy? N Route Postmile Prefix Postmile Side of HwyCity Rialto County San Bernardino Population 5 Rpt Dist 220 Beat 004 Type 0 CalTrans Badge 6367 Collision Date 20130814 Time 0729 Day WEDPrimary Collision Factor UNSAFE SPEED Violation 22350 Collision Type REAR END Severity PDO #Killed 0 #Injured 0 Tow Away? N Process Date 20141023Weather1 CLEAR Weather2 Rdwy Surface DRY Rdwy Cond1 NO UNUSL CND Rdwy Cond2 Spec Cond 0Hit and Run MSDMNR Motor Vehicle Involved WithOTHER MV Lighting DAYLIGHT Ped Action Cntrl Dev FNCTNG Loc Type Ramp/Int
1F DRVR 998 - IMP UNK IMP UNK PROC ST N A 0700 FORD 1999 - 3 A 21658 - - -2 DRVR 43 M W HNBD PROC ST N A 0100 FORD 1998 - 3 N - M G3 DRVR 24 F H HNBD PROC ST N A 0700 FORD 2012 - 3 N - M G
Party InfoParty Type Age Sex Race Sobriety1 Sobriety2 Move Pre Dir SW Veh CHP Veh Make Year SP Info OAF1 Viol OAF2 Safety Equip ROLE Ext Of Inj AGE Sex Seat Pos Safety EQUIP Ejected
Victim Info
Primary Rd RIVERSIDE AV Distance (ft) 23 Direction N Secondary Rd JURUPA AV NCIC 3609 State Hwy? N Route Postmile Prefix Postmile Side of HwyCity Rialto County San Bernardino Population 5 Rpt Dist 515 Beat 004 Type 0 CalTrans Badge 3156 Collision Date 20131210 Time 1953 Day TUEPrimary Collision Factor IMPROP TURN Violation 22107 Collision Type HIT OBJECT Severity PDO #Killed 0 #Injured 0 Tow Away? N Process Date 20141226Weather1 CLEAR Weather2 Rdwy Surface DRY Rdwy Cond1 NO UNUSL CND Rdwy Cond2 Spec Cond 0Hit and Run MSDMNR Motor Vehicle Involved WithFIXED OBJ Lighting DARK - ST Ped Action Cntrl Dev FNCTNG Loc Type Ramp/Int
1F DRVR 998 - HBD-UNK RGT TURN S A 0100 VOLKS - - N - - B
Party InfoParty Type Age Sex Race Sobriety1 Sobriety2 Move Pre Dir SW Veh CHP Veh Make Year SP Info OAF1 Viol OAF2 Safety Equip ROLE Ext Of Inj AGE Sex Seat Pos Safety EQUIP Ejected
Victim Info
Primary Rd RIVERSIDE AV Distance (ft) 78 Direction N Secondary Rd LIGHT STANDARD NCIC 3609 State Hwy? N Route Postmile Prefix Postmile Side of HwyCity Rialto County San Bernardino Population 5 Rpt Dist 78 Beat 002 Type 0 CalTrans Badge 6932 Collision Date 20130531 Time 2249 Day FRIPrimary Collision Factor NOT DRIVER Violation Collision Type AUTO/PED Severity INJURY #Killed 0 #Injured 1 Tow Away? N Process Date 20140222Weather1 CLEAR Weather2 Rdwy Surface DRY Rdwy Cond1 NO UNUSL CND Rdwy Cond2 Spec Cond 0Hit and Run Motor Vehicle Involved WithPED Lighting DARK - ST Ped Action NOT IN X- Cntrl Dev NT PRS/FCTR Loc Type Ramp/Int
1 PED 34 F W HBD-UNK PROC ST E N 6000 - - 3 A 21954 N - - PED OTH VIS 34 F 9 0 - -2 DRVR 49 M W HNBD PROC ST N A 0100 SATUR 2002 - 3 N - M G PASS 50 F 3 0 M G
Party InfoParty Type Age Sex Race Sobriety1 Sobriety2 Move Pre Dir SW Veh CHP Veh Make Year SP Info OAF1 Viol OAF2 Safety Equip ROLE Ext Of Inj AGE Sex Seat Pos Safety EQUIP Ejected
Victim Info
Primary Rd RIVERSIDE AV Distance (ft) 0 Direction Secondary Rd LINDEN AV NCIC 3609 State Hwy? N Route Postmile Prefix Postmile Side of HwyCity Rialto County San Bernardino Population 5 Rpt Dist 21 Beat 001 Type 0 CalTrans Badge 6367 Collision Date 20130812 Time 0620 Day MONPrimary Collision Factor UNSAFE SPEED Violation 22350 Collision Type HIT OBJECT Severity PDO #Killed 0 #Injured 0 Tow Away? N Process Date 20141023Weather1 CLEAR Weather2 Rdwy Surface DRY Rdwy Cond1 NO UNUSL CND Rdwy Cond2 Spec Cond 0Hit and Run Motor Vehicle Involved WithFIXED OBJ Lighting DAYLIGHT Ped Action Cntrl Dev FNCTNG Loc Type Ramp/Int
1F DRVR 17 F H HNBD RGT TURN S A 0700 JEEP 2001 - 3 N - M G
Party InfoParty Type Age Sex Race Sobriety1 Sobriety2 Move Pre Dir SW Veh CHP Veh Make Year SP Info OAF1 Viol OAF2 Safety Equip ROLE Ext Of Inj AGE Sex Seat Pos Safety EQUIP Ejected
Victim Info
Page 66 This report is accepted subject to the Terms of Use. Due to collision records processing backlogs, SWITRS data is typically seven months behind. Data requested for dates seven months prior to the current date will be incomplete.
Agenda Item No. 4 Attachment
Traffic Signal Prioritization Analysis City of Rialto
APPENDIX E
CA MUTCD Traffic Signal Warrants Summary Reports
Agenda Item No. 4 Attachment
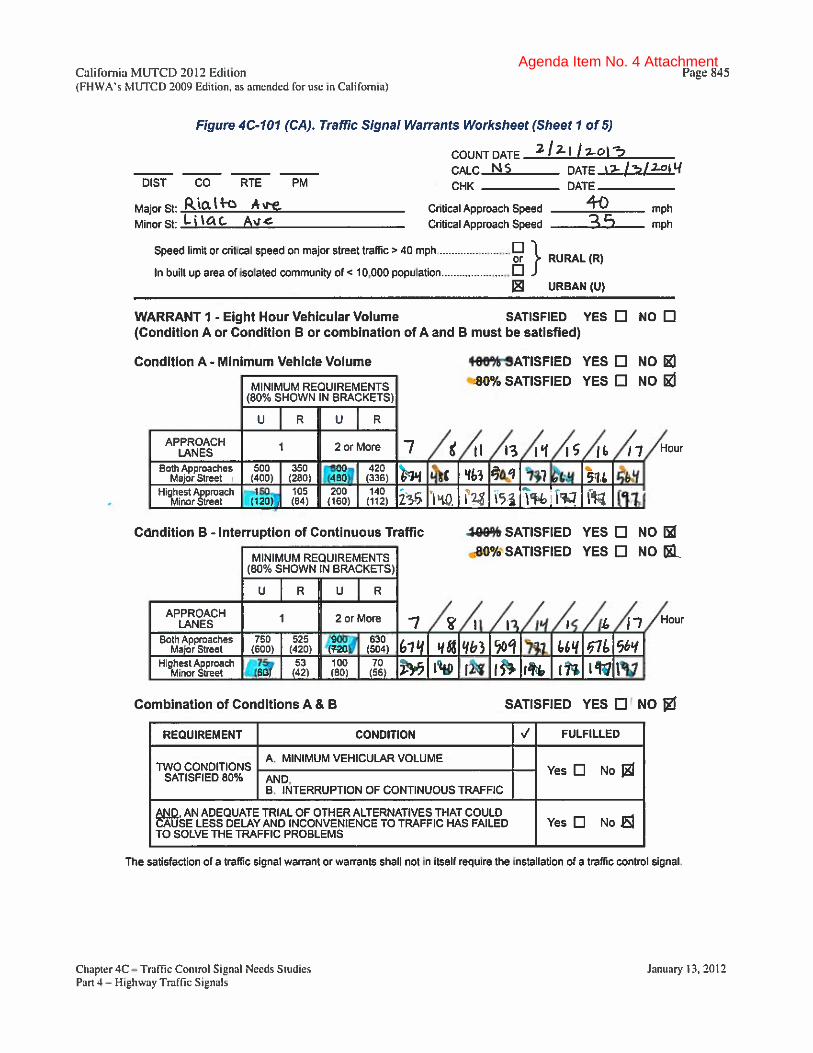
Agenda Item No. 4 Attachment
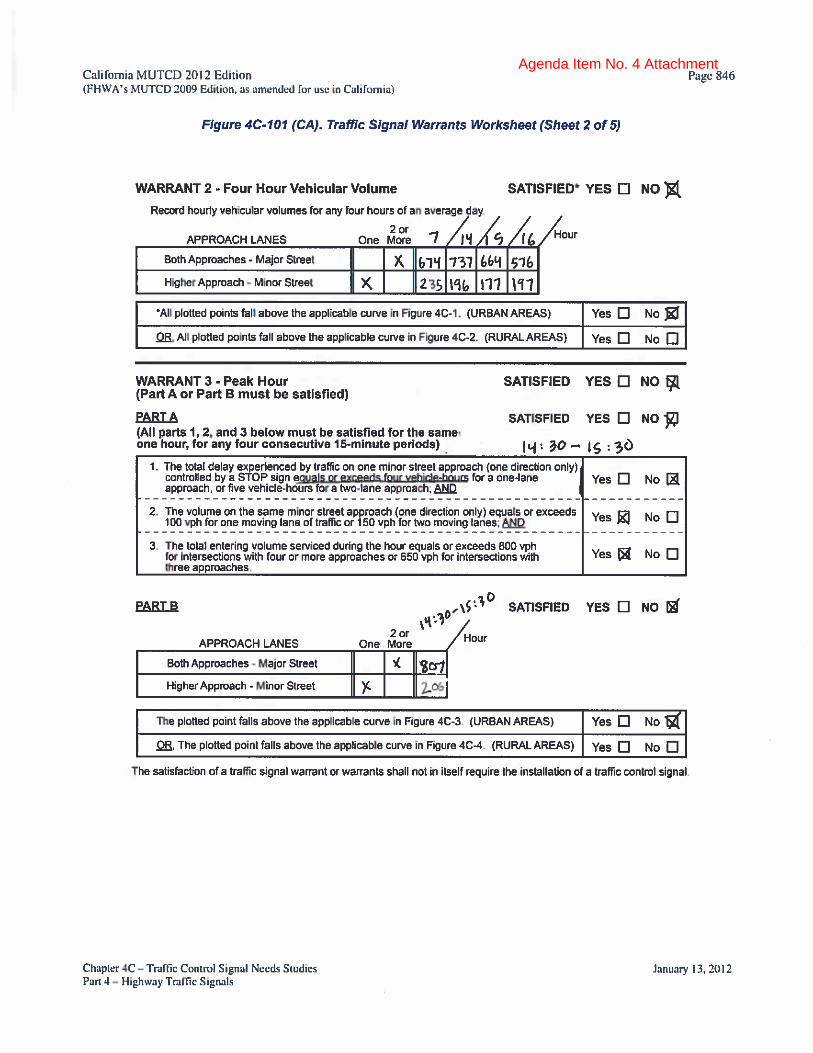
Agenda Item No. 4 Attachment

Agenda Item No. 4 Attachment
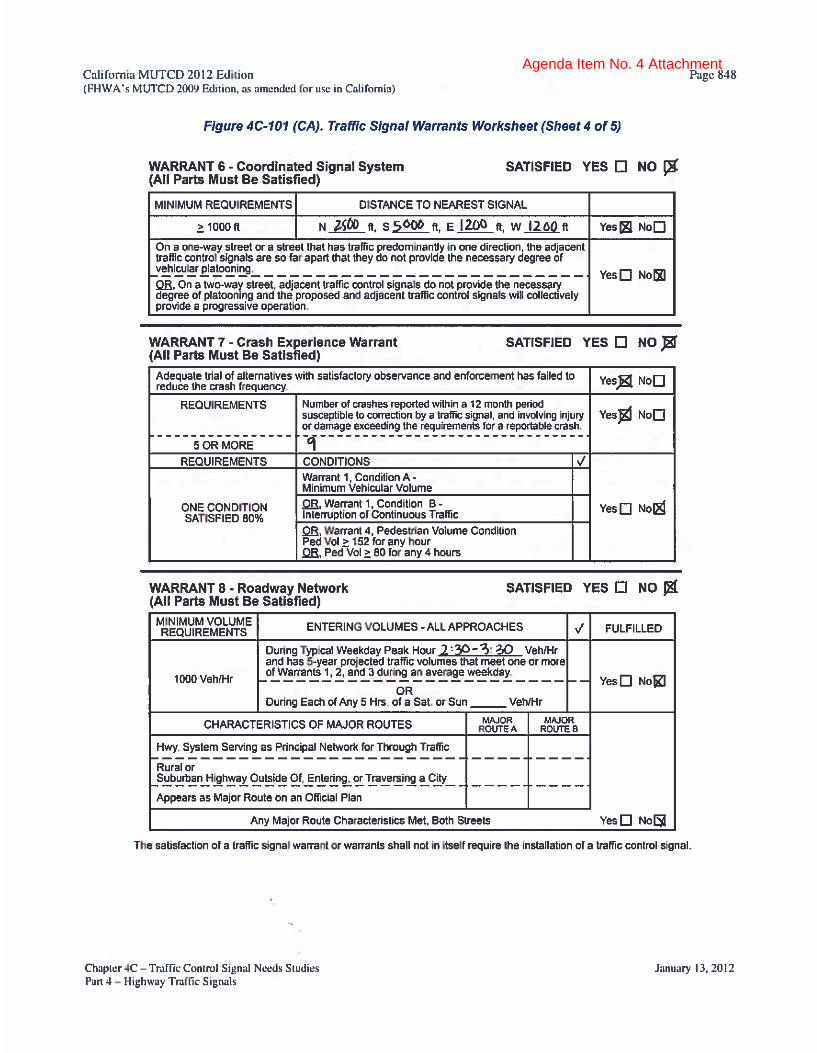
Agenda Item No. 4 Attachment
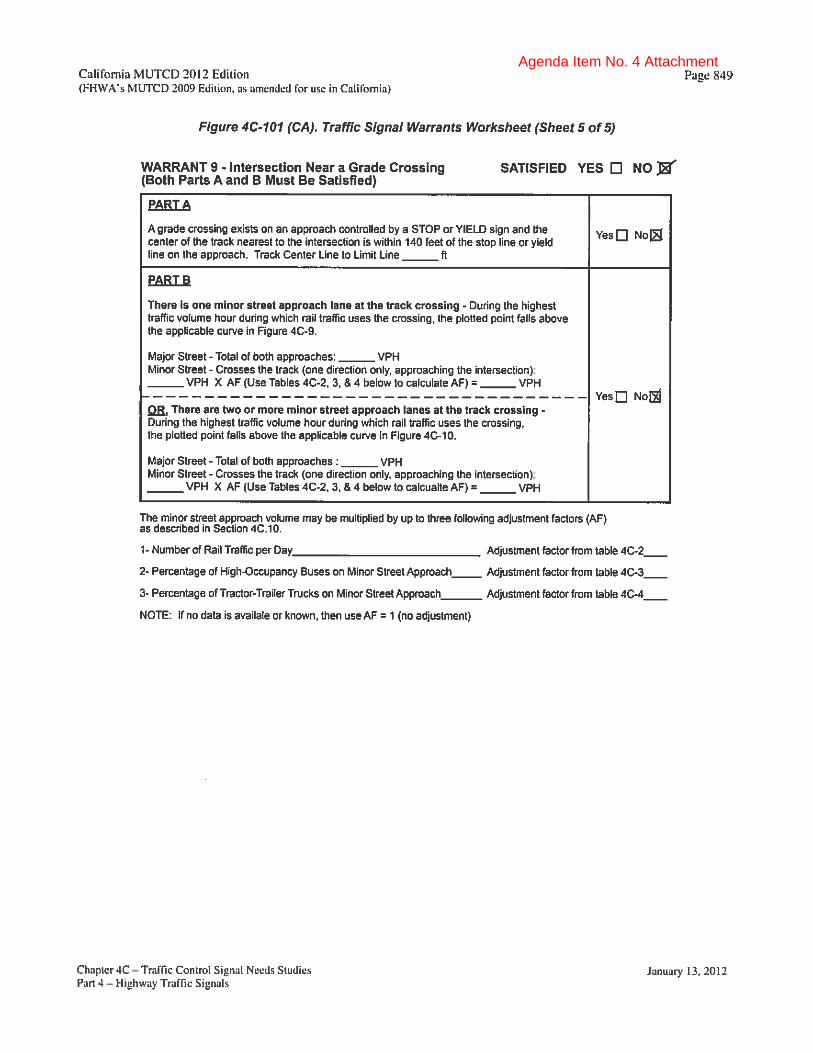
Agenda Item No. 4 Attachment

Agenda Item No. 4 Attachment
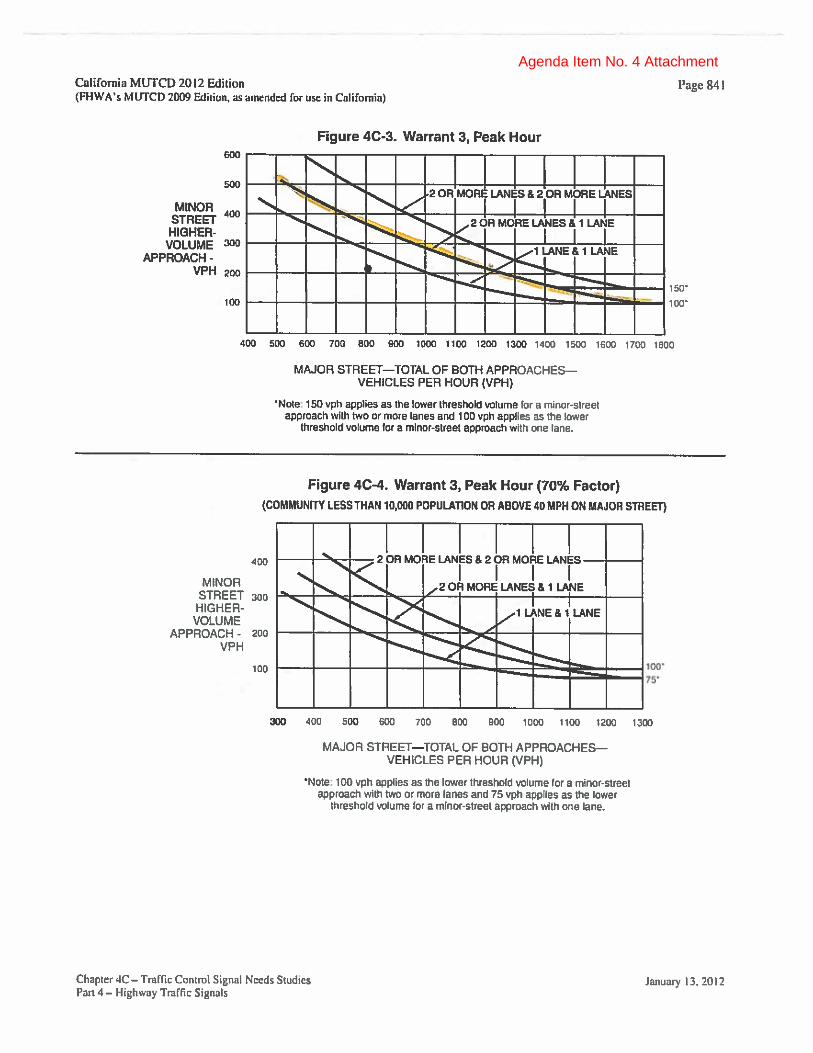
Agenda Item No. 4 Attachment

Agenda Item No. 4 Attachment

Agenda Item No. 4 Attachment

Agenda Item No. 4 Attachment
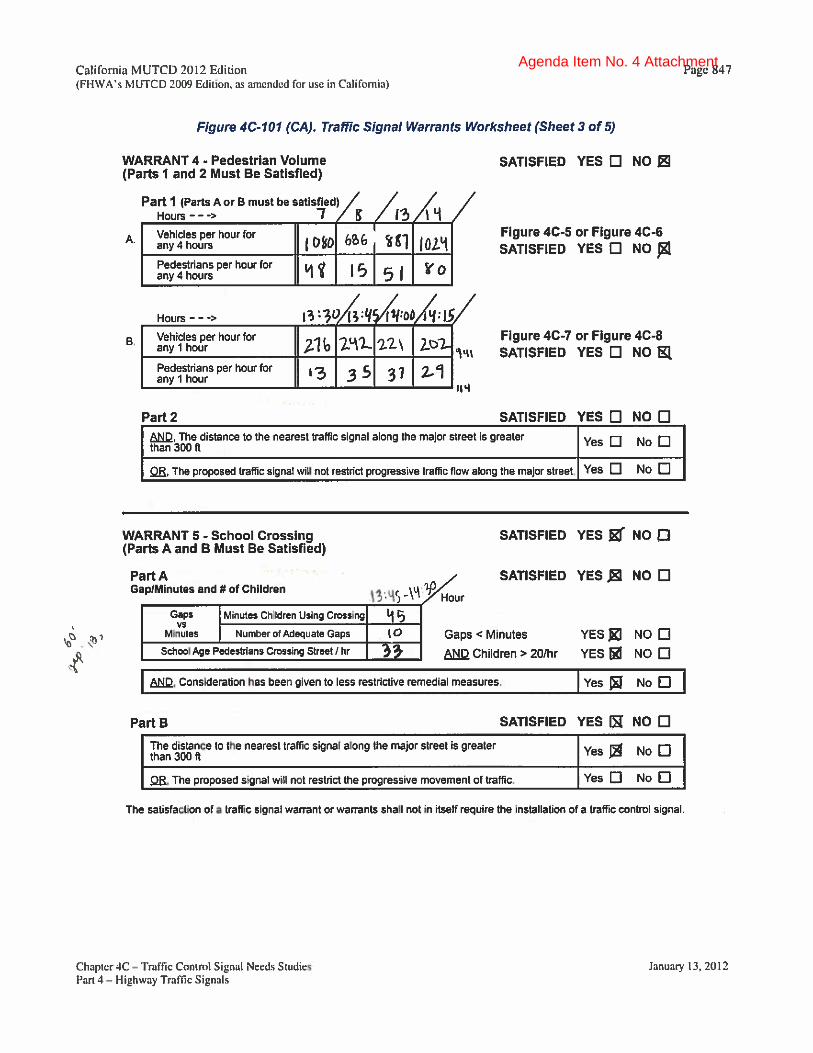
Agenda Item No. 4 Attachment

Agenda Item No. 4 Attachment

Agenda Item No. 4 Attachment

Agenda Item No. 4 Attachment

Agenda Item No. 4 Attachment
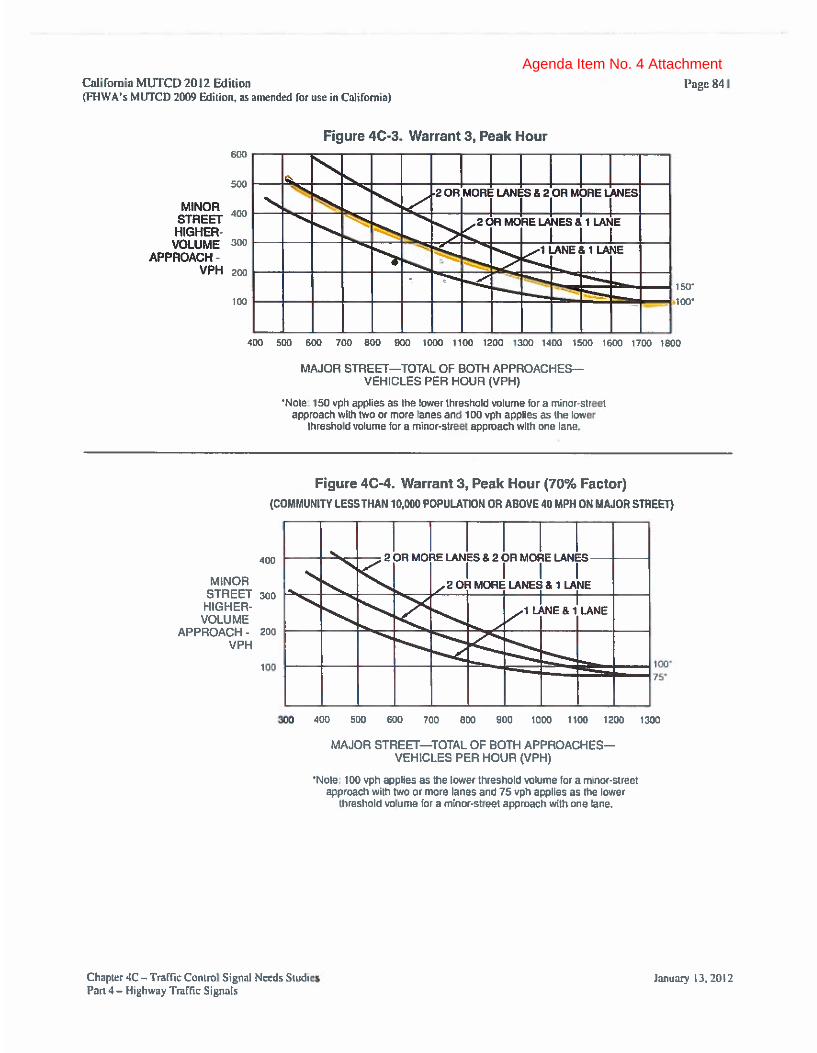
Agenda Item No. 4 Attachment

Agenda Item No. 4 Attachment
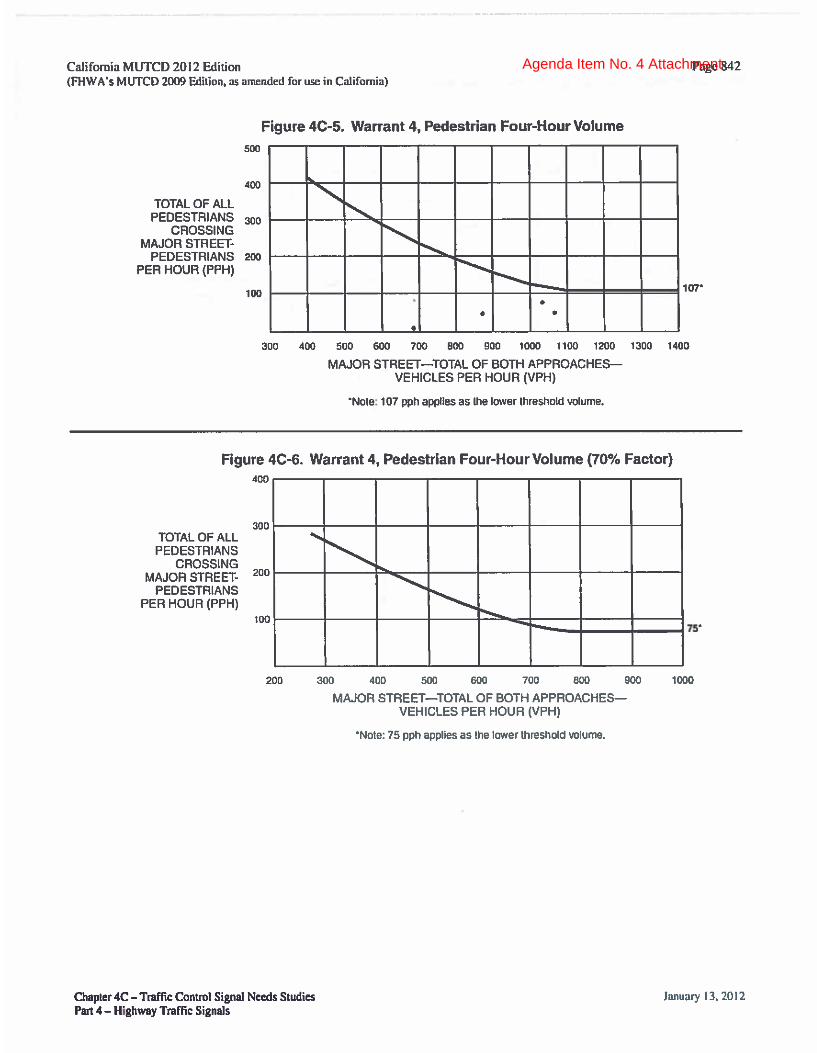
Agenda Item No. 4 Attachment
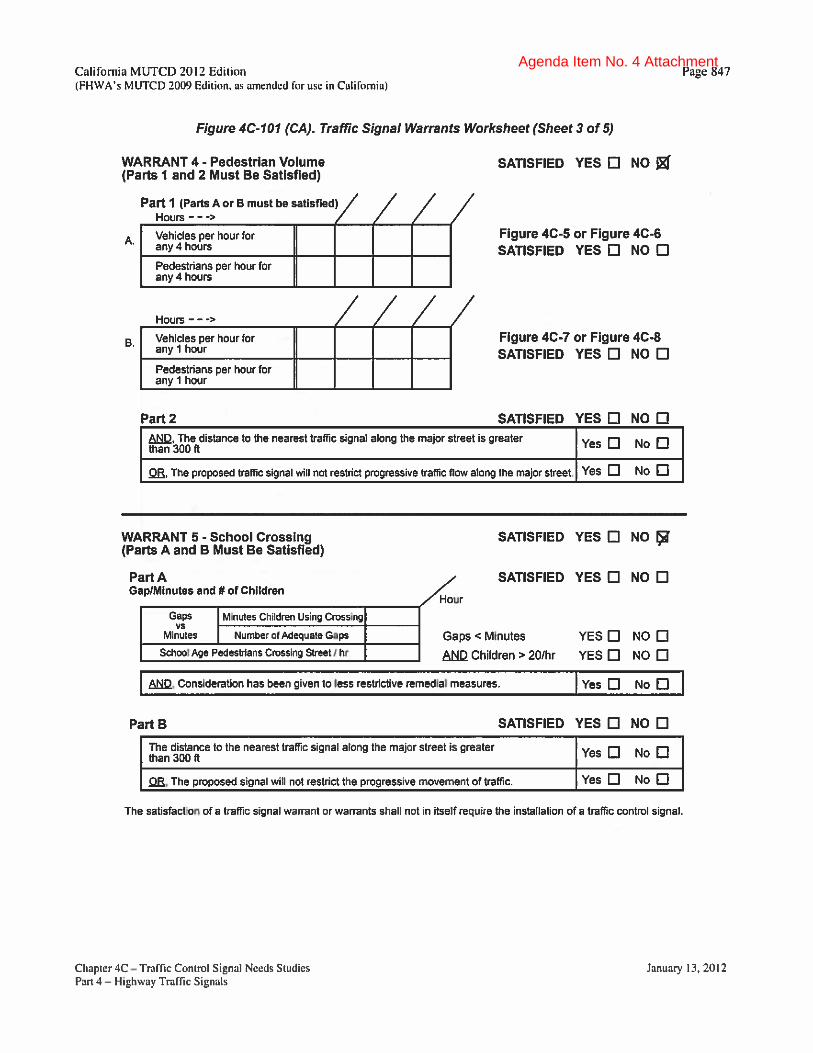
Agenda Item No. 4 Attachment

Agenda Item No. 4 Attachment

Agenda Item No. 4 Attachment

Agenda Item No. 4 Attachment
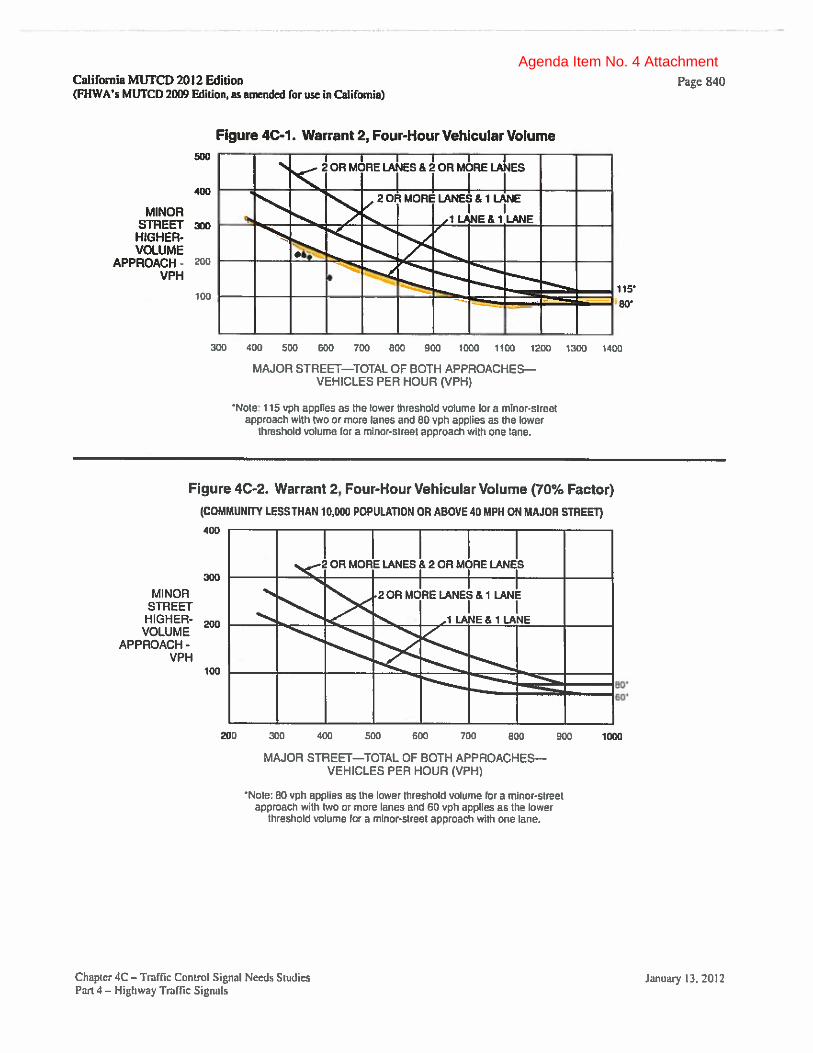
Agenda Item No. 4 Attachment
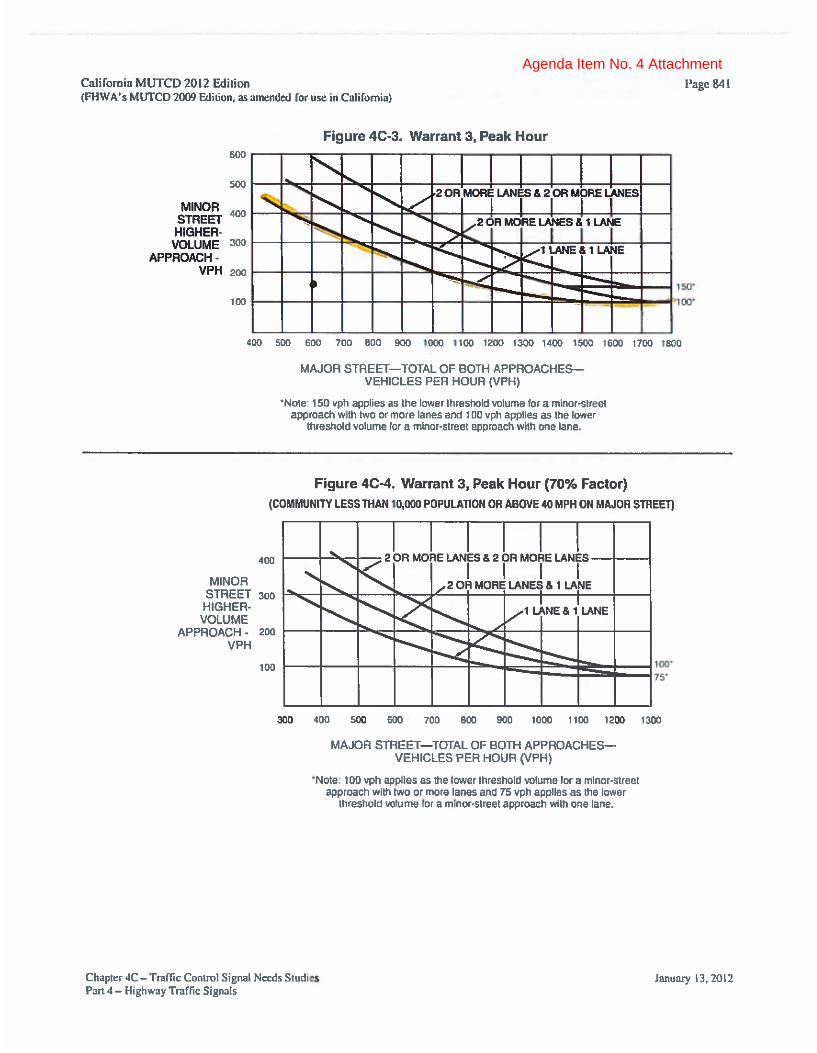
Agenda Item No. 4 Attachment
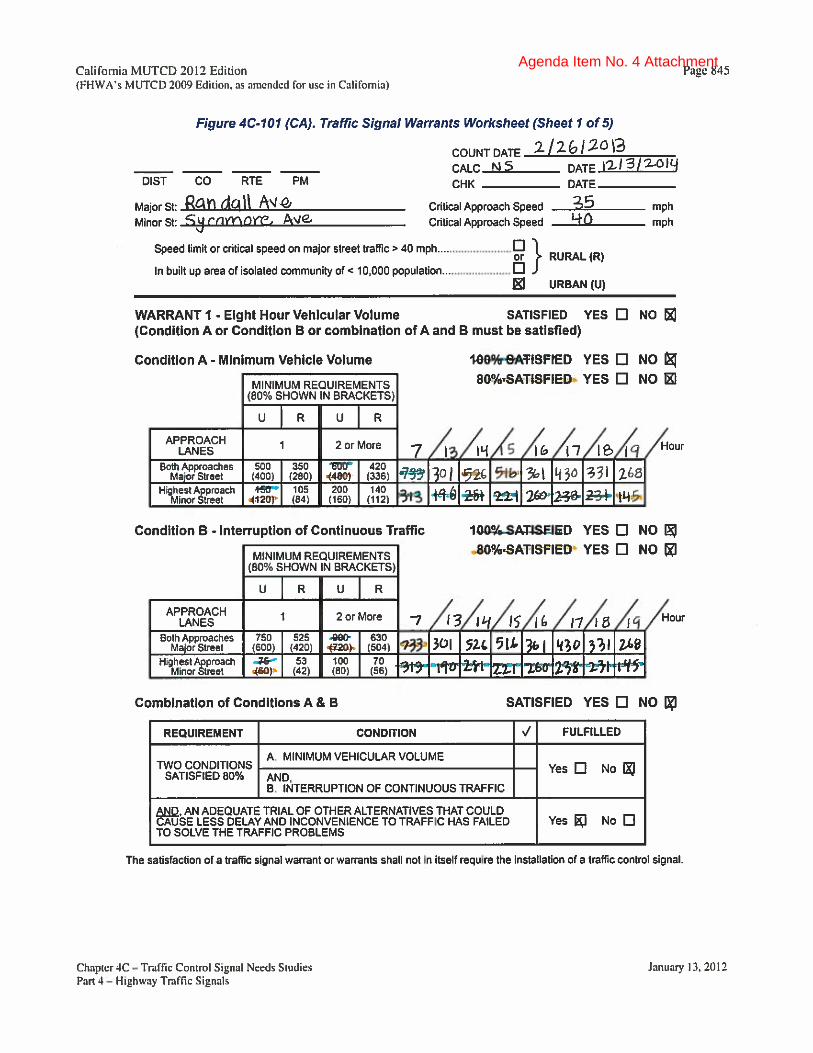
Agenda Item No. 4 Attachment

Agenda Item No. 4 Attachment
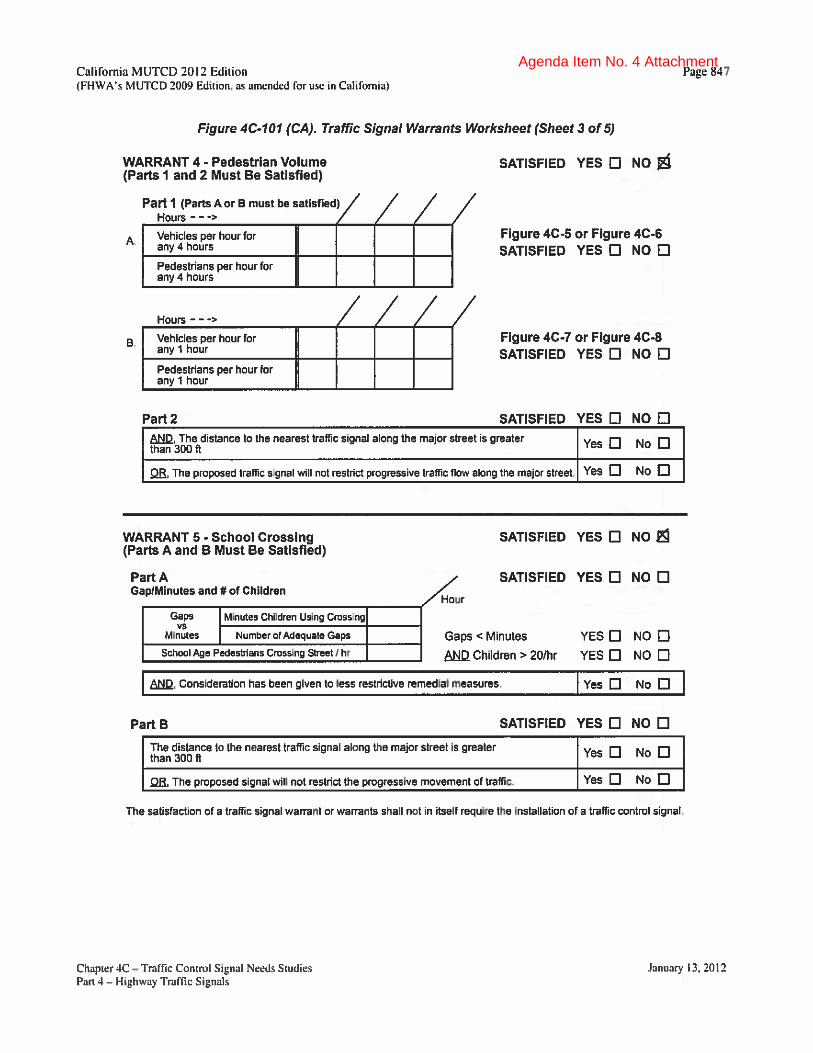
Agenda Item No. 4 Attachment

Agenda Item No. 4 Attachment

Agenda Item No. 4 Attachment

Agenda Item No. 4 Attachment
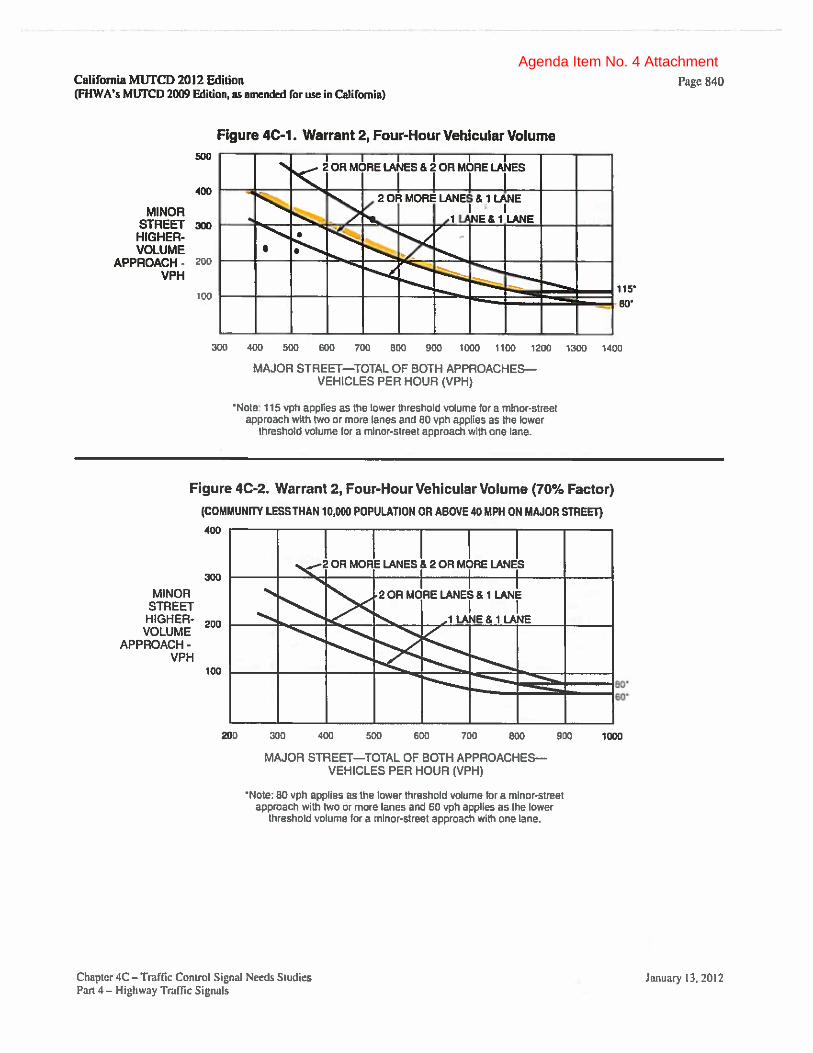
Agenda Item No. 4 Attachment

Agenda Item No. 4 Attachment

Agenda Item No. 4 Attachment
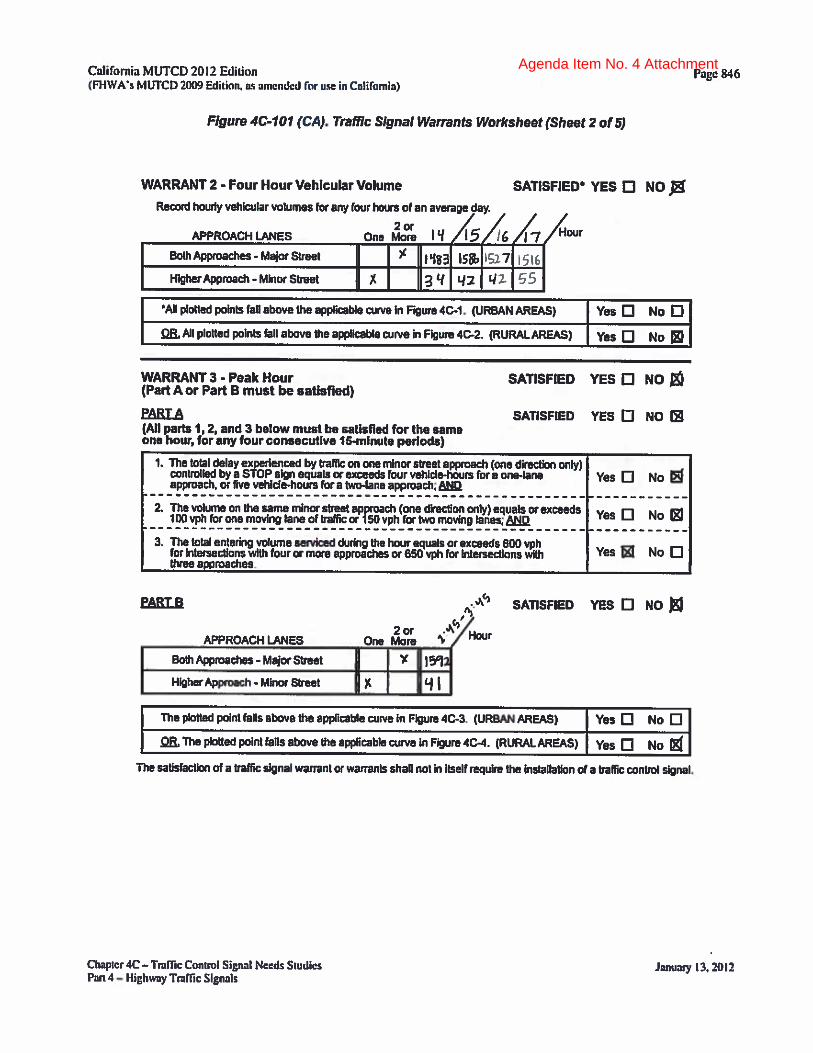
Agenda Item No. 4 Attachment

Agenda Item No. 4 Attachment

Agenda Item No. 4 Attachment

Agenda Item No. 4 Attachment
Agenda Item No. 4 Attachment
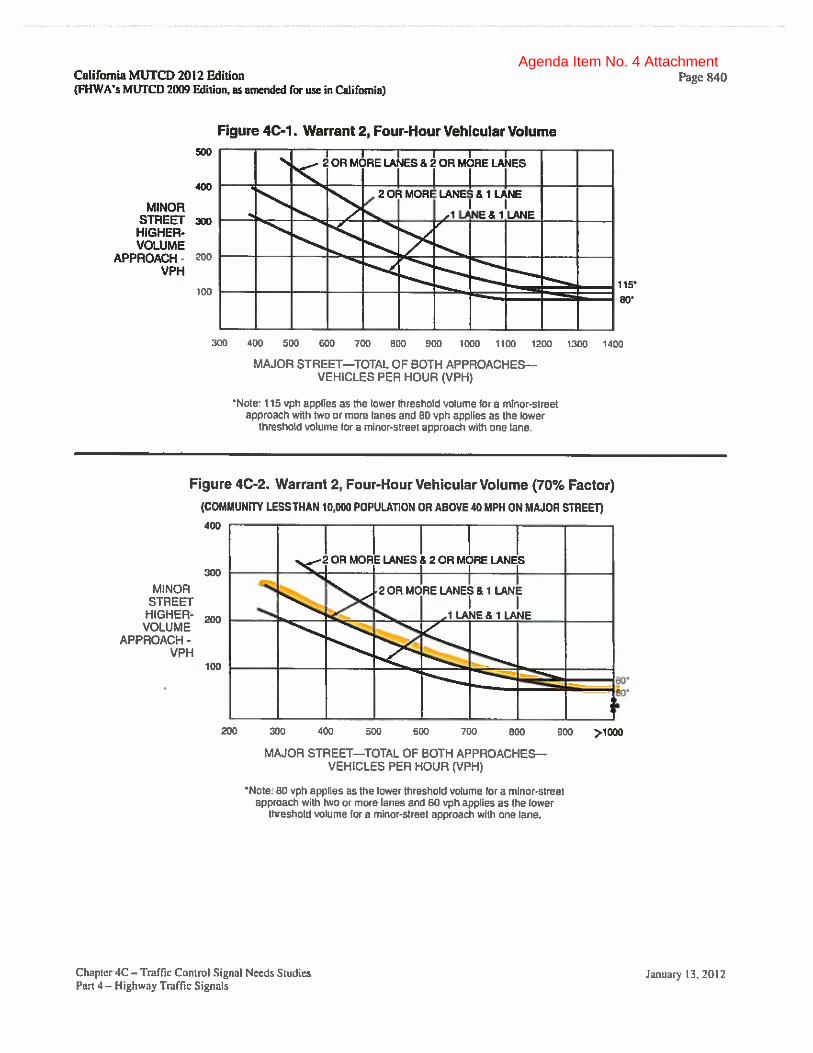
Agenda Item No. 4 Attachment

Agenda Item No. 4 Attachment

Agenda Item No. 4 Attachment

Agenda Item No. 4 Attachment

Agenda Item No. 4 Attachment

Agenda Item No. 4 Attachment

Agenda Item No. 4 Attachment

Agenda Item No. 4 Attachment
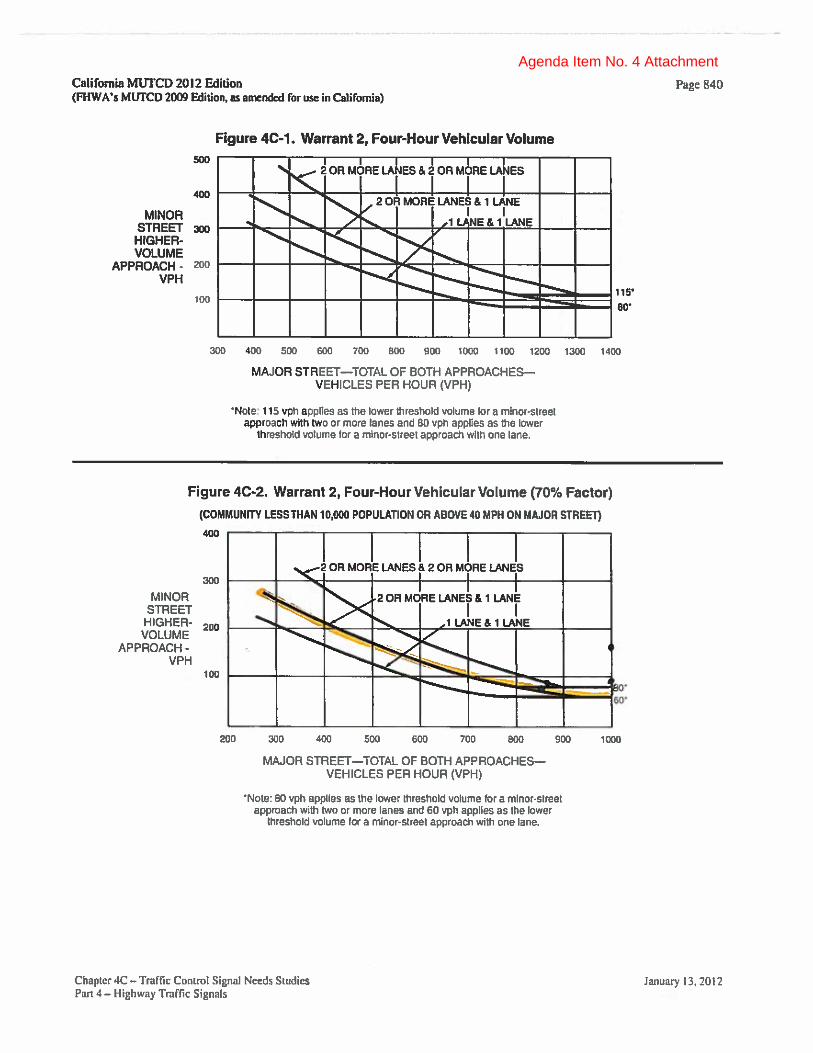
Agenda Item No. 4 Attachment

Agenda Item No. 4 Attachment
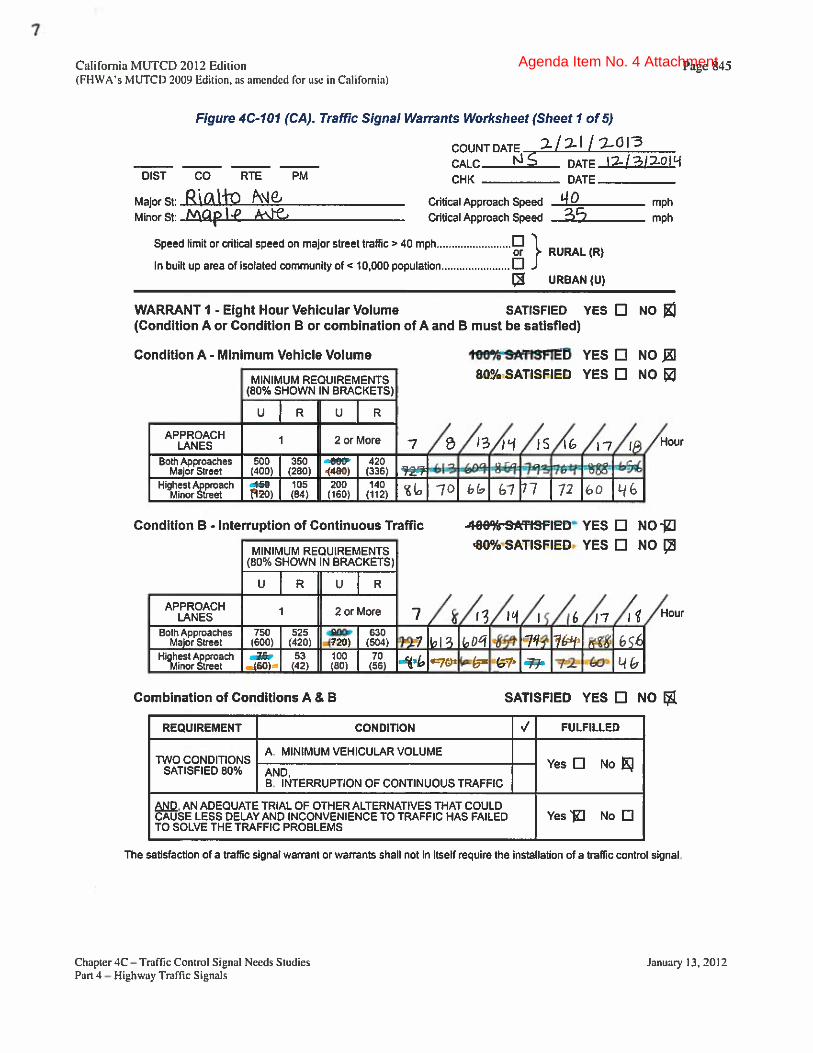
Agenda Item No. 4 Attachment
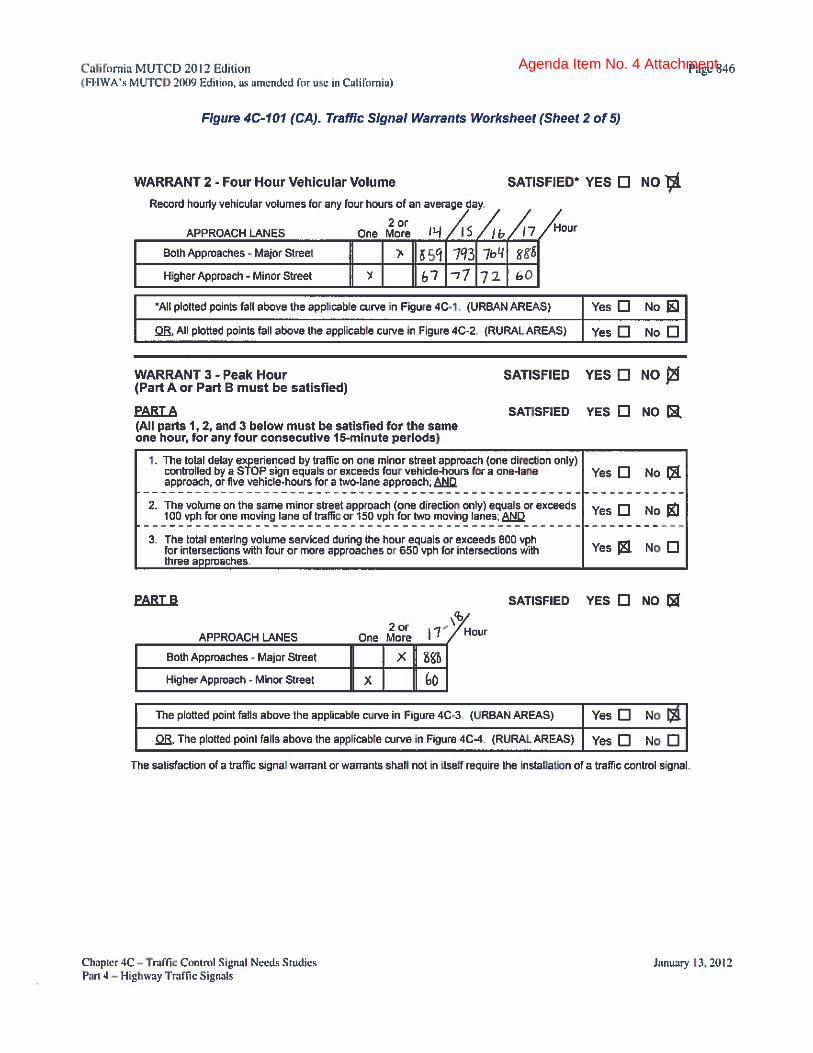
Agenda Item No. 4 Attachment

Agenda Item No. 4 Attachment

Agenda Item No. 4 Attachment

Agenda Item No. 4 Attachment

Agenda Item No. 4 Attachment

Agenda Item No. 4 Attachment

Agenda Item No. 4 Attachment
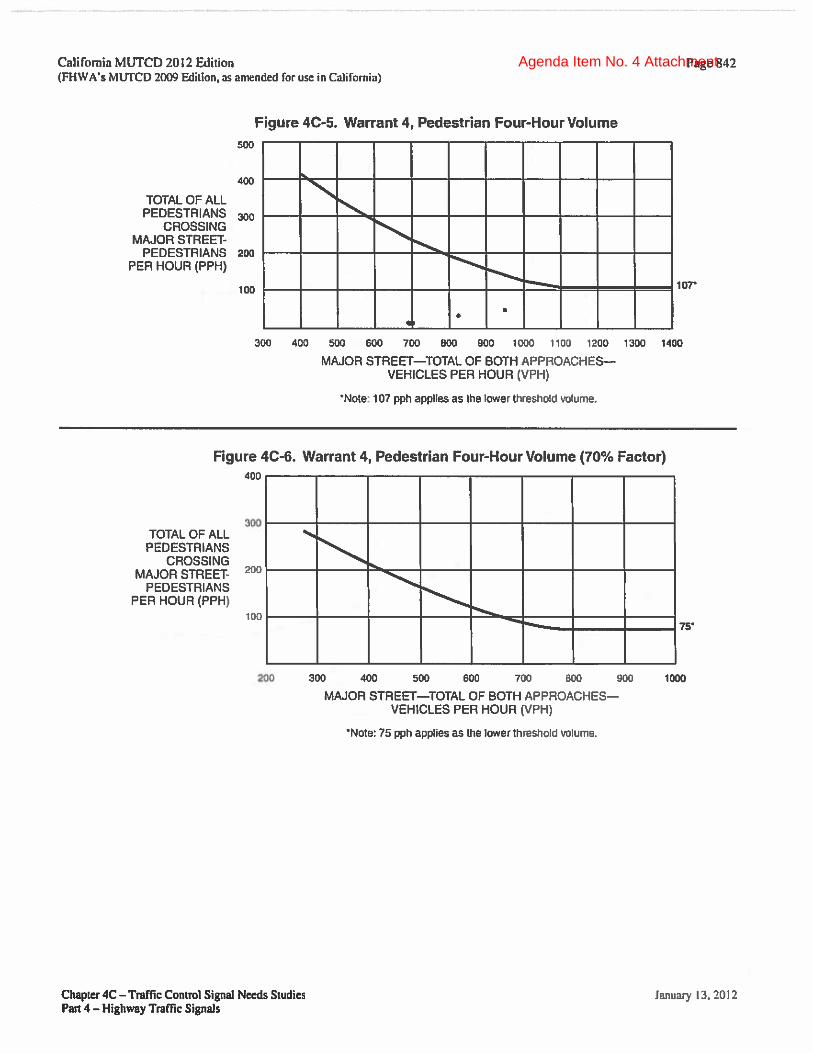
Agenda Item No. 4 Attachment
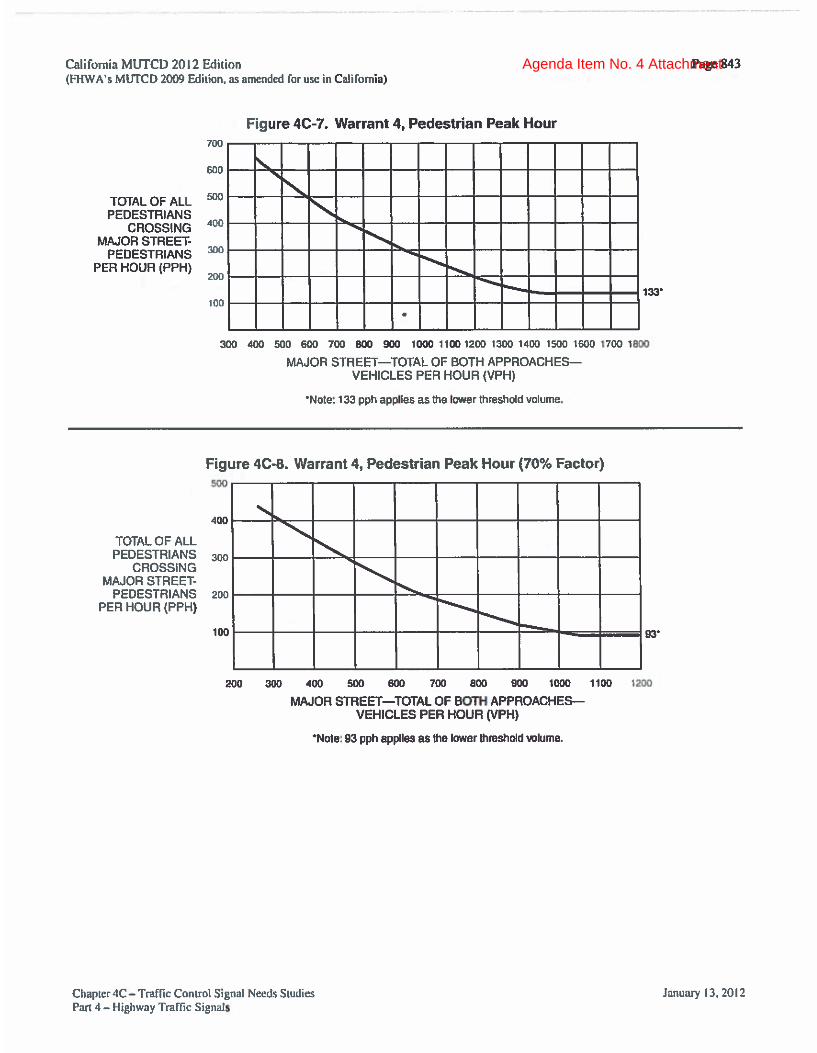
Agenda Item No. 4 Attachment

Agenda Item No. 4 Attachment
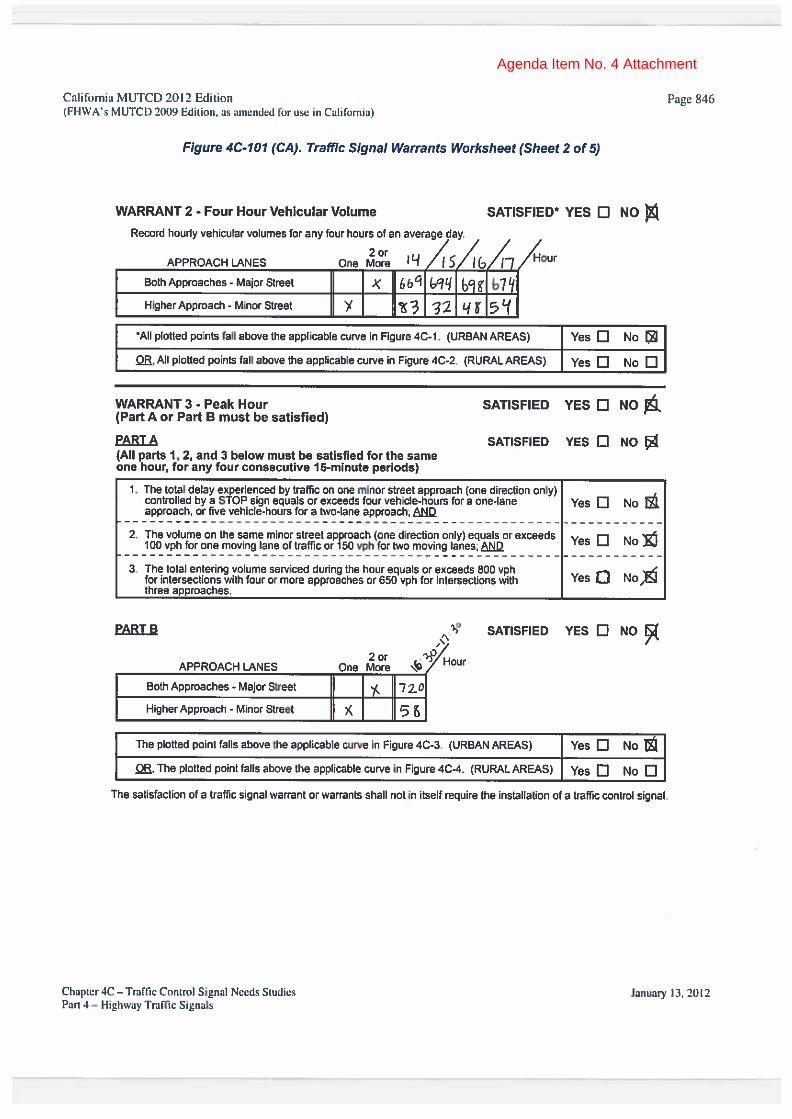
Agenda Item No. 4 Attachment

Agenda Item No. 4 Attachment

Agenda Item No. 4 Attachment
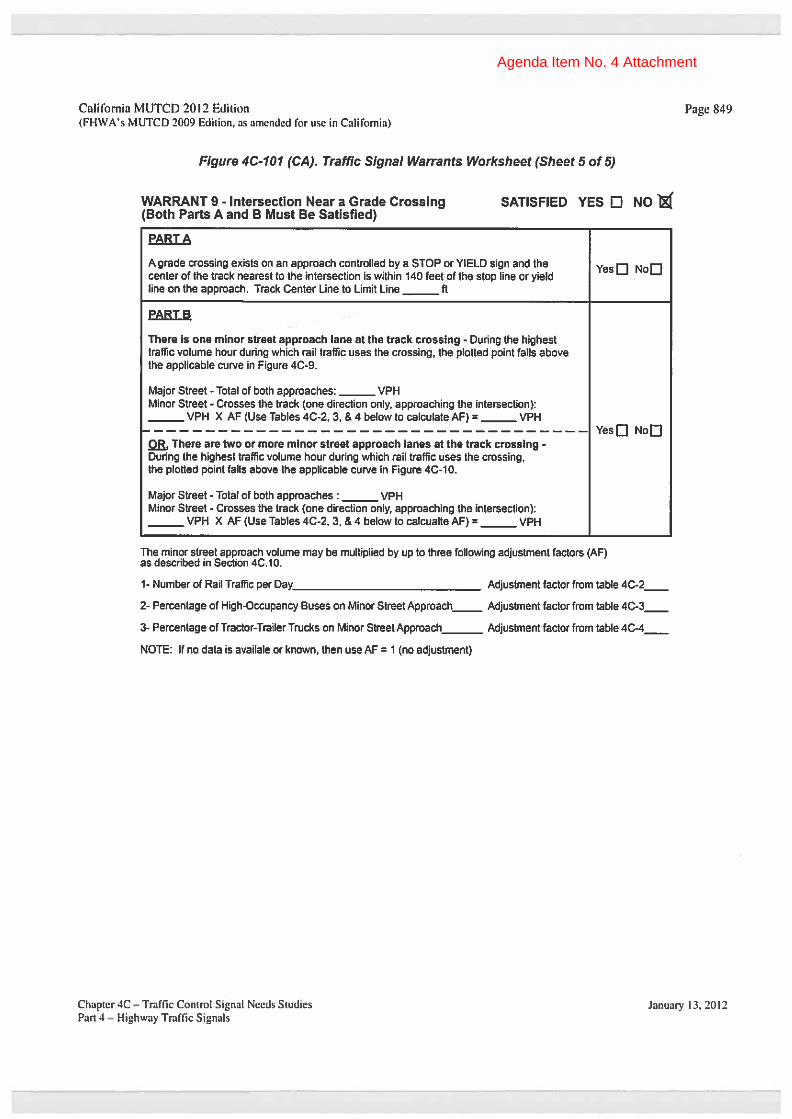
Agenda Item No. 4 Attachment

Agenda Item No. 4 Attachment
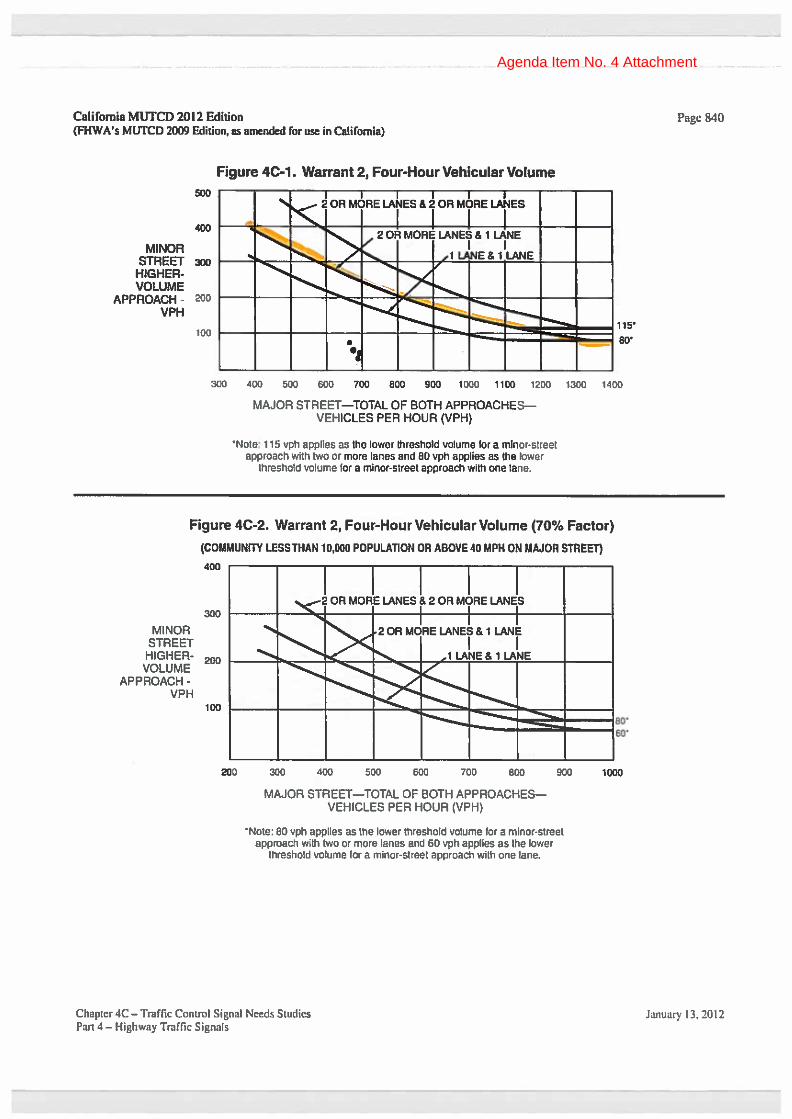
Agenda Item No. 4 Attachment

Agenda Item No. 4 Attachment
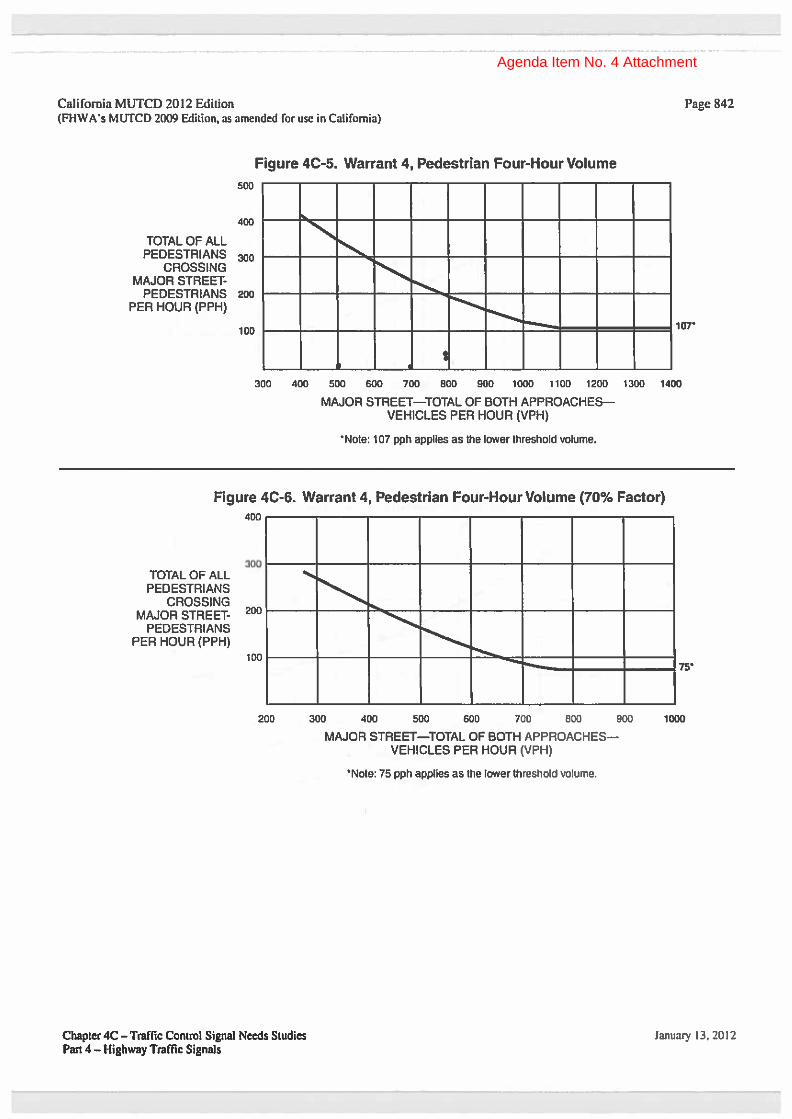
Agenda Item No. 4 Attachment

Agenda Item No. 4 Attachment

Agenda Item No. 4 Attachment

Agenda Item No. 4 Attachment

Agenda Item No. 4 Attachment

Agenda Item No. 4 Attachment

Agenda Item No. 4 Attachment

Agenda Item No. 4 Attachment
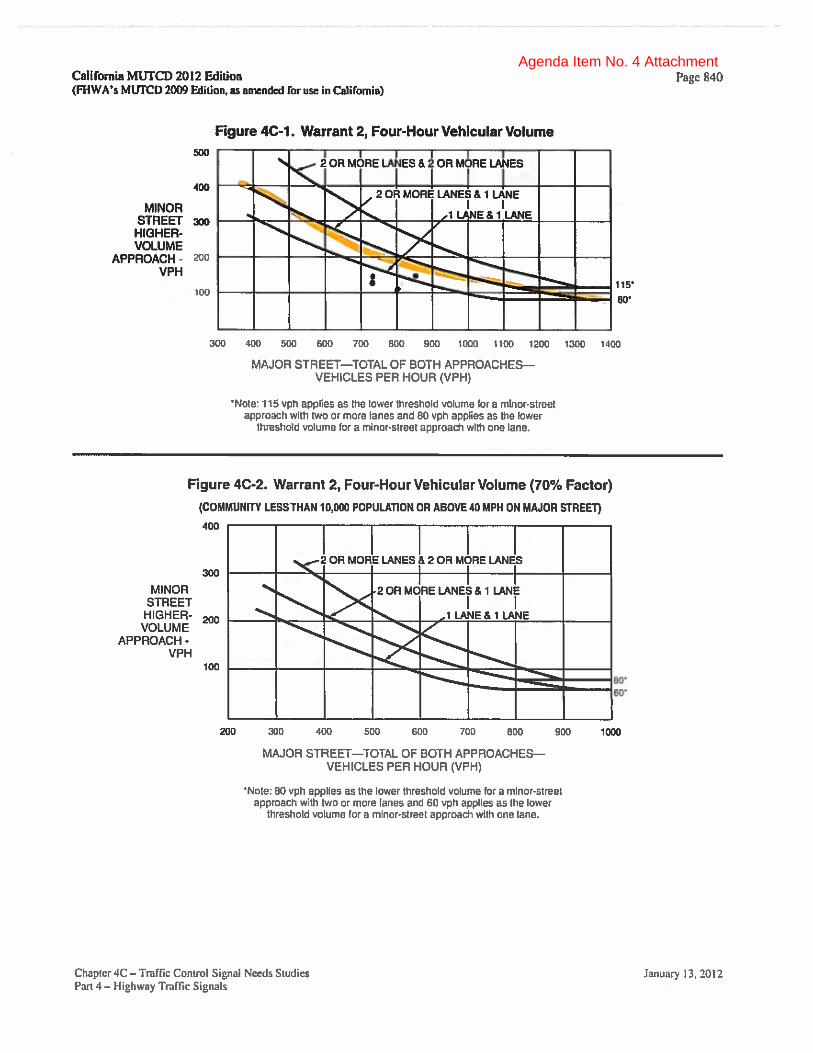
Agenda Item No. 4 Attachment

Agenda Item No. 4 Attachment

Agenda Item No. 4 Attachment

Agenda Item No. 4 Attachment

Agenda Item No. 4 Attachment

Agenda Item No. 4 Attachment
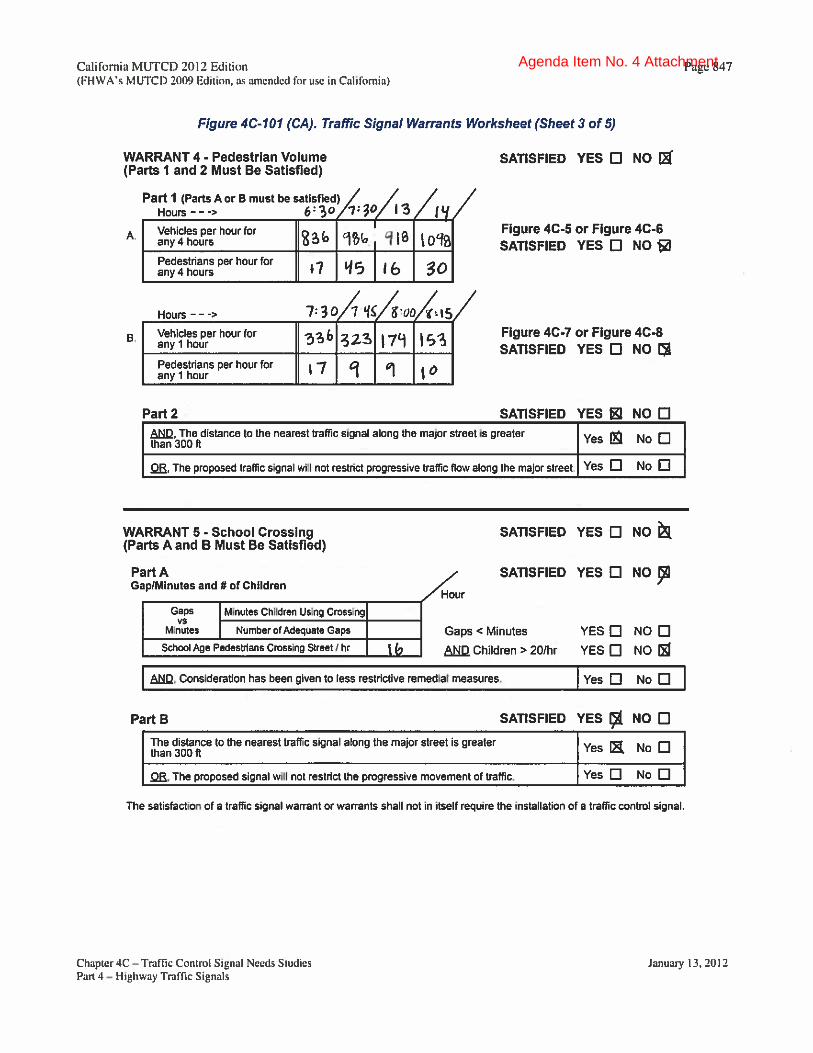
Agenda Item No. 4 Attachment

Agenda Item No. 4 Attachment

Agenda Item No. 4 Attachment

Agenda Item No. 4 Attachment

Agenda Item No. 4 Attachment

Agenda Item No. 4 Attachment

Agenda Item No. 4 Attachment

Agenda Item No. 4 Attachment

Agenda Item No. 4 Attachment

Agenda Item No. 4 Attachment

Agenda Item No. 4 Attachment
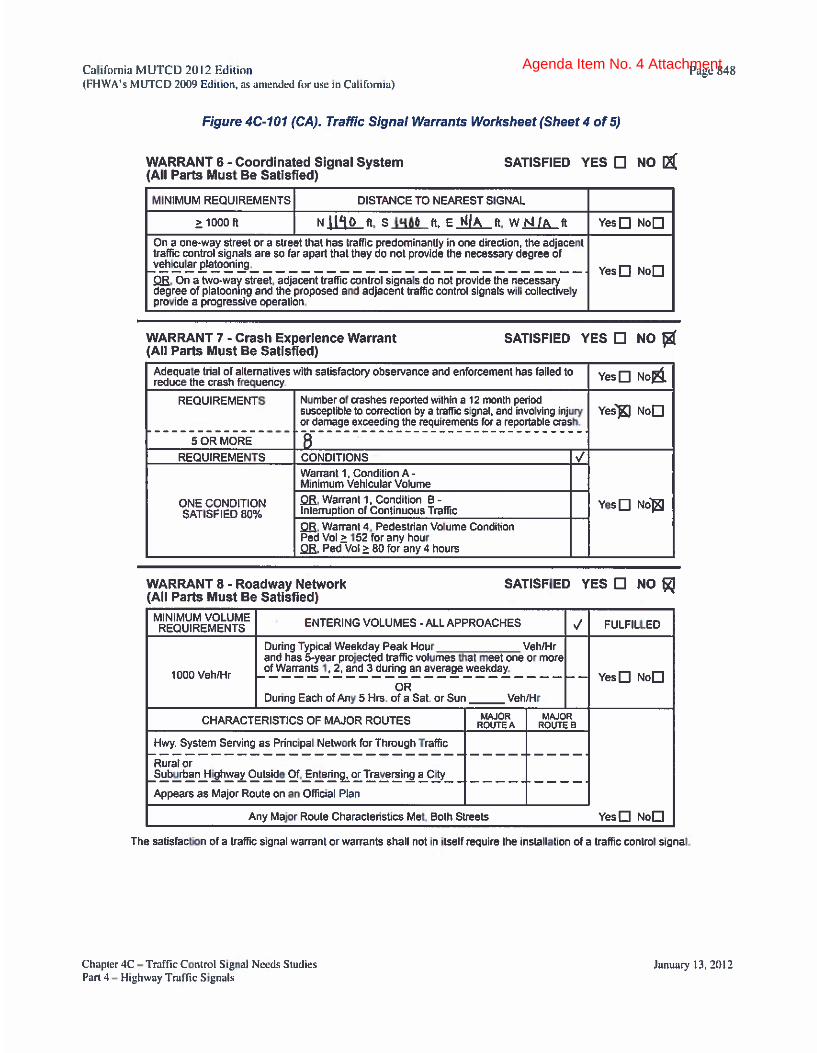
Agenda Item No. 4 Attachment

Agenda Item No. 4 Attachment

Agenda Item No. 4 Attachment
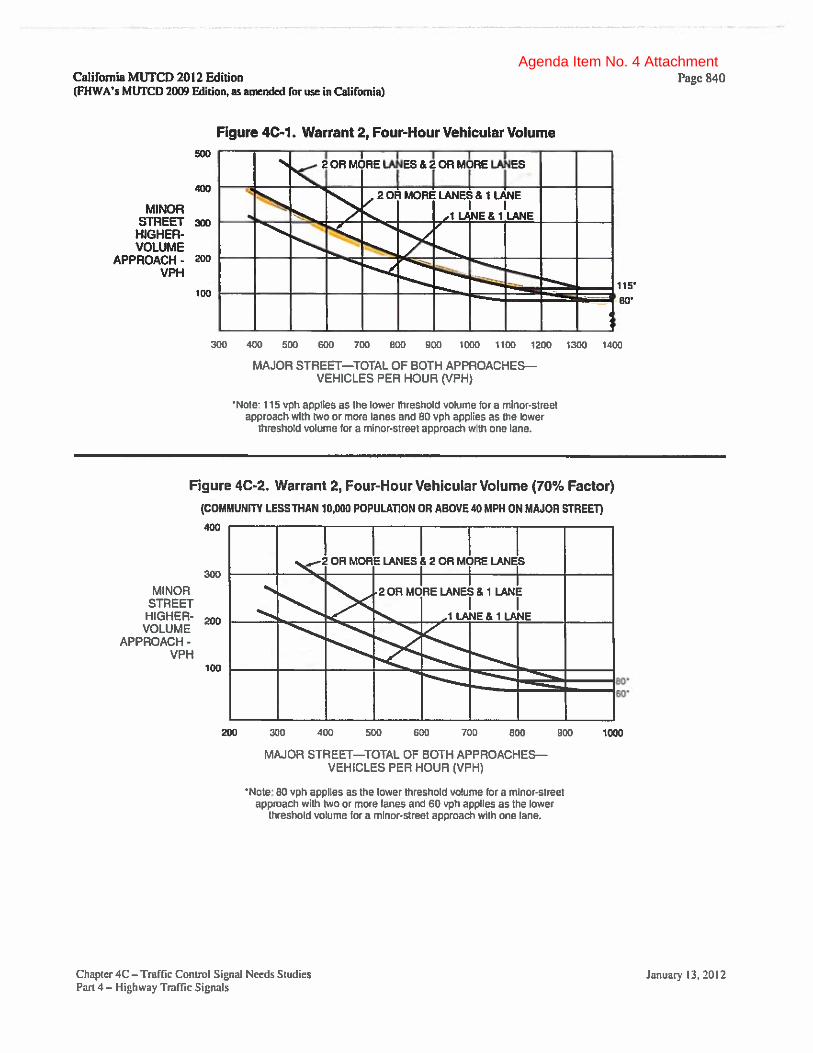
Agenda Item No. 4 Attachment

Agenda Item No. 4 Attachment
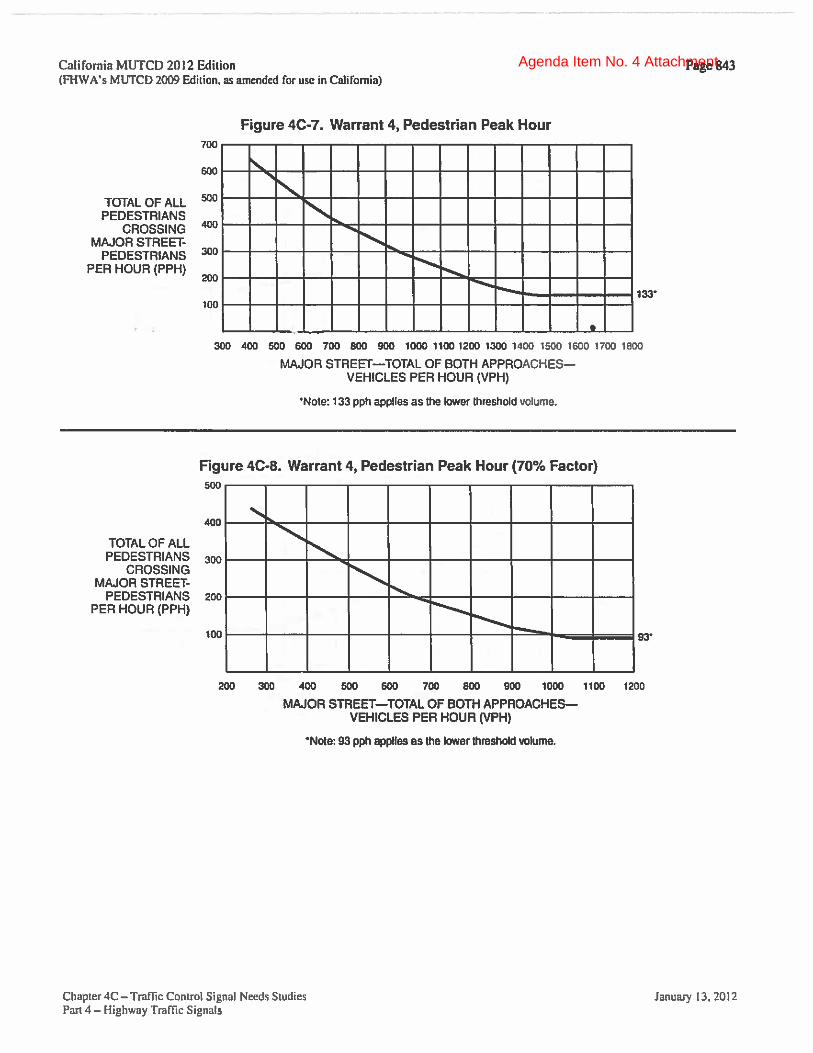
Agenda Item No. 4 Attachment

Agenda Item No. 4 Attachment

Agenda Item No. 4 Attachment
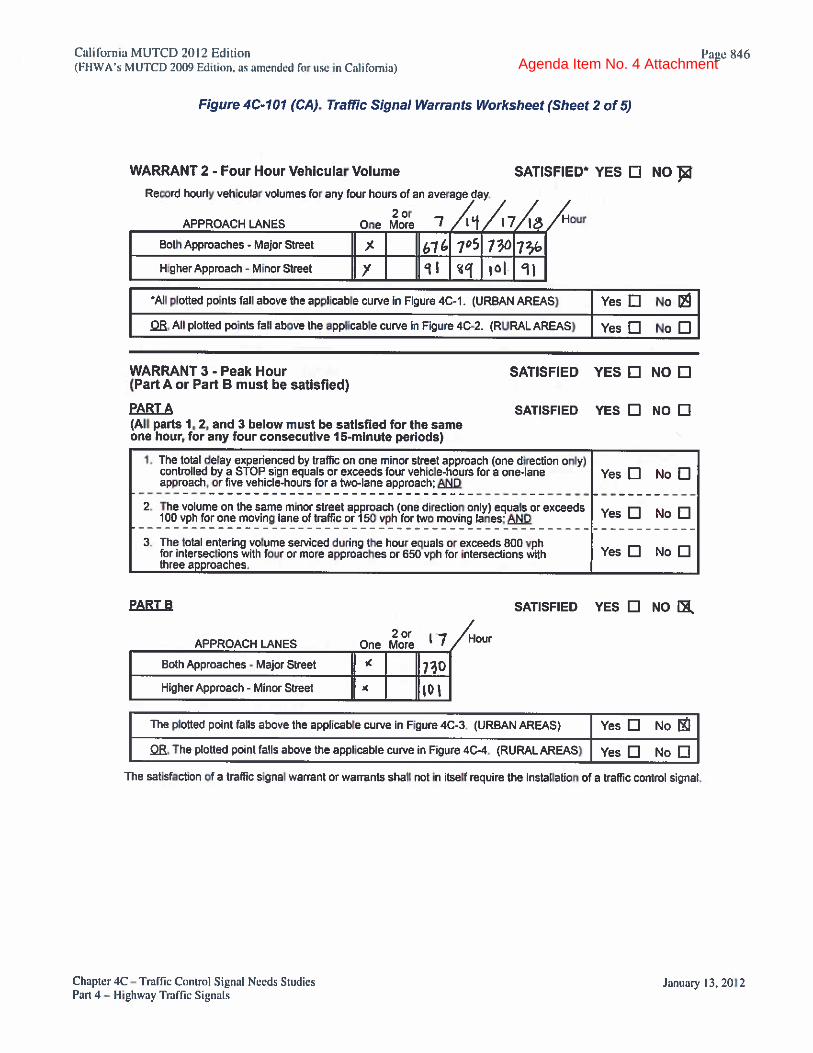
Agenda Item No. 4 Attachment

Agenda Item No. 4 Attachment
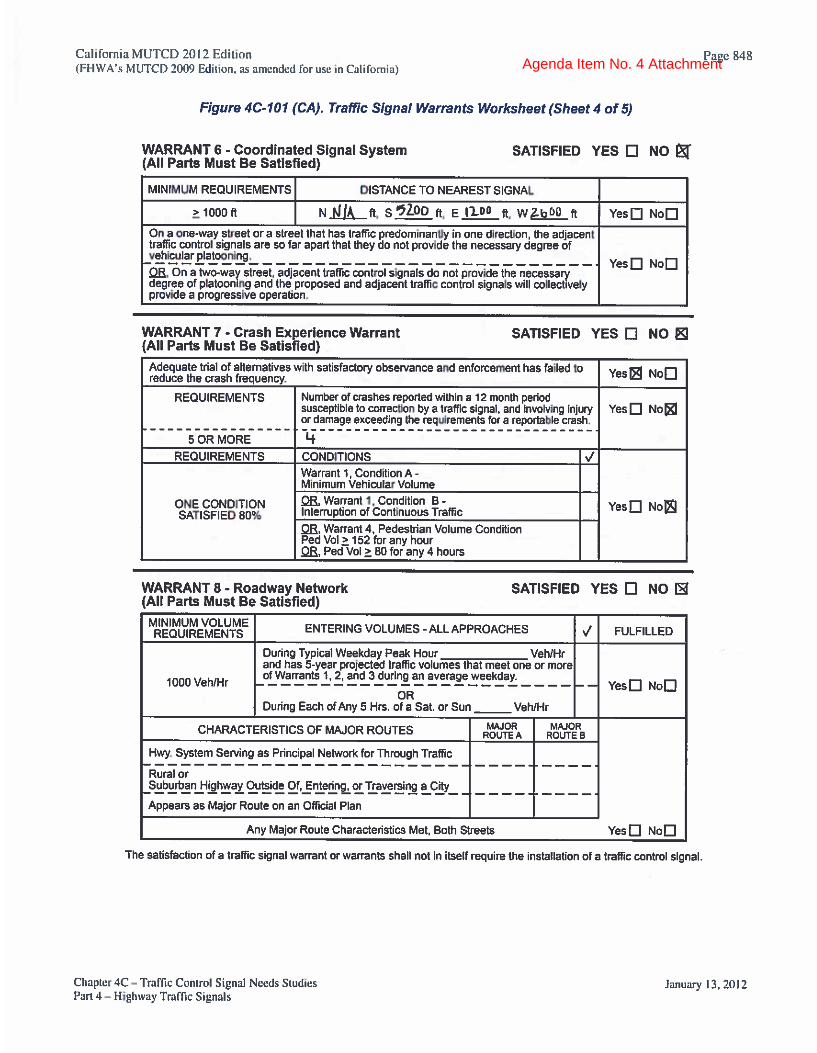
Agenda Item No. 4 Attachment

Agenda Item No. 4 Attachment

Agenda Item No. 4 Attachment

California MUTCD 2014 Edition Page 836 (FHWA’s MUTCD 2009 Edition, including Revisions 1 & 2, as amended for use in California)
Chapter 4C – Traffic Control Signal Needs Studies November 7, 2014
Part 4 – Highway Traffic Signals
_____________________________________________________________________________________
Agenda Item No. 4 Attachment

California MUTCD 2014 Edition Page 837 (FHWA’s MUTCD 2009 Edition, including Revisions 1 & 2, as amended for use in California)
Chapter 4C – Traffic Control Signal Needs Studies November 7, 2014
Part 4 – Highway Traffic Signals
_____________________________________________________________________________________
Agenda Item No. 4 Attachment
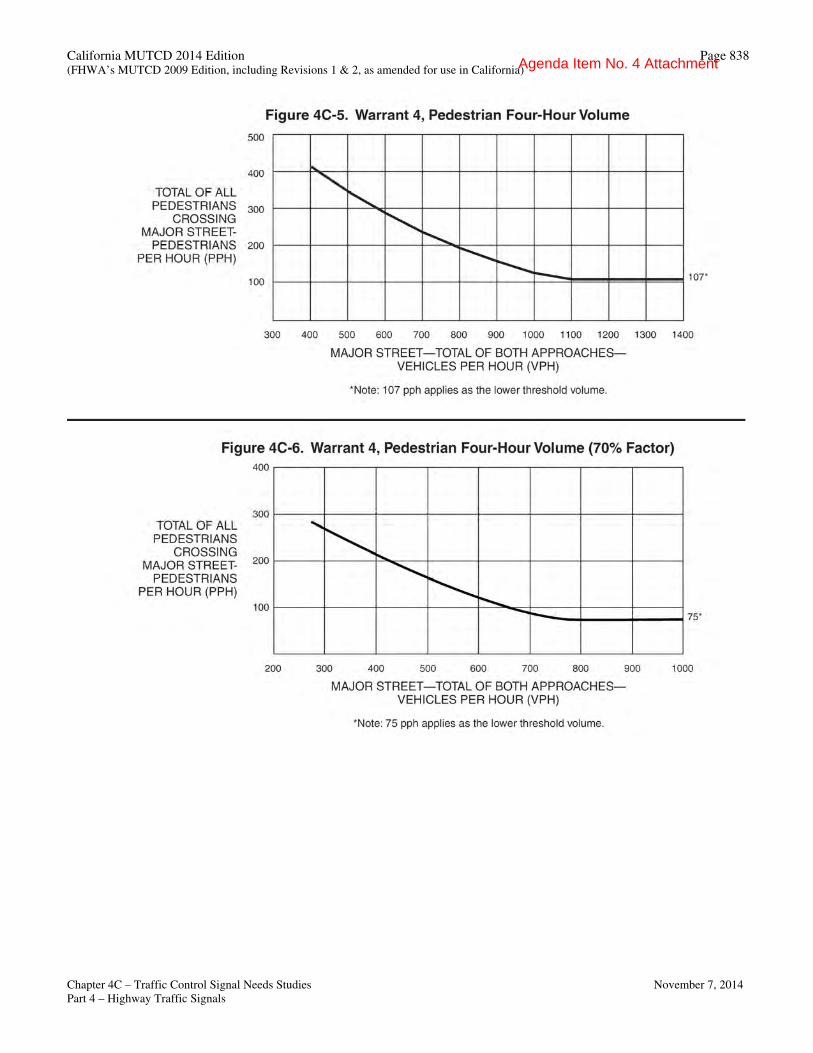
California MUTCD 2014 Edition Page 838 (FHWA’s MUTCD 2009 Edition, including Revisions 1 & 2, as amended for use in California)
Chapter 4C – Traffic Control Signal Needs Studies November 7, 2014
Part 4 – Highway Traffic Signals
_____________________________________________________________________________________
Agenda Item No. 4 Attachment
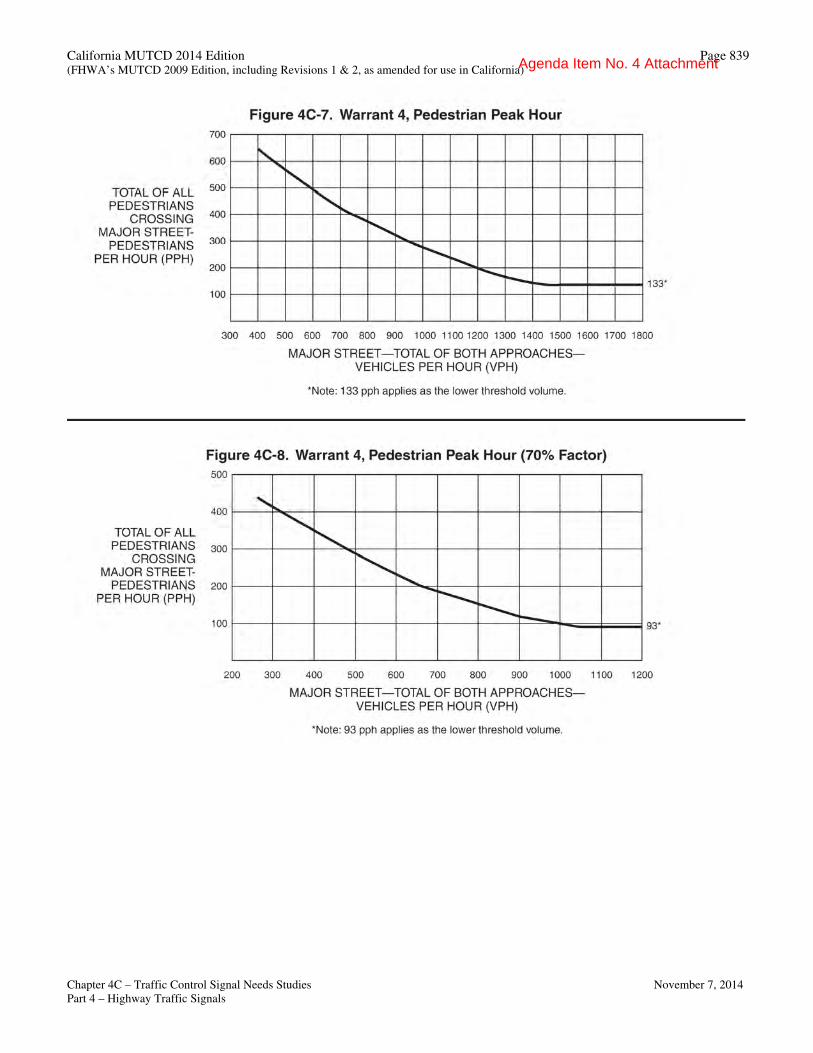
California MUTCD 2014 Edition Page 839 (FHWA’s MUTCD 2009 Edition, including Revisions 1 & 2, as amended for use in California)
Chapter 4C – Traffic Control Signal Needs Studies November 7, 2014
Part 4 – Highway Traffic Signals
_____________________________________________________________________________________
Agenda Item No. 4 Attachment

California MUTCD 2014 Edition Page 840 (FHWA’s MUTCD 2009 Edition, including Revisions 1 & 2, as amended for use in California)
Chapter 4C – Traffic Control Signal Needs Studies November 7, 2014
Part 4 – Highway Traffic Signals
_____________________________________________________________________________________
Agenda Item No. 4 Attachment

California MUTCD 2014 Edition Page 841 (FHWA’s MUTCD 2009 Edition, including Revisions 1 & 2, as amended for use in California)
Chapter 4C – Traffic Control Signal Needs Studies November 7, 2014
Part 4 – Highway Traffic Signals
2/25/2015
Baseline Rd 45
Fitzgerald Ave 35
✔
✔
✔
✔
7:00 14:00 15:00 16:00 17:00 18:00 19:00 20:00
907 1071 1047 1094 1266 1064 690 571
141 194 190 203 205 176 148 146
✔
✔
7:00 14:00 15:00 16:00 17:00 18:00 19:00 20:00
907 1071 1047 1094 1266 1064 690 571
141 194 190 203 205 176 148 146
✔
✔
✔
✔
Agenda Item No. 4 Attachment

California MUTCD 2014 Edition Page 842 (FHWA’s MUTCD 2009 Edition, including Revisions 1 & 2, as amended for use in California)
Chapter 4C – Traffic Control Signal Needs Studies November 7, 2014
Part 4 – Highway Traffic Signals
✔
14:00 15:00 16:00 17:00
✔
✔
✔ 1071 1047 1094 1266
194 190 203 205
✔
✔
✔
✔
✔
✔
17:00
✔ 1266
205
Agenda Item No. 4 Attachment

California MUTCD 2014 Edition Page 843 (FHWA’s MUTCD 2009 Edition, including Revisions 1 & 2, as amended for use in California)
Chapter 4C – Traffic Control Signal Needs Studies November 7, 2014
Part 4 – Highway Traffic Signals
N/A
N/A
Agenda Item No. 4 Attachment

California MUTCD 2014 Edition Page 844 (FHWA’s MUTCD 2009 Edition, including Revisions 1 & 2, as amended for use in California)
Chapter 4C – Traffic Control Signal Needs Studies November 7, 2014
Part 4 – Highway Traffic Signals
✔
- - 3000 930 ✔
✔
✔
✔
✔
2
✔
✔
Agenda Item No. 4 Attachment
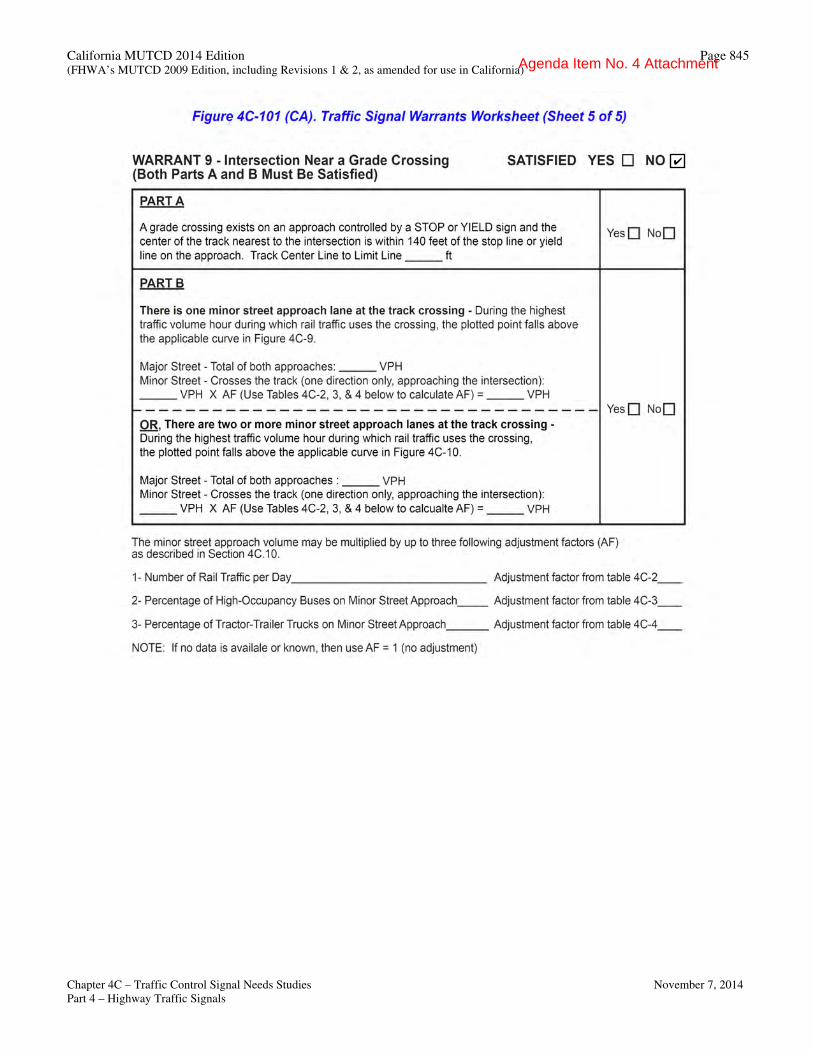
California MUTCD 2014 Edition Page 845 (FHWA’s MUTCD 2009 Edition, including Revisions 1 & 2, as amended for use in California)
Chapter 4C – Traffic Control Signal Needs Studies November 7, 2014
Part 4 – Highway Traffic Signals
✔
Agenda Item No. 4 Attachment

California MUTCD 2014 Edition Page 836 (FHWA’s MUTCD 2009 Edition, including Revisions 1 & 2, as amended for use in California)
Chapter 4C – Traffic Control Signal Needs Studies November 7, 2014
Part 4 – Highway Traffic Signals
_____________________________________________________________________________________
Agenda Item No. 4 Attachment

California MUTCD 2014 Edition Page 837 (FHWA’s MUTCD 2009 Edition, including Revisions 1 & 2, as amended for use in California)
Chapter 4C – Traffic Control Signal Needs Studies November 7, 2014
Part 4 – Highway Traffic Signals
_____________________________________________________________________________________
Agenda Item No. 4 Attachment

California MUTCD 2014 Edition Page 838 (FHWA’s MUTCD 2009 Edition, including Revisions 1 & 2, as amended for use in California)
Chapter 4C – Traffic Control Signal Needs Studies November 7, 2014
Part 4 – Highway Traffic Signals
_____________________________________________________________________________________
Agenda Item No. 4 Attachment

California MUTCD 2014 Edition Page 839 (FHWA’s MUTCD 2009 Edition, including Revisions 1 & 2, as amended for use in California)
Chapter 4C – Traffic Control Signal Needs Studies November 7, 2014
Part 4 – Highway Traffic Signals
_____________________________________________________________________________________
Agenda Item No. 4 Attachment

California MUTCD 2014 Edition Page 840 (FHWA’s MUTCD 2009 Edition, including Revisions 1 & 2, as amended for use in California)
Chapter 4C – Traffic Control Signal Needs Studies November 7, 2014
Part 4 – Highway Traffic Signals
_____________________________________________________________________________________
Agenda Item No. 4 Attachment

California MUTCD 2014 Edition Page 841 (FHWA’s MUTCD 2009 Edition, including Revisions 1 & 2, as amended for use in California)
Chapter 4C – Traffic Control Signal Needs Studies November 7, 2014
Part 4 – Highway Traffic Signals
2/25/2015
Baseline Rd 45
Fitzgerald Ave 35
✔
✔
✔
✔
7:00 14:00 15:00 16:00 17:00 18:00 19:00 20:00
907 1071 1047 1094 1266 1064 690 571
141 194 190 203 205 176 148 146
✔
✔
7:00 14:00 15:00 16:00 17:00 18:00 19:00 20:00
907 1071 1047 1094 1266 1064 690 571
141 194 190 203 205 176 148 146
✔
✔
✔
✔
Agenda Item No. 4 Attachment

California MUTCD 2014 Edition Page 842 (FHWA’s MUTCD 2009 Edition, including Revisions 1 & 2, as amended for use in California)
Chapter 4C – Traffic Control Signal Needs Studies November 7, 2014
Part 4 – Highway Traffic Signals
✔
14:0015:0016:0017:00
✔
✔
✔ 1071 1047 1094 1266
194 190 203 205
✔
✔
✔
✔
✔
✔
17:00
✔ 1266
205
Agenda Item No. 4 Attachment
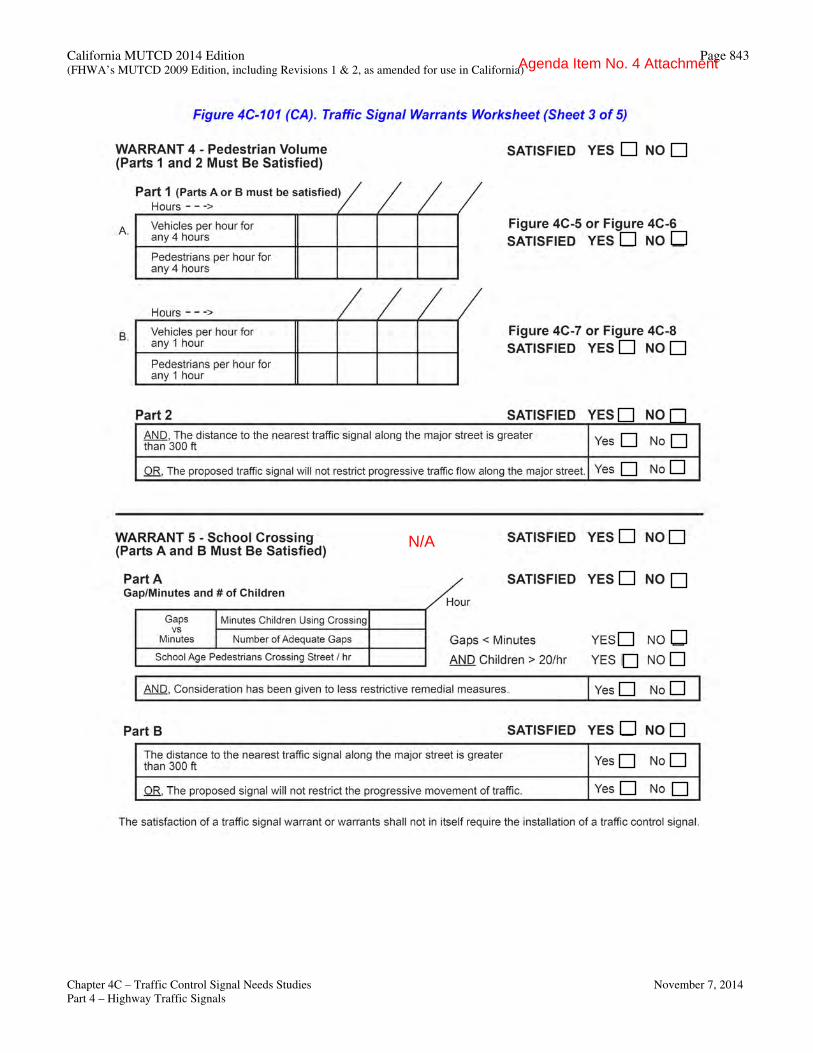
California MUTCD 2014 Edition Page 843 (FHWA’s MUTCD 2009 Edition, including Revisions 1 & 2, as amended for use in California)
Chapter 4C – Traffic Control Signal Needs Studies November 7, 2014
Part 4 – Highway Traffic Signals
N/A
Agenda Item No. 4 Attachment

California MUTCD 2014 Edition Page 844 (FHWA’s MUTCD 2009 Edition, including Revisions 1 & 2, as amended for use in California)
Chapter 4C – Traffic Control Signal Needs Studies November 7, 2014
Part 4 – Highway Traffic Signals
✔
- - 3000 930 ✔
✔
✔
✔
✔
2
✔
✔
Agenda Item No. 4 Attachment

California MUTCD 2014 Edition Page 845 (FHWA’s MUTCD 2009 Edition, including Revisions 1 & 2, as amended for use in California)
Chapter 4C – Traffic Control Signal Needs Studies November 7, 2014
Part 4 – Highway Traffic Signals
✔
Agenda Item No. 4 Attachment
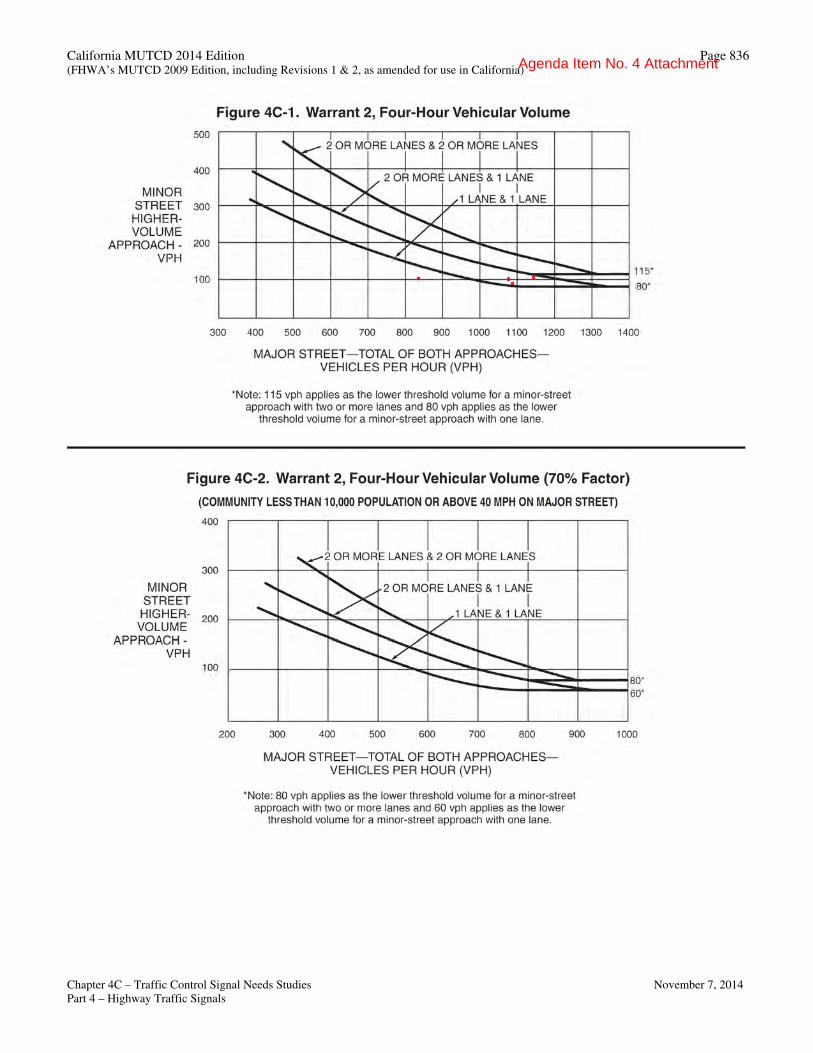
California MUTCD 2014 Edition Page 836 (FHWA’s MUTCD 2009 Edition, including Revisions 1 & 2, as amended for use in California)
Chapter 4C – Traffic Control Signal Needs Studies November 7, 2014
Part 4 – Highway Traffic Signals
_____________________________________________________________________________________
Agenda Item No. 4 Attachment
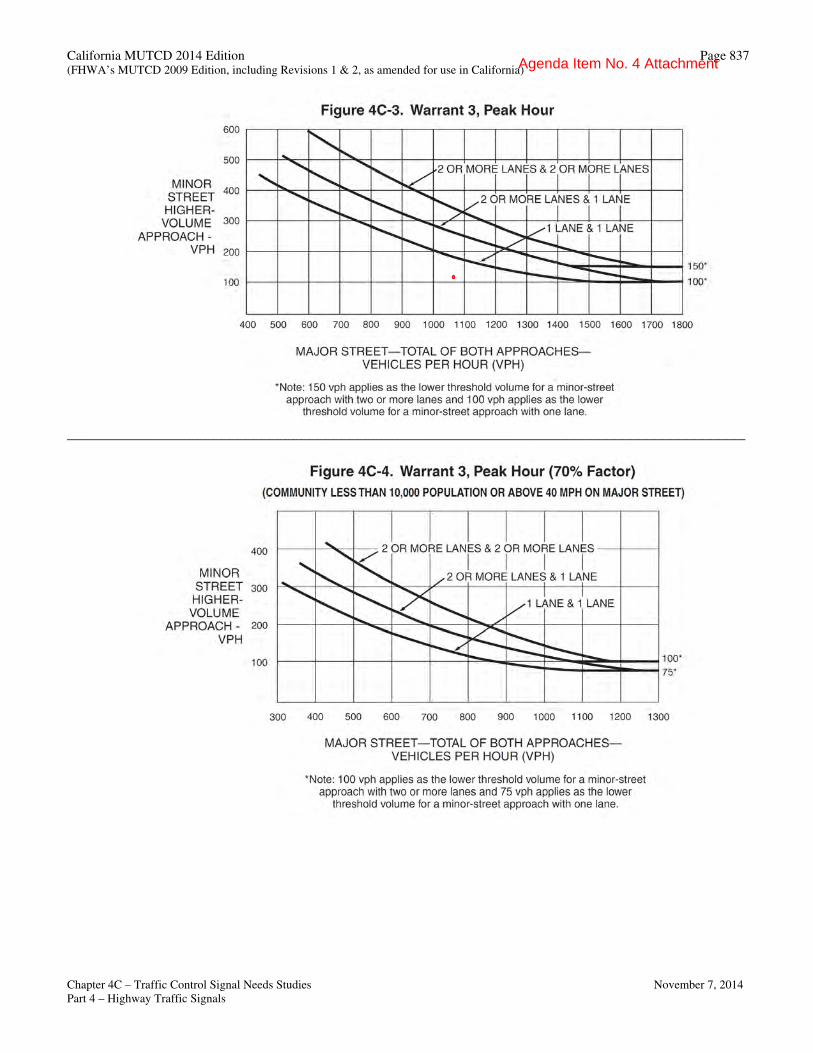
California MUTCD 2014 Edition Page 837 (FHWA’s MUTCD 2009 Edition, including Revisions 1 & 2, as amended for use in California)
Chapter 4C – Traffic Control Signal Needs Studies November 7, 2014
Part 4 – Highway Traffic Signals
_____________________________________________________________________________________
Agenda Item No. 4 Attachment

California MUTCD 2014 Edition Page 838 (FHWA’s MUTCD 2009 Edition, including Revisions 1 & 2, as amended for use in California)
Chapter 4C – Traffic Control Signal Needs Studies November 7, 2014
Part 4 – Highway Traffic Signals
_____________________________________________________________________________________
Agenda Item No. 4 Attachment

California MUTCD 2014 Edition Page 839 (FHWA’s MUTCD 2009 Edition, including Revisions 1 & 2, as amended for use in California)
Chapter 4C – Traffic Control Signal Needs Studies November 7, 2014
Part 4 – Highway Traffic Signals
_____________________________________________________________________________________
Agenda Item No. 4 Attachment
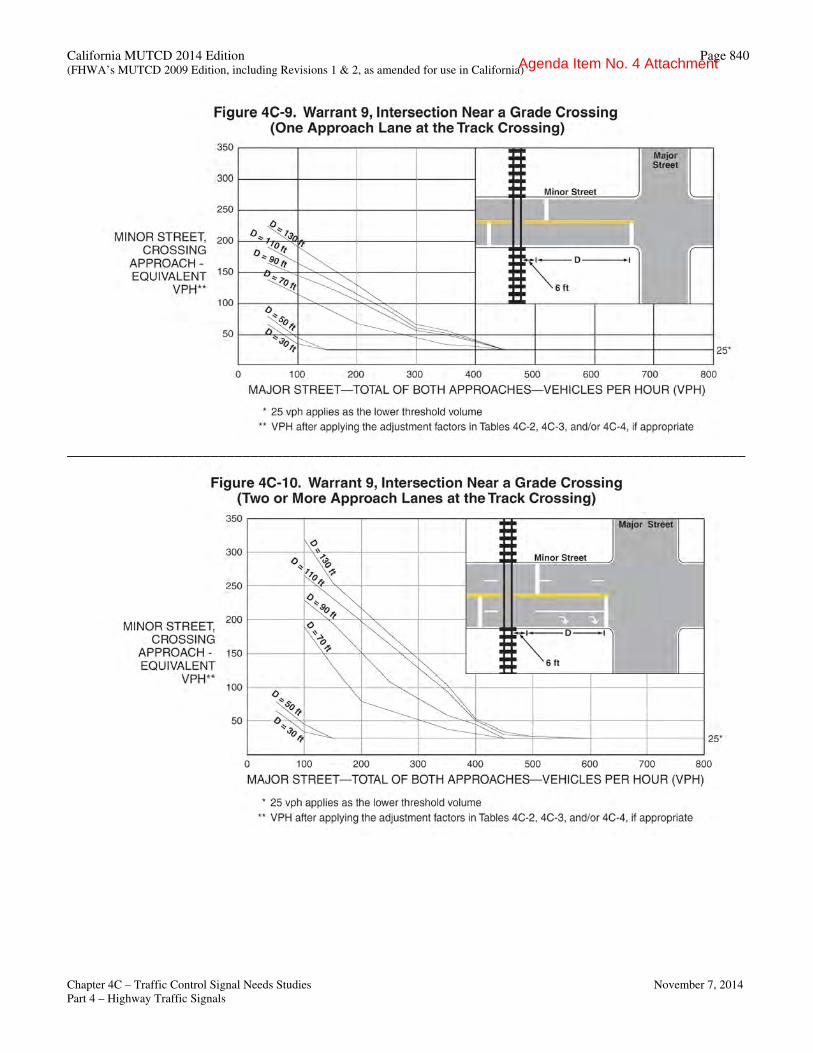
California MUTCD 2014 Edition Page 840 (FHWA’s MUTCD 2009 Edition, including Revisions 1 & 2, as amended for use in California)
Chapter 4C – Traffic Control Signal Needs Studies November 7, 2014
Part 4 – Highway Traffic Signals
_____________________________________________________________________________________
Agenda Item No. 4 Attachment

California MUTCD 2014 Edition Page 841 (FHWA’s MUTCD 2009 Edition, including Revisions 1 & 2, as amended for use in California)
Chapter 4C – Traffic Control Signal Needs Studies November 7, 2014
Part 4 – Highway Traffic Signals
2/25/2015
Baseline Rd 45
Fitzgerald Ave 35
✔
✔
✔
✔
7:00 14:00 15:00 16:00 17:00 18:00 19:00 20:00
907 1071 1047 1094 1266 1064 690 571
141 194 190 203 205 176 148 146
✔
✔
7:00 14:00 15:00 16:00 17:00 18:00 19:00 20:00
907 1071 1047 1094 1266 1064 690 571
141 194 190 203 205 176 148 146
✔
✔
✔
✔
Agenda Item No. 4 Attachment
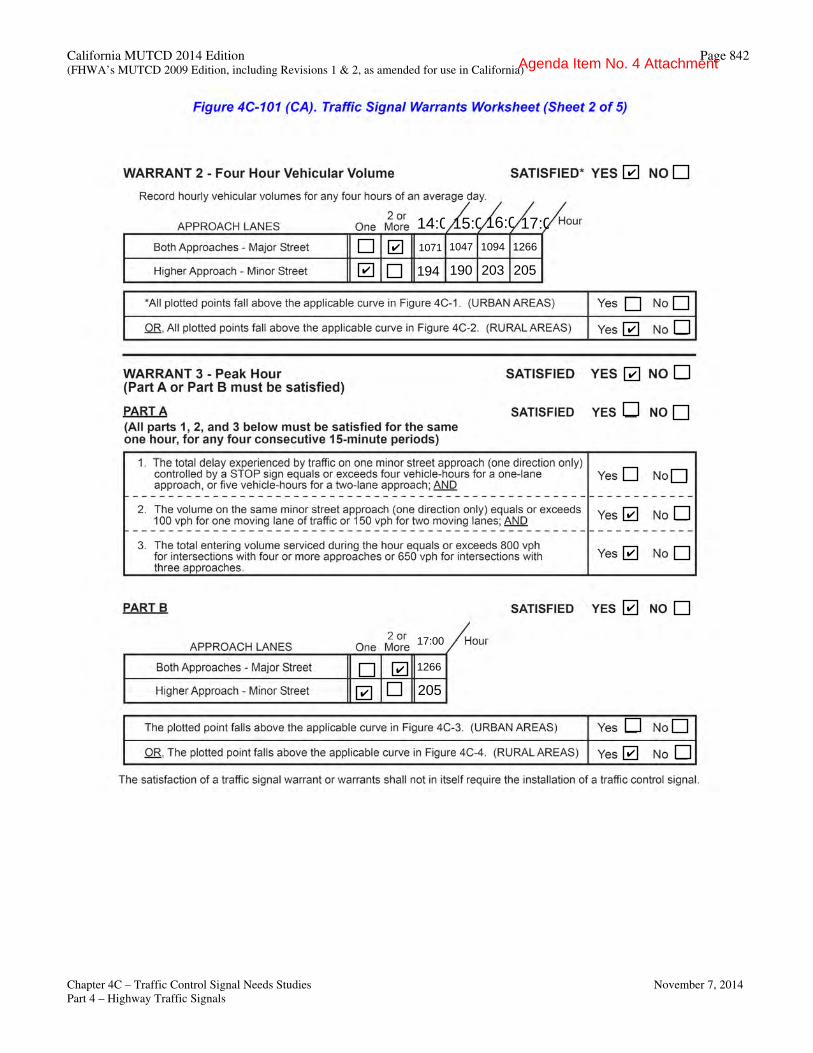
California MUTCD 2014 Edition Page 842 (FHWA’s MUTCD 2009 Edition, including Revisions 1 & 2, as amended for use in California)
Chapter 4C – Traffic Control Signal Needs Studies November 7, 2014
Part 4 – Highway Traffic Signals
✔
14:0015:0016:0017:00
✔
✔
✔ 1071 1047 1094 1266
194 190 203 205
✔
✔
✔
✔
✔
✔
17:00
✔ 1266
205
Agenda Item No. 4 Attachment
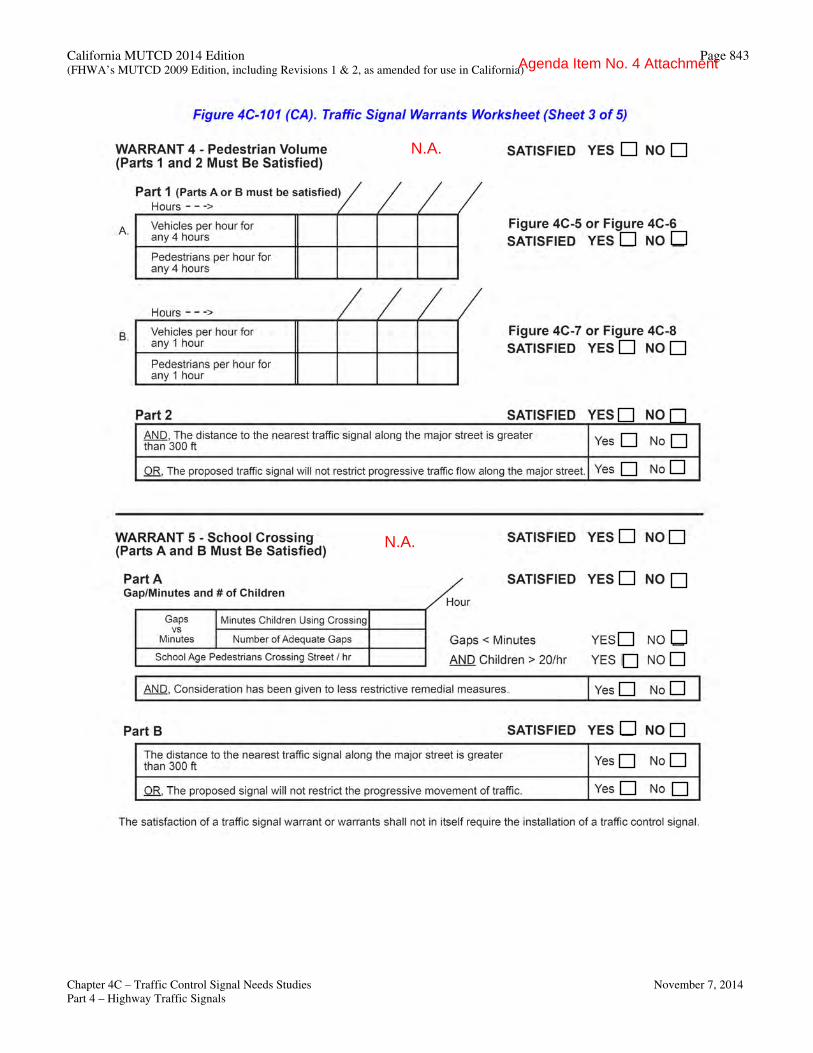
California MUTCD 2014 Edition Page 843 (FHWA’s MUTCD 2009 Edition, including Revisions 1 & 2, as amended for use in California)
Chapter 4C – Traffic Control Signal Needs Studies November 7, 2014
Part 4 – Highway Traffic Signals
N.A.
N.A.
Agenda Item No. 4 Attachment
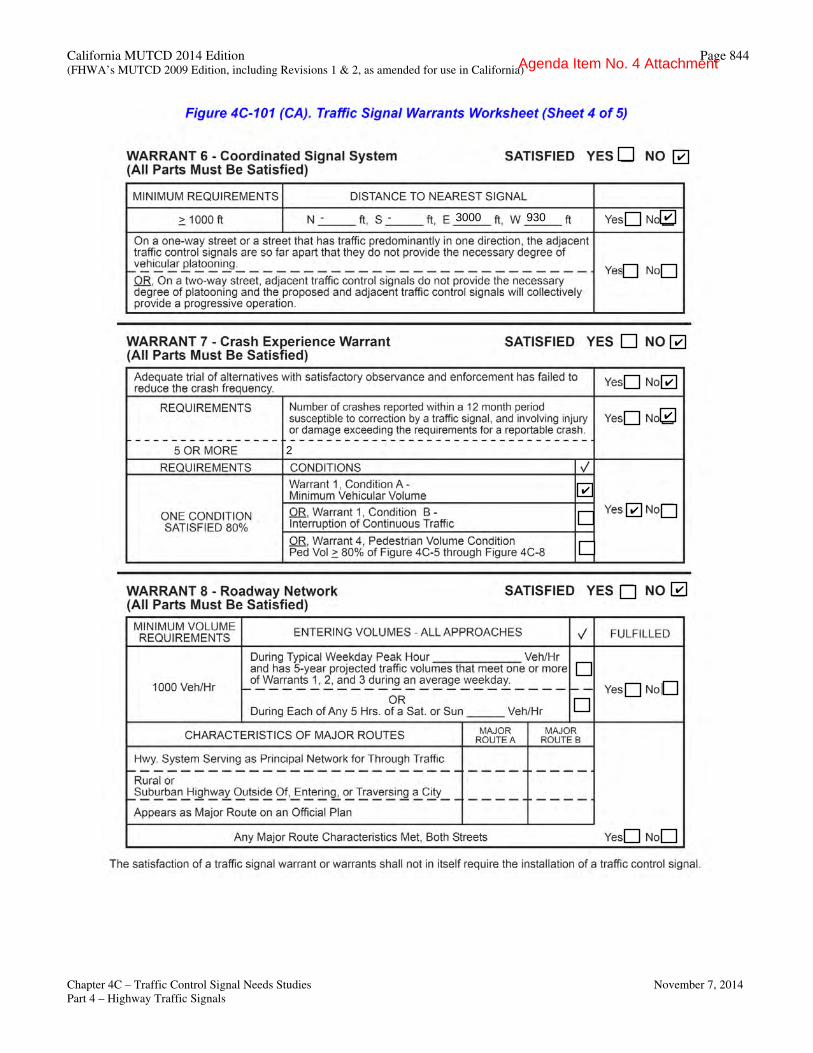
California MUTCD 2014 Edition Page 844 (FHWA’s MUTCD 2009 Edition, including Revisions 1 & 2, as amended for use in California)
Chapter 4C – Traffic Control Signal Needs Studies November 7, 2014
Part 4 – Highway Traffic Signals
✔
- - 3000 930 ✔
✔
✔
✔
✔
2
✔
✔
Agenda Item No. 4 Attachment

California MUTCD 2014 Edition Page 845 (FHWA’s MUTCD 2009 Edition, including Revisions 1 & 2, as amended for use in California)
Chapter 4C – Traffic Control Signal Needs Studies November 7, 2014
Part 4 – Highway Traffic Signals
✔
Agenda Item No. 4 Attachment
Traffic Signal Prioritization Analysis City of Rialto
APPENDIX F
Traffic Signal Priority Rating System
Agenda Item No. 4 Attachment

Traffic Signal Priority Rating System
The priority rating system is developed to impartially rank all intersections considered for installation of traffic signals. This ranking will assist the decision makers to decide where the capital improvement funding would be best spent. The ranking system would document and run inventory of intersections qualified for traffic signal installation to be under surveillance periodically for significant changes.
The proposed rating system is an updated version of the past ranking system used by the City of Rialto since 2008.The proposed system will assign points to several elements contributing to the operation and safety of an intersection. The points are then totaled and the intersections are arranged by descending number of points to form a priority list.
The following elements were considered in developing the ranking system:
Interruption of Continuous Flow Traffic volume Speed Safety (numbers and severity)
Accident Rates Pedestrian School Miscellaneous
1) Interruption of Continuous Traffic ………………………………………… 10 Maximum Points
A traffic signal can be helpful if there is an interruption of continuous traffic by high volumes on both streets in the intersection. If the minor volume street has less than a total of 300 vehicles in the peak 4 hours, zero points are assigned. If the minor street has over 300 vehicles in the highest 4 hours, one point is assigned beginning at 1950 vehicles on the high volume street and one point for each additional 300 vehicles in the highest 4-hour period.
2) Traffic Volume ……………………….……………………………………….10 Maximum Points
Traffic volume is a measure of congestion; the volume considered is the total volume entering the intersection in the highest 4 peak hours. The following rating was assigned for total entering volume at each intersection:
0 to 1,999 = 2 point 2000 to 2999 = 4 points 3000 to 3999 = 6 points
4000 to 4999 = 8 points 5000 or greater = 10 points
3) Vehicle Speed ………………………….………………………………………. 4 Maximum Points
The following rating was assigned for the 85th percentile approach speed on the major street:
34 mph or less = 0 points 35 mph to 39 mph = 1 point 40 mph to 44 mph = 2 points 45 mph to 49 mph = 3 points 50 mph or greater = 4 points
Agenda Item No. 4 Attachment
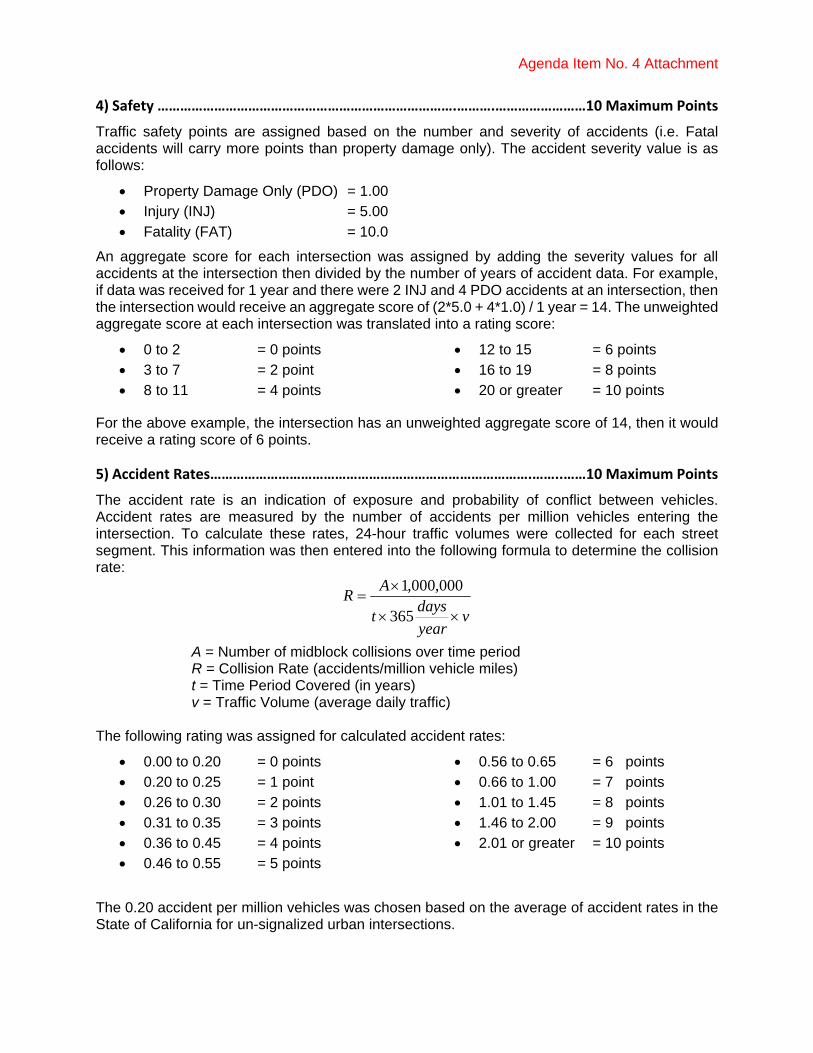
4) Safety …………………………………………………………………….……….……………………10 Maximum Points
Traffic safety points are assigned based on the number and severity of accidents (i.e. Fatal accidents will carry more points than property damage only). The accident severity value is as follows:
Property Damage Only (PDO) = 1.00 Injury (INJ) = 5.00
Fatality (FAT) = 10.0
An aggregate score for each intersection was assigned by adding the severity values for all accidents at the intersection then divided by the number of years of accident data. For example, if data was received for 1 year and there were 2 INJ and 4 PDO accidents at an intersection, then the intersection would receive an aggregate score of (2*5.0 + 4*1.0) / 1 year = 14. The unweighted aggregate score at each intersection was translated into a rating score:
0 to 2 = 0 points 3 to 7 = 2 point 8 to 11 = 4 points
12 to 15 = 6 points 16 to 19 = 8 points 20 or greater = 10 points
For the above example, the intersection has an unweighted aggregate score of 14, then it would receive a rating score of 6 points.
5) Accident Rates………………………………………………………………………….……..……10 Maximum Points
The accident rate is an indication of exposure and probability of conflict between vehicles. Accident rates are measured by the number of accidents per million vehicles entering the intersection. To calculate these rates, 24-hour traffic volumes were collected for each street segment. This information was then entered into the following formula to determine the collision rate:
vyear
dayst
AR
365
000,000,1
A = Number of midblock collisions over time period R = Collision Rate (accidents/million vehicle miles) t = Time Period Covered (in years) v = Traffic Volume (average daily traffic) The following rating was assigned for calculated accident rates:
0.00 to 0.20 = 0 points 0.20 to 0.25 = 1 point 0.26 to 0.30 = 2 points 0.31 to 0.35 = 3 points 0.36 to 0.45 = 4 points 0.46 to 0.55 = 5 points
0.56 to 0.65 = 6 points 0.66 to 1.00 = 7 points 1.01 to 1.45 = 8 points 1.46 to 2.00 = 9 points 2.01 or greater = 10 points
The 0.20 accident per million vehicles was chosen based on the average of accident rates in the State of California for un-signalized urban intersections.
Agenda Item No. 4 Attachment
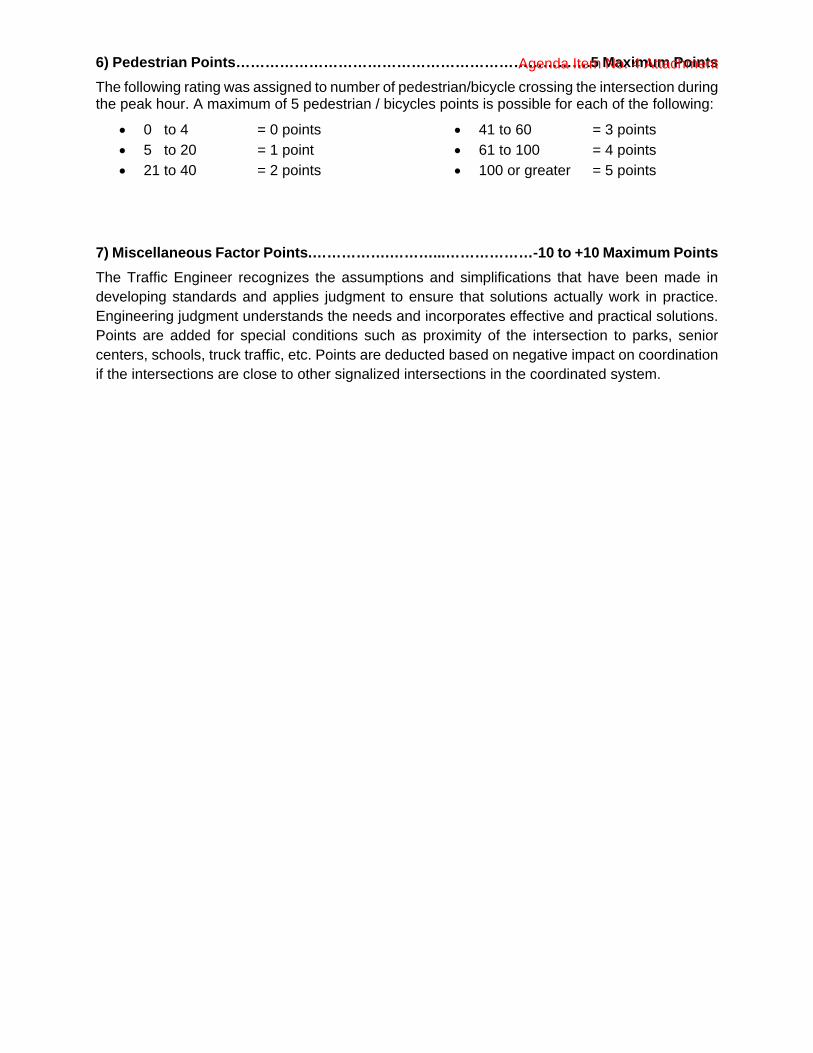
6) Pedestrian Points……………………………………………………………….5 Maximum Points
The following rating was assigned to number of pedestrian/bicycle crossing the intersection during the peak hour. A maximum of 5 pedestrian / bicycles points is possible for each of the following:
0 to 4 = 0 points 5 to 20 = 1 point 21 to 40 = 2 points
41 to 60 = 3 points 61 to 100 = 4 points 100 or greater = 5 points
7) Miscellaneous Factor Points.…………….………...………………-10 to +10 Maximum Points
The Traffic Engineer recognizes the assumptions and simplifications that have been made in developing standards and applies judgment to ensure that solutions actually work in practice. Engineering judgment understands the needs and incorporates effective and practical solutions. Points are added for special conditions such as proximity of the intersection to parks, senior centers, schools, truck traffic, etc. Points are deducted based on negative impact on coordination if the intersections are close to other signalized intersections in the coordinated system.
Agenda Item No. 4 Attachment

Traffic Signal Prioritization Analysis City of Rialto
APPENDIX G
Traffic Signal Priority Rating List
Agenda Item No. 4 Attachment

RIALTO SIGNALALPHA SORT
PRIORITIZATION 2003WITH MISCELLANEOUS
1 2 3 4 5 6 7 8 9 10 11 12 13 14 15 16 17 18 19 20 21 22 23 24 25 26 27 28 29APPROACHING
VEHICLE VOLUMES 3 YEAR 3 YEAR 3 YEAR YEARLY YEARLY YEARLY POSTED PEDTruck generating Special
24 HOUR COLLINJURY COLL
PDO COLL COLL: COLL: COLL: SPEED
PEAK HOUR land use
activity center
VOLUME SUM: SUM: SUM: 2012 2013 2014 LIMITVOLUM
E1 S. Lilac Avenue W. Rialto Avenue 12079 3456 2651 805 40 7 0.529 3 6 2 4 5 0 2 22 6 7 5 2 1 1 5 40 0 2 02 S. Lilac Avenue W. Merrill Avenue 13068 3613 2927 686 35 3 0.210 4 6 1 2 1 5 7 26 3 3 2 1 1 1 1 35 114 2 53 N. Acacia Avenue E. Rialto Avenue 11487 3014 2218 796 35 4 0.318 1 6 1 2 3 1 0 14 13 4 2 2 2 1 1 35 13 0 04 S. Sycamore Avenue E. Randall Avenue 11804 3230 2232 998 35 0 0.000 1 6 1 0 0 3 5 16 11 0 0 0 0 0 0 35 53 0 55 N. Larch Avenue E. Foothill Boulevard 20662 6285 6112 173 45 0 0.000 0 10 3 0 0 0 0 13 14 0 0 0 0 0 0 45 0 0 06 N. Tamarind Avenue E. Baseline Road 12733 4254 3843 411 45 4 0.287 7 8 3 2 2 1 4 27 2 50% Fontana 50% Rialto 4 3 1 2 2 0 45 5 4 07 N. Maple Avenue W. Rialto Avenue 11564 3580 3304 276 40 1 0.079 0 6 2 0 0 2 8 18 9 50% Fontana 50% Rialto 1 0 1 0 1 0 40 39 3 58 S. Maple Avenue Merrill Avenue 10122 2952 2735 217 40 1 0.090 0 4 2 0 0 2 8 16 11 50% Fontana 50% Rialto 1 1 0 1 0 0 40 35 3 59 N. Pepper Avenue E. Etiwanda Avenue 12092 3642 3113 529 35 2 0.151 4 6 1 0 0 2 5 18 9 50% San Bernardino 50% Rialto 2 1 1 0 1 1 35 37 0 5
10 S. Eucalyptus Avenue E. Rialto Avenue 13422 3738 2688 1050 40 3 0.204 3 6 2 0 1 3 5 20 8 25% San Bernardino 75% Rialto 3 1 2 0 1 2 40 45 0 511 Cedar Avenue Hawthorne Avenue 25046 6740 6559 181 40 2 0.073 0 10 2 2 0 1 7 22 6 50% Fontana 50% Rialto 2 2 0 1 1 0 40 13 2 512 S. Linden Avenue W. Merrill Avenue 11690 3222 2847 375 40 9 0.703 3 6 2 4 7 0 7 29 1 9 6 3 0 3 6 40 0 3 413 N. Fitzgerald Avenue E. Baseline Road 16980 5270 4478 792 45 3 0.161 10 10 3 0 0 0 0 23 4 3 1 0 0 2 1 45 3 0 014 Spruce Avenue W. Valley Boulevard 13636 4557 4158 399 40 0 0.000 8 8 2 0 0 0 5 23 4 50% County 50% Rialto 0 0 0 0 0 0 40 0 0 5
Veh
icle
Spe
ed
Poi
nts
# of
Col
lison
s
Juristictional Ownership Int
erse
ctio
n #
NO
RT
H-
SO
UT
H
Cro
ss S
tree
t
Veh
icle
Spe
ed
maj
or
stre
et
min
or
stre
et
To
tal
Po
ints
Ran
kin
g
MIS
C.
Fac
tor
Poi
nts
Col
lisio
ns/M
illio
n V
ehic
les
Inte
rrup
tion
of
Con
tinuo
us
Tra
ffic
Poi
ntsHIGHEST FOUR HOURS
TOTAL Acc
iden
t R
ates
P
oint
s
Tra
ffic
Vol
ume
Poi
nts
Tot
al P
ed
Poi
nts
Saf
ety
Poi
nts
Agenda Item No. 4 Attachment