regression modelling of california bearing ratio (cbr
TRANSCRIPT

© 2019. Kayode-Ojo, N., Ehizokhale, M. E. & Ehiorobo, J. O. This is a research/review paper, distributed under the terms of the Creative Commons Attribution-Noncommercial 3.0 Unported License http://creativecommons.org/licenses/by-nc/3.0/), permitting all non commercial use, distribution, and reproduction in any medium, provided the original work is properly cited.
Global Journal of Researches in Engineering: E Civil And Structural Engineering Volume 19 Issue 4 Version 1.0 Year 2019 Type: Double Blind Peer Reviewed International Research Journal Publisher: Global Journals Online ISSN: 2249-4596 & Print ISSN: 0975-5861
Regression Modelling of California Bearing Ratio (CBR) Predicted from Index
By Kayode-Ojo, N., Ehizokhale, M. E. & Ehiorobo, J. O. University of Benin
Abstract- Obtaining California Bearing Ratios (CBR) of soils for road construction projects could be a time-consuming and costly exercise. In order to reduce the time and cost of obtaining CBR values of soils, this paper presents a mathematical relationship between index properties of lateritic soils, which can easily be obtained from simple laboratory investigations, and their CBR (soaked and unsoaked) values.
Keywords:
california bearing ratio, index properties, multivariate regression model, plasticity index, subgrade.
GJRE-E
Classification: FOR Code: 090599
RegressionModellingofCaliforniaBearingRatioCBRPredictedfromIndex
Strictly as per the compliance and regulations of:
Lateritic Soils were sourced from borrow pits in Edo State in Nigeria. Laboratory tests were conducted to determine the Atterberg limits, grading and CBR of soils obtained. Tests conducted include: sieve analysis, liquid limits, plastic limits, plasticity index (index properties), density, natural moisture content and CBR (soaked and unsoaked) tests. Using multivariate linear regression models, a mathematical model was developed to obtain a relationship between the CBR (soaked and unsoaked) of obtained soils with their index properties, which were obtained from the laboratory investigations conducted.

Regression Modelling of California Bearing Ratio (CBR) Predicted from Index Properties for
Lateritic Soils Kayode-Ojo, N. α , Ehizokhale, M. E. σ & Ehiorobo, J. O. ρ
Author
α σ ρ:
Department of Civil Engineering, Faculty of Engineering, University of Benin, PMB 1154 Benin City, Nigeria.
e-mail: [email protected]
Obtaining California Bearing Ratios (CBR) of soils for road construction projects could be a time-consuming and costly exercise. In order to reduce the time and cost of obtaining CBR values of soils, this paper presents a mathematical relationship between index properties of lateritic soils, which can easily be obtained from simple laboratory investigations, and their CBR (soaked and unsoaked) values.
Lateritic Soils were sourced from borrow pits in Edo State in Nigeria. Laboratory tests were conducted to determine the Atterberg limits, grading and CBR of soils obtained. Tests conducted include: sieve analysis, liquid limits, plastic limits, plasticity index (index properties), density, natural moisture content and CBR (soaked and unsoaked) tests. Using multivariate linear regression models, a mathematical model was developed to obtain a relationship between the CBR (soaked and unsoaked) of obtained soils with their index properties, which were obtained from the laboratory investigations conducted.
The statistical regression analyses showed a good correlation between experimental obtained and the predicted CBR values. The coefficient of determination (R2) differed for both the soaked and the unsoaked CBR values. The selected independent variables (index properties) had a better correlation with the unsoaked CBR than the soaked CBR. However, both CBR values did not satisfy the condition for road base and sub base as some of the materials can be qualified as subgrade material only after thorough compaction by several passes with vibratory roller or excavation and replacement with suitable fill materials has been carried out.
Keywords:
california bearing ratio, index properties, multivariate regression model, plasticity index, subgrade.
I.
Introduction
n highway design, bearing capacity of sub grade soil is of great importance in the determination of pavement thickness (Forkenbrock and Weisbrod,
2001). The sub-grade layer, which is the bottommost layer, is mostly affected as load comes upon it (Forkenbrock and Weisbrod, 2001). In Nigeria, California Bearing Capacity (CBR) test is one of the most common and comprehensive method currently used to determine the sub-grade strength. It is essentially a measure of the shear strength of a material at a known density and moisture content. The shear strength of soils can generally be considered in terms of Coulomb’s Law, as discussed by Croney, (1977).Sub-grade plays an
important role in imparting structural stability to the pavement structure as it receives loads imposed upon it by road traffic (Croney, 1977; Forkenbrock and Weisbrod, 2001). A range of factors influence the CBR of a particular material. Carter and Bentley (1991) mentioned the soil type, density, moisture content and method of sample preparation as playing important roles. Apart from the material properties themselves, moisture conditions are also pivotal. The moisture conditions at which the material is to be used vary according to climatic region, and as such the soaked CBR test is used to simulate the worst likely conditions in service and the un-soaked simulate the normal field condition (Kumar, 2014). For determining soaked value of the CBR, the sample is submerged in water for 96 hours prior to performing the penetration test.
In the tropics, lateritic soils are used as a road making material and they form the sub-grade of most tropical roads (Alayaki, 2012). Lateritic soil is generally believed to be a very good sub-grade material for road construction. Nigerian roads and highways are usually constructed on compacted lateritic soils foundation. Although some lateritic soils (especially gravelly aggregates) have been found to be quite good in pavement construction particularly those with appropriate geotechnical characteristics, the limited availability of these materials in the country is a challenge to constructing durable roads and highways (Alayaki ,2012).
A good highway or road is a gateway to national development as they create access to infrastructure (Okovido and Musa, 2004). In Nigeria, the failure of engineering facilities such as roads and embankments has attracted numerous opinions on the causes (Orie and Nweni, 2015). These failures have necessitated the need for research which revealed that the causes of the highway failure were traceable to indiscriminate dumping of waste, the use of substandard materials and incompetent contractors. Apart from these mentioned causes, insufficient knowledge of the sub-grade of the intended site before use is also a contributing factor of failure (Orie and Nweni, 2015). Huge amounts of money are spent on road maintenance on annual basis, yet the pavement does not last for a long period of time before its fails as a result of not knowing the condition of the sub-grade before design (Alayaki, 2012). CBR test is
I
© 2019 Global Journals
39
Year
2019
Globa
l Jo
urna
l of
Resea
rche
s in E
nginee
ring
(
)Vo
lume
XIxX
Issu
e IV V e
rsion
I
E
Abstract-

one of those parameters that serves as an indication of sub-grade soil strength and hence the service-life of a pavement depends on the sub-grade (Sathawara and Patel, 2013). Comparing soaked and un-soaked CBR will help to know the behavior of the soil before and after construction. Knowing this will help to minimize the high rate of pavement failure, and money spent on yearly maintenance will be used for other projects that will boost the economic and social development of the country (Orie and Nweni, 2015; Alayaki, 2012).
The aim of this study is to develop a relationship between the index properties of lateritic soils and their soaked and unsoaked CBRs of lateritic soils. This relationship will help in quick assessment of CBRs of soils during the design stages of engineering projects.
II. Materials and Method
a) Study Area
The study area covers Ebhohimi, and Ekpoma in Edo central senatorial zone of Edo state, Nigeria as shown in figure 1.
Figure 1: Location Map for the study area b)
Sample Collection
In order to have sufficient and reliable data for the targeted analysis, soil samples were collected from the study area. The samples were collected along the road, and borrow pits. A total of Twenty (20) disturbed
samples were collected, using hand auger at a depth of 1 m to 2 m. Some were taken from both side of the road within a reasonable sampling interval of 2 to 3 km. The sample locations are shown in Table 1.
Table 1: Sample Locations
S/N
Location
Number of Samples Collected
Depth / Chainage
1
Ebohimi borrow pit
10
1 to 3m 2
Ekpoma road /BP
10
0.6-3m&43+230 –
65+100
Regression Modelling of California Bearing Ratio (CBR) Predicted from Index Properties for Lateritic Soils
40
Year
2019
Globa
l Jo
urna
l of
Resea
rche
s in E
nginee
ring
(
)Vo
lume
XIxX
Issu
e IV V e
rsion
I
E
© 2019 Global Journals

c) Laboratory Tests All laboratory tests were done in accordance
with the British Standard Specifications B.S 1377: 1990 (BS, 1990). The tests included: a. Atterberg limits, b. Particle (grain) size analysis, c. California bearing ratio and d. Compaction test. d) Analysis of Data using Multivariate Regression
To find the dependence of the measured geotechnical parameters on the soaked and un-soaked
CBR, mathematical modeling using multivariate regression analysis was done (Bello, 2012). CBR values were taken as dependent variables and index properties (LL, PL, PI, OMC, MDD (compaction tests values), % passing of 0.075mm and 0.425mm) as independent variables.
Multivariate regression equation of the form as shown in Equation 1 was used.
εββββ +−−−−−−−−−+++= 5522110
^xxxy (1)
Where y is the dependent variables,
εββββ ,,,,, 5210 −−− are the coefficient to be
determined (regression coefficients) and
521 ,,, xxx −−− are the independent variables.
The parameters of the equation were computed using E-view version 9.0 statistical software.
1. The first phase in the model development was the transformation of the independent variables (%passing 0.075mm and 0.425mm sieve, liquid limit, plastic limit, plastic index, maximum dry density (g/cm3), optimum moisture content) into readable codes that can be used as input files for the analysis.
2.
The second phase was to define the dependent variables (Soaked and un-soaked CBR) and the model analysis method. In this case, least square regression based on multivariate model was selected.
3.
The third and final phase was to compute the coefficient statistics, and assess the model strength using coefficient of determination, thereafter generate the multivariate equations.
III. Results and Discussion
a) Laboratory Tests Results The results of the laboratory tests for Ebhohimi
borrow pits are shown in Table 2.
Table 2: Results for Ebhohimi borrow pits
Regression Modelling of California Bearing Ratio (CBR) Predicted from Index Properties for Lateritic Soils
© 2019 Global Journals
41
Year
2019
Globa
l Jo
urna
l of
Resea
rche
s in E
nginee
ring
(
)Vo
lume
XIxX
Issu
e IV V e
rsion
I
E
S/NSample Location
%Passing0.075mm(no200)
%Pasng 0.425
mm
Liquid Limit (%)
Plastc Limit (%)
Plasticity Index(%)
MDD(g/cm3)
OMC( %)
CBR Soaked
( %)
CBR Unsoaked
(%)
ASSHTOSoil
Classifica-tion
1Ebhohimi
borrowpit 1,Sample 1
44.1 66.2 57.49 18.57 38.92 1.81 16.92 0.63 0.71 A-7-5
2Ebhohimi
borrow pit 1,Sample 2
48.1 69.8 56.28 15.5 35.92 1.75 17.30 3.63 5.70 A-7-5
3Ebhohimi
borrow pit 1,Sample 3
42.1 64.1 54.75 16.4 38.5 1.72 14.30 8.18 9.72 A-7-5
4
Ebhohimi \borrow pit
1,Sample 4
38.2 61.08 46.31 16.97 29.34 1.74 14.30 2.38 2.89 A-7-5
5Ebhohimi
borrow pit 1,Sample 5
50.66 73.35 56.45 26.11 30.34 1.65 19.76 1.39 1.46 A-7-5
6Ebhohimi
borrow pit 2,Sample 1
46.4 66.8 54.49 23.71 30.78 1.65 15.20 3.71 4.09 A-7-5
7Ebhohimi
borrow pit 2,Sample 2
49.1 67.2 58.17 21.23 36.94 1.75 17.6 1.91 6.19 A-7-5

8
Ebhohimi borrow pit 2,
Sample 3
49.9
68.5
53.04
19.46
33.58
1.75
17.34
1.23
1.30
A-7-5
9
Ebhohimi borrow pit 2,
Sample 4
44.5
64.9
46.31
20.19
26.12
1.68
15.54
4.82
6.48
A-7-5
10
Ebhohimi borrow pit 2,
52.16
75.01
54.64
19.78
34.88
1.65
17.40
0.88
1.51
A-7-5
Based on the obtained test results from Ebhohimi borrow pit (Table 2), the soil is classified as A-7-5 (sandy soil). From the conventional Atterberg limit tests, liquid limit values are in the range of 46.31 to 58.17, plasticity limit values are of 15.5 to
26.45 and plasticity index value of 26.12 to 41.06 as shown in Table 2. Soils with liquid limit less than 30% are considered to be of low plasticity, those with liquid limit between 30% and 50% exhibit medium plasticity and those with liquid limit greater
than 50% exhibit high plasticity (Arora, 2004). All samples exhibited high plasticity except sample 4 in pits 1 and 2 which exhibited medium plasticity. The particle size distribution passing through 0.075mm and 0.425mm ranged between 38.2 to 52.16 and 61.08 to 73.35, which
indicate fine grained soils, the soil can be classified as sandy soil (Arora, 2004). The unsoaked CBR values ranged between 0.71 and 9.72, while its corresponding soaked samples range between 0.63 and 8.18%. The percentage decreases from soaked CBR to unsoaked CBR. This implies that as water is absorbed into the compacted specimen, the resistance to penetration becomes drastically reduced. It has been recommended by Federal Ministry of Works and Housing that the values of CBR for road
base, sub base and subgrade should not be less than 80%, 30% and 10% respectively under soaked condition (FMWH, 1994). It can be seen that samples do not satisfy the condition for road subgrade, base and sub-base. Hence the CBR from that particular borrow
pits are very low.
Table
3:
Results for Ekpoma
S/N
Sample Location
%Passig 0.075mm
(no 200)
%Passing 0.425mm
Liquid Limit
( %)
Plastic Limit (%)
Plasticity
Index (%)
MDD
(g/cm3)
OMC (%)
CBR
Soaked
( %)
CBR Unsoa
ked
( %)
ASSHTO
Soil Classificat
ion
1
EkpomaUjioba RD,1.4m
36.06
68.35
53.32
19.00
34.32
1.59
18.60
17.6
33.2
A-7-5
2
EkpomaUjioba 0.65m
24.32
65.85
43.81
15.86
27.95
1.62
19.38
18.2
32.49
A-7-5
3
Ekpoma
Borrow pit 1
0.75m
36.89
67.99
36.74
15.51
21.23
1.78
10.8
6.34
11.4
A-6
4
Ekpoma Borrow pit 2
0.75m
22.15
73.16
27.76
13.43
14.33
1.69
13.2
10.9
12.8
A-2-6
5
Ekpoma Borrow pit 2
1.5m
23.14
75.49
41.52
13.70
27.55
1.72
14.9
8.85
12.8
A-2-6
6
Ekpoma Borrow pit 3
1.5m
21.13
76.44
35.76
15.18
20.58
1.76
13.6
3.48
10.2
A-2-6
7
Ekpoma 50+500
40.44
74.7
45.80
25.2
14.29
1.59
16.0
8.29
10.1
A-7-5
8
Ekpoma 43+230
40.74
78.75
33.80
19.74
14.06
1.65
14.0
9.03
11.1
A-6
9
Ekpoma 47+500
36.23
77.43
29.38
17.45
11.92
1.71
13.6
4.99
5.09
A-6
Regression Modelling of California Bearing Ratio (CBR) Predicted from Index Properties for Lateritic Soils
42
Year
2019
Globa
l Jo
urna
l of
Resea
rche
s in E
nginee
ring
(
)Vo
lume
XIxX
Issu
e IV V e
rsion
I
E
© 2019 Global Journals
10 Ekpoma 65+100 29.35 73.32 43.81 15.86 27.95 1.62 19.4 7.43 12.67 A-2-6

The laboratory tests results for soils from Ekpoma are presented in Table 3. Based on the obtained test results of plasticity, the soil classification was made in accordance to the AASHTO classification system, and it was classified as A-7-5, A-2-6, A-6. From the conventional Atterberg limit tests, liquid limit value ranging from 27.76 to 53.32, plastic limit value of 13.43 to 25.20 and plasticity index value of 11.92 to 34.32. Soils with liquid limit less than 30% are considered to be of low plasticity, those with liquid limit between 30% and 50% exhibit medium plasticity and those with liquid limit greater than 50% exhibit medium plasticity and those with liquid limit greater than 50% exhibit high plasticity. The values of California bearing ratio have been shown in Table 1. It has unsoaked CBR ranges between 10.1 and 33.2, which that of its corresponding soaked samples range between 3.48 and 17.6%. The percentage decreases from soaked CBR to unsoaked CBR. This implies that as water is absorbed into the compacted specimen, the resistance to penetration becomes drastically reduced. It has been recommended by Federal Ministry of Works that the
values of CBR for road base, subbase and subgrade should not be less than 80%, 30% and 10% respectively under soaked condition. It can be seen that some of the samples satisfy the condition for road subgrade, but for it to be used for base and subbase materials, it is advisable to improve the soil by stabilization or excavation of the soil.
b)
Regression Modelling
For this analysis, geotechnical properties including sieve analysis, liquid limit, plastic limit, plastic index, optimium moisture content and maximum moisture content were taken as independent variables as shown in tables 4 and 5while CBR soaked and unsoaked were taken as the dependent variables.To conduct the multivariate linear regression and solve the regression equation, multivariate statistical software E-view 9.0 was employed. The interphase of the statistical software containing both the dependent and independent variables is presented in tables 6 and 7 representing both the soaked and unsoaked CBR respectively. For ease of data transformation, the selected independent variables were coded as follows
Table 4:
Independent
variable codes and their definition
S/No.
Variable Code
Variable Definition
1 X1
% Passing 0.075mm sieve
2 X2
% Passing 0.425mm sieve
3 X3
Liquid limit (%)
4 X4
Plastic limit (%)
5 X5
Plastic index (%)
6 X6
Maximum dry density (g/cm3)
7 X7
Optimum
moisture content (%)
Table 5:
Input data for analysis (Ebhohimi)
X1
X2
X3
X4
X5
X6
X7
SOAKED CBR
UNSOAKED CBR
44.1
66.2
57.49
18.57
38.92
1.81
16.92
0.63
0.71
48.1
69.8
56.28
15.5
35.92
1.75
17.30
3.63
5.70
42.1
64.1
54.75
16.4
38.5
1.72
14.30
8.18
9.72
38.2
61.08
46.31
16.97
29.34
1.74
14.30
2.38
2.89
50.66
73.35
56.45
26.11
30.78
1.65
19.76
1.39
1.46
46.4
66.8
54.49
23.71
30.78
1.65
15.20
3.71
4.09
49.1
67.2
58.17
21.23
36.94
1.75
16.81
1.91
6.19
49.9
68.5
53.04
19.46
33.58
1.75
17.34
1.23
1.30
44.5
64.9
46.31
20.19
26.12
1.68
15.54
4.82
6.48
52.16
75.01
54.64
19.78
34.88
1.65
17.40
0.88
1.51
Regression Modelling of California Bearing Ratio (CBR) Predicted from Index Properties for Lateritic Soils
© 2019 Global Journals
43
Year
2019
Globa
l Jo
urna
l of
Resea
rche
s in E
nginee
ring
(
)Vo
lume
XIxX
Issu
e IV V e
rsion
I
E

Table 6: Software interphase showing the coefficient estimates of the dependent and independent
variables
Table 7: Software interphase showing the coefficient estimates of the dependent and independent variables
i.
Analysis Test Results of soaked and un-soaked CBR for Ebhohimi samples
From the result of Tables 6 and 7, it was observed that the coefficient of determination (R2) differs for both the soaked and the unsoaked CBR analysis (0.899147 and 0.937723) respectively. The explanation is that the selected independent variables (percent passing 0.075mm sieve size, percent passing 0.425mm sieve size, liquid limit, plastic limit, plastic index,
maximum dry density and optimum moisture content) had a better correlation with the unsoaked CBR than the soaked CBR. In addition, the high coefficient of determination as observed revealed the suitability of multivariate linear regression model in explaining the dependence of the independent variables on the regressor. Normally, this would imply a very good fit for the model. Thereafter, multivariate linear regression equation was developed as shown in Figure 2 and 3.
Regression Modelling of California Bearing Ratio (CBR) Predicted from Index Properties for Lateritic Soils
44
Year
2019
Globa
l Jo
urna
l of
Resea
rche
s in E
nginee
ring
(
)Vo
lume
XIxX
Issu
e IV V e
rsion
I
E
© 2019 Global Journals

Figure 2: Multivariate linear regression equation showing the dependence of selected
Independent variables on the regressor
Based on the observed (R2) values, the multiple linear regression equation was thereafter developed using the estimated parameters and the substituted coefficients are as shown in Figures 2 and 3
which represent the soaked and unsoaked CBR. The “Cs”are the soaked CBR coefficient, while X1, X2…Xn are the independent variables. The values were substituted and equation (2) was derived.
733811517925.166641130848.25534762910760.14786023925909.0369982361879.02
232041621766.01361449101719.07569647842.31
Χ∗−Χ∗+Χ∗−Χ∗−Χ∗+Χ∗
+Χ∗+=CBRs
(2)
Figure 3: Multivariate linear regression equation showing the dependence of selected independent variables on the
regressor The same procedure in Figure 2 applies here.
Multiple linear regression equation was developed using the estimated parameters and the substituted coefficients are as shown in Figure 3 which represent
Regression Modelling of California Bearing Ratio (CBR) Predicted from Index Properties for Lateritic Soils
© 2019 Global Journals
45
Year
2019
Globa
l Jo
urna
l of
Resea
rche
s in E
nginee
ring
(
)Vo
lume
XIxX
Issu
e IV V e
rsion
I
E

the unsoaked CBR. The “Cs”are the soaked CBR coefficient, while X1, X2…Xn are the independent variables ( X1 = % 0.075mm sieve, X2 = % 0.425mm
sieve, X3 = LL (%), X4 = PL (%), X5= PI (%), X6 = MDD (g/cm3), X7= OMC (%)). The values were substituted and equation 3 was derived.
730114382326.46349513474.1785267097863768.0487974329052.13746233297355.02
24034275055.31559189188357.0734684701.409
Χ∗+Χ∗−Χ∗+Χ∗−Χ∗+Χ∗−Χ∗+=CBRu
(3)
Thereafter, a graphical visualization was done, the graphical representation of soaked and unsoaked CBR for Ebhohimi sample, as shown in Figures 4 and 5.
Figure 4:
Statistics of fit based on 95% upper and lower bounds for soaked CBR
Regression Modelling of California Bearing Ratio (CBR) Predicted from Index Properties for Lateritic Soils
46
Year
2019
Globa
l Jo
urna
l of
Resea
rche
s in E
nginee
ring
(
)Vo
lume
XIxX
Issu
e IV V e
rsion
I
E
© 2019 Global Journals

Figure 5:
Statistics of fit based on 95% upper and lower bounds for unsoaked CBR
ii.
Statistics of fit based on 95% upper and lower bounds for soaked and unsoaked CBR
The computed statistics of fit based on 95% lower and upper bounds was visualized graphically as presented in Figures 4 and 5 respectively representing the effect of selected independent variables on the soaked and unsoaked CBR for Ebhohimi borrow pit soils. The red dotted lines are the upper and lower
bounds of the graph, while the blue line shows the variations in the CBR values. The selected independent variables have more effect on the unsoaked CBR than the soaked CBR.The statistical prediction Figure which shows the actual and predicted soaked and un-soaked CBR based on the multivariate regression approach is presented in Figures 6 and 7 respectively.
Figure 6:
Actual and predicted soaked CBR
Regression Modelling of California Bearing Ratio (CBR) Predicted from Index Properties for Lateritic Soils
© 2019 Global Journals
47
Year
2019
Globa
l Jo
urna
l of
Resea
rche
s in E
nginee
ring
(
)Vo
lume
XIxX
Issu
e IV V e
rsion
I
E

Figure 7: Actual and predicted unsoaked CBR
iii. Comparison of Actual and Predicted CBR Values
From the statistical prediction figures 6 and 7 which shows the actual and predicted soaked and unsoaked CBR based on the multivariate regression approach, it is observed that the actual CBR values and predicted CBR value for both soaked and unsoaked are relatively close, the highest variation is 1.38. To assess the strength of multivariate linear regression analysis in predicting the soaked and unsoaked CBR of the soil based on selected geotechnical parameters, a linear regression of output was done using the actual and predicted soaked and unsoaked CBR as the dependent and independent variables. Result obtained are presented in Figure 8.
Regression Modelling of California Bearing Ratio (CBR) Predicted from Index Properties for Lateritic Soils
48
Year
2019
Globa
l Jo
urna
l of
Resea
rche
s in E
nginee
ring
(
)Vo
lume
XIxX
Issu
e IV V e
rsion
I
E
© 2019 Global Journals

Figure 8: Prediction accuracy of multivariate linear regression (Ebhohimi)
A plot was made between experimental
and predicted values of CBR as shown in Figure 8
It is clear from this figure that most of the predicted CBR values are close to the reported experimental soaked CBR values. As the Actual CBR in soaked and the unsoaked increases, predicted CBR values also
increases, indicating linear relationship
exists between them. Considering the square of
coefficient of correlation (R2) for both is found to be
0.8991 (soaked) and 0.9377 unsoaked, there is evidence that a good correlations exist.
c)
Ekpoma sample
The input data for Ekpoma analysis is shown in
Table 9.
Table 8:
Input data for analysis (Ekpoma)
X1
X2
X3
X4
X5
X6
X7
SOAKED CBR
UNSOAKED
CBR
36.06
68.35
53.32
19
34.32
1.59
18.6
17.6
33.2
24.32
65.85
43.81
15.86
27.95
1.62
19.38
18.2
32.49
36.89
67.99
36.74
15.51
21.23
1.78
10.8
6.34
11.4
22.15
73.16
27.76
13.43
14.33
1.69
13.2
10.9
12.8
23.14
75.49
41.52
13.7
27.55
1.72
14.9
8.85
12.8
21.13
76.44
35.76
15.18
20.58
1.76
13.6
3.48
10.2
40.44
74.7
45.8
25.2
14.29
1.59
16
8.29
10.2
40.74
78.75
33.8
19.74
14.06
1.65
14
9.03
11.1
36.23
77.43
29.38
17.45
11.92
1.71
13.6
4.99
5.09
29.35
73.32
43.81
15.86
27.95
1.62
19.4
7.43
12.67
Regression Modelling of California Bearing Ratio (CBR) Predicted from Index Properties for Lateritic Soils
© 2019 Global Journals
49
Year
2019
Globa
l Jo
urna
l of
Resea
rche
s in E
nginee
ring
(
)Vo
lume
XIxX
Issu
e IV V e
rsion
I
E

Table 10: Software interphase showing the coefficient estimates of the dependent and independent variables
d)
Analysis Test Results of soaked and un-soaked CBR for Ekpoma sample
From the result of Tables 9 and 10, it was observed that the coefficient of determination (R2) differs for both the soaked and the unsoaked CBR analysis (0.887462 and 0.974403). The selected independent variables (percent passing 0.075mm sieve size, percent passing 0.425mm sieve size, liquid limit, plastic limit, plastic index, maximum dry density
and optimum moisture content) had a better correlation with the unsoaked CBR than the soaked CBR. In addition, the
high coefficient of determination as observed revealed the suitability of multivariate linear regression model in explaining the dependence of the independent variables on the regressor. From the results, it was observed that 88.7462% and 97.4403% of the variation in the soaked and unsoaked CBR can be explained by the selected independent variables.
Thereafter, multivariate linear regression equation was developed as are shown in Figures 9 and 10 and
Regression Modelling of California Bearing Ratio (CBR) Predicted from Index Properties for Lateritic Soils
50
Year
2019
Globa
l Jo
urna
l of
Resea
rche
s in E
nginee
ring
(
)Vo
lume
XIxX
Issu
e IV V e
rsion
I
E
© 2019 Global Journals
Table 9: Software interphase showing the coefficient estimates of the dependent and independent variables

Figure 9: Multivariate linear regression equation showing the dependence o f selected independent variables on the regressor
728057760202.16561288054.106547049445502.1434055198019.2345324865238.1
2075509760436.01363922445361.0764557322.250
Χ∗−Χ∗−Χ∗+Χ∗+Χ∗
Χ∗−Χ∗−=CBRs (4)
Figure 10: Multivariate linear regression equation showing the dependence ofselected independent variables on the regressor
Regression Modelling of California Bearing Ratio (CBR) Predicted from Index Properties for Lateritic Soils
© 2019 Global Journals
51
Year
2019
Globa
l Jo
urna
l of
Resea
rche
s in E
nginee
ring
(
)Vo
lume
XIxX
Issu
e IV V e
rsion
I
E
730570850211.269683624403.95525945987642.4462109346859.7320312422388.42
53635829771.1110356585519.1903734199.274
Χ∗−Χ∗−Χ∗+Χ∗+Χ∗−Χ∗
−Χ∗−=CBRu (5)
Based on the observed (R2) values, the multiple linear regression equation was thereafter developed using the estimated parameters and the substituted coefficients as shown in Figures 9 and 10 which represent the soaked and unsoaked CBR models.
The graphical representation of the predicted values of soaked and unsoaked CBR for Ekpoma sample, are as shown in Figures 11 and 12.
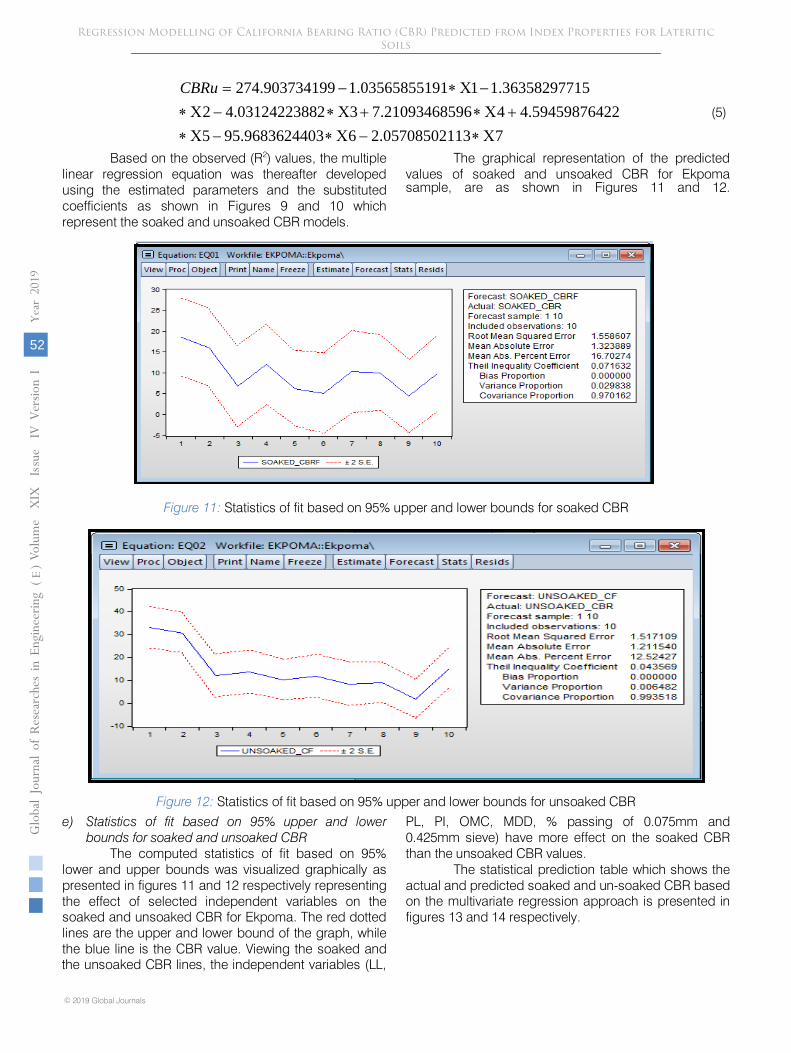
Figure 11:
Statistics of fit based on 95% upper and lower bounds for soaked CBR
Figure 12:
Statistics of fit based on 95% upper and lower bounds for unsoaked CBR
e)
Statistics of fit based on 95% upper and lower bounds for soaked and unsoaked CBR
The computed statistics of fit based on 95% lower and upper bounds was visualized graphically as presented in figures 11 and 12 respectively representing the effect of selected independent variables on the soaked and unsoaked CBR for Ekpoma. The red dotted lines are the upper and lower bound of the graph, while the blue line is the CBR value. Viewing the soaked and the unsoaked CBR lines, the independent variables (LL,
PL, PI, OMC, MDD, % passing of 0.075mm and 0.425mm sieve) have more effect on the soaked CBR than the unsoaked CBR values.
The statistical prediction table which shows the actual and predicted soaked and un-soaked CBR based on the multivariate regression approach is presented in figures 13 and 14 respectively.
Regression Modelling of California Bearing Ratio (CBR) Predicted from Index Properties for Lateritic Soils
52
Year
2019
Globa
l Jo
urna
l of
Resea
rche
s in E
nginee
ring
(
)Vo
lume
XIxX
Issu
e IV V e
rsion
I
E
© 2019 Global Journals

Figure 13: Actual and predicted soaked CBR
Figure 14: Actual and predicted un-soaked CBR
f) Statistical Prediction of Actual and Predicted CBR
soaked and unsoaked The statistical prediction table which shows the actual and predicted soaked and un-soaked CBR based on the multivariate regression approach is presented in Figures 13 and 14 respectively. To assess the strength of multivariate linear regression analysis in predicting the soaked and unsoaked CBR of the soil based on selected geotechnical parameters, a linear regression of output was done using the actual and predicted soaked and unsoaked CBR as the dependent and independent variables. Result obtained is presented in Figure 15
Regression Modelling of California Bearing Ratio (CBR) Predicted from Index Properties for Lateritic Soils
© 2019 Global Journals
53
Year
2019
Globa
l Jo
urna
l of
Resea
rche
s in E
nginee
ring
(
)Vo
lume
XIxX
Issu
e IV V e
rsion
I
E

Figure 15: Prediction accuracy of multivariate linear regression for both soaked and un-soaked CBR (Ekpoma)
sample A plot was made between experimental and
predicted values of CBR as shown in Figure 15 It is clear from this figure that most of the predicted CBR values are close to the reported experimental soaked CBR values and hence considering the limitations of developed correlation and the test related errors, the proposed equations can be regarded as well validated.
It is observed from figure 15 that the experimental soaked CBR values are close to predicted values. The model developed for soaked CBR value has correlation coefficient (R2) =0.8875 and R2= 0.9744 for the unsoaked indicating a reasonable fit.
Table 11: Statistical parameters of cross validation output data
Location Model (Y) R2 Adjusted
R2 Standard
Deviation (σ) Standard Error (SE)
Mean (µ)
Ebhohimi CBRs 0.8991 X + 0.3126 0.8991 0.5461 2.5063 1.6884 3.1000 Ebhohimi CBRu 0.9377 X + 0.2355 0.9377 0.7197 2.8747 1.5218 3.7810 Ekpoma CBRs 0.8875 X + 1.114 0.8874 0.4935 4.8974 3.4851 9.8990 Ekpoma CBRu 0.9744 X + 0.3748 0.9744 0.8848 9.9954 3.3923 14.641
Statistical parameters such as coefficient of multiple determinations (R2),
standard deviation (σ),
standard error (SE), Adjusted R2, and mean (µ) of estimated and measured values obtained after multivariate analysis were determined for both soaked and unsoaked CBR for Ebhohimi and, Ekpoma. Comparing the soaked and unsoaked CBR values of these two locations, it was observed in Table 11, that Ekpoma sample has a higher determination coefficient
(R2) of 0.9744 for unsoaked CBR as a function of independent variables (LL, PI, MDD, OMC, 0.075mm and 0.425mm sieve) and Ebhohimi sample has a higher determination coefficient (R2) of 0.8991 for soaked CBR, which is also as a function of the independent variables. This means that the model has a higher coefficient of determination compared with un-soaked CBR.
Table 12: Summary of the experimental and predicted CBR soaked and unsoaked
Ebhohimi
Sample No.
BP1
BP2
BP3
BP4
BP5
BP6
BP7
BP8
BP9
BP10
Experimental Value of CBRs
0.63
3.63
8.18
2.38
1.39
3.71
1.91
1.30
4.82
0.88
Predicted value of CBRs
0.02
4.26
7.58
3.84
1.44
4.62
1.51
2.07
5.09
0.56
Experimental Value of CBRu
0.71
5.70
9.72
2.89
1.46
4.09
6.19
1.23
6.48
1.51
Regression Modelling of California Bearing Ratio (CBR) Predicted from Index Properties for Lateritic Soils
54
Year
2019
Globa
l Jo
urna
l of
Resea
rche
s in E
nginee
ring
(
)Vo
lume
XIxX
Issu
e IV V e
rsion
I
E
© 2019 Global Journals

Predicted value of CBRu
0.14
6.34
9.12
3.22
1.48
4.96
5.83
1.87
3.61
1.21
Ekpoma
Sample No.
RD1
RD2
BP3
BP4
BP5
BP6
RD7
RD8
RD9
RD10
Experimental Value of CBRs
17.6
18.2
6.34
10.9
8.85
3.48
8.29
9.03
4.99
7.43
Predicted value of CBRs
18.4
15.9
6.85
12.0
6.20
5.05
10.2
9.94
4.38
9.85
Experimental Value of CBRu
33.2
32.4
11.4
12.8
12.8
10.2
10.1
11.1
5.09
12.6
Predicted value of CBRu
33.2
30.7
12.2
13.6
10.2
11.7
8.40
8.86
1.87
15.3
IV.
Conclusion
From this study, it was observed that the regression model was able to capture the relation between index properties of soils and the soaked and unsoaked CBRs. At Ebhohimi site, the coefficient of regression with values predicted from the developed regression model and experimentally obtained values were found to be high (Soaked was observed to be 0.89 and the unsoaked is 0.93). Ekpoma (R2) was observed to be 0.88 for the soaked and 0.97 for the unsoaked.
The results of the analysis indicate that there is a close relationship between experimental CBR values and the predicted CBR values.
However, the results show that more than half of the sample materials do not satisfy the requirement for both road base and subbase. Some of the materials can only be used as subgrade materials only after thorough compaction by several passes with vibratory roller or excavation and replacement with suitable fill material has been carried out.
1.
Arora, K.
R., (2004) Soil Mechanics and Foundation Engineering, Re-print Standard
Publishers Distributer, Nai Sarak, Delhi, 2004.
2.
Alayaki, F.
M. (2012). Water Absorption Properties of Lateritic Soil in Road Pavement. A Case Study of Ife-Ilesha Highway, South-Western Nigeria. International Journal of
Emerging Technology and Advanced Engineering. p. 52.
3.
American Society for Testing and Materials, (2000). Standard Practice for classification of Soils for Engineering Purposes (Unified Soil Classification System). Annual Book of ASTM Standards, West Conshohocken, Pennsylvania, Volume 04.08.
4.
Bello, A.A. (2012). Regression analysis between properties of subgrade lateritic soil. Leonardo Journal of sciences, 21, pp. 99-108.
5.
BSI (British Standard Institution) (1990). Methods
of test for soils for civil engineering
purposes.
Part 2 (BS 1377-2) and Part 4 (BS 1377-4): BS 1377 Tests 2 and 3, BS, London.
6.
Carter, M. and Bentley, S.P. (1991). Correlations of soil properties. Pentech Press, London,
p. 130.
7. Croney, D. (1977). “The design and performance of
road pavements”. (Department of the Environment. Department of Transport: Transport and Road Research Laboratory)
8. Her Majesty s Stationery Office, London, 673pp. 9. Kumar, T. (2014). “A Study of Correlation between
California Bearing Ratio (CBR) values with other properties of Soil”. International Journal of Emerging Technology and Advanced Engineering Certified Journal,Civil Engineering Department, Nowgong Polytechnic, Nagaon, Assam. India.
10. Federal Ministry of Works and Housing (1994). General Specification for Roads and Bridges.
11. Forkenbrock, D.J and GLEN E. Weisbrod, G.E (2001) NCHRP PROGRAM REPORT 456, Guidebook for Assessing the Social and Economic Effects of Transportation Projects, NATIONAL ACADEMY PRESS WASHINGTON, D.C
12. National Cooperative Highway Research Program (2001). “Correlation of CBR Values with Soil Index Guide for Mechanistic and Empirical Design for New and Rehabilitated
13. Pavement Structures”. Final Document. In: Properties. West University Avenue Champaign, Illinois: Ara, In. 14. Okovido, .J. O., and Musa .M. (2004). “Civil Engineering History &
Phylosophy of Science
&
Technology”. Quality Press Research Studio, Benin City.
15. Orie, O. U. and Nweni, E. L. (2015). Severity indices of variables causing road collapse in Nigeria. Journal of Civil and Environmental System Engineering, University of Benin
Volume 13, Pp 156.
16. Sathawara
Jigar K. and Patel A.
K.
2013. “Comparison between soaked and unsoaked CBR”. International Journal of Advanced Engineering Research and Studies. Volume 11, pp 1327-135.
Regression Modelling of California Bearing Ratio (CBR) Predicted from Index Properties for Lateritic Soils
© 2019 Global Journals
55
Year
2019
Globa
l Jo
urna
l of
Resea
rche
s in E
nginee
ring
(
)Vo
lume
XIxX
Issu
e IV V e
rsion
I
E
References Références Referencias