registrar & transfer agent new york stock exchange symbols … · 2017-07-17 · lumina power,...
TRANSCRIPT

Subsidiaries
Flight Support Group Action Research Corporation Aero Design, Inc. Aeroworks International Holdings, B.V. Aircraft Technology, Inc. Blue Aerospace LLC CSI Aerospace, Inc. DEC Technologies, Inc. Future Aviation, Inc. HEICO Aerospace Corporation HEICO Aerospace Holdings Corp. HEICO Aerospace Parts Corp. HEICO Component Repair Group - Miami HEICO Flight Support Corp. HEICO Parts Group HEICO Repair Group Inertial Airline Services, Inc. Jet Avion Corporation Jetseal, Inc. LPI Corporation McClain International, Inc. Niacc-Avitech Technologies, Inc. Prime Air, LLC and Prime Air Europe Reinhold Industries, Inc. Seal Dynamics LLC Sunshine Avionics LLC Thermal Structures, Inc. Turbine Kinetics, Inc.
Electronic Technologies Group 3D-Plus, SAS Analog Modules, Inc. Connectronics Corp. and Wiremax dB Control Corp. Dukane Seacom, Inc. EMD Technologies Incorporated Engineering Design Team, Inc. HVT Group, Inc. Dielectric Sciences, Inc. Essex X-Ray & Medical Equipment LTD Leader Tech, Inc. Lucix Corporation Lumina Power, Inc. Radiant Power Corp. Ramona Research, Inc. Santa Barbara Infrared, Inc. Sierra Microwave Technology, LLC Switchcraft, Inc. and Conxall VPT, Inc.
Registrar & Transfer Agent
Computershare Investor ServicesP.O. BOX 30170College Station, TX 77842-3170Telephone: 800-307-3056www.computershare.com/investor
New York Stock Exchange Symbols
Class A Common Stock - “HEI.A”Common Stock - “HEI”
Form 10-K and Board of Directors Inquiries
The Company’s Annual Report on Form 10-K for 2014, as filed with the Securities and Exchange Commission, is available without charge upon written request to the Corporate Secretary at the Company’s headquarters.
Any inquiry to any member of the Company’s Board of Directors, including, but not limited to “independent” Directors, should be addressed to such Director(s) care of the Company’s Headquarters and such inquiries will be forwarded to the Director(s) of whom the inquiry is being made.
Annual Meeting
The Annual Meeting of Shareholderswill be held on Friday,March 20, 2015 at 10:00 a.m. at the JW Marriott Miami1109 Brickell AvenueMiami, FL 33131Telephone: 305-329-3500
Shareholder Information
Elizabeth R. LetendreCorporate SecretaryHEICO Corporation3000 Taft StreetHollywood, FL 33021Telephone: 954-987-4000Facsimile: [email protected]
CORPORATION
HEICO Corporation
Corporate Offices3000 Taft Street Hollywood, FL 33021Telephone: 954-987-4000Facsimile: 954-987-8228www.heico.com
HE
ICO
® CO
RP
OR
AT
ION
/ 2
014
AN
NU
AL
RE
PO
RT

THOMAS M. CULLIGANretired Sr. Vice President and CEO of Raytheon International,The Raytheon Company
ADOLFO HENRIQUESChairman and CEO,Gibraltar Private Bank and Trust
SAMUEL L. HIGGINBOTTOMretired Chairman, President andChief Executive Officer,Rolls-Royce, Inc.
MARK H. HILDEBRANDTManaging Member and Partner, Waldman, Trigoboff, Hildebrandt, Marx & Calnan, P.A.
WOLFGANG MAYRHUBERChairman of the Supervisory Board,Deutsche Lufthansa AGChairman of the Supervisory Board,Infineon Technologies AG
ERIC A. MENDELSONCo-President, HEICO Corporation
LAURANS A. MENDELSONChairman and Chief Executive Officer,HEICO Corporation
VICTOR H. MENDELSONCo-President, HEICO Corporation
JULIE NEITZELPartner, WE Family Offices
DR. ALAN SCHRIESHEIMretired Director,Argonne National Laboratory
FRANK J. SCHWITTERretired Partner,Arthur Andersen LLP
Dr. Alan Schriesheim
Adolfo HenriquesThomas M. Culligan
Wolfgang Mayrhuber Eric A. Mendelson
Victor H. MendelsonLaurans A. Mendelson
Samuel L. Higginbottom Mark H. Hildebrandt
Julie Neitzel
Frank J. Schwitter
F O R W A R D - L O O K I N G S T A T E M E N T S
Certain statements in this report constitute forward-looking statements, which are subject to risks, uncertainties and contingencies. HEICO’s actual results may differ materially from those expressed in or implied by those forward-looking statements as a result of fac-tors including, but not limited to: lower demand for commercial air travel or airline fleet changes or airline purchasing decisions, which could cause lower demand for our goods and services; product development or product specification costs and requirements, which could cause an increase to our costs to complete contracts; governmental and regulatory demands, export policies and restrictions, reductions in defense, space or homeland security spending by U.S. and/or foreign customers or competition from existing and new competitors, which could reduce our sales; our ability to introduce new products and product pricing levels, which could reduce our sales or sales growth; product development difficulties, which could increase our product development costs and delay sales; our ability to make acquisitions and achieve operating synergies from acquired businesses, customer credit risk, interest and income tax rates and economic conditions within and outside of the aviation, defense, space, medical, telecommunications and electronics industries, which could negatively impact our costs and revenues; and defense budget cuts, which could reduce our defense-related revenue. Parties receiving this material are encouraged to review all of HEICO’s filings with the Securities and Exchange Commission, including, but not limited to filings on Form 10-K, Form 10-Q and Form 8-K. We undertake no obligation to publicly update or revise any forward-looking statement, whether as a result of new information, future events or otherwise, except to the extent required by applicable law.
F I N A N C I A L H I G H L I G H T S B O A R D O F D I R E C T O R S
Year ended October 31, (1) 2012 2013 2014
(in thousands, except per share data)
Operating Data: Net sales $ 897,347 $ 1,008,757 $ 1,132,311 Operating income 163,294 183,590 203,388 Interest expense 2,432 3,717 5,441 Net income attributable to HEICO 85,147 102,396 (3) 121,293 (4) Weighted average number of common shares outstanding: (2) Basic 65,861 66,298 66,463 Diluted 66,624 66,982 67,453 Per Share Data: (2) Net income per share attributable to HEICO shareholders: Basic $ 1.29 $ 1.54 (3) $ 1.82 (4) Diluted 1.28 1.53 (3) 1.80 (4) Cash dividends per share (2) .086 1.816 .470 Balance Sheet Data (as of October 31): Total assets $ 1,192,846 $ 1,533,015 $ 1,489,214 Total debt (including current portion) 131,820 377,515 329,109 Redeemable noncontrolling interests 67,166 59,218 39,966 Total shareholders’ equity 719,759 723,235 774,619
(1) Results include the results of acquisitions from each respective effective date.
(2) All share and per share information has been adjusted retrospectively to reflect the 5-for-4 stock splits effected in October 2013 and April 2012.
(3) Includes the aggregate tax benefit from an income tax credit for qualified research and development activities for the last ten months of fiscal 2012 recognized in fiscal 2013 upon the retroactive extension in January 2013 of the U.S. research and development tax credit and higher research and development tax credits recognized upon the filing of HEICO’s fiscal 2012 U.S. federal and state tax returns, which, net of expenses, increased net income attributable to HEICO by $1.8 million, or $.03 per basic and diluted share.
(4) Operating income was increased by a $28.1 million reduction in accrued contingent consideration related to a fiscal 2013 and a fiscal 2012 acquisition within the Electronic Technologies Group (“ETG”), partially offset by $15.0 million in impairment losses related to the write-down of certain intangible assets at the fiscal 2013 and fiscal 2012 acquisitions to their estimated fair values as well as lower than expected operating income at the fiscal 2013 acquired business, which in aggregate increased net income attributable to HEICO by $10.2 million, or $.15 per basic and diluted share. The reduction in the value of contingent consideration and $13.1 million of the impairment losses were recorded as a component of selling, general and administrative expenses, while the remaining impairment losses of $1.9 million were recorded as a component of cost of sales.

HEICO Corporation is a rapidly growing aerospace and electronics
company focused on niche markets and cost-saving solutions
for its customers. HEICO’s products are found in the most demanding
applications requiring high-reliability parts and components, such
as aircraft, spacecraft, defense equipment, medical equipment,
and telecommunications systems. Through our Flight Support
Group, we are: the world’s largest independent provider of
commercial, FAA-approved aircraft replacement parts;
a significant provider of aircraft accessories component
repair & overhaul services for avionic, electro-me-
chanical, flight surface, hydraulic and pneumatic
applications; a leader in niche aircraft parts
distribution; and a manufacturer of other
critical aircraft parts.
C O R P O R A T E P R O F I L E
N E T S A L E S(in millions)
O P E R AT I N G I N C O M E(in millions)
N E T I N C O M E(in millions)
2012 2013 2014
2012 2013 2014
2012 2013 2014
N E T I N C O M E P E R S H A R E(diluted)
2012 2013 2014H E I C O C O R P O R A T I O N / 1
$897.3
$1,008.8
$163.3
$85.1$1.28
$183.6
$102.4$1.53
$203.4
$121.3$1.80
$1,132.3
Our Electronic Technologies
Group designs and manufactures
mission-critical niche electronic,
electro-optical, microwave and
other components found in aviation,
broadcast, defense, homeland security,
medical, space, telecom and other complex
equipment used worldwide.
HEICO’s customers include most of the world’s
airlines, overhaul shops, satellite manufacturers,
commercial and defense equipment producers,
medical equipment manufacturers, government agencies,
telecommunications equipment suppliers and others.

2 / H E I C O C O R P O R A T I O N
Dear Fellow Shareholder:
2014 was another excellent year for HEICO Corpora-
tion. Our company again reported record net sales,
operating income, net income and net operating cash
flow for the fiscal year.
Net income increased 18% to a record $121.3 million, or
$1.80 per diluted share, up from $102.4 million, or $1.53
per diluted share, in Fiscal 2013.
Our cash flow provided by operating activities was
$190.7 million, an increase from $131.8 million in Fiscal
2013. Fiscal 2014’s cash flow was 157% of the Company’s
net income. Net sales increased 12% to a record $1.132
billion, up from $1.009 billion in Fiscal 2013.
Our Flight Support Group’s net sales increased 15% to
a record $762.8 million, up from $665.1 million in Fiscal
2013. This was fueled mostly by organic growth, as well
as some growth from a Fiscal 2013 acquisition. The
Flight Support Group’s operating income increased
12% to a record $136.5 million, up from $122.1 million
in Fiscal 2013.
The Electronic Technologies Group’s net sales increased
8% to a record $379.4 million, up from $350.0 million
in Fiscal 2013. Most of the increase came from a Fiscal
2013 acquisition, as well as some organic growth. The
Electronic Technologies Group’s operating income
increased 7% to a record $88.9 million, up from $83.1
million in Fiscal 2013.
Please see the accompanying financial statements for
details about our Company’s financial performance.
During Fiscal 2014, HEICO Corporation paid its 72nd
consecutive semi-annual cash dividend since 1979, and,
in December 2014, the Company’s Board of Directors
increased the semi-annual dividend by 17% over the
prior payment level payable on both classes of our
common shares.
The Electronic Technologies Group’s 3D Plus subsidiary
supplied mission critical components on the European
Space Agency’s Rosetta program, which successfully
landed a robotic probe on a comet for the first time
in history. Additionally, 3D Plus and the Electronic
Technologies Group’s VPT subsidiary each supplied
high-reliability electronic products for NASA’s successful
Orion launch in late 2014.
Strength in our commercial aviation markets, the
possibility of improvement in defense budgets and
lower oil prices leave us cautiously optimistic for 2015
and beyond. We will remain focused on growing HEICO
to maximize these opportunities.
HEICO is blessed to have an incomparable group
of Team Members who are dedicated to serving
our customers, their fellow Team Members and our
shareholders (who include most HEICO Team
Members). We credit and thank our Team Members
for the exemplary results borne by their efforts.
We suggest you read the Question and Answer session
which follows this letter to learn more about HEICO’s
2014 and some thoughts on our future.
As always, we thank our customers, our fellow share-
holders and our Board of Directors for their confidence
and support.
Sincerely,
M A N A G E M E N T ’ S M E S S A G E
Laurans A. MendelsonChairman & Chief Executive Officer
Eric A. MendelsonCo-President
Victor H. Mendelson Co-President

Q U E S T I O N S A N S W E R S
We are often asked the same or similar questions by investors,
Team Members and others during the year. Therefore, we
have been including a Question and Answer section in our Annual
Report for many years, and this year’s questions and answers are below:
Shown in the photo: seated, left to right, Thomas S. Irwin, Senior Executive
Vice President, Laurans A. Mendelson, Chairman and Chief Executive Officer;
standing, left to right, Victor H. Mendelson, Co-President, Joseph W. Pallot,
General Counsel, Carlos L. Macau, Jr., Executive Vice President, Chief Financial
Officer and Treasurer, Eric A. Mendelson, Co-President.
Q. What stood out for HEICO in 2014?
A. Overall, our commercial aviation businesses stood out among our companies. We attribute
this to their strong emphasis on product and service development (which is something we did
even when conditions were more difficult a few years ago) and growth in commercial aircraft
travel, along with greater commercial aircraft utilization. Some of our space operations were also
strong in Fiscal 2014 as a result of product development and customer relationships.
Q. What was most challenging for HEICO in 2014?
A. The continuing contraction in U.S. Defense spending was difficult for a few of our companies, even though
other HEICO defense-focused businesses performed admirably. Slower orders and some technical issues also
needed to be overcome at a newly acquired space company.
Q. Can you update us on HEICO’s acquisition approach?
A. We continue to seek high-quality acquisitions and our Flight Support Group completed a small purchase during
the year. Despite the fact that we remain very active in acquisition activities, we are very cautious about how
we deploy HEICO’s capital and will only buy businesses that we believe fit well with our financial, operational
and high-quality culture philosophies.
Q. How do you see the defense market outlook in the future?
A. Although we expect continued pressure on the U.S. defense budget in the near term, world affairs have started
to reverse some of those pressures. We expect the intermediate and longer term outlook for defense markets to
be healthy and we remain committed to them.
Q. What is HEICO’s strategy for growth in 2015 and beyond?
A. Our strategy is to do as we have historically done - - stay committed to our core markets with product and
service development, seek and make acquisitions, grow our market share, develop our Team Members and keep
our absolute commitment to quality.
H E I C O C O R P O R A T I O N / 3

Commercial air travel continues to grow with HEICO’s broad products and services offerings
found on many types of jetliners around the world.
C O M M E R C I A L A V I A T I O N
4 / H E I C O C O R P O R A T I O N
H E I C O C O R P O R A T I O N / 5
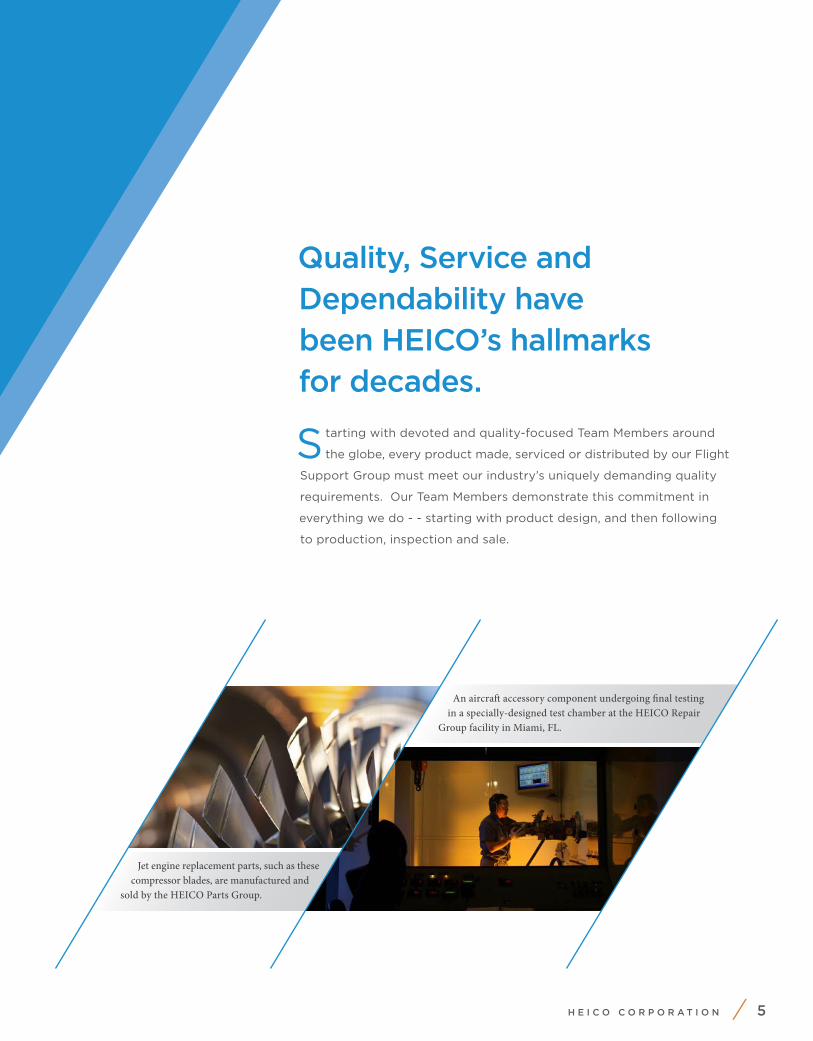
Quality, Service and Dependability have been HEICO’s hallmarks for decades.
Starting with devoted and quality-focused Team Members around
the globe, every product made, serviced or distributed by our Flight
Support Group must meet our industry’s uniquely demanding quality
requirements. Our Team Members demonstrate this commitment in
everything we do - - starting with product design, and then following
to production, inspection and sale.
An aircraft accessory component undergoing final testing in a specially-designed test chamber at the HEICO Repair
Group facility in Miami, FL.
Jet engine replacement parts, such as these compressor blades, are manufactured and
sold by the HEICO Parts Group.

The Flight Support Group’s distribution companies operate domestic and international facilities to serve
aviation and defense companies without delay.
6 / H E I C O C O R P O R A T I O N
H E I C O C O R P O R A T I O N / 7
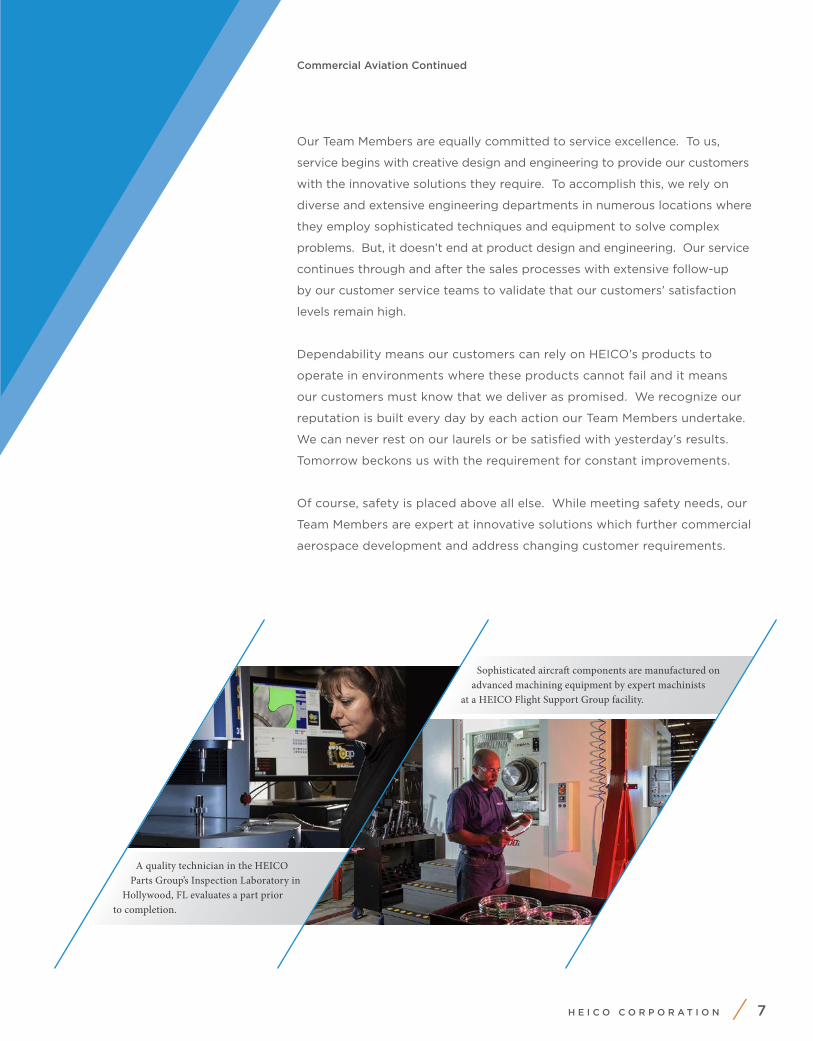
Our Team Members are equally committed to service excellence. To us,
service begins with creative design and engineering to provide our customers
with the innovative solutions they require. To accomplish this, we rely on
diverse and extensive engineering departments in numerous locations where
they employ sophisticated techniques and equipment to solve complex
problems. But, it doesn’t end at product design and engineering. Our service
continues through and after the sales processes with extensive follow-up
by our customer service teams to validate that our customers’ satisfaction
levels remain high.
Dependability means our customers can rely on HEICO’s products to
operate in environments where these products cannot fail and it means
our customers must know that we deliver as promised. We recognize our
reputation is built every day by each action our Team Members undertake.
We can never rest on our laurels or be satisfied with yesterday’s results.
Tomorrow beckons us with the requirement for constant improvements.
Of course, safety is placed above all else. While meeting safety needs, our
Team Members are expert at innovative solutions which further commercial
aerospace development and address changing customer requirements.
Sophisticated aircraft components are manufactured on advanced machining equipment by expert machinists
at a HEICO Flight Support Group facility.
A quality technician in the HEICO Parts Group’s Inspection Laboratory in
Hollywood, FL evaluates a part prior to completion.
Commercial Aviation Continued

S P A C E D E F E N S E
Multiple Electronic Technologies Group companies supply critical components
on the U.S. Air Force’s Global Positioning Satellite program, commonly known as “GPS.”
Above, a GPS satellite is successfully launched into space from Cape Canaveral, Florida in 2014.
8 / H E I C O C O R P O R A T I O N Photo courtesy of United Launch Alliance.

H E I C O C O R P O R A T I O N / 9
The Electronic Technologies Group’s products also operate in supremely
demanding environments where failure cannot be tolerated.
Numerous Electronic Technologies Group companies supply high-reliability
components utilized on communications, scientific, Earth-observation and
military satellites. These components include, among others, microwave
assemblies, power supplies, power converters, memory modules, frequency
converters, master local oscillators and connectors. Our uncommonly talented
engineering and design teams are called upon to develop exacting products
and solutions for remarkably sophisticated customers. Our Team Members
succeed at this every day.
Similarly, the Electronic Technologies Group’s companies that supply defense
products provide an extensive variety of components ranging from Laser
Rangefinder Receivers, power supplies, amplifiers, connectors, infrared cameras
and testing equipment, power converters and many other products for mostly
airborne equipment. Knowing the life-and-death nature of the systems which
use our products heightens our focus. Our customers, which include govern-
ments, commercial satellite markets, major defense contractors and others,
count on the Electronic Technologies Group’s companies for inventive designs.
The Electronic Technologies Group’s 3D Plus subsidiary’s memory modules, similar to the ones shown below, were
used in the European Space Agency’s Rosetta comet landing program and NASA’s Orion program.
HEICO subsidiaries, in both the Electronic Technologies Group and
the Flight Support Group, supply mission-critical components on
various missile defense programs, such as the Patriot missile system
shown above.

1 0 / H E I C O C O R P O R A T I O N
O T H E R E X P A N D I N G E L E C T R O N I C S M A R K E T S
A proprietary power supply system for radiology applications designed and built by the Electronic
Technologies Group’s EMD Technologies subsidiary is shown above. In addition to the Company’s
traditional aerospace and defense markets, multiple Electronic Technologies Group companies also serve the
growing medical equipment markets.

H E I C O C O R P O R A T I O N / 1 1
HEICO’s Electronic Technologies companies also serve the commercial
aviation industry with emergency backup power supplies, power distribution
equipment, underwater locator beacons, wireless switches and controls, as
well as connectors and power controls. Commercial aviation requirements are
as exacting as the ones we must meet with our space and defense products.
The Electronic Technologies Group Companies that serve medical equipment
markets are also subject to stringent requirements, which is one of the many
reasons why our companies are perfectly positioned to meet customer needs
in this market. From power supplies that are used in medically-related lasers,
to large power generating systems used on X-ray, CT and radiation therapy
equipment, as well as high voltage cable assemblies, our Team Members work
to customer requirements and standards which demand perfection.
We also provide harsh environment and regulator-required electronic
components that are used in a variety of non-aerospace, defense or medical
applications. Among these are Electro-Magnetic and Radio Frequency
Interference shielding, high-voltage connectors, other connectors and power
supplies to meet rigorous operating environment standards. Some Electronic
Technologies Group Companies provide their products to multiple industries
and are on multiple platforms in those industries.
The Electronic Technologies Group’s VPT subsidiary is a leading designer and maker of mission-critical, hybrid power products. Below, a VPT
Team Member in Blacksburg, VA uses unique wire bonding equipment to create a hybrid DC-to-DC power converter.

1 2 / H E I C O C O R P O R A T I O N
2 0 1 4F I N A N C I A L S T A T E M E N T S
A N D O T H E R I N F O R M A T I O N
Selected Financial Data 13
Management’s Discussion and Analysis of Financial Condition and Results of Operations 14
Consolidated Balance Sheets 25
Consolidated Statements of Operations 26
Consolidated Statements of Comprehensive Income 27
Consolidated Statements of Shareholders’ Equity 28
Consolidated Statements of Cash Flows 30
Notes to Consolidated Financial Statements 31
Management’s Annual Report on Internal Control Over Financial Reporting and Executive Officer Certifications 59
Reports of Independent Registered Public Accounting Firm 60
Market for Company’s Common Equity and Related Stockholder Matters 62

H E I C O C O R P O R A T I O N
A N D S U B S I D I A R I E S
H E I C O C O R P O R A T I O N / 1 3
S E L E C T E D F I N A N C I A L D ATA
Year ended October 31, (1) 2014 2013 2012 2011 2010
(in thousands, except per share data)
Operating Data:Net sales $ 1,132,311 $ 1,008,757 $ 897,347 $ 764,891 $ 617,020Gross profit 398,312 371,181 327,436 274,441 222,347Selling, general and administrative expenses 194,924 187,591 164,142 136,010 113,174Operating income 203,388 (3) 183,590 163,294 138,431 (5) 109,173Interest expense 5,441 3,717 2,432 142 508Other income 625 888 313 64 390Net income attributable to HEICO 121,293 (3) 102,396 (4) 85,147 72,820 (5)(6) 54,938
Weighted average number of common shares outstanding (2)
Basic 66,463 66,298 65,861 65,050 64,126 Diluted 67,453 66,982 66,624 66,408 65,959
Per Share Data: (2)
Net income per share attributable to HEICO shareholders: Basic $ 1.82 (3) $ 1.54 (4) $ 1.29 $ 1.12 (5)(6) $ .86 Diluted 1.80 (3) 1.53 (4) 1.28 1.10 (5)(6) .83Cash dividends per share (2) .470 1.816 .086 .069 .055
Balance Sheet Data (as of October 31):Cash and cash equivalents $ 20,229 $ 15,499 $ 21,451 $ 17,500 $ 6,543Total assets 1,489,214 1,533,015 1,192,846 941,069 781,643Total debt (including current portion) 329,109 377,515 131,820 40,158 14,221Redeemable noncontrolling interests 39,966 59,218 67,166 65,430 55,048Total shareholders’ equity 774,619 723,235 719,759 620,154 554,826
(1) Results include the results of acquisitions from each respective effective date. See Note 2, Acquisitions, of the Notes to Consolidated Financial Statements for more information.
(2) All share and per share information has been adjusted retrospectively to reflect the 5-for-4 stock splits effected in October 2013 and April 2012, 2011 and 2010.
(3) Operating income was increased by a $28.1 million reduction in accrued contingent consideration related to a fiscal 2013 and a fiscal 2012 acquisition within the Electronic Technologies Group (“ETG”), partially offset by $15.0 million in impairment losses related to the write-down of certain intangible assets at the fiscal 2013 and fiscal 2012 acquisitions to their estimated fair values as well as lower than expected operating income at the fiscal 2013 acquired business, which in aggregate increased net income attributable to HEICO by $10.2 million, or $.15 per basic and diluted share. The reduction in the value of contingent consideration and $13.1 million of the impairment losses were recorded as a component of selling, general and administrative expenses, while the remaining impairment losses of $1.9 million were recorded as a component of cost of sales.
(4) Includes the aggregate tax benefit from an income tax credit for qualified research and development activities for the last ten months of fiscal 2012 recognized in fiscal 2013 upon the retroactive extension in January 2013 of the U.S. research and development tax credit and higher research and development tax credits recognized upon the filing of HEICO’s fiscal 2012 U.S. federal and state tax returns, which, net of expenses, increased net income attributable to HEICO by $1.8 million, or $.03 per basic and diluted share.
(5) Operating income was reduced by a net aggregate of $3.8 million due to $5.0 million in impairment losses related to the write-down of certain intangible assets within the ETG to their estimated fair values, partially offset by a $1.2 million reduction in accrued contingent consideration related to a prior year acquisition. Approximately $4.5 million of the impairment losses and the reduction in accrued contingent consideration were recorded as a component of selling, general and administrative expenses, while the remaining impairment losses of $.5 million were recorded as a component of cost of sales, which decreased net income attributable to HEICO by $2.4 million, or $.04 per basic and diluted share, in aggregate.
(6) Includes the aggregate tax benefit principally from state income apportionment updates and higher research and development tax credits recognized upon the filing of HEICO’s fiscal 2010 U.S. federal and state tax returns and amendments of certain prior year state tax returns as well as the benefit from an income tax credit for qualified research and development activities for the last ten months of fiscal 2010 recognized in fiscal 2011 upon the retroactive extension in December 2010 of the U.S. research and development tax credit, which, net of expenses, increased net income attributable to HEICO by $2.8 million, or $.04 per basic and diluted share, in aggregate.
H E I C O C O R P O R A T I O N
A N D S U B S I D I A R I E S
M A N A G E M E N T ’ S D I S C U S S I O N A N D A N A LY S I S O F F I N A N C I A L C O N D I T I O N A N D R E S U LT S O F O P E R AT I O N S
1 4 / H E I C O C O R P O R A T I O N
Overview
Our business is comprised of two operating segments, the Flight Support Group (“FSG”) and the Electronic Technologies Group (“ETG”).
The Flight Support Group consists of HEICO Aerospace Holdings Corp. (“HEICO Aerospace”), which is 80% owned, and HEICO Flight Support Corp., which is wholly owned, and their collective subsidiaries, which primarily:
• Designs, Manufactures, Repairs, Overhauls and Distributes Jet Engine and Aircraft Component Replacement Parts. The Flight Support Group designs, manufactures, repairs, overhauls and distributes jet engine and aircraft component replacement parts. The parts and services are approved by the Federal Aviation Administration (“FAA”). The Flight Support Group also manufactures and sells specialty parts as a subcontractor for aerospace and industrial original equipment manufacturers and the United States government. Additionally, the Flight Support Group is a leading supplier, distributor, and integrator of military aircraft parts and support services primarily to foreign military organizations allied with the United States and a leading manufacturer of advanced niche components and complex composite assemblies for commercial aviation, defense and space applications.
The Electronic Technologies Group consists of HEICO Electronic Technologies Corp. (“HEICO Electronic”) and its subsidiaries, which primarily:
• Designs and Manufactures Electronic, Microwave and Electro-Optical Equipment, High-Speed Interface Products, High Voltage Interconnection Devices and High Voltage Advanced Power Electronics. The Electronic Technologies Group designs, manufactures and sells various types of electronic, microwave and electro-optical equipment and components, including power supplies, laser rangefinder receivers, infrared simulation, calibration and testing equipment; power conversion products serving the high-reliability military, space and commercial avionics end-markets; underwater locator beacons used to locate data and voice recorders utilized on aircraft and marine vessels; electromagnetic interference shielding for commercial and military aircraft operators, traveling wave tube amplifiers and microwave power modules used in radar, electronic warfare, on-board jamming and countermeasure systems, electronics companies and telecommunication equipment suppliers; advanced high-technology interface products that link devices such as telemetry receivers, digital cameras, high resolution scanners, simulation systems and test sys-tems to computers; high voltage energy generators interconnection devices, cable assemblies and wire for the medical equipment, defense and other industrial markets; high frequency power delivery systems for the commercial sign industry; high voltage power supplies found in satellite communications, CT scanners and in medical and industrial x-ray systems; three-dimensional micro-electronic and stacked memory products that are principally integrated into larger subsystems equipping satellites and spacecraft; harsh environment connectivity products and custom molded cable assemblies; RF and microwave amplifiers, transmitters and receivers used to support military communications on unmanned aerial systems, other aircraft, helicopters and ground-based data/communications systems, wireless cabin control systems, solid state power distribution and management systems and fuel level sensing systems for business jets and for general aviation, as well as for the military/defense market and microwave modules, units and integrated sub-systems for commercial and military satellites.
Our results of operations during each of the past three fiscal years have been affected by a number of transactions. This discussion of our financial condition and results of operations should be read in conjunction with the Consolidated Financial Statements and Notes thereto included herein. All applicable share and per share information has been adjusted retrospectively to reflect the 5-for-4 stock splits effected in October 2013 and April 2012. See Note 1, Summary of Significant Accounting Policies – Stock Splits, of the Notes to Consolidated Financial Statements for additional information regarding these stock splits. For further information regarding the acquisitions discussed below, see Note 2, Acquisitions, of the Notes to Consolidated Financial Statements. Acquisitions are included in our results of operations from the effective dates of acquisition.
In June 2014, we acquired, through a subsidiary of HEICO Flight Support Corp., certain assets and liabilities of Quest Aviation Supply, Inc. (“Quest Aviation”). Quest Aviation is a niche supplier of parts to repair thrust reversers on various aircraft engines.
In October 2013, we acquired, through HEICO Electronic, all of the outstanding stock of Lucix Corporation (“Lucix”) in a trans-action carried out by means of a merger. Lucix is a leading designer and manufacturer of high performance, high reliability microwave modules, units, and integrated sub-systems for commercial and military satellites.
On May 31, 2013, we acquired, through HEICO Flight Support Corp., Reinhold Industries, Inc. (“Reinhold”) through the acquisition of all of the outstanding stock of Reinhold’s parent company in a transaction carried out by means of a merger. Reinhold is a leading manufacturer of advanced niche components and complex composite assemblies for commercial aviation, defense and space applications.

H E I C O C O R P O R A T I O N
A N D S U B S I D I A R I E S
M A N A G E M E N T ’ S D I S C U S S I O N A N D A N A LY S I S O F F I N A N C I A L C O N D I T I O N A N D R E S U LT S O F O P E R AT I O N S
H E I C O C O R P O R A T I O N / 1 5
In October 2012, we acquired, through HEICO Flight Support Corp., 80.1% of the assets and assumed certain liabilities of Action Research Corporation (“Action Research”). Action Research is an FAA-Approved Repair Station that has developed unique proprietary repairs that extend the lives of certain engine and airframe components. The remaining 19.9% interest continues to be owned by an existing member of Action Research’s management team. The purchase price of this acquisition was paid using cash provided by operating activities.
In August 2012, we acquired, through HEICO Flight Support Corp., 84% of the assets and assumed certain liabilities of CSI Aero-space, Inc. (“CSI Aerospace”). CSI Aerospace is a leading repair and overhaul provider of specialized components for airlines, military and other aerospace related organizations. The remaining 16% interest continues to be owned by certain members of CSI Aerospace’s management team.
In April 2012, we acquired, through HEICO Electronic, certain aerospace assets of Moritz Aerospace, Inc. (“Moritz Aerospace”) in an aerospace product line acquisition. The Moritz Aerospace product line designs and manufactures next generation wireless cabin control systems, solid state power distribution and management systems and fuel level sensing systems for business jets and for general aviation, as well as for the military/defense market segments. The purchase price of this acquisition was paid using cash provided by operating activities.
In March 2012, we acquired, through HEICO Electronic, the business and substantially all of the assets of Ramona Research, Inc. (“Ramona Research”). Ramona Research designs and manufactures RF and microwave amplifiers, transmitters and receivers primarily used to support military communications on unmanned aerial systems, other aircraft, helicopters and ground-based data/communica-tions systems.
On November 22, 2011, we acquired, through HEICO Electronic, Switchcraft, Inc. (“Switchcraft”) through the purchase of all of the stock of Switchcraft’s parent company, Switchcraft Holdco, Inc. Switchcraft is a leading designer and manufacturer of high performance, high reliability and harsh environment electronic connectors and other interconnect products.
Unless otherwise noted, the purchase price of each of the above referenced acquisitions was paid in cash principally using proceeds from our revolving credit facility. The aggregate cost paid in cash for acquisitions, including additional purchase consideration pay-ments, was $8.7 million, $222.6 million and $197.3 million in fiscal 2014, 2013 and 2012, respectively.
In February 2012, we acquired, through HEICO Aerospace, an additional 6.7% equity interest in one of our subsidiaries, which increased our ownership interest to 86.7%. In December 2012, we acquired the remaining 13.3% equity interest in the subsidiary.
In February 2014, we acquired the 20% noncontrolling interest held by Lufthansa Technik AG (“LHT”) in four of our existing subsidiaries principally operating in the specialty products and distribution businesses within HEICO Aerospace. For further informa-tion regarding this acquisition, see Note 8, Shareholder’s Equity, of the Notes to the Consolidated Financial Statements.
Critical Accounting Policies
We believe that the following are our most critical accounting policies, which require management to make judgments about matters that are inherently uncertain.
Assumptions utilized to determine fair value in connection with business combinations, contingent consideration arrangements and in goodwill and intangible assets impairment tests are highly judgmental. If there is a material change in such assumptions or if there is a material change in the conditions or circumstances influencing fair value, we could be required to recognize a material impairment charge.
Revenue Recognition Revenue from the sale of products and the rendering of services is recognized when title and risk of loss passes to the customer, which is generally at the time of shipment. Revenue from certain fixed price contracts for which costs can be dependably estimated is recognized on the percentage-of-completion method, measured by the percentage of costs incurred to date to estimated total costs for each contract. This method is used because management considers costs incurred to be the best available measure of progress on these contracts. Revisions in cost estimates as contracts progress have the effect of increasing or decreasing profits in the period of revision. Revisions in cost estimates may be caused by factors such as the price or availability of raw materials and component parts or variations in the amount of labor required and/or the materials necessary to meet customer specifications and requirements. Provisions for estimated losses on uncompleted contracts are made in the period in which such losses are determined. The percentage of our net sales recognized under the percentage-of-completion method was approximately 3%, 1% and 1% in fiscal 2014, 2013 and 2012, respectively. Changes in estimates pertaining to percentage-of-completion contracts did not have a material or significant effect on net income or net income per share in fiscal 2014, 2013 and 2012.

H E I C O C O R P O R A T I O N
A N D S U B S I D I A R I E S
M A N A G E M E N T ’ S D I S C U S S I O N A N D A N A LY S I S O F F I N A N C I A L C O N D I T I O N A N D R E S U LT S O F O P E R AT I O N S
1 6 / H E I C O C O R P O R A T I O N
For fixed price contracts in which costs cannot be dependably estimated, revenue is recognized on the completed-contract method. A contract is considered complete when all significant costs have been incurred or the item has been accepted by the customer. Progress billings and customer advances received on fixed price contracts accounted for under the completed-contract method are classified as a reduction to contract costs that are included in inventories, if any, and any remaining amount is included in accrued expenses and other current liabilities.
Valuation of Accounts Receivable The valuation of accounts receivable requires that we set up an allowance for estimated uncollectible accounts and record a corre-sponding charge to bad debt expense. We estimate uncollectible receivables based on such factors as our prior experience, our appraisal of a customer’s ability to pay, age of receivables outstanding and economic conditions within and outside of the aviation, defense, space, medical, telecommunications and electronics industries. Actual bad debt expense could differ from estimates made.
Valuation of Inventory Inventory is stated at the lower of cost or market, with cost being determined on the first-in, first-out or the average cost basis. Losses, if any, are recognized fully in the period when identified.
We periodically evaluate the carrying value of inventory, giving consideration to factors such as its physical condition, sales patterns and expected future demand in order to estimate the amount necessary to write down any slow moving, obsolete or damaged inventory. These estimates could vary significantly from actual amounts based upon future economic conditions, customer inventory levels, or competitive factors that were not foreseen or did not exist when the estimated write-downs were made.
In accordance with industry practice, all inventories are classified as a current asset including portions with long production cycles, some of which may not be realized within one year.
Business Combinations We allocate the purchase price of acquired entities to the underlying tangible and identifiable intangible assets acquired and liabilities and any noncontrolling interests assumed based on their estimated fair values, with any excess recorded as goodwill. Deter-mining the fair value of assets acquired and liabilities assumed requires management’s judgment and often involves the use of significant estimates and assumptions, including assumptions with respect to future cash inflows and outflows, discount rates, asset lives and market multiples, among other items. We determine the fair values of intangible assets acquired generally in consultation with third-party valuation advisors.
As part of the agreement to acquire certain subsidiaries, we may be obligated to pay contingent consideration should the acquired entity meet certain earnings objectives subsequent to the date of acquisition. As of the acquisition date, contingent consideration is recorded at fair value as determined through the use of a probability-based scenario analysis approach. Under this method, a set of discrete potential future subsidiary earnings is determined using internal estimates based on various revenue growth rate assumptions for each scenario. A probability of likelihood is then assigned to each discrete potential future earnings estimate and the resultant contingent consideration is calculated and discounted using a weighted average discount rate reflecting the credit risk of a market partici-pant. Subsequent to the acquisition date, the fair value of such contingent consideration is measured each reporting period and any changes are recorded within our Consolidated Statements of Operations. Changes in either the revenue growth rates, related earnings or the discount rate could result in a material change to the amount of contingent consideration accrued. As of October 31, 2014 and 2013, $1.2 million and $29.3 million of contingent consideration was accrued within our Consolidated Balance Sheets, respectively. During fiscal 2014, 2013 and 2012, such fair value measurement adjustments resulted in a net gain of $28.1 million, a net gain of $1.6 million and a loss of $.1 million, respectively. For further information regarding the adjustment above, see Note 7, Fair Value Measurements, of the Notes to Consolidated Financial Statements.
Valuation of Goodwill and Other Intangible Assets We test goodwill for impairment annually as of October 31, or more frequently if events or changes in circumstances indicate that the carrying amount of goodwill may not be fully recoverable. In evaluating the recoverability of goodwill, we compare the fair value of each of our reporting units to its carrying value to determine potential impairment. If the carrying value of a reporting unit exceeds its fair value, the implied fair value of that reporting unit’s goodwill is to be calculated and an impairment loss is recognized in the amount by which the carrying value of the reporting unit’s goodwill exceeds its implied fair value, if any. The fair values of our reporting units were determined using a weighted average of a market approach and an income approach. Under the market approach, fair values are estimated using published market multiples for comparable companies. We calculate fair values under the income approach by taking estimated future cash flows that are based on internal projections and other assumptions deemed reasonable by management and discounting them using an estimated weighted average cost of capital. Based on the annual goodwill impairment test as of October 31, 2014, 2013 and 2012, we determined there was no impairment of our goodwill. The fair value of each of our reporting units as of October 31, 2014 significantly exceeded its carrying value.

H E I C O C O R P O R A T I O N
A N D S U B S I D I A R I E S
M A N A G E M E N T ’ S D I S C U S S I O N A N D A N A LY S I S O F F I N A N C I A L C O N D I T I O N A N D R E S U LT S O F O P E R AT I O N S
H E I C O C O R P O R A T I O N / 1 7
We test each non-amortizing intangible asset (principally trade names) for impairment annually as of October 31, or more frequently if events or changes in circumstances indicate that the asset might be impaired. To derive the fair value of our trade names, we utilize an income approach, which relies upon management’s assumptions of royalty rates, projected revenues and discount rates. We also test each amortizing intangible asset for impairment if events or circumstances indicate that the asset might be impaired. The test consists of determining whether the carrying value of such assets will be recovered through undiscounted expected future cash flows. If the total of the undiscounted future cash flows is less than the carrying amount of those assets, we recognize an impairment loss based on the excess of the carrying amount over the fair value of the assets. The determination of fair value requires us to make a number of estimates, assumptions and judgments of such factors as projected revenues and earnings and discount rates. Based on the intangible impairment tests conducted, we recognized pre-tax impairment losses within the ETG during fiscal 2014 related to the write-down of certain customer relationships, non-amortizing trade names, and intellectual property of $11.2 million, $1.9 million and $1.9 million, respectively, to their estimated fair values. The impairment losses pertaining to customer relationships and non-amortizing trade names were recorded as a component of selling, general and administrative expenses in the Company’s Consolidated Statement of Operations and the impairment losses pertaining to intellectual property were recorded as a component of cost of sales. For additional information regarding the impairment losses discussed above, including the assumptions made when determining the asset’s fair value, see Note 7, Fair Value Measurements, of the Notes to Consolidated Financial Statements.
Results of Operations
The following table sets forth the results of our operations, net sales and operating income by segment and the percentage of net sales represented by the respective items in our Consolidated Statements of Operations (in thousands):
Year ended October 31, 2014 2013 2012
Net sales $ 1,132,311 $ 1,008,757 $ 897,347Cost of sales 733,999 637,576 569,911Selling, general and administrative expenses 194,924 187,591 164,142 Total operating costs and expenses 928,923 825,167 734,053 Operating income $ 203,388 $ 183,590 $ 163,294
Net sales by segment: Flight Support Group $ 762,801 $ 665,148 $ 570,325 Electronic Technologies Group 379,404 350,033 331,598 Intersegment sales (9,894) (6,424) (4,576) $ 1,132,311 $ 1,008,757 $ 897,347Operating income by segment: Flight Support Group $ 136,480 $ 122,058 $ 103,943 Electronic Technologies Group 88,914 83,063 77,438 Other, primarily corporate (22,006) (21,531) (18,087) $ 203,388 $ 183,590 $ 163,294 Net sales 100.0% 100.0% 100.0%Gross profit 35.2% 36.8% 36.5%Selling, general and administrative expenses 17.2% 18.6% 18.3%Operating income 18.0% 18.2% 18.2%Interest expense .5% .4% .3%Other income .1% .1% —%Income tax expense 5.3% 5.6% 6.1%Net income attributable to noncontrolling interests 1.5% 2.2% 2.4%Net income attributable to HEICO 10.7% 10.2% 9.5%

H E I C O C O R P O R A T I O N
A N D S U B S I D I A R I E S
M A N A G E M E N T ’ S D I S C U S S I O N A N D A N A LY S I S O F F I N A N C I A L C O N D I T I O N A N D R E S U LT S O F O P E R AT I O N S
1 8 / H E I C O C O R P O R A T I O N
Comparison of Fiscal 2014 to Fiscal 2013
Net Sales Our net sales in fiscal 2014 increased by 12% to a record $1,132.3 million, as compared to net sales of $1,008.8 million in fiscal 2013. The increase in net sales principally reflects an increase of $97.7 million (a 15% increase) to a record $762.8 million in net sales within the FSG as well as an increase of $29.4 million (an 8% increase) to a record $379.4 million in net sales within the ETG. The net sales increase in the FSG reflects organic growth of approximately 9% as well as additional net sales of $37.7 million from a fiscal 2013 acquisition. The organic growth in the FSG principally reflects new product offerings and favorable market conditions resulting in net sales increases of $58.6 million within our aftermarket replacement parts and repair and overhaul services product lines. The net sales increase in the ETG resulted from additional net sales of $23.5 million from a fiscal 2013 acquisition as well as organic growth of approximately 2%. The organic growth in the ETG principally reflects an increase in demand for certain space and aerospace products resulting in a $7.5 million and $2.1 million increase in net sales, respectively, partially offset by a decrease in demand for certain defense products resulting in a decrease in net sales of $3.4 million. Sales price changes were not a significant contributing factor to the FSG and ETG net sales growth in fiscal 2014.
Our net sales in fiscal 2014 and 2013 by market approximated 56% and 54%, respectively, from the commercial aviation industry, 26% and 26%, respectively, from the defense and space industries, and 18% and 20%, respectively, from other industrial markets including medical, electronics and telecommunications.
Gross Profit and Operating Expenses Our consolidated gross profit margin decreased to 35.2% in fiscal 2014 as compared to 36.8% in fiscal 2013 principally reflects a decrease of 4.2% in the ETG’s gross profit margin. The decrease in the ETG’s gross profit margin is mainly attributed to a less favorable product mix for certain of our space and defense products inclusive of the impact of the fiscal 2013 acquisition as well as a .5% impact from an impairment loss related to the write-down of a certain intangible asset to its estimated fair value. Total new product research and development expenses included within our consolidated cost of sales increased to $37.4 million in fiscal 2014 compared to $32.9 million in fiscal 2013.
Selling, general and administrative (“SG&A”) expenses were $194.9 million and $187.6 million in fiscal 2014 and 2013, respectively. The increase in SG&A expenses is principally attributable to additional costs to support the higher net sales volumes. During fiscal 2014, SG&A expenses were reduced by $15.0 million from the net impact of a $28.1 million decrease in the estimated fair value of accrued contingent consideration associated with the fiscal 2013 and a fiscal 2012 acquisition of the ETG that was partially offset by $13.1 million of impairment losses related to the write-down of certain intangible assets of the acquired entities to their estimated fair values. The reductions in accrued contingent consideration and impairment losses were principally due to less favorable projected market conditions for certain of the acquired entities’ space and defense products. See Note 7, Fair Value Measurements, for additional information regard-ing the contingent consideration arrangements and valuations thereof as well as further information pertaining to the measurement and recognition of the impairment losses associated with intangible assets.
SG&A expenses as a percentage of net sales decreased from 18.6% in fiscal 2013 to 17.2% in fiscal 2014 principally reflecting the previously mentioned net impact of fair value adjustments to accrued contingent consideration and intangible asset impairment losses.
Operating Income Operating income in fiscal 2014 increased by 11% to a record $203.4 million as compared to operating income of $183.6 million in fiscal 2013. The increase in operating income reflects a $14.4 million increase (a 12% increase) to a record $136.5 million in operating income of the FSG in fiscal 2014, up from $122.1 million in fiscal 2013 and a $5.8 million increase (a 7% increase) in operating income of the ETG to a record $88.9 million in fiscal 2014, up from $83.1 million in fiscal 2013. The increase in operating income of the FSG is principally attributed to the previously mentioned net sales growth. The increase in operating income of the ETG is attributable to the previously mentioned organic net sales growth and reductions in accrued contingent consideration partially offset by the less favorable product mix, impairment losses and lower than expected operating income from the fiscal 2013 acquisition.
Our consolidated operating income as a percentage of net sales decreased to 18.0% in fiscal 2014 from 18.2% in fiscal 2013. The decrease in consolidated operating income as a percentage of net sales reflects a reduction in the FSG’s operating income as a percentage of net sales from 18.4% in fiscal 2013 to 17.9% in fiscal 2014 and a reduction in the ETG’s operating income as a percentage of net sales from 23.7% in fiscal 2013 to 23.4% in fiscal 2014. The decrease in the FSG’s operating income as a percentage of net sales principally reflects a slightly lower gross profit margin as well as increases in certain SG&A expenses to support the higher net sales volumes. The decrease in the ETG’s operating income as a percentage of net sales is primarily attributed to the previously mentioned lower gross profit margin and impairment losses partially offset by the reductions in accrued contingent consideration.
Interest Expense Interest expense increased to $5.4 million in fiscal 2014 from $3.7 million in fiscal 2013. The increase was principally due to a higher weighted average balance outstanding under our revolving credit facility in fiscal 2014 associated with fiscal 2013 acquisitions and the acquisition of certain noncontrolling interests during fiscal 2014.

H E I C O C O R P O R A T I O N
A N D S U B S I D I A R I E S
M A N A G E M E N T ’ S D I S C U S S I O N A N D A N A LY S I S O F F I N A N C I A L C O N D I T I O N A N D R E S U LT S O F O P E R AT I O N S
H E I C O C O R P O R A T I O N / 1 9
Other Income Other income in fiscal 2014 and 2013 was not material.
Income Tax Expense Our effective tax rate in fiscal 2014 decreased to 30.1% from 31.1% in fiscal 2013. The decrease is principally attributed to the im-pact of a nontaxable reduction in accrued contingent consideration during fiscal 2014 associated with a fiscal 2013 acquisition acquired by means of a stock transaction. The aforementioned decrease in the effective tax rate was partially offset by lower U.S. federal research and development (“R&D”) tax credits recognized in fiscal 2014 due to the expiration of the U.S. federal R&D tax credit in December 2013 compared to fiscal 2013 during which the retroactive extension of the U.S. federal R&D tax credit in the first quarter resulted in twenty-two months of U.S. federal R&D tax credits recognized that year. Additionally, the decrease in the effective rate was partially offset by higher tax-exempt unrealized gains in the cash surrender values of life insurance policies related to the HEICO Corporation Leadership Compensation Plan (“LCP”) in fiscal 2013 compared to fiscal 2014. For a detailed analysis of the provision for income taxes, see Note 6, Income Taxes, of the Notes to Consolidated Financial Statements.
Net Income Attributable to Noncontrolling Interests Net income attributable to noncontrolling interests relates to the 20% noncontrolling interest held by LHT in HEICO Aerospace and the noncontrolling interests held by others in certain subsidiaries of the FSG and ETG. Net income attributable to noncontrolling interests was $17.5 million in fiscal 2014 compared to $22.2 million in fiscal 2013. The decrease principally reflects lower allocations of net income to noncontrolling interests in fiscal 2014 due to the acquisition of certain noncontrolling interests during the current year.
Net Income Attributable to HEICO Net income attributable to HEICO increased to a record $121.3 million, or $1.80 per diluted share, in fiscal 2014 from $102.4 million, or $1.53 per diluted share, in fiscal 2013, principally reflecting the previously mentioned increased operating income, lower allocation of net income to noncontrolling interests and the lower effective tax rate.
Outlook As we look ahead to fiscal 2015, we anticipate continued growth within the FSG’s aftermarket replacement parts and repair and overhaul services product lines partially offset by declines in demand for certain of our industrial products within our specialty products lines. Furthermore, we anticipate improved demand and moderate levels of growth within the ETG as compared to fiscal 2014. During fiscal 2015, we will continue our focus on developing new products and services, further market penetration, additional acquisition opportunities and maintaining our financial strength. Overall, we are targeting growth in fiscal 2015 full year net sales and net income over fiscal 2014 levels.
Comparison of Fiscal 2013 to Fiscal 2012
Net Sales Our net sales in fiscal 2013 increased by 12% to a record $1,008.8 million, as compared to net sales of $897.3 million in fiscal 2012. The increase in net sales reflects an increase of $94.8 million (a 17% increase) to a record $665.1 million within the FSG as well as an increase of $18.4 million (a 6% increase) to a record $350.0 million within the ETG. The net sales increase in the FSG reflects organic growth of approximately 9% as well as additional net sales of $42.3 million from the fiscal 2013 and 2012 acquisitions. The organic growth in the FSG principally reflects an increase in net sales from new product offerings and improving market conditions resulting in a $40.7 million increase in net sales within our aftermarket replacement parts and repair and overhaul services product lines and an $11.8 million increase in net sales within our specialty products lines. The net sales increase in the ETG reflects organic growth of approximately 3% as well as additional net sales of $8.0 million from fiscal 2013 and 2012 acquisitions. The organic growth in the ETG principally reflects increased demand for certain space and aerospace products resulting in a $12.2 million and $3.3 million increase in net sales from these product lines, respectively, partially offset by a decrease in demand for certain of our defense and medical products resulting in a $3.1 million and $1.9 million decrease in net sales from these product lines, respectively. Sales price changes were not a significant contributing factor to the FSG and ETG net sales growth for fiscal 2013.
Our net sales in fiscal 2013 and 2012 by market approximated 54% and 53%, respectively, from the commercial aviation industry, 26% and 26%, respectively, from the defense and space industries, and 20% and 21%, respectively, from other industrial markets including medical, electronics and telecommunications.
Gross Profit and Operating Expenses Our consolidated gross profit margin increased to 36.8% in fiscal 2013 as compared to 36.5% in fiscal 2012, principally reflecting a 1.4% and .1% increase in the ETG’s and FSG’s gross profit margin, respectively. The increase in the ETG’s gross profit margin is principally attributed to increased net sales and a more favorable product mix for certain of our space products partially offset by lower net sales and a less favorable product mix for certain of our defense products. Total new product research and development expenses included within our consolidated cost of sales increased to $32.9 million in fiscal 2013 compared to $30.4 million in fiscal 2012.

H E I C O C O R P O R A T I O N
A N D S U B S I D I A R I E S
M A N A G E M E N T ’ S D I S C U S S I O N A N D A N A LY S I S O F F I N A N C I A L C O N D I T I O N A N D R E S U LT S O F O P E R AT I O N S
2 0 / H E I C O C O R P O R A T I O N
SG&A expenses were $187.6 million and $164.1 million for fiscal 2013 and fiscal 2012, respectively. The increase in SG&A expenses reflects an increase of $18.5 million in general and administrative expenses principally attributed to an $8.9 million increase from the fiscal 2013 and 2012 acquired businesses and the remainder to support the higher net sales volumes including an increase in accrued performance awards based on the improved consolidated operating results. Additionally, the increase in SG&A expenses reflects an increase of $5.0 million in selling expenses of which $1.3 million pertains to the acquired businesses and the remainder is attributed to higher sales-related commissions and other costs from the nets sales growth. SG&A expenses as a percentage of net sales increased to 18.6% for fiscal 2013 as compared to 18.3% for fiscal 2012 principally reflecting the impact from the previously mentioned increase in accrued performance awards.
Operating Income Operating income for fiscal 2013 increased by 12% to a record $183.6 million as compared to operating income of $163.3 million for fiscal 2012. The increase in operating income reflects an $18.1 million increase (a 17% increase) to a record $122.1 million in operating income of the FSG for fiscal 2013, up from $103.9 million for fiscal 2012 and a $5.6 million increase (a 7% increase) in operating income of the ETG to a record $83.1 million for fiscal 2013, up from $77.4 million for fiscal 2012, partially offset by a $3.4 million increase in corporate expenses. The increase in the operating income of the FSG is principally attributed to the previously mentioned net sales growth. The increase in the operating income of the ETG reflects the previously mentioned improved gross profit margin and net sales growth.
As a percentage of net sales, our consolidated operating income was 18.2% for both fiscal 2013 and fiscal 2012 despite operating margin improvements of .3% and .2% within the ETG and FSG, respectively, as the FSG, and its lower operating income as a percentage of net sales relative to the ETG, accounted for a larger percentage of our consolidated net sales for fiscal 2013 as compared to fiscal 2012. The ETG’s operating income as a percentage of net sales increased from 23.4% in fiscal 2012 to 23.7% in fiscal 2013 reflecting the previously mentioned improved gross profit margin partially offset by an increase in SG&A expenses as a percentage of net sales. The FSG’s operating income as a percentage of net sales increased from 18.2% in fiscal 2012 to 18.4% in fiscal 2013 reflecting the previously mentioned improved gross profit margin.
Interest Expense Interest expense increased to $3.7 million in fiscal 2013, up from $2.4 million in fiscal 2012. The increase was principally due to a higher weighted average balance outstanding under our revolving credit facility during fiscal 2013 associated with fiscal 2013 and 2012 acquisitions and borrowings made to fund an aggregate $1.76 per share cash dividend paid in December 2012.
Other Income Other income in fiscal 2013 and 2012 was not material.
Income Tax Expense Our effective tax rate in fiscal 2013 decreased to 31.1% from 33.8% in fiscal 2012. The decrease is partially due to higher research and development tax credits recognized in fiscal 2013 resulting from the retroactive extension of the U.S. federal R&D tax credit in January 2013 to cover a two-year period from January 1, 2012 to December 31, 2013. The decrease in the effective tax rate was also attributed to the benefit from higher tax-exempt unrealized gains in the cash surrender values of life insurance policies related to the LCP and a larger income tax deduction recognized for the special and extraordinary cash dividend paid in December 2012 to participants of the HEICO Savings and Investment Plan holding HEICO common stock. For a detailed analysis of the provision for income taxes, see Note 6, Income Taxes, of the Notes to Consolidated Financial Statements.
Net Income Attributable to Noncontrolling Interests Net income attributable to noncontrolling interests relates to the 20% noncontrolling interest held by LHT in HEICO Aerospace and the noncontrolling interests held by others in certain subsidiaries of the FSG and ETG. Net income attributable to noncontrolling interests was $22.2 million in fiscal 2013 compared to $21.5 million in fiscal 2012. The increase for fiscal 2013 reflects the aggregate impact of higher earnings of FSG and ETG subsidiaries in which noncontrolling interests are held, partially offset by our purchases of certain noncontrolling interests during fiscal 2013 and 2012 resulting in lower allocations of net income to noncontrolling interests.
Net Income Attributable to HEICO Net income attributable to HEICO increased to a record $102.4 million, or $1.53 per diluted share, in fiscal 2013, up from $85.1 million, or $1.28 per diluted share, in fiscal 2012, principally reflecting the previously mentioned increased operating income and the favorable tax benefits recognized during fiscal 2013.
Inflation
We have generally experienced increases in our costs of labor, materials and services consistent with overall rates of inflation. The impact of such increases on net income attributable to HEICO has been generally minimized by efforts to lower costs through manufac-turing efficiencies and cost reductions.

H E I C O C O R P O R A T I O N
A N D S U B S I D I A R I E S
M A N A G E M E N T ’ S D I S C U S S I O N A N D A N A LY S I S O F F I N A N C I A L C O N D I T I O N A N D R E S U LT S O F O P E R AT I O N S
H E I C O C O R P O R A T I O N / 2 1
Liquidity and Capital Resources
Our capitalization was as follows (in thousands):
As of October 31, 2014 2013
Total debt (including current portion) $ 329,109 $ 377,515Less: Cash and cash equivalents 20,229 15,499Net debt (total debt less cash and cash equivalents) 308,880 362,016Shareholders’ equity 774,619 723,235Total capitalization (debt plus equity) 1,103,728 1,100,750Net debt to shareholders’ equity 40% 50%Total debt to total capitalization 30% 34%
Our principal uses of cash include acquisitions, distributions to noncontrolling interests, cash dividends, capital expenditures and working capital needs. Capital expenditures in fiscal 2015 are anticipated to approximate $25 million. We finance our activities primari-ly from our operating and financing activities, including borrowings under our revolving credit facility.
As of December 16, 2014, we had approximately $480 million of unused committed availability under the terms of our revolving credit facility. Based on our current outlook, we believe that our net cash provided by operating activities and available borrowings under our revolving credit facility will be sufficient to fund cash requirements for at least the next twelve months.
Operating Activities Net cash provided by operating activities was $190.7 million in fiscal 2014 and consisted primarily of net income from consolidated operations of $138.8 million, depreciation and amortization of $47.8 million (a non-cash item), a decrease in working capital (current assets minus current liabilities) of $16.0 million and impairment of intangible assets totaling $15.0 million (a non-cash item), partially offset by a $28.1 million decrease in accrued contingent consideration (a non-cash item) associated with prior year acquisitions. Net cash provided by operating activities increased by $58.9 million in fiscal 2014 from $131.8 million in fiscal 2013. The increase in net cash provided by operating activities in fiscal 2014 is principally due to a $47.0 million decrease in working capital and increases of $15.0 million, $14.2 million and $11.0 million in impairment of intangible assets, net income from consolidated operations and depreciation and amortization, respectively, partially offset by a $26.5 million decrease in accrued contingent consideration associated with a fiscal 2013 and a fiscal 2012 acquisition. The $47.0 million decrease in working capital principally reflects a $23.6 million decrease in accounts receivable due to improved timeliness of cash collections and a $15.0 million decrease in inventories resulting from more efficient inventory management at our subsidiaries.
Net cash provided by operating activities was $131.8 million in fiscal 2013 and consisted primarily of net income from consolidated operations of $124.6 million and depreciation and amortization of $36.8 million, partially offset by an increase in working capital of $30.9 million. The increase in working capital was principally attributed to increases in accounts receivable and inventory as a result of net sales growth during the period. Net cash provided by operating activities decreased by $6.7 million in fiscal 2013 from $138.6 million in fiscal 2012. The decrease in cash provided by operating activities is principally attributed to a $27.8 million increase in working capital reflecting increases in accounts receivable of $10.8 million and inventories of $7.4 million as a result of net sales growth, a $9.0 million decrease in income taxes payable due to the timing of estimated payments and a $3.0 million increase in our deferred tax benefit, partially offset by a $17.9 million and $6.1 million increase in net income from consolidated operations and depreciation and amortization, respectively.
Net cash provided by operating activities was $138.6 million in fiscal 2012, principally reflecting net income from consolidated operations of $106.7 million, depreciation and amortization of $30.7 million and stock option compensation expense of $3.9 million, partially offset by an increase in working capital of $3.1 million. The increase in working capital of $3.1 million primarily reflects a build in inventory levels to meet customer demand and increased accounts receivable related to higher net sales in fiscal 2012, partially offset by the timing of certain payments pertaining to fiscal 2012 accruals and payables.
Investing Activities Net cash used in investing activities during the three-year fiscal period ended October 31, 2014 primarily relates to several acquisitions aggregating $428.6 million, including $8.7 million in fiscal 2014, $222.6 million in fiscal 2013, and $197.3 million in fiscal 2012. Further details on acquisitions may be found under the caption “Overview” and Note 2, Acquisitions, of the Notes to Consolidated Financial Statements. Capital expenditures aggregated $50.0 million over the last three fiscal years, primarily reflecting the expansion, replacement and betterment of existing production facilities and capabilities, which were generally funded using cash provided by operating activities.

H E I C O C O R P O R A T I O N
A N D S U B S I D I A R I E S
M A N A G E M E N T ’ S D I S C U S S I O N A N D A N A LY S I S O F F I N A N C I A L C O N D I T I O N A N D R E S U LT S O F O P E R AT I O N S
2 2 / H E I C O C O R P O R A T I O N
Financing Activities Net cash used in financing activities was $160.1 million in fiscal 2014 as compared to net cash provided by financing activities of $103.2 million and $78.4 million in fiscal 2013 and 2012, respectively. During the three-year fiscal period ended October 31, 2014, we borrowed an aggregate $675.0 million under our revolving credit facility including borrowings of $112.0 million in fiscal 2014, $372.0 million in fiscal 2013, and $191.0 million in fiscal 2012. The aforementioned borrowings were principally to fund acquisitions, special and extraordinary cash dividends paid in fiscal 2014 and 2013, and distributions to noncontrolling interests. Further details on acqui-sitions may be under the caption “Overview” and Note 2, Acquisitions, of the Notes to Consolidated Financial Statements. Payments on the revolving credit facility aggregated $385.0 million over the last three fiscal years, including $159.0 million in fiscal 2014, $126.0 million in fiscal 2013, and $100.0 million in fiscal 2012. For the three-year fiscal period ended October 31, 2014, we paid an aggregate $157.3 million in cash dividends, including $31.2 million in fiscal 2014, $120.4 million in fiscal 2013, and $5.7 million in fiscal 2012 and we also made distributions to noncontrolling interests aggregating $95.9 million. Net cash (used in) provided by financing activities also includes the presentation of an excess tax benefit from stock option exercises aggregating $17.3 million for the three-year fiscal period ended October 31, 2014.
In December 2011, we entered into a $670 million Revolving Credit Agreement (“Credit Facility”) with a bank syndicate. The Cred-it Facility may be used for our working capital and general corporate needs, including capital expenditures and to finance acquisitions. In November 2013, we entered into an amendment to extend the maturity date of the Credit Facility by one year to December 2018 and to increase the aggregate committed principal amount to $800 million. Furthermore, the amendment includes a feature that will allow us to increase the aggregate committed principal amount by an additional $200 million to become a $1.0 billion facility through increased commitments from existing lenders or the addition of new lenders.
Advances under the Credit Facility accrue interest at our choice of the “Base Rate” or the London Interbank Offered Rate (“LIBOR”) plus applicable margins (based on the Company’s ratio of total funded debt to earnings before interest, taxes, depreciation and amortization, noncontrolling interests and non-cash charges, or “leverage ratio”). The Base Rate is the highest of (i) the Prime Rate; (ii) the Federal Funds rate plus .50% per annum; and (iii) the Adjusted LIBO Rate determined on a daily basis for an Interest Period of one month plus 1.00% per annum, as such capitalized terms are defined in the Credit Facility. The applicable margins for LIBOR-based borrowings range from .75% to 2.25%. The applicable margins for Base Rate borrowings range from 0% to 1.25%. A fee is charged on the amount of the unused commitment ranging from .125% to .35% (depending on our leverage ratio). The Credit Facility also includes a $50 million sublimit for borrowings made in foreign currencies, letters of credit and swingline borrowings. Outstanding principal, accrued and unpaid interest and other amounts payable under the Credit Facility may be accelerated upon an event of default, as such events are described in the Credit Facility. The Credit Facility is unsecured and contains covenants that restrict the amount of certain payments, including dividends, and require, among other things, the maintenance of a total leverage ratio, a senior leverage ratio and a fixed charge coverage ratio. In the event our leverage ratio exceeds a specified level, the Credit Facility would become secured by the capital stock owned in substantially all of our subsidiaries. As of October 31, 2014, we were in compliance with all financial and nonfinancial covenants. See Note 5, Long-Term Debt, of the Notes to Consolidated Financial Statements for further information regarding the Credit Facility.
H E I C O C O R P O R A T I O N
A N D S U B S I D I A R I E S
M A N A G E M E N T ’ S D I S C U S S I O N A N D A N A LY S I S O F F I N A N C I A L C O N D I T I O N A N D R E S U LT S O F O P E R AT I O N S
H E I C O C O R P O R A T I O N / 2 3
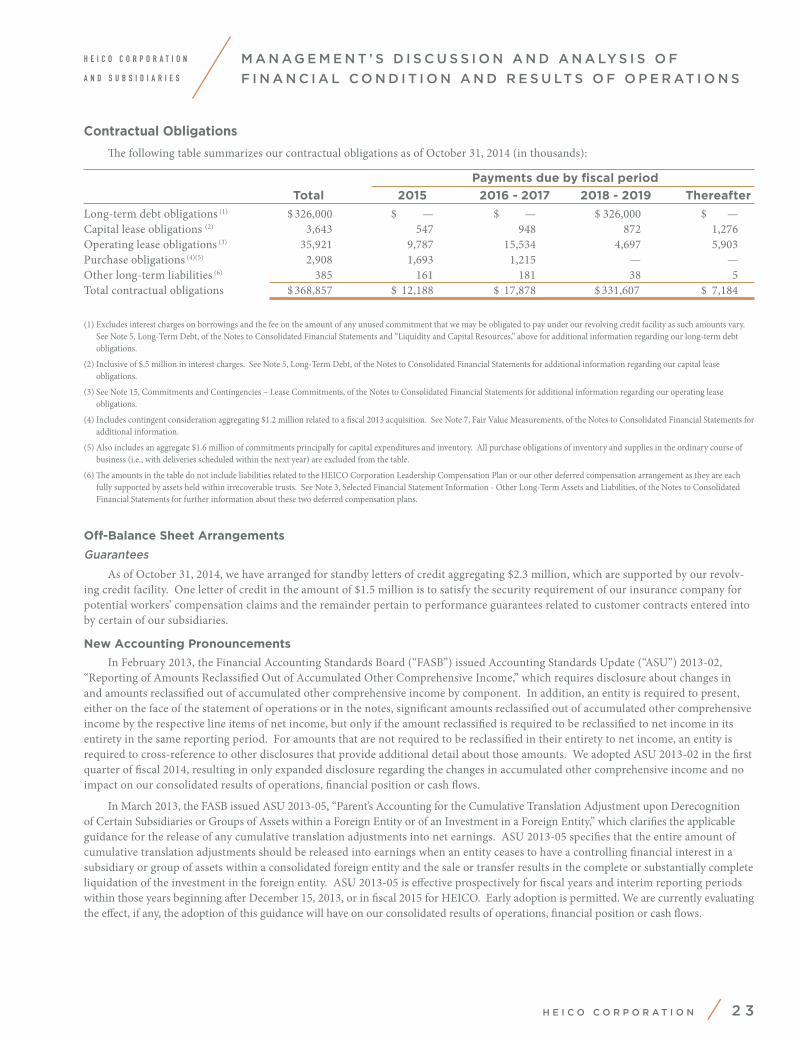
Contractual Obligations
The following table summarizes our contractual obligations as of October 31, 2014 (in thousands):
Payments due by fiscal period
Total 2015 2016 - 2017 2018 - 2019 Thereafter
Long-term debt obligations (1) $ 326,000 $ — $ — $ 326,000 $ —Capital lease obligations (2) 3,643 547 948 872 1,276Operating lease obligations (3) 35,921 9,787 15,534 4,697 5,903Purchase obligations (4)(5) 2,908 1,693 1,215 — —Other long-term liabilities (6) 385 161 181 38 5Total contractual obligations $ 368,857 $ 12,188 $ 17,878 $ 331,607 $ 7,184
(1) Excludes interest charges on borrowings and the fee on the amount of any unused commitment that we may be obligated to pay under our revolving credit facility as such amounts vary. See Note 5, Long-Term Debt, of the Notes to Consolidated Financial Statements and “Liquidity and Capital Resources,” above for additional information regarding our long-term debt obligations.
(2) Inclusive of $.5 million in interest charges. See Note 5, Long-Term Debt, of the Notes to Consolidated Financial Statements for additional information regarding our capital lease obligations.
(3) See Note 15, Commitments and Contingencies – Lease Commitments, of the Notes to Consolidated Financial Statements for additional information regarding our operating lease obligations.
(4) Includes contingent consideration aggregating $1.2 million related to a fiscal 2013 acquisition. See Note 7, Fair Value Measurements, of the Notes to Consolidated Financial Statements for additional information.
(5) Also includes an aggregate $1.6 million of commitments principally for capital expenditures and inventory. All purchase obligations of inventory and supplies in the ordinary course of business (i.e., with deliveries scheduled within the next year) are excluded from the table.
(6) The amounts in the table do not include liabilities related to the HEICO Corporation Leadership Compensation Plan or our other deferred compensation arrangement as they are each fully supported by assets held within irrecoverable trusts. See Note 3, Selected Financial Statement Information - Other Long-Term Assets and Liabilities, of the Notes to Consolidated Financial Statements for further information about these two deferred compensation plans.
Off-Balance Sheet Arrangements
Guarantees As of October 31, 2014, we have arranged for standby letters of credit aggregating $2.3 million, which are supported by our revolv-ing credit facility. One letter of credit in the amount of $1.5 million is to satisfy the security requirement of our insurance company for potential workers’ compensation claims and the remainder pertain to performance guarantees related to customer contracts entered into by certain of our subsidiaries.
New Accounting Pronouncements
In February 2013, the Financial Accounting Standards Board (“FASB”) issued Accounting Standards Update (“ASU”) 2013-02, “Reporting of Amounts Reclassified Out of Accumulated Other Comprehensive Income,” which requires disclosure about changes in and amounts reclassified out of accumulated other comprehensive income by component. In addition, an entity is required to present, either on the face of the statement of operations or in the notes, significant amounts reclassified out of accumulated other comprehensive income by the respective line items of net income, but only if the amount reclassified is required to be reclassified to net income in its entirety in the same reporting period. For amounts that are not required to be reclassified in their entirety to net income, an entity is required to cross-reference to other disclosures that provide additional detail about those amounts. We adopted ASU 2013-02 in the first quarter of fiscal 2014, resulting in only expanded disclosure regarding the changes in accumulated other comprehensive income and no impact on our consolidated results of operations, financial position or cash flows.
In March 2013, the FASB issued ASU 2013-05, “Parent’s Accounting for the Cumulative Translation Adjustment upon Derecognition of Certain Subsidiaries or Groups of Assets within a Foreign Entity or of an Investment in a Foreign Entity,” which clarifies the applicable guidance for the release of any cumulative translation adjustments into net earnings. ASU 2013-05 specifies that the entire amount of cumulative translation adjustments should be released into earnings when an entity ceases to have a controlling financial interest in a subsidiary or group of assets within a consolidated foreign entity and the sale or transfer results in the complete or substantially complete liquidation of the investment in the foreign entity. ASU 2013-05 is effective prospectively for fiscal years and interim reporting periods within those years beginning after December 15, 2013, or in fiscal 2015 for HEICO. Early adoption is permitted. We are currently evaluating the effect, if any, the adoption of this guidance will have on our consolidated results of operations, financial position or cash flows.

H E I C O C O R P O R A T I O N
A N D S U B S I D I A R I E S
M A N A G E M E N T ’ S D I S C U S S I O N A N D A N A LY S I S O F F I N A N C I A L C O N D I T I O N A N D R E S U LT S O F O P E R AT I O N S
2 4 / H E I C O C O R P O R A T I O N
In May 2014, the FASB issued ASU 2014-09, “Revenue from Contracts with Customers,” which provides a comprehensive new revenue recognition model that will supersede nearly all existing revenue recognition guidance. Under ASU 2014-09, an entity will recognize revenue when it transfers promised goods or services to a customer at an amount that reflects the consideration it expects to receive in exchange for those goods or services. The guidance also requires additional disclosure about the nature, amount, timing and uncertainty of revenue and cash flows arising from customer contracts. ASU 2014-09 is effective for fiscal years and interim reporting periods within those years beginning after December 15, 2016, or in fiscal 2018 for HEICO. Early adoption is not permitted. ASU 2014-09 shall be applied either retrospectively to each prior reporting period presented or retrospectively with the cumulative effect of initially applying ASU 2014-09 recognized at the date of initial application. We are currently evaluating which transition method we will elect and the effect the adoption of this guidance will have on our consolidated results of operations, financial position or cash flows.
Forward-Looking Statements
Certain statements in this report constitute “forward-looking statements” within the meaning of the Private Securities Litigation Reform Act of 1995. All statements contained herein that are not clearly historical in nature may be forward-looking and the words “expect,” “anticipate,” “believe,” “estimate” and similar expressions are generally intended to identify forward-looking statements. Any forward-looking statement contained herein, in press releases, written statements or other documents filed with the Securities and Exchange Commission or in communications and discussions with investors and analysts in the normal course of business through meetings, phone calls and conference calls, concerning our operations, economic performance and financial condition are subject to risks, uncertainties and contingencies. We have based these forward-looking statements on our current expectations and projections about future events. All forward-looking statements involve risks and uncertainties, many of which are beyond our control, which may cause actual results, performance or achievements to differ materially from anticipated results, performance or achievements. Also, forward-looking statements are based upon management’s estimates of fair values and of future costs, using currently available informa-tion. Therefore, actual results may differ materially from those expressed or implied in those statements. Factors that could cause such differences include:
• Lower demand for commercial air travel or airline fleet changes or airline purchasing decisions, which could cause lower demand for our goods and services;
• Product development or product specification costs and requirements, which could cause an increase to our costs to complete contracts;
• Governmental and regulatory demands, export policies and restrictions, reductions in defense, space or homeland security spending by U.S. and/or foreign customers or competition from existing and new competitors, which could reduce our sales;
• Our ability to introduce new products and product pricing levels, which could reduce our sales or sales growth;
• Product development difficulties, which could increase our product development costs and delay sales; and
• Our ability to make acquisitions and achieve operating synergies from acquired businesses, customer credit risk, interest and income tax rates and economic conditions within and outside of the aviation, defense, space, medical, telecommunications and electronics industries, which could negatively impact our costs and revenues; and defense budget cuts, which could reduce our defense-related revenue.
We undertake no obligation to publicly update or revise any forward-looking statement, whether as a result of new information, future events or otherwise, except to the extent required by applicable law.
QUANTITATIVE AND QUALITATIVE DISCLOSURES ABOUT MARKET RISK
The primary market risk to which we have exposure is interest rate risk, mainly related to our revolving credit facility, which has variable interest rates. Interest rate risk associated with our variable rate debt is the potential increase in interest expense from an increase in interest rates. Based on our aggregate outstanding variable rate debt balance of $326 million as of October 31, 2014, a hypothetical 10% increase in interest rates would not have a material effect on our results of operations, financial position or cash flows.
We maintain a portion of our cash and cash equivalents in financial instruments with original maturities of three months or less. These financial instruments are subject to interest rate risk and will decline in value if interest rates increase. Due to the short duration of these financial instruments, a hypothetical 10% increase in interest rates as of October 31, 2014 would not have a material effect on our results of operations, financial position or cash flows.
We are also exposed to foreign currency exchange rate fluctuations on the United States dollar value of our foreign currency denominated transactions, which are principally in Euros, Canadian dollars and British pounds sterling. A hypothetical 10% weakening in the exchange rate of the Euro, Canadian dollar or British pound sterling to the United States dollar as of October 31, 2014 would not have a material effect on our results of operations, financial position or cash flows.

H E I C O C O R P O R A T I O N
A N D S U B S I D I A R I E S
H E I C O C O R P O R A T I O N / 2 5
C O N S O L I D AT E D B A L A N C E S H E E T S(in thousands, except per share data)
As of October 31, 2014 2013
ASSETSCurrent assets: Cash and cash equivalents $ 20,229 $ 15,499 Accounts receivable, net 149,669 157,022 Inventories, net 218,042 218,893 Prepaid expenses and other current assets 8,868 17,022 Deferred income taxes 34,485 33,036 Total current assets 431,293 441,472 Property, plant and equipment, net 93,865 97,737 Goodwill 686,271 688,489 Intangible assets, net 200,810 241,558 Deferred income taxes 1,063 1,791 Other assets 75,912 61,968 Total assets $ 1,489,214 $ 1,533,015 LIABILITIES AND EQUITYCurrent liabilities: Current maturities of long-term debt $ 418 $ 697 Trade accounts payable 57,157 54,855 Accrued expenses and other current liabilities 92,578 105,734 Income taxes payable 2,067 — Total current liabilities 152,220 161,286 Long-term debt, net of current maturities 328,691 376,818 Deferred income taxes 111,429 128,482 Other long-term liabilities 82,289 83,976 Total liabilities 674,629 750,562
Commitments and contingencies (Notes 2 and 15)
Redeemable noncontrolling interests (Note 11) 39,966 59,218
Shareholders’ equity: Preferred Stock, $.01 par value per share; 10,000 shares authorized; 300 shares designated as Series B Junior Participating Preferred Stock and 300 shares designated as Series C Junior Participating Preferred Stock; none issued — — Common Stock, $.01 par value per share; 75,000 shares authorized; 26,847 and 26,790 shares issued and outstanding 268 268 Class A Common Stock, $.01 par value per share; 75,000 shares authorized; 39,699 and 39,586 shares issued and outstanding 397 396 Capital in excess of par value 269,351 255,889 Deferred compensation obligation 1,138 1,138 HEICO stock held by irrevocable trust (1,138) (1,138) Accumulated other comprehensive (loss) income (8,289) 144 Retained earnings 437,757 349,649 Total HEICO shareholders’ equity 699,484 606,346 Noncontrolling interests 75,135 116,889 Total shareholders’ equity 774,619 723,235 Total liabilities and equity $ 1,489,214 $ 1,533,015
The accompanying notes are an integral part of these consolidated financial statements.

H E I C O C O R P O R A T I O N
A N D S U B S I D I A R I E S
2 6 / H E I C O C O R P O R A T I O N
C O N S O L I D AT E D S TAT E M E N T S O F O P E R AT I O N S(in thousands, except per share data)
Year ended October 31, 2014 2013 2012
Net sales $ 1,132,311 $ 1,008,757 $ 897,347
Operating costs and expenses: Cost of sales 733,999 637,576 569,911 Selling, general and administrative expenses 194,924 187,591 164,142
Total operating costs and expenses 928,923 825,167 734,053
Operating income 203,388 183,590 163,294
Interest expense (5,441) (3,717) (2,432)Other income 625 888 313
Income before income taxes and noncontrolling interests 198,572 180,761 161,175
Income tax expense 59,800 56,200 54,500
Net income from consolidated operations 138,772 124,561 106,675
Less: Net income attributable to noncontrolling interests 17,479 22,165 21,528
Net income attributable to HEICO $ 121,293 $ 102,396 $ 85,147
Net income per share attributable to HEICO shareholders (Note 13): Basic $ 1.82 $ 1.54 $ 1.29 Diluted $ 1.80 $ 1.53 $ 1.28
Weighted average number of common shares outstanding: Basic 66,463 66,298 65,861 Diluted 67,453 66,982 66,624
The accompanying notes are an integral part of these consolidated financial statements.

H E I C O C O R P O R A T I O N
A N D S U B S I D I A R I E S
H E I C O C O R P O R A T I O N / 2 7
C O N S O L I D AT E D S TAT E M E N T S O F C O M P R E H E N S I V E I N C O M E(in thousands)
Year ended October 31, 2014 2013 2012
Net income from consolidated operations $ 138,772 $ 124,561 $ 106,675Other comprehensive (loss) income: Foreign currency translation adjustments (7,882) 3,128 (6,457) Unrealized (loss) gain on pension benefit obligation, net of tax (551) 590 —Total other comprehensive (loss) income (8,433) 3,718 (6,457)Comprehensive income from consolidated operations 130,339 128,279 100,218Less: Comprehensive income attributable to noncontrolling interests 17,479 22,165 21,528Comprehensive income attributable to HEICO $ 112,860 $ 106,114 $ 78,690
The accompanying notes are an integral part of these consolidated financial statements.

H E I C O C O R P O R A T I O N
A N D S U B S I D I A R I E S
2 8 / H E I C O C O R P O R A T I O N
CO N S O L I DAT E D S TAT E M E N T S O F S H A R E H O L D E R S ’ E Q U I T Y(in thousands, except per share data)
HEICO Shareholders’ Equity
HEICO Stock Accumulated Redeemable Class A Capital in Deferred Held by Other Total Noncontrolling Common Common Excess of Compensation Irrevocable Comprehensive Retained Noncontrolling Shareholders’ Interests Stock Stock Par Value Obligation Trust Income (Loss) Earnings Interests Equity
Balances as of October 31, 2013 $ 59,218 $ 268 $ 396 $ 255,889 $ 1,138 ($ 1,138) $ 144 $ 349,649 $ 116,889 $ 723,235Comprehensive income (loss) 5,313 — — — — — (8,433) 121,293 12,166 125,026Cash dividends ($.47 per share) — — — — — — — (31,215) — (31,215)Issuance of common stock to HEICO Savings and Investment Plan — — — 5,504 — — — — — 5,504Share-based compensation expense — — 1 7,425 — — — — — 7,426Proceeds from stock option exercises — — — 708 — — — — — 708Tax benefit from stock option exercises — — — 93 — — — — — 93Redemptions of common stock related to share-based compensation — — — (273) — — — — — (273)Distributions to noncontrolling interests (5,908) — — — — — — — (73,304) (73,304)Acquisitions of noncontrolling interests (1,243) — — — — — — — — —Reclassification of redeemable noncontrolling interests to noncontrolling interests (19,383) — — — — — — — 19,383 19,383Adjustments to redemption amount of redeemable noncontrolling interests 1,969 — — — — — — (1,969) — (1,969)Other — — — 5 — — — (1) 1 5 Balances as of October 31, 2014 $ 39,966 $ 268 $ 397 $ 269,351 $ 1,138 ($ 1,138) ($ 8,289) $ 437,757 $ 75,135 $ 774,619
Balances as of October 31, 2012 $ 67,166 $ 213 $ 315 $ 244,632 $ 823 ($ 823) ($ 3,572) $ 375,085 $ 103,086 $ 719,759Comprehensive income 8,386 — — — — — 3,718 102,396 13,779 119,893Cash dividends ($1.816 per share) — — — — — — — (120,361) — (120,361)Five-for-four common stock split — 54 79 (133) — — — (17) — (17)Issuance of common stock to HEICO Savings and Investment Plan — — — 2,985 — — — — — 2,985Share-based compensation expense — — — 5,117 — — — — — 5,117Proceeds from stock option exercises — 1 2 460 — — — — — 463Tax benefit from stock option exercises — — — 5,191 — — — — — 5,191Redemptions of common stock related to share-based compensation — — — (2,364) — — — — — (2,364)Distributions to noncontrolling interests (7,579) — — — — — — — — —Acquisitions of noncontrolling interests (16,610) — — — — — — — — —Adjustments to redemption amount of redeemable noncontrolling interests 7,454 — — — — — — (7,454) — (7,454)Deferred compensation obligation — — — — 315 (315) — — — —Other 401 — — 1 — — (2) — 24 23Balances as of October 31, 2013 $ 59,218 $ 268 $ 396 $ 255,889 $ 1,138 ($ 1,138) $ 144 $ 349,649 $ 116,889 $ 723,235
Balances as of October 31, 2011 $ 65,430 $ 171 $ 250 $ 226,120 $ 522 ($ 522) $ 3,033 $ 299,497 $ 91,083 $ 620,154Comprehensive income (loss) 9,526 — — — — — (6,457) 85,147 12,002 90,692Cash dividends ($.086 per share) — — — — — — — (5,689) — (5,689)Five-for-four common stock split — 42 63 (105) — — — (16) — (16)Issuance of common stock to HEICO Savings and Investment Plan — — — 982 — — — — — 982Share-based compensation expense — — — 3,948 — — — — — 3,948Proceeds from stock option exercises — — 2 831 — — — — — 833Tax benefit from stock option exercises — — — 13,164 — — — — — 13,164Redemptions of common stock related to share-based compensation — — — (307) — — — — — (307)Distributions to noncontrolling interests (9,090) — — — — — — — — —Acquisitions of noncontrolling interests (7,616) — — — — — — — — —Adjustments to redemption amount of redeemable noncontrolling interests 3,775 — — — — — — (3,775) — (3,775)Noncontrolling interests assumed related to acquisitions 3,918 — — — — — — — — —Deferred compensation obligation — — — — 301 (301) — — — —Other 1,223 — — (1) — — (148) (79) 1 (227)Balances as of October 31, 2012 $ 67,166 $ 213 $ 315 $ 244,632 $ 823 ($ 823) ($ 3,572) $ 375,085 $ 103,086 $ 719,759
The accompanying notes are an integral part of these consolidated financial statements.

H E I C O C O R P O R A T I O N / 2 9
HEICO Shareholders’ Equity
HEICO Stock Accumulated Redeemable Class A Capital in Deferred Held by Other Total Noncontrolling Common Common Excess of Compensation Irrevocable Comprehensive Retained Noncontrolling Shareholders’ Interests Stock Stock Par Value Obligation Trust Income (Loss) Earnings Interests Equity
Balances as of October 31, 2013 $ 59,218 $ 268 $ 396 $ 255,889 $ 1,138 ($ 1,138) $ 144 $ 349,649 $ 116,889 $ 723,235Comprehensive income (loss) 5,313 — — — — — (8,433) 121,293 12,166 125,026Cash dividends ($.47 per share) — — — — — — — (31,215) — (31,215)Issuance of common stock to HEICO Savings and Investment Plan — — — 5,504 — — — — — 5,504Share-based compensation expense — — 1 7,425 — — — — — 7,426Proceeds from stock option exercises — — — 708 — — — — — 708Tax benefit from stock option exercises — — — 93 — — — — — 93Redemptions of common stock related to share-based compensation — — — (273) — — — — — (273)Distributions to noncontrolling interests (5,908) — — — — — — — (73,304) (73,304)Acquisitions of noncontrolling interests (1,243) — — — — — — — — —Reclassification of redeemable noncontrolling interests to noncontrolling interests (19,383) — — — — — — — 19,383 19,383Adjustments to redemption amount of redeemable noncontrolling interests 1,969 — — — — — — (1,969) — (1,969)Other — — — 5 — — — (1) 1 5 Balances as of October 31, 2014 $ 39,966 $ 268 $ 397 $ 269,351 $ 1,138 ($ 1,138) ($ 8,289) $ 437,757 $ 75,135 $ 774,619
Balances as of October 31, 2012 $ 67,166 $ 213 $ 315 $ 244,632 $ 823 ($ 823) ($ 3,572) $ 375,085 $ 103,086 $ 719,759Comprehensive income 8,386 — — — — — 3,718 102,396 13,779 119,893Cash dividends ($1.816 per share) — — — — — — — (120,361) — (120,361)Five-for-four common stock split — 54 79 (133) — — — (17) — (17)Issuance of common stock to HEICO Savings and Investment Plan — — — 2,985 — — — — — 2,985Share-based compensation expense — — — 5,117 — — — — — 5,117Proceeds from stock option exercises — 1 2 460 — — — — — 463Tax benefit from stock option exercises — — — 5,191 — — — — — 5,191Redemptions of common stock related to share-based compensation — — — (2,364) — — — — — (2,364)Distributions to noncontrolling interests (7,579) — — — — — — — — —Acquisitions of noncontrolling interests (16,610) — — — — — — — — —Adjustments to redemption amount of redeemable noncontrolling interests 7,454 — — — — — — (7,454) — (7,454)Deferred compensation obligation — — — — 315 (315) — — — —Other 401 — — 1 — — (2) — 24 23Balances as of October 31, 2013 $ 59,218 $ 268 $ 396 $ 255,889 $ 1,138 ($ 1,138) $ 144 $ 349,649 $ 116,889 $ 723,235
Balances as of October 31, 2011 $ 65,430 $ 171 $ 250 $ 226,120 $ 522 ($ 522) $ 3,033 $ 299,497 $ 91,083 $ 620,154Comprehensive income (loss) 9,526 — — — — — (6,457) 85,147 12,002 90,692Cash dividends ($.086 per share) — — — — — — — (5,689) — (5,689)Five-for-four common stock split — 42 63 (105) — — — (16) — (16)Issuance of common stock to HEICO Savings and Investment Plan — — — 982 — — — — — 982Share-based compensation expense — — — 3,948 — — — — — 3,948Proceeds from stock option exercises — — 2 831 — — — — — 833Tax benefit from stock option exercises — — — 13,164 — — — — — 13,164Redemptions of common stock related to share-based compensation — — — (307) — — — — — (307)Distributions to noncontrolling interests (9,090) — — — — — — — — —Acquisitions of noncontrolling interests (7,616) — — — — — — — — —Adjustments to redemption amount of redeemable noncontrolling interests 3,775 — — — — — — (3,775) — (3,775)Noncontrolling interests assumed related to acquisitions 3,918 — — — — — — — — —Deferred compensation obligation — — — — 301 (301) — — — —Other 1,223 — — (1) — — (148) (79) 1 (227)Balances as of October 31, 2012 $ 67,166 $ 213 $ 315 $ 244,632 $ 823 ($ 823) ($ 3,572) $ 375,085 $ 103,086 $ 719,759
The accompanying notes are an integral part of these consolidated financial statements.

H E I C O C O R P O R A T I O N
A N D S U B S I D I A R I E S
3 0 / H E I C O C O R P O R A T I O N
C O N S O L I D AT E D S TAT E M E N T S O F C A S H F L O W S(in thousands)
Year ended October 31, 2014 2013 2012
Operating Activities: Net income from consolidated operations $ 138,772 $ 124,561 $ 106,675 Adjustments to reconcile net income from consolidated operations to net cash provided by operating activities: Depreciation and amortization 47,757 36,790 30,656 Impairment of intangible assets 15,000 — — Share-based compensation expense 6,426 5,117 3,948 Employer contributions to HEICO Savings and Investment Plan 6,302 2,985 982 Tax benefit from stock option exercises 93 5,191 13,164 Excess tax benefit from stock option exercises (93) (5,126) (12,110) Deferred income tax benefit (16,745) (5,785) (2,834) (Decrease) increase in accrued contingent consideration (28,126) (1,640) 119 Changes in operating assets and liabilities, net of acquisitions: Decrease (increase) in accounts receivable 6,999 (16,585) (5,782) Decrease (increase) in inventories 126 (14,877) (7,484) Decrease (increase) in prepaid expenses and other current assets 8,033 (4,918) (1,072) Increase (decrease) in trade accounts payable 2,511 (23) 4,269 (Decrease) increase in accrued expenses and other current liabilities (3,090) 12,766 5,182 Increase (decrease) in income taxes payable 1,462 (7,273) 1,759 Other long-term assets and liabilities, net 5,262 653 1,113 Net cash provided by operating activities 190,689 131,836 138,585
Investing Activities: Acquisitions, net of cash acquired (8,737) (222,638) (197,285) Capital expenditures (16,410) (18,328) (15,262) Other (40) (342) (161) Net cash used in investing activities (25,187) (241,308) (212,708)
Financing Activities: Borrowings on revolving credit facility 112,000 372,000 191,000 Payments on revolving credit facility (159,000) (126,000) (100,000) Distributions to noncontrolling interests (79,212) (7,579) (9,090) Cash dividends paid (31,215) (120,361) (5,689) Acquisitions of noncontrolling interests (1,243) (16,610) (7,616) Revolving credit facility issuance costs (767) (570) (3,028) Redemptions of common stock related to share-based compensation (273) (2,364) (307) Payment of contingent consideration — (601) — Excess tax benefit from stock option exercises 93 5,126 12,110 Proceeds from stock option exercises 708 463 833 Other (1,206) (296) 214 Net cash (used in) provided by financing activities (160,115) 103,208 78,427
Effect of exchange rate changes on cash (657) 312 (353)
Net increase (decrease) in cash and cash equivalents 4,730 (5,952) 3,951Cash and cash equivalents at beginning of year 15,499 21,451 17,500Cash and cash equivalents at end of year $ 20,229 $ 15,499 $ 21,451
The accompanying notes are an integral part of these consolidated financial statements.
H E I C O C O R P O R A T I O N
A N D S U B S I D I A R I E S
H E I C O C O R P O R A T I O N / 3 1
NOTE 1. SUMMARY OF SIGNIFICANT ACCOUNTING POLICIES
Nature of Business
HEICO Corporation, through its principal subsidiaries HEICO Aerospace Holdings Corp. (“HEICO Aerospace”), HEICO Flight Support Corp. and HEICO Electronic Technologies Corp. (“HEICO Electronic”) and their subsidiaries (collectively, the “Company”), is principally engaged in the design, manufacture and sale of aerospace, defense and electronic related products and services throughout the United States and internationally. The Company’s customer base is primarily the aviation, defense, space, medical, telecommunica-tions and electronics industries.
Basis of Presentation
The Company has two operating segments: the Flight Support Group (“FSG”), consisting of HEICO Aerospace and HEICO Flight Support Corp. and their collective subsidiaries; and the Electronic Technologies Group (“ETG”), consisting of HEICO Electronic and its subsidiaries.
The consolidated financial statements include the accounts of HEICO Corporation and its subsidiaries, all of which are wholly owned except for HEICO Aerospace, which is 20% owned by Lufthansa Technik AG (“LHT”), the technical services subsidiary of Lufthansa German Airlines. In addition, HEICO Aerospace consolidates two subsidiaries which are 80.1% and 82.3% owned, respective-ly, and a joint venture, which is 84% owned. Also, HEICO Flight Support Corp. consolidates three subsidiaries which are 80.1%, 80.1%, and 84% owned, respectively. Furthermore, HEICO Electronic consolidates three subsidiaries, which are 80.1%, 82.5%, and 95.9% owned, respectively, and a wholly owned subsidiary of HEICO Electronic consolidates a subsidiary which is 78% owned. See Note 11, Redeemable Noncontrolling Interests. All intercompany balances and transactions are eliminated.
Stock Splits
In September 2013 and March 2012, the Company’s Board of Directors declared a 5-for-4 stock split on both classes of the Com-pany’s common stock. The stock splits were effected as of October 23, 2013 and April 25, 2012, respectively, in the form of a 25% stock dividend distributed to shareholders of record as of October 11, 2013 and April 13, 2012, respectively. All applicable share and per share information has been adjusted retrospectively to give effect to the 5-for-4 stock splits.
Use of Estimates and Assumptions
The preparation of financial statements in conformity with accounting principles generally accepted in the United States of America requires management to make estimates and assumptions that affect the reported amounts of assets and liabilities and disclosure of contingent assets and liabilities as of the date of the financial statements and the reported amounts of revenue and expenses during the reporting period. Actual results could differ from those estimates.
Cash and Cash Equivalents
For purposes of the consolidated financial statements, the Company considers all highly liquid investments such as U.S. Treasury bills and money market funds with an original maturity of three months or less at the time of purchase to be cash equivalents.
Accounts Receivable
Accounts receivable consist of amounts billed and currently due from customers and unbilled costs and estimated earnings related to revenue from certain fixed price contracts recognized on the percentage-of-completion method that have been recognized for accounting purposes, but not yet billed to customers. The valuation of accounts receivable requires that the Company set up an allow-ance for estimated uncollectible accounts and record a corresponding charge to bad debt expense. The Company estimates uncollectible receivables based on such factors as its prior experience, its appraisal of a customer’s ability to pay, age of receivables outstanding and economic conditions within and outside of the aviation, defense, space, medical, telecommunications and electronics industries.
Concentrations of Credit Risk
Financial instruments that potentially subject the Company to concentrations of credit risk consist principally of temporary cash investments and trade accounts receivable. The Company places its temporary cash investments with high credit quality financial institutions and limits the amount of credit exposure to any one financial institution. Concentrations of credit risk with respect to trade receivables are limited due to the large number of customers comprising the Company’s customer base and their dispersion across many different geographical regions. The Company performs ongoing credit evaluations of its customers, but does not generally require collateral to support customer receivables.
Inventory
Inventory is stated at the lower of cost or market, with cost being determined on the first-in, first-out or the average cost basis. Losses, if any, are recognized fully in the period when identified.
N O T E S T O C O N S O L I D AT E D F I N A N C I A L S TAT E M E N T S

H E I C O C O R P O R A T I O N
A N D S U B S I D I A R I E S
3 2 / H E I C O C O R P O R A T I O N
N O T E S T O C O N S O L I D AT E D F I N A N C I A L S TAT E M E N T S
The Company periodically evaluates the carrying value of inventory, giving consideration to factors such as its physical condition, sales patterns and expected future demand in order to estimate the amount necessary to write down any slow moving, obsolete or damaged inventory. These estimates could vary significantly from actual amounts based upon future economic conditions, customer inventory levels or competitive factors that were not foreseen or did not exist when the estimated write-downs were made. In accordance with industry practice, all inventories are classified as a current asset including portions with long production cycles, some of which may not be realized within one year.
Property, Plant and Equipment
Property, plant and equipment is recorded at cost. Depreciation and amortization is generally provided on the straight-line method over the estimated useful lives of the various assets. The Company’s property, plant and equipment is depreciated over the following estimated useful lives:
Buildings and improvements . . . . . . . . . . . . . . . . . . . . . . . .10 to 40 years Leasehold improvements . . . . . . . . . . . . . . . . . . . . . . . . . . . .2 to 20 years Machinery and equipment . . . . . . . . . . . . . . . . . . . . . . . . . . .3 to 10 years Tooling . . . . . . . . . . . . . . . . . . . . . . . . . . . . . . . . . . . . . . . . . . .2 to 5 years
The costs of major additions and improvements are capitalized. Leasehold improvements are amortized over the shorter of the leasehold improvement’s useful life or the lease term. Repairs and maintenance costs are expensed as incurred. Upon disposition, the asset’s cost and related accumulated depreciation are removed from the accounts and any resulting gain or loss is reflected within earnings.
Capital Leases
Assets acquired under capital leases are recorded at the lower of the fair value of the asset or the present value of the future minimum lease payments, excluding that portion of the payments representing executory costs. The discount rate used in determining the present value of the minimum lease payments is the lower of the rate implicit in the lease or the Company’s incremental borrowing rate. Assets under capital leases are included in property, plant and equipment and are depreciated over the shorter of the lease term or the useful life of the leased asset. Lease payments under capital leases are recognized as a reduction of the capital lease obligation and as interest expense.
Business Combinations
The Company allocates the purchase price of acquired entities to the underlying tangible and identifiable intangible assets acquired and liabilities and any noncontrolling interests assumed based on their estimated fair values, with any excess recorded as goodwill. The operating results of acquired businesses are included in the Company’s results of operations beginning as of their effective acquisition dates. Acquisition costs are generally expensed as incurred and were not material in fiscal 2014, 2013 or 2012.
For contingent consideration arrangements, a liability is recognized at fair value as of the acquisition date with subsequent fair value adjustments recorded in operations. Information regarding additional contingent purchase consideration may be found in Note 2, Acquisitions and Note 7, Fair Value Measurements.
Goodwill and Other Intangible Assets
The Company tests goodwill for impairment annually as of October 31, or more frequently if events or changes in circumstances indicate that the carrying amount of goodwill may not be fully recoverable. In evaluating the recoverability of goodwill, the Company compares the fair value of each of its reporting units to its carrying value to determine potential impairment. If the carrying value of a reporting unit exceeds its fair value, the implied fair value of that reporting unit’s goodwill is to be calculated and an impairment loss is recognized in the amount by which the carrying value of the reporting unit’s goodwill exceeds its implied fair value, if any. The fair values of the Company’s reporting units are determined by using a weighted average of a market approach and an income approach. Under the market approach, fair values are estimated using published market multiples for comparable companies. The Company calculates fair values under the income approach by taking estimated future cash flows that are based on internal projections and other assumptions deemed reasonable by management and discounting them using an estimated weighted average cost of capital.
The Company’s intangible assets not subject to amortization consist principally of its trade names. The Company’s intangible assets subject to amortization are amortized on the straight-line method (except for certain customer relationships amortized on an accelerated method) over the following estimated useful lives:
Customer relationships . . . . . . . . . . . . . . . . . . . . . . . . . . . . . .6 to 10 years Intellectual property . . . . . . . . . . . . . . . . . . . . . . . . . . . . . . . .6 to 15 years Licenses . . . . . . . . . . . . . . . . . . . . . . . . . . . . . . . . . . . . . . . . . .10 to 17 years Non-compete agreements . . . . . . . . . . . . . . . . . . . . . . . . . . . .2 to 7 years Patents . . . . . . . . . . . . . . . . . . . . . . . . . . . . . . . . . . . . . . . . . . . .5 to 20 years Trade names . . . . . . . . . . . . . . . . . . . . . . . . . . . . . . . . . . . . . . .5 to 10 years

H E I C O C O R P O R A T I O N
A N D S U B S I D I A R I E S
H E I C O C O R P O R A T I O N / 3 3
N O T E S T O C O N S O L I D AT E D F I N A N C I A L S TAT E M E N T S
Amortization expense of intellectual property, licenses and patents is recorded as a component of cost of sales, and amortization expense of customer relationships, non-compete agreements and trade names is recorded as a component of selling, general and administrative expenses in the Company’s Consolidated Statements of Operations. The Company tests each non-amortizing intangible asset for impairment annually as of October 31, or more frequently if events or changes in circumstances indicate that the asset might be impaired. To derive the fair value of its trade names, the Company utilizes an income approach, which relies upon management’s assumptions of royalty rates, projected revenues and discount rates. The Company also tests each amortizing intangible asset for impairment if events or circumstances indicate that the asset might be impaired. The test consists of determining whether the carrying value of such assets will be recovered through undiscounted expected future cash flows. If the total of the undiscounted future cash flows is less than the carrying amount of those assets, the Company recognizes an impairment loss based on the excess of the carrying amount over the fair value of the assets. The determination of fair value requires us to make a number of estimates, assumptions and judgments of such factors as projected revenues and earnings and discount rates.
Investments
Investments are stated at fair value based on quoted market prices. Investments that are intended to be held for less than one year are included within prepaid expenses and other current assets in the Company’s Consolidated Balance Sheets, while those intended to be held for longer than one year are classified within other assets. Unrealized gains or losses associated with available-for-sale securities are reported net of tax within other comprehensive income in shareholders’ equity. Unrealized gains or losses associated with trading securities are recorded as a component of other income in the Company’s Consolidated Statements of Operations.
Customer Rebates and Credits
The Company records accrued customer rebates and credits as a component of accrued expenses and other current liabilities in the Company’s Consolidated Balance Sheets. These amounts generally relate to discounts negotiated with customers as part of certain sales contracts that are usually tied to sales volume thresholds. The Company accrues customer rebates and credits as a reduction within net sales as the revenue is recognized based on the estimated level of discount rate expected to be earned by each customer over the life of the contract period (generally one year). Accrued customer rebates and credits are monitored by management and discount levels are updated at least quarterly.
Product Warranties
Product warranty liabilities are estimated at the time of shipment and recorded as a component of accrued expenses and other current liabilities in the Company’s Consolidated Balance Sheets. The amount recognized is based on historical claims experience.
Defined Benefit Pension Plan
In connection with a fiscal 2013 acquisition, the Company assumed a frozen qualified defined benefit pension plan (the “Plan”). The Plan’s benefits are based on employee compensation and years of service. However, since the Plan was closed to new participants effective December 31, 2004, the accrued benefit for Plan participants was fixed as of the date of acquisition. The Company uses an actuarial valuation to determine the projected benefit obligation of the Plan and records the difference between the fair value of the Plan’s assets and the projected benefit obligation as of October 31 in its Consolidated Balance Sheets. Additionally, any actuarial gain or loss that arises during a fiscal year that is not recognized as a component of net periodic pension income or expense is recorded as a component of other comprehensive income or (loss), net of tax. See Note 10, Employee Retirement Plans, for additional information and disclosures about the Plan.
Revenue Recognition
Revenue from the sale of products and the rendering of services is recognized when title and risk of loss passes to the customer, which is generally at the time of shipment. Revenue from the rendering of services represented less than 10% of consolidated net sales for all periods presented. Revenue from certain fixed price contracts for which costs can be dependably estimated is recognized on the percentage-of-completion method, measured by the percentage of costs incurred to date to estimated total costs for each contract. The percentage of the Company’s net sales recognized under the percentage-of-completion method was approximately 3%, 1% and 1% in fiscal 2014, 2013 and 2012, respectively. Contract costs include all direct material and labor costs and those indirect costs related to contract performance, such as indirect labor, supplies, tools, repairs and depreciation costs. Selling, general and administrative costs are charged to expense as incurred.
Revisions in cost estimates as contracts progress have the effect of increasing or decreasing profits in the period of revision. Pro-visions for estimated losses on uncompleted contracts are made in the period in which such losses are determined. Variations in actual labor performance, changes to estimated profitability, and final contract settlements may result in revisions to cost estimates and are recognized in income in the period in which the revisions are determined. Changes in estimates pertaining to percentage-of-completion contracts did not have a material effect on net income from consolidated operations in fiscal 2014, 2013 or 2012.

H E I C O C O R P O R A T I O N
A N D S U B S I D I A R I E S
3 4 / H E I C O C O R P O R A T I O N
N O T E S T O C O N S O L I D AT E D F I N A N C I A L S TAT E M E N T S
The asset, “costs and estimated earnings in excess of billings” on uncompleted percentage-of-completion contracts, included in accounts receivable, represents revenue recognized in excess of amounts billed. The liability, “billings in excess of costs and estimated earnings,” included in accrued expenses and other current liabilities, represents billings in excess of revenue recognized on contracts accounted for under the percentage-of-completion method. Billings are made based on the completion of certain milestones as provided for in the contracts.
For fixed price contracts in which costs cannot be dependably estimated, revenue is recognized on the completed-contract method. A contract is considered complete when all significant costs have been incurred or the item has been accepted by the customer. Progress billings and customer advances (“billings to date”) received on fixed price contracts accounted for under the completed-contract method are classified as a reduction to contracts in process (a component of inventories), if any, and any remaining amount is included in accrued expenses and other current liabilities.
Stock-Based Compensation
The Company records compensation expense associated with stock options in its Consolidated Statements of Operations based on the grant date fair value of those awards. The fair value of each stock option on the date of grant is estimated using the Black-Scholes pricing model based on certain valuation assumptions. Expected volatilities are based on the Company’s historical stock prices over the contractual terms of the options and other factors. The risk-free interest rates used are based on the published U.S. Treasury yield curve in effect at the time of the grant for instruments with a similar life. The dividend yield reflects the Company’s expected dividend yield at the date of grant. The expected life represents the period that the stock options are expected to be outstanding, taking into consideration the contractual terms of the options and employee historical exercise behavior. The Company generally recognizes stock option compensation expense ratably over the award’s vesting period.
Income Taxes
Income tax expense includes United States and foreign income taxes, plus the provision for United States taxes on undistributed earnings of foreign subsidiaries not deemed to be permanently invested. Deferred income taxes are provided on elements of income that are recognized for financial accounting purposes in periods different from periods recognized for income tax purposes.
The Company accounts for uncertainty in income taxes and evaluates tax positions utilizing a two-step process. The first step is to determine whether it is more-likely-than-not that a tax position will be sustained upon examination based on the technical merits of the position. The second step is to measure the benefit to be recorded from tax positions that meet the more-likely-than-not recognition threshold by determining the largest amount of tax benefit that is greater than 50 percent likely of being realized upon ultimate settlement and recognizing that amount in the financial statements. The Company’s policy is to recognize interest and penalties related to income tax matters as a component of income tax expense. Further information regarding income taxes can be found in Note 6, Income Taxes.
Redeemable Noncontrolling Interests
As further detailed in Note 11, Redeemable Noncontrolling Interests, the holders of equity interests in certain of the Company’s subsidiaries have rights (“Put Rights”) that require the Company to provide cash consideration for their equity interests (the “Redemp-tion Amount”) at fair value or at a formula that management intended to reasonably approximate fair value based solely on a multiple of future earnings over a measurement period. The Put Rights are embedded in the shares owned by the noncontrolling interest holders and are not freestanding. The Company tracks the carrying cost of such redeemable noncontrolling interests at historical cost plus an allocation of subsidiary earnings based on ownership interest, less dividends paid to the noncontrolling interest holders. Redeemable noncontrolling interests are recorded outside of permanent equity at the higher of their carrying cost or management’s estimate of the Redemption Amount. The initial adjustment to record redeemable noncontrolling interests at the Redemption Amount results in a corresponding decrease to retained earnings. Subsequent adjustments to the Redemption Amount of redeemable noncontrolling interests may result in corresponding decreases or increases to retained earnings, provided any increases to retained earnings may only be recorded to the extent of decreases previously recorded. Adjustments to Redemption Amounts based on fair value will have no effect on net income per share attributable to HEICO shareholders whereas the portion of periodic adjustments to the carrying amount of redeemable noncontrolling interests based solely on a multiple of future earnings that reflect a redemption amount in excess of fair value will affect net income per share attributable to HEICO shareholders. Acquisitions of redeemable noncontrolling interests are treated as equity transactions.
Net Income per Share Attributable to HEICO Shareholders
Basic net income per share attributable to HEICO shareholders is computed by dividing net income attributable to HEICO by the weighted average number of common shares outstanding during the period. Diluted net income per share attributable to HEICO shareholders is computed by dividing net income attributable to HEICO by the weighted average number of common shares outstanding during the period plus potentially dilutive common shares arising from the assumed exercise of stock options, if dilutive. The dilutive impact of potentially dilutive common shares is determined by applying the treasury stock method.

H E I C O C O R P O R A T I O N
A N D S U B S I D I A R I E S
H E I C O C O R P O R A T I O N / 3 5
N O T E S T O C O N S O L I D AT E D F I N A N C I A L S TAT E M E N T S
As further detailed in “Redeemable Noncontrolling Interests” above, the portion of periodic adjustments to the carrying amount of redeemable noncontrolling interests based solely on a multiple of future earnings that reflect a redemption amount in excess of fair value affect net income attributable to HEICO for purposes of determining net income per share attributable to HEICO shareholders (see Note 12, Net Income per Share Attributable to HEICO Shareholders).
Foreign Currency Translation
All assets and liabilities of foreign subsidiaries that do not utilize the United States dollar as its functional currency are translated at period-end exchange rates, while revenue and expenses are translated using average exchange rates for the period. Unrealized translation gains or losses are reported as foreign currency translation adjustments through other comprehensive income in shareholders’ equity.
Contingencies
Losses for contingencies such as product warranties, litigation and environmental matters are recognized in income when they are probable and can be reasonably estimated. Gain contingencies are not recognized in income until they have been realized.
New Accounting Pronouncements
In February 2013, the Financial Accounting Standards Board (“FASB”) issued Accounting Standards Update (“ASU”) 2013-02, “Reporting of Amounts Reclassified Out of Accumulated Other Comprehensive Income,” which requires disclosure about changes in and amounts reclassified out of accumulated other comprehensive income by component. In addition, an entity is required to present, either on the face of the statement of operations or in the notes, significant amounts reclassified out of accumulated other comprehensive income by the respective line items of net income, but only if the amount reclassified is required to be reclassified to net income in its entirety in the same reporting period. For amounts that are not required to be reclassified in their entirety to net income, an entity is required to cross-reference to other disclosures that provide additional detail about those amounts. The Company adopted ASU 2013-02 in the first quarter of fiscal 2014, resulting in only expanded disclosure regarding the changes in accumulated other comprehensive income and no impact on the Company’s consolidated results of operations, financial position or cash flows.
In March 2013, the FASB issued ASU 2013-05, “Parent’s Accounting for the Cumulative Translation Adjustment upon Derecognition of Certain Subsidiaries or Groups of Assets within a Foreign Entity or of an Investment in a Foreign Entity,” which clarifies the applicable guidance for the release of any cumulative translation adjustments into net earnings. ASU 2013-05 specifies that the entire amount of cumulative translation adjustments should be released into earnings when an entity ceases to have a controlling financial interest in a subsidiary or group of assets within a consolidated foreign entity and the sale or transfer results in the complete or substantially complete liquidation of the investment in the foreign entity. ASU 2013-05 is effective prospectively for fiscal years and interim reporting periods within those years beginning after December 15, 2013, or in fiscal 2015 for HEICO. Early adoption is permitted. The Company is currently evaluating the effect, if any, the adoption of this guidance will have on its consolidated results of operations, financial position or cash flows.
In May 2014, the FASB issued ASU 2014-09, “Revenue from Contracts with Customers,” which provides a comprehensive new revenue recognition model that will supersede nearly all existing revenue recognition guidance. Under ASU 2014-09, an entity will recognize revenue when it transfers promised goods or services to a customer at an amount that reflects the consideration it expects to receive in exchange for those goods or services. The guidance also requires additional disclosure about the nature, amount, timing and uncertainty of revenue and cash flows arising from customer contracts. ASU 2014-09 is effective for fiscal years and interim reporting periods within those years beginning after December 15, 2016, or in fiscal 2018 for HEICO. Early adoption is not permitted. ASU 2014-09 shall be applied either retrospectively to each prior reporting period presented or retrospectively with the cumulative effect of initially applying ASU 2014-09 recognized at the date of initial application. The Company is currently evaluating which transition method it will elect and the effect the adoption of this guidance will have on its consolidated results of operations, financial position or cash flows.
NOTE 2. ACQUISITIONS
Reinhold Acquisition
On May 31, 2013, the Company, through its HEICO Flight Support Corp. subsidiary, acquired Reinhold Industries, Inc. (“Rein-hold”) through the acquisition of all of the outstanding stock of Reinhold’s parent company for approximately $133.0 million, net of $8.0 million of cash acquired, in a transaction carried out by means of a merger. The purchase price of this acquisition was paid in cash, principally using proceeds from the Company’s revolving credit facility. Reinhold is a leading manufacturer of advanced niche components and complex composite assemblies for commercial aviation, defense and space applications. This acquisition is consistent with HEICO’s practice of acquiring outstanding, niche designers and manufacturers of critical components in the aerospace and defense industries and will further enable the Company to broaden its product offerings, technologies and customer base.

H E I C O C O R P O R A T I O N
A N D S U B S I D I A R I E S
3 6 / H E I C O C O R P O R A T I O N
N O T E S T O C O N S O L I D AT E D F I N A N C I A L S TAT E M E N T S
The following table summarizes the allocation of the purchase price of Reinhold to the estimated fair values of the tangible and identifiable intangible assets acquired and liabilities assumed (in thousands):
Assets acquired: Goodwill $ 76,424 Identifiable intangible assets 66,500 Inventories 10,753 Accounts receivable 8,830 Property, plant and equipment 7,994 Other assets 2,756 Total assets acquired, excluding cash $ 173,257 Liabilities assumed: Deferred income taxes $ 25,613 Accrued expenses 6,994 Accounts payable 2,923 Defined benefit pension plan obligation, net 2,865 Accrued additional purchase consideration 1,499 Other liabilities 390 Total liabilities assumed $ 40,284Net assets acquired, excluding cash $ 132,973
During fiscal 2014, the company recorded certain immaterial measurement period adjustments to the purchase price allocation of Reinhold, which are reflected in the table above. The primary items that generated the goodwill recognized were the premiums paid by the Company for the future earnings potential of Reinhold and the value of its assembled workforce that do not qualify for separate recognition. The operating results of Reinhold were included in the Company’s results of operations from the effective acquisition date. The Company’s consolidated net sales and net income attributable to HEICO for fiscal 2013 includes approximately $30.8 million and $2.8 million, respectively, from the acquisition of Reinhold.
The following table presents unaudited pro forma financial information for fiscal 2012 as if the acquisition of Reinhold had occurred as of November 1, 2011 (in thousands):
Year ended October 31, 2012
Net sales $ 952,184 Net income from consolidated operations $ 109,923 Net income attributable to HEICO $ 88,382 Net income per share attributable to HEICO shareholders: Basic $ 1.34 Diluted $ 1.33
The pro forma financial information is presented for comparative purposes only and is not necessarily indicative of the results of operations that actually would have been achieved if the acquisition had taken place as of November 1, 2011. The unaudited pro forma financial information includes adjustments to historical amounts such as additional amortization expense related to intangible assets acquired, increased interest expense associated with borrowings to finance the acquisition and inventory purchase accounting adjustments charged to cost of sales as the inventory is sold. Had the acquisition been consummated as of November 1, 2011, net sales, net income from consolidated operations, net income attributable to HEICO, and basic and diluted net income per share attributable to HEICO shareholders on a pro forma basis for fiscal 2013 would not have been materially different than the reported amounts.
Switchcraft Acquisition
On November 22, 2011, the Company, through HEICO Electronic, acquired Switchcraft, Inc. (“Switchcraft”) through the purchase of all of the stock of Switchcraft’s parent company, Switchcraft Holdco, Inc., for approximately $142.7 million, net of $3.7 million of cash acquired. The purchase price of this acquisition was paid in cash, principally using proceeds from the Company’s revolving credit facility. Switchcraft is a leading designer and manufacturer of high performance, high reliability and harsh environment electronic connectors and other interconnect products. This acquisition is consistent with HEICO’s practice of acquiring outstanding, niche designers and manufacturers of critical components in the aerospace and electronic industries and will further enable the Company to broaden its product offerings, technologies and customer base.
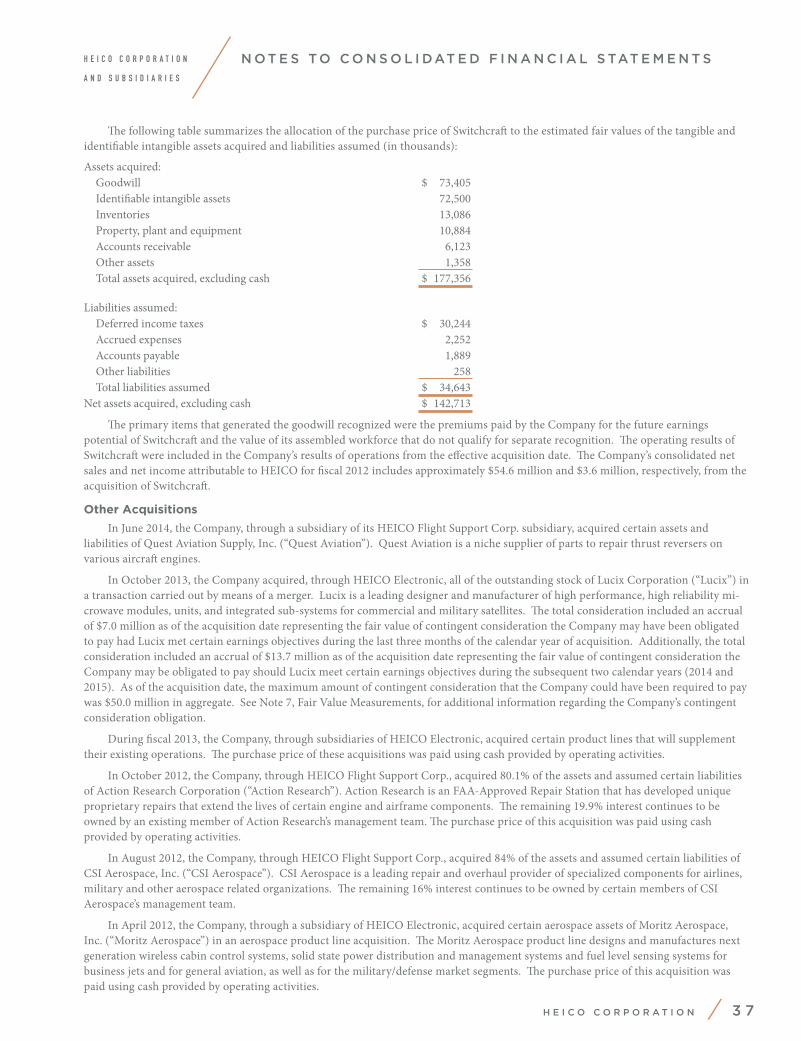
H E I C O C O R P O R A T I O N
A N D S U B S I D I A R I E S
H E I C O C O R P O R A T I O N / 3 7
N O T E S T O C O N S O L I D AT E D F I N A N C I A L S TAT E M E N T S
The following table summarizes the allocation of the purchase price of Switchcraft to the estimated fair values of the tangible and identifiable intangible assets acquired and liabilities assumed (in thousands):
Assets acquired: Goodwill $ 73,405 Identifiable intangible assets 72,500 Inventories 13,086 Property, plant and equipment 10,884 Accounts receivable 6,123 Other assets 1,358 Total assets acquired, excluding cash $ 177,356 Liabilities assumed: Deferred income taxes $ 30,244 Accrued expenses 2,252 Accounts payable 1,889 Other liabilities 258 Total liabilities assumed $ 34,643 Net assets acquired, excluding cash $ 142,713
The primary items that generated the goodwill recognized were the premiums paid by the Company for the future earnings potential of Switchcraft and the value of its assembled workforce that do not qualify for separate recognition. The operating results of Switchcraft were included in the Company’s results of operations from the effective acquisition date. The Company’s consolidated net sales and net income attributable to HEICO for fiscal 2012 includes approximately $54.6 million and $3.6 million, respectively, from the acquisition of Switchcraft.
Other Acquisitions
In June 2014, the Company, through a subsidiary of its HEICO Flight Support Corp. subsidiary, acquired certain assets and liabilities of Quest Aviation Supply, Inc. (“Quest Aviation”). Quest Aviation is a niche supplier of parts to repair thrust reversers on various aircraft engines.
In October 2013, the Company acquired, through HEICO Electronic, all of the outstanding stock of Lucix Corporation (“Lucix”) in a transaction carried out by means of a merger. Lucix is a leading designer and manufacturer of high performance, high reliability mi-crowave modules, units, and integrated sub-systems for commercial and military satellites. The total consideration included an accrual of $7.0 million as of the acquisition date representing the fair value of contingent consideration the Company may have been obligated to pay had Lucix met certain earnings objectives during the last three months of the calendar year of acquisition. Additionally, the total consideration included an accrual of $13.7 million as of the acquisition date representing the fair value of contingent consideration the Company may be obligated to pay should Lucix meet certain earnings objectives during the subsequent two calendar years (2014 and 2015). As of the acquisition date, the maximum amount of contingent consideration that the Company could have been required to pay was $50.0 million in aggregate. See Note 7, Fair Value Measurements, for additional information regarding the Company’s contingent consideration obligation.
During fiscal 2013, the Company, through subsidiaries of HEICO Electronic, acquired certain product lines that will supplement their existing operations. The purchase price of these acquisitions was paid using cash provided by operating activities.
In October 2012, the Company, through HEICO Flight Support Corp., acquired 80.1% of the assets and assumed certain liabilities of Action Research Corporation (“Action Research”). Action Research is an FAA-Approved Repair Station that has developed unique proprietary repairs that extend the lives of certain engine and airframe components. The remaining 19.9% interest continues to be owned by an existing member of Action Research’s management team. The purchase price of this acquisition was paid using cash provided by operating activities.
In August 2012, the Company, through HEICO Flight Support Corp., acquired 84% of the assets and assumed certain liabilities of CSI Aerospace, Inc. (“CSI Aerospace”). CSI Aerospace is a leading repair and overhaul provider of specialized components for airlines, military and other aerospace related organizations. The remaining 16% interest continues to be owned by certain members of CSI Aerospace’s management team.
In April 2012, the Company, through a subsidiary of HEICO Electronic, acquired certain aerospace assets of Moritz Aerospace, Inc. (“Moritz Aerospace”) in an aerospace product line acquisition. The Moritz Aerospace product line designs and manufactures next generation wireless cabin control systems, solid state power distribution and management systems and fuel level sensing systems for business jets and for general aviation, as well as for the military/defense market segments. The purchase price of this acquisition was paid using cash provided by operating activities.
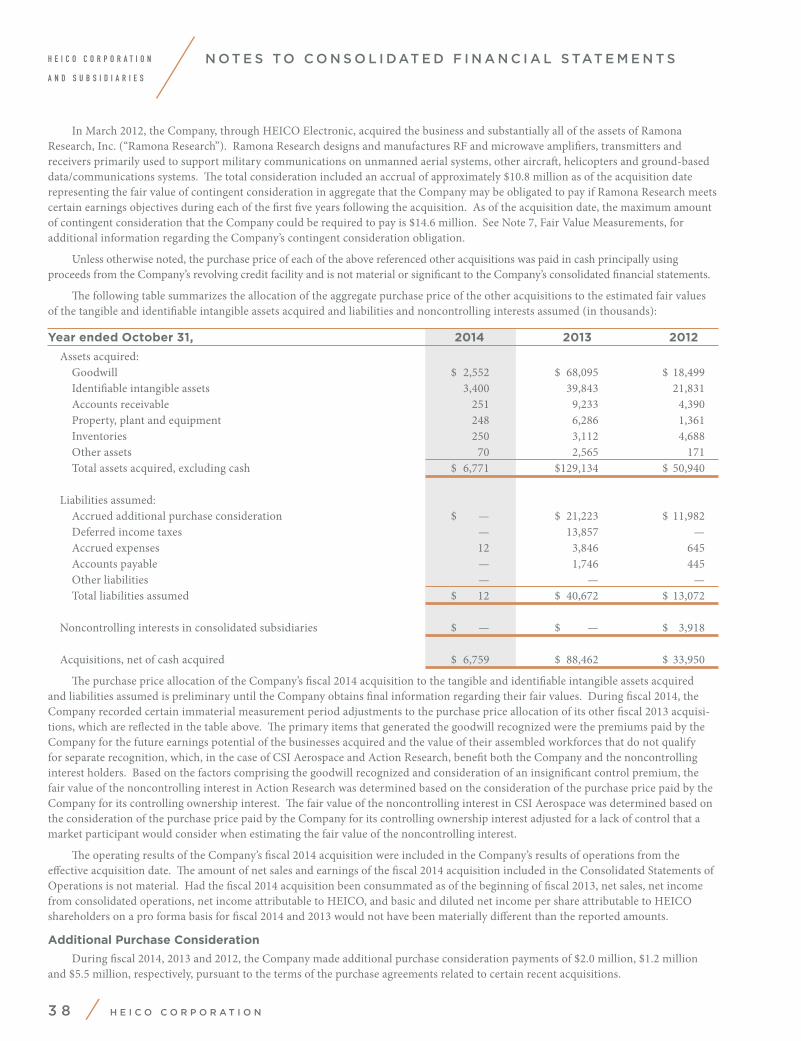
H E I C O C O R P O R A T I O N
A N D S U B S I D I A R I E S
3 8 / H E I C O C O R P O R A T I O N
N O T E S T O C O N S O L I D AT E D F I N A N C I A L S TAT E M E N T S
In March 2012, the Company, through HEICO Electronic, acquired the business and substantially all of the assets of Ramona Research, Inc. (“Ramona Research”). Ramona Research designs and manufactures RF and microwave amplifiers, transmitters and receivers primarily used to support military communications on unmanned aerial systems, other aircraft, helicopters and ground-based data/communications systems. The total consideration included an accrual of approximately $10.8 million as of the acquisition date representing the fair value of contingent consideration in aggregate that the Company may be obligated to pay if Ramona Research meets certain earnings objectives during each of the first five years following the acquisition. As of the acquisition date, the maximum amount of contingent consideration that the Company could be required to pay is $14.6 million. See Note 7, Fair Value Measurements, for additional information regarding the Company’s contingent consideration obligation.
Unless otherwise noted, the purchase price of each of the above referenced other acquisitions was paid in cash principally using proceeds from the Company’s revolving credit facility and is not material or significant to the Company’s consolidated financial statements.
The following table summarizes the allocation of the aggregate purchase price of the other acquisitions to the estimated fair values of the tangible and identifiable intangible assets acquired and liabilities and noncontrolling interests assumed (in thousands):
Year ended October 31, 2014 2013 2012
Assets acquired: Goodwill $ 2,552 $ 68,095 $ 18,499 Identifiable intangible assets 3,400 39,843 21,831 Accounts receivable 251 9,233 4,390 Property, plant and equipment 248 6,286 1,361 Inventories 250 3,112 4,688 Other assets 70 2,565 171 Total assets acquired, excluding cash $ 6,771 $ 129,134 $ 50,940 Liabilities assumed: Accrued additional purchase consideration $ — $ 21,223 $ 11,982 Deferred income taxes — 13,857 — Accrued expenses 12 3,846 645 Accounts payable — 1,746 445 Other liabilities — — — Total liabilities assumed $ 12 $ 40,672 $ 13,072 Noncontrolling interests in consolidated subsidiaries $ — $ — $ 3,918 Acquisitions, net of cash acquired $ 6,759 $ 88,462 $ 33,950
The purchase price allocation of the Company’s fiscal 2014 acquisition to the tangible and identifiable intangible assets acquired and liabilities assumed is preliminary until the Company obtains final information regarding their fair values. During fiscal 2014, the Company recorded certain immaterial measurement period adjustments to the purchase price allocation of its other fiscal 2013 acquisi-tions, which are reflected in the table above. The primary items that generated the goodwill recognized were the premiums paid by the Company for the future earnings potential of the businesses acquired and the value of their assembled workforces that do not qualify for separate recognition, which, in the case of CSI Aerospace and Action Research, benefit both the Company and the noncontrolling interest holders. Based on the factors comprising the goodwill recognized and consideration of an insignificant control premium, the fair value of the noncontrolling interest in Action Research was determined based on the consideration of the purchase price paid by the Company for its controlling ownership interest. The fair value of the noncontrolling interest in CSI Aerospace was determined based on the consideration of the purchase price paid by the Company for its controlling ownership interest adjusted for a lack of control that a market participant would consider when estimating the fair value of the noncontrolling interest.
The operating results of the Company’s fiscal 2014 acquisition were included in the Company’s results of operations from the effective acquisition date. The amount of net sales and earnings of the fiscal 2014 acquisition included in the Consolidated Statements of Operations is not material. Had the fiscal 2014 acquisition been consummated as of the beginning of fiscal 2013, net sales, net income from consolidated operations, net income attributable to HEICO, and basic and diluted net income per share attributable to HEICO shareholders on a pro forma basis for fiscal 2014 and 2013 would not have been materially different than the reported amounts.
Additional Purchase Consideration
During fiscal 2014, 2013 and 2012, the Company made additional purchase consideration payments of $2.0 million, $1.2 million and $5.5 million, respectively, pursuant to the terms of the purchase agreements related to certain recent acquisitions.

H E I C O C O R P O R A T I O N
A N D S U B S I D I A R I E S
H E I C O C O R P O R A T I O N / 3 9
N O T E S T O C O N S O L I D AT E D F I N A N C I A L S TAT E M E N T S
As part of the purchase agreements associated with certain acquisitions consummated prior to fiscal 2010, the Company was obligated to pay additional purchase consideration based on the acquired subsidiary meeting certain earnings objectives following the acquisition. For such acquisitions, the Company accrued an estimate of additional purchase consideration when the earnings objectives were met. During fiscal 2012, the Company, through HEICO Electronic, paid $15.1 million of such additional purchase consideration, of which $4.8 million was accrued as of October 31, 2011. The amounts paid in fiscal 2012 were based on a multiple of each applicable subsidiary’s earnings relative to target and were not contingent upon the former shareholders of the respective acquired entity remaining employed by the Company or providing future services to the Company. Accordingly, the amounts paid were recorded as additional goodwill as they represented an additional cost of the respective entity. As of October 31, 2014 and 2013, the Company had no remain-ing obligation to pay additional purchase consideration for acquisitions consummated prior to fiscal 2010.
NOTE 3. SELECTED FINANCIAL STATEMENT INFORMATION
Accounts Receivable
As of October 31, 2014 2013
(in thousands)Accounts receivable $ 151,812 $ 160,118 Less: Allowance for doubtful accounts (2,143) (3,096) Accounts receivable, net $ 149,669 $ 157,022
Costs and Estimated Earnings on Uncompleted Percentage-of-Completion Contracts
As of October 31, 2014 2013
(in thousands)Costs incurred on uncompleted contracts $ 24,437 $ 22,548 Estimated earnings 11,747 25,391 36,184 47,939 Less: Billings to date (29,829) (40,676) $ 6,355 $ 7,263 Included in the accompanying Consolidated Balance Sheets under the following captions: Accounts receivable, net (costs and estimated earnings in excess of billings) $ 8,161 $ 9,540 Accrued expenses and other current liabilities (billings in excess of costs and estimated earnings) (1,806) (2,277) $ 6,355 $ 7,263
Changes in estimates pertaining to percentage-of-completion contracts did not have a material effect on net income from consolidated operations in fiscal 2014, 2013 or 2012.
Inventories
As of October 31, 2014 2013
(in thousands)Finished products $ 106,229 $ 103,234 Work in process 30,056 26,810 Materials, parts, assemblies and supplies 79,163 79,863 Contracts in process 2,594 9,941 Less: Billings to date — (955) Inventories, net of valuation reserves $ 218,042 $ 218,893
Contracts in process represents accumulated capitalized costs associated with fixed price contracts for which revenue is recognized on the completed-contract method. Related progress billings and customer advances (“billings to date”) are classified as a reduction to contracts in process, if any, and any excess is included in accrued expenses and other liabilities.

H E I C O C O R P O R A T I O N
A N D S U B S I D I A R I E S
4 0 / H E I C O C O R P O R A T I O N
N O T E S T O C O N S O L I D AT E D F I N A N C I A L S TAT E M E N T S
Property, Plant and Equipment
As of October 31, 2014 2013
(in thousands)Land $ 4,501 $ 4,515 Buildings and improvements 60,332 60,105 Machinery, equipment and tooling 139,963 131,855 Construction in progress 6,905 4,932 211,701 201,407 Less: Accumulated depreciation and amortization (117,836) (103,670) Property, plant and equipment, net $ 93,865 $ 97,737
The amounts set forth above include tooling costs having a net book value of $6.0 million and $5.7 million as of October 31, 2014 and 2013, respectively. Amortization expense on capitalized tooling was $2.4 million, $2.2 million and $2.1 million in fiscal 2014, 2013 and 2012, respectively.
The amounts set forth above also include $4.6 million and $5.5 million of assets under capital leases as of October 31, 2014 and October 31, 2013, respectively. Accumulated depreciation associated with the assets under capital leases was $1.0 million and $1.1 million as of October 31, 2014 and October 31, 2013, respectively. See Note 5, Long-Term Debt, for additional information pertaining to these capital lease obligations.
Depreciation and amortization expense, exclusive of tooling, on property, plant and equipment was $17.1 million, $13.4 million and $11.6 million in fiscal 2014, 2013 and 2012, respectively.
Accrued Expenses and Other Current Liabilities
As of October 31, 2014 2013
(in thousands)Accrued employee compensation and related payroll taxes $ 52,480 $ 52,435 Deferred revenue 12,481 11,529 Accrued customer rebates and credits 10,924 14,787 Accrued additional purchase consideration 90 9,142 Other 16,603 17,841 Accrued expenses and other current liabilities $ 92,578 $ 105,734
The total customer rebates and credits deducted within net sales in fiscal 2014, 2013 and 2012 was $8.3 million, $8.3 million and $2.8 million, respectively. The principal reason why the amount of customer rebates and credits deducted within net sales in fiscal 2012 is less than it was in fiscal 2014 and 2013 is fiscal 2012 reflected a reduction in the net sales volume of certain customers eligible for rebates as well as a reduction in the associated rebate percentages. The decrease in the amount of accrued customer rebates and credits principally reflects payments made during fiscal 2014 of certain amounts accrued over a two to three year period. The decrease in accrued additional purchase consideration pertains to a fiscal 2013 and a fiscal 2012 acquisition for which the underlying earnings objectives were not met. See Note 7, Fair Value Measurements, for additional information regarding the Company’s contingent consider-ation obligations.
Other Long-Term Assets and Liabilities
The Company provides eligible employees, officers and directors of the Company the opportunity to voluntarily defer base salary, bonus payments, commissions, long-term incentive awards and directors’ fees, as applicable, on a pre-tax basis through the HEICO Corporation Leadership Compensation Plan (“LCP”), a nonqualified deferred compensation plan that conforms to Section 409A of the Internal Revenue Code. The Company matches 50% of the first 6% of base salary deferred by each participant. Director fees that would otherwise be payable in Company common stock may be deferred into the LCP, and, when distributable, are distributed in actual shares of Company common stock. The LCP does not provide for diversification of a director’s assets allocated to Company common stock. The deferred compensation obligation associated with Company common stock is recorded as a component of shareholders’ equity at cost and subsequent changes in fair value are not reflected in operations or shareholders’ equity of the Company. Further, while the Company has no obligation to do so, the LCP also provides the Company the opportunity to make discretionary contributions. The Company’s matching contributions and any discretionary contributions are subject to vesting and forfeiture provisions set forth in the LCP. Company contributions to the LCP charged to income in fiscal 2014, 2013 and 2012 totaled $5.3 million, $4.3 million and $3.8 million, respectively. The aggregate liabilities of the LCP were $65.0 million and $51.9 million as of October 31, 2014 and 2013, respectively, and are classified within other long-term liabilities in the Company’s Consolidated Balance Sheets. The assets of the LCP, totaling $65.9 million and $52.7 million as of October 31, 2014 and 2013, respectively, are classified within other assets and principally represent cash surrender values of life insurance policies that are held within an irrevocable trust that may be used to satisfy the obligations under the LCP.

H E I C O C O R P O R A T I O N
A N D S U B S I D I A R I E S
H E I C O C O R P O R A T I O N / 4 1
N O T E S T O C O N S O L I D AT E D F I N A N C I A L S TAT E M E N T S
Other long-term liabilities also includes deferred compensation of $5.5 million and $5.0 million as of October 31, 2014 and 2013, respectively, principally related to elective deferrals of salary and bonuses under a Company sponsored non-qualified deferred compensation plan available to selected employees. The Company makes no contributions to this plan. The assets of this plan, which equaled the deferred compensation liability as of October 31, 2014 and 2013, respectively, are held within an irrevocable trust and classified within other assets in the Company’s Consolidated Balance Sheets. Additional information regarding the assets of this deferred compensation plan and the LCP may be found in Note 7, Fair Value Measurements.
Research and Development Expenses
The amount of new product research and development expenses (R&D expenses) included in cost of sales is as follows (in thousands):
Year ended October 31, 2014 2013 2012
R&D expenses $ 37,377 $ 32,897 $ 30,395
Accumulated Other Comprehensive Income (Loss)
Changes in the components of accumulated other comprehensive income (loss) for the fiscal year ended October 31, 2014 are as follows (in thousands): Accumulated Foreign Currency Pension Benefit Other Comprehensive Translation Obligation Income (Loss)
Balances at October 31, 2013 ($ 466) $ 610 $ 144Unrealized loss (7,882) (551) (8,433)Balances at October 31, 2014 ($ 8,348) $ 59 ($ 8,289)
NOTE 4. GOODWILL AND OTHER INTANGIBLE ASSETS
Changes in the carrying amount of goodwill during fiscal 2014 and 2013 by operating segment are as follows (in thousands):
Segment Consolidated
FSG ETG Totals
Balances as of October 31, 2012 $ 203,539 $ 338,575 $ 542,114Goodwill acquired 76,424 68,068 144,492Foreign currency translation adjustments — 1,991 1,991Adjustments to goodwill (108) — (108)Balances as of October 31, 2013 279,855 408,634 688,489Goodwill acquired 2,552 — 2,552Foreign currency translation adjustments — (4,797) (4,797)Adjustments to goodwill — 27 27Balances as of October 31, 2014 $ 282,407 $ 403,864 $ 686,271
The goodwill acquired during fiscal 2014 and 2013 relates to the acquisitions consummated in those respective years as described in Note 2, Acquisitions. Goodwill acquired represents the residual value after the allocation of the total consideration to the tangible and identifiable intangible assets acquired and liabilities assumed. The foreign currency translation adjustments reflect unrealized translation gains or losses on the goodwill recognized in connection with foreign subsidiaries. Foreign currency translation adjustments are included in other comprehensive income in the Company’s Consolidated Statements of Comprehensive Income. The adjustments to goodwill during fiscal 2014 and 2013 represent immaterial measurement period adjustments to the purchase price allocations of certain fiscal 2013 and 2012 acquisitions, respectively. The Company estimates that all $3 million and approximately $5 million of the goodwill acquired in fiscal 2014 and 2013, respectively, is deductible for income tax purposes. Based on the annual test for goodwill impairment as of October 31, 2014, the Company determined there is no impairment of its goodwill and the fair value of each of the Company’s reporting units significantly exceeded their carrying value.

H E I C O C O R P O R A T I O N
A N D S U B S I D I A R I E S
4 2 / H E I C O C O R P O R A T I O N
N O T E S T O C O N S O L I D AT E D F I N A N C I A L S TAT E M E N T S
Identifiable intangible assets consist of (in thousands):
As of October 31, 2014 As of October 31, 2013
Gross Net Gross Net Carrying Accumulated Carrying Carrying Accumulated Carrying Amount Amortization Amount Amount Amortization Amount
Amortizing Assets: Customer relationships $ 144,478 ($ 55,393) $ 89,085 $ 156,801 ($ 38,461) $ 118,340 Intellectual property 73,005 (17,620) 55,385 75,095 (10,795) 64,300 Licenses 2,900 (1,645) 1,255 2,900 (1,381) 1,519 Non-compete agreements 1,020 (1,020) — 1,132 (1,132) — Patents 712 (405) 307 642 (351) 291 Trade names 166 (17) 149 566 (448) 118 222,281 (76,100) 146,181 237,136 (52,568) 184,568 Non-Amortizing Assets: Trade names 54,629 — 54,629 56,990 — 56,990 $ 276,910 ($ 76,100) $ 200,810 $ 294,126 ($ 52,568) $ 241,558
The decrease in the gross carrying amount of customer relationships, non-amortizing trade names and intellectual property primarily reflects impairment losses of $11.2 million, $1.9 million and $1.9 million, respectively, recognized during fiscal 2014. The impairment losses were due to reductions in the estimated future cash flows associated with such intangible assets within the ETG (see Note 7, Fair Value Measurements). The impairment losses pertaining to customer relationships and trade names were recorded as a component of selling, general and administrative expenses in the Company’s Consolidated Statement of Operations and the impairment loss pertaining to intellectual property was recorded as a component of cost of sales. The Company recognized certain intangible assets during fiscal 2014 in connection with an acquisition (see Note 2, Acquisitions). The amortization period of the customer relationships, intellectual property and amortizing trade names acquired is 8 years, 15 years, and 8 years, respectively.
Amortization expense related to intangible assets was $27.7 million, $20.6 million and $16.2 million in fiscal 2014, 2013 and 2012, respectively. Amortization expense for each of the next five fiscal years and thereafter is estimated to be $23.4 million in fiscal 2015, $21.8 million in fiscal 2016, $20.9 million in fiscal 2017, $19.1 million in fiscal 2018, $17.2 million in fiscal 2019 and $43.8 million thereafter.
NOTE 5. LONG-TERM DEBT
Long-term debt consists of the following (in thousands):
As of October 31, 2014 2013
Borrowings under revolving credit facility $ 326,000 $ 373,000 Capital leases and notes payable 3,109 4,515 329,109 377,515 Less: Current maturities of long-term debt (418) (697) $ 328,691 $ 376,818
As of October 31, 2014, the Company’s long-term debt, excluding capital leases, consisted solely of $326.0 million of borrowings under its revolving credit facility, all of which will mature in fiscal 2019.

H E I C O C O R P O R A T I O N
A N D S U B S I D I A R I E S
H E I C O C O R P O R A T I O N / 4 3
N O T E S T O C O N S O L I D AT E D F I N A N C I A L S TAT E M E N T S
Capital Lease Obligations
A subsidiary of HEICO Electronic is a party to a capital lease for a manufacturing facility and related property in France. The lease contains a bargain purchase option and has a twelve-year term, which began in fiscal 2011. Additionally, the subsidiary is a party to various capital leases, principally for manufacturing equipment, with lease terms ranging from approximately three to five years. The estimated future minimum lease payments of all capital leases for the next five fiscal years and thereafter are as follows (in thousands):
Year ending October 31,
2015 $ 5472016 506 2017 442 2018 436 2019 436 Thereafter 1,276 Total minimum lease payments 3,643 Less: amount representing interest 534 Present value of minimum lease payments $ 3,109
Revolving Credit Facility
In December 2011, the Company entered into a $670 million Revolving Credit Agreement (“Credit Facility”) with a bank syndicate. The Credit Facility may be used for working capital and general corporate needs of the Company, including capital expenditures and to finance acquisitions. In December 2012, the Company entered into an amendment to extend the maturity date of the Credit Facility by one year to December 2017. The Company also amended certain covenants contained within the Credit Facility agreement to accommodate payment of a special and extraordinary cash dividend paid in December 2012. See Note 8, Shareholders’ Equity, for additional information.
In November 2013, the Company entered into an amendment to extend the maturity date of the Credit Facility by one year to December 2018 and to increase the aggregate principal amount to $800 million. Furthermore, the amendment includes a feature that will allow the Company to increase the aggregate principal amount by an additional $200 million to become a $1.0 billion facility through increased commitments from existing lenders or the addition of new lenders.
Advances under the Credit Facility accrue interest at the Company’s choice of the “Base Rate” or the London Interbank Offered Rate (“LIBOR”) plus applicable margins (based on the Company’s ratio of total funded debt to earnings before interest, taxes, depreciation and amortization, noncontrolling interests and non-cash charges, or “leverage ratio”). The Base Rate is the highest of (i) the Prime Rate; (ii) the Federal Funds rate plus .50% per annum; and (iii) the Adjusted LIBO Rate determined on a daily basis for an Interest Period of one month plus 1.00% per annum, as such capitalized terms are defined in the Credit Facility. The applicable margins for LIBOR-based borrowings range from .75% to 2.25%. The applicable margins for Base Rate borrowings range from 0% to 1.25%. A fee is charged on the amount of the unused commitment ranging from .125% to .35% (depending on the Company’s leverage ratio). The Credit Facility also includes a $50 million sublimit for borrowings made in foreign currencies, letters of credit and swingline borrowings. Outstanding principal, accrued and unpaid interest and other amounts payable under the Credit Facility may be accelerated upon an event of default, as such events are described in the Credit Facility. The Credit Facility is unsecured and contains covenants that restrict the amount of certain payments, including dividends, and require, among other things, the maintenance of a total leverage ratio, a senior leverage ratio and a fixed charge coverage ratio. In the event the Company’s leverage ratio exceeds a specified level, the Credit Facility would become secured by the capital stock owned in substantially all of the Company’s subsidiaries.
As of October 31, 2014 and 2013, the weighted average interest rate on borrowings under the Credit Facility was 1.3%. The Credit Facility contains both financial and non-financial covenants. As of October 31, 2014, the Company was in compliance with all such covenants.
NOTE 6. INCOME TAXES
The components of income before income taxes and noncontrolling interests are as follows (in thousands):
Year ended October 31, 2014 2013 2012
Domestic $ 185,842 $ 168,643 $ 157,189Foreign 12,730 12,118 3,986 Income before taxes and noncontrolling interests $ 198,572 $ 180,761 $ 161,175

H E I C O C O R P O R A T I O N
A N D S U B S I D I A R I E S
4 4 / H E I C O C O R P O R A T I O N
N O T E S T O C O N S O L I D AT E D F I N A N C I A L S TAT E M E N T S
The components of the provision for income taxes on income before income taxes and noncontrolling interests are as follows (in thousands):
Year ended October 31, 2014 2013 2012
Current: Federal $ 63,264 $ 49,275 $ 48,461 State 10,145 9,060 7,516 Foreign 3,136 3,650 1,357 76,545 61,985 57,334Deferred (16,745) (5,785) (2,834) Total income tax expense $ 59,800 $ 56,200 $ 54,500
A reconciliation of the federal statutory income tax rate to the Company’s effective tax rate is as follows:
Year ended October 31, 2014 2013 2012
Federal statutory income tax rate 35.0% 35.0% 35.0%State taxes, net of federal income tax benefit 2.9 3.1 3.1Nontaxable reduction in accrued contingent consideration (3.4) — —Domestic production activities tax deduction (1.6) (1.2) (1.3)Research and development tax credits (1.2) (2.6) (1.7)Noncontrolling interests’ share of income (1.0) (1.3) (1.7)Tax-exempt gains on corporate owned life insurance policies (.6) (1.4) (.5)Other, net — (.5) .9 Effective tax rate 30.1% 31.1% 33.8%
The Company’s effective tax rate in fiscal 2014 decreased to 30.1% from 31.1% in fiscal 2013. The decrease is principally attributed to the impact of a nontaxable reduction in accrued contingent consideration during fiscal 2014 associated with a fiscal 2013 acquisition acquired by means of a stock transaction. The aforementioned decrease in the effective tax rate was partially offset by lower U.S. federal research and development (“R&D”) tax credits recognized in fiscal 2014 due to the expiration of the U.S. federal R&D tax credit in December 2013 compared to fiscal 2013 during which the retroactive extension of the U.S. federal R&D tax credit in the first quarter resulted in twenty-two months of U.S. federal R&D tax credits recognized that year. Additionally, the decrease in the effective rate was partially offset by higher tax-exempt unrealized gains in the cash surrender values of life insurance policies related to the HEICO Corporation Leadership Compensation Plan (“LCP”) in fiscal 2013 compared to fiscal 2014.
The Company’s effective tax rate in fiscal 2013 decreased to 31.1% from 33.8% in fiscal 2012. The decrease is partially due to higher research and development tax credits recognized in fiscal 2013 resulting from the retroactive extension of the U.S. federal R&D tax credit in January 2013 to cover a two-year period from January 1, 2012 to December 31, 2013. The decrease in the effective tax rate was also attributed to the benefit from higher tax-exempt unrealized gains in the cash surrender values of life insurance policies related to the LCP and a larger income tax deduction recognized for the special and extraordinary cash dividend paid in December 2012 to participants of the HEICO Savings and Investment Plan holding HEICO common stock.
Deferred income taxes reflect the net tax effects of temporary differences between the carrying amounts of assets and liabilities for financial reporting purposes and the amounts used for income tax purposes. The Company believes that it is more likely than not that it will generate sufficient future taxable income to utilize all of its deferred tax assets and has therefore not recorded a valuation allowance on any such asset.

H E I C O C O R P O R A T I O N
A N D S U B S I D I A R I E S
H E I C O C O R P O R A T I O N / 4 5
N O T E S T O C O N S O L I D AT E D F I N A N C I A L S TAT E M E N T S
Significant components of the Company’s deferred tax assets and liabilities are as follows (in thousands):
As of October 31, 2014 2013
Deferred tax assets: Deferred compensation liability $ 27,568 $ 22,242 Inventories 23,099 21,673 Share-based compensation 7,427 5,002 Bonus accrual 4,031 3,394 Deferred revenue 2,660 — R&D related carryforward 2,068 4,045 Vacation accrual 1,724 1,676 Customer rebates accrual 1,635 2,706 Other 8,258 7,958 Total deferred tax assets 78,470 68,696 Deferred tax liabilities: Goodwill and other intangible assets (144,381) (148,711) Property, plant and equipment (9,090) (12,486) Other (880) (1,154) Total deferred tax liabilities (154,351) (162,351) Net deferred tax liability ($ 75,881) ($ 93,655)
The net deferred tax liability is classified in the Company’s Consolidated Balance Sheets as follows (in thousands):
As of October 31, 2014 2013
Current asset $ 34,485 $ 33,036Long-term asset 1,063 1,791Long-term liability (111,429) (128,482)Net deferred tax liability ($ 75,881) ($ 93,655)
The decrease in the Company’s net deferred tax liability from $93.7 million as of October 31, 2013 to $75.9 million as of October 31, 2014 and the increase in the deferred income tax benefit from $5.8 million in fiscal 2013 to $16.7 million in fiscal 2014 is related to several items including the impact of impairment losses and amortization expense associated with intangible assets recognized in con-nection with fiscal 2013 acquisitions, the expiration of the bonus depreciation allowance on new property, plant and equipment acquired on or after January 1, 2014, and an increase in long-term deferred revenue. Additionally, the increase in the deferred tax asset related to the LCP resulting from additional compensation deferrals and higher earnings on deferred balances contributed to the decrease in the Company’s net deferred tax liability.
As of October 31, 2014 and 2013, the Company’s liability for gross unrecognized tax benefits related to uncertain tax positions was $.9 million and $1.1 million, respectively, of which $.6 million and $.8 million, respectively, would decrease the Company’s income tax expense and effective income tax rate if the tax benefits were recognized. A reconciliation of the activity related to the liability for gross unrecognized tax benefits during the fiscal years ended October 31, 2014 and 2013 is as follows (in thousands):
Year ended October 31, 2014 2013
Balances as of beginning of year $ 1,072 $ 2,527Increases related to prior year tax positions 10 58Decreases related to prior year tax positions — (967)Increases related to current year tax positions 138 108Settlements (22) (570)Lapse of statutes of limitations (319) (84)Balances as of end of year $ 879 $ 1,072
The decreases related to settlements and prior year tax positions recognized in fiscal 2013 pertain to state income tax positions regarding nexus and state apportionment, respectively, which were originally recognized in fiscal 2012 and resolved through the filing of state income tax returns in fiscal 2013 and the finalization of a state tax audit, respectively. The Company does not expect the total amount of unrecognized tax benefits to materially change in the next twelve months.

H E I C O C O R P O R A T I O N
A N D S U B S I D I A R I E S
4 6 / H E I C O C O R P O R A T I O N
N O T E S T O C O N S O L I D AT E D F I N A N C I A L S TAT E M E N T S
The Company’s net liability for unrecognized tax benefits was $.8 million as of October 31, 2014, including $.3 million of interest and penalties and net of $.4 million in deferred tax assets. The Company’s net liability for unrecognized tax benefits was $1.0 million as of October 31, 2013, including $.3 million of interest and penalties and net of $.4 million in deferred tax assets. The Company recognized interest and penalties of ($.1) million, ($.2) million and $.4 million in fiscal 2014, 2013 and 2012, respectively, related to unrecognized tax benefits.
The Company files income tax returns in the United States (“U.S.”) federal jurisdiction and in multiple state jurisdictions. The Company is also subject to income taxes in certain jurisdictions outside the U.S., none of which are individually material to the accompa-nying consolidated financial statements. Generally, the Company is no longer subject to U.S. federal, state or foreign examinations by tax authorities for years prior to fiscal 2010.
NOTE 7. FAIR VALUE MEASUREMENTS
The Company’s assets and liabilities that were measured at fair value on a recurring basis are set forth by level within the fair value hierarchy in the following tables (in thousands): As of October 31, 2014
Quoted Prices Significant Significant in Active Markets Other Observable Unobservable for Identical Assets Inputs Inputs (Level 1) (Level 2) (Level 3) Total
Assets: Deferred compensation plans: Corporate owned life insurance $ — $ 61,958 $ — $ 61,958 Money market funds 3,974 — — 3,974 Equity securities 2,225 — — 2,225 Mutual funds 1,903 — — 1,903 Other 1,339 50 — 1,389 Total assets $ 9,441 $ 62,008 $ — $ 71,449 Liabilities: Contingent consideration $ — $ — $ 1,184 $ 1,184
As of October 31, 2013
Quoted Prices Significant Significant in Active Markets Other Observable Unobservable for Identical Assets Inputs Inputs (Level 1) (Level 2) (Level 3) Total
Assets: Deferred compensation plans: Corporate owned life insurance $ — $ 52,655 $ — $ 52,655 Money market deposit accounts 1,470 — — 1,470 Equity securities 1,940 — — 1,940 Mutual funds 1,529 — — 1,529 Other — 46 — 46 Total assets $ 4,939 $ 52,701 $ — $ 57,640 Liabilities: Contingent consideration $ — $ — $ 29,310 $ 29,310
The Company maintains two non-qualified deferred compensation plans. The assets of the LCP principally represent cash surrender values of life insurance policies, which derive their fair values from investments in mutual funds that are managed by an insurance company and are classified within Level 2 and valued using a market approach. Certain other assets of the LCP represent investments in money market funds that are classified within Level 1. The assets of the Company’s other deferred compensation plan are principally invested in equity securities, mutual funds and money market deposit accounts that are classified within Level 1. The assets of both plans are held within irrevocable trusts and classified within other assets in the Company’s Consolidated Balance Sheets.

H E I C O C O R P O R A T I O N
A N D S U B S I D I A R I E S
H E I C O C O R P O R A T I O N / 4 7
N O T E S T O C O N S O L I D AT E D F I N A N C I A L S TAT E M E N T S
As part of the agreement to acquire a subsidiary by the ETG in fiscal 2013, the Company may have been obligated to pay contingent consideration of up to $20.0 million had the acquired entity met certain earnings objectives during the last three months of the calendar year of acquisition and may be obligated to pay contingent consideration of up to $30.0 million should the acquired entity meet certain earnings objectives during each of the next two calendar years (2014 and 2015). In December 2013, the acquired entity incurred unan-ticipated costs associated with certain contracts for which revenue is recognized on the percentage-of-completion method and as a result, did not meet its calendar 2013 related earnings objectives. Accordingly, the $7.0 million contingent consideration accrued as of October 31, 2013 was recorded as a reduction to selling, general and administrative expenses (“SG&A”) in the Company’s Consolidated Statement of Operations in the first quarter of fiscal 2014. The estimated fair value of the contingent consideration for the calendar 2014 and 2015 earnings period was $1.2 million as of October 31, 2014 compared to $13.7 million as of October 31, 2013. The $12.5 million decrease in the fair value of the contingent consideration is principally attributed to revised earnings estimates that reflect less favorable projected market conditions for certain of the space products it produces and was recorded as a reduction to SG&A expenses. Additionally, the aforementioned conditions resulted in the Company concluding it had a triggering event requiring assessment of impairment of the subsidiary’s intangible assets during fiscal 2014. Please see below for further information pertaining to the measurement and recognition of impairment losses associated with the intangible assets of this subsidiary.
As part of the agreement to acquire a subsidiary by the ETG in fiscal 2012, the Company may be obligated to pay contingent con-sideration of up to $10.6 million in aggregate should the acquired entity meet certain earnings objectives during each of the next three years following the second anniversary date of the acquisition. The $8.6 million estimated fair value of the contingent consideration as of October 31, 2013 was recorded as a reduction to SG&A expenses in the Company’s Consolidated Statement of Operations during fiscal 2014. The decrease in the fair value of the contingent consideration is principally attributed to revised earnings estimates that reflect less favorable market conditions for certain of the defense products it produces. Additionally, the aforementioned conditions resulted in the Company concluding it had a triggering event requiring assessment of impairment of the subsidiary’s intangible assets during fiscal 2014. Please see below for further information pertaining to the measurement and recognition of impairment losses associated with the intangible assets of this subsidiary.
The estimated fair values of the contingent consideration arrangements described above are classified within Level 3 and were determined using a probability-based scenario analysis approach. Under this method, a set of discrete potential future subsidiary earnings was determined using internal estimates based on various revenue growth rate assumptions for each scenario. A probability of likelihood was assigned to each discrete potential future earnings estimate and the resultant contingent consideration was calculated. The resulting probability-weighted contingent consideration amounts were discounted using a weighted average discount rate reflecting the credit risk of a market participant. Changes in either the revenue growth rates, related earnings or the discount rate could result in a material change to the amount of contingent consideration accrued and such changes will be recorded in the Company’s consolidated statements of operations.
The Level 3 inputs used to derive the estimated fair values of the contingent consideration as of October 31, 2014 are as follows:
Fiscal 2013 Fiscal 2012 Acquisition Acquisition
Compound annual revenue growth rate range (7%) - 20% (8%) - 26%Weighted average discount rate 2.6% 3.0%
Changes in the Company’s assets and liabilities measured at fair value on a recurring basis using unobservable inputs (Level 3) for the fiscal years ended October 31, 2014 and 2013 are as follows (in thousands):
Assets Liabilities
Balances as of October 31, 2012 $ 538 $ 10,897Contingent consideration related to acquisition — 20,654Payment of contingent consideration — (601)Decrease in accrued contingent consideration — (1,640)Total realized gains 48 —Sales (586) —Balances as of October 31, 2013 — 29,310Decrease in accrued contingent consideration — (28,126)Balances as of October 31, 2014 $ — $ 1,184
The Company did not have any transfers between Level 1 and Level 2 fair value measurements during fiscal 2014 and 2013.
The carrying amounts of the Company’s cash and cash equivalents, accounts receivable, trade accounts payable and accrued expenses and other current liabilities approximate fair value as of October 31, 2014 due to the relatively short maturity of the respective instruments. The carrying value of long-term debt approximates fair value due to its variable interest rates.
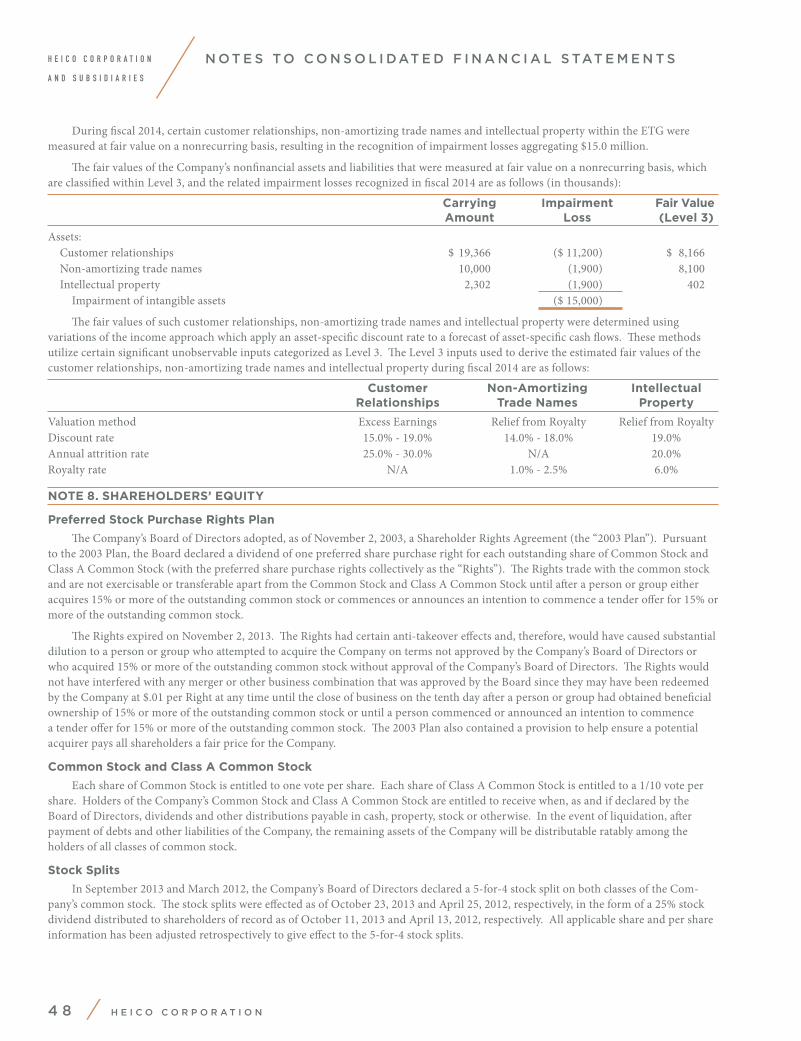
H E I C O C O R P O R A T I O N
A N D S U B S I D I A R I E S
4 8 / H E I C O C O R P O R A T I O N
N O T E S T O C O N S O L I D AT E D F I N A N C I A L S TAT E M E N T S
During fiscal 2014, certain customer relationships, non-amortizing trade names and intellectual property within the ETG were measured at fair value on a nonrecurring basis, resulting in the recognition of impairment losses aggregating $15.0 million.
The fair values of the Company’s nonfinancial assets and liabilities that were measured at fair value on a nonrecurring basis, which are classified within Level 3, and the related impairment losses recognized in fiscal 2014 are as follows (in thousands):
Carrying Impairment Fair Value Amount Loss (Level 3)
Assets: Customer relationships $ 19,366 ($ 11,200) $ 8,166 Non-amortizing trade names 10,000 (1,900) 8,100 Intellectual property 2,302 (1,900) 402 Impairment of intangible assets ($ 15,000)
The fair values of such customer relationships, non-amortizing trade names and intellectual property were determined using variations of the income approach which apply an asset-specific discount rate to a forecast of asset-specific cash flows. These methods utilize certain significant unobservable inputs categorized as Level 3. The Level 3 inputs used to derive the estimated fair values of the customer relationships, non-amortizing trade names and intellectual property during fiscal 2014 are as follows:
Customer Non-Amortizing Intellectual Relationships Trade Names Property
Valuation method Excess Earnings Relief from Royalty Relief from RoyaltyDiscount rate 15.0% - 19.0% 14.0% - 18.0% 19.0%Annual attrition rate 25.0% - 30.0% N/A 20.0%Royalty rate N/A 1.0% - 2.5% 6.0%
NOTE 8. SHAREHOLDERS’ EQUITY
Preferred Stock Purchase Rights Plan
The Company’s Board of Directors adopted, as of November 2, 2003, a Shareholder Rights Agreement (the “2003 Plan”). Pursuant to the 2003 Plan, the Board declared a dividend of one preferred share purchase right for each outstanding share of Common Stock and Class A Common Stock (with the preferred share purchase rights collectively as the “Rights”). The Rights trade with the common stock and are not exercisable or transferable apart from the Common Stock and Class A Common Stock until after a person or group either acquires 15% or more of the outstanding common stock or commences or announces an intention to commence a tender offer for 15% or more of the outstanding common stock.
The Rights expired on November 2, 2013. The Rights had certain anti-takeover effects and, therefore, would have caused substantial dilution to a person or group who attempted to acquire the Company on terms not approved by the Company’s Board of Directors or who acquired 15% or more of the outstanding common stock without approval of the Company’s Board of Directors. The Rights would not have interfered with any merger or other business combination that was approved by the Board since they may have been redeemed by the Company at $.01 per Right at any time until the close of business on the tenth day after a person or group had obtained beneficial ownership of 15% or more of the outstanding common stock or until a person commenced or announced an intention to commence a tender offer for 15% or more of the outstanding common stock. The 2003 Plan also contained a provision to help ensure a potential acquirer pays all shareholders a fair price for the Company.
Common Stock and Class A Common Stock
Each share of Common Stock is entitled to one vote per share. Each share of Class A Common Stock is entitled to a 1/10 vote per share. Holders of the Company’s Common Stock and Class A Common Stock are entitled to receive when, as and if declared by the Board of Directors, dividends and other distributions payable in cash, property, stock or otherwise. In the event of liquidation, after payment of debts and other liabilities of the Company, the remaining assets of the Company will be distributable ratably among the holders of all classes of common stock.
Stock Splits
In September 2013 and March 2012, the Company’s Board of Directors declared a 5-for-4 stock split on both classes of the Com-pany’s common stock. The stock splits were effected as of October 23, 2013 and April 25, 2012, respectively, in the form of a 25% stock dividend distributed to shareholders of record as of October 11, 2013 and April 13, 2012, respectively. All applicable share and per share information has been adjusted retrospectively to give effect to the 5-for-4 stock splits.

H E I C O C O R P O R A T I O N
A N D S U B S I D I A R I E S
H E I C O C O R P O R A T I O N / 4 9
N O T E S T O C O N S O L I D AT E D F I N A N C I A L S TAT E M E N T S
Share Repurchases
In 1990, the Company’s Board of Directors authorized a share repurchase program, which allows the Company to repurchase Company shares in the open market or in privately negotiated transactions at the Company’s discretion, subject to certain restrictions in-cluded in the Company’s revolving credit agreement. As of October 31, 2014, the maximum number of shares that may yet be purchased under this program was 2,501,813 of either or both of the Company’s Class A Common Stock and the Company’s Common Stock. The repurchase program does not have a fixed termination date. During fiscal 2014, 2013 and 2012, the Company did not repurchase any shares of Company common stock under this program.
During fiscal 2014, the Company repurchased an aggregate 6,833 shares of Class A Common Stock at a total cost of approximately $.3 million. The shares purchased represent shares tendered as payment of employee withholding taxes due upon the issuance of a share-based award. During fiscal 2013, the Company repurchased an aggregate 36,354 shares of Common Stock at a total cost of $1.3 million and an aggregate 39,965 shares of Class A Common Stock at a total cost of $1.1 million. During fiscal 2012, the Company repurchased an aggregate 3,808 shares of Common Stock at a total cost of approximately $.1 million and an aggregate 7,510 shares of Class A Common Stock at a total cost of $.2 million. The transactions in fiscal 2013 and 2012 occurred as settlement for employee taxes due pertaining to exercises of non-qualified stock options. The shares purchased in fiscal 2014, 2013 and 2012 did not impact the number of shares authorized for future purchase under the Company’s share repurchase program and are reflected as redemptions of common stock related to share-based compensation in the Company’s Consolidated Statements of Shareholders’ Equity and the Company’s Consolidat-ed Statements of Cash Flows.
Special and Extraordinary Cash Dividends
In January 2014, the Company paid a special and extraordinary $.35 per share cash dividend on both classes of HEICO’s common stock as well as its regular semi-annual $.06 per share cash dividend. In December 2012, the Company paid a special and extraordinary $1.712 per share cash dividend on both classes of HEICO’s common stock as well as a regular semi-annual $.048 per share cash dividend that was accelerated from January 2013. The dividends, which aggregated $27.2 million in fiscal 2014 and $116.6 million in fiscal 2013, were principally funded from borrowings under the Company’s revolving credit facility.
Noncontrolling Interests
Consistent with the Company’s past practice of increasing its ownership in certain non-wholly-owned subsidiaries, on February 14, 2014, HEICO Corporation acquired the 20% noncontrolling interest held by LHT in four of the Company’s existing subsidiaries principally operating in the specialty products and distribution businesses within HEICO Aerospace (the “Transaction”). Pursuant to the Transaction, HEICO Aerospace paid dividends proportional to the ownership (80%/20%) to HEICO and LHT, and HEICO trans-ferred the businesses to HEICO Flight Support Corp. HEICO did not record any gain or loss in connection with the Transaction. LHT’s dividend of $67.4 million was paid in cash, principally using proceeds from the Company’s revolving credit facility. LHT remains a 20% owner in HEICO Aerospace, a leading producer of PMA parts and component repair and overhaul services.
During fiscal 2014, the Put Right held by the noncontrolling interest holders in one of the Company’s subsidiaries expired, resulting in a reclassification of the Redemption Amount from redeemable noncontrolling interests (temporary equity) to noncontrolling interests (permanent equity). See Note 11, Redeemable Noncontrolling Interests, for additional information.
NOTE 9. SHARE-BASED COMPENSATION
The Company currently maintains one share-based compensation plan, the HEICO Corporation 2012 Incentive Compensation Plan (“2012 Plan”), under which it may grant various forms of share-based compensation awards including, but not limited to, stock options, restricted stock, restricted stock awards and stock appreciation rights. The 2012 Plan became effective in March 2012, the same time the Company’s 2002 Stock Option Plan (“2002 Plan”) and its remaining 2.0 million unissued shares expired. Also, in March 2012, the Company made a decision to no longer issue options under its Non-Qualified Stock Option Plan (“NQSOP”) under which less than .1 million remaining unissued shares were cancelled. Options outstanding under the 2002 Plan and NQSOP may be exercised pursuant to their terms. The total number of shares approved by the shareholders of the Company for the 2012 Plan is 2.7 million plus any options outstanding under the 2002 Plan and NQSOP as of the 2012 Plan’s effective date and that are subsequently forfeited or expire. A total of 4.9 million shares of the Company’s common stock are reserved for issuance to employees, directors, officers and consultants as of October 31, 2014, including 3.3 million shares currently under option and 1.6 million shares available for future grants.
Stock options granted pursuant to the 2012 Plan may be designated as Common Stock and/or Class A Common Stock in such pro-portions as shall be determined by the Board of Directors or the Stock Option Plan Committee at its sole discretion. The exercise price per share of a stock option granted under the 2012 Plan may not be less than the fair market value of the designated class of Company common stock as of the date of grant and stock option grants vest ratably over a period specified as of the date of grant (generally five years) and expire ten years after the date of grant. Options issued under the 2012 Plan may be designated as incentive stock options or non-qualified stock options, but only employees are eligible to receive incentive stock options. The 2012 Plan will terminate no later than the tenth anniversary of its effective date.

H E I C O C O R P O R A T I O N
A N D S U B S I D I A R I E S
5 0 / H E I C O C O R P O R A T I O N
N O T E S T O C O N S O L I D AT E D F I N A N C I A L S TAT E M E N T S
Information concerning share-based activity for each of the last three fiscal years ended October 31 is as follows (in thousands, except per share data): Shares Under Option
Shares Available Weighted Average For Grant Shares Exercise Price
Outstanding as of October 31, 2011 2,083 2,893 $ 14.50Shares approved by the Shareholders for the 2012 Incentive Compensation Plan 2,656 — $ — Granted (323) 323 $ 24.97Cancelled unissued shares under the NQSOP (23) — $ —Expired unissued shares under the 2002 Plan (2,004) — $ —Exercised — (317) $ 3.22Outstanding as of October 31, 2012 2,389 2,899 $ 16.90Granted (549) 549 $ 35.74Exercised — (306) $ 3.78Outstanding as of October 31, 2013 1,840 3,142 $ 21.48Granted (161) 161 $ 43.37Stock award issuance (62) — $ —Exercised — (39) $ 18.36Outstanding as of October 31, 2014 1,617 3,264 $ 22.59
Information concerning stock options outstanding (all of which are vested or expected to vest) and stock options exercisable by class of common stock as of October 31, 2014 is as follows (in thousands, except per share and contractual life data):
Options Outstanding
Weighted Weighted Average Aggregate Number Average Remaining Contractual Intrinsic Outstanding Exercise Price Life (Years) Value
Common Stock 1,484 $ 21.14 5.4 $ 49,119Class A Common Stock 1,780 $ 23.80 6.6 39,113 3,264 $ 22.59 6.1 $ 88,232
Options Exercisable
Weighted Weighted Average Aggregate Number Average Remaining Contractual Intrinsic Outstanding Exercise Price Life (Years) Value
Common Stock 1,181 $ 18.32 5.0 $ 42,425Class A Common Stock 854 $ 16.48 5.2 24,997 2,035 $ 17.55 5.1 $ 67,422
Information concerning stock options exercised is as follows (in thousands):
Year ended October 31, 2014 2013 2012
Cash proceeds from stock option exercises $ 708 $ 463 $ 833Tax benefit realized from stock option exercises 93 5,191 13,164Intrinsic value of stock option exercises 929 8,033 7,008
Net income attributable to HEICO for the fiscal years ended October 31, 2014, 2013 and 2012 includes compensation expense of $6.2 million, $5.1 million and $3.9 million, respectively, and an income tax benefit of $2.4 million, $2.0 million and $1.5 million, respectively, related to the Company’s stock options. Substantially all of the stock option compensation expense was recorded as a component of selling, general and administrative expenses in the Company’s Consolidated Statements of Operations. As of October 31, 2014, there was $14.5 million of pre-tax unrecognized compensation expense related to nonvested stock options, which is expected to be recognized over a weighted average period of approximately 3.2 years. The total fair value of stock options that vested in fiscal 2014, 2013 and 2012 was $5.9 million, $4.5 million and $3.6 million, respectively. If there were a change in control of the Company, all of the unvested options outstanding as of October 31, 2014 would become immediately exercisable.
For the fiscal years ended October 31, 2014, 2013 and 2012, the excess tax benefit resulting from tax deductions in excess of the cumulative compensation cost recognized for stock options exercised was $.1 million, $5.1 million and $12.1 million, respectively, and is presented as a financing activity in the Company’s Consolidated Statements of Cash Flows.

H E I C O C O R P O R A T I O N
A N D S U B S I D I A R I E S
H E I C O C O R P O R A T I O N / 5 1
N O T E S T O C O N S O L I D AT E D F I N A N C I A L S TAT E M E N T S
The fair value of each stock option grant was estimated on the date of grant using the Black-Scholes option-pricing model based on the following weighted average assumptions for the fiscal years ended October 31, 2014, 2013 and 2012:
2014 2013 2012 Class A Class A Class A Common Common Common Common Stock Stock Stock Stock
Expected stock price volatility 38.04% 39.94% 38.40% 40.11%Risk-free interest rate 2.06% 2.02% 1.85% 1.19%Dividend yield .38% .24% .33% .32%Forfeiture rate .00% .00% .00% .00%Expected option life (years) 7 9 7 7Weighted average fair value $ 17.23 $ 20.24 $ 14.29 $ 10.20
In fiscal 2013, the Company granted restricted shares in the common stock of one of its subsidiaries representing approximately 1% of the equity of the subsidiary. The shares cliff vest in fiscal 2018. Net income attributable to HEICO includes compensation expense of $.2 million in fiscal 2014 and less than $.1 million in fiscal 2013 related to unvested restricted shares. As of October 31, 2014, there was $.7 million of pre-tax unrecognized compensation expense related to the unvested restricted shares, which is expected to be recognized over the next 3.2 years.
In fiscal 2014, the Company issued 24,982 shares of Class A Common Stock in lieu of cash to satisfy an employee bonus award, which was accrued in fiscal 2013. Pursuant to the terms of the 2012 Plan, this stock award reduced the share reserve for issuance under the 2012 Plan by 62,455 shares.
NOTE 10. EMPLOYEE RETIREMENT PLANS
The HEICO Savings and Investment Plan (the “401(k) Plan”) is a qualified defined contribution retirement plan under which eligible employees of the Company and its participating subsidiaries may make Elective Deferral Contributions up to the limitations set forth in Section 402(g) of the Internal Revenue Code. The Company generally makes a 25% or 50% Employer Matching Contribution, as determined by the Board of Directors, based on a participant’s Elective Deferral Contribution up to 6% of the participant’s Compen-sation for the Elective Deferral Contribution period. The 401(k) Plan also provides that the Company may make additional Employer Contributions. Employer Contributions may be contributed in the form of the Company’s common stock or cash, as determined by the Company. Employer Contributions awarded in the form of Company common stock are valued based on the fair value of the underlying shares as of the effective date of contribution. Employer Contributions may be diversified by a participant into any of the participant-di-rected investment options of the 401(k) Plan; however, Employee Contributions may not be invested in Company common stock.
Participants receive 100% vesting of Employee Contributions and cash dividends received on Company common stock. Vesting in Employer Contributions is based on a participant’s number of years of vesting service. Employer Contributions to the 401(k) Plan charged to income in fiscal 2014, 2013 and 2012 totaled $6.3 million, $3.2 million and $3.0 million, respectively, and were made through the issuance of new shares of Company common stock and the use of forfeited shares within the 401(k) Plan.
In fiscal 2012, the Company’s Board of Directors authorized 187,500 shares of the Company’s Common Stock and 187,500 shares of the Company’s Class A Common Stock be reserved and made available for issuance under the 401(k) Plan. Information concerning share-based activity pertaining to the 401(k) Plan for each of the last three fiscal years ended October 31 is as follows (in thousands):
Class A Common Common Stock Stock
Shares available for issuance as of October 31, 2011 — —Shares registered for issuance to the 401(k) Plan 187 187Issuance of common stock to 401(k) Plan (17) (17)Shares available for issuance as of October 31, 2012 170 170Issuance of common stock to 401(k) Plan (45) (45)Shares available for issuance as of October 31, 2013 125 125Issuance of common stock to 401(k) Plan (57) (57)Shares available for issuance as of October 31, 2014 68 68

H E I C O C O R P O R A T I O N
A N D S U B S I D I A R I E S
5 2 / H E I C O C O R P O R A T I O N
N O T E S T O C O N S O L I D AT E D F I N A N C I A L S TAT E M E N T S
In connection with a fiscal 2013 acquisition, the Company assumed a frozen qualified defined benefit pension plan (the “Plan”). The Plan’s benefits are based on employee compensation and years of service. However, since the Plan was closed to new participants effective December 31, 2004, the accrued benefit for Plan participants was fixed as of the date of acquisition and therefore the Plan’s accumulated benefit obligation is equal to the projected benefit obligation. The acquired projected benefit obligation and plan assets were recorded at fair value as of the acquisition date.
Changes in the Plan’s projected benefit obligation and plan assets during fiscal 2013 subsequent to the acquisition and for the fiscal year ended October 31, 2014 are as follows (in thousands):
Change in projected benefit obligation: Acquired projected benefit obligation $ 14,539 Actuarial gain (1,165) Interest cost 236 Benefits paid (397)Projected benefit obligation as of October 31, 2013 13,213 Actuarial loss 930 Interest cost 610 Benefits paid (938)Projected benefit obligation as of October 31, 2014 $ 13,815 Change in plan assets: Acquired plan assets $ 11,674 Actual return on plan assets 120 Benefits paid (397)Fair value of plan assets as of October 31, 2013 11,397 Actual return on plan assets 764 Employer contributions 136 Benefits paid (938)Fair value of plan assets as of October 31, 2014 $ 11,359 Funded status as of October 31, 2013 ($ 1,816)Funded status as of October 31, 2014 ($ 2,456)
The $2.5 million and $1.8 million difference between the projected benefit obligation and fair value of plan assets as of October 31, 2014 and October 31, 2013, respectively, are included in other long-term liabilities within the Company’s Consolidated Balance Sheets. Additionally, the Plan experienced a $.9 million net actuarial loss and $1.0 million net actuarial gain during fiscal 2014 and 2013, respectively, that were recognized in other comprehensive income (where they are reported net of ($.3) million and $.4 million of tax, respectively). As of October 31, 2014, $.1 million represents the total actuarial gain in accumulated other comprehensive income that have yet to be recognized as a component of net periodic pension income. The Company does not expect to recognize any of the amount within accumulated other comprehensive income as of October 31, 2014 as a component of net periodic pension income during fiscal 2015.
Weighted average assumptions used to determine the projected benefit obligation as of October 31, 2014 and October 31, 2013 and net pension income for the fiscal year ended October 31, 2014 and October 31, 2013 are as follows:
Projected Benefit Obligation Net Pension Income 2014 2013 2014 2013
Discount rate 4.20% 4.79% 4.79% 3.99%Expected return on plan assets N/A N/A 6.75% 6.75%
The discount rate was determined using the results of a bond yield curve model based on a portfolio of high-quality bonds matching expected Plan benefit payments. The expected return on Plan assets was based upon the current and expected target asset allocation and investment return estimates for the Plan’s equity and fixed income securities. In establishing this assumption, the Company considers many factors including both the historical rate of return and projected inflation-adjusted real rate of return on the Plan’s various asset classes and the expected working lifetime for Plan participants.

H E I C O C O R P O R A T I O N
A N D S U B S I D I A R I E S
H E I C O C O R P O R A T I O N / 5 3
N O T E S T O C O N S O L I D AT E D F I N A N C I A L S TAT E M E N T S
Components of net pension income for the fiscal years ended October 31, 2014 and October 31, 2013 that were recorded within the Company’s Consolidated Statements of Operations are as follows (in thousands):
Year ended October 31, 2014 2013
Expected return on plan assets $ 739 $ 320Interest cost 610 236Net pension income $ 129 $ 84
The Company anticipates making contributions of $.1 million to the Plan during fiscal 2015. Estimated future benefit payments to be made during each of the next five fiscal years and in aggregate during the succeeding five fiscal years are as follows (in thousands):
Year ending October 31,
2015 $ 921 2016 904 2017 897 2018 868 2019 895 2020-2024 4,244
The fair value of the Plan’s assets are set forth by level within the fair value hierarchy in the following tables (in thousands):
As of October 31, 2014
Quoted Prices Significant Significant in Active Markets Other Observable Unobservable for Identical Assets Inputs Inputs (Level 1) (Level 2) (Level 3) Total
Equity securities $ 5,678 $ — $ — $ 5,678Fixed income securities 5,563 — — 5,563Money market funds and cash 118 — — 118 $ 11,359 $ — $ — $ 11,359
As of October 31, 2013
Quoted Prices Significant Significant in Active Markets Other Observable Unobservable for Identical Assets Inputs Inputs (Level 1) (Level 2) (Level 3) Total
Equity securities $ 2,212 $ — $ — $ 2,212Fixed income securities 9,060 — — 9,060Money market funds and cash 125 — — 125 $ 11,397 $ — $ — $ 11,397
Equity securities consist of investments in common stocks, mutual funds and exchange traded funds. Fixed income securities consist of investments in mutual funds.
The Plan’s actual and targeted asset allocations by investment category are as follows:
As of October 31, 2014 2013 Actual Target Actual Target
Equity securities 50% 50% 19% 20%Fixed income securities 49% 50% 80% 80%Money market funds and cash 1% —% 1% —% 100% 100% 100% 100%
During fiscal 2014, the Company modified the Plan’s asset allocation policy from that which was established prior to the acquisition. The Company’s objective is to maximize long-term investment return while maintaining an acceptable level of risk that is accomplished through broad diversification of the Plan’s assets.

H E I C O C O R P O R A T I O N
A N D S U B S I D I A R I E S
5 4 / H E I C O C O R P O R A T I O N
N O T E S T O C O N S O L I D AT E D F I N A N C I A L S TAT E M E N T S
NOTE 11. REDEEMABLE NONCONTROLLING INTERESTS
The holders of equity interests in certain of the Company’s subsidiaries have rights (“Put Rights”) that may be exercised on varying dates causing the Company to purchase their equity interests through fiscal 2022. The Put Rights, all of which relate either to common shares or membership interests in limited liability companies, provide that the cash consideration to be paid for their equity interests (the “Redemption Amount”) be at fair value or at a formula that management intended to reasonably approximate fair value based solely on a multiple of future earnings over a measurement period. As of October 31, 2014, management’s estimate of the aggregate Redemption Amount of all Put Rights that the Company would be required to pay is approximately $40.0 million. The actual Redemption Amount will likely be different. The aggregate Redemption Amount of all Put Rights was determined using probability adjusted internal estimates of future earnings of the Company’s subsidiaries with Put Rights while considering the actual or earliest exercise date, the measurement period and any applicable fair value adjustments. The portion of the estimated Redemption Amount as of October 31, 2014 redeemable at fair value is approximately $27.7 million and the portion redeemable based solely on a multiple of future earnings is approximately $12.3 million.
A summary of the put and call rights associated with the redeemable noncontrolling interests in certain of the Company’s subsidiar-ies and a description of any transactions involving redeemable noncontrolling interests during fiscal 2014, 2013 and 2012 is as follows:
The Company acquired an 80.1% interest in a subsidiary through the ETG in fiscal 2004. As part of the purchase agreement, the noncontrolling interest holders had the right to cause the Company to purchase their interests over a five-year period. During fiscal 2014, the noncontrolling interest holders’ Put Right expired, resulting in a reclassification of the Redemption Amount from redeemable noncontrolling interests (temporary equity) to noncontrolling interests (permanent equity). Furthermore, the Company has the right to purchase the noncontrolling interests over a five-year period beginning in fiscal 2015, or sooner under certain conditions.
Pursuant to the purchase agreement related to the acquisition of an 85% interest in a subsidiary by the ETG in fiscal 2005, the noncontrolling interest holders have the right to cause the Company to purchase their interests over a four-year period beginning in fiscal 2007 or thereafter. Certain noncontrolling interest holders exercised their option during prior years, which resulted in the Company increasing its ownership interest in the subsidiary to 95.9% effective fiscal 2011.
Pursuant to the purchase agreement related to the acquisition of a 51% interest in a subsidiary by the FSG in fiscal 2006, certain noncontrolling interest holders exercised their option to cause the Company to purchase an aggregate 29% interest, which was completed in fiscal 2011. During fiscal 2012, the remaining noncontrolling interest holder exercised their option to cause the Company to purchase the remaining 20% interest, of which 6.7% was acquired effective February 2012 and 13.3% was acquired effective December 2012. During fiscal 2014, the Company paid a purchase price adjustment for the portion of the redeemable noncontrolling interests acquired in December 2012 that was based on the acquired entity’s actual fiscal 2013 earnings.
The Company acquired an 80.1% interest in a subsidiary through the FSG in fiscal 2006. As part of the purchase agreement, the Company has the right to purchase the noncontrolling interests over a four-year period and the noncontrolling interest holders have the right to cause the Company to purchase the same equity interests over the same period.
The Company acquired an 80.1% interest in a subsidiary through the FSG in fiscal 2008 and acquired an additional 2.2% interest in fiscal 2010, which increased the Company’s ownership interest to 82.3%. Pursuant to the original purchase agreement as amended in fiscal 2012, the Company has the right to purchase the remaining noncontrolling interests over a five-year period beginning in fiscal 2016, or sooner under certain conditions, and the noncontrolling interest holders have the right to cause the Company to purchase the same equity interests over the same period.
The Company acquired an 82.5% interest in a subsidiary through the ETG in fiscal 2009. As part of the purchase agreement, the Company has the right to purchase the noncontrolling interests in a lump sum transaction and the noncontrolling interest holder has the right to cause the Company to purchase the same equity interests over the same period.
The Company acquired an 80.1% interest in a subsidiary through the FSG in fiscal 2011. As part of the purchase agreement, the Company has the right to purchase the noncontrolling interests over a two-year period beginning in fiscal 2015, or sooner under certain conditions, and the noncontrolling interest holders have the right to cause the Company to purchase the same equity interests over the same period.
During fiscal 2012, one of the subsidiaries of the ETG formed a new subsidiary which acquired certain assets and liabilities of two businesses in exchange for shares aggregating 22% of its equity interest, valued at $.4 million. The noncontrolling interest holders have the right to cause the Company to purchase their equity interests over a two-year period beginning in fiscal 2017.
The Company acquired an 84% interest in a subsidiary through the FSG in fiscal 2012. As part of the purchase agreement, the Company has the right to purchase the noncontrolling interests over a four-year period beginning in fiscal 2018, or sooner under certain conditions, and the noncontrolling interest holders have the right to cause the Company to purchase the same equity interests over the same period.

H E I C O C O R P O R A T I O N
A N D S U B S I D I A R I E S
H E I C O C O R P O R A T I O N / 5 5
N O T E S T O C O N S O L I D AT E D F I N A N C I A L S TAT E M E N T S
The Company acquired an 80.1% interest in a subsidiary through the FSG in fiscal 2012. As part of the purchase agreement, the Company has the right to purchase the noncontrolling interests over a four-year period beginning in fiscal 2019, or sooner under certain conditions, and the noncontrolling interest holder has the right to cause the Company to purchase the same equity interests over the same period.
The purchase prices of the redeemable noncontrolling interests acquired in fiscal 2014 and 2012 were paid using cash provided by operating activities. The purchase price of the redeemable noncontrolling interests acquired in fiscal 2013 was paid using proceeds from the Company’s revolving credit facility. The aggregate cost of the redeemable noncontrolling interests acquired was $1.2 million, $16.6 million and $7.6 million in fiscal 2014, 2013 and 2012, respectively.
NOTE 12. NET INCOME PER SHARE ATTRIBUTABLE TO HEICO SHAREHOLDERS
The computation of basic and diluted net income per share attributable to HEICO shareholders is as follows (in thousands, except per share data):
Year ended October 31, 2014 2013 2012
Numerator: Net income attributable to HEICO $ 121,293 $ 102,396 $ 85,147 Adjustments to redemption amount of redeemable noncontrolling interests (see Note 1) — — 13 Net income attributable to HEICO, as adjusted $ 121,293 $ 102,396 $ 85,160 Denominator: Weighted average common shares outstanding - basic 66,463 66,298 65,861 Effect of dilutive stock options 990 684 763 Weighted average common shares outstanding - diluted 67,453 66,982 66,624 Net income per share attributable to HEICO shareholders: Basic $ 1.82 $ 1.54 $ 1.29 Diluted $ 1.80 $ 1.53 $ 1.28 Anti-dilutive stock options excluded 430 754 888
NOTE 13. QUARTERLY FINANCIAL INFORMATION (UNAUDITED)
First Second Third Fourth(in thousands, except per share data) Quarter Quarter Quarter Quarter
Net sales: 2014 $ 266,826 $ 282,232 $ 291,030 $ 292,223 2013 $ 216,490 $ 237,708 $ 267,133 $ 287,426Gross profit: 2014 $ 92,117 $ 99,922 $ 103,327 $ 102,946 2013 $ 77,589 $ 89,448 $ 97,540 $ 106,604Net income from consolidated operations: 2014 $ 32,562 $ 32,780 $ 37,352 $ 36,078 2013 $ 24,984 $ 29,046 $ 34,768 $ 35,763Net income attributable to HEICO: 2014 $ 27,455 $ 28,367 $ 33,366 $ 32,105 2013 $ 19,958 $ 23,700 $ 28,947 $ 29,791Net income per share attributable to HEICO: Basic: 2014 $ .41 $ .43 $ .50 $ .48 2013 $ .30 $ .36 $ .44 $ .45 Diluted: 2014 $ .41 $ .42 $ .49 $ .48 2013 $ .30 $ .35 $ .43 $ .44

H E I C O C O R P O R A T I O N
A N D S U B S I D I A R I E S
5 6 / H E I C O C O R P O R A T I O N
N O T E S T O C O N S O L I D AT E D F I N A N C I A L S TAT E M E N T S
During the fourth quarter of fiscal 2014, the Company recorded a reduction in accrued contingent consideration related to a fiscal 2012 acquisition that was partially offset by impairment losses related to the write-down of certain intangible assets at the acquired business resulting in an increase in net income attributable to HEICO of approximately $1.7 million, or $.03 per basic and diluted share.
During the third quarter of fiscal 2014, the Company recorded a reduction in accrued contingent consideration related to a fiscal 2013 acquisition that was partially offset by impairment losses related to the write-down of certain intangible assets and lower than expected operating income at the acquired business resulting in an increase in net income attributable to HEICO of approximately $3.4 million, or $.05 per basic and diluted share.
During the first quarter of fiscal 2014, the Company recorded a reduction in accrued contingent consideration related to a fiscal 2013 acquisition that was partially offset by lower than expected operating income at the acquired business resulting in an increase in net income attributable to HEICO of approximately $2.6 million, or $.04 per basic and diluted share.
During the third quarter of fiscal 2013, the Company filed its fiscal 2012 U.S. federal and state tax returns. As a result, the Company recognized a benefit, which increased net income attributable to HEICO by approximately $.8 million, or $.01 per basic and diluted share, net of expenses, from higher research and development tax credits.
During the first quarter of fiscal 2013, the Company recognized an income tax credit for qualified research and development activities for the last ten months of fiscal 2012 upon the retroactive extension of the U.S. federal research and development tax credit in January 2013 to cover a two-year period from January 1, 2012 to December 31, 2013. The tax credit, net of expenses, increased net income attributable to HEICO by $1.0 million, or $.01 per basic and diluted share.
Due to changes in the average number of common shares outstanding, net income per share attributable to HEICO for the full fiscal year may not equal the sum of the four individual quarters.
NOTE 14. OPERATING SEGMENTS
The Company has two operating segments: the Flight Support Group (“FSG”), consisting of HEICO Aerospace and HEICO Flight Support Corp. and their collective subsidiaries; and the Electronic Technologies Group (“ETG”), consisting of HEICO Electronic and its subsidiaries. The FSG designs, manufactures, repairs, overhauls and distributes jet engine and aircraft component replacement parts. The parts and services are approved by the FAA. The FSG also manufactures and sells specialty parts as a subcontractor for aerospace and industrial original equipment manufacturers and the United States government and is a leading manufacturer of advanced niche components and complex composite assemblies for commercial aviation, defense and space applications. The ETG designs and manu-factures electronic, microwave, and electro-optical equipment and components, three-dimensional microelectronic and stacked memory products, high-speed interface products, high voltage interconnection devices, high voltage advanced power electronics products, power conversion products, underwater locator beacons, traveling wave tube amplifiers, harsh environment electronic connectors and other interconnect products, and RF and microwave amplifiers, transmitters, receivers and satellite microwave modules, units and integrated subsystems primarily for the aviation, defense, space, medical, telecommunications and electronics industries.
The Company’s reportable operating segments offer distinctive products and services that are marketed through different channels. They are managed separately because of their unique technology and service requirements.
Segment Profit or Loss
The accounting policies of the Company’s operating segments are the same as those described in Note 1, Summary of Significant Accounting Policies. Management evaluates segment performance based on segment operating income.

H E I C O C O R P O R A T I O N
A N D S U B S I D I A R I E S
H E I C O C O R P O R A T I O N / 5 7
N O T E S T O C O N S O L I D AT E D F I N A N C I A L S TAT E M E N T S
Information on the Company’s two operating segments, the FSG and the ETG, for each of the last three fiscal years ended October 31 is as follows (in thousands): Other, Primarily Segment Corporate and Consolidated FSG ETG Intersegment Totals
Year ended October 31, 2014: Net sales $ 762,801 $ 379,404 ($ 9,894) $ 1,132,311 Depreciation and amortization 19,843 27,106 808 47,757 Operating income 136,480 88,914 (22,006) 203,388 Capital expenditures 9,437 6,327 646 16,410 Total assets 676,824 703,144 109,246 1,489,214 Year ended October 31, 2013: Net sales $ 665,148 $ 350,033 ($ 6,424) $ 1,008,757 Depreciation and amortization 14,614 21,392 784 36,790 Operating income 122,058 83,063 (21,531) 183,590 Capital expenditures 10,190 7,748 390 18,328 Total assets 679,839 759,807 93,369 1,533,015 Year ended October 31, 2012: Net sales $ 570,325 $ 331,598 ($ 4,576) $ 897,347 Depreciation and amortization 10,451 19,365 840 30,656 Operating income 103,943 77,438 (18,087) 163,294 Capital expenditures 7,045 7,248 969 15,262 Total assets 487,188 636,660 68,998 1,192,846
Major Customer and Geographic Information
The Company markets its products and services in approximately 100 countries. The following table summarizes the Company’s net sales to customers located in the United States and to those in other countries for each of the last three fiscal years ended October 31 (in thousands). Net sales are attributed to countries based on the location of the customer. Net sales to any one customer or originating from any one country did not account for 10% or more of the Company’s consolidated net sales during any of the last three fiscal years. The following table also summarizes the Company’s long-lived assets held within and outside of the United States as of October 31 of the last three fiscal years (in thousands). Long-lived assets consist of net property, plant and equipment.
2014 2013 2012
Net sales: United States of America $ 754,616 $ 654,096 $ 596,922 Other countries 377,695 354,661 300,425 Total net sales $ 1,132,311 $ 1,008,757 $ 897,347 Long-lived assets: United States of America $ 84,116 $ 87,247 $ 70,380 Other countries 9,749 10,490 10,138 Total long-lived assets $ 93,865 $ 97,737 $ 80,518

H E I C O C O R P O R A T I O N
A N D S U B S I D I A R I E S
5 8 / H E I C O C O R P O R A T I O N
N O T E S T O C O N S O L I D AT E D F I N A N C I A L S TAT E M E N T S
NOTE 15. COMMITMENTS AND CONTINGENCIES
Lease Commitments
The Company leases certain property and equipment, including manufacturing facilities and office equipment under operating leases. Some of these leases provide the Company with the option after the initial lease term either to purchase the property at the then fair market value or renew the lease at the then fair rental value. Generally, management expects that leases will be renewed or replaced by other leases in the normal course of business.
Future minimum payments under non-cancelable operating leases for the next five fiscal years and thereafter are estimated to be as follows (in thousands):
Year ending October 31,
2015 $ 9,787 2016 8,830 2017 6,704 2018 3,239 2019 1,458 Thereafter 5,903 Total minimum lease commitments $ 35,921
Total rent expense charged to operations for operating leases in fiscal 2014, 2013 and 2012 amounted to $11.2 million, $9.8 million and $7.9 million, respectively.
Guarantees
As of October 31, 2014, the Company has arranged for standby letters of credit aggregating $2.3 million, which are supported by its revolving credit facility. One letter of credit in the amount of $1.5 million is to satisfy the security requirement of the Company’s insurance company for potential workers’ compensation claims and the remainder pertain to performance guarantees related to customer contracts entered into by certain of the Company’s subsidiaries.
Product Warranty
Changes in the Company’s product warranty liability in fiscal 2014 and 2013 are as follows (in thousands):
Year ended October 31, 2014 2013
Balances as of beginning of year $ 3,233 $ 2,571 Accruals for warranties 3,005 1,308 Acquired warranty liabilities — 556 Warranty claims settled (2,159) (1,202)Balances as of end of year $ 4,079 $ 3,233
Litigation
The Company is involved in various legal actions arising in the normal course of business. Based upon the Company’s and its legal counsel’s evaluations of any claims or assessments, management is of the opinion that the outcome of these matters will not have a material adverse effect on the Company’s results of operations, financial position or cash flows.
NOTE 16. SUPPLEMENTAL DISCLOSURES OF CASH FLOW INFORMATION
The following table presents supplemental cash flow information for fiscal 2014, 2013 and 2012 (in thousands):
Year ended October 31, 2014 2013 2012
Cash paid for interest $ 5,550 $ 3,514 $ 2,420 Cash paid for income taxes 72,723 62,631 43,470 Cash received from income tax refunds (395) (33) (1,555)Property, plant and equipment acquired through capital lease obligations 131 — 295

H E I C O C O R P O R A T I O N / 5 9
H E I C O C O R P O R A T I O N
A N D S U B S I D I A R I E S
Management of HEICO Corporation is responsible for establishing and maintaining adequate internal control over financial reporting. Internal control over financial reporting is a process designed to provide reasonable assurance regarding the reliability of financial reporting and the preparation of financial statements for external purposes in accordance with generally accepted accounting principles. A company’s internal control over financial reporting includes those policies and procedures that (i) pertain to the maintenance of records that in reasonable detail accurately and fairly reflect the transactions and dispositions of the assets of the Company; (ii) provide reasonable assurance that transactions are recorded as necessary to permit preparation of financial statements in accordance with generally accepted accounting principles, and that receipts and expenditures of the Company are being made only in accordance with authorizations of management and directors of the Company; and (iii) provide reasonable assurance regarding prevention or timely detection of unauthorized acquisition, use or disposition of the Company’s assets that could have a material effect on the financial statements.
Because of inherent limitations, internal control over financial reporting may not prevent or detect misstatements. Projections of any evaluation of effectiveness to future periods are subject to the risks that controls may become inadequate because of changes in conditions, or that the degree of compliance with the policies or procedures may deteriorate.
Management, under the supervision of and with the participation of the Company’s Chief Executive Officer and the Chief Financial Officer, assessed the effectiveness of the Company’s internal control over financial reporting based on the criteria set forth by the Committee of Sponsoring Organizations of the Treadway Commission in Internal Control - Integrated Framework (1992). Based on its assessment, management concluded that the Company’s internal control over financial reporting is effective as of October 31, 2014.
Deloitte & Touche LLP, an independent registered public accounting firm, audited the Company’s consolidated financial statements included in this Annual Report for the year ended October 31, 2014. A copy of their report is included in this Annual Report. Deloitte & Touche LLP has issued their attestation report on management’s internal control over financial reporting, which is set forth below.
E X E C U T I V E O F F I C E R C E R T I F I C AT I O N S
HEICO Corporation has filed with the U.S. Securities and Exchange Commission as Exhibits 31.1 and 31.2 to its Form 10-K for the year ended October 31, 2014, the required certifications of its Chief Executive Officer (CEO) and Chief Financial Officer under Section 302 of the Sarbanes-Oxley Act of 2002 regarding the quality of its public disclosures. HEICO Corporation’s CEO also has submitted to the New York Stock Exchange (NYSE) following the March 2014 annual meeting of shareholders, the annual CEO certification stating that he is not aware of any violation by HEICO Corporation of the NYSE’s corporate governance listing standards. All Board of Directors Committee Charters, Corporate Governance Guidelines as well as HEICO’s Code of Ethics and Business Conduct are located on HEICO’s web site at www.heico.com.
M A N A G E M E N T ’ S A N N U A L R E P O R T O N I N T E R N A L C O N T R O L O V E R F I N A N C I A L R E P O R T I N G
H E I C O C O R P O R A T I O N
A N D S U B S I D I A R I E S
H E I C O C O R P O R A T I O N
A N D S U B S I D I A R I E S
6 0 / H E I C O C O R P O R A T I O N
To the Board of Directors and Shareholders ofHEICO CorporationHollywood, Florida
We have audited the accompanying consolidated balance sheets of HEICO Corporation and subsidiaries (the “Company”) as of October 31, 2014 and 2013, and the related consolidated statements of operations, comprehensive income, shareholders’ equity, and cash flows for each of the three years in the period ended October 31, 2014. These financial statements are the responsibility of the Company’s management. Our responsibility is to express an opinion on these financial statements based on our audits.
We conducted our audits in accordance with the standards of the Public Company Accounting Oversight Board (United States). Those standards require that we plan and perform the audit to obtain reasonable assurance about whether the financial statements are free of material misstatement. An audit includes examining, on a test basis, evidence supporting the amounts and disclosures in the financial statements. An audit also includes assessing the accounting principles used and significant estimates made by management, as well as evaluating the overall financial statement presentation. We believe that our audits provide a reasonable basis for our opinion.
In our opinion, such consolidated financial statements present fairly, in all material respects, the financial position of HEICO Corporation and subsidiaries as of October 31, 2014 and 2013, and the results of their operations and their cash flows for each of the three years in the period ended October 31, 2014, in conformity with accounting principles generally accepted in the United States of America.
We have also audited, in accordance with the standards of the Public Company Accounting Oversight Board (United States), the Company’s internal control over financial reporting as of October 31, 2014, based on the criteria established in Internal Control - Integrated Framework (1992) issued by the Committee of Sponsoring Organizations of the Treadway Commission and our report dated December 18, 2014 expressed an unqualified opinion on the Company’s internal control over financial reporting.
/s/ DELOITTE & TOUCHE LLPCertified Public Accountants
Miami, FloridaDecember 18, 2014
R E P O R T O F I N D E P E N D E N T R E G I S T E R E D P U B L I C A C C O U N T I N G F I R M

H E I C O C O R P O R A T I O N
A N D S U B S I D I A R I E S
H E I C O C O R P O R A T I O N / 6 1
R E P O R T O F I N D E P E N D E N T R E G I S T E R E D P U B L I C A C C O U N T I N G F I R M
To the Board of Directors and Shareholders of HEICO CorporationHollywood, Florida
We have audited the internal control over financial reporting of HEICO Corporation and subsidiaries (the “Company”) as of October 31, 2014, based on criteria established in Internal Control - Integrated Framework (1992) issued by the Committee of Sponsoring Organizations of the Treadway Commission. The Company’s management is responsible for maintaining effective internal control over financial reporting and for its assessment of the effectiveness of internal control over financial reporting, included in the accompanying Management’s Annual Report on Internal Control Over Financial Reporting. Our responsibility is to express an opinion on the Company’s internal control over financial reporting based on our audit.
We conducted our audit in accordance with the standards of the Public Company Accounting Oversight Board (United States). Those standards require that we plan and perform the audit to obtain reasonable assurance about whether effective internal control over financial reporting was maintained in all material respects. Our audit included obtaining an understanding of internal control over financial reporting, assessing the risk that a material weakness exists, testing and evaluating the design and operating effectiveness of internal control based on the assessed risk, and performing such other procedures as we considered necessary in the circumstances. We believe that our audit provides a reasonable basis for our opinion.
A company’s internal control over financial reporting is a process designed by, or under the supervision of, the company’s principal executive and principal financial officers, or persons performing similar functions, and effected by the company’s board of directors, management, and other personnel to provide reasonable assurance regarding the reliability of financial reporting and the preparation of financial statements for external purposes in accordance with generally accepted accounting principles. A company’s internal control over financial reporting includes those policies and procedures that (1) pertain to the maintenance of records that, in reasonable detail, accurately and fairly reflect the transactions and dispositions of the assets of the company; (2) provide reasonable assurance that transactions are recorded as necessary to permit preparation of financial statements in accordance with generally accepted accounting principles and that receipts and expenditures of the company are being made only in accordance with authorizations of management and directors of the company; and (3) provide reasonable assurance regarding prevention or timely detection of unauthorized acquisition, use, or disposition of the company’s assets that could have a material effect on the financial statements.
Because of the inherent limitations of internal control over financial reporting, including the possibility of collusion or improper management override of controls, material misstatements due to error or fraud may not be prevented or detected on a timely basis. Also, projections of any evaluation of the effectiveness of the internal control over financial reporting to future periods are subject to the risk that the controls may become inadequate because of changes in conditions, or that the degree of compliance with the policies or procedures may deteriorate.
In our opinion, the Company maintained, in all material respects, effective internal control over financial reporting as of October 31, 2014, based on the criteria established in Internal Control - Integrated Framework (1992) issued by the Committee of Sponsoring Organizations of the Treadway Commission.
We have also audited, in accordance with the standards of the Public Company Accounting Oversight Board (United States), the consolidated financial statements as of and for the year ended October 31, 2014 of the Company and our report dated December 18, 2014 expressed an unqualified opinion on those financial statements.
/s/ DELOITTE & TOUCHE LLPCertified Public Accountants
Miami, Florida December 18, 2014

H E I C O C O R P O R A T I O N
A N D S U B S I D I A R I E S
6 2 / H E I C O C O R P O R A T I O N
M A R K E T F O R C O M PA N Y ’ S C O M M O N E Q U I T Y A N D R E L AT E D S T O C K H O L D E R M AT T E R S
Market Information
Our Class A Common Stock and Common Stock are listed and traded on the New York Stock Exchange (“NYSE”) under the symbols “HEI.A” and “HEI,” respectively. The following tables set forth, for the periods indicated, the high and low share prices for our Class A Common Stock and our Common Stock as reported on the NYSE, as well as the amount of cash dividends paid per share during such periods.
In September 2013, the Company’s Board of Directors declared a 5-for-4 stock split on both classes of the Company’s common stock. The stock split was effected as of October 23, 2013 in the form of a 25% stock dividend distributed to shareholders of record as of October 11, 2013. All applicable share and per share information has been adjusted retrospectively to give effect to the 5-for-4 stock split.
Class A Common Stock Common Stock Cash Dividends High Low High Low Per Share
Fiscal 2013: First Quarter $ 28.46 $ 23.84 $ 38.12 $ 29.88 $ 1.760 Second Quarter 29.17 25.77 37.84 32.61 — Third Quarter 32.34 26.84 45.96 33.82 .056 Fourth Quarter 42.04 31.48 56.09 45.54 —
Fiscal 2014: First Quarter $ 44.33 $ 36.77 $ 62.30 $ 51.44 $ .410 Second Quarter 48.90 37.11 65.04 50.29 — Third Quarter 43.40 38.25 57.69 48.54 .060 Fourth Quarter 46.73 39.46 54.62 46.03 —
As of December 16, 2014, there were 399 holders of record of our Class A Common Stock and 396 holders of record of our Common Stock.
In addition, as of December 16, 2014, there were approximately 5,100 holders of the Company’s Class A Common Stock and Common Stock who held their shares in brokerage or nominee accounts. The combined total of all record holders and brokerage or nominee holders is approximately 5,900 holders of both classes of common stock.
Performance Graphs
The following graph and table compare the total return on $100 invested in HEICO Common Stock and HEICO Class A Common Stock with the total return of $100 invested in the NYSE Composite Index and the Dow Jones U.S. Aerospace Index for the five-year period from October 31, 2009 through October 31, 2014. The NYSE Composite Index measures the performance of all common stocks listed on the NYSE. The Dow Jones U.S. Aerospace Index is comprised of large companies which make aircraft, major weapons, radar and other defense equipment and systems as well as providers of satellites and spacecrafts used for defense purposes. The total returns include the reinvestment of cash dividends.
Cumulative Total Return as of October 31,
2009 2010 2011 2012 2013 2014
HEICO Common Stock $ 100.00 $ 164.12 $ 235.50 $ 199.97 $ 364.20 $ 371.71 HEICO Class A Common Stock 100.00 151.03 200.43 194.95 333.51 395.91 NYSE Composite Index 100.00 111.48 112.23 121.99 148.52 160.92 Dow Jones U.S. Aerospace Index 100.00 136.69 146.77 157.84 242.66 248.88
HEICO Common Stock
HEICO Class A Common Stock
NYSE Composite Index
Dow Jones U.S. Aerospace Index
2009 2010 2011 2012 2013 2014
$440
$400
$360
$320
$280
$240
$200
$160
$120
$80
$40
0
Comparison of Five-Year Cumulative Total Return

H E I C O C O R P O R A T I O N
A N D S U B S I D I A R I E S
H E I C O C O R P O R A T I O N / 6 3
M A R K E T F O R C O M PA N Y ’ S C O M M O N E Q U I T Y A N D R E L AT E D S T O C K H O L D E R M AT T E R S
Cumulative Total Return as of October 31,
1990 1991 1992 1993 1994 1995
HEICO Common Stock $ 100.00 $ 141.49 $ 158.35 $ 173.88 $ 123.41 $ 263.25NYSE Composite Index 100.00 130.31 138.76 156.09 155.68 186.32 Dow Jones U.S. Aerospace Index 100.00 130.67 122.00 158.36 176.11 252.00
1996 1997 1998 1999 2000 2001
HEICO Common Stock $ 430.02 $ 1,008.31 $ 1,448.99 $ 1,051.61 $ 809.50 $ 1,045.86 NYSE Composite Index 225.37 289.55 326.98 376.40 400.81 328.78 Dow Jones U.S. Aerospace Index 341.65 376.36 378.66 295.99 418.32 333.32
2002 2003 2004 2005 2006 2007
HEICO Common Stock $ 670.39 $ 1,067.42 $ 1,366.57 $ 1,674.40 $ 2,846.48 $ 4,208.54 NYSE Composite Index 284.59 339.15 380.91 423.05 499.42 586.87 Dow Jones U.S. Aerospace Index 343.88 393.19 478.49 579.77 757.97 1,000.84
2008 2009 2010 2011 2012 2013
HEICO Common Stock $ 2,872.01 $ 2,984.13 $ 4,722.20 $ 6,557.88 $ 5,900.20 $ 10,457.14 NYSE Composite Index 344.96 383.57 427.61 430.46 467.91 569.69 Dow Jones U.S. Aerospace Index 602.66 678.00 926.75 995.11 1,070.15 1,645.24
2014
HEICO Common Stock $ 11,416.51 NYSE Composite Index 617.23 Dow Jones U.S. Aerospace Index 1,687.41
The following graph and table compare the total return on $100 invested in HEICO Common Stock since October 31, 1990 using the same indices shown on the five-year performance graph above. October 31, 1990 was the end of the first fiscal year following the date the current executive management team assumed leadership of the Company. No Class A Common Stock was outstanding as of October 31, 1990. As with the five-year performance graph, the total returns include the reinvestment of cash dividends.
Comparison of Twenty-Four Year Cumulative Total Return
90 91 92 93 94 95 96 97 98 99 00 01 02 03 04 05 06 07 08 09 10 11 12 13 14
HEICO Common Stock
NYSE Composite Index
Dow Jones U.S. Aerospace Index
$12,000
$11,000
$10,000
$9,000
$8,000
$7,000
$6,000
$5,000
$4,000
$3,000
$2,000
$1,000
$0

H E I C O C O R P O R A T I O N
A N D S U B S I D I A R I E S
6 4 / H E I C O C O R P O R A T I O N
O F F I C E R S A N D S E N I O R L E A D E R S H I P
Laurans A. MendelsonChairman of the Board of Directors andChief Executive Officer,HEICO Corporation
Jeff AndrewsVice President and General Manager,Niacc-Avitech Technologies, Inc.
Nadim BakhachePresident,EMD Technologies Incorporated
Keith BandolikPresident,Switchcraft, Inc. and Conxall
Vaughn BarnesPresident,HEICO Specialty Products Group andThermal Structures, Inc.
Paul BelisleVice President and General Manager,Turbine Kinetics, Inc.
Jeffrey S. BiederwolfSenior Vice President,HEICO Repair Group
Gregory S. BraseltonVice President and General Manager,Action Research Corporation
Russ CarlsonVice President of New Product -Business Development,HEICO Parts Group
Vladimir CerveraVice President and General Manager - Structures,HEICO Component Repair Group – Miami
William CockerellPresident and Founder,Ramona Research, Inc.
Barry CohenPresident and Founder,Prime Air, LLC
Ian D. CrawfordPresident and Founder,Analog Modules, Inc.
Alexandre de GuntenBusiness Development Officer,HEICO Aerospace Corporation
Sjuk de VriesChief Executive Officer and Founder,Aeroworks International Holdings, B.V.
Andrew J. FeeleyVice President and General Manager,CSI Aerospace, Inc.
Jerry GoldlustPresident and Founder,HVT Group, Inc. andDielectric Sciences, Inc.
Leon GonzalezVice President and General Manager,Sunshine Avionics LLC
William S. HarlowVice President - Acquisitions,HEICO Corporation
Clarence HightowerPresident,Reinhold Industries, Inc.
Walter HowardVice President and General Manager,Aero Design, Inc.
John F. HunterSenior Vice President,HEICO Parts Group
Tung HyunhPresident and Co-Founder,Lumina Power, Inc.
Thomas S. IrwinSenior Executive Vice President,HEICO Corporation
Elizabeth R. LetendreCorporate Secretary,HEICO Corporation
Jack LewisVice President and General Manager,Jet Avion Corporation
Omar LloretVice President and General Manager -Accessories,HEICO Component Repair Group – Miami
David A. LowryPresident and Co-Founder,Engineering Design Team, Inc.
Carlos L. Macau, Jr.Executive Vice President,Chief Financial Officer and Treasurer,HEICO Corporation
Patrick MarkhamVice President - Technical Services,HEICO Parts Group
Pierre MauricePresident and Co-Founder,3D Plus, SAS
Steve McHughChief Operating Officer,Electronic Technologies Group andPresident and Co-Founder,Santa Barbara Infrared, Inc. andIRCameras, LLC
Robert J. McKennaPresident,Leader Tech, Inc.
Eric A. MendelsonCo-President,HEICO Corporation
Victor H. MendelsonCo-President,HEICO Corporation
Luis J. MorellPresident,HEICO Parts Group andHEICO Repair Group
Michael NavonPresident and Founder,Blue Aerospace LLC
Joseph W. PallotGeneral Counsel,HEICO Corporation
Anish V. PatelPresident,Radiant Power Corp. andDukane Seacom, Inc.
Jeffrey PerkinsVice President and General Manager,Seal Dynamics – Tampa
James L. ReumExecutive Vice President (Emeritus), HEICO Aerospace Holdings Corp.
Rex ReumVice President and General Manager,Jetseal, Inc.
Thomas L. RickettsChief Executive Officer and Co-Founder,Connectronics Corp. and Wiremax
Troy J. RodriguezPresident and Co-Founder,Sierra Microwave Technology, LLC
James E. RoubianSenior Vice President - Manufacturing,HEICO Parts Group
Dr. Daniel M. SableChief Executive Officer and Co-Founder,VPT, Inc.
Mark ShahriaryChief Executive Officer,Lucix Corporation
Val R. ShelleyVice President - Strategy,HEICO Corporation
Gary SpauldingChief Operating Officer,dB Control Corp.
David J. SusserPresident,HEICO Distribution Group andSeal Dynamics LLC
Gregg TuttleVice President and General Manager,Future Aviation, Inc.
Steven M. WalkerChief Accounting Officer andAssistant Treasurer,HEICO Corporation
Nicholas “Tony” WrightVice President and General Manager -Avionics,HEICO Repair Group

THOMAS M. CULLIGANretired Sr. Vice President and CEO of Raytheon International,The Raytheon Company
ADOLFO HENRIQUESChairman and CEO,Gibraltar Private Bank and Trust
SAMUEL L. HIGGINBOTTOMretired Chairman, President andChief Executive Officer,Rolls-Royce, Inc.
MARK H. HILDEBRANDTManaging Member and Partner, Waldman, Trigoboff, Hildebrandt, Marx & Calnan, P.A.
WOLFGANG MAYRHUBERChairman of the Supervisory Board,Deutsche Lufthansa AGChairman of the Supervisory Board,Infineon Technologies AG
ERIC A. MENDELSONCo-President, HEICO Corporation
LAURANS A. MENDELSONChairman and Chief Executive Officer,HEICO Corporation
VICTOR H. MENDELSONCo-President, HEICO Corporation
JULIE NEITZELPartner, WE Family Offices
DR. ALAN SCHRIESHEIMretired Director,Argonne National Laboratory
FRANK J. SCHWITTERretired Partner,Arthur Andersen LLP
Dr. Alan Schriesheim
Adolfo HenriquesThomas M. Culligan
Wolfgang Mayrhuber Eric A. Mendelson
Victor H. MendelsonLaurans A. Mendelson
Samuel L. Higginbottom Mark H. Hildebrandt
Julie Neitzel
Frank J. Schwitter
F O R W A R D - L O O K I N G S T A T E M E N T S
Certain statements in this report constitute forward-looking statements, which are subject to risks, uncertainties and contingencies. HEICO’s actual results may differ materially from those expressed in or implied by those forward-looking statements as a result of fac-tors including, but not limited to: lower demand for commercial air travel or airline fleet changes or airline purchasing decisions, which could cause lower demand for our goods and services; product development or product specification costs and requirements, which could cause an increase to our costs to complete contracts; governmental and regulatory demands, export policies and restrictions, reductions in defense, space or homeland security spending by U.S. and/or foreign customers or competition from existing and new competitors, which could reduce our sales; our ability to introduce new products and product pricing levels, which could reduce our sales or sales growth; product development difficulties, which could increase our product development costs and delay sales; our ability to make acquisitions and achieve operating synergies from acquired businesses, customer credit risk, interest and income tax rates and economic conditions within and outside of the aviation, defense, space, medical, telecommunications and electronics industries, which could negatively impact our costs and revenues; and defense budget cuts, which could reduce our defense-related revenue. Parties receiving this material are encouraged to review all of HEICO’s filings with the Securities and Exchange Commission, including, but not limited to filings on Form 10-K, Form 10-Q and Form 8-K. We undertake no obligation to publicly update or revise any forward-looking statement, whether as a result of new information, future events or otherwise, except to the extent required by applicable law.
F I N A N C I A L H I G H L I G H T S B O A R D O F D I R E C T O R S
Year ended October 31, (1) 2012 2013 2014
(in thousands, except per share data)
Operating Data: Net sales $ 897,347 $ 1,008,757 $ 1,132,311 Operating income 163,294 183,590 203,388 Interest expense 2,432 3,717 5,441 Net income attributable to HEICO 85,147 102,396 (3) 121,293 (4) Weighted average number of common shares outstanding: (2) Basic 65,861 66,298 66,463 Diluted 66,624 66,982 67,453 Per Share Data: (2) Net income per share attributable to HEICO shareholders: Basic $ 1.29 $ 1.54 (3) $ 1.82 (4) Diluted 1.28 1.53 (3) 1.80 (4) Cash dividends per share (2) .086 1.816 .470 Balance Sheet Data (as of October 31): Total assets $ 1,192,846 $ 1,533,015 $ 1,489,214 Total debt (including current portion) 131,820 377,515 329,109 Redeemable noncontrolling interests 67,166 59,218 39,966 Total shareholders’ equity 719,759 723,235 774,619
(1) Results include the results of acquisitions from each respective effective date.
(2) All share and per share information has been adjusted retrospectively to reflect the 5-for-4 stock splits effected in October 2013 and April 2012.
(3) Includes the aggregate tax benefit from an income tax credit for qualified research and development activities for the last ten months of fiscal 2012 recognized in fiscal 2013 upon the retroactive extension in January 2013 of the U.S. research and development tax credit and higher research and development tax credits recognized upon the filing of HEICO’s fiscal 2012 U.S. federal and state tax returns, which, net of expenses, increased net income attributable to HEICO by $1.8 million, or $.03 per basic and diluted share.
(4) Operating income was increased by a $28.1 million reduction in accrued contingent consideration related to a fiscal 2013 and a fiscal 2012 acquisition within the Electronic Technologies Group (“ETG”), partially offset by $15.0 million in impairment losses related to the write-down of certain intangible assets at the fiscal 2013 and fiscal 2012 acquisitions to their estimated fair values as well as lower than expected operating income at the fiscal 2013 acquired business, which in aggregate increased net income attributable to HEICO by $10.2 million, or $.15 per basic and diluted share. The reduction in the value of contingent consideration and $13.1 million of the impairment losses were recorded as a component of selling, general and administrative expenses, while the remaining impairment losses of $1.9 million were recorded as a component of cost of sales.

Subsidiaries
Flight Support Group Action Research Corporation Aero Design, Inc. Aeroworks International Holdings, B.V. Aircraft Technology, Inc. Blue Aerospace LLC CSI Aerospace, Inc. DEC Technologies, Inc. Future Aviation, Inc. HEICO Aerospace Corporation HEICO Aerospace Holdings Corp. HEICO Aerospace Parts Corp. HEICO Component Repair Group - Miami HEICO Flight Support Corp. HEICO Parts Group HEICO Repair Group Inertial Airline Services, Inc. Jet Avion Corporation Jetseal, Inc. LPI Corporation McClain International, Inc. Niacc-Avitech Technologies, Inc. Prime Air, LLC and Prime Air Europe Reinhold Industries, Inc. Seal Dynamics LLC Sunshine Avionics LLC Thermal Structures, Inc. Turbine Kinetics, Inc.
Electronic Technologies Group 3D-Plus, SAS Analog Modules, Inc. Connectronics Corp. and Wiremax dB Control Corp. Dukane Seacom, Inc. EMD Technologies Incorporated Engineering Design Team, Inc. HVT Group, Inc. Dielectric Sciences, Inc. Essex X-Ray & Medical Equipment LTD Leader Tech, Inc. Lucix Corporation Lumina Power, Inc. Radiant Power Corp. Ramona Research, Inc. Santa Barbara Infrared, Inc. Sierra Microwave Technology, LLC Switchcraft, Inc. and Conxall VPT, Inc.
Registrar & Transfer Agent
Computershare Investor ServicesP.O. BOX 30170College Station, TX 77842-3170Telephone: 800-307-3056www.computershare.com/investor
New York Stock Exchange Symbols
Class A Common Stock - “HEI.A”Common Stock - “HEI”
Form 10-K and Board of Directors Inquiries
The Company’s Annual Report on Form 10-K for 2014, as filed with the Securities and Exchange Commission, is available without charge upon written request to the Corporate Secretary at the Company’s headquarters.
Any inquiry to any member of the Company’s Board of Directors, including, but not limited to “independent” Directors, should be addressed to such Director(s) care of the Company’s Headquarters and such inquiries will be forwarded to the Director(s) of whom the inquiry is being made.
Annual Meeting
The Annual Meeting of Shareholderswill be held on Friday,March 20, 2015 at 10:00 a.m. at the JW Marriott Miami1109 Brickell AvenueMiami, FL 33131Telephone: 305-329-3500
Shareholder Information
Elizabeth R. LetendreCorporate SecretaryHEICO Corporation3000 Taft StreetHollywood, FL 33021Telephone: 954-987-4000Facsimile: [email protected]
CORPORATION
HEICO Corporation
Corporate Offices3000 Taft Street Hollywood, FL 33021Telephone: 954-987-4000Facsimile: 954-987-8228www.heico.com
HE
ICO
® CO
RP
OR
AT
ION
/ 2
014
AN
NU
AL
RE
PO
RT