regional_partnerships_nwqmc_12.6.07 cooperative regional monitoring in southern california stephen...
TRANSCRIPT

Regional_Partnerships_NWQMC_12.6.07
COOPERATIVE REGIONAL MONITORING IN SOUTHERN CALIFORNIA
Stephen B. Weisberg
Southern California Coastal Water Research Project Authority
(www.sccwrp.org)
Regional_Partnerships_NWQMC_12.6.07
WHAT IS SCCWRP?
• Joint Powers Agency founded in 1969
• Initiated to address regional monitoring and research needs– Cumulative impact assessment
– Methods development
– Data integration
• Member organizations include city, county, state, and federal agencies– Unique combination of regulators and regulated
Regional_Partnerships_NWQMC_12.6.07
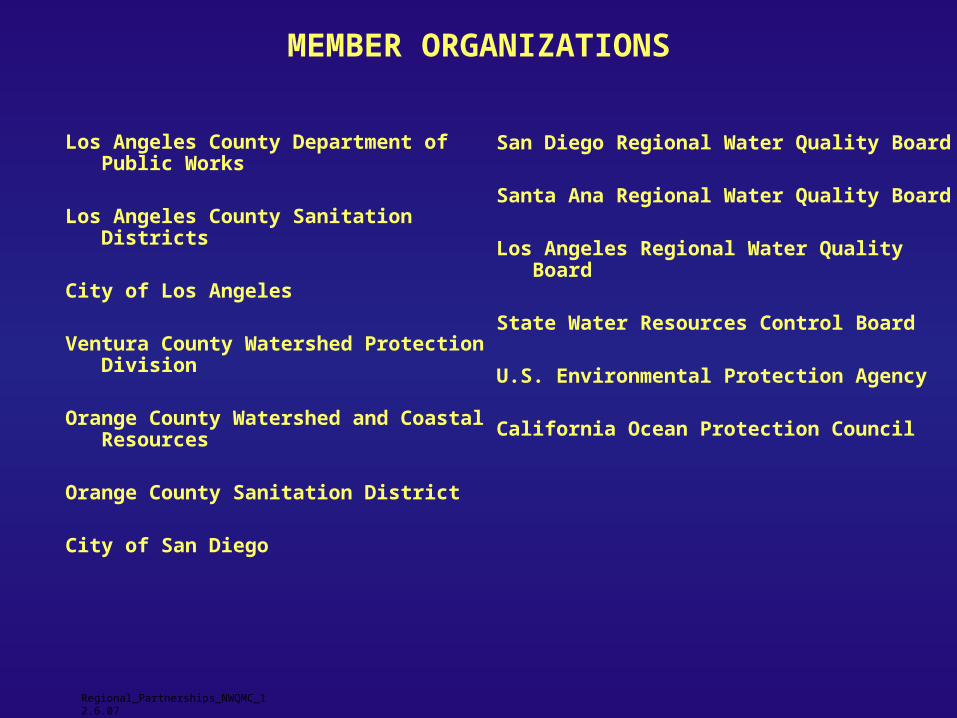
MEMBER ORGANIZATIONS
San Diego Regional Water Quality Board
Santa Ana Regional Water Quality Board
Los Angeles Regional Water Quality Board
State Water Resources Control Board
U.S. Environmental Protection Agency
California Ocean Protection Council
Los Angeles County Department of Public Works
Los Angeles County Sanitation Districts
City of Los Angeles
Ventura County Watershed Protection Division
Orange County Watershed and Coastal Resources
Orange County Sanitation District
City of San Diego
Regional_Partnerships_NWQMC_12.6.07
REGIONAL MONITORING BACKGROUND
• Started with 1990 National Research Council assessment of monitoring in southern California– $17M in annual monitoring could not be integrated to provide a
regional assessment of condition
• Many impediments to a regional assessment – Most monitoring was site-specific
– Different parameters among groups
– Different methods
– No common QA
– Lack of data management systems
• SCCWRP Commission stepped up to solve the problem– Two-thirds of the ocean monitoring in southern California is in
response to NPDES permits
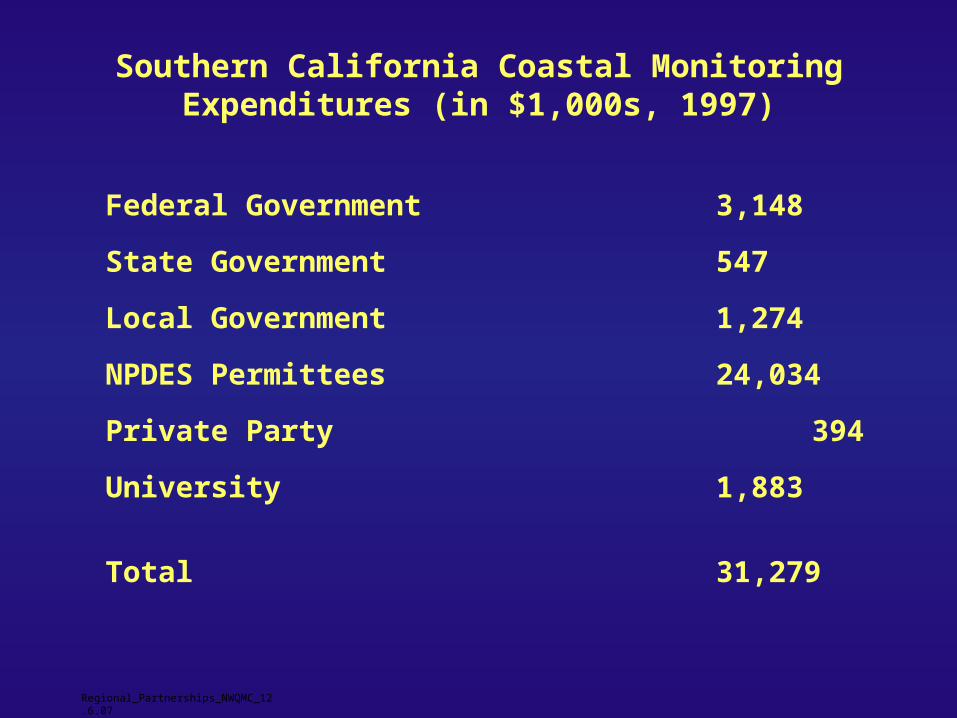
Federal Government 3,148
State Government 547
Local Government 1,274
NPDES Permittees 24,034
Private Party 394
University 1,883
Total 31,279
Regional_Partnerships_NWQMC_12.6.07
Southern California Coastal Monitoring Expenditures (in $1,000s, 1997)
UNIQUE FUNDING MECHANISM
• 90% funded through in-kind services– A participatory program
• Facilitated through resource exchange– Regulators allow exchange of some routine monitoring elements for
an equal level of effort in the Bight program
– Regional monitoring has even been formalized in some permits
• The cooperative nature provides a mechanism for dialog about monitoring approaches– Monitoring methods manuals
– QA protocols
– Data management structures
– Data interpretation approaches
Regional_Partnerships_NWQMC_12.6.07
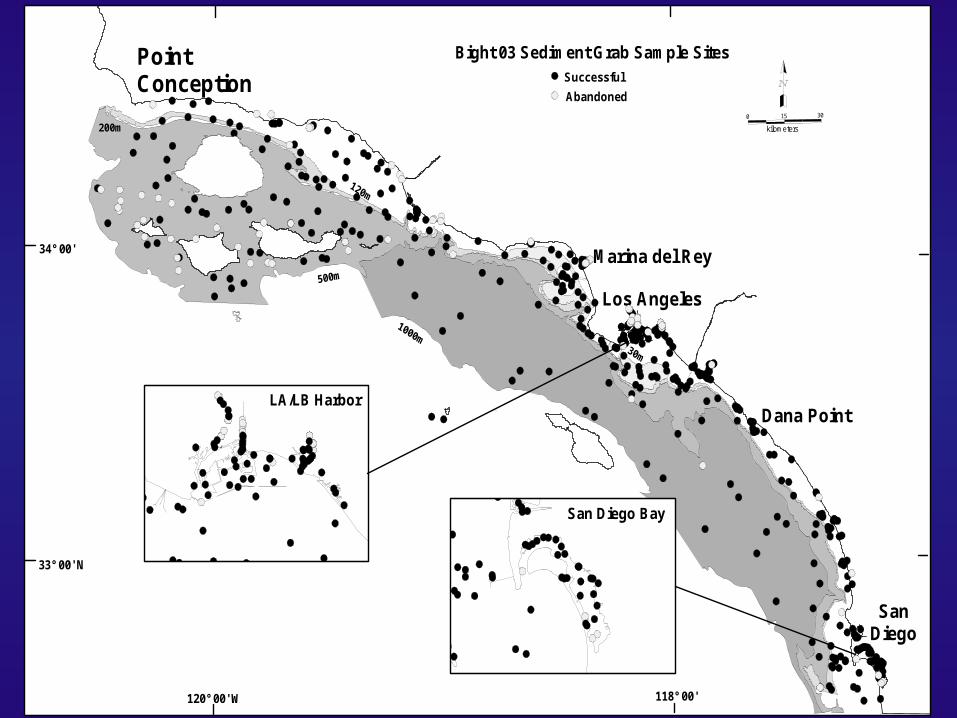
BIGHT’03 WAS THE THIRD REGIONAL SURVEY
• Started with a Pilot Project in 1994– Limited to SCCWRP member agencies
– Focused on contaminant effects on sediment and fish quality
• Opened up to all interested parties in 1998– 62 organizations participated
– Added a shoreline microbiology component
– Expanded into Mexico
• 66 organizations participated in 2003– Expanded the number of habitats sampled
– Added remote sensing to the tool box
– Greater number of academic partners
Regional_Partnerships_NWQMC_12.6.07

Regional_Partnerships_NWQMC_12.6.07
MULTIPLE REGIONAL MONITORING COMPONENTS
• Coastal Ecology– Fish and sediment quality
• Water Quality– Nutrients and harmful algal blooms
• Shoreline Microbiology
• Rocky reef
COASTAL ECOLOGY BASICS
• Primary question: What is the spatial extent of chemical contamination and their biological effects?
• Probability based sampling design– Stratified to evaluate potential impact areas
– Approximately 400 sampling sites
• Multiple indicators at each site– Sediment chemistry
– Toxicity
– Benthic infauna
– Fish tissue contaminants
– Gross pathology
– BiomarkersRegional_Partnerships_NWQMC_12.6.07
STRATA
• Mainland continental shelf- 5-30m - 30-120m- 120-200m
• Mainland slope and basin- 200-500m - 500-1,000m
• Embayments- Ports/harbors- Marinas- Estuaries
• Discharge zones- Large POTW - Small POTW- Stormwater receiving areas
• Special Management Areas- Channel Islands National Marine Sanctuary- Santa Monica Bay National Estuary Program
COASTAL ECOLOGY BASICS
• Primary question: What is the spatial extent of chemical contamination and their biological effects?
• Probability based sampling design– Stratified to evaluate potential impact areas
– Approximately 400 sampling sites
• Multiple indicators at each site– Sediment chemistry
– Toxicity
– Benthic infauna
– Fish tissue contaminants
– Gross pathology
– BiomarkersRegional_Partnerships_NWQMC_12.6.07
PRODUCTS OF COOPERATIVE REGIONAL MONITORING
• Assessment of condition
• Methods standardization
• Regional assessment tools
• Information management
• Dialogue about data interpretation
Regional_Partnerships_NWQMC_12.6.07
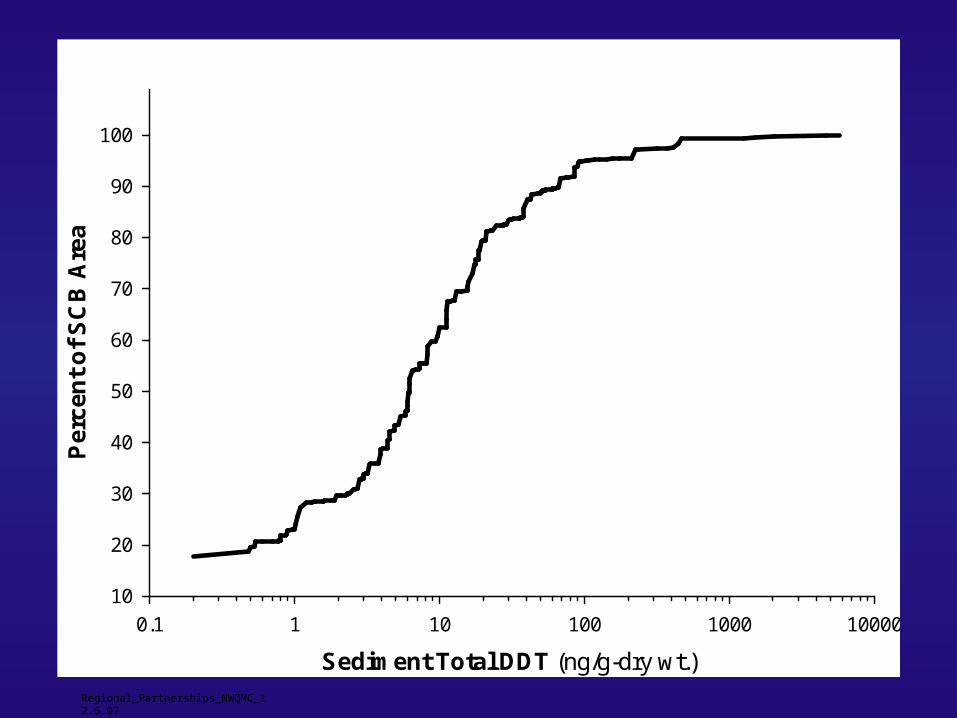
Regional_Partnerships_NWQMC_12.6.07
Sediment Total DDT (ng/g-dry wt.)
0.1 1 10 100 1000 10000
Per
cen
t o
f S
CB
Are
a
10
20
30
40
50
60
70
80
90
100
Regional_Partnerships_NWQMC_12.6.07
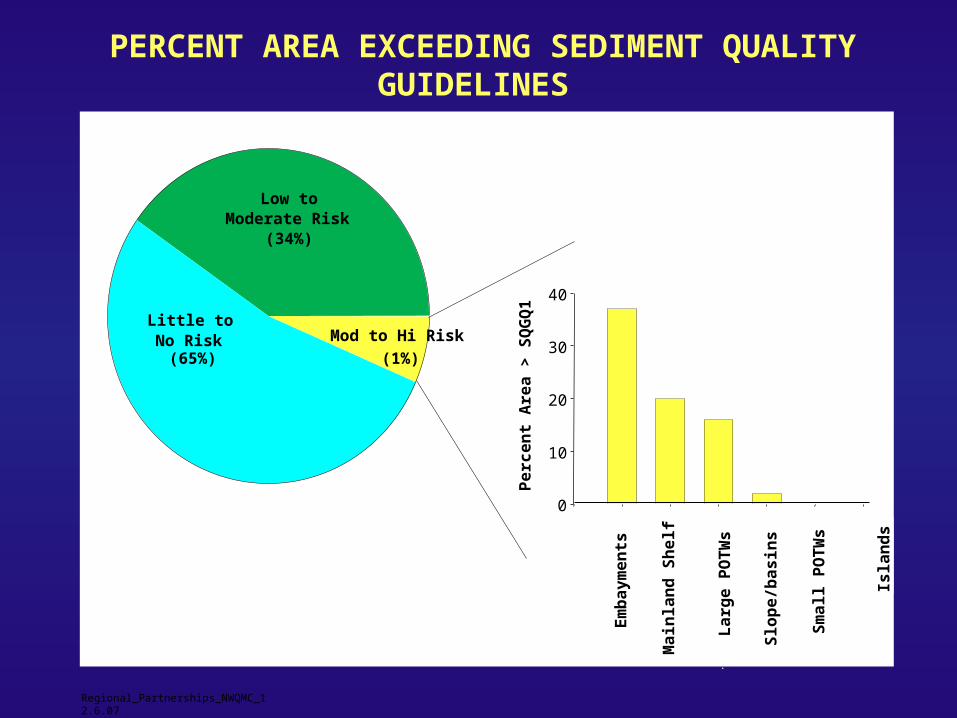
Low to
Moderate Risk
Little to
No Risk
Em
ba
ym
en
ts
Ma
inla
nd
Sh
elf
La
rge
PO
TW
s
Pe
rce
nt
Are
a >
SQ
GQ
10
10
20
30
40
Mod to Hi Risk
.(34%)
(65%) (1%)
S
ma
ll P
OT
Ws
Slo
pe
/ba
sin
s
Is
lan
ds
PERCENT AREA EXCEEDING SEDIMENT QUALITY GUIDELINES
Regional_Partnerships_NWQMC_12.6.07
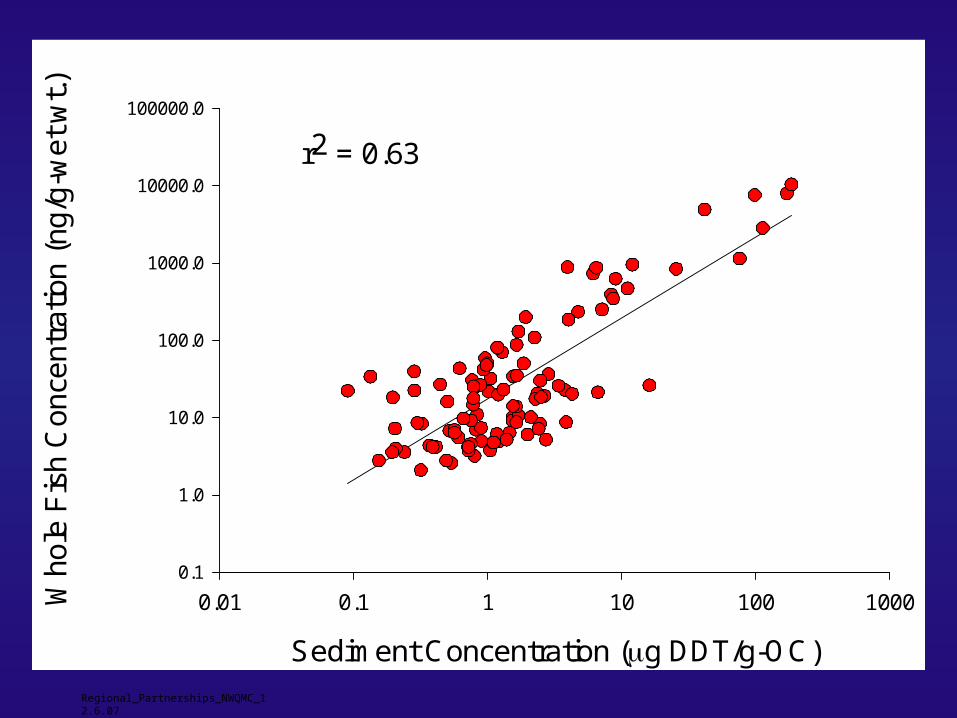
Sediment Concentration (g DDT/g-OC)
0.01 0.1 1 10 100 1000Wh
ole
Fis
h C
on
cen
tra
tion
(n
g/g
-we
t w
t.)
0.1
1.0
10.0
100.0
1000.0
10000.0
100000.0
r2 = 0.63
Regional_Partnerships_NWQMC_12.6.07
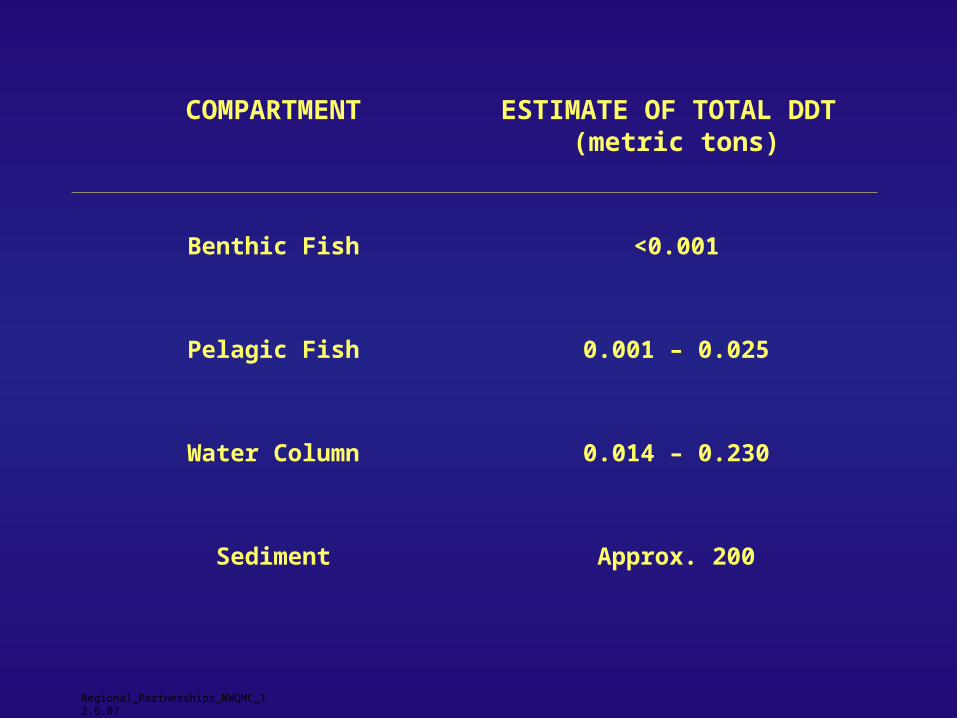
COMPARTMENT ESTIMATE OF TOTAL DDT (metric tons)
Benthic Fish <0.001
Pelagic Fish 0.001 – 0.025
Water Column 0.014 – 0.230
Sediment Approx. 200

Regional_Partnerships_NWQMC_12.6.07
COMPARTMENT ESTIMATE OF TOTAL DDT (metric tons)
Benthic Fish <0.001
Pelagic Fish 0.001 – 0.025
Water Column 0.014 – 0.230
Sediment Approx. 200
Total DDT Discharged Approx. 2,400

PRODUCTS OF COOPERATIVE REGIONAL MONITORING
• Assessment of condition
• Methods standardization
• Regional assessment tools
• Information management
• Dialogue about data interpretation
Regional_Partnerships_NWQMC_12.6.07
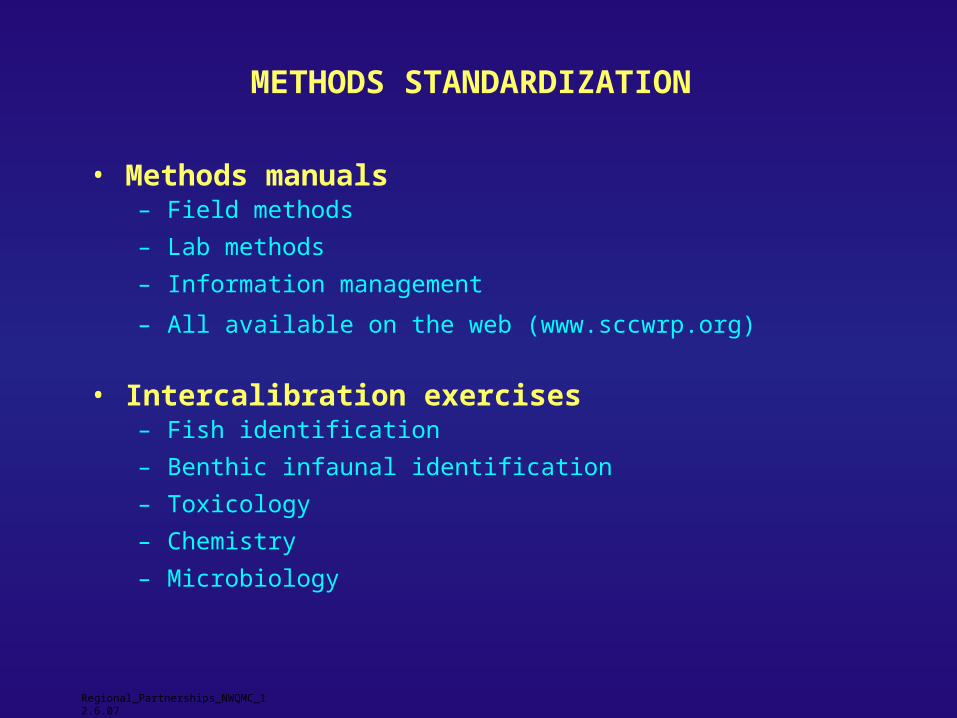
• Methods manuals– Field methods
– Lab methods
– Information management
– All available on the web (www.sccwrp.org)
• Intercalibration exercises – Fish identification
– Benthic infaunal identification
– Toxicology
– Chemistry
– Microbiology
METHODS STANDARDIZATION
Regional_Partnerships_NWQMC_12.6.07

PALOS VERDES SEDIMENT – FIRST ROUND
COMPOUND LAB-1 LAB-2 LAB-3 LAB-4 LAB-5 LAB-6
2-Methylnaphthalene ND 57 78 5 54 119
Biphenyl ND 44 54 17 25 57
2,6-Dimethylnaphthalene 28 30 62 ND 39 64
Phenanthrene ND 36 60 9 64 52
Fluoranthene ND ND 53 12 57 64
Pyrene 43 255 374 20 109 108
Benz[a]anthracene ND ND 79 9 47 49
Chrysene ND ND 67 9 53 25
Benzo[e]pyrene ND 233 241 19 191 77
Benzo[a]pyrene ND ND 236 16 186 64
Perylene 41 359 312 20 165 138
Benzo[g,h,i]pyrene ND ND 91 ND 112 37
TOTAL 137 1130 2300 177 1430 1280
Regional_Partnerships_NWQMC_12.6.07

PALOS VERDES SEDIMENT – FINAL ROUND
COMPOUND LAB-1 LAB-2 LAB-3 LAB-4 LAB-5 LAB-6
2-Methylnapthalene 59 54 63 56 62 54
Biphenyl 53 26 39 47 41 33
2,6-Dimethylnaphtalene 103 31 75 79 46 28
Phenanthrene 76 71 53 58 64 66
Fluoranthene 45 68 55 39 75 75
Pyrene 139 215 137 138 163 168
Benz[a]anthracene 51 46 61 56 52 60
Chrysene 49 58 63 78 71 63
Benzo[e]pyrene 139 124 193 131 103 113
Benzo[a]pyrene 95 141 203 109 79 52
Perylene 168 259 227 237 119 142
Benzo[g,h,I,]perylene 25 99 75 ND 110 91
TOTAL 1,391 1,572 1,748 1,418 1,344 1,296
Regional_Partnerships_NWQMC_12.6.07

Regional_Partnerships_NWQMC_12.6.07

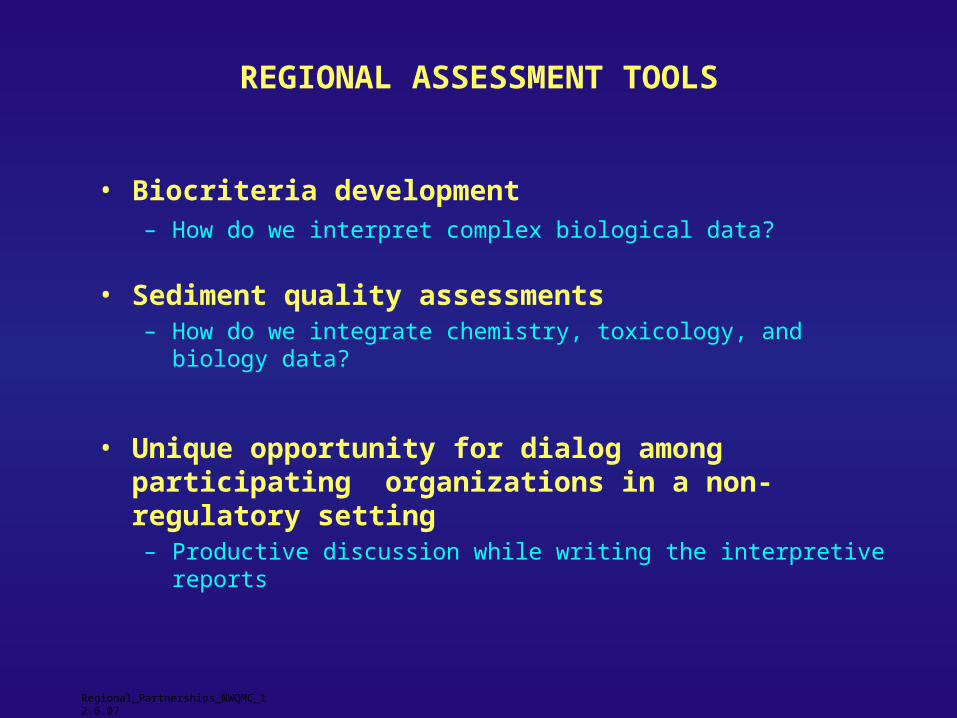
• Biocriteria development– How do we interpret complex biological data?
• Sediment quality assessments– How do we integrate chemistry, toxicology, and biology data?
• Unique opportunity for dialog among participating organizations in a non-regulatory setting– Productive discussion while writing the interpretive reports
REGIONAL ASSESSMENT TOOLS
Regional_Partnerships_NWQMC_12.6.07
Regional_Partnerships_NWQMC_12.6.07
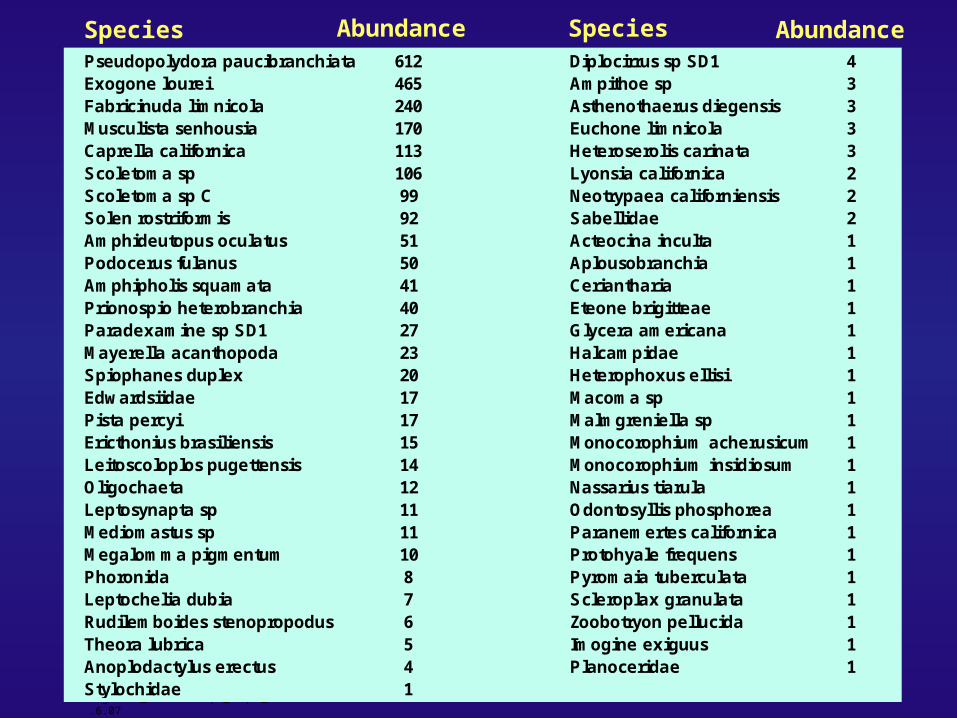
Pseudopolydora paucibranchiata 612 Diplocirrus sp SD1 4Exogone lourei 465 Ampithoe sp 3Fabricinuda limnicola 240 Asthenothaerus diegensis 3Musculista senhousia 170 Euchone limnicola 3Caprella californica 113 Heteroserolis carinata 3Scoletoma sp 106 Lyonsia californica 2Scoletoma sp C 99 Neotrypaea californiensis 2Solen rostriformis 92 Sabellidae 2Amphideutopus oculatus 51 Acteocina inculta 1Podocerus fulanus 50 Aplousobranchia 1Amphipholis squamata 41 Ceriantharia 1Prionospio heterobranchia 40 Eteone brigitteae 1Paradexamine sp SD1 27 Glycera americana 1Mayerella acanthopoda 23 Halcampidae 1Spiophanes duplex 20 Heterophoxus ellisi 1Edwardsiidae 17 Macoma sp 1Pista percyi 17 Malmgreniella sp 1Ericthonius brasiliensis 15 Monocorophium acherusicum 1Leitoscoloplos pugettensis 14 Monocorophium insidiosum 1Oligochaeta 12 Nassarius tiarula 1Leptosynapta sp 11 Odontosyllis phosphorea 1Mediomastus sp 11 Paranemertes californica 1Megalomma pigmentum 10 Protohyale frequens 1Phoronida 8 Pyromaia tuberculata 1Leptochelia dubia 7 Scleroplax granulata 1Rudilemboides stenopropodus 6 Zoobotryon pellucida 1Theora lubrica 5 Imogine exiguus 1Anoplodactylus erectus 4 Planoceridae 1Stylochidae 1
Species Species AbundanceAbundance
• Biocriteria development– How do we interpret complex biological data?
• Sediment quality assessments– How do we integrate chemistry, toxicology, and biology data?
• Unique opportunity for dialog among participating organizations in a non-regulatory setting– Productive discussion while writing the interpretive reports
REGIONAL ASSESSMENT TOOLS
Regional_Partnerships_NWQMC_12.6.07
Regional_Partnerships_NWQMC_12.6.07
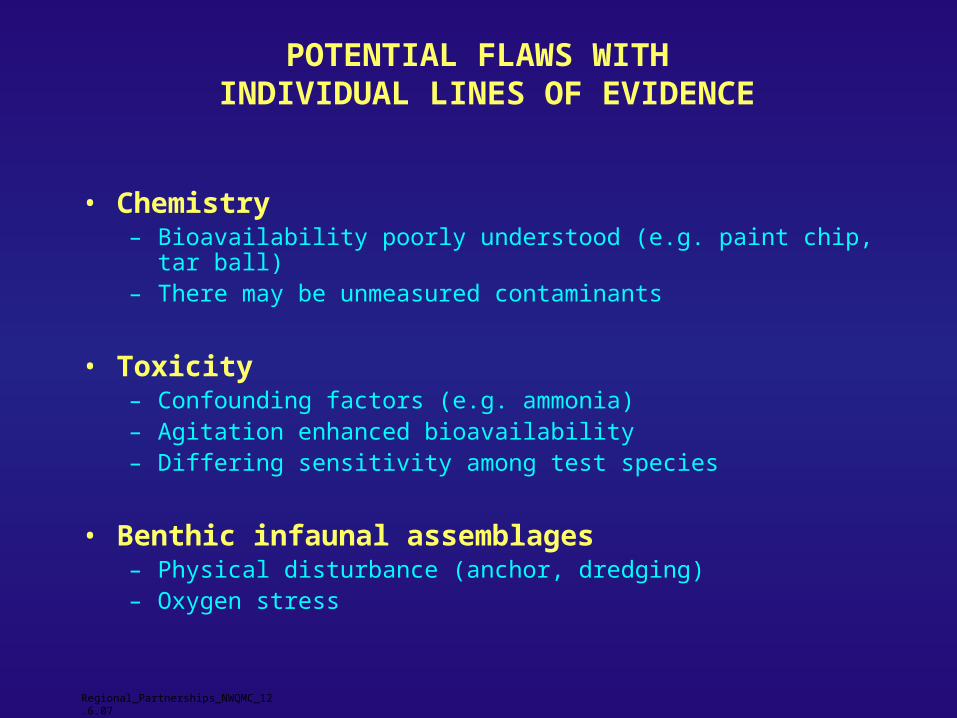
POTENTIAL FLAWS WITH INDIVIDUAL LINES OF EVIDENCE
• Chemistry– Bioavailability poorly understood (e.g. paint chip, tar ball)– There may be unmeasured contaminants
• Toxicity– Confounding factors (e.g. ammonia)– Agitation enhanced bioavailability– Differing sensitivity among test species
• Benthic infaunal assemblages– Physical disturbance (anchor, dredging)– Oxygen stress
Regional_Partnerships_NWQMC_12.6.07
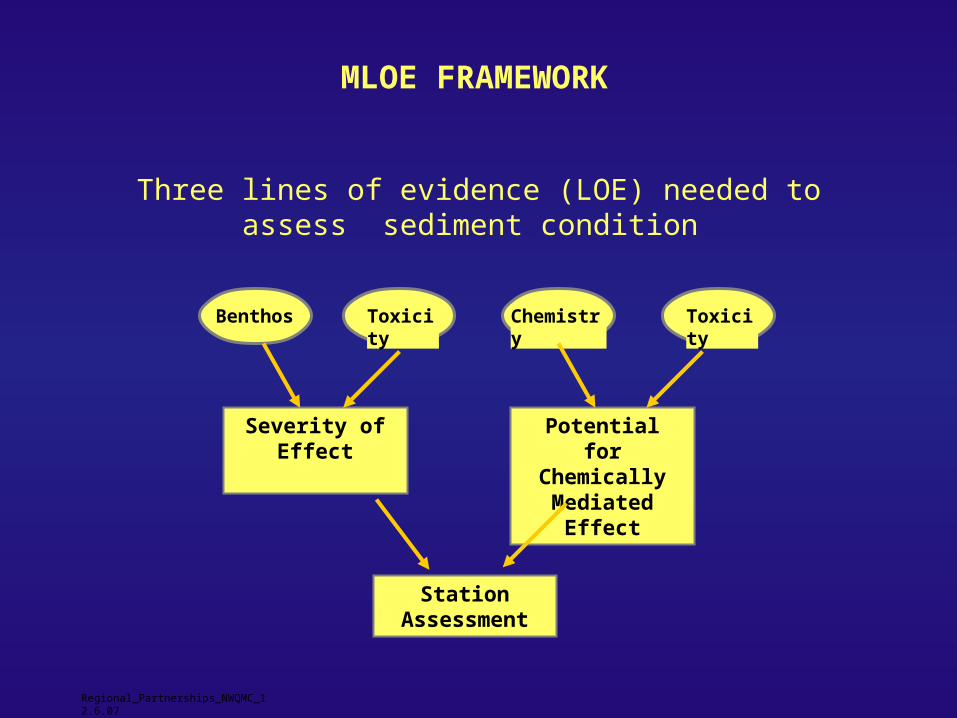
MLOE FRAMEWORK
Severity of Effect
Potential for Chemically
Mediated Effect
Station Assessment
Benthos Toxicity Chemistry Toxicity
Three lines of evidence (LOE) needed to assess sediment condition
Regional_Partnerships_NWQMC_12.6.07
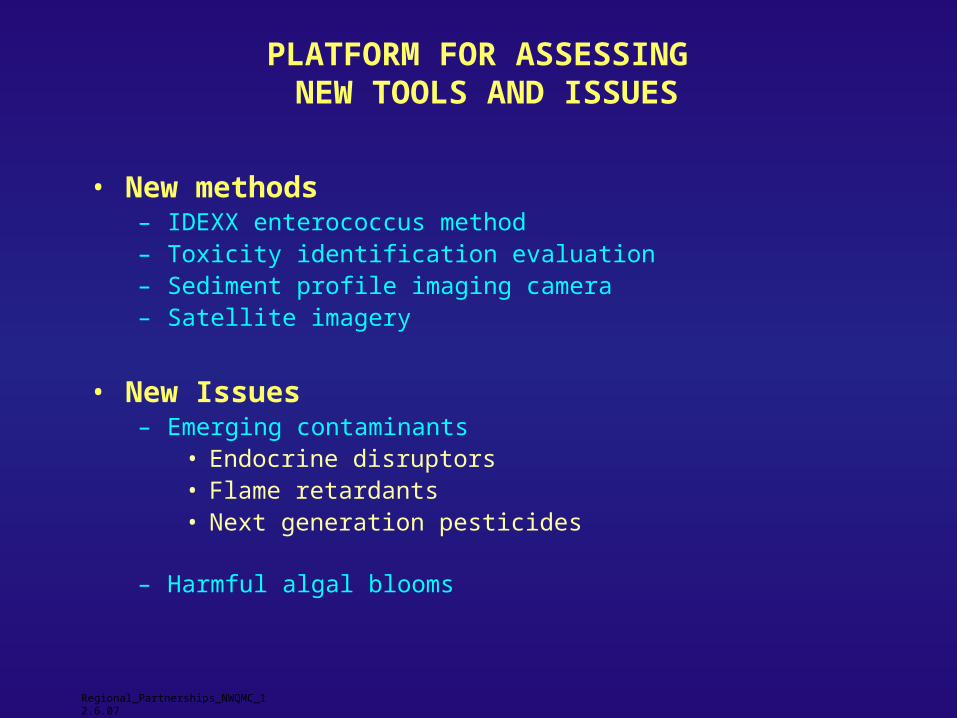
PLATFORM FOR ASSESSING NEW TOOLS AND ISSUES
• New methods– IDEXX enterococcus method– Toxicity identification evaluation– Sediment profile imaging camera– Satellite imagery
• New Issues– Emerging contaminants
• Endocrine disruptors• Flame retardants • Next generation pesticides
– Harmful algal blooms

PRODUCTS OF COOPERATIVE REGIONAL MONITORING
• Assessment of condition
• Methods standardization
• Regional assessment tools
• Information management
• Dialogue about data interpretation
Regional_Partnerships_NWQMC_12.6.07
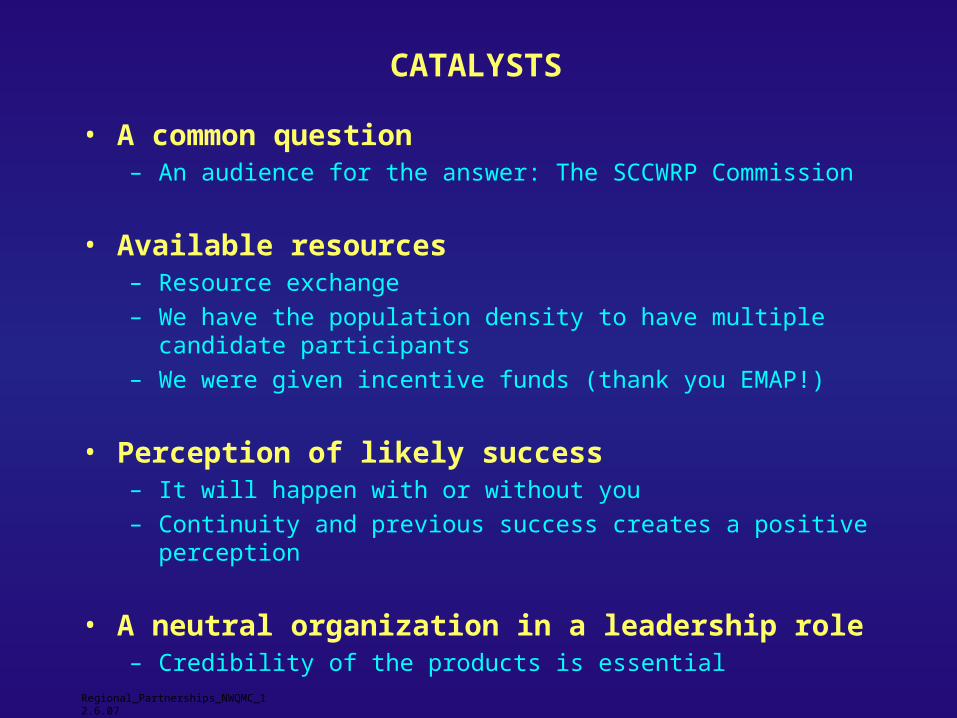
CATALYSTS
• A common question– An audience for the answer: The SCCWRP Commission
• Available resources– Resource exchange
– We have the population density to have multiple candidate participants
– We were given incentive funds (thank you EMAP!)
• Perception of likely success– It will happen with or without you
– Continuity and previous success creates a positive perception
• A neutral organization in a leadership role– Credibility of the products is essential
Regional_Partnerships_NWQMC_12.6.07
CHALLENGES
• Time– Interminable planning meetings
• Flexibility to change– New collection methods
– Provides an opportunity for upgrading
• Intercalibration costs– Can initially be larger than implementation costs
• Loss of autonomy– Most program managers are invested in their own thing
Regional_Partnerships_NWQMC_12.6.07
Regional_Partnerships_NWQMC_12.6.07
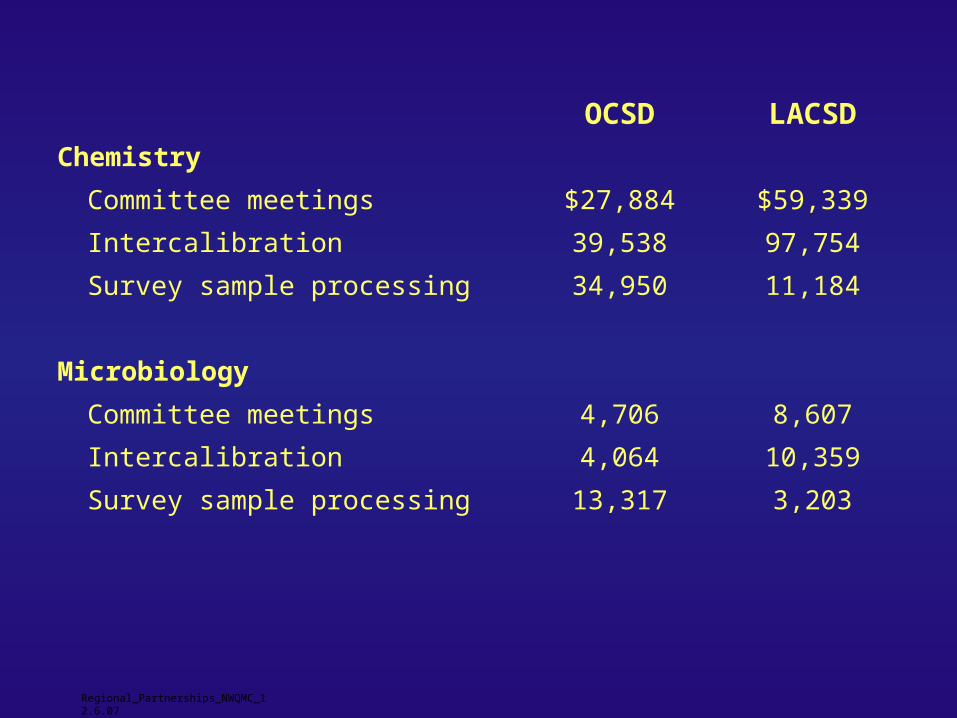
OCSD LACSD
Chemistry
Committee meetings $27,884 $59,339
Intercalibration 39,538 97,754
Survey sample processing 34,950 11,184
Microbiology
Committee meetings 4,706 8,607
Intercalibration 4,064 10,359
Survey sample processing 13,317 3,203
CHALLENGES
• Time– Interminable planning meetings
• Flexibility to change– New collection methods
– Provides an opportunity for upgrading
• Intercalibration costs– Can initially be larger than implementation costs
• Loss of autonomy– Most program managers are invested in their own thing
Regional_Partnerships_NWQMC_12.6.07
THE CONCEPTS ARE SPREADING TO OTHER HABITATS
• Streams – Co-joining of discharger and state programs – Regional QA evaluations– Common data management
• Wetlands
• Rocky intertidal
• Subtidal hard-bottom reefs
• Beach water quality
Regional_Partnerships_NWQMC_12.6.07
Regional_Partnerships_NWQMC_12.6.07
Map of B’03 StrataPointConception
Marina del Rey
Los Angeles
Dana Point
SanDiego
300 15
kilometers200m
Bight 03 Sediment Grab Sample SitesSuccessful
Abandoned
34° 00'
33° 00' N
120° 00' W 118° 00'
LA/LB Harbor
San Diego Bay
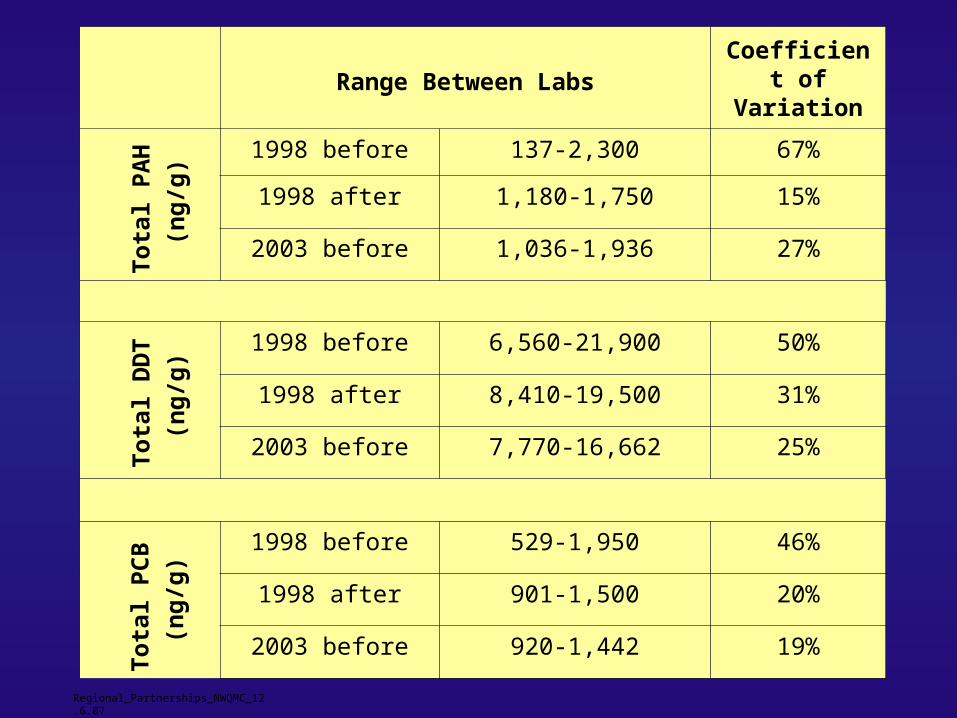
Range Between LabsCoefficient of
Variation
1998 before 137-2,300 67%
1998 after 1,180-1,750 15%
2003 before 1,036-1,936 27%
1998 before 6,560-21,900 50%
1998 after 8,410-19,500 31%
2003 before 7,770-16,662 25%
1998 before 529-1,950 46%
1998 after 901-1,500 20%
2003 before 920-1,442 19%
To
tal
PA
H
(ng
/g)
To
tal
DD
T
(ng
/g)
To
tal
PC
B
(ng
/g)
Regional_Partnerships_NWQMC_12.6.07