regional workforce study - center for strategic economic research
TRANSCRIPT

October 2005, Sacramento Regional Research Institute, SACTO-Sacramento State. All rights reserved. No part of this publication may be reproduced in any form, by any means, without written permission of the publisher.
REGIONAL WORKFORCE STUDY
Prepared for
Sacramento Employment and Training Agency (SETA) Sacramento Works, Inc. 925 Del Paso Boulevard Sacramento, CA 95815
(916) 263-3800 FAX (916) 263-4618
Prepared by
Sacramento Regional Research Institute, A Joint Venture of SACTO and Sacramento State
400 Capitol Mall, Suite 2500 Sacramento, CA 95814
(916) 491-0444 FAX (916) 441-2312
Ryan Sharp, Director
Helen Schaubmayer, Deputy Director Chad Angaretis, Research Analyst
Jesse Catlin, Research Analyst Marcia Cosgrove, Research Analyst
Libby Lyon, Research Analyst Leeann Paquette, Research Analyst

EXECUTIVE SUMMARY
SSaaccrraammeennttoo RReeggiioonnaall RReesseeaarrcchh IInnssttiittuuttee ii
Executive Summary The findings from this study can be used for four primary purposes: educating the business, economic development, and workforce communities about the Sacramento Region’s workforce; directing workforce development programs to assure that qualified workers are available to meet the needs of the Region’s economy; identifying Sacramento’s strengths so that they can be fostered, enhanced, and marketed; and pinpointing opportunities that, if addressed, could make the workforce stronger and the Region more competitive. A wealth of information is presented throughout this report that provides a greater understanding of the Region’s workforce and SRRI encourages readers who are affected by or directly interact with Sacramento’s workforce to examine the entire report. The pie chart below shows the Sacramento Region’s occupational composition along with the 2003 employment levels in each major occupational category. Over one-fifth of the Region’s workforce is in the Office & Administrative Support category. Two other major categories make up a relatively large amount of the workforce—Sales & Related and Food Preparation & Serving Related each contain close to 10 percent of the total occupational employment. Together, these three occupational categories encompass almost 40 percent of Sacramento’s workforce. Nearly all occupational categories in the Sacramento Region experienced healthier employment growth than the state and nation. SACRAMENTO REGION OCCUPATIONAL COMPOSITION IN 2003
Production ; 37,010; 4.3%
Education, training, and library ; 48,040; 5.6%
Management ; 43,520; 5.0%
Sales and related ; 87,170; 10.1%
Food preparation and serving related ; 65,470;
7.6%
Healthcare practitioners and technical ; 35,800; 4.2%
Transportation and material moving ; 56,240; 6.5%
Construction and extraction ; 55,860; 6.5%
Business and financial operations ; 53,830; 6.2%
Office and administrative support ; 178,530; 20.7%
Legal ; 7,330; 0.9% Farming, fishing, and forestry; 6,250; 0.7%
Personal care and service ; 14,520; 1.7%
Architecture and engineering ; 18,320; 2.1%
Community and social services ; 14,740; 1.7%
Healthcare support ; 16,850; 2.0%
Arts, design, entertainment, sports, and media ; 9,200;
1.1%Life, physical, and social
science ; 9,320; 1.1%
Protective service ; 20,460; 2.4%
Computer and mathematical ; 25,710; 3.0%
Building and grounds cleaning and maintenance ;
26,810; 3.1%Installation, maintenance, and repair ; 31,260; 3.6%
Sacramento Regional Research Institute, May 2005 Data Source: Bureau of Labor Statistics, Occupational Employment Statistics

EXECUTIVE SUMMARY
SSaaccrraammeennttoo RReeggiioonnaall RReesseeaarrcchh IInnssttiittuuttee iii
Major employers in the Sacramento Region make use of a large number of jobs that fall within many of the Region’s biggest occupational categories. In addition, many of the key occupations that arose from SRRI’s previous study, Analysis of Workforce Skills Sets (which focused on industry sectors presenting the greatest economic development potential), are grouped within some of Sacramento’s largest occupational categories. Each of the Region’s major occupational categories demonstrate unique patterns in terms of composition, historical shift in composition, specialization, historical change in specialization, historical growth, and projected growth. The figure below displays a rank and an index score, on a 0 to 100 range, that accounts for overall performance across all measured indicators. Categories ranked 1 through 5, all with scores above 85, can be seen as the Region’s strongest or best-performing—Legal; Construction & Extraction; Office & Administrative Support; Community & Social Services; and Computer & Mathematical. SACRAMENTO REGION OVERALL OCCUPATIONAL PERFORMANCE
0 10 20 30 40 50 60 70 80 90 100
22. Production
21. Protective service
20. Food preparation and serving related
19. Personal care and service
18. Management
17. Healthcare support
16. Farming, fishing, and forestry
15. Arts, design, entertainment, sports, and media
14. Education, training, and library
13. Life, physical, and social science
12. Architecture and engineering
11. Healthcare practitioners and technical
10. Sales and related
9. Building and grounds cleaning and maintenance
8. Transportation and material moving
7. Installation, maintenance, and repair
6. Business and financial operations
5. Computer and mathematical
4. Community and social services
3. Office and administrative support
2. Construction and extraction
1. Legal
Performance on a scale of 0 to 100
Performance rank
Sacramento Regional Research Institute, May 2005 Data Sources: Bureau of Labor Statistics, Occupational Employment Statistics and Employment Development Department, Employment Projections by Occupation Jobs within the Region’s workforce can be grouped into three level of preparation categories, reflecting the training requirements demanded by most employers: low (some on-the-job training and high-school level education), medium (considerable on-the-job

EXECUTIVE SUMMARY
SSaaccrraammeennttoo RReeggiioonnaall RReesseeaarrcchh IInnssttiittuuttee iv
training, vocational education, and a two-year degree), and high (a four-year degree or above plus work experience). The pie chart below shows Sacramento’s level of preparation composition and related 2003 employment levels. Nearly 57 percent of the Region’s workforce is employed in jobs requiring a low level of preparation. This is particularly important for workforce development organizations since it demonstrates that one of their primary target markets is considerably large in the Sacramento Region. The high level of preparation category also encompasses a notable proportion of the Region’s workforce with close to one-third of the total. At less than half the size of the high level of preparation category and about a quarter of the size of the low level of preparation category, jobs requiring a medium level of preparation make up a little more than one-tenth of the workforce (this category is also notably more concentrated in other competitive regions). The majority of the Region’s major employers characterize the workforce training composition in a similar manner. While all three categories have seen healthy growth, the high and medium level of preparation categories have been slightly more robust—these trends are projected to continue in the future. SACRAMENTO REGION LEVEL OF PREPARATION COMPOSITION IN 2003
Low; 488,850; 56.7%
Medium; 107,580; 12.5%
High; 265,810; 30.8%
Sacramento Regional Research Institute, June 2005 Data Sources: Bureau of Labor Statistics, Occupational Employment Statistics and O*Net
EXECUTIVE SUMMARY
SSaaccrraammeennttoo RReeggiioonnaall RReesseeaarrcchh IInnssttiittuuttee v
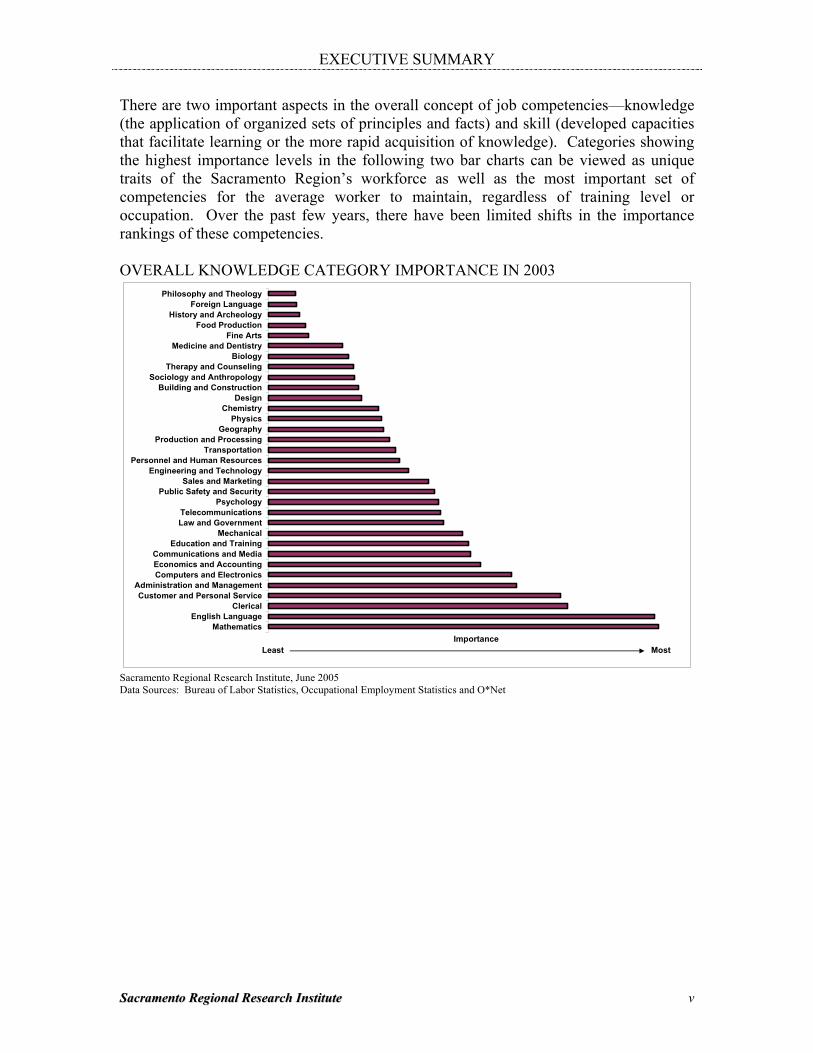
There are two important aspects in the overall concept of job competencies—knowledge (the application of organized sets of principles and facts) and skill (developed capacities that facilitate learning or the more rapid acquisition of knowledge). Categories showing the highest importance levels in the following two bar charts can be viewed as unique traits of the Sacramento Region’s workforce as well as the most important set of competencies for the average worker to maintain, regardless of training level or occupation. Over the past few years, there have been limited shifts in the importance rankings of these competencies. OVERALL KNOWLEDGE CATEGORY IMPORTANCE IN 2003
MathematicsEnglish Language
ClericalCustomer and Personal Service
Administration and ManagementComputers and ElectronicsEconomics and AccountingCommunications and Media
Education and TrainingMechanical
Law and GovernmentTelecommunications
PsychologyPublic Safety and Security
Sales and MarketingEngineering and Technology
Personnel and Human ResourcesTransportation
Production and ProcessingGeography
PhysicsChemistry
DesignBuilding and Construction
Sociology and AnthropologyTherapy and Counseling
BiologyMedicine and Dentistry
Fine ArtsFood Production
History and ArcheologyForeign Language
Philosophy and Theology
ImportanceLeast Most
Sacramento Regional Research Institute, June 2005 Data Sources: Bureau of Labor Statistics, Occupational Employment Statistics and O*Net

EXECUTIVE SUMMARY
SSaaccrraammeennttoo RReeggiioonnaall RReesseeaarrcchh IInnssttiittuuttee vi
OVERALL SKILL CATEGORY IMPORTANCE IN 2003
SpeakingReading Comprehension
Active ListeningWriting
MathematicsJudgment and Decision Making
MonitoringCritical Thinking
CoordinationComplex Problem Solving
Social PerceptivenessActive Learning
Service OrientationEquipment Selection
Time ManagementOperation and Control
Systems EvaluationQuality Control Analysis
Learning StrategiesSystems Analysis
InstructingOperations Analysis
Management of Material ResourcesPersuasion
Operation MonitoringManagement of Personnel Resources
ScienceNegotiation
Management of Financial ResourcesTroubleshooting
Equipment MaintenanceTechnology Design
InstallationRepairing
Programming
ImportanceLeast Most
Sacramento Regional Research Institute, June 2005 Data Sources: Bureau of Labor Statistics, Occupational Employment Statistics and O*Net Major employers indicate a strong need for a similar core set of knowledge and skills, but stress the importance of “soft skills” (work ethic, interpersonal skills, etc.) as well as the growing need for basic computer skills. In addition, SRRI’s Analysis of Workforce Skills Sets study showed a like set of competencies as being the most important to successful job performance for occupations within industries demonstrating the greatest potential for economic development. There are a number of aspects that can be considered strengths of the Region’s workforce. These aspects can be marketed to prospective and existing companies and workforce and economic development efforts should focus on fostering and ensuring the longevity of these advantages.
The Legal; Construction & Extraction; Office & Administrative Support; Community & Social Services; Computer & Mathematical; and Business & Financial occupational categories have demonstrated strong economic performance.
The portion of the workforce with jobs requiring a low level of preparation makes
up nearly 60 percent of the Region’s workforce and is critical to Sacramento’s economic success.

EXECUTIVE SUMMARY
SSaaccrraammeennttoo RReeggiioonnaall RReesseeaarrcchh IInnssttiittuuttee vii
Being one of the healthiest economies in California and the United States not only creates a positive perception of the Sacramento Region overall, but also points to the quality of the workforce and the nexus between economic and workforce development.
There are also a number of opportunities for the Sacramento Region. If effectively addressed, these aspects could make the workforce stronger and more competitive.
The Education, Training, & Library; Management; Building & Grounds Cleaning & Maintenance; Protective Service; Healthcare Support; and Personal Care & Services occupational categories are underspecialized and are projected to see relatively strong employment growth and an increase in concentration.
Combined, the portion of the Region’s workforce with jobs requiring medium and
high levels of preparation account for a little over 40 percent of the total—both categories have grown and are projected to continue to grow at a faster rate than the low level of preparation category, and, as such, will become slightly more concentrated than they currently are.
In addition to a critical need for “soft skills” and computer skills, the most widely
applicable competencies for Sacramento workers include Mathematics; English Language; Clerical; Customer & Personal Service; Administration & Management; Speaking; Reading Comprehension; Active Listening; and Writing.
The Region’s major employers feel there are a few workforce-related aspects that
need to be addressed including a shortage of entry-level Office & Administrative support workers, nurses, specialty health practitioners, and math, science, and special education teachers; relatively low compensation levels; and the overall availability and scope of all education and training programs.
Each of these strengths and opportunities are expanded upon in the concluding section of this report and are supported by a wide variety of information presented in the occupational, training and skills, and comparative analyses.

TABLE OF CONTENTS
SSaaccrraammeennttoo RReeggiioonnaall RReesseeaarrcchh IInnssttiittuuttee viii
Table of Contents Page EXECUTIVE SUMMARY ........................................................................... ii TABLE OF CONTENTS .............................................................................. viii INTRODUCTION......................................................................................... 1 Background ............................................................................................ 1 Research Approach ................................................................................ 2 Figure 1: Study Differences.............................................................. 5 Report Structure ..................................................................................... 5 OCCUPATIONAL ANALYSIS ................................................................... 6 Occupational Patterns............................................................................. 6 Figure 2: Sacramento Region Occupational Composition in 2003.................................................................... 7 Figure 3: Sacramento Region Composition between 1999 and 2003.......................................... 9 Figure 4: Sacramento Region Occupational Specialization in 2003 ................................................................. 10 Figure 5: Change in Sacramento Region Occupational Specialization between 1999 and 2003 ................. 11 Figure 6: Sacramento Region Occupational Employment Growth between 1999 and 2003 ............................. 12 Figure 7: Sacramento Region Projected Occupational Employment Growth and Composition ................. 14 Major Employer Viewpoints .................................................................. 15 Figure 8: Percentage of Responding Firms that Contain Jobs in the Major Occupational Categories........... 16 Staffing Patterns in Key Industries......................................................... 17 Figure 9: Characteristics of Key Occupations................................. 17 Conclusion.............................................................................................. 18 Figure 10: Sacramento Region Overall Occupational Performance.......................................................... 18 TRAINING AND SKILLS ANALYSIS....................................................... 21 Training Analysis ................................................................................... 21 Figure 11: Average Level of Preparation For Occupational Categories....................................................... 21 Figure 12: Sacramento Region Level of Preparation Composition in 2003.................................................................... 22 Figure 13: Sacramento Region Level of Preparation Composition between 1999 and 2003.......................................... 23 Figure 14: Sacramento Region Level of Preparation Employment Growth between 1999 and 2003 ............................. 24 Figure 15: Sacramento Region Projected Level of Preparation Employment and Composition................... 25 Skills Analysis........................................................................................ 26 Figure 16: Knowledge Category Importance in 2003....................... 26 Figure 17: Skill Category Importance in 2003.................................. 27 Major Employer Viewpoints .................................................................. 28 Knowledge and Skills Sets in Key Industries......................................... 30 Figure 18: Knowledge and Skill Sets ................................................ 31

TABLE OF CONTENTS
SSaaccrraammeennttoo RReeggiioonnaall RReesseeaarrcchh IInnssttiittuuttee ix
COMPARATIVE ANALYSIS...................................................................... 33 Comparative Occupational Analysis ...................................................... 33 Figure 19: Occupational Employment Growth between 1999 and 2003 ............................................................... 33 Figure 20: Occupational Composition in 2003................................ 34 Figure 21: Shift in Occupational Composition between 1999 and 2003 ............................................................... 35 Figure 22: Office and Administrative Support Occupations Compared to Sacramento Region................................................ 38 Figure 23: Sales and Related Occupations Compared to Sacramento Region................................................ 39 Figure 24: Food Preparation and Serving Related Occupations Compared to Sacramento Region........................... 40 Figure 25: Transportation and Material Moving Occupations Compared to Sacramento Region........................... 41 Figure 26: Construction and Extraction Occupations Compared to Sacramento Region................................................ 42 Figure 27: Business and Financial Operations Occupations Compared to Sacramento Region........................... 43 Figure 28: Education, Training, and Library Occupations Compared to Sacramento Region........................... 44 Figure 29: Management Occupations Compared to Sacramento Region................................................ 45 Comparative Training Analysis.............................................................. 46 Figure 30: High Level of Preparation Compared to Sacramento Region ................................................ 47 Figure 31: Medium Level of Preparation Compared to Sacramento Region ................................................ 48 Figure 32: Low Level of Preparation Compared to Sacramento Region ................................................ 49 Major Employer Viewpoints .................................................................. 50 Conclusion.............................................................................................. 50 CONCLUSION ............................................................................................. 52 Strengths................................................................................................. 52 Opportunities.......................................................................................... 53 APPENDIX A—SOC STRUCTURE AND NOTES ON DATA ................. A-1 APPENDIX B—SAMPLING OF OCCUPATIONS .................................... B-1 Figure B-1: Occupational Employment .......................................... B-1 APPENDIX C—EMPLOYMENT DATA.................................................... C-1 Figure C-1: Employment Data ......................................................... C-1 Figure C-2: Sacramento Region Level of Preparation Employment............................................................. C-1 APPENDIX D—KNOWLEDGE AND SKILL IMPORTANCE ................. D-1 Figure D-1: High Level of Preparation Knowledge Category Importance in 2003 ...................................................... D-1 Figure D-2: Medium Level of Preparation Knowledge Category Importance in 2003 ...................................................... D-2 Figure D-3: Low Level of Preparation Knowledge Category Importance in 2003 ...................................................... D-3

TABLE OF CONTENTS
SSaaccrraammeennttoo RReeggiioonnaall RReesseeaarrcchh IInnssttiittuuttee x
Figure D-4: High Level of Preparation Skill Category Importance in 2003 ...................................................... D-4 Figure D-5: Medium Level of Preparation Skill Category Importance in 2003 ...................................................... D-5 Figure D-6: Low Level of Preparation Skill Category Importance in 2003 ...................................................... D-6 APPENDIX E—KNOWLEDGE AND SKILL DEFINITIONS................... E-1 Knowledge Categories ........................................................................... E-1 Skills Categories..................................................................................... E-3

INTRODUCTION
SSaaccrraammeennttoo RReeggiioonnaall RReesseeaarrcchh IInnssttiittuuttee 1
Introduction Background National, statewide, and local business agendas have become progressively more focused on workforce aspects, noting that a high-quality and capable workforce is a core economic asset. Businesses search for those places which can best meet their critical workforce needs, currently and into the future. Additionally, existing employers look to the workforce to support their continued success. Not only is availability important, but quality is also critical. In terms of economic health, workforce development programs aimed at maintaining and enhancing the quality of the workforce are becoming as important as economic development programs focused on growing the local economy and increasing overall welfare. Many regions throughout the nation have experienced economic restructuring, and, as a result, have seen demand for a new mix of jobs, greater mobility across occupations, and increasing requirements for a higher level and broader set of core skills. A high-quality and capable workforce cannot develop independently—collaborative efforts among business organizations, educational institutions, and local governments must come together to address critical needs and plan for future requirements. However, all aspects of workforce development planning can be improved by incorporating a clear understanding of the local economy, especially the workforce aspects. There is a wide array of information and studies examining the Sacramento Region’s economy (encompassing El Dorado, Placer, Sacramento, Sutter, Yolo, and Yuba Counties); however, the focus is typically on industry information. This type of information is organized based on what firms produce—firms that use similar processes to produce goods or services are grouped together into specific industry categories. The industry view is the most prevalent in regional economic studies because it provides broad insight into economic structure and fundamental changes taking place within a region’s economy. However, there is another, less utilized, view of a region’s economy that focuses on what people do. In this case, the economy is broken down into occupational categories that classify people based on the functions they perform in their jobs. This view is especially important for organizations focused on workforce development. Noting the need for a greater understanding of the Region’s workforce and the benefits that knowledge can provide to workforce and economic development efforts, Sacramento Works, Inc. commissioned the Sacramento Regional Research Institute (SRRI) to provide a study of workforce characteristics and trends. The primary objective of this study is to provide key information about the Sacramento Region’s workforce that can be used to increase the core set of knowledge about the Region’s economy; identify existing strengths and opportunities; and guide Sacramento Works’ and Los Rios Community College’s workforce development efforts (as well as other education and training programs throughout Sacramento).

INTRODUCTION
SSaaccrraammeennttoo RReeggiioonnaall RReesseeaarrcchh IInnssttiittuuttee 2
Research Approach In order to examine the current workforce environment, SRRI utilized employment data grouped in the Standard Occupational Classification (SOC) system. In this system, all workers are classified into one of over 820 occupations according to their job functions. To facilitate classification, SOC combines data into 22 major groups, 96 minor groups, and 449 broad occupations. Each broad occupation includes a sub-set of detailed occupations requiring similar job duties, skills, education, or experience. One fundamental aspect to note is that specific occupations or broader occupational categories can reach across a number of industry sectors. In other words, people that perform a specific job function can be employed in a variety of industries—firms generally do not migrate across industry sectors, but occupations do. The occupational analysis focused on examining the Region’s employment level, occupational composition, employment growth, specialization, and available projections. SRRI also incorporated analyses of training and education requirements and knowledge and skill demand into the study. Information from the occupational analysis was applied to analyses of job zones and knowledge and skill demands for each occupational category and adjusted to the Region’s unique workforce structure. The Department of Labor’s Occupational Information Network (O*Net), a database of worker attributes and job characteristics, provides a wealth of information about specific occupations based on feedback from both employers and employees. O*Net’s job zone data offers a standardized scale that accounts for four factors that are proxies for training and education requirements: common steps taken to enter a particular field of work; necessary overall experience; required education; and the amount of on-the-job training necessary to perform a specific job. While job zone data is broken down into five categories, SRRI aggregated the top and bottom ends of the scale to create three “level of preparation” categories. The first category, high level of preparation, includes occupations that require considerable or extensive preparation (generally, a four-year degree or above plus work experience). The second category, medium level of preparation, encompasses occupations that demand considerable levels of on-the-job training, vocational education, or a two-year degree. The low level of preparation, SRRI’s third category, contains occupations that need little to no preparation with some on-the-job training needs and high school-level education requirements. The O*Net database also tracks importance rankings for sets of knowledge and skills categories for each occupation. This information is based on employee views of the importance of certain competencies for successful job performance. The database includes the same sets of knowledge and skills for each occupation, but the level of importance for each set varies by occupation—there are 35 skill categories and 33 knowledge categories in O*Net’s database (a more detailed description of the categories is provided in the appendix of this interim report). For both the job zone data and the knowledge and skill set information, SRRI created an average measure for each major occupational category based on the O*Net data for the specific jobs contained within the categories. The training and skills analysis was then performed by applying the average measures to the employment by occupational category data obtained in the Occupational Analysis section

INTRODUCTION
SSaaccrraammeennttoo RReeggiioonnaall RReesseeaarrcchh IInnssttiittuuttee 3
of this project. The training and skills analysis focused on examining the training and education requirements as well as knowledge and skill demand for the Region’s major occupational categories. It is also imperative to consider how the Region measures up to statewide and national averages as well as other comparative or competitive regions. SRRI and Sacramento Works, Inc. selected eight regions for the comparative analysis in order to capture a balance of comparative and competitive regions both within and outside of California. The eight regions include:
1. Bay Area (Alameda, Contra Costa, Marin, San Francisco, San Mateo, and Santa Clara Counties, CA)
2. Fresno (Fresno and Madera Counties, CA) 3. Inland Empire (Riverside and San Bernardino Counties, CA) 4. San Diego (San Diego County, CA) 5. Denver (Adams, Arapahoe, Denver, Douglas, and Jefferson Counties, CO) 6. Las Vegas (Clark and Nye Counties, NV and Mohave County, AZ) 7. Phoenix (Maricopa and Pinal Counties, AZ) 8. Portland (Clackamas, Columbia, Multnomah, Washington, and Yamhill Counties,
OR and Clark County, WA) In addition to these eight regions, the statewide and national averages were also used as comparison points to provide a broader range of analysis. SRRI utilized the same set of occupational employment and job zone data for this piece of the project as was analyzed in the occupational and training and skills analyses. The comparative analysis was aimed at comparing employment growth, workforce composition, and shift in workforce composition for the 22 major occupational categories and three level of preparation categories in the Sacramento Region and the comparative and competitive regions. Technical research and analysis based on secondary data (like that provided by the Bureau of Labor Statistics and O*Net) produces key information about existing conditions, historical trends, and expected changes. This type of research and analysis was used to produce the occupational, training and skills analysis, comparative analyses, which all explain different aspects of the Sacramento Region’s workforce. When possible, it is also important to conduct primary research such as interviews and comparisons between different research studies in order to validate what the secondary data is showing, capture information that the data does not, and generate greater insight into specific conditions and trends. Since both economic and workforce development efforts must keep up with the dynamic changes in the economy that secondary data might not completely address, primary research is a particularly important litmus test for research projects aimed at providing information to help guide these efforts. SRRI provided two areas of primary research in this study—interviews and comparisons to previous research that are interspersed to provide additional information in all areas of analysis.

INTRODUCTION
SSaaccrraammeennttoo RReeggiioonnaall RReesseeaarrcchh IInnssttiittuuttee 4
SRRI conducted interviews with major employers in the Sacramento Region in order to validate research and analysis provided in the previous sections of this project. The interview process also allowed regional employers to offer an insider-perspective regarding occupational skills, knowledge, education and training, as well as industry-specific observations. SRRI attempted to contact 57 of the Sacramento Region’s largest employers (based on total employment size in the Region’s six counties) and was ultimately able to obtain responses from 18 firms (a response rate of 32 percent)—the respondents support over 49,000 jobs in the Region. Employers were provided a few methods by which they could participate in the open-ended interview process: on the phone (the preferred method) or via e-mail or facsimile with follow-up questions and clarification. In an effort to obtain the most relevant and accurate responses, SRRI primarily contacted executives, managers, and directors, targeting those with positions in recruitment, human resources, and personnel. In the Analysis of Workforce Skills Sets study, SRRI examined the low- and moderate-skilled occupations and related knowledge and skill sets within 15 industries sectors that demonstrated the greatest potential for economic development in the Sacramento Region. The goal of the previous study was to provide a link between industry structure, occupational categories, and employee skill requirements to show which workforce characteristics are important to the Region’s key growth industries. This study, however, is aimed at describing Sacramento’s overall workforce characteristics and trends irrespective of links to specific industry sectors or training levels in order to provide a broader understanding of the Region’s workforce.

INTRODUCTION
SSaaccrraammeennttoo RReeggiioonnaall RReesseeaarrcchh IInnssttiittuuttee 5
Figure 1 shows some of the key differences in the foci of the two studies. Comparing high level findings in both the Regional Workforce Study and the Analysis of Workforce Skills Sets report provides further validation of information in both studies and can help highlight both conformity and gaps between economic and workforce development. FIGURE 1 STUDY DIFFERENCES
Analysis of Workforce Skills Sets
-15 key industries-Low- and moderate- skilled occupations
Regional Workforce Study
-All industries-All training levels
Sacramento Regional Research Institute, August 2005 Report Structure This report is broken down into three main sections for each of the areas of analysis—occupational, training and skills, and comparative—along with a conclusion that identifies the Region’s major strengths and opportunities based on the information gathered for this study. In addition to these four main sections, this report contains five appendices. Appendix A includes the complete SOC structure along with further technical background on the data. A sampling of specific jobs within each of the Sacramento Region’s largest major occupational categories is included in Appendix B. For reference purposes, Appendix C provides five years of employment data for the Region’s major occupational and level of preparation categories. Also for reference purposes, Appendix D contains level of importance rankings for the knowledge and skill categories in the Sacramento Region broken down by the high, medium, and low level of preparation categories. Appendix E provides O*Net’s definitions for each of the specific knowledge and skill categories.

OCCUPATIONAL ANALYSIS
SSaaccrraammeennttoo RReeggiioonnaall RReesseeaarrcchh IInnssttiittuuttee 6
Occupational Analysis This section of the report examines recent and projected trends in the Sacramento Region’s major occupational categories and presents analyses of employment levels, occupational composition, employment growth, and specialization. An index is also developed to illustrate overall occupational category performance across all measures. In addition, major employers’ viewpoints on the Region’s occupational structure and a review of staffing patterns highlighted in the Analysis of Workforce Skills Sets project are included to validate and expand on the technical data. Occupational Patterns Over one-fifth of the Region’s workforce is in the Office & Administrative Support occupational category. This category includes jobs related to communications equipment operation; financial and general information records management; material recording, scheduling, dispatching, and distributing; and clerical, executive, and general administrative support. Two other major categories make up a relatively large amount of the workforce—Sales & Related and Food Preparation & Serving Related encompass about 10 and 8 percent of the Region’s total occupational employment, respectively. The Sales & Related category contains retail sales workers and other sales representatives for a wide array of products and services. Cooks, food preparation workers, and food and beverage servers are all included in the Food Preparation & Serving Related occupational category. Together, the top three occupational categories make up almost 40 percent of the Region’s workforce.

OCCUPATIONAL ANALYSIS
SSaaccrraammeennttoo RReeggiioonnaall RReesseeaarrcchh IInnssttiittuuttee 7
Figure 2 illustrates the Sacramento Region’s occupational composition in 2003 based on the percentage of total occupational employment contained in each major category. FIGURE 2 SACRAMENTO REGION OCCUPATIONAL COMPOSITION IN 2003
Production ; 37,010; 4.3%
Education, training, and library ; 48,040; 5.6%
Management ; 43,520; 5.0%
Sales and related ; 87,170; 10.1%
Food preparation and serving related ; 65,470;
7.6%
Healthcare practitioners and technical ; 35,800; 4.2%
Transportation and material moving ; 56,240; 6.5%
Construction and extraction ; 55,860; 6.5%
Business and financial operations ; 53,830; 6.2%
Office and administrative support ; 178,530; 20.7%
Legal ; 7,330; 0.9% Farming, fishing, and forestry; 6,250; 0.7%
Personal care and service ; 14,520; 1.7%
Architecture and engineering ; 18,320; 2.1%
Community and social services ; 14,740; 1.7%
Healthcare support ; 16,850; 2.0%
Arts, design, entertainment, sports, and media ; 9,200;
1.1%Life, physical, and social
science ; 9,320; 1.1%
Protective service ; 20,460; 2.4%
Computer and mathematical ; 25,710; 3.0%
Building and grounds cleaning and maintenance ;
26,810; 3.1%Installation, maintenance, and repair ; 31,260; 3.6%
Sacramento Regional Research Institute, May 2005 Data Source: Bureau of Labor Statistics, Occupational Employment Statistics All other occupational categories contain less than 7 percent of the total employment, but grouping the top ten categories accounts for approximately 77 percent of the Sacramento Region’s total occupational employment. The top ten categories include:
1. Office & Administrative Support 2. Sales & Related 3. Food Preparation & Serving Related 4. Transportation & Material Moving 5. Construction & Extraction 6. Business & Financial Operations 7. Education, Training, & Library 8. Management 9. Production 10. Healthcare Practitioners & Technical
The remaining 12 occupational categories play a minimal role in the Region’s workforce, each with less than 4 percent of the total occupational employment—combined, they account for only about 23 percent of the entire workforce. For additional information on

OCCUPATIONAL ANALYSIS
SSaaccrraammeennttoo RReeggiioonnaall RReesseeaarrcchh IInnssttiittuuttee 8
the complete SOC structure and data, refer to Appendix A. A sampling of specific jobs within each of the Region’s ten largest occupational categories along with related employment data is provided in Appendix B. Between 1999 and 2003, Office & Administrative Support, the Region’s largest occupational category, has increased in proportion of the total workforce by about 1 percent. This category has become a much more important aspect of Sacramento’s workforce over the past five years. The Region’s second largest occupational category, Sales & Related, has shown only a minimal shift in concentration since 1999 with only a minimal increase. Sales & Related occupations have continuously been a key element of the Region’s economy over the past five years. Demonstrating an opposite pattern, Sacramento’s third largest occupational category, Food Preparation & Serving Related, has seen a significant decrease in concentration between 1999 and 2003. While this category currently encompasses about 8 percent of the Region’s total occupational employment, it contained nearly 10 percent in 1999.

OCCUPATIONAL ANALYSIS
SSaaccrraammeennttoo RReeggiioonnaall RReesseeaarrcchh IInnssttiittuuttee 9
Figure 3 shows how the Sacramento Region’s occupational composition has shifted over the past five years and hints at aspects of workforce restructuring that are already underway. Overall, eight of the Region’s major occupational categories have demonstrated a negative shift in occupational composition between 1999 and 2003 with Food Preparation & Serving Related, Production, and Protective Service seeing the greatest decrease in concentration. The other 14 categories all experienced an increase in their proportion of total employment over the past five years. The Office & Administrative Support, Computer & Mathematical, and Construction & Extraction occupational categories saw the largest increases in concentration. FIGURE 3 SHIFT IN SACRAMENTO REGION OCCUPATIONAL COMPOSITION BETWEEN 1999 AND 2003
-1.9%
-1.2%
-1.0%
-0.9%
-0.5%
-0.2%
-0.2%
-0.2%
0.1%
0.1%
0.2%
0.2%
0.3%
0.3%
0.3%
0.5%
0.5%
0.6%
0.6%
0.7%
0.7%
0.9%
-2.5% -2.0% -1.5% -1.0% -0.5% 0.0% 0.5% 1.0% 1.5%
Food preparation and serving related
Production
Protective service
Management
Personal care and service
Healthcare practitioners and technical
Education, training, and library
Healthcare support
Arts, design, entertainment, sports, and media
Sales and related
Farming, fishing, and forestry
Life, physical, and social science
Building and grounds cleaning and maintenance
Legal
Architecture and engineering
Business and financial operations
Installation, maintenance, and repair
Transportation and material moving
Community and social services
Construction and extraction
Computer and mathematical
Office and administrative support
Sacramento Regional Research Institute, May 2005 Data Source: Bureau of Labor Statistics, Occupational Employment Statistics

OCCUPATIONAL ANALYSIS
SSaaccrraammeennttoo RReeggiioonnaall RReesseeaarrcchh IInnssttiittuuttee 10
Figure 4 demonstrates the Sacramento Region’s occupational specialization in 2003 which measures the degree to which the Region is concentrated in some workforce elements in a way different from the rest of the state. Specialization is measured by the relative size of an occupational category in Sacramento compared to the statewide average. A measure of specialization above 100 percent indicates that Sacramento has a greater percentage of total employment in the category compared to California, while a value less than 100 percent indicates that the Region has a below-average concentration in that category. Essentially, this measure shows what is unique about the Region’s workforce. FIGURE 4 SACRAMENTO REGION OCCUPATIONAL SPECIALIZATION IN 2003
140.8%
139.7%
133.5%
112.0%
111.9%
111.5%
109.7%
105.1%
102.5%
80.7%
69.6%
62.3%
57.9%
97.9%
97.3%
96.3%
95.9%
95.6%
93.7%
92.9%
92.2%
89.3%
0% 20% 40% 60% 80% 100% 120% 140% 160%
Business and financial operations
Community and social services
Construction and extraction
Computer and mathematical
Legal
Office and administrative support
Life, physical, and social science
Healthcare practitioners and technical
Installation, maintenance, and repair
Sales and related
Food preparation and serving related
Building and grounds cleaning and maintenance
Architecture and engineering
Protective service
Management
Transportation and material moving
Healthcare support
Education, training, and library
Personal care and service
Arts, design, entertainment, sports, and media
Farming, fishing, and forestry
Production SpecializedUnderspecialized
Sacramento Regional Research Institute, May 2005 Data Source: Bureau of Labor Statistics, Occupational Employment Statistics The Sacramento Region is specialized in nine occupational categories including:
1. Business & Financial Operations 2. Community & Social Services 3. Construction & Extraction 4. Computer & Mathematical 5. Legal 6. Office & Administrative Support 7. Life, Physical, & Social Science 8. Healthcare Practitioners & Technical

OCCUPATIONAL ANALYSIS
SSaaccrraammeennttoo RReeggiioonnaall RReesseeaarrcchh IInnssttiittuuttee 11
9. Installation, Maintenance, & Repair The top three areas of specialization all have a concentration over 30 percent higher than the statewide average. One of the Sacramento Region’s largest occupational categories, Office & Administrative Support shows a level of specialization about 12 percent higher than the statewide average, further illustrating the contribution of this aspect of the workforce to the Region’s economy. Two of Sacramento’s largest occupational categories, Sales & Related and Food Preparation & Serving Related, demonstrate a similar level of concentration as the statewide average. The Region is underspecialized in the remaining 11 major occupational categories. Many of these categories are only slightly less concentrated than the statewide average, but three demonstrate a significantly lower level including Arts, Design, Entertainment, Sports, & Media; Farming, Fishing, & Forestry; and Production. Figure 5 demonstrates the change in the degree of occupational specialization between 1999 and 2003 in the Sacramento Region. This measure reflects occupational restructuring occurring at both the regional and statewide levels. FIGURE 5 CHANGE IN SACRAMENTO REGION OCCUPATIONAL SPECIALIZATION BETWEEN 1999 AND 2003
-30.6%
-23.4%
-11.3%
-9.8%
-4.8%
-2.6%
-2.0%
-0.8%
3.0%
5.2%
5.5%
6.5%
10.2%
12.0%
17.1%
21.7%
21.7%
23.0%
32.2%
42.0%
-38.6%
-45.1%
-50% -40% -30% -20% -10% 0% 10% 20% 30% 40% 50%
Personal care and service
Protective service
Food preparation and serving related
Healthcare support
Business and financial operations
Education, training, and library
Life, physical, and social science
Production
Sales and related
Management
Office and administrative support
Healthcare practitioners and technical
Transportation and material moving
Construction and extraction
Building and grounds cleaning and maintenance
Installation, maintenance, and repair
Architecture and engineering
Farming, fishing, and forestry
Computer and mathematical
Arts, design, entertainment, sports, and media
Community and social services
Legal
Sacramento Regional Research Institute, May 2005 Data Source: Bureau of Labor Statistics, Occupational Employment Statistics

OCCUPATIONAL ANALYSIS
SSaaccrraammeennttoo RReeggiioonnaall RReesseeaarrcchh IInnssttiittuuttee 12
Changes in the Region’s degree of specialization are basically split in half with 12 occupational categories experiencing an increase in the level of specialization and 10 seeing a decrease. Two of the occupational categories that currently show specialization in the Sacramento Region have seen strong increases in the degree of specialization over the past five years—Legal and Community & Social Services. Although the Region is currently underspecialized in Arts, Design, Entertainment, Sports, & Media this category also saw a relatively large positive change in the level of specialization since 1999. Personal Care & Service; Protective Service; Food Preparation & Serving Related (one of Sacramento’s largest categories); and Healthcare Support have all experienced considerable decreases in specialization over the past five years. The Region’s two largest categories, Office & Administrative Support and Sales & Related saw minimal positive and negative changes in the degree of specialization, respectively. Business & Financial Operations, the Region’s most specialized category, experienced a notable decrease in its degree of specialization between 1999 and 2003. Figure 6 displays the employment growth rate in the Sacramento Region’s major occupational categories between 1999 and 2003. FIGURE 6 SACRAMENTO REGION OCCUPATIONAL EMPLOYMENT GROWTH BETWEEN 1999 AND 2003
-20.5%
-12.2%
-11.2%
-8.3%
-2.2%
5.6%
8.4%
10.8%
24.3%
25.1%
25.5%
28.5%
34.6%
34.7%
42.9%
49.5%
50.6%
77.4%
79.2%
15.0%
21.5%
19.6%
-40% -20% 0% 20% 40% 60% 80% 100%
Protective service
Personal care and service
Production
Food preparation and serving related
Management
Healthcare support
Healthcare practitioners and technical
Education, training, and library
Sales and related
Office and administrative support
Arts, design, entertainment, sports, and media
Business and financial operations
Transportation and material moving
Building and grounds cleaning and maintenance
Construction and extraction
Installation, maintenance, and repair
Architecture and engineering
Life, physical, and social science
Farming, fishing, and forestry
Computer and mathematical
Community and social services
Legal R
egio
nal A
vera
ge
Occ
upat
iona
l Gro
wth
Sacramento Regional Research Institute, May 2005 Data Source: Bureau of Labor Statistics, Occupational Employment Statistics
OCCUPATIONAL ANALYSIS
SSaaccrraammeennttoo RReeggiioonnaall RReesseeaarrcchh IInnssttiittuuttee 13
Half of the Region’s occupational categories experienced employment growth rates above the regional average. A few occupational categories saw robust employment growth over the past five years with the most notable gains in the Legal and Community & Social Services categories (although these two categories only account for a little less than 3 percent of the Region’s total employment and high growth rates reflect minimal actual job gains). Only five of the 22 occupational categories experienced employment decreases over this period including Protective Service; Personal Care & Service; Production; Food Preparation & Serving Related; and Management. While one of the Region’s largest categories is in the list of employment decreases (Food Preparation & Serving Related), the other two, Office & Administrative Support and Sales & Related, both saw positive, but relatively low, employment growth rates. All three of Sacramento’s most specialized categories also posted employment gains over the past five years—Community & Social Services (one of the highest growth rates); Business & Financial Operations; and Construction & Extraction. Appendix C contains employment levels for all of the Region’s major occupational categories over each of the past five years.

OCCUPATIONAL ANALYSIS
SSaaccrraammeennttoo RReeggiioonnaall RReesseeaarrcchh IInnssttiittuuttee 14
Figure 7 displays projections of occupational employment in the Sacramento Region for 2012 along with 2003 to 2012 employment growth rates and projected composition. This information is based on statewide projected growth rates, and although there will be some regional differences depending upon the specific economic conditions, SRRI believes that they provide a reliable estimate of growth for the Sacramento Region’s occupational categories since the Region is beginning to demonstrate trends similar to the state and statewide averages are generally less robust than regional trends. It is also important to point out that the projections reflect a fairly conservative view because the staffing patterns for some industry sectors are not included. FIGURE 7 SACRAMENTO REGION PROJECTED OCCUPATIONAL EMPLOYMENT AND COMPOSITION
Projected Shift inEmployment Growth Composition Composition
Occupational Category 2012 2003-2012 2012 2003-2012
Office and administrative support 184,166 3.2% 18.1% -2.6%Sales and related 104,136 19.5% 10.2% 0.1%Food preparation and serving related 77,395 18.2% 7.6% 0.0%Construction and extraction 73,992 32.5% 7.3% 0.8%Transportation and material moving 65,817 17.0% 6.5% -0.1%Business and financial operations 65,640 21.9% 6.4% 0.2%Education, training, and library 63,949 33.1% 6.3% 0.7%Management 53,553 23.1% 5.3% 0.2%Healthcare practitioners and technical 47,807 33.5% 4.7% 0.5%Production 40,247 8.7% 4.0% -0.3%Installation, maintenance, and repair 36,882 18.0% 3.6% 0.0%Building and grounds cleaning and maintenance 33,315 24.3% 3.3% 0.2%Computer and mathematical 30,982 20.5% 3.0% 0.1%Protective service 26,331 28.7% 2.6% 0.2%Healthcare support 21,729 29.0% 2.1% 0.2%Personal care and service 20,994 44.6% 2.1% 0.4%Architecture and engineering 19,968 9.0% 2.0% -0.2%Community and social services 13,322 -9.6% 1.3% -0.4%Arts, design, entertainment, sports, and media 11,678 26.9% 1.1% 0.1%Life, physical, and social science 10,427 11.9% 1.0% -0.1%Legal 8,958 22.2% 0.9% 0.0%Farming, fishing, and forestry 7,257 16.1% 0.7% 0.0%
Sacramento Regional Research Institute, May 2005 Data Sources: Bureau of Labor Statistics, Occupational Employment Statistics and Employment Development Department, Employment Projections by Occupation Note: Projected employment based on statewide projected growth rates. The Sacramento Region’s general occupational structure is projected to remain similar to the 2003 composition. Office & Administrative Support; Sales & Related; and Food Preparation & Serving Related will still be the Region’s largest occupational categories in 2012. Most categories show limited shifts in composition. Two categories show positive projected concentration shifts of close to one percent including Construction & Extraction and Education, Training, & Library. Only six occupational categories are projected to lose concentration with Office & Administrative Support showing the largest decrease. This is primarily due to its relatively slow projected growth. Only one sector is projected to experience a decrease in employment between 2003 and 2012, Community & Social Services. Personal Care & Service; Healthcare Practitioners & Technical; Education, Training, & Library; and Construction & Extraction will all see strong

OCCUPATIONAL ANALYSIS
SSaaccrraammeennttoo RReeggiioonnaall RReesseeaarrcchh IInnssttiittuuttee 15
employment growth over the next nine years, all with growth rates over 32 percent. In general, employment will increase in the Sacramento Region between 2003 and 2012 raising levels in almost every occupational category, but these patterns will not substantially change the Region’s workforce structure. Major Employer Viewpoints The predominant occupations within the firms that participated in SRRI’s interviews fall within the Office & Administrative Support; Healthcare Practitioners & Technical; and Education, Training, & Library occupational categories, three of the Sacramento Region’s largest occupational categories. To a lesser extent, interviewed firms also mentioned that some of their most predominant jobs fall within other occupational categories such as Architecture & Engineering; Protective Services; Installation, Maintenance, & Repair; and Building & Grounds Cleaning & Maintenance. While these categories represent the unique features of the interviewed firms, collectively, respondents’ firms contain occupations that are part of all the Sacramento Region’s ten largest occupational categories.

OCCUPATIONAL ANALYSIS
SSaaccrraammeennttoo RReeggiioonnaall RReesseeaarrcchh IInnssttiittuuttee 16
Figure 8 shows the percentage of respondents that employ jobs within each of the major occupational categories, irrespective of the total number of jobs they have in each category. The majority of interviewed firms have jobs within the Office & Administrative Support and Management occupational categories, while a mix of other major categories are present within many of the respondents’ firms. It is interesting to note that a few of the major employers lacked the corporate infrastructure or were unwilling to share the general breakdown of job types or the most predominant occupations they employ. Major employers do not expect significant changes in the types of jobs they employ over the next five to ten years—this supports occupational projections that demonstrate that the Region’s general occupational structure will remain similar to its current composition with small shifts in a few occupational categories. FIGURE 8 PERCENTAGE OF RESPONDING FIRMS THAT CONTAIN JOBS IN THE MAJOR OCCUPATIONAL CATEGORIES
0% 10% 20% 30% 40% 50% 60% 70% 80% 90% 100%
Office and administrative support
Management
Healthcare practitioners andtechnical
Architecture and engineering
Transportation and materialmoving
Business and financial operations
Sales and related
Education, training, and library
Production
Protective service
Food preparation and servingrelated
Construction and extraction
Sacramento Regional Research Institute, August 2005 Data Source: SRRI Major Employer Interviews Respondents noted difficulties staffing certain classifications and job types due to a shortage of qualified applicants. A majority of respondents remarked on a shortage of entry-level Office & Administrative Support applicants. Many of the firms that noted this issue cited a lack of basic computer, reading comprehension, and active listening skills as one of the primary reason for the quality of applicants. Additionally, respondents projected a concern over high turnover in this occupational category. A majority of healthcare firms, whose primary occupational categories are projected to see

OCCUPATIONAL ANALYSIS
SSaaccrraammeennttoo RReeggiioonnaall RReesseeaarrcchh IInnssttiittuuttee 17
relatively high job growth in the next decade, noted a shortage of nurse and specialty practitioner applicants along with the issue of continuous job vacancies. Most healthcare agencies attribute the shortage to government-mandated nurse-to-patient ratios and impacted educational programs (more demand than can be accommodated). The absence of math, science, and special education teachers is a major concern for local school districts who endure staffing problems—these respondents mentioned poor recruitment in colleges and universities as part of the reason for their hiring difficulties. City and county governments experience difficulties filling Protective Service occupations (one of the region’s smallest occupational categories) despite highly competitive salary and compensation packages. Other industry-specific staffing problems include government and production firm vacancies in civil and mechanical engineering-related jobs (another relatively small occupational category in the Region) as well as some construction positions (despite their strong presence in Sacramento). For higher-skilled positions, such as engineering and construction, employers often referred to specialized qualifications and credentials which narrow the number of qualified applicants considerably. Staffing Patterns in Key Industries Many of the key occupations that arose from the Analysis of Workforce Skills Sets study (based on projected growth) are grouped within some of the Sacramento Region’s largest occupational categories including Office & Administrative Support; Production; Sales & Related; and Healthcare Practitioners & Technical (as shown in Figure 9). FIGURE 9 CHARACTERISTICS OF KEY OCCUPATIONS
Occupational OccupationalComposition Specialization
Occupation Major Occupational Category 2003 2003
Key Low-SkilledOccupational therapist assistants Healthcare support 2.0% 92.2%Customer service representatives Office and administrative support 20.7% 111.5%Hotel, motel, and resort desk clerks Office and administrative support 20.7% 111.5%Office clerks, general Office and administrative support 20.7% 111.5%Extruding, forming, pressing, and compacting operators Production 4.3% 57.9%Welding , soldering, and brazing operators Production 4.3% 57.9%Security guards Protective Service 2.4% 95.6%Cashiers Sales and related 10.1% 97.9%Real estate brokers Sales and related 10.1% 97.9%Retail salespersons Sales and related 10.1% 97.9%
Key Moderate-SkilledDental hygienists Healthcare practitioners and technical 4.2% 105.1%Licensed practical and licensed vocational nurses Healthcare practitioners and technical 4.2% 105.1%Medical records and health information technicians Healthcare practitioners and technical 4.2% 105.1%Registered nurses Healthcare practitioners and technical 4.2% 105.1%Surgical technologists Healthcare practitioners and technical 4.2% 105.1%Avionics technicians Installation, maintenance, and repair 3.6% 102.5%Chemical technicians Life, physical, and social science 1.1% 109.7%Geological and petroleum technicians Life, physical, and social science 1.1% 109.7%Executive secretaries and administrative assistants Office and administrative support 20.7% 111.5%Secretaries, except legal, medical, and executive Office and administrative support 20.7% 111.5%
Sacramento Regional Research Institute, August 2005 Data Sources: Employment Development Department, Employment Projections by Occupation and Bureau of Labor Statistics, Occupational Employment Statistics

OCCUPATIONAL ANALYSIS
SSaaccrraammeennttoo RReeggiioonnaall RReesseeaarrcchh IInnssttiittuuttee 18
Three of the key occupations from the previous report are classified in occupational categories that are relatively small such as Protective Services; Installation, Maintenance, and Repair; and Life, Physical, & Social Science. All of the key moderate-skilled occupations identified as important to industries with strong economic development potential are contained in categories where the Sacramento Region is specialized (contains a greater proportion than the statewide average); however, besides the Office & Administrative Support occupations, all key low-skilled occupations are within categories that are either underspecialized or around the statewide average concentration. The occupations that are in large or specialized categories point to a notable consistency between economic and workforce development where there is a potential fit between industry growth and workforce capabilities. On the other hand, occupations in small or underspecialized occupational categories illustrate the divergence between the two efforts where workforce development responses might be necessary to complement industry growth. Conclusion Figure 10 displays a rank of performance for each occupational category based on indexed measures of composition, shift in composition, specialization, change in specialization, growth, and projected growth. The index measure is presented in a 0 to 100 range. FIGURE 10 SACRAMENTO REGION OVERALL OCCUPATIONAL PERFORMANCE
Rank Occupational Category Index Score
1 Legal 100.02 Construction and extraction 98.63 Office and administrative support 93.14 Community and social services 91.45 Computer and mathematical 89.06 Business and financial operations 82.37 Installation, maintenance, and repair 71.98 Transportation and material moving 66.39 Building and grounds cleaning and maintenance 64.7
10 Sales and related 63.311 Healthcare practitioners and technical 61.812 Architecture and engineering 59.213 Life, physical, and social science 57.714 Education, training, and library 52.315 Arts, design, entertainment, sports, and media 51.916 Farming, fishing, and forestry 51.917 Healthcare support 36.418 Management 36.319 Personal care and service 21.020 Food preparation and serving related 10.921 Protective service 10.722 Production 0.0
Sacramento Regional Research Institute, May 2005 Data Sources: Bureau of Labor Statistics, Occupational Employment Statistics and Employment Development Department, Employment Projections by Occupation

OCCUPATIONAL ANALYSIS
SSaaccrraammeennttoo RReeggiioonnaall RReesseeaarrcchh IInnssttiittuuttee 19
Overall, index scores suggest that six occupational categories appear to be the best-performing elements of Sacramento Region’s workforce including:
1. Legal 2. Construction & Extraction 3. Office & Administrative Support 4. Community & Social Services 5. Computer & Mathematical 6. Business & Financial Operations
All six categories saw relatively robust measures across a number of indicators, but each experienced a unique pattern that affected their overall performance. The Legal occupational category saw the highest employment growth and change in degree of specialization among all categories. Construction & Extraction has a relatively high level of specialization and saw a strong shift in composition. The Office & Administrative Support category is the Region’s largest and saw the highest shift in composition out of all 22 categories. Community & Social Services has a relatively high degree of specialization and saw strong employment growth. Computer & Mathematical occupations experienced a strong shift in composition and saw relatively high measures in a few other areas. The Business & Financial Operations category is the most specialized in the Region and experienced a relatively large change in the degree of specialization. Four occupational categories, ranked 19 through 22, showed generally poor performance based on the index of all indicators including Personal Care & Service (despite its strong projected growth); Food Preparation & Serving Related (regardless of its relatively large size); Protective Service; and Production. The remaining 12 occupational categories presented a mixed view of performance across the five indicators and ranked between 7 and 18 overall. Overall, the viewpoints of the Sacramento Region’s major employers generally validate SRRI’s technical analysis of occupations. A large proportion of the respondents employed jobs in many of the Region’s largest occupational categories and do not expect significant shifts in occupational structure over the next 5 to 10 years. Although the Analysis of Workfoce Skills Sets project and this study differ in the segment of the Sacramento workforce they examine and are aimed at accomplishing two separate objectives, there are quite a few areas that illustrate a connection between the Region’s economic and workforce development potential. Many of the occupations identified as key to the 15 industries in the Analysis of Workforce Skill Sets study are part of the Region’s largest and specialized occupational categories, presenting a potential link between economic and workforce development. A few other key occupations are housed within smaller and underspecialized occupational categories, suggesting the need for increased workforce development to support economic growth and development in the 15 industries—in planning for potential workforce development efforts, data and interviews

OCCUPATIONAL ANALYSIS
SSaaccrraammeennttoo RReeggiioonnaall RReesseeaarrcchh IInnssttiittuuttee 20
from both studies imply that there is a need to dig deeper into characteristics, trends, and requirements for specific occupations.

TRAINING AND SKILLS ANALYSIS
SSaaccrraammeennttoo RReeggiioonnaall RReesseeaarrcchh IInnssttiittuuttee 21
Training and Skills Analysis This section of the report provides an analysis of training and education requirements as well as knowledge and skill demand for the Sacramento Region’s major occupational categories. To provide more local context and validate the data analysis, the results of interviews with major employers are presented. Additionally, comparisons are made between training and skills analyses in this project and findings from the Analysis of Workforce Skills Sets study. Training Analysis Each of the 22 major occupational categories in the Standard Occupational Classification (SOC) system encompasses a group of broad occupations. Using O*Net’s job zone data for each of the broad occupations housed in the major occupational categories, SRRI created a level of preparation—high, medium, and low—for the major occupational categories. Figure 11 shows the level of preparation associated with each major occupational category. On an overall basis, irrespective of employment levels, many of the categories are grouped under the high and low level of preparation while only a few show a medium level of preparation. FIGURE 11 AVERAGE LEVEL OF PREPARATION FOR OCCUPATIONAL CATEGORIES
Average LevelOccupational Category of Preparation
Architecture and engineering HighArts, design, entertainment, sports, and media HighBusiness and financial operations HighCommunity and social services HighComputer and mathematical HighEducation, training, and library HighHealthcare practitioners and technical HighLegal HighLife, physical, and social science HighManagement HighConstruction and extraction MediumInstallation, maintenance, and repair MediumProtective service MediumBuilding and grounds cleaning and maintenance LowFarming, fishing, and forestry LowFood preparation and serving related LowHealthcare support LowOffice and administrative support LowPersonal care and service LowProduction LowSales and related LowTransportation and material moving Low
Sacramento Regional Research Institute, June 2005 Data Source: O*Net

TRAINING AND SKILLS ANALYSIS
SSaaccrraammeennttoo RReeggiioonnaall RReesseeaarrcchh IInnssttiittuuttee 22
Figure 12 illustrates the Sacramento Region’s level of preparation composition in 2003 based on the percentage of total occupational employment encompassed in each category. This information is based on the employment levels for the major occupational categories and the level of preparation associated with those occupational categories (shown in Figure 11). FIGURE 12 SACRAMENTO REGION LEVEL OF PREPARATION COMPOSITION IN 2003
Low; 488,850; 56.7%
Medium; 107,580; 12.5%
High; 265,810; 30.8%
Sacramento Regional Research Institute, June 2005 Data Sources: Bureau of Labor Statistics, Occupational Employment Statistics and O*Net Nearly 57 percent of the Region’s workforce is employed in jobs requiring a low level of preparation. This is particularly important for workforce development organizations to note since it demonstrates that one of their primary target markets is considerably large in the Sacramento Region. The high level of preparation category also encompasses a notable proportion of the Region’s workforce with close to 31 percent of the total occupational employment. At less than half the size of the high level of preparation category and about a quarter of the size of the low level of preparation category, the medium level of preparation category contains almost 13 percent of the workforce. The Region’s current economic structure has created conditions that primarily make use of jobs requiring low and high levels of preparation—combined these two categories make up almost 88 percent of the workforce.

TRAINING AND SKILLS ANALYSIS
SSaaccrraammeennttoo RReeggiioonnaall RReesseeaarrcchh IInnssttiittuuttee 23
Figure 13 shows the shifts in the Sacramento Region’s level of preparation composition over the past five years and provides insight into how demand for training requirements have been shifting through the Region’s economic restructuring. Between 1999 and 2003, the proportion of the workforce with jobs requiring a low level of preparation has decreased by nearly 2 percentage points. The high level of preparation category has taken up most of the low level shift with a gain of a little less than two percentage points. The medium level of preparation category also experienced a slight gain in proportion over the past five years. Between 1999 and 2003, jobs with medium and high levels of preparation have become slightly more important to the regional economy, while occupations demanding low levels of preparation (still the Region’s largest category) have decreased in their contribution. FIGURE 13 SHIFT IN SACRAMENTO REGION LEVEL OF PREPARATION COMPOSITION BETWEEN 1999 AND 2003
1.5%
0.2%
-1.7%
-2.0% -1.5% -1.0% -0.5% 0.0% 0.5% 1.0% 1.5% 2.0%
High
Medium
Low
Sacramento Regional Research Institute, June 2005 Data Sources: Bureau of Labor Statistics, Occupational Employment Statistics and O*Net

TRAINING AND SKILLS ANALYSIS
SSaaccrraammeennttoo RReeggiioonnaall RReesseeaarrcchh IInnssttiittuuttee 24
Figure 14 displays the employment growth rate in the Sacramento Region’s level of preparation categories between 1999 and 2003. Like the total occupational employment, all three categories have grown over the past five years, but the rates of growth support a similar trend as the shift in composition (shown in Figure 13). The high and medium level of preparation categories have grown at faster rates than the low level of preparation category and are becoming more important aspects of the Region’s workforce. While employment in the low level of preparation category has increased nearly 11 percent over the past five years, the high and medium levels have grown at about 20 and 16 percent, respectively. Appendix C contains data for total employment in the three level of preparation categories for each year between 1999 and 2003. FIGURE 14 SACRAMENTO REGION LEVEL OF PREPARATION EMPLOYMENT GROWTH BETWEEN 1999 AND 2003
20.1%
16.4%
10.8%
0%
5%
10%
15%
20%
25%
High Medium Low
Sacramento Regional Research Institute, June 2005 Data Sources: Bureau of Labor Statistics, Occupational Employment Statistics and O*Net

TRAINING AND SKILLS ANALYSIS
SSaaccrraammeennttoo RReeggiioonnaall RReesseeaarrcchh IInnssttiittuuttee 25
Figure 15 displays projections of occupational employment by level of preparation category in the Sacramento Region for 2012 along with 2003 to 2012 growth rates and projected composition. Similar to the projections shown in the Occupational Analysis section of this project, this information is based on conservative projected statewide trends that SRRI believes are also indicative of the Sacramento Region’s trends. It is important to note that this information assumes that job zones associated with specific occupations and across major occupational categories will remain constant since O*Net and other sources do not present information addressing potential shifts in job zones or level of preparation categories. FIGURE 15 SACRAMENTO REGION PROJECTED LEVEL OF PREPARATION EMPLOYMENT AND COMPOSITION
Projected Shift inEmployment Growth Composition Composition
Level of Preparation 2012 2003-2012 2012 2003-2012
High 326,283 34.6% 32.0% 1.2%Medium 137,205 36.3% 13.5% 1.0%Low 555,055 20.4% 54.5% -2.2%
Sacramento Regional Research Institute, June 2005 Data Sources: Bureau of Labor Statistics, Occupational Employment Statistics; Employment Development Department, Employment Projections by Occupation; and O*Net Note: Projected employment based on statewide projected growth rates. Changes in the Sacramento Region’s workforce composition are projected to follow a similar pattern as the more recent trends with the high and medium level of preparation categories gaining larger proportions of the workforce and the low level of preparation category experiencing slight decreases in concentration. It is important to note that projected shifts in composition are relatively small, but their patterns point to notable workforce trends. While over the past five years the high level of preparation category has seen the largest employment growth rates and gains in composition, projections out to 2012 show the medium level of preparation category taking over this role. The medium level of preparation category is projected to experience the largest employment growth rate between 2003 and 2012 and gain a similar proportion of employment as the high level of preparation category. While jobs requiring a low level of preparation are projected to make up the largest share of the workforce in 2012 (a prime target market for workforce development organizations), the high and medium level of preparation categories are projected to become increasingly more important to the Region’s economy.

TRAINING AND SKILLS ANALYSIS
SSaaccrraammeennttoo RReeggiioonnaall RReesseeaarrcchh IInnssttiittuuttee 26
Skills Analysis There are two important aspects to consider when examining job competencies—knowledge (organized sets of principles and facts applied in general domains) and skill (developed capacities that facilitate learning or the more rapid acquisition of knowledge). Like job zones, O*Net tracks knowledge and skill data for specific occupations. SRRI used this data to create average measures of knowledge and skills importance weighted by regional employment for the major occupational categories. Appendix E provides definitions for all of O*Net’s knowledge and skill categories. Figure 16 shows, on average, what level of importance the Sacramento Region’s workforce gives specific knowledge categories for successful job performance. Categories showing the highest importance levels can be viewed as unique traits of the Sacramento Region’s workforce as well as the most important sets of knowledge for the average worker to maintain, regardless of training level or occupation. FIGURE 16 OVERALL KNOWLEDGE CATEGORY IMPORTANCE IN 2003
MathematicsEnglish Language
ClericalCustomer and Personal Service
Administration and ManagementComputers and ElectronicsEconomics and AccountingCommunications and Media
Education and TrainingMechanical
Law and GovernmentTelecommunications
PsychologyPublic Safety and Security
Sales and MarketingEngineering and Technology
Personnel and Human ResourcesTransportation
Production and ProcessingGeography
PhysicsChemistry
DesignBuilding and Construction
Sociology and AnthropologyTherapy and Counseling
BiologyMedicine and Dentistry
Fine ArtsFood Production
History and ArcheologyForeign Language
Philosophy and Theology
ImportanceLeast Most
Sacramento Regional Research Institute, June 2005 Data Sources: Bureau of Labor Statistics, Occupational Employment Statistics and O*Net Overall, the following five categories ranked as the most important:
1. Mathematics 2. English Language

TRAINING AND SKILLS ANALYSIS
SSaaccrraammeennttoo RReeggiioonnaall RReesseeaarrcchh IInnssttiittuuttee 27
3. Clerical 4. Customer & Personal Service 5. Administration & Management
Over the past five years, these importance levels have changed only slightly, but two are worth noting. The Customer & Personal Service category experienced the largest negative change in importance between 1999 and 2003, while Computers & Electronics saw the greatest positive increase (reflecting the increasing prevalence of technology in the workplace). Knowledge information for the low, medium, and high level of preparation categories is included in Appendix D. Figure 17 demonstrates the average importance ranking the Sacramento Region’s workforce assigns specific skills sets necessary for successful job performance. Without consideration of training level or job function, skill categories that rank the highest can be seen as widely applicable competencies for workers in the Region in addition to unique conditions driven by the Region’s economy. FIGURE 17 OVERALL SKILL CATEGORY IMPORTANCE IN 2003
SpeakingReading Comprehension
Active ListeningWriting
MathematicsJudgment and Decision Making
MonitoringCritical Thinking
CoordinationComplex Problem Solving
Social PerceptivenessActive Learning
Service OrientationEquipment Selection
Time ManagementOperation and Control
Systems EvaluationQuality Control Analysis
Learning StrategiesSystems Analysis
InstructingOperations Analysis
Management of Material ResourcesPersuasion
Operation MonitoringManagement of Personnel Resources
ScienceNegotiation
Management of Financial ResourcesTroubleshooting
Equipment MaintenanceTechnology Design
InstallationRepairing
Programming
ImportanceLeast Most
Sacramento Regional Research Institute, June 2005 Data Sources: Bureau of Labor Statistics, Occupational Employment Statistics and O*Net In general, five skill sets below placed as the most important:
1. Speaking

TRAINING AND SKILLS ANALYSIS
SSaaccrraammeennttoo RReeggiioonnaall RReesseeaarrcchh IInnssttiittuuttee 28
2. Reading Comprehension 3. Active Listening 4. Writing 5. Mathematics
Like the knowledge categories, only minimal shifts in skill importance occurred between 1999 and 2003, but a few are notable. The Programming and Installation skill sets experienced the greatest gains in their level of importance while the Service Orientation category saw the largest decrease. Appendix D presents skill information broken down by the low, medium, and high level of preparation categories. Major Employer Viewpoints Due to the fact that all participants in SRRI’s interviews were from large companies with a major presence in the area, nearly all reported that they employ people with various levels of training required. The minimum level of training specified ranged from a high school diploma up to graduate level or professional training. The majority of respondents believe that over 50 percent of the jobs in the Sacramento Region require low levels of education and training, over 30 percent require high levels, and only about 13 percent require medium levels, supporting SRRI’s research. Major employers also tended to classify occupational categories (and some specific occupations) as generally low, medium, or high in a similar manner to what the O*Net level of preparation and occupational employment level data show. A little less than a quarter of the interviewed employers were not capable of assessing skill levels. Two interesting patterns emerged from the responses to training levels. Quite a few employers tended to over-classify the level of preparation associated with specific jobs in their companies, pushing generally accepted low-skilled jobs up to mid-level and occupations requiring a medium level of preparation to high-skilled. In addition, some respondents biased their training and education requirement assessment toward their company’s own employment structure (for example, companies with larger numbers of high skilled workers tended to see the region as having a larger composition of those workers in general). Most respondents expect little or no change in the breakdown of training and skill requirements over the next 5 to 10 years. While employers did not foresee a major change in the workforce’s level of preparation composition, SRRI’s analysis of occupational employment projections shows a small shift over the next decade with low level of preparation occupations making up slightly less of the total workforce and both medium and high level of preparation occupations containing slightly more. This divergence between interviews and data is most likely explained by the small projected shift in composition as well as the interviewees’ over-classification of jobs and bias toward specific company structures. However, some major employers felt that the overall level of training and skills required will increase for jobs at the lower skill levels. For instance, one respondent noted that the level of training and skill necessary for Office & Administrative Support occupations should increase in the future. Those employers
TRAINING AND SKILLS ANALYSIS
SSaaccrraammeennttoo RReeggiioonnaall RReesseeaarrcchh IInnssttiittuuttee 29
who did anticipate these increases mostly referred to increasing computer prevalence and the necessity for employees at all skill levels to have computer skills. Overall, major employers indicated a strong need for mathematics, English language, speaking, reading comprehension, and listening skills for job success across all job types in their firms—all of these aspects were at the top of the list of the Region’s most important knowledge and skill sets for successful job performance across the entire workforce. While many important job knowledge and skill sets vary by occupation and type of employer, there were some underlying themes to most of the responses. In addition to the specialized skills more unique to each company, more often than not, communication skills, particularly writing skills were stressed as most important. Computer skills were also indicated as being imperative in almost all positions. Respondents also stressed the importance of “soft skills” such as work ethic and interpersonal skills. In some cases, employers indicated that, at times at the medium and lower levels, these “soft skills” can make up for a lack of formal training or education. It is interesting to note that the emphasis on “soft skills” was also highlighted in the interviews conducted with major employers in SRRI’s Analysis of Workforce Skills Sets study, demonstrating the importance of these skills to the Region’s employers. While the majority of firms do not foresee an extreme shift in important knowledge and skill sets in the next 5 to 10 years, many respondents emphasized that the most significant changes in the workplace will be in response to the increased use of computers. Respondents foresee jobs that previously did not require computer skills in the past requiring more computer proficiency in the future. Many interviewees noted that writing and grammar skills are often lacking, especially at the medium and low skill levels. Furthermore, the prevalence of computer-based communication also factors into an increased need for writing ability as e-mail becomes a more common method of workplace communication. However, respondents also observed that an increased reliance upon computers for basic grammar, writing, and mathematical skills, thus has contributed to a deficiency in these areas for low-level employees and applicants. In SRRI’s interview process, major employers were also given the opportunity to provide suggestions for future improvements and additional training programs they would like to see in Sacramento. Many participants indicated that they think the training and educational programs in the Region are of high quality, but the scope of all operations needs to be expanded. Those respondents from the healthcare field seemed most concerned about this issue, pointing out long waits to enter nursing and other health care training programs. Several respondents also brought up the need for basic business training across all disciplines to help develop the “soft skills.” Additionally, employers articulate a need for increased proficiency in computer use, writing, reading comprehension, language and grammar skills to fortify the region’s low-skilled labor force.

TRAINING AND SKILLS ANALYSIS
SSaaccrraammeennttoo RReeggiioonnaall RReesseeaarrcchh IInnssttiittuuttee 30
Knowledge and Skills Sets in Key Industries A large portion of the occupations housed within the staffing patterns of the 15 key industries presented in the Analysis of Workforce Skills Sets report are low-skilled with a small segment falling into the moderate-skilled classification. Combined, low- and moderate-skilled occupations make up about 76 percent of the occupations in the 15 industries. This is somewhat higher than these two categories’ combined proportion of the total workforce in 2003 (69 percent), but reflects the Region’s high concentration in occupations requiring a low level of preparation. Much of this divergence is most likely due to the fact that the Regional Workforce Study examines the whole economy while only a portion is addressed in the previous study, but it is important to note that the two are fairly close. In addition to stressing the need for low-skilled employees, major employers that were interviewed in the previous study expected to see continued aggressive employment growth in low-skilled occupations as well as strong growth in moderate-skilled jobs—trends over the past few years and projections for Sacramento’s overall workforce show similar patterns. Most of the key low-skilled occupations (shown in Figure 9 of the previous section) are contained in major occupational categories that are generally associated with a low level of preparation. One of the major categories highlighted in the key low-skilled occupations, Protective Service, is generally seen as a category requiring a medium level of preparation; however, the specific occupation is on the low-skilled end of the spectrum of all occupations within that category. Besides the occupation within the Installation, Maintenance, & Repair category, all occupations in the list of key moderate-skilled occupations in the Analysis of Workforce Skill Sets report (displayed in Figure 9 of the previous section) are grouped in occupational categories that require either high (Healthcare Practitioners and Life, Physical, & Social Science) or low (Office & Administrative Support) levels of preparation. This also suggests that the specific occupations have some of the lowest (in the case of high level of preparation) or highest (in the case of low level of preparation) training requirements among all occupations in their respective categories. These differences highlight difficulties filling specific occupations as well as the potential increased need for certain jobs that require different training levels than their occupational counterparts. The Analysis of Workforce Skills Sets study showed similar sets of knowledge and skills as being the most important to successful job performance for occupations within the 15 key industries as those sets that are important to the Region’s workforce overall.

TRAINING AND SKILLS ANALYSIS
SSaaccrraammeennttoo RReeggiioonnaall RReesseeaarrcchh IInnssttiittuuttee 31
As Figure 18 demonstrates, in both cases, Mathematics, English Language, and Clerical topped the list of important knowledge categories while Reading Comprehension, Active Listening, and Speaking all ranked as the most important skill sets. Computers & Electronics showed up in the top five knowledge categories for the 15 key industries, but ranked lower for the Region’s workforce across all industries and training levels. The opposite is also evident for Administration & Management; however, these ranking variations are only minimal. Employer interviews in both cases stressed a need for the development of computer and office skills; placed an emphasis on communications skills; and confirmed the importance of the top-ranked knowledge and skill sets. Other important skills sets were similar across the two studies. There is a strong connection between the knowledge and skill sets important to the low- and moderate-skilled occupations within the 15 industries presenting the greatest economic development potential and the Sacramento Region’s workforce overall. Both sets of employer interviews also seem to confirm this connection. In general, there appears to be alignment between economic and workforce development in terms of fostering the development of core knowledge and skill sets—the competencies necessary for job success in the 15 key industries are also those most important for all jobs in the economy as a whole. FIGURE 18 KNOWLEDGE AND SKILL SETS
Rank Analysis of Workforce Skills Sets Regional Workforce Study
1 Mathematics Mathematics2 English Language English Language3 Clerical Clerical4 Computers and Electronics Customer and Personal Service5 Customer and Personal Service Administration and Management
1 Reading Comprehension Speaking2 Active Listening Reading Comprehension3 Speaking Active Listening4 Writing Writing5 Mathematics Mathematics
Skill Sets
Knowledge Categories
Sacramento Regional Research Institute, August 2005 Data Sources: Bureau of Labor Statistics, Occupational Employment Statistics and O*Net Conclusion The Sacramento Region’s workforce is comprised of workers primarily employed in job functions that require low levels of preparation with minimum requirements of high school education and some on-the-job training—a prime target market for workforce development organizations. Occupations demanding only a low level of preparation are supplemented by a noteworthy amount of high-skilled jobs and a smaller amount of workers in jobs requiring a medium level of preparation. Although the low level of preparation category is projected to continue to make up the largest portion of the workforce, the medium- and high-skilled jobs are expected to become more important to the Region’s economy and carry on gaining concentration in the future.

TRAINING AND SKILLS ANALYSIS
SSaaccrraammeennttoo RReeggiioonnaall RReesseeaarrcchh IInnssttiittuuttee 32
To successfully perform their jobs, the Region’s workforce also relies on basic knowledge and skill sets that cut across occupations and industries. The most important knowledge categories include mathematics, English language, and clerical abilities, while speaking, reading, and writing rank high on the skill categories list. Major employers view the Region’s workforce as predominantly low-skilled with jobs requiring a high level of preparation making up the next largest share of the workforce and mid-level occupations containing the smallest proportion and also feel that the workforce training composition will not experience major shifts over the next decade. The viewpoints on shifts in occupational and training composition suggest that, as the data show, future changes will only have a minimal effect on the overall workforce structure. Major employers also emphasized the importance of knowledge and skill sets that rank as the most important for successful job performance across all of the Region’s occupational categories. Interviewees highlighted the need to build stronger communication and computer capabilities as well as “soft skills.” Besides the need to address these areas, major employers do not foresee a large change in the key knowledge and skill sets over the next few years. The Region’s current workforce and the occupations within the 15 industries with economic development potential (highlighted in the Analysis of Workforce Skills Sets study) both demonstrate a concentration in the low-skilled occupations and show that this segment will continue to see strong employment growth. Occupational categories requiring medium and high levels of preparation are not as central as the low-skilled component, but will also play an important role in the Region’s economy. In terms of knowledge and skills, both studies support the viewpoint of a set of core competencies for job success across a number of occupations employed within a wide range of industries. The core competencies include Mathematics, English Language, Clerical, Reading Comprehension, and Active Listening, as well as an increased emphasis on computer, communications, and “soft skills.”

COMPARATIVE ANALYSIS
SSaaccrraammeennttoo RReeggiioonnaall RReesseeaarrcchh IInnssttiittuuttee 33
Comparative Analysis This section of the report focuses on comparing the Sacramento Region to the eight selected regions as well as the state and the nation. Comparisons are provided across analyses of employment growth, workforce composition, and shift in workforce composition for the major occupational and level of preparation categories. The section also presents some major employer opinions on the strengths and weaknesses of the Sacramento Region. Comparative Occupational Analysis Figure 19 shows the employment growth rates for the major occupational categories in the Sacramento Region and the selected regions between 1999 and 2003. FIGURE 19 OCCUPATIONAL EMPLOYMENT GROWTH BETWEEN 1999 AND 2003
Occupation Title Sacr
amen
to
Bay
Area
Fres
no
Inla
nd E
mpi
re
San
Dieg
o
Calif
orni
a
Denv
er
Las
Vega
s
Phoe
nix
Portl
and
Unite
d St
ates
Management -2.2% -9.7% -16.2% -8.9% -4.3% -11.8% -27.2% -16.8% -1.6% -25.2% -17.5%Business and financial operations 24.3% 7.6% 45.4% 47.6% 39.5% 20.1% 10.8% 35.6% 29.1% 25.2% 12.9%Computer and mathematical 50.6% -10.8% 32.1% 102.6% 10.4% 8.6% 6.7% 11.7% 5.8% 17.0% 7.9%Architecture and engineering 34.7% -13.5% 12.3% 20.2% 1.0% -1.0% 7.0% 56.5% -4.7% 33.7% -5.2%Life, physical, and social science 42.9% 19.3% 44.6% 68.2% 126.1% 33.5% -15.5% -15.9% 52.1% 72.0% 22.4%Community and social services 77.4% 4.8% 41.2% 35.1% 26.0% 22.1% 2.3% 55.8% -7.2% 44.2% 15.0%Legal 79.2% -5.6% -45.4% 28.3% 15.6% 0.2% 17.4% 31.7% 33.8% -0.3% 10.9%Education, training, and library 10.8% 5.2% 2.6% 11.2% -1.3% 10.0% 3.9% -52.0% 17.1% -16.5% 6.6%Arts, design, entertainment, sports, and media 21.5% 14.6% 21.9% 11.9% -8.4% -27.3% 68.5% 20.6% -7.4% 17.6% -0.9%Healthcare practitioners and technical 8.4% -3.7% 1.2% -16.2% -13.7% -7.8% -0.9% 20.8% 3.0% 26.1% 2.9%Healthcare support 5.6% 9.1% 6.3% 5.7% 5.9% 18.5% 35.3% 30.2% 9.0% -1.7% 8.0%Protective service -20.5% -9.3% 24.5% -5.3% -3.2% -0.1% -9.6% 16.8% -14.8% 42.7% 1.4%Food preparation and serving related -8.3% -19.8% -22.6% 36.4% 20.5% 7.8% 16.4% 7.3% 18.9% -5.5% 5.5%Building and grounds cleaning and maintenance 25.5% -4.6% 13.6% 5.9% 10.5% 0.4% -12.4% 12.3% -3.4% -5.6% -0.3%Personal care and service -12.2% 19.0% 8.5% 32.7% 5.6% 22.5% 15.9% -2.9% 7.1% 3.0% 16.9%Sales and related 15.0% -3.7% -9.5% 19.8% 10.3% 5.0% 3.0% 21.5% 10.3% 0.0% 4.6%Office and administrative support 19.6% -10.6% 15.3% 24.8% 13.9% 4.1% -7.7% 2.8% -1.4% -3.9% 0.5%Farming, fishing, and forestry 49.5% 0.9% -86.3% 38.6% -19.8% -12.8% 210.3% -65.0% 28.8% 18.6% -0.4%Construction and extraction 28.5% -0.5% 11.4% 21.6% 6.7% 9.3% -8.8% 8.7% 2.4% -3.2% 2.5%Installation, maintenance, and repair 34.6% -1.8% 14.6% 19.7% 7.3% 6.4% -3.6% 15.7% 6.0% -18.2% 1.7%Production -11.2% -24.2% 23.1% -3.2% -7.5% -17.1% -22.1% -17.3% -22.5% -17.9% -16.9%Transportation and material moving 25.1% -17.2% 15.6% 11.8% 4.0% 5.4% -7.6% 25.9% 0.8% -21.5% -1.3%
Sacramento Regional Research Institute, July 2005 Data Source: Bureau of Labor Statistics, Occupational Employment Statistics Nearly all occupational categories in the Sacramento Region experienced healthier employment growth rates than California and the United States. Only the Healthcare Support; Protective Service; Food Preparation & Serving Related; and Personal Care & Service categories saw growth rates below the statewide and national averages. Two out of the Region’s top three growth categories posted the highest growth rates over the past five years among all of the comparative and competitive regions—the Community & Social Services and Legal categories were the highest while the Computer & Mathematical category posted the second highest rate among the selected regions. Three

COMPARATIVE ANALYSIS
SSaaccrraammeennttoo RReeggiioonnaall RReesseeaarrcchh IInnssttiittuuttee 34
other occupational categories in Sacramento experienced the strongest growth among the other regions including Construction & Extraction; Installation, Maintenance, and Repair; and Transportation & Material Moving. The Region saw negative growth in five occupational categories. In two of the categories, Management and Production, nearly all regions experienced negative growth (showing a widespread trend) and the Sacramento Region’s negative growth rates were relatively small. The Region posted relatively large losses in two occupational categories, Protective Service and Personal Care & Service, and saw moderate losses in Food Preparation & Serving Related category. It is also interesting to note that all regions gained jobs over the past five years in only one category, Business & Financial Operations, and the Sacramento Region posted a relatively strong growth rate in this category. Figure 20 displays the occupational composition in 2003 for the Sacramento Region along with the comparative and competitive regions based on the percentage of total occupational employment encompassed in each major category. FIGURE 20 OCCUPATIONAL COMPOSITION IN 2003
Occupation Title Sacr
amen
to
Bay
Area
Fres
no
Inla
nd E
mpi
re
San
Dieg
o
Calif
orni
a
Denv
er
Las
Vega
s
Phoe
nix
Portl
and
Unite
d St
ates
Management 5.0% 6.9% 3.8% 3.9% 5.4% 5.4% 5.5% 3.9% 5.6% 5.1% 5.2%Business and financial operations 6.2% 5.4% 3.8% 2.9% 4.6% 4.4% 5.3% 2.7% 4.4% 4.4% 3.9%Computer and mathematical 3.0% 5.0% 0.8% 0.9% 2.7% 2.7% 4.0% 0.9% 2.1% 2.8% 2.2%Architecture and engineering 2.1% 3.5% 1.0% 1.1% 2.6% 2.2% 2.5% 1.2% 2.6% 2.9% 1.9%Life, physical, and social science 1.1% 1.3% 0.8% 0.7% 1.4% 1.0% 1.0% 0.5% 0.6% 1.1% 0.9%Community and social services 1.7% 1.0% 1.7% 1.4% 1.2% 1.2% 1.0% 0.6% 0.9% 1.7% 1.3%Legal 0.9% 1.0% 0.3% 0.3% 0.6% 0.8% 0.8% 0.6% 0.7% 0.7% 0.7%Education, training, and library 5.6% 5.6% 7.5% 7.1% 6.2% 6.2% 4.9% 0.8% 5.2% 5.9% 6.1%Arts, design, entertainment, sports, and media 1.1% 1.6% 0.9% 0.7% 1.2% 1.5% 1.6% 1.2% 0.9% 1.3% 1.2%Healthcare practitioners and technical 4.2% 3.9% 4.5% 4.3% 3.8% 3.9% 4.0% 3.6% 3.9% 4.4% 4.8%Healthcare support 2.0% 1.8% 2.2% 2.3% 2.2% 2.1% 1.8% 1.5% 2.2% 2.2% 2.5%Protective service 2.4% 2.1% 2.8% 2.6% 2.5% 2.5% 2.0% 3.0% 2.4% 1.8% 2.4%Food preparation and serving related 7.6% 7.2% 7.2% 8.6% 8.8% 7.8% 8.1% 13.2% 8.4% 7.9% 8.0%Building and grounds cleaning and maintenance 3.1% 3.3% 3.1% 3.7% 3.7% 3.2% 3.1% 5.9% 3.5% 2.8% 3.3%Personal care and service 1.7% 2.2% 1.9% 2.2% 2.4% 2.1% 2.3% 6.6% 2.3% 2.0% 2.3%Sales and related 10.1% 10.2% 9.2% 10.5% 10.8% 10.3% 11.9% 11.9% 11.7% 10.8% 10.6%Office and administrative support 20.7% 17.6% 16.9% 16.8% 18.9% 18.6% 19.1% 16.2% 18.4% 18.0% 17.8%Farming, fishing, and forestry 0.7% 0.1% 1.5% 0.8% 0.2% 1.2% 0.2% 0.0% 0.2% 0.3% 0.4%Construction and extraction 6.5% 4.5% 5.0% 7.9% 5.3% 4.9% 5.6% 8.1% 7.1% 4.6% 4.8%Installation, maintenance, and repair 3.6% 3.5% 3.6% 4.2% 3.6% 3.5% 4.3% 4.0% 4.2% 3.8% 4.1%Production 4.3% 6.3% 6.7% 8.2% 6.6% 7.4% 4.5% 3.1% 5.7% 8.4% 8.2%Transportation and material moving 6.5% 5.9% 8.0% 8.9% 5.5% 7.0% 6.5% 7.8% 6.8% 7.2% 7.4%
Sacramento Regional Research Institute, July 2005 Data Source: Bureau of Labor Statistics, Occupational Employment Statistics The Sacramento Region demonstrates the highest concentration among all the regions in three occupational categories including Office & Administrative Support; Business & Financial Operations; and Community & Social Services. Only one of these three categories, Office & Administrative Support, is among the Region’s three largest categories (Sales & Related and Food Preparation & Serving Related show only moderate levels of concentration compared to the other regions). It is important to note that the Office & Administrative Support is the largest category in nearly all of the comparative

COMPARATIVE ANALYSIS
SSaaccrraammeennttoo RReeggiioonnaall RReesseeaarrcchh IInnssttiittuuttee 35
and competitive regions. The Sacramento Region has the lowest proportion of occupational employment in the Personal Care & Service category among the selected regions. Figure 21 shows the shift in occupational composition over the past five years for the Sacramento Region and the selected regions. FIGURE 21 SHIFT IN OCCUPATIONAL COMPOSITION BETWEEN 1999 AND 2003
Occupation Title Sacr
amen
to
Bay
Area
Fres
no
Inla
nd E
mpi
re
San
Dieg
o
Calif
orni
a
Denv
er
Las
Vega
s
Phoe
nix
Portl
and
Unite
d St
ates
Management -0.9% -0.1% -0.8% -1.0% -0.7% -0.9% -1.8% -1.3% -0.3% -1.4% -1.1%Business and financial operations 0.5% 0.8% 1.1% 0.6% 1.0% 0.7% 0.6% 0.5% 0.9% 1.0% 0.4%Computer and mathematical 0.7% -0.2% 0.2% 0.4% 0.1% 0.2% 0.3% 0.0% 0.1% 0.5% 0.2%Architecture and engineering 0.3% -0.2% 0.1% 0.0% -0.2% -0.1% 0.2% 0.3% -0.2% 0.8% -0.1%Life, physical, and social science 0.2% 0.3% 0.2% 0.2% 0.7% 0.2% -0.2% -0.2% 0.2% 0.5% 0.2%Community and social services 0.6% 0.1% 0.5% 0.2% 0.2% 0.2% 0.0% 0.2% -0.1% 0.6% 0.2%Legal 0.3% 0.0% -0.3% 0.0% 0.0% 0.0% 0.1% 0.1% 0.2% 0.0% 0.1%Education, training, and library -0.2% 0.7% 0.0% -0.2% -0.6% 0.4% 0.3% -1.0% 0.6% -0.9% 0.4%Arts, design, entertainment, sports, and media 0.1% 0.3% 0.1% 0.0% -0.2% -0.6% 0.7% 0.1% -0.1% 0.2% 0.0%Healthcare practitioners and technical -0.2% 0.2% -0.1% -1.6% -1.0% -0.4% 0.1% 0.3% 0.0% 1.0% 0.1%Healthcare support -0.2% 0.3% 0.1% -0.2% 0.0% 0.3% 0.5% 0.2% 0.1% 0.1% 0.2%Protective service -1.0% 0.0% 0.5% -0.5% -0.3% -0.1% -0.2% 0.1% -0.5% 0.6% 0.0%Food preparation and serving related -1.9% -1.1% -2.3% 1.4% 0.9% 0.4% 1.3% -0.5% 1.1% -0.1% 0.4%Building and grounds cleaning and maintenance 0.3% 0.1% 0.3% -0.3% 0.1% -0.1% -0.3% 0.0% -0.2% 0.0% 0.0%Personal care and service -0.5% 0.5% 0.1% 0.3% 0.0% 0.3% 0.4% -1.0% 0.1% 0.1% 0.3%Sales and related 0.1% 0.4% -1.2% 0.4% 0.3% 0.3% 0.7% 1.0% 0.8% 0.4% 0.4%Office and administrative support 0.9% -0.6% 1.9% 1.3% 1.0% 0.3% -1.0% -1.4% -0.8% 0.0% 0.0%Farming, fishing, and forestry 0.2% 0.0% -10.0% 0.1% -0.1% -0.2% 0.1% 0.0% 0.0% 0.1% 0.0%Construction and extraction 0.7% 0.3% 0.4% 0.4% -0.1% 0.3% -0.4% -0.2% 0.0% 0.0% 0.1%Installation, maintenance, and repair 0.5% 0.2% 0.4% 0.2% 0.0% 0.1% 0.0% 0.1% 0.1% -0.7% 0.1%Production -1.2% -1.4% 1.1% -1.5% -1.1% -1.7% -1.1% -1.1% -1.9% -1.4% -1.7%Transportation and material moving 0.6% -0.7% 0.9% -0.2% -0.2% 0.2% -0.3% 0.9% -0.1% -1.6% -0.1%
Sacramento Regional Research Institute, July 2005 Data Source: Bureau of Labor Statistics, Occupational Employment Statistics The Sacramento Region has demonstrated quite a few unique workforce restructuring trends in the past few years compared to California and the United States. The Region experienced a greater positive shift in concentration in 10 occupational categories including:
1. Computer & Mathematical 2. Architecture & Engineering 3. Community & Social Services 4. Legal 5. Arts, Entertainment, Sports, & Media 6. Building & Grounds Cleaning & Maintenance 7. Office & Administrative Support 8. Farming, Fishing, & Forestry 9. Construction & Extraction 10. Transportation & Material Moving

COMPARATIVE ANALYSIS
SSaaccrraammeennttoo RReeggiioonnaall RReesseeaarrcchh IInnssttiittuuttee 36
Three of these categories, Computer & Mathematical; Office & Administrative Support; and Construction & Extraction were the Region’s top three categories with the largest shift in composition. The Arts, Entertainment, Sports, & Media; Building & Grounds Cleaning & Maintenance; and Farming, Fishing, & Forestry categories gained concentration while they all lost concentration in California (but gained at the national level). In the United States, the Transportation & Material Moving category lost concentration while it gained in the Sacramento Region and California. While the nation and the state lost concentration in Architecture and Engineering, Sacramento became more concentrated. Conversely, California and the United States became more concentrated in the Education, Library, & Training; Healthcare Support; Food Preparation & Serving Related; and Personal Care & Service occupational categories while the Sacramento Region displayed a lesser proportion of total employment in 2003 compared to 1999. In addition, the Protective Service category posted a negative shift in composition in Sacramento and California but showed no shift in concentration at the national level. Seven occupational categories showed the largest shift in composition in the Sacramento Region compared to the comparative and competitive regions including:
1. Computer & Mathematical 2. Community & Social Services 3. Legal 4. Building & Grounds Cleaning & Maintenance 5. Farming, Fishing, & Forestry 6. Construction & Extraction 7. Installation, Maintenance, & Repair
Widespread workforces restructuring is evident in eight occupational categories. The following six categories gained in concentration in almost all the selected regions:
1. Business & Financial Operations 2. Computer & Mathematical 3. Community & Social Services 4. Legal 5. Sales & Related 6. Installation, Maintenance, & Repair
Two other categories lost proportion of total occupational employment in nearly all of the comparative and competitive regions, Management and Production. For visual comparison purposes, SRRI selected occupational categories that encompass at least 5 percent of the Sacramento Region’s occupational employment—the Region’s top eight categories include:
1. Office & Administrative Support 2. Sales & Related

COMPARATIVE ANALYSIS
SSaaccrraammeennttoo RReeggiioonnaall RReesseeaarrcchh IInnssttiittuuttee 37
3. Food Preparations & Serving Related 4. Transportation & Material Moving 5. Construction & Extraction 6. Business & Financial Operations 7. Education, Training, & Library 8. Management Occupations
The following eight Figures (22 through 29) display each of the Region’s eight largest categories and compare Sacramento’s trends with the comparative and competitive regions. The Figures use the Sacramento Region’s occupational employment growth between 1999 and 2003 and the 2003 composition as reference points (the zero point) and the bars illustrate each of the selected regions’ divergence from the Sacramento values. These graphs visually show how the Sacramento Region differs from each of the selected regions—negative bars show that the Region was stronger in that measure while positive bars demonstrate that the Region was relatively weaker in that measure. The values depicted in the Figures are numerical percentage point difference, not a proportional relationship. For example, between 1999 and 2003 employment in the Office & Administrative Support occupational category grew by 19.6 percent in the Sacramento Region, compared to 4.1 percent statewide. The comparative result displayed in the Figure is calculated by subtracting the statewide value from the Sacramento Region value for a negative 15.5 numerical percentage point difference, demonstrating that the Region grew at a rate nearly 16 percentage points higher than California overall. In this case, the Office & Administrative Support category encompasses a little less than 5 percentage points more of the total occupational employment than the statewide average. Overall, the Figures are a useful conceptualization of the relative size and performance of Sacramento’s largest occupational categories.

COMPARATIVE ANALYSIS
SSaaccrraammeennttoo RReeggiioonnaall RReesseeaarrcchh IInnssttiittuuttee 38
As shown in Figure 22, employment in the Sacramento Region’s Office & Administrative Support category grew faster over the past five years than all regions except the Inland Empire. The most significant difference in growth was reflected in the Bay Area while Las Vegas showed the greatest divergence in composition shift. The Region’s concentration in this category was larger than all selected areas. FIGURE 22 OFFICE AND ADMINISTRATIVE SUPPORT OCCUPATIONS COMPARED TO SACRAMENTO REGION
-35% -30% -25% -20% -15% -10% -5% 0% 5% 10%
Bay Area
Fresno
Inland Empire
San Diego
California
Denver
Las Vegas
Phoenix
Portland
United States
1999-2003 Employment Growth Rate Divergence 2003 Composition Divergence
Sacr
amen
to
Reg
ion
= 0
Sacramento Regional Research Institute, July 2005 Data Source: Bureau of Labor Statistics, Occupational Employment Statistics Note: Bars reflect percentage point divergence from Sacramento Region value

COMPARATIVE ANALYSIS
SSaaccrraammeennttoo RReeggiioonnaall RReesseeaarrcchh IInnssttiittuuttee 39
With the exception of Las Vegas and the Inland Empire, Sacramento posted a notably higher employment growth in Sales and Related category with Fresno showing the greatest difference (as shown in Figure 23). The Region showed a higher proportion of Sales and Related occupations than all selected areas with the Inland Empire, Fresno, and Las Vegas posting the largest divergence from Sacramento. FIGURE 23 SALES AND RELATED OCCUPATIONS COMPARED TO SACRAMENTO REGION
-30% -25% -20% -15% -10% -5% 0% 5% 10%
Bay Area
Fresno
Inland Empire
San Diego
California
Denver
Las Vegas
Phoenix
Portland
United States
1999-2003 Employment Growth Rate Divergence 2003 Composition Divergence
Sacr
amen
to
Reg
ion
= 0
Sacramento Regional Research Institute, July 2005 Data Source: Bureau of Labor Statistics, Occupational Employment Statistics Note: Bars reflect percentage point divergence from Sacramento Region value

COMPARATIVE ANALYSIS
SSaaccrraammeennttoo RReeggiioonnaall RReesseeaarrcchh IInnssttiittuuttee 40
As Figure 24 demonstrates, the Sacramento Region showed relatively poor performance in the Food Preparation & Serving Related occupational category in terms of employment growth between 1999 and 2003 and composition in 2003. Only Fresno and the Bay Area experienced less employment growth and a concentration than the Sacramento Region during this time period. In terms of employment growth, the Inland Empire showed the greatest difference in comparison to Sacramento while Las Vegas demonstrated the largest divergence in composition. FIGURE 24 FOOD PREPARATION AND SERVING RELATED OCCUPATIONS COMPARED TO SACRAMENTO REGION
-20% -10% 0% 10% 20% 30% 40% 50%
Bay Area
Fresno
Inland Empire
San Diego
California
Denver
Las Vegas
Phoenix
Portland
United States
1999-2003 Employment Growth Rate Divergence 2003 Composition Divergence
Sacr
amen
to
Reg
ion
= 0
Sacramento Regional Research Institute, July 2005 Data Source: Bureau of Labor Statistics, Occupational Employment Statistics Note: Bars reflect percentage point divergence from Sacramento Region value

COMPARATIVE ANALYSIS
SSaaccrraammeennttoo RReeggiioonnaall RReesseeaarrcchh IInnssttiittuuttee 41
Most of the comparative and competitive regions experienced smaller employment growth rates in the Transportation and Material Moving occupational category than Sacramento, as shown in Figure 25 (Las Vegas was the only exception). Portland demonstrated the most significant difference in its employment growth rate. Conversely, besides San Diego and the Bay Area, all of the selected regions have a greater proportion of total employment in this occupational category with the Inland Empire displaying the greatest difference. FIGURE 25 TRANSPORTATION AND MATERIAL MOVING OCCUPATIONS COMPARED TO SACRAMENTO
-50% -40% -30% -20% -10% 0% 10%
Bay Area
Fresno
Inland Empire
San Diego
California
Denver
Las Vegas
Phoenix
Portland
United States
1999-2003 Employment Growth Rate Divergence 2003 Composition Divergence
Sacr
amen
to
Reg
ion
= 0
Sacramento Regional Research Institute, July 2005 Data Source: Bureau of Labor Statistics, Occupational Employment Statistics Note: Bars reflect percentage point divergence from Sacramento Region value

COMPARATIVE ANALYSIS
SSaaccrraammeennttoo RReeggiioonnaall RReesseeaarrcchh IInnssttiittuuttee 42
As shown in Figure 26, between 1999 and 2003, the Sacramento Region posted considerably higher growth rates than all comparison regions in the Construction and Extraction occupational category, especially compared to Denver. Only Phoenix, Las Vegas, and Inland Empire have seen greater shifts in concentration of this category than the Sacramento Region. FIGURE 26 CONSTRUCTION AND EXTRACTION OCCUPATIONS COMPARED TO SACRAMENTO REGION
-40% -35% -30% -25% -20% -15% -10% -5% 0% 5%
Bay Area
Fresno
Inland Empire
San Diego
California
Denver
Las Vegas
Phoenix
Portland
United States
1999-2003 Employment Growth Rate Divergence 2003 Composition DivergenceSa
cram
ento
R
egio
n =
0
Sacramento Regional Research Institute, July 2005 Data Source: Bureau of Labor Statistics, Occupational Employment Statistics Note: Bars reflect percentage point divergence from Sacramento Region value

COMPARATIVE ANALYSIS
SSaaccrraammeennttoo RReeggiioonnaall RReesseeaarrcchh IInnssttiittuuttee 43
The Business & Financial Operations occupational category shows a much more mixed picture for the selected regions compared to Sacramento in employment growth. As Figure 27 illustrates, two regions (in addition to the United States and California) posted lower employment growth rates while the remaining six regions experienced stronger growth with the Inland Empire demonstrating the greatest difference. On the other hand, in terms of shift in composition, the Sacramento Region showed stronger performance than all the selected regions. FIGURE 27 BUSINESS AND FINANCIAL OPERATIONS OCCUPATIONS COMPARED TO SACRAMENTO REGION
-20% -15% -10% -5% 0% 5% 10% 15% 20% 25% 30%
Bay Area
Fresno
Inland Empire
San Diego
California
Denver
Las Vegas
Phoenix
Portland
United States
2003 Composition Divergence
1999-2003 Employment Growth Rate Divergence
Sacr
amen
to
Reg
ion
= 0
Sacramento Regional Research Institute, July 2005 Data Source: Bureau of Labor Statistics, Occupational Employment Statistics Note: Bars reflect percentage point divergence from Sacramento Region value

COMPARATIVE ANALYSIS
SSaaccrraammeennttoo RReeggiioonnaall RReesseeaarrcchh IInnssttiittuuttee 44
In terms of the Education, Training, & Library occupational category, shown in Figure 28, the Sacramento Region posted a stronger employment growth rate between 1999 and 2003 than all selected regions apart from Phoenix and the Inland Empire. The region with the most significant difference in employment growth compared to the Sacramento Region was Las Vegas. In most cases, the Region showed a similar proportion of total employment in this occupational category as most areas. Only Las Vegas, with a lesser concentration, and Fresno and the Inland Empire, with a greater level of concentration, were notably different from the Sacramento Region. FIGURE 28 EDUCATION, TRAINING, AND LIBRARY OCCUPATIONS COMPARED TO SACRAMENTO REGION
-70% -60% -50% -40% -30% -20% -10% 0% 10%
Bay Area
Fresno
Inland Empire
San Diego
California
Denver
Las Vegas
Phoenix
Portland
United States
1999-2003 Employment Growth Rate Divergence 2003 Composition Divergence
Sacr
amen
to
Reg
ion
= 0
Sacramento Regional Research Institute, July 2005 Data Source: Bureau of Labor Statistics, Occupational Employment Statistics Note: Bars reflect percentage point divergence from Sacramento Region value

COMPARATIVE ANALYSIS
SSaaccrraammeennttoo RReeggiioonnaall RReesseeaarrcchh IInnssttiittuuttee 45
As demonstrated in Figure 29, the Management occupational category grew at a higher rate in Sacramento than all comparative and competitive regions, with the exception of Phoenix which posted a slightly higher growth rate. Composition in this category was similar for most regions, besides the Bay Area, which despite its lower growth rate, maintained a relatively higher concentration. Additionally, it is notable that this is the only one of the selected categories where the Bay Area has a higher composition value than the Sacramento Region. FIGURE 29 MANAGEMENT OCCUPATIONS COMPARED TO SACRAMENTO REGION
-30% -25% -20% -15% -10% -5% 0% 5%
Bay Area
Fresno
Inland Empire
San Diego
California
Denver
Las Vegas
Phoenix
Portland
United States
1999-2003 Employment Growth Rate Divergence 2003 Composition Divergence
Sacr
amen
to
Reg
ion
= 0
Sacramento Regional Research Institute, July 2005 Data Source: Bureau of Labor Statistics, Occupational Employment Statistics Note: Bars reflect percentage point divergence from Sacramento Region value Overall, the Sacramento Region experienced stronger employment growth rates over the past five years than the comparative and competitive regions in the majority of its largest occupational categories, demonstrating the Region’s relatively strong performance in its large categories. Only about half of the Region’s largest categories show a generally higher level of concentration than the selected regions. This suggests that other regions might have relative size advantages in the corresponding categories. The only one of Sacramento’s largest occupational categories that appears relatively weak is Food Preparation & Serving Related where most of the selected regions grew faster and have higher levels of concentration. Office & Administrative Support, the Sacramento Region’s largest occupational category, seems to be the strongest compared to the

COMPARATIVE ANALYSIS
SSaaccrraammeennttoo RReeggiioonnaall RReesseeaarrcchh IInnssttiittuuttee 46
selected regions with generally high levels of employment growth and composition divergence. Comparative Training Analysis In addition to the types of occupations and job functions comparisons, considering the general level of training and experience the comparative and competitive regions’ workforces offer are also important in considering the Sacramento Region’s relative strengths and weaknesses. Similar to Figures 22 through 29, the following three Figures (30 through 33) illustrate the selected regions’ divergence from the Sacramento Region’s employment growth rate between 1999 and 2003 and percent of total employment in 2003. Rather than the Region’s largest occupational categories, the Figures show the high, medium, and low levels of preparation.

COMPARATIVE ANALYSIS
SSaaccrraammeennttoo RReeggiioonnaall RReesseeaarrcchh IInnssttiittuuttee 47
As shown in Figure 30, the Sacramento Region posted stronger growth in jobs requiring a high level of preparation than all selected regions, including those that typically tout their highly-skilled workforce, such as the Bay Area and Denver. However, these two regions are the only among the selected group that show a higher level of concentration in the high level of preparation category. These comparisons are a positive sign for the Region’s second largest level of preparation category. FIGURE 12 HIGH LEVEL OF PREPARATION COMPARED TO SACRAMENTO REGION
-25% -20% -15% -10% -5% 0% 5% 10%
Bay Area
Fresno
Inland Empire
San Diego
California
Denver
Las Vegas
Phoenix
Portland
United States
1999-2003 Employment Growth Rate Divergence 2003 Composition Divergence
Sacr
amen
to
Reg
ion
= 0
Sacramento Regional Research Institute, July 2005 Data Source: Bureau of Labor Statistics, Occupational Employment Statistics and O*Net Note: Bars reflect percentage point divergence from Sacramento Region value

COMPARATIVE ANALYSIS
SSaaccrraammeennttoo RReeggiioonnaall RReesseeaarrcchh IInnssttiittuuttee 48
In the medium level of preparation category, shown in Figure 31, three regions experienced larger growth rates over the past five years compared to Sacramento—Las Vegas, the Inland Empire, and Fresno. Nearly all of the comparative and competitive regions have a notably greater proportion of their workforce with jobs requiring a medium level of preparation. This level of preparation category is the Region’s smallest, and although it has seen more robust growth than other regions, its weakness is apparent in relative size comparisons. The Sacramento Region seems to be somewhat top and bottom heavy compared to the selected regions. FIGURE 31 MEDIUM LEVEL OF PREPARATION COMPARED TO SACRAMENTO REGION
-15% -10% -5% 0% 5% 10% 15% 20% 25%
Bay Area
Fresno
Inland Empire
San Diego
California
Denver
Las Vegas
Phoenix
Portland
United States
2003 Composition Divergence1999-2003 Employment Growth Rate Divergence
Sacr
amen
to
Reg
ion
= 0
Sacramento Regional Research Institute, July 2005 Data Source: Bureau of Labor Statistics, Occupational Employment Statistics and O*Net Note: Bars reflect percentage point divergence from Sacramento Region value

COMPARATIVE ANALYSIS
SSaaccrraammeennttoo RReeggiioonnaall RReesseeaarrcchh IInnssttiittuuttee 49
As shown in Figure 32, the low level of preparation category is the Sacramento Region’s largest (containing over half of the Region’s workforce) and has grown at a greater rate over the past five years than all comparative and competitive regions with the exception of the Inland Empire. Even though this category encompasses a large proportion of the Region’s workforce, four areas, including Phoenix, Las Vegas, Denver, and the Inland Empire, have a higher concentration of their workforce with jobs requiring a low level of preparation compared to Sacramento. Even though other regions have a higher concentration in this category, the Sacramento Region appears to have a relatively healthy amount of its workforce with jobs requiring a low level of preparation and generally robust employment growth in this category. FIGURE 32 LOW LEVEL OF PREPARATION COMPARED TO SACRAMENTO REGION
-30% -25% -20% -15% -10% -5% 0% 5% 10% 15% 20%
Bay Area
Fresno
Inland Empire
San Diego
California
Denver
Las Vegas
Phoenix
Portland
United States
2003 Composition Divergence
1999-2003 Employment Growth Rate Divergence
Sacr
amen
to
Reg
ion
= 0
Sacramento Regional Research Institute, July 2005 Data Source: Bureau of Labor Statistics, Occupational Employment Statistics and O*Net Note: Bars reflect percentage point divergence from Sacramento Region value

COMPARATIVE ANALYSIS
SSaaccrraammeennttoo RReeggiioonnaall RReesseeaarrcchh IInnssttiittuuttee 50
Major Employer Viewpoints Almost all participants in SRRI’s interview process spoke positively regarding the Sacramento Region as a place to conduct business operations. In terms of occupations and job types, the majority of employers interviewed cited the variety of industries and jobs available as a valuable asset. The quality and diversity of the workforce was also applauded by many respondents while many also pointed to the cost of living advantages and growth potential for the region. Another frequently mentioned advantage was the variety and quality of higher education institutions in the area. Many weaknesses respondents mentioned about the Region were often based on a comparison to the Bay Area or other large regions. Although several respondents praised the lower cost of living in Sacramento, some pointed to difficulties in attracting applicants due to the higher salaries and competition from the Bay Area and other major metropolitan areas (cost of living not considered). Respondents in the healthcare and technology fields pointed to a shortage of applicants (especially in nursing and specialty fields) with the particular training they need and the limited availability of educational programs to help address these issues. Elementary and secondary educational establishments pointed to the lack of recruitment by schools and training agencies for math, science and special education programs. In general, respondents attributed most of Sacramento’s weaknesses to regional “growing pains.” Conclusion Overall, the Sacramento Region’s workforce is relatively strong and presents some definite advantages—almost all of the Region’s occupational categories have seen healthier growth rates than the statewide and national averages; it is specialized in many important categories (compared to both the state and the nation); and, along with following many of the widespread restructuring patterns, has shown some unique restructuring trends in many key occupational categories. The Sacramento Region’s workforce advantages primarily lie in its largest occupational and training categories—Office & Administrative Support occupations as well as jobs demanding a low level of preparation. Both of these aspects act as locational advantages and can be fostered by workforce development organizations. A few other occupational categories present relatively promising indicators of performance, such as the Sales & Related and Construction & Extraction categories. The part of the Region’s workforce that possesses jobs requiring a high level of preparation also demonstrates signs of strength in relation to the comparative and competitive regions. These elements also act as competitive advantages for the Sacramento Region, but are not as highly developed as the Office & Administrative support and low level of preparation categories. However, all of these elements are projected to post robust employment growth rates and capture larger proportions of the workforce over the next decade. Other occupational categories present a mixed view compared to the selected regions, but two categories highlight opportunities to enhance the Region’s workforce including Food

COMPARATIVE ANALYSIS
SSaaccrraammeennttoo RReeggiioonnaall RReesseeaarrcchh IInnssttiittuuttee 51
Preparation & Serving Related occupations and the medium level of preparation category, which have both experienced lower growth and contain a smaller proportion of the workforce than the comparative and competitive areas. While the Food Preparation & Related category might not be a notable area of concern in terms of the Region’s economic and workforce development efforts (especially considering that it is one of the Region’s largest categories and is projected to have no shift in composition by 2012), the medium level of preparation category presents a red flag for Sacramento. In addition to relatively slower growth and limited concentration, jobs requiring a medium level of preparation are projected to increase concentration and post the highest growth rate in the Region between 2003 and 2012. This is an area where some workforce development efforts along with community college programs might address one of the Region’s most notable competitive weaknesses. Major employers feel that the Sacramento Region presents some strong advantages related to the quality of the workforce, strength of available education and training programs, and the overall quality of life. However, they also stressed a regional need to foster the development of some deficient core skills and provide mechanisms to train a group of healthcare, office, and teaching-related occupations.

CONCLUSION
SSaaccrraammeennttoo RReeggiioonnaall RReesseeaarrcchh IInnssttiittuuttee 52
Conclusion The primary objective of this report is to provide a better understanding of the Sacramento Region’s workforce since limited research has addressed this aspect of the economy. Information from this report, however, can also be used to address Sacramento Works’ goal of assuring that qualified and trained workers are available to meet the needs of the Region’s economy. There are a number of aspects that can be considered strengths of the Region’s workforce, which can be marketed both internally and externally to prospective and existing companies. Workforce and economic development efforts should not simply accept these strengths and focus efforts elsewhere—programs should concentrate on fostering and ensuring the longevity of the advantages in order to help existing businesses succeed and allow the Region to maintain its competitive position. While preserving strengths is important, there are also a number of opportunities that, if effectively addressed through workforce development efforts, could make the workforce even stronger and the Region more competitive. Strengths
Several occupational categories, including Legal; Construction & Extraction; Office & Administrative Support; Community & Social Services; Computer & Mathematical; and Business & Financial, have demonstrated strong economic performance. All of these categories received high marks across a combination of concentration, historical shift in concentration, historical growth, projected growth, specialization, and historical change in specialization. Office & Administrative Support is undoubtedly the Region’s strongest occupational category—in addition to posting healthy economic performance across a number of indicators, it is more concentrated than most comparative and competitive regions; many of the Region’s major employers provide jobs housed in this category; and jobs in the category support growth in industry sectors with the greatest potential for economic development. Three of the six best-performing categories also posted the highest growth among the Region’s comparative and competitive regions and demonstrated the largest shift in composition—Legal; Community & Social Services; and Computer & Mathematical. Further, three of the categories including Business & Financial; Community & Social Services; and Construction & Extraction, show a high degree of specialization in the Sacramento Region.
The portion of the workforce with jobs requiring a low level of preparation
(some on-the-job training and high school-level education) makes up nearly 60 percent of the Region’s total workforce. While this level of preparation category has seen slight declines in concentration (and is expected to see minimal declines in the future) and somewhat lower growth than the medium and high level of preparation categories, due to its size, it still remains a critical component of the Region’s economic success. Many of Sacramento’s major employers predominantly provide low-skilled jobs and the low-skilled aspect is important to

CONCLUSION
SSaaccrraammeennttoo RReeggiioonnaall RReesseeaarrcchh IInnssttiittuuttee 53
support growth in industry sectors showing the greatest economic development potential. Additionally, this category has experienced stronger growth and is more concentrated than most of the comparative and competitive regions.
Across nearly all occupational categories, the Sacramento Region has seen
healthier growth than the statewide and national averages. Being one of the healthiest economies in California and the United States not only creates a positive perception of the Region overall, but also points to the quality of the workforce and the nexus between economic and workforce development. The Sacramento Region’s major employers praise the quality and diversity of the workforce; the Region’s growth potential; and the high-quality training and education programs. Additionally, in most cases, it appears that the existing workforce can complement growth in industry sectors presenting the highest economic development potential for the Sacramento Region.
Opportunities
A handful of the Sacramento Region’s underspecialized occupational categories are projected to see relatively strong employment growth and an increase in concentration including Education, Training, & Library; Management; Building & Grounds Cleaning & Maintenance; Protective Service; Healthcare Support; and Personal Care & Services. Major employers in the Region make use of jobs in the Education, Training, & Library; Management; and Protective Service occupational categories. Two of the categories, Protective Service and Healthcare Support, contain jobs that are important to the industry sectors showing the greatest potential for economic development, demonstrating that, in these cases, there is a gap between workforce and economic development. Both the Protective Service and Personal Care & Service occupational categories posted large employment losses relative to the comparative and competitive regions. While most of the other occupational categories are still competitive among the comparative and competitive regions, they all present room for improvement. With the exception of Education, Training, & Library and Management, all of these categories are either classified as requiring low or medium levels of preparation and workforce development programs are uniquely positioned to build capacity in these areas.
Combined, the portion of the Region’s workforce with jobs requiring medium
and high levels of preparation account for a little over 40 percent of the total—13 percent for medium and 31 percent for high. The high level of preparation category has seen more robust growth and is more concentrated than most comparative and competitive areas as well as the statewide and national averages. The medium level of preparation category, on the other hand, is underspecialized in the Sacramento Region and has grown at a notably slower rate than all comparative and competitive regions. Both the medium and high level of preparation categories have grown and are projected to continue to grow at a

CONCLUSION
SSaaccrraammeennttoo RReeggiioonnaall RReesseeaarrcchh IInnssttiittuuttee 54
faster rate than the low level of preparation category, and, as such, will become slightly more concentrated than they currently are. There is room to strengthen the high level of preparation category, but the jobs requiring a medium level of preparation present a higher priority. Since efforts in workforce development and community college programs are focused on this portion of the workforce, they are clearly in a position to address one of the Region’s most notable competitive weaknesses and future needs.
Knowledge and skill data for the Sacramento Region as well as major employer
opinions and jobs supporting growth in the industry sectors with the greatest economic development potential point to the likely benefit of equipping the Region’s workforce with a set of transferable skills that can help ensure job success across a wide range of occupations, industries, and training levels. The most widely applicable competencies for Sacramento workers include Mathematics; English Language; Clerical; Customer & Personal Service; Administration & Management; Speaking; Reading Comprehension; Active Listening; and Writing. In addition to these core competencies, both “soft skills” and computer proficiency should be added to the list since many employers note a lack of such skills as well as the growing need for computer abilities. In order to ensure that members of the workforce have the core set of skills that are applicable in the broadest range of occupational opportunities, education and training providers serving all skill levels could build programs that help to provide a set of transferable skills.
Despite the advantages the Region’s major employers feel Sacramento possesses,
there are a few workforce-related aspects that they believe need to be addressed. First, they note a shortage of workers in some of Sacramento’s largest occupational categories including Office & Administrative Support (high-quality entry-level workers); Healthcare Practitioners & Technical (nurses and specialty health practitioners) and Education, Training, & Library (math, science, and special education teachers). Education and training providers could mitigate this issue by building capacity in programs that train these types of occupations as well as developing industry-education linkages and feedback loops. Second, major employers highlighted the issue of relatively low compensation levels and wage growth that allow other regions offering higher salaries to pull high-quality workers out of the Sacramento Region. Programs that increase the quality of the Region’s workforce and enhance its competitiveness could have indirect effects on worker compensation. Finally, major employers believe that the availability and scope of all education and training programs need to be expanded. This suggestion is generally self-explanatory, but data and interviews for this report as well as the Analysis of Workforce Skills Sets project imply that in planning for increased workforce development efforts, there is a need to dig deeper and conduct further research into characteristics, trends, and requirements for specific occupations.

APPENDIX A
SSaaccrraammeennttoo RReeggiioonnaall RReesseeaarrcchh IInnssttiittuuttee A-1
Appendix A—SOC Structure and Notes on Data The list below, created by the Bureau of Labor Statistics, provides the complete SOC structure.

APPENDIX A
SSaaccrraammeennttoo RReeggiioonnaall RReesseeaarrcchh IInnssttiittuuttee A-2

APPENDIX A
SSaaccrraammeennttoo RReeggiioonnaall RReesseeaarrcchh IInnssttiittuuttee A-3

APPENDIX A
SSaaccrraammeennttoo RReeggiioonnaall RReesseeaarrcchh IInnssttiittuuttee A-4

APPENDIX A
SSaaccrraammeennttoo RReeggiioonnaall RReesseeaarrcchh IInnssttiittuuttee A-5

APPENDIX A
SSaaccrraammeennttoo RReeggiioonnaall RReesseeaarrcchh IInnssttiittuuttee A-6

APPENDIX A
SSaaccrraammeennttoo RReeggiioonnaall RReesseeaarrcchh IInnssttiittuuttee A-7

APPENDIX A
SSaaccrraammeennttoo RReeggiioonnaall RReesseeaarrcchh IInnssttiittuuttee A-8

APPENDIX A
SSaaccrraammeennttoo RReeggiioonnaall RReesseeaarrcchh IInnssttiittuuttee A-9

APPENDIX A
SSaaccrraammeennttoo RReeggiioonnaall RReesseeaarrcchh IInnssttiittuuttee A-10

APPENDIX A
SSaaccrraammeennttoo RReeggiioonnaall RReesseeaarrcchh IInnssttiittuuttee A-11

APPENDIX A
SSaaccrraammeennttoo RReeggiioonnaall RReesseeaarrcchh IInnssttiittuuttee A-12

APPENDIX A
SSaaccrraammeennttoo RReeggiioonnaall RReesseeaarrcchh IInnssttiittuuttee A-13

APPENDIX A
SSaaccrraammeennttoo RReeggiioonnaall RReesseeaarrcchh IInnssttiittuuttee A-14

APPENDIX A
SSaaccrraammeennttoo RReeggiioonnaall RReesseeaarrcchh IInnssttiittuuttee A-15

APPENDIX A
SSaaccrraammeennttoo RReeggiioonnaall RReesseeaarrcchh IInnssttiittuuttee A-16

APPENDIX A
SSaaccrraammeennttoo RReeggiioonnaall RReesseeaarrcchh IInnssttiittuuttee A-17

APPENDIX A
SSaaccrraammeennttoo RReeggiioonnaall RReesseeaarrcchh IInnssttiittuuttee A-18

APPENDIX A
SSaaccrraammeennttoo RReeggiioonnaall RReesseeaarrcchh IInnssttiittuuttee A-19

APPENDIX A
SSaaccrraammeennttoo RReeggiioonnaall RReesseeaarrcchh IInnssttiittuuttee A-20

APPENDIX A
SSaaccrraammeennttoo RReeggiioonnaall RReesseeaarrcchh IInnssttiittuuttee A-21

APPENDIX A
SSaaccrraammeennttoo RReeggiioonnaall RReesseeaarrcchh IInnssttiittuuttee A-22

APPENDIX A
SSaaccrraammeennttoo RReeggiioonnaall RReesseeaarrcchh IInnssttiittuuttee A-23

APPENDIX A
SSaaccrraammeennttoo RReeggiioonnaall RReesseeaarrcchh IInnssttiittuuttee A-24

APPENDIX A
SSaaccrraammeennttoo RReeggiioonnaall RReesseeaarrcchh IInnssttiittuuttee A-25
The SOC-based occupational data was originally intended to provide snapshots of wages and employment for a specific point in time. The most recent data sets are generally seen as reliable estimates of an area’s occupational profile. Throughout the years, data collection methodologies have undergone some notable adjustments. Benchmarks and pooled, three-year collection cycles, in addition to methodology changes, have led the Bureau of Labor Statistics to advise users of discrepancies that may result when the data is compared across time periods. For instance, some changes that are reflected in time period comparisons may be due to methodological variations rather than actual changes in the economy. However, SRRI has chosen to make comparisons across time periods for three reasons. First, while occupational analysis has not been widely adopted in the workforce and economic development realms, some states and organizations have produced workforce studies that utilize the occupational data and make comparisons across time. Second, many research and data collection processes face similar methodological issues and the related data is still used as proxies or indicators, especially when they act as the only source of available information. SRRI believes that the occupational data—the only comparable information available for employment by occupations—serves as a reasonable proxy for workforce trends. Third, many of the errors manifest themselves at the detailed level, but are minimized by using a broader level of detail. For this reason, SRRI focuses on data at the major occupational category level (the 22 major SOC groups) and does not utilize data for sub-categories or specific occupations (SOC’s 96 minor groups and 449 general occupations). While conclusions reached through this data analysis provide insight into the occupational structure and trends, the potential for uncertainty in time series analyses should be noted.
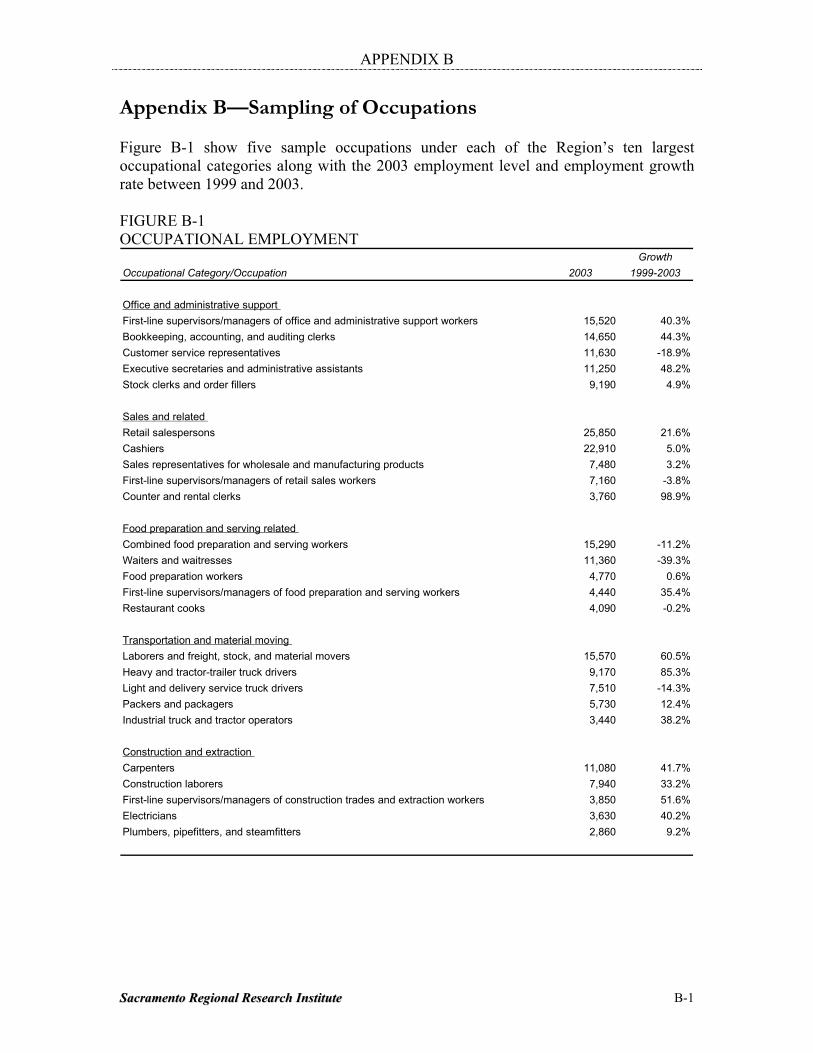
APPENDIX B
SSaaccrraammeennttoo RReeggiioonnaall RReesseeaarrcchh IInnssttiittuuttee B-1
Appendix B—Sampling of Occupations Figure B-1 show five sample occupations under each of the Region’s ten largest occupational categories along with the 2003 employment level and employment growth rate between 1999 and 2003. FIGURE B-1 OCCUPATIONAL EMPLOYMENT
GrowthOccupational Category/Occupation 2003 1999-2003
Office and administrative support First-line supervisors/managers of office and administrative support workers 15,520 40.3%Bookkeeping, accounting, and auditing clerks 14,650 44.3%Customer service representatives 11,630 -18.9%Executive secretaries and administrative assistants 11,250 48.2%Stock clerks and order fillers 9,190 4.9%
Sales and related Retail salespersons 25,850 21.6%Cashiers 22,910 5.0%Sales representatives for wholesale and manufacturing products 7,480 3.2%First-line supervisors/managers of retail sales workers 7,160 -3.8%Counter and rental clerks 3,760 98.9%
Food preparation and serving related Combined food preparation and serving workers 15,290 -11.2%Waiters and waitresses 11,360 -39.3%Food preparation workers 4,770 0.6%First-line supervisors/managers of food preparation and serving workers 4,440 35.4%Restaurant cooks 4,090 -0.2%
Transportation and material moving Laborers and freight, stock, and material movers 15,570 60.5%Heavy and tractor-trailer truck drivers 9,170 85.3%Light and delivery service truck drivers 7,510 -14.3%Packers and packagers 5,730 12.4%Industrial truck and tractor operators 3,440 38.2%
Construction and extraction Carpenters 11,080 41.7%Construction laborers 7,940 33.2%First-line supervisors/managers of construction trades and extraction workers 3,850 51.6%Electricians 3,630 40.2%Plumbers, pipefitters, and steamfitters 2,860 9.2%

APPENDIX B
SSaaccrraammeennttoo RReeggiioonnaall RReesseeaarrcchh IInnssttiittuuttee B-2
FIGURE B-1—CONTINUED OCCUPATIONAL EMPLOYMENT
GrowthOccupational Category/Occupation 2003 1999-2003
Business and financial operations Claims adjusters, examiners, and investigators 3,690 97.3%Management analysts 2,320 47.8%Cost estimators 1,680 13.5%Loan officers 1,470 41.3%Purchasing agents 1,360 34.7%
Education, training, and library Teacher assistants 10,460 59.5%Secondary school teachers 6,430 103.5%Self-enrichment education teachers 1,750 57.7%Postsecondary vocational education teachers 1,620 78.0%Instructional coordinators 1,450 107.1%
Management General and operations managers 13,290 13.0%Financial managers 3,240 -4.7%Computer and information systems managers 2,080 58.8%Administrative services managers 1,950 -7.1%Construction managers 1,670 7.1%
Production Team assemblers 4,220 32.7%First-line supervisors/managers of production and operating workers 2,410 18.7%Bakers 1,270 29.6%Welders, cutters, solderers, and brazers 1,130 9.7%Machinists 1,080 31.7%
Healthcare practitioners and technical Pharmacists 1,420 -33.3%Radiologic technologists and technicians 1,040 13.0%Pharmacy technicians 1,000 16.3%Veterinary technologists and technicians 690 25.5%Medical and clinical laboratory technicians 680 -39.8%
Sacramento Regional Research Institute, August 2005 Data Source: Bureau of Labor Statistics, Occupational Employment Statistics Note: The specific occupations presented in the table reflect a small sampling of occupations in the Sacramento Region’s ten largest occupational categories.

APPENDIX C
SSaaccrraammeennttoo RReeggiioonnaall RReesseeaarrcchh IInnssttiittuuttee C-1
Appendix C—Employment Data For reference purposes, Figure C-1 and C-2 provide the employment levels for the major occupational and level of preparation categories in the Sacramento Region for each year between 1999 and 2003. FIGURE C-1 SACRAMENTO REGION OCCUPATIONAL EMPLOYMENT Occupational Category 1999 2000 2001 2002 2003
Office and administrative support 149,270 157,640 171,570 170,230 178,530Sales and related 75,800 83,290 85,420 87,840 87,170Food preparation and serving related 71,410 70,980 63,010 64,100 65,470Transportation and material moving 44,940 48,920 56,480 56,980 56,240Construction and extraction 43,470 47,340 54,880 56,210 55,860Business and financial operations 43,290 48,840 55,010 53,360 53,830Education, training, and library 43,350 45,050 48,510 50,380 48,040Management 44,520 43,770 45,970 44,130 43,520Production 41,690 40,550 37,440 37,810 37,010Healthcare practitioners and technical 33,020 34,230 30,570 37,420 35,800Installation, maintenance, and repair 23,220 27,640 30,090 31,210 31,260Building and grounds cleaning and maintenance 21,370 23,920 25,360 27,510 26,810Computer and mathematical 17,070 20,690 26,070 23,310 25,710Protective service 25,740 25,680 26,090 20,740 20,460Architecture and engineering 13,600 16,550 20,230 17,890 18,320Healthcare support 15,950 16,460 16,390 16,030 16,850Community and social services 8,310 9,800 10,200 10,980 14,740Personal care and service 16,530 15,540 16,260 17,060 14,520Life, physical, and social science 6,520 7,040 8,460 8,510 9,320Arts, design, entertainment, sports, and media 7,570 8,440 9,270 9,750 9,200Legal 4,090 8,020 7,750 7,510 7,330Farming, fishing, and forestry 4,180 3,540 3,690 6,240 6,250
Sacramento Regional Research Institute, May 2005 Data Source: Bureau of Labor Statistics, Occupational Employment Statistics FIGURE C-2 SACRAMENTO REGION LEVEL OF PREPARATION EMPLOYMENT Level of Preparation 1999 2000 2001 2002 2003
High 221,340 242,430 262,040 263,240 265,810Medium 92,430 100,660 111,060 108,160 107,580Low 441,140 460,840 475,620 483,800 488,850
Sacramento Regional Research Institute, June 2005 Data Sources: Bureau of Labor Statistics, Occupational Employment Statistics and O*Net

APPENDIX D
SSaaccrraammeennttoo RReeggiioonnaall RReesseeaarrcchh IInnssttiittuuttee D-1
Appendix D—Knowledge and Skill Importance For reference purposes, Figures D-1 through D-6 display the average level of importance for the knowledge and skill categories in the Sacramento Region broken down by the high, medium, and low level of preparation categories. Like the information for the workforce overall, the categories that ranked as most important in the lists can be seen as the most useful and unique set of job competencies for the Sacramento Region’s workforce in the particular training level, without regard to job function. It is important for workforce development organizations to note the patterns in the low level of preparation category since they reflect competencies that could be included in training programs for the principle target market. FIGURE D-1 HIGH LEVEL OF PREPARATION KNOWLEDGE CATEGORY IMPORTANCE IN 2003
English LanguageMathematics
Administration and ManagementEducation and Training
Computers and ElectronicsClerical
Economics and AccountingPsychology
Communications and MediaLaw and Government
Customer and Personal ServicePersonnel and Human Resources
Therapy and CounselingPublic Safety and Security
TelecommunicationsBiology
Sociology and AnthropologyEngineering and Technology
Medicine and DentistrySales and Marketing
ChemistryPhysicsDesign
MechanicalGeography
Production and ProcessingTransportation
History and ArcheologyBuilding and ConstructionPhilosophy and Theology
Fine ArtsFood Production
Foreign Language
ImportanceLeast Most
Sacramento Regional Research Institute, June 2005 Data Sources: Bureau of Labor Statistics, Occupational Employment Statistics and O*Net

APPENDIX D
SSaaccrraammeennttoo RReeggiioonnaall RReesseeaarrcchh IInnssttiittuuttee D-2
FIGURE D-2 MEDIUM LEVEL OF PREPARATION KNOWLEDGE CATEGORY IMPORTANCE IN 2003
MechanicalBuilding and Construction
Engineering and TechnologyPublic Safety and Security
MathematicsPhysics
English LanguageDesign
Computers and ElectronicsTransportation
Law and GovernmentTelecommunications
GeographyChemistry
Production and ProcessingCustomer and Personal Service
ClericalCommunications and Media
Administration and ManagementEducation and Training
PsychologyMedicine and Dentistry
Economics and AccountingPersonnel and Human Resources
Sociology and AnthropologyTherapy and Counseling
Foreign LanguageFine Arts
Sales and MarketingBiology
History and ArcheologyPhilosophy and Theology
Food Production
ImportanceLeast Most
Sacramento Regional Research Institute, June 2005 Data Sources: Bureau of Labor Statistics, Occupational Employment Statistics and O*Net

APPENDIX D
SSaaccrraammeennttoo RReeggiioonnaall RReesseeaarrcchh IInnssttiittuuttee D-3
FIGURE D-3 LOW LEVEL OF PREPARATION KNOWLEDGE CATEGORY IMPORTANCE IN 2003
MathematicsCustomer and Personal Service
English LanguageClerical
Computers and ElectronicsEconomics and Accounting
Sales and MarketingCommunications and Media
TelecommunicationsAdministration and Management
MechanicalTransportation
Public Safety and SecurityLaw and Government
Education and TrainingPsychology
Production and ProcessingGeography
Personnel and Human ResourcesEngineering and Technology
ChemistryPhysics
Sociology and AnthropologyDesign
BiologyMedicine and Dentistry
Therapy and CounselingBuilding and Construction
Food ProductionFine Arts
Foreign LanguagePhilosophy and Theology
History and Archeology
ImportanceLeast Most
Sacramento Regional Research Institute, June 2005 Data Sources: Bureau of Labor Statistics, Occupational Employment Statistics and O*Net

APPENDIX D
SSaaccrraammeennttoo RReeggiioonnaall RReesseeaarrcchh IInnssttiittuuttee D-4
FIGURE D-4 HIGH LEVEL OF PREPARATION SKILL CATEGORY IMPORTANCE IN 2003
Reading ComprehensionSpeaking
Critical ThinkingActive Listening
WritingJudgment and Decision Making
Active LearningMathematics
Complex Problem Solving Monitoring
CoordinationLearning StrategiesSystems Evaluation
Social PerceptivenessSystems AnalysisTime Management
InstructingOperations Analysis
Management of Personnel ResourcesScience
Equipment SelectionService Orientation
Quality Control AnalysisManagement of Material Resources
PersuasionManagement of Financial Resources
NegotiationOperation and Control
Technology DesignOperation Monitoring
TroubleshootingProgramming
InstallationEquipment Maintenance
Repairing
ImportanceLeast Most
Sacramento Regional Research Institute, June 2005 Data Sources: Bureau of Labor Statistics, Occupational Employment Statistics and O*Net

APPENDIX D
SSaaccrraammeennttoo RReeggiioonnaall RReesseeaarrcchh IInnssttiittuuttee D-5
FIGURE D-5 MEDIUM LEVEL OF PREPARATION SKILL CATEGORY IMPORTANCE IN 2003
Equipment SelectionOperation and Control
RepairingInstallation
Quality Control AnalysisReading ComprehensionEquipment Maintenance
MonitoringJudgment and Decision Making
TroubleshootingActive Listening
MathematicsCritical Thinking
CoordinationComplex Problem Solving
Operation MonitoringSpeaking
Active LearningWriting
Systems EvaluationTime ManagementSystems Analysis
Operations AnalysisScience
Learning StrategiesTechnology Design
Management of Material ResourcesSocial Perceptiveness
Service OrientationInstructingPersuasion
Management of Personnel ResourcesNegotiation
Management of Financial ResourcesProgramming
ImportanceLeast Most
Sacramento Regional Research Institute, June 2005 Data Sources: Bureau of Labor Statistics, Occupational Employment Statistics and O*Net

APPENDIX D
SSaaccrraammeennttoo RReeggiioonnaall RReesseeaarrcchh IInnssttiittuuttee D-6
FIGURE D-6 LOW LEVEL OF PREPARATION SKILL CATEGORY IMPORTANCE IN 2003
Active ListeningSpeaking
Reading ComprehensionMathematics
WritingService Orientation
CoordinationSocial Perceptiveness
MonitoringOperation and Control
Judgment and Decision MakingComplex Problem Solving
Critical ThinkingEquipment Selection
Time ManagementActive Learning
Quality Control AnalysisSystems EvaluationLearning Strategies
Management of Material ResourcesInstructing
Operation MonitoringPersuasion
Systems AnalysisOperations Analysis
Equipment MaintenanceNegotiation
Management of Financial ResourcesTroubleshooting
Management of Personnel ResourcesTechnology Design
ScienceRepairing
InstallationProgramming
ImportanceLeast Most
Sacramento Regional Research Institute, June 2005 Data Sources: Bureau of Labor Statistics, Occupational Employment Statistics and O*Net

APPENDIX E
SSaaccrraammeennttoo RReeggiioonnaall RReesseeaarrcchh IInnssttiittuuttee E-1
Appendix E—Knowledge and Skill Definitions The lists below present definitions for each of O*Net’s knowledge and skill categories. Knowledge Categories 1. Administration and Management—knowledge of business and management
principles involved in strategic planning, resource allocation, human resources modeling, leadership technique, production methods, and coordination of people and resources.
2. Biology—knowledge of plant and animal organisms, their tissues, cells, functions, interdependencies, and interactions with each other and the environment.
3. Building and Construction—knowledge of materials, methods, and the tools involved in the construction or repair of houses, buildings, or other structures such as highways and roads.
4. Chemistry—knowledge of the chemical composition, structure, and properties of substances and of the chemical processes and transformations that they undergo. This includes uses of chemicals and their interactions, danger signs, production techniques, and disposal methods.
5. Clerical—knowledge of administrative and clerical procedures and systems such as word processing, managing files and records, stenography and transcription, designing forms, and other office procedures and terminology.
6. Communications and Media—knowledge of media production, communication, and dissemination techniques and methods. This includes alternative ways to inform and entertain via written, oral, and visual media.
7. Computers and Electronics—knowledge of circuit boards, processors, chips, electronic equipment, and computer hardware and software, including applications and programming.
8. Customer and Personal Service—knowledge of principles and processes for providing customer and personal services. This includes customer needs assessment, meeting quality standards for services, and evaluation of customer satisfaction.
9. Design—knowledge of design techniques, tools, and principles involved in production of precision technical plans, blueprints, drawings, and models.
10. Economics and Accounting—knowledge of economic and accounting principles and practices, the financial markets, banking and the analysis and reporting of financial data.
11. Education and Training—knowledge of principles and methods for curriculum and training design, teaching and instruction for individuals and groups, and the measurement of training effects.
12. Engineering and Technology—knowledge of the practical application of engineering science and technology. This includes applying principles, techniques, procedures, and equipment to the design and production of various goods and services.
13. English Language—knowledge of the structure and content of the English language including the meaning and spelling of words, rules of composition, and grammar.
14. Fine Arts—knowledge of the theory and techniques required to compose, produce, and perform works of music, dance, visual arts, drama, and sculpture.

APPENDIX E
SSaaccrraammeennttoo RReeggiioonnaall RReesseeaarrcchh IInnssttiittuuttee E-2
15. Food Production—knowledge of techniques and equipment for planting, growing, and harvesting food products (both plant and animal) for consumption, including storage/handling techniques.
16. Foreign Language—knowledge of the structure and content of a foreign (non-English) language including the meaning and spelling of words, rules of composition and grammar, and pronunciation.
17. Geography—knowledge of principles and methods for describing the features of land, sea, and air masses, including their physical characteristics, locations, interrelationships, and distribution of plant, animal, and human life.
18. History and Archeology—knowledge of historical events and their causes, indicators, and effects on civilizations and cultures.
19. Law and Government—knowledge of laws, legal codes, court procedures, precedents, government regulations, executive orders, agency rules, and the democratic political process.
20. Mathematics—knowledge of arithmetic, algebra, geometry, calculus, statistics, and their applications.
21. Mechanical—knowledge of machines and tools, including their designs, uses, repair, and maintenance.
22. Medicine and Dentistry—knowledge of the information and techniques needed to diagnose and treat human injuries, diseases, and deformities. This includes symptoms, treatment alternatives, drug properties and interactions, and preventive health-care measures.
23. Personnel and Human Resources—knowledge of principles and procedures for personnel recruitment, selection, training, compensation and benefits, labor relations and negotiation, and personnel information systems.
24. Philosophy and Theology—knowledge of different philosophical systems and religions. This includes their basic principles, values, ethics, ways of thinking, customs, practices, and their impact on human culture.
25. Physics—knowledge and prediction of physical principles, laws, their interrelationships, and applications to understanding fluid, material, and atmospheric dynamics, and mechanical, electrical, atomic and sub- atomic structures and processes.
26. Production and Processing—knowledge of raw materials, production processes, quality control, costs, and other techniques for maximizing the effective manufacture and distribution of goods.
27. Psychology—knowledge of human behavior and performance; individual differences in ability, personality, and interests; learning and motivation; psychological research methods; and the assessment and treatment of behavioral and affective disorders.
28. Public Safety and Security—knowledge of relevant equipment, policies, procedures, and strategies to promote effective local, state, or national security operations for the protection of people, data, property, and institutions.
29. Sales and Marketing—knowledge of principles and methods for showing, promoting, and selling products or services. This includes marketing strategy and tactics, product demonstration, sales techniques, and sales control systems.

APPENDIX E
SSaaccrraammeennttoo RReeggiioonnaall RReesseeaarrcchh IInnssttiittuuttee E-3
30. Sociology and Anthropology—knowledge of group behavior and dynamics, societal trends and influences, human migrations, ethnicity, cultures and their history and origins.
31. Telecommunications—knowledge of transmission, broadcasting, switching, control, and operation of telecommunications systems.
32. Therapy and Counseling—knowledge of principles, methods, and procedures for diagnosis, treatment, and rehabilitation of physical and mental dysfunctions, and for career counseling and guidance.
33. Transportation—knowledge of principles and methods for moving people or goods by air, rail, sea, or road, including the relative costs and benefits.
Skills Categories 1. Active Learning—understanding the implications of new information for both current
and future problem-solving and decision-making. 2. Active Listening—giving full attention to what other people are saying, taking time to
understand the points being made, asking questions as appropriate, and not interrupting at inappropriate times.
3. Complex Problem Solving—identifying complex problems and reviewing related information to develop and evaluate options and implement solutions.
4. Coordination—adjusting actions in relation to others' actions. 5. Critical Thinking—using logic and reasoning to identify the strengths and weaknesses
of alternative solutions, conclusions or approaches to problems. 6. Equipment Maintenance—performing routine maintenance on equipment and
determining when and what kind of maintenance is needed. 7. Equipment Selection—determining the kind of tools and equipment needed to do a
job. 8. Installation—installing equipment, machines, wiring, or programs to meet
specifications. 9. Instructing—teaching others how to do something. 10. Judgment and Decision Making—considering the relative costs and benefits of
potential actions to choose the most appropriate one. 11. Learning Strategies—selecting and using training/instructional methods and
procedures appropriate for the situation when learning or teaching new things. 12. Management of Financial Resources—determining how money will be spent to get
the work done, and accounting for these expenditures. 13. Management of Material Resources—obtaining and seeing to the appropriate use of
equipment, facilities, and materials needed to do certain work. 14. Management of Personnel Resources—motivating, developing, and directing people
as they work, identifying the best people for the job. 15. Mathematics—using mathematics to solve problems. 16. Monitoring—monitoring/assessing performance of yourself, other individuals, or
organizations to make improvements or take corrective action. 17. Negotiation—bringing others together and trying to reconcile differences. 18. Operation and Control—controlling operations of equipment or systems.

APPENDIX E
SSaaccrraammeennttoo RReeggiioonnaall RReesseeaarrcchh IInnssttiittuuttee E-4
19. Operation Monitoring—watching gauges, dials, or other indicators to make sure a machine is working properly.
20. Operations Analysis—analyzing needs and product requirements to create a design. 21. Persuasion—persuading others to change their minds or behavior. 22. Programming—writing computer programs for various purposes. 23. Quality Control Analysis—conducting tests and inspections of products, services, or
processes to evaluate quality or performance. 24. Reading Comprehension—understanding written sentences and paragraphs in work
related documents. 25. Repairing—repairing machines or systems using the needed tools. 26. Science—using scientific rules and methods to solve problems. 27. Service Orientation—actively looking for ways to help people. 28. Social Perceptiveness—being aware of others' reactions and understanding why they
react as they do. 29. Speaking—talking to others to convey information effectively. 30. Systems Analysis—determining how a system should work and how changes in
conditions, operations, and the environment will affect outcomes. 31. Systems Evaluation—identifying measures or indicators of system performance and
the actions needed to improve or correct performance, relative to the goals of the system.
32. Technology Design—generating or adapting equipment and technology to serve user needs.
33. Time Management—managing one's own time and the time of others. 34. Troubleshooting—determining causes of operating errors and deciding what to do
about it. 35. Writing—communicating effectively in writing as appropriate for the needs of the
audience.