regional transit strategic plan 2018-2023 - rta · 2 regional transit strategic plan 2018-2023: ......
TRANSCRIPT

Regional Transit Strategic Plan2018-2023MAY 2017
Beginning the Discussion

2 Regional Transit Strategic Plan 2018-2023: Beginning the Discussion
The next Regional Transit Strategic Plan will provide a visionary roadmap for near-term transit investment in the Regional Transportation Authority (RTA) six-county area. Through the Strategic Plan, the Chicago region’s transit agencies – RTA, Chicago Transit Authority, Metra, and Pace – will join forces to talk about the policies and investments that are needed over the next five years to deliver great public transportation in light of changing demographics, travel trends, and technology. The Strategic Plan will serve as a guide to each of the transit agencies as we prepare for the future and carry out day-to-day activities to meet passenger needs across the large and diverse region.
This document presents key findings from research conducted during 2016.
In order to identify our priorities and strategies for the next five years, we will be using this research and coordinating with the Chicago Metropolitan Agency for Planning (CMAP) as it develops the ON TO 2050 long range plan for the region.
2018 - 2023
Regional Transit Strategic Plan
Conduct RESEARCH to develop a foundation for plan development
2016
ENGAGE stakeholders and the public2017
ADOPT the 2018-2023 RegionalTransit Strategic Plan
2018

Beginning the Discussion presents nine key findings summarizing the
state of the Chicago region and the transit system today.
The Region is Builton Transit The Region’s Investment is at Risk
Many People Ride Transit…but Many Don’t Great Transit Access Serves a Strong Chicago Central Business District Growing Markets in Suburban Cook Could Benefit Transit
More Jobs and New Connections are Needed on the South Side and South Suburbs
More Capacity is Needed on Chicago’s North Side Large Suburban Job Clusters are Difficult to Serve by Traditional Transit Millennials and Boomers Push Transit to Adapt
http://strategicplan.rtachicago.org
05
01
02
03
04
06
07
08
09
Check the Regional Transit Strategic Plan project website for updates throughout 2017.
3

4 Regional Transit Strategic Plan 2018-2023: Beginning the Discussion
01
After World War II, growth moved outward from the City and away from the rail lines with the creation of the Interstate highway system and other roadway expansions. Much of this development occurred in areas easily accessed by car, but not served by transit. As a result, the region is home to a variety of neighborhoods and commercial developments, some of which are near the transit system and others of which are far from it.
The transit system in our region is the second largest in the nation based on passenger miles traveled. The system provides over 2 million passenger rides each work day.
The majority of the rail and bus lines that comprise our regional transit system today have existed in some form for nearly a century. During the first half of the 20th century, the City of Chicago and many suburban towns centered their growth along the transit system.
6 Counties
277 municipalities
8.4 million residents
4 transit agencies
2.2 million rides per day
THE CHICAGO REGION’S TRANSIT NETWORK
Where are we today?
Metra
CTA Bus
Pace Bus
CTA Rail
MERID
HC
MDW
SWS
UPW
UPNWUPNW
MDN
NC
S
BNSF
MERID
HC
MDW
SWS
UPW
UPNWUPNWUPNW
MDN
NC
S
BNSF
UP
N
Kane
Lake
Cook
McHenry
Cook
Will
Will
DuPage
Kane
LakeLakeLake
CookCookCook
McHenryMcHenryMcHenry
CookCookCook
WillWillWill
WillWillWill
DuPageDuPageDuPage
Chicago
Source: RTA Mapping and Statistics (RTAMS.org)
The Region is Built on Transit

The Region is Built on Transit
Population density influences transit service, with higher densities supporting more frequent and effective transit service. Transit likewise influences population density, with the highest densities in the region found in the City of Chicago and along Metra rail lines in suburban areas.
Many residents use transit to get to work in the region, with the transit system providing the
“Transit is one of our region’s greatest strengths. A Strategic Plan built on collaboration, cooperation, and sustainable funding will allow us to rebuild and modernize our system so that it remains
globally competitive for years to come.”
POPULATION DENSITY REGIONAL JOB ACCESS
ModernResilient World-classEfficient
Affordable
What key words best capture your vision for the region’s transit system?
01
5
average resident with access to over 425,000 jobs within 60 minutes and up to 1.1 million jobs within 90 minutes. The purpose of the Strategic Plan process is to ensure that there is a strong vision and adequate funding to support the region’s transit system in providing an anchor for development and a convenient mode of travel well into the future.
Where are we going?
– Leanne P. Redden, Executive Director, Regional Transportation Authority
Source: US Census 2010-2014 ACS 5-year est. Source: RTA Regional Transit Access Analysis (based on 2015 CMAP employment est.)

02
The Region’s Investment is at Risk
CTA51.2%
7.7% Pace
5.9% ADA Paratransit
7.4% Debt Service
0.2% Joint Self-Insurance Fund
1.4% RTA Agency and Regional Programs
Metra26.2%
38.0% Service BoardOperating Revenue
2.1% Real Estate Transfer Tax
13.1% Public Transportation Fund
0.9% Other
4.3% State FinancialAssistance (ASA/AFA)
41.5% Sales Tax
Our regional operating budget is about $3 billion in 2017. This is funded by a combination of farebox revenue, sales tax, and other public funding. We use this funding to operate services on CTA, Metra, and Pace as well as for debt service and RTA’s own budget.
We operate a very cost-effective service. Our regional cost per passenger mile, at $0.61, is the lowest operating cost among peer metropolitan areas.
Where are we today? 2017 EXPENSES: $2.976 BILLION
2017 OPERATING REVENUES: $3.022 BILLION
6 Regional Transit Strategic Plan 2018-2023: Beginning the Discussion
$1.07
$0.85
$0.84
$0.84
$0.81
$0.78
$0.73
$0.68
$0.63
$0.61
Dallas
Houston
Washington D.C.
Boston
Miami
Philadelphia
Los Angeles
New York
Atlanta
Chicago
OPERATING COST PER PASSENGER MILESource: RTA 2015 Regional Peer Review
Source: RTA 2017 Operating Budget, Two-Year Financial Plan, and Five-Year Capital Budget
Source: RTA 2017 Operating Budget, Two-Year Financial Plan, and Five-Year Capital Budget
Operating Funding

The Region’s Investment is at Risk
“We are committed to providing our customers with affordable, reliable, and convenient bus and rail service. As an agency, we devote the necessary resources to achieving these goals every
day, while monitoring our spending to ensure that all of our dollars are spent wisely.”
Is it important for us to maintain the position of lowest cost per passenger mile?
NoYes
02
While we are proud that our agencies are able to keep operating costs low, it is worth considering what could change if the Chicago region was able to invest more in our operations. The middle of our peer group spends about $0.81 per passenger mile. At this level of investment, the region would still be competitive with our peers, but could invest $0.20 more per mile in our current operations, potentially providing additional resources for more reliable and frequent service.
Continuing to maintain costs by keeping fares and taxes low requires the agencies to make trade-offs. Through the Strategic Plan, the agencies will engage with stakeholders to determine whether the opportunity to improve services or amenities is a sensible use of higher fares or increased taxes to support more robust operations.
7
Where are we going?
AMENITIESPreventative Maintenance
TechnologyAesthetic Improvements
SERVICEBasic Maintenance
LaborFuel
MOREAMENITIES
MORESERVICE
TODAY
– Dorval R. Carter, Jr., President, Chicago Transit Authority

8 Regional Transit Strategic Plan 2018-2023: Beginning the Discussion
We have a $5 billion capital budget for the next five years. On a per capita basis, our region ranks in the middle of our peer metropolitan areas. A substantial portion of that available funding is committed to debt service and the Red and Purple Modernization (RPM) Program Phase One, so not much is available for discretionary capital use.
Without an Illinois State budget, or a State capital program, the transit agencies rely mostly on Federal funding to rebuild our infrastructure and purchase new vehicles.
In order to keep construction projects and capital programs moving, CTA is using bonding and Tax Increment Financing dedicated to the RPM Program.
Where are we today?
$300
$200
$100
$0
20052014New
York
Los A
ngeles
Boston
Philadel
phiaAtla
nta
Miam
i
Dalla
s
Houston
Chicag
oW
ashin
gton, D
C
CAPITAL FUNDING PER CAPITA
14.4%Debt Service
(Federal)
25.8% Rolling Stock35.8%
Rail Line Modernization
&Improvements
0.7% RTA Innovation Coordination, andEnhancement (ICE)
5.5% Service Board
12.2% Transit TIF
6.1% RTA Bond Proceeds
5.6% CTA Bond Proceeds
0.2% Pace Bond Proceeds
68.1%Federal Funds
1.5% De-obligation/Re-obligation Funds (State Funds)
2017-2021 CAPITAL FUNDING: $5.085 BILLION
8.2% Support Facilities and Equipment
5.2% Track and Structure
4.2% Electric, Signal, & Communications
3.4% Stations & Passenger Facilities
0.6% Miscellaneous
2.3% Contingencies & Adminstrations
2017-2021 CAPITAL PROGRAM USES 2017-2021 CAPITAL FUNDING: $5.085 BILLION
The Region’s Investment is at Risk
02
Metra has increased fares to develop a dedicated pool of capital funds, and has pursued lease programs with locomotive manufacturers. Pace has also bonded, and put some projects on hold pending availability of State funding.
Source: Federal Transit Administration National Transit Database (2005 & 2014)
Source: RTA 2017 Operating Budget, Two-Year Financial Plan, and Five-Year Capital BudgetSource: RTA 2017 Operating Budget, Two-Year Financial Plan, and Five-Year Capital Budget
Capital Funding
“Because we are investing in our future, for four years in a row we have seen more companies move their headquarters to Chicago and more investors from around the world invest in Chicago than in any other
American city. By investing in our public transportation system we can make it more accessible for residents while attracting businesses to the
region and strengthening our position as a world-class city.”
– Rahm Emanuel, Mayor, City of Chicago

2015
31% 2020
32%2025
35%
2030
35% 2035
37%
PROJECTED PERCENTAGE OF RTA ASSETS NOT IN STATE OF GOOD REPAIR AT CURRENT FUNDING LEVELS
The Region’s Investment is at Risk
Where are we going?Today about 31% of our assets are not in a state of good repair, which means that they are older than they were designed to last. At our current investment level, nearly 37% of our assets will be too old by 2035.
We estimate that we need $2 to $3 billion of capital funding annually – about double what we have now – to substantially improve the state of good repair of our assets over the next 20 years.
There are two ways to obtain more capital funding. One option is for the region to look to new or expanded revenue sources. This could include
Which funding sources should we pursue in order to increase capital funding to the
level of our peers?
Should we as a region pursue policies that would direct more of the total
transportation funds toward transit?
Gas taxParking fees
Value captureOk as we are
NoYes
Vehicle mile tax Sales tax on services
9
raising vehicle user fees (such as gas tax or a tax on vehicle miles traveled), extending the RTA sales tax to services, or using impact fees to capture the increase in land value created by transit investments.
Another approach is to allocate more of the region’s existing transportation funding to transit. The Strategic Plan will lay out capital priorities that can be delivered by the transit agencies should the region’s decision-makers provide a stable, reliable source of additional capital funding.
Source: RTA 2017 Bridge the Gap report
Impact fees
Rental car tax

10 Regional Transit Strategic Plan 2018-2023: Beginning the Discussion
03
Many People Ride Transit... but Many Don’t
0
100
200
300
400
500
600
700
800
900
An
nu
al u
nlin
ked
tri
ps
(mill
ion
s)
REGIONAL TRANSIT RIDERSHIP
SYSTEM TOTAL
CTA BUS
CTA RAIL
METRA
PACE
1980
1982
1984
1986
1988
1990
1992
1994
1996
1998
2000
2002
2004
2006
2008
2010
2012
2014
REGIONAL TRANSIT RIDERSHIP
PUBLIC TRANSIT MODE SHAREOver two million trips are made every weekday on our transit system. CTA accounts for over 1.6 million, split about evenly between bus and rail. Metra provides nearly 300 thousand trips and Pace about 100 thousand trips. Where transit is robust and land use provides support, more than half of work trips are made on transit.
System ridership declined in the 1980’s, led by a major reduction in CTA bus ridership, partly brought on by a loss of industrial jobs. Since the mid-1990’s bus ridership has been mostly steady, while rail ridership has grown.
In 2015, CTA rail reached its highest level in decades. Bus used to account for a much larger share of CTA ridership than rail, but with rail growth and bus decline, they are now about even. The CTA is currently studying these changes.
Where are we today?
Source: RTA Mapping and Statistics (RTAMS.org)
Source: US Census 2010-2014 ACS 5-year est.

11
“Future capital efforts by the State of Illinois will support smart, multi-modal transportation projects that show a
return on investment.”
As part of planning for the ON TO 2050 Regional Plan, CMAP used the regional travel demand model to test the potential of various strategies to increase transit ridership.
High-level policies, including pricing and land use strategies, broadly implemented across the region tend to have a significant impact on transit ridership and mode share. Apart from increasing frequency, transit service enhancements and expansion projects have less of an impact on mode share, but are changes that the agencies have more direct ability to influence.
We recognize that mode share and ridership may not be the only goal for transit projects, as capital investments can provide economic development and equity of service benefits. The Strategic Plan will provide a forum for discussing the region’s investment priorities in this era of constrained public resources.
Where are we going?
PRICING
LAND USE
TRANSIT ENHANCEMENT
TRANSIT EXPANSION
Price parking
More jobs in CBD
Increase frequency
Peak/o�-peak fares
More jobs near rail outside CBD
Expand rail
More householdsnear transit
Improve last-mileconnections
Enhance bus service
Increase motorfuel tax
Toll expressways
Improve vehicles
Improve stations
RELATIVE IMPACT ON INCREASING TRANSIT MODE SHARE
What types of strategies should we focus on to grow ridership?
Transit enhancementsTransit expansion
Pricing Land use
11
03
Many People Ride Transit... but Many Don’t
– Randy Blankenhorn, Secretary, Illinois Department of Transportation
Less than today
A significant increase
What level of investment is appropriate to pursue that vision?
Same astoday
Source: Adapted from CMAP 2016 Transit Ridership Growth Study
Whatever it takes to get
there
12 Regional Transit Strategic Plan 2018-2023: Beginning the Discussion
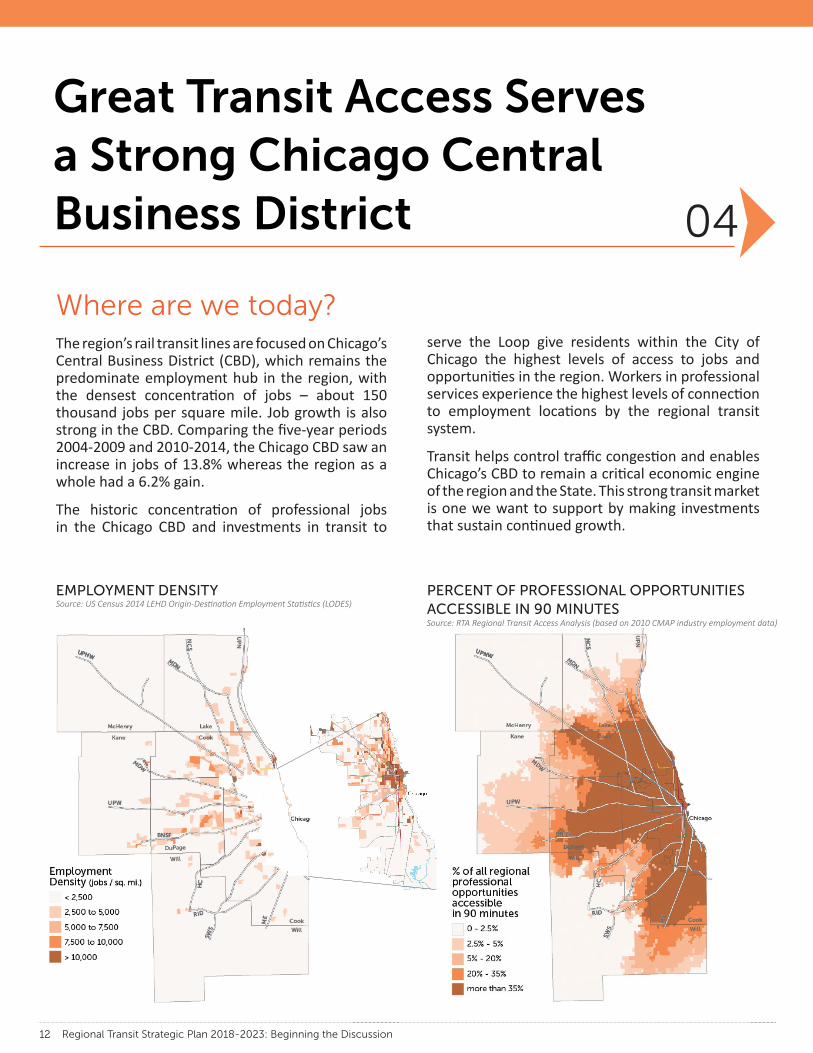
The region’s rail transit lines are focused on Chicago’s Central Business District (CBD), which remains the predominate employment hub in the region, with the densest concentration of jobs – about 150 thousand jobs per square mile. Job growth is also strong in the CBD. Comparing the five-year periods 2004-2009 and 2010-2014, the Chicago CBD saw an increase in jobs of 13.8% whereas the region as a whole had a 6.2% gain.
The historic concentration of professional jobs in the Chicago CBD and investments in transit to
Great Transit Access Serves a Strong Chicago Central Business District 04
EMPLOYMENT DENSITY PERCENT OF PROFESSIONAL OPPORTUNITIES ACCESSIBLE IN 90 MINUTES
Where are we today?serve the Loop give residents within the City of Chicago the highest levels of access to jobs and opportunities in the region. Workers in professional services experience the highest levels of connection to employment locations by the regional transit system.
Transit helps control traffic congestion and enables Chicago’s CBD to remain a critical economic engine of the region and the State. This strong transit market is one we want to support by making investments that sustain continued growth.
Source: US Census 2014 LEHD Origin-Destination Employment Statistics (LODES)
Source: RTA Regional Transit Access Analysis (based on 2010 CMAP industry employment data)

13
In order to support robust transit to the Chicago CBD, the region needs to invest in major transit infrastructure projects that will provide improvements for all riders and additional capacity for new riders. The CTA has multiple needs to help better serve the Chicago CBD, such as Blue Line capacity and traction power improvements, Brown line capacity improvements, and the Red and Purple Modernization (RPM) Program. The RPM Program is underway, but only Phase One is currently funded.
Metra needs to untangle and upgrade the A-2 interlocking where four rail lines cross at grade just west of Ogilvie Station. Union Station needs to be modernized in order to grow its capacity to handle even today’s demand, let alone the projected future growth.
Circulation throughout the Chicago CBD from train stations to River North, the West Loop, and other areas remains a challenge. The CTA operates a robust bus network but is challenged by increasing traffic congestion. All transit agencies and the Chicago Department of Transportation will need to work together to address this issue in the years following development of this Strategic Plan.
What are the best ways to fund major infrastructure projects that add capacity
to the Chicago CBD?
What would it take to get more people out of their cars and onto
transit for trips headed downtown?
Grow density and businesses to provide riders and tax revenue
Integrate roadway/transit projects to leverage synergies
Easier/cheaper connection
between modes
Incentives for using transit
Provide long term funding for robust
capital programExplore public-private
partnerships
13
TRANSIT MODESHARE FOR ALL REGIONAL WORK TRIPS
Transit
All other modes
62%
TRANSIT MODE SHARE FORCBD WORK TRIPS
04
More expensive parking
Faster circulation throughout CBD
Where are we going?
“Major investment in our transit infrastructure and the CREATE program are necessary to keep people and goods moving in
metropolitan Chicago.”
Great Transit Access Serves a Strong Chicago Central Business District
– Joe Szabo, Executive Director, CMAP
Source: CMAP Travel Tracker Survey (2009)

14 Regional Transit Strategic Plan 2018-2023: Beginning the Discussion
The region’s population has not grown significantly in the last decade. However, suburban Cook County has seen growth at a higher rate than the rest of the region in both population and employment. Much of this growth is in demographic groups that tend to have a higher propensity to use transit. This includes groups that do not own cars or own only one car, low income residents, Asians, African-Americans, and younger adults.
Where are we today?
05
Growing Markets in Suburban Cook Could Benefit Transit
25%
5%
10%
15%
20%
propensity to use transit
Sub. Cook generalpop. growth (3.3%)
Regional generalpop. growth (0.2%)
Less likely to use transit More likely to use transit
No Car
Ava
ilable
Black
or A
frica
n Am
erica
n
Low
-Inco
me
1 Car
Ava
ilable
Younger A
dults
Asian
Mid
dle-A
ge A
dults
Mid
dle to
Hig
h Inco
me
Hispan
ic or L
atin
o W
hite
Old
er A
dults
2 Car
s Ava
ilable
3 or m
ore C
ar A
vaila
ble
SUBURBAN COOK GROWTH IN POPULATIONGROUPS AND PROPENSITY TO USE TRANSIT
The older adults group is also growing—while this group is overall less likely to ride transit, they may become more dependent on transit as they age.
The combination of employment and population growth in key demographics are a notable trend occurring in suburban Cook County.
Source: RTA 2017 Regional Market Assessment (based on US Census 2005-2009 & 2010-2014 ACS 5-year estimates)

15
Growing Markets in Suburban Cook Could Benefit Transit
Suburban Cook County communities have been proactive in planning for transit improvements and transit-supportive land uses, or transit-oriented development (TOD). The majority of TOD work conducted by the RTA has been in suburban Cook County. This indicates that suburban Cook County communities are interested in supporting TOD by planning for walkable communities at rail nodes and along bus corridors, as well as by providing their residents with the ability to own fewer cars by offering mobility options and transit accessible housing.
Creative transit service solutions can also help build transit ridership and improve commute options in suburban areas. Pace’s Pulse Service and express bus network are innovative approaches to providing bus service to residents, particularly by providing improved access to suburban job centers.
While the RTA and the Service Boards do not have control over local land use, it is still prudent for us to support TOD in suburban communities. The Strategic Plan will explore strategies to reinforce TOD in suburban communities, as well as transit services that best support inter-suburban travel.
Where are we going?
05
RTA COMMUNITY PLANNING PROGRAM PROJECTS COMPLETED IN SUBURBAN COOK
15
How do we influence land use in the suburbs?
What types of transit services could better support travel within the suburbs?
Influence new developments
Provide implementation assistance
Arterial Rapid Transit /Express Bus More traditional
bus serviceAssess
impact fees
Fund planning studies
Private partnerships for last mile connections
Local, on demand service
“Cook County is extremely fortunate to have one of the largest and most extensive public transit systems in the U.S.
Supporting robust transit systems and improving the services they offer are top priorities for Cook County.”
– Toni Preckwinkle, President, Cook County
Implement pedestrian treatments
Advocate and educate Vanpools
16 Regional Transit Strategic Plan 2018-2023: Beginning the Discussion
06
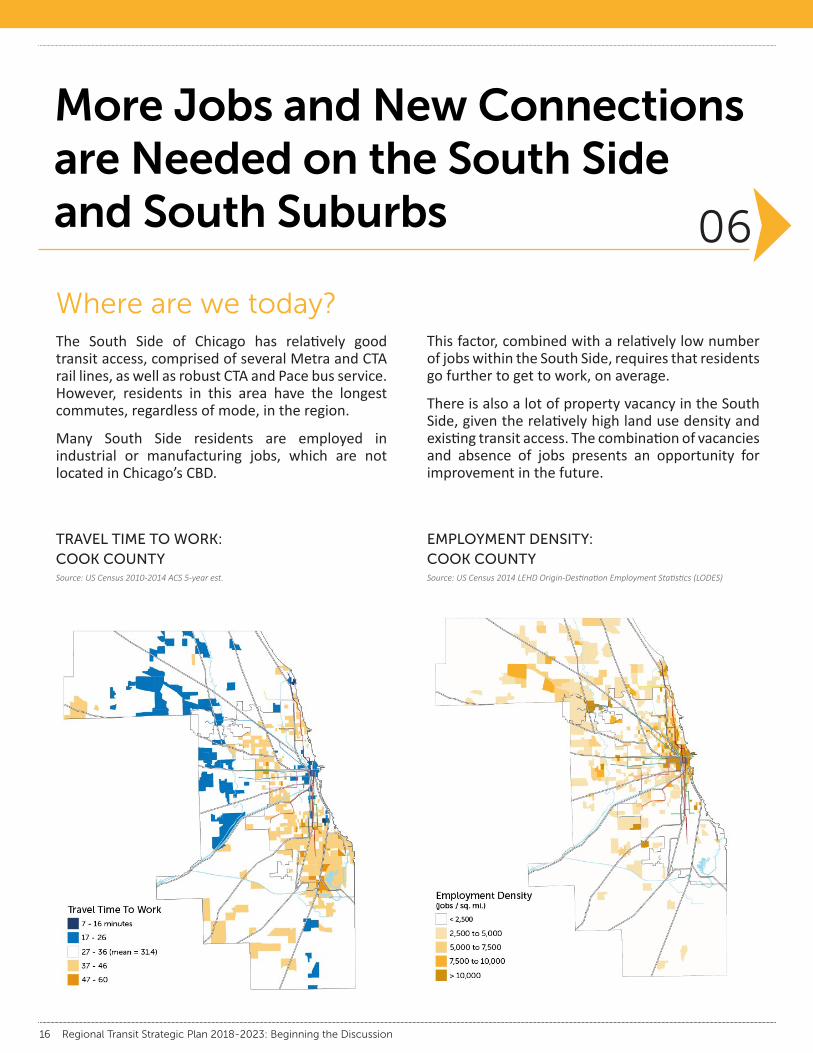
The South Side of Chicago has relatively good transit access, comprised of several Metra and CTA rail lines, as well as robust CTA and Pace bus service. However, residents in this area have the longest commutes, regardless of mode, in the region.
Many South Side residents are employed in industrial or manufacturing jobs, which are not located in Chicago’s CBD.
Where are we today?
More Jobs and New Connections are Needed on the South Side and South Suburbs
EMPLOYMENT DENSITY: COOK COUNTY
TRAVEL TIME TO WORK: COOK COUNTY
This factor, combined with a relatively low number of jobs within the South Side, requires that residents go further to get to work, on average.
There is also a lot of property vacancy in the South Side, given the relatively high land use density and existing transit access. The combination of vacancies and absence of jobs presents an opportunity for improvement in the future.
Source: US Census 2010-2014 ACS 5-year est. Source: US Census 2014 LEHD Origin-Destination Employment Statistics (LODES)

17 17
More Jobs and New Connections are Needed on the South Side and South Suburbs
There are many factors influencing the population and employment trends on the South Side – much more than just transit service. Yet the transit agencies know that access to jobs in a reasonable amount of time will be an important part of a holistic solution to economic revitalization on the South Side.
The Strategic Planning process will provide a forum to discuss the transit agencies’ approaches to improvements on the South Side, whether it be contributing to transit-oriented development, increasing local business opportunities, or focusing on the transit connections themselves.
Where are we going?AERIAL IMAGE OF VACANT LOTS NEAR THE CTA GREEN LINE- GARFIELD STATION
06
How can transit agencies support commercial land use and job growth on
the South Side?How do we improve transit
connections on the South Side?
Add workplace express servicesMore Express bus and
Arterial Rapid Transit (ART) service
Support railextensions
Develop land around stations Promote area
to developers
Upgrade existing rail services
Support local business through transit contracts
Source: NearMap 2017 imagery
17
Seek commercial TODs to create jobs
CTA Green Line- Garfield Station
“The good news is, there are new employment centers and job opportunities across the region, especially in our southern
service area. The bad news is, Pace has a very limited capacity to expand and serve new commuters without sustainable funding for
infrastructure needs, like rolling stock and facilities.” – Richard Kwasneski, Chairman of the Board, Pace

18 Regional Transit Strategic Plan 2018-2023: Beginning the Discussion
07
More Capacity is Needed on Chicago’s North Side
The North Side of the City of Chicago has high population and employment density. Employment densities in the corridor along the north Red Line approach those of the Chicago CBD.
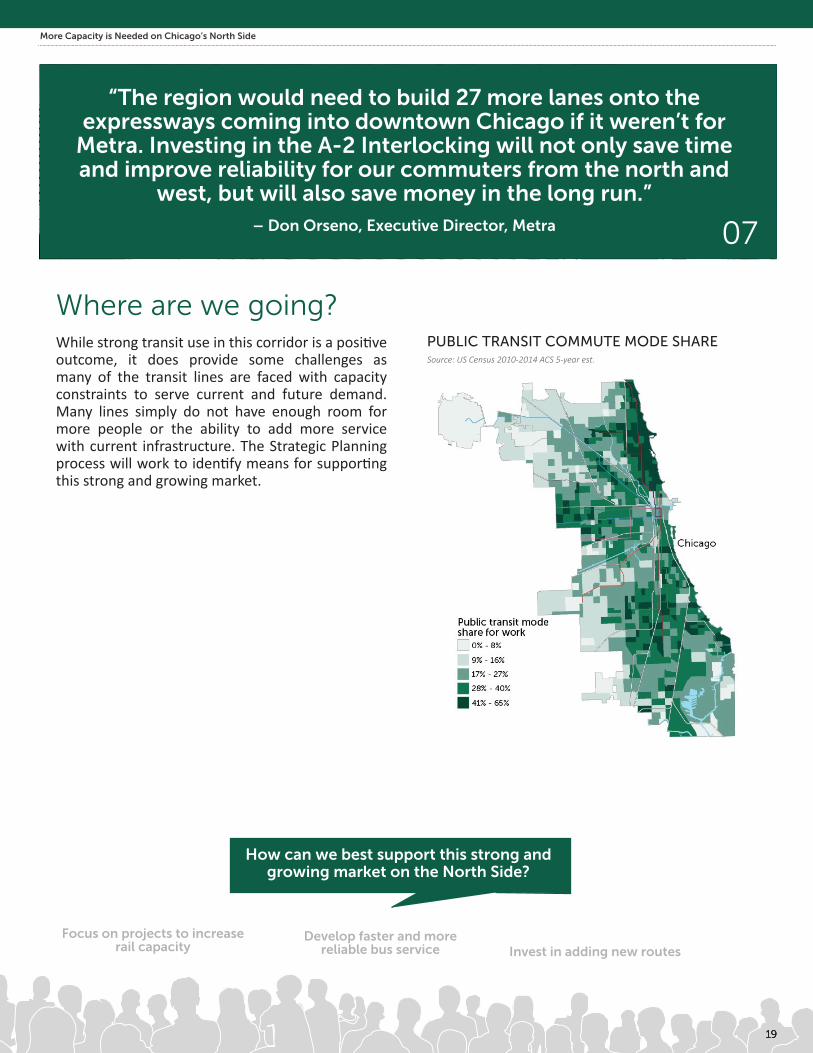
The combination of both high population and employment densities contribute to transit use in Chicago’s North Side that is higher than any other corridor in the region. Transit mode share is strong, particularly along the Red Line and North Lake Shore Drive corridors, with as much as 65% of commutes being made on transit.
Where are we today?
POPULATION DENSITY EMPLOYMENT DENSITYSource: US Census 2010-2014 ACS 5-year est. Source: US Census 2014 LEHD Origin-Destination Employment Statistics (LODES)
19 19
More Capacity is Needed on Chicago’s North Side
“The region would need to build 27 more lanes onto the expressways coming into downtown Chicago if it weren’t for
Metra. Investing in the A-2 Interlocking will not only save time and improve reliability for our commuters from the north and
west, but will also save money in the long run.”
07
While strong transit use in this corridor is a positive outcome, it does provide some challenges as many of the transit lines are faced with capacity constraints to serve current and future demand. Many lines simply do not have enough room for more people or the ability to add more service with current infrastructure. The Strategic Planning process will work to identify means for supporting this strong and growing market.
Where are we going?
19
How can we best support this strong and growing market on the North Side?
Focus on projects to increase rail capacity Invest in adding new routes
Develop faster and more reliable bus service
PUBLIC TRANSIT COMMUTE MODE SHARE
19
– Don Orseno, Executive Director, Metra
Source: US Census 2010-2014 ACS 5-year est.

20 Regional Transit Strategic Plan 2018-2023: Beginning the Discussion
08
Large Suburban Job Clusters are Difficult to Serve by Traditional Transit
20 Regional Transit Strategic Plan 2018-2023: Beginning the Discussion
Although the Chicago CBD remains the predominant employment center in the region, there is a substantial amount of employment clustered throughout the region’s suburban area.
These employment clusters are dispersed throughout the region and the majority are not located near existing transit services. Their locations are instead influenced by proximity to the expressway system and O’Hare airport.
Due to their locations and development patterns, these employment clusters and corridors are difficult to serve by transit. They are often not located in walking distance of existing rail stations and lack pedestrian access to major roadways, making safe and efficient bus service challenging. Suburban employment centers can be better served by transit when they are located near existing bus and rail service and designed to be more transit-supportive by reducing building setbacks and including pedestrian infrastructure.
Where are we today?MAJOR JOB CORRIDORS OUTSIDE CHICAGO CBDSource: RTA 2017 Regional Market Assessment, based on US Census 2014 LEHD Origin-Destination Employment Statistics (LODES) data

21 21
Large Suburban Job Clusters are Difficult to Serve by Traditional Transit
“We are working collectively with our transit providers, employers, and municipalities to develop innovative methods
to connect workers with their jobs.”
08
One of the biggest obstacles to serving these suburban employment clusters with traditional transit is the dispersed patterns of development, both where people live and work. Also, parking is generally free and convenient, undermining the value of affordable public transit. The land use patterns typical of suburban employment clusters make transit in the form of bus or van services
Where are we going?
21
What can agencies do to shape land use and mobility in suburban commercial areas?
Provide assistancefor TOD Continue the push
for shuttlesFocus service on densest corridors
Adopt apps and tech innovations
Educate and partner with employers
– Dan Cronin, Chairman, DuPage County
most sustainable, but only with a commitment by communities to provide sidewalks, shelters, and other pedestrian amenities that make it possible for people to take transit in these environments. Through the Strategic Planning process, we will work to identify partnerships, land use changes, and services that are practical for connecting these suburban developments to the transit system.
LAND USE DENSITIES NEEDED TO SUPPORT TRANSITSource: RTA Setting the Stage for Transit, emphasis added
Pace Community Based Transit
CTA Fixed Route BusArterial Bus Rapid
TransitCTA Rail
OPTIMUM DENSITY NEEDED
2 DU* Per Acre 4 DU* Per Acre 8 DU* Per Acre + Retail 8 DU* Per Acre 15 DU* Per Acre + Retail 12 DU* Per Acre
RE
TA
IL
* DU = Dwelling Units
RETAIL
12 Unit Condo
1 Acre Site
Metra Commuter RailPace Fixed Route Bus
1 Acre Site 1 Acre Site1 Acre Site1 Acre Site1 Acre Site

22 Regional Transit Strategic Plan 2018-2023: Beginning the Discussion
09
Millennials and Boomers Push Transit to Adapt
22 Regional Transit Strategic Plan 2018-2023: Beginning the Discussion
Millennials today live in greater numbers within the City of Chicago, but recent changes show they are beginning to move to the suburbs. This group today has a higher use of transit than average.
The long-term impact of technology and new mobility options on transit ridership is unknown, but there is hope that innovation and cultural changes will keep this demographic group riding transit as they move into their next phase of life.
Where are we today?The region is also aging, with an overall increase in the percent of the population over 65. Growth in the older adult population has been primarily in the suburbs and collar counties, plus Chicago’s downtown. This is likely to lead to an increase in demand for paratransit services, including local Dial-a-Rides and ADA complementary service, which are some of the region’s most complicated and expensive services to provide.
AGE 20-34 POPULATIONPERCENT CHANGE
AGE 65+ POPULATIONPERCENT CHANGE
Source: US Census 2005-2009 & 2010-2014 ACS 5-year estimates Source: US Census 2005-2009 & 2010-2014 ACS 5-year estimates
23 23
Millennials and Boomers Push Transit to Adapt
“As a lifelong transit rider, and an elected official in our State for two decades, I know firsthand the value and necessity of public
transportation in our region. It is critical to our economy and to the growing numbers of millennials in our region who comprise the
talented and hardworking labor force today’s companies require.”
09
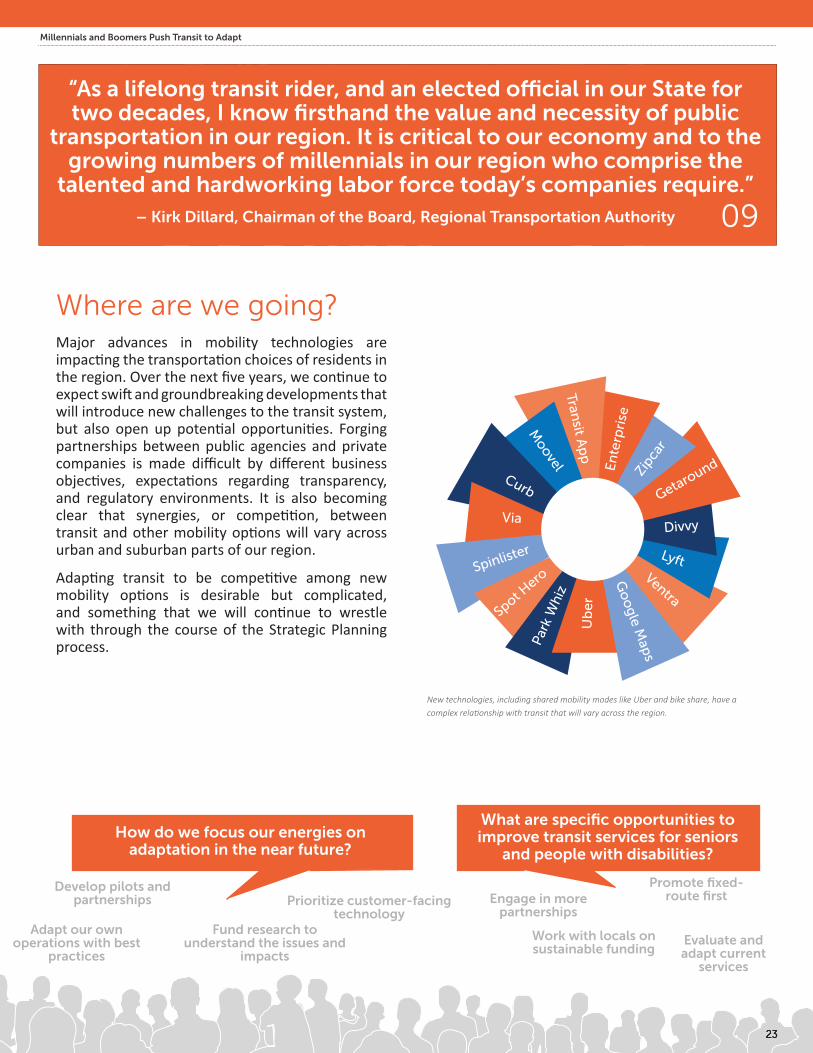
Major advances in mobility technologies are impacting the transportation choices of residents in the region. Over the next five years, we continue to expect swift and groundbreaking developments that will introduce new challenges to the transit system, but also open up potential opportunities. Forging partnerships between public agencies and private companies is made difficult by different business objectives, expectations regarding transparency, and regulatory environments. It is also becoming clear that synergies, or competition, between transit and other mobility options will vary across urban and suburban parts of our region.
Adapting transit to be competitive among new mobility options is desirable but complicated, and something that we will continue to wrestle with through the course of the Strategic Planning process.
Where are we going?
23 23 23
How do we focus our energies on adaptation in the near future?
What are specific opportunities to improve transit services for seniors
and people with disabilities?
Adapt our own operations with best
practices
Engage in morepartnerships
Evaluate and adapt current
services
Develop pilots and partnerships
Work with locals on sustainable funding
Promote fixed-route firstPrioritize customer-facing
technology
New technologies, including shared mobility modes like Uber and bike share, have a complex relationship with transit that will vary across the region.
Fund research to understand the issues and
impacts
Zipc
ar
Go
og
le Map
s
LyftVentra
Divvy
GetaroundEn
terp
rise
Ub
er
Moovel
Curb
Transit A
pp
SpinlisterP
ark
Whi
z
Spot Hero
Via
– Kirk Dillard, Chairman of the Board, Regional Transportation Authority

Regional Transit Strategic Plan2018-2023
What’s Next?The transit agencies will use this data and feedback from stakeholders to develop the plan over the next several months. Visit http://strategicplan.rtachicago.orgthe Regional Transit Strategic Plan project website, for updates throughout 2017.
Throughout 2017, transit agency staff will also be collaborating with the Chicago Metropolitan Agency for Planning (CMAP) as CMAP develops ON TO 2050, the next regional comprehensive plan that will cast a long-term vision for the region. The ON TO 2050 development process includes extensive public outreach and several workshops that will be used as a forum for collecting public input related to the transit system. Visit www.cmap.illinois.gov for a list of public events and opportunities to participate.