regional subcultures of the united states
TRANSCRIPT

Cleveland State University Cleveland State University
EngagedScholarship@CSU EngagedScholarship@CSU
Political Science Faculty Publications Political Science Department
11-1993
Regional Subcultures of the United States Regional Subcultures of the United States
Joel A. Lieske Cleveland State University, [email protected]
Follow this and additional works at: https://engagedscholarship.csuohio.edu/clpolsci_facpub
Part of the Political Science Commons
How does access to this work benefit you? Let us know! How does access to this work benefit you? Let us know!
Publisher's Statement Copyright 1993 Cambridge University Press. Available on publisher's site at
http://journals.cambridge.org/abstract_S0022381600076234.
Original Citation Original Citation Lieske, Joel. 1993. "Regional Subcultures of the United States." Journal of Politics 55:888-913.
Repository Citation Lieske, Joel A., "Regional Subcultures of the United States" (1993). Political Science Faculty Publications. 11. https://engagedscholarship.csuohio.edu/clpolsci_facpub/11
This Article is brought to you for free and open access by the Political Science Department at EngagedScholarship@CSU. It has been accepted for inclusion in Political Science Faculty Publications by an authorized administrator of EngagedScholarship@CSU. For more information, please contact [email protected].

Regional Subcultures of the United States
Joel Lieske Cleveland State University
This study develops the case, theory, and statistical methodology for a new measure of American regional subcultures. Using principal component and cluster analysis on some 45 measures of racial origin, ethnic ancestry, religious affiliation, and social structure, I show how the entire population of U.S. counties can be partitioned into 10 distinctive, regional subcultures that are relatively homoge- neous and contiguous. Next, I identify the cultural characteristics of each subculture and relate my new classification scheme to the work of Elazar, Gastil, Garreau, and Fischer. Finally, I compare the relative utility of this new measure with Elazar's typology in explaining the variation in a number of social, political, and policy indicators.
More work, in our view, needs to be done, to ascertain whether the cultural clusters that Elazar designates do indeed exist (either at the mass or elite level). This step, it seems to us, should precede attempts to link public policy outputs with political cultures. Unfortu- nately most work has started with the second step and assumed the first. (Thompson, Ellis, and Wildavsky 1990, 245)
]wenty-seven years ago, Elazar (1984) advanced a revolutionary new theory of American regional subcultures. This new theory was designed to help explain variations in the political processes, institutional structures, political behavior, and policies and programs of state and local government. In short, Elazar argued that subcultural differences could help us understand: (1) what state and local govern- ments do, (2) how they are organized, (3) what political rules they observe, and (4) who participates in the political process (Press and VerBurg 1983).
To expedite this task, Elazar developed a geopolitical mapping of the United States that classifies states and local regions into one or a combination of three political subcultures: individualistic, moralistic, and traditionalistic. In Elazar's typology, there are a total of nine different subcultural classifications that repre- sent dominant and subordinate combinations of his three "core" subcultures. His mapping includes some 50 state and 224 substate designations.
Since Elazar advanced his theory, other scholars have developed their own cul- tural classification schemes and produced their own cultural mappings of the
This study owes a heavy intellectual debt to Dan Elazar, Aaron Wildavsky, and my departed friend and colleague, Tom Flinn. None of these individuals, of course, bears any responsibility for any errors of analysis or interpretation. I also wish to thank Elazar, the Center for the Study of Federalism at Temple University, and Cleveland State University for their financial support of my research.
THE JOURNAL OF POLITICS, Vol. 55, No. 4, November 1993, Pp. 888-913 C 1993 by the University of Texas Press

Regional Subcultures of the United States 889
United States (Luttbeg 1971; Zelinsky 1973; Gastil 1975; Garreau 1981; Morgan and England 1987). However, Luttbeg's (1971) and Morgan and England's (1987) classification schemes are the only mappings based on replicable, statistical proce- dures. And Elazar's (1984) typology is the only one that has been subjected to extensive empirical tests.
In reviewing this literature, Kincaid and I (1991) identify approximately 100 stud- ies that have subjected Elazar's thesis or a subcultural variation to empirical tests (e.g., Sharkansky 1969; Weber and Shaffer 1972; Johnson 1976; Joslyn 1980; Lowery and Sigelman 1982; Herzik 1985; Fitzpatrick and Hero 1988; Nardulli 1990; Morgan and Watson 1991; Dran, Albritton, and Wyckoff 1991). But as we note, one of the most frequent criticisms made of this developing literature con- cerns the difficulties of measuring political culture. It is well-known that Elazar's derivation of the three political subcultures is not based on any rigorous statistical procedures. Neither are his geopolitical designations based on any empirical data, other than historical migration patterns, personal field observations, interviews, and scholarly studies of America's regions2_sections, and ethnoreligious groups. Moreover, Elazar has not adjusted his mapping of the three subcultures for the pervasive cultural changes that have occurred in American society. Indeed, his concept of "cultural geology" allows for overlay and change. But his state and sub- state classifications are the same today as they were 27 years ago.
Yet another criticism of Elazar's classification scheme is the crudeness of his state and regional designations. According to Elazar (1970, 236), political culture can be defined as the persistent, generational patterns of political attitudes, values, beliefs, and behavior that characterize a group of people who live in geographical proximity. But what constitutes distinctive subcultures is often a very subjective judgment. And when the geographical boundaries of a subculture include entire states or large substate regions, there is not a great deal of empirical precision. Since the county is the basic unit of state government, it would seem desirable to develop measures that differentiate American subcultures at least down to the county level.
A final criticism of many cultural classification schemes, including Elazar's, is their circularity. Thus, it is often alleged that Elazar's typology relies, in part, on information about past political behavior to predict current or future political be- havior. To get around this difficulty, Kincaid and I (1991) have proposed the development of new subcultural measures exclusively based on what Elazar has called the "sources" of political culture such as racial origin, ethnic ancestry, religious affiliation, and social structure. This focus would exclude from the derivation of any new measures the confounding "manifestations" and "effects" of culture, i.e., political behavior and institutional arrangements.
The purpose of this study is to develop and analyze a new measure of American subculture that has these properties:
1. It is derivable from an explicit and replicable set of mathematical and statistical algorithms.

890 Joel Lieske
2. It reflects current cultural conditions. 3. It distinguishes subcultural differences down to the county level. 4. It is based entirely on "nonpolitical" measures of American culture.
To achieve these objectives, I will first discuss the theoretical logic that undergirds my new measure. Next I will present the statistical methodology on which it is based. After this, I will discuss the distinguishing characteristics of each sub- culture and relate my classification scheme to the work of Elazar (1984), Gastil (1975), Garreau (1981), and Fischer (1989). Finally, since Elazar's typology is the only one that has been subjected to extensive empirical analysis, I will test the em- pirical utility of my new measure relative to his. This will be done by comparing their relative ability to explain the variation in a number of social, political, and policy indicators.
A MODEL OF AMERICAN REGIONAL SUBCULTURES
As Kincaid and I (1991) argue elsewhere,1 the peoples who settled the United States came with distinctive ethnoreligious identities, cultural preferences, and ways of life (Fischer 1989). In most cases, these traditions shaped both their choices of and responses to the environment. Generally, groups settled in clusters, not as randomly dispersed individuals. And as they pushed inland, as in the west- ward migration of British-Americans across the entire continent, they took with them and transmitted to future generations the values, beliefs, attitudes, and behavior of their forebears (Holbrook 1950). Moreover, given the pervasiveness of local self-goverment that constituted the American democratic experiment, groups could give significant social and political expression to their cultural pref- erences within geographically defined political jurisdictions, namely, towns, town- ships, cities, and counties (Kincaid 1982). This gave an advantage to the early settlers who founded the first local and state governments (Zelinsky 1973; Gastil 1975). Unless they could numerically overwhelm these early settlers, later arrivals had to contend with and adapt themselves to existing social and political power structures.
Based on this historical record, American subcultures should be dispersed, but not balkanized, across the country in explicable patterns or mosaics that are rooted in political jurisdictions. In addition, single subcultures or distinctive multicul- tural blends should be found in most local jurisdictions because most states were settled and developed by diverse groups that clustered geographically within sub- state regions. Finally, the continuity and persistence of these local subcultures is predicated on two characteristic features of American social and political culture: ethnoreligious socialization and federal democracy.
For most Americans, socialization occurs within the ethnoreligious kinship and neighborhood ties of small and medium-size jurisdictions. Even in large cities,
' This section draws on the ideas and contributions of John Kincaid to this paper.

Regional Subcultures of the United States 891
ethnoreligious groups tend to cluster in neighborhoods and ethnic enclaves, the so-called "turfs" of urban society, if not also in precincts, wards, and legislative districts. Thus, unless the mix of ethnoreligious groups changes or a dominant group is displaced, the prevailing subculture is contained within a bounded set of economic and social relationships that can be communicated across generations (Kincaid 1980; Lieske 1990).
Federal democracy, in turn, has long entailed substantial local self-government and therefore has served, until recently, to bolster local autonomy and control. This has enabled jurisdictionally based subcultures to institutionalize their cul- tural preferences, as reflected in local control of law enforcement practices and state control of social welfare services. Current trends in the federal system, how- ever, both constrain and expand the ability of state and local governments to give expression to their cultural preferences in public institutions and policies. On the one hand, there has been an unprecedented increase since the 1960s in the federal preemption of state and local powers and federal mandating of state and local poli- cies (Kincaid 1990). On the other hand, the federal government has restored, or continued to allow, state and local discretion in a number of areas, such as "the new judicial federalism." Under this doctrine state courts may rely on their state constitutions to grant broader protections in the culturally sensitive area of rights than the U.S. Supreme Court is willing to grant under the federal Constitution (Collins, Galie, and Kincaid 1986).
In sum, patterns of settlement and local self-governance in the United States have nurtured the evolution and development of jurisdictionally based subcul- tures. Thus, different ethnoreligious groups, interacting with their environments, have been able to translate their cultural preferences into relatively stable social relationships within substantially self-governing jurisdictions. These relation- ships, in turn, reinforce the dominant cultural preferences in an area and provide bounded nests for enduring patterns of socialization, communication, and action. At the same time, migration, pluralism, Americanization, and diverse frontier conditions created different cultural mixes and responses, thereby giving rise to subcultures rather than to the very distinct, territorial-based cultures found in countries such as India and Yugoslavia. Regional subcultures, then, are the prod- ucts of historical interactions between the cultural preferences of different ethno- religious settler groups and the nationally centripetal and regionally centrifugal demands of their environments. Therefore, they represent the historical exten- sions of earlier settlement patterns and the continuing advantages of the first ef- fective settler groups (i.e., the founding groups) over later arrivals (i.e., newer groups) who are placed in the culturally subordinate position of challenging social conventions and tradition.
Following Wildavsky's (1987) concept of "general" culture, as opposed to Elazar's (1970) concept of "political" culture, I view a subculture as a "way of life" and system of shared values that legitimate a preferred set of social relationships. Conceptually, cultural preferences are derived from the learning that occurs

892 Joel Lieske
within the web of social relationships in which people are embedded and on which they are especially dependent during their formative years. According to Dreitzel (1977) and Wildavsky (1987), a culture shapes preferences by answering three fundamental questions: (1) Who am I? (2) How should I behave? and (3) What is legitimate? Thus, culture provides individuals with their basic social identities (the identity function), norms for socially acceptable behavior (the boundary- maintenance function), and standards for judging social institutions (the legitimat- ing function). Presumably, these functions are realized primarily through people's racial and ethnic kinship ties, religious or secular value systems, and social ways of life and life-styles. Conceptually, these socializing agents define the cultural con- text, or subculture, that shapes individual preferences and behavior.
In figure 1, I present a causal framework depicting these assumptions. In this model, racial-ethnic ancestries and religious affiliations are assumed to be the pri- mary carriers of subcultural differences (Elazar 1970). Throughout history, social differences have been defined largely by differences in racial-ethnic and religious background. Race and ethnicity represent the accumulated learning or history of a people who share a common ancestral identity and usually a language or dialect.
FIGURE 1
A SUBCULTURAL MODEL OF SOCIAL AND POLITICAL BEHAVIOR
Social Structure
Race-Ethnic
Ancestry\
Social and Political
Behavior
Religious Affiliation
Regional Subculture

Regional Subcultures of the United States 893
Religion is a formal belief system that endeavors to organize social relationships according to its tenets.
Social structures, in turn, serve to define alternative ways of life or social life- styles. They represent the institutionalized social preferences of different racial- ethnic and religious groups. However, they also reflect the influence of certain environmental constraints, such as geography, climate, and the local economy. Thus, the work of many cultural theorists (Elazar 1970; Kleppner 1970; Gastil 1975; Garreau 1981; Fischer 1989; Leege, Lieske, and Wald 1991) and behavioral researchers (Lazarsfeld, Berelson, and Gaudet 1944; Laswell and Kaplan 1950; Campbell, Converse, Miller, and Stokes 1960) suggests that many differences in social life-style result from a mix of ethnoreligious, environmental, and economic conditions. These include: (1) the advance of urbanization and industrialization, (2) the persistence of agrarian traditions, (3) population mobility, (4) social status, (5) social inequality, (6) family structure, (7) life cycle, and (8) cultural homogeneity. To the extent social relationships embody the institutionalized social preferences of different racial-ethnic and religious groups, they constitute a culture's preferred way of life. Finally, a regional subculture can be conceptualized as a weighted sum of the racial-ethnic identifications, religious attachments, and social relationships that characterize a group of individuals who live in geographical proximity.
Data and Method
The sample consists of all 3,164 U.S. counties. The data were drawn from the 1980 census and the 1980 Glenmary (1982) survey of American church bodies. To represent the variables in the cultural model, I selected 5 indicators of racial ori- gin, 11 indicators of ethnic ancestry, 14 indicators of religious affiliation, and 15 in- dicators of social structure. The racial and ethnic indicators contain the major groups tabulated in the 1980 census; while the religious indicators embrace the 13 largest Christian denominations in the United States plus conservative and re- form Judaism. About 99 million Americans, or 43.7% of the total population in 1980, are affiliated with these church bodies. According to estimates developed by Wald (1987), this figure represents 85.8% of all church members in the United States. Finally, the structural indicators were selected to measure differences in the factors hypothesized to have the greatest influence in defining social ways of life and life-styles.
The five racial indicators include: (1) percent white, (2) percent black, (3) per- cent Asian, (4) percent Native American, and (5) percent Spanish-speaking.2 The 11 ethnic indicators include: (1) percent British, (2) percent German, (3) percent Irish, (4) percent French, (5) percent Italian, (6) percent Slavic, (7) percent Scan- dinavian, (8) percent Russian, (9) percent Hungarian, (10) percent Portuguese, and (11) percent Greek. The 14 religious indicators include: (1) percent Catholic,
2Strictly speaking, Spanish-speaking is not a racial but a linguistic designation, since Spanish- speaking can be of any group. However, most Spanish-speaking Americans are thought to be mestizo, i.e., of mixed European and Native American ancestry.
894 Joel Lieske
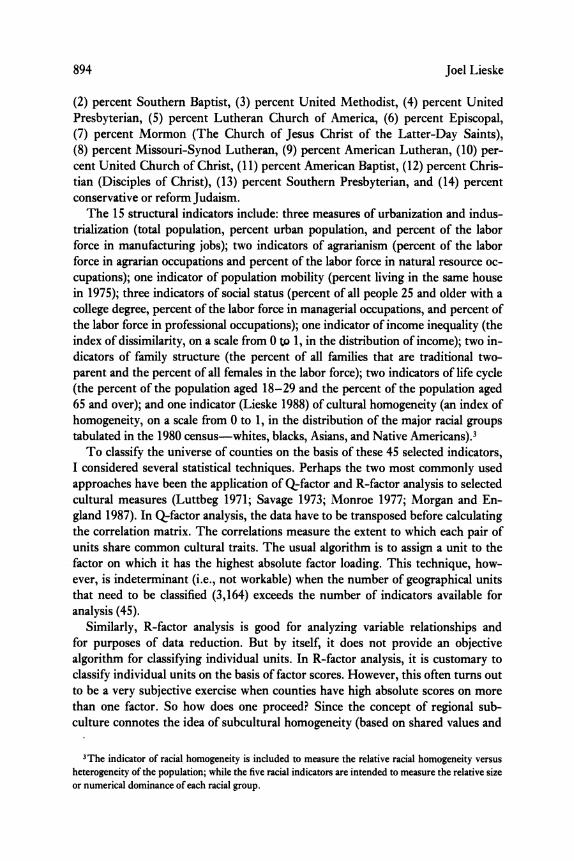
(2) percent Southern Baptist, (3) percent United Methodist, (4) percent United Presbyterian, (5) percent Lutheran Church of America, (6) percent Episcopal, (7) percent Mormon (The Church of Jesus Christ of the Latter-Day Saints), (8) percent Missouri-Synod Lutheran, (9) percent American Lutheran, (10) per- cent United Church of Christ, (11) percent American Baptist, (12) percent Chris- tian (Disciples of Christ), (13) percent Southern Presbyterian, and (14) percent conservative or reform Judaism.
The 15 structural indicators include: three measures of urbanization and indus- trialization (total population, percent urban population, and percent of the labor force in manufacturing jobs); two indicators of agrarianism (percent of the labor force in agrarian occupations and percent of the labor force in natural resource oc- cupations); one indicator of population mobility (percent living in the same house in 1975); three indicators of social status (percent of all people 25 and older with a college degree, percent of the labor force in managerial occupations, and percent of the labor force in professional occupations); one indicator of income inequality (the index of dissimilarity, on a scale from 0 to 1, in the distribution of income); two in- dicators of family structure (the percent of all families that are traditional two- parent and the percent of all females in the labor force); two indicators of life cycle (the percent of the population aged 18-29 and the percent of the population aged 65 and over); and one indicator (Lieske 1988) of cultural homogeneity (an index of homogeneity, on a scale from 0 to 1, in the distribution of the major racial groups tabulated in the 1980 census-whites, blacks, Asians, and Native Americans).3
To classify the universe of counties on the basis of these 45 selected indicators, I considered several statistical techniques. Perhaps the two most commonly used approaches have been the application of Q-factor and R-factor analysis to selected cultural measures (Luttbeg 1971; Savage 1973; Monroe 1977; Morgan and En- gland 1987). In Q-factor analysis, the data have to be transposed before calculating the correlation matrix. The correlations measure the extent to which each pair of units share common cultural traits. The usual algorithm is to assign a unit to the factor on which it has the highest absolute factor loading. This technique, how- ever, is indeterminant (i.e., not workable) when the number of geographical units that need to be classified (3,164) exceeds the number of indicators available for analysis (45).
Similarly, R-factor analysis is good for analyzing variable relationships and for purposes of data reduction. But by itself, it does not provide an objective algorithm for classifying individual units. In R-factor analysis, it is customary to classify individual units on the basis of factor scores. However, this often turns out to be a very subjective exercise when counties have high absolute scores on more than one factor. So how does one proceed? Since the concept of regional sub- culture connotes the idea of subcultural homogeneity (based on shared values and
3The indicator of racial homogeneity is included to measure the relative racial homogeneity versus heterogeneity of the population; while the five racial indicators are intended to measure the relative size or numerical dominance of each racial group.

Regional Subcultures of the United States 895
ways of life), one might try to group counties on the basis of common cultural characteristics.
One well-known technique for accomplishing this objective is cluster analysis. While there are a large number of clustering algorithms, perhaps the most useful for large data sets (from 100 to 100,000 units) is a variation of a method developed by Anderberg (1973). This method, called FASTCLUS, employs a technique of classifying or sorting units on the basis of their spatial or Euclidean distance to the nearest cluster centroid.4 First, a set of points called "cluster seeds" is selected as a first approximation to the means of the clusters. Next, each unit is assigned to the nearest seed to form temporary clusters. The means of these temporary clusters are then used to replace the cluster seeds, and the process is repeated iteratively. The iterations stop when the conditions set by the researcher are met and no fur- ther changes occur in the clusters. These conditions concern such matters as the maximum number of clusters that are allowed, the minimum number of units that are permitted to define a separate cluster, and the convergence criteria that stop the iterative process (SAS 1985, 377-79).
Thus, FASTCLUS greatly facilitates the-execution of a disjoint cluster analysis on the basis of Euclidean distances computed from one or more quantitative vari- ables. Unfortunately, the clusters are often difficult to interpret. And if there are a large number of grouping variables, the clustering process does not always produce parsimonious solutions. To circumvent these difficulties, I first employed principal component analysis with varimax rotation. Like other factor analytic techniques, principal component analysis can transform the variation in a large number of indi- cators to a reduced set of factors whose meanings can be easily inferred from the in- dicators with the largest loading coefficients. An added advantage of this technique is that the reduced set of factors are unique and orthogonal to each other. Then I used the derived factors (actually factor scores) as input variables to the cluster analysis. The output from the cluster analysis consists of county groupings or clus- ters (generally fewer in number than the input factors) that share common cultural characteristics. To interpret and label these clusters (i.e., relate them to the derived factors), I first created dummy variables for each cluster. Thus, a county was as- signed a value of one if it belonged to a given cluster, zero otherwise. Then I corre- lated each of the cluster dummies with the input factors. In this way, it is possible to match or associate each cluster with its defining factor(s).
RESULTS
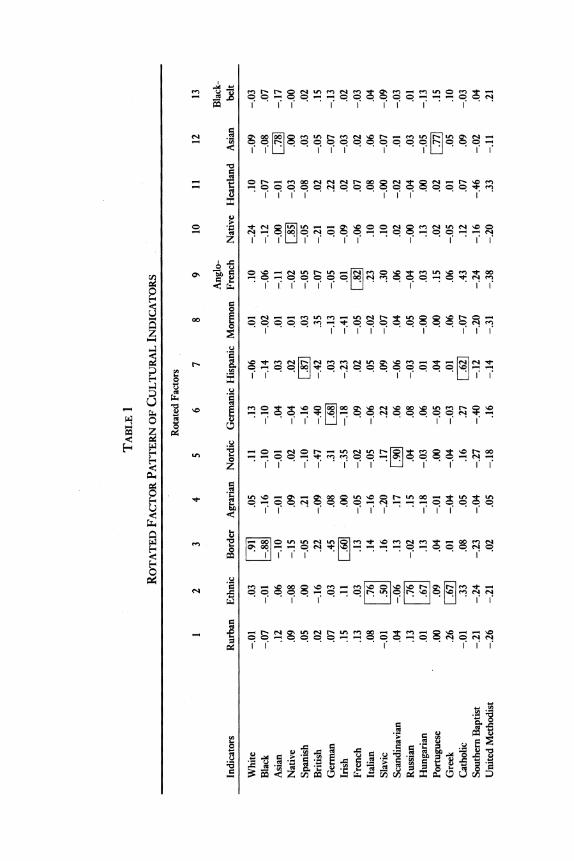
The results of first performing a principal component analysis on the 45 cul- tural indicators discussed earlier and then rotating them using the vari- max method are presented in table 1.5 The tabulated data show that the selected
40ne major advantage of the FASTCLUS procedure is that its initialization process makes it sensi- tive to outliers.
5Inspection of a scree plot of the eigenvalues and their associated cumulative explained variances suggested setting a minimum eigenvalue of 0.98.
t - en 00 eq e1 eq r- 00 C,, c" r- go m
_ . . . . 0 O . . O . . 0 . . . O . . . O . O . . .
U: 0s 4 S 0 ~~o -1 ul r- ul
om en UM "o en O- z mO
z ~ ~~~~~ S . O. O. O. O.
. O. O. O.
. O.
. g, O. O.
. .
. ~ ~~ . .
.....
H~~~~~~ 00 (- _o o0 "o Ln oen NO ,og t. x>Y
g ~ ~~~~ F, 1omONs,!e+ o~~~~~~~~c
p! ~ ~ ~ ~~L . o (: _ . 00 oo g e o olol UM 9t^< Ln _
N = o. o. oo. . . o. . o. o. . ]g . . . s .
.
.'1 . . . .. . . . 1- . . . . . 1- 1- 1-
X,q4*0
8 ̂ i ? z & W O c B 2 Y a | a 2 ;: r '~~~~~~~~~~~~~~4-

= sW - eq Ln v r- tn 00 C.4 en (4 (.4 en Rl c eq CD
00 e4 (1-4 LAI -4," CD CD CD (= = (= (= CD . . . . . . . . . . . . . . . . . . . . .
r- Ln r- en en m Ln (,4 qt 00
en U) LA') 00 m tAn 'd, c,4 m
tn C14 C14 en r- en C4 ei CD 4=
Ln 8 Ln en S CNI en Ln en 00
C4 nD ,0,0 Ln
en
00 00 00 00 Ul) en Ln en Ln 00 r- en U113 10 (= = - e"I en e"I CD CD = C4 - = (= 0, Ln
. . . . . . . . . . . . . . . . . . . e4
Ln (11.4 Ln 'IC en (14 en Ln Ul) CD - (Z (= 00
. . . . . . . . . . . .
. . . . . . . . . .
m Ln e'j a- en
t," Ln
U" 4, ul r- 00 CK en U un en r- "o = = --I -q -i --! = = C14 . . . . . . . . .
. . . .
un C4 FiZZ-=7 Ln
en 1 1 m*l "7nN
un so C7, z ull 'IR oq Ln
4w f4.
=1 u 0-4

898 Joel Lieske
indicators reduce to 13 orthogonal factors, which explain 71% of the cumulative variance. The cell entries consist of the computed factor loadings on each indi- cator. The enclosed boxes, which indicate all loadings more than .5 in absolute value, identify those indicators that have the greatest effect on each factor.
The first rotated factor is labeled as a "Rurban" factor since it loads strongly on those characteristics that Elazar (1984) has associated with the emergent "rurban- cybernetics" frontier, namely, rural-urban habitats, high levels of education, pro- fessional and managerial occupations, working women, population mobility, and younger populations. This cultural stream is generally found in pastoral academic settings and in the less populated states west of the Mississippi.
The second factor, labeled "Ethnic," represents a diverse polyglot of ethnic groups that are concentrated in the largest and most urbanized metropolitan areas of the United States. Included in this stream are groups who claim Italian, Slavic, Russian, Hungarian, and Greek ancestry as well as religious affiliation with the reform and conservative traditions of Judaism.
For reasons which will become more evident, the third factor is labeled as a "Border" stream. This factor loads strongly on counties that are predominantly white; include significant concentrations of residents whose ancestors came from the "border" regions of Great Britain, such as the (Scotch)-Irish (Fischer 1989); are egalitarian in social structure; and favor traditional family-oriented life-styles.
The fourth factor is labeled "Agrarian" because of its high positive loadings on the relative sizes of the work force engaged in agriculture and the extraction of natural resources. Since these economic sectors are generally characterized by a high degree of economic concentration and a low division of labor, this factor also loads highly on the indicator of income inequality.
The fifth factor, a "Nordic" stream, is typified by high densities of residents who claim Scandinavian ancestry and who belong to the American Lutheran Church, the church body that united a number of small Lutheran synods with former ties to the old state churches of Scandinavia. Similarly, the "Germanic" stream is associated with residents of German ancestry, many of whom claim membership in the Missouri-Synod Lutheran Church and the United Church of Christ. The former church body used to be called the German Lutheran Church; while the latter represents the merger of the New England-based Congregational Church with the largely midwestern-based Evangelical and Reformed Church, a Calvinist body formed by German and Dutch immigrants to Pennsylvania (Cas- sels 1965, 114-15).
In like manner, the sixth factor may be interpreted as a "Hispanic" stream since it loads strongly on the relative size of Spanish-speaking residents, many of whom are affiliated with the Catholic Church. On the other hand, the "Mormon" stream can be identified on the basis of a single tag, namely, membership in The Church of Jesus Christ of the Latter-Day Saints. Similarly, French ancestry serves as an identifying marker for the "Anglo-French" factor, but this stream is also asso- ciated with Americans who claim British ancestry.
Regional Subcultures of the United States 899
TABLE 2
GOODNESS OF FIT DIAGNOSTICS
Cluster Summary
Max. Seed Nearest Centroid Cluster Freq. RMS Std. Dev. Distance Cluster Distance
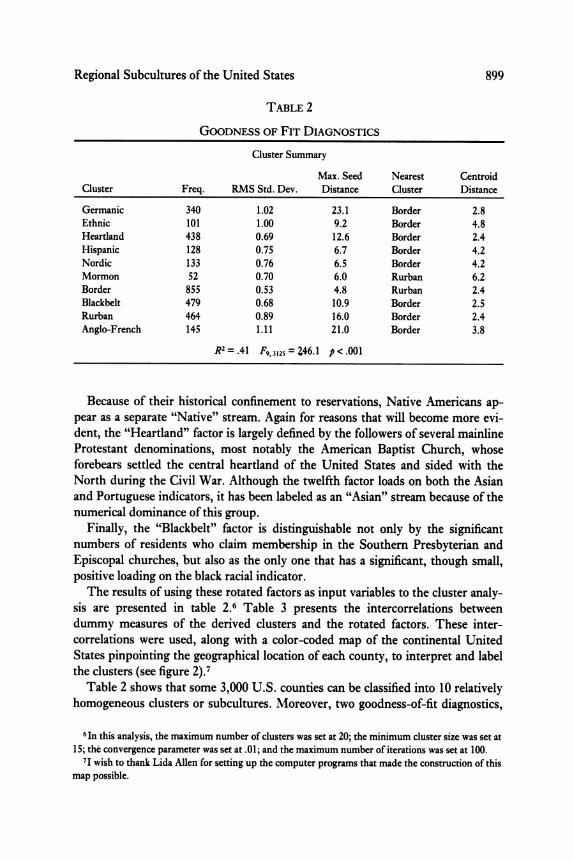
Germanic 340 1.02 23.1 Border 2.8 Ethnic 101 1.00 9.2 Border 4.8 Heartland 438 0.69 12.6 Border 2.4 Hispanic 128 0.75 6.7 Border 4.2 Nordic 133 0.76 6.5 Border 4.2 Mormon 52 0.70 6.0 Rurban 6.2 Border 855 0.53 4.8 Rurban 2.4 Blackbelt 479 0.68 10.9 Border 2.5 Rurban 464 0.89 16.0 Border 2.4 Anglo-French 145 1.11 21.0 Border 3.8
R2 =.41 F9,3125 =Z46.1 p <.001
Because of their historical confinement to reservations, Native Americans ap- pear as a separate "Native" stream. Again for reasons that will become more evi- dent, the "Heartland" factor is largely defined by the followers of several mainline Protestant denominations, most notably the American Baptist Church, whose forebears settled the central heartland of the United States and sided with the North during the Civil War. Although the twelfth factor loads on both the Asian and Portuguese indicators, it has been labeled as an "Asian" stream because of the numerical dominance of this group.
Finally, the "Blackbelt" factor is distinguishable not only by the significant numbers of residents who claim membership in the Southern Presbyterian and Episcopal churches, but also as the only one that has a significant, though small, positive loading on the black racial indicator.
The results of using these rotated factors as input variables to the cluster analy- sis are presented in table 2.6 Table 3 presents the intercorrelations between dummy measures of the derived clusters and the rotated factors. These inter- correlations were used, along with a color-coded map of the continental United States pinpointing the geographical location of each county, to interpret and label the clusters (see figure 2).7
Table 2 shows that some 3,000 U.S. counties can be classified into 10 relatively homogeneous clusters or subcultures. Moreover, two goodness-of-fit diagnostics,
6In this analysis, the maximum number of clusters was set at 20; the minimum cluster size was set at 15; the convergence parameter was set at .01; and the maximum number of iterations was set at 100.
'I wish to thank Lida Allen for setting up the computer programs that made the construction of this map possible.

.; . . . o . o . . . . . .
Lo% " go C4 o ooo
. L I L c
D 610 t Cho o_1 ot~ _a oO
1- 1' 1- 1- 1- 1- 1 . 1- 1- 1- 1- I I I R I ot
HX ~ ~~ o. . . . . . . .
0. . .
U: N0 0 N~z0 x w0 : 00<0w
8 ew 1 ?i >~i ? ? i ?i
N O N o o ~ -00 zogo
.II.

Regional Subcultures of the United States 901
the overall explained variance and the pseudo F-statistic, show that the clusters are relatively well-defined (SAS 1985, 386). Figure 2 shows that, with the excep- tion of the "Rurban" subculture, the derived clusters of counties are fairly con- tiguous and regionally concentrated. Based on the highest intercorrelations in table 3 (enclosed in boxes), I have labeled the clusters respectively as: (1) Ger- manic, (2) Ethnic, (3) Heartland, (4) Hispanic, (5) Nordic, (6) Mormon, (7) Bor- der, (8) Blackbelt, (9) Rurban, and (10) Anglo-French.8
The cluster with the largest number of counties, 855, is the "Border" subcul- ture (see table 2). With the lowest maximum seed distance (4.8) and the smallest root mean square standard deviation (0.53), it is also the most culturally uniform. In addition, it is also the closest, i.e., most similar, to eight of the nine other clus- ters in my typology. The only exception is the "Mormon" cluster which is closest to the "Rurban" cluster. Finally, as can be seen from figure 2, the "Border" clus- ter, along with the "Rurban" cluster, is one of the most regionally dispersed.
The Genealogy and Morphology of the Subcultures
One of the most insightful historical studies on the genealogy of American cul- ture is Fischer's Albion's Seed (1989). Adopting what is basically a "germ" theory, Fischer contends that American culture was largely established by four great migrations of English-speaking immigrants from the British Isles. These immi- grants, he argues, carried across the Atlantic four different ways of life that be- came the basis of regional cultures in the New World.
The first wave was the exodus of Puritans from East Anglia to Massachusetts from 1629 to 1640. The second was the transplantation of a small Royalist elite and large numbers of indentured servants from the South of England to Virginia between 1642 and 1675. The third was a migration from the North Midlands of England and Wales to the Delaware River Valley from 1675 to 1725. And the fourth was a numerically large stream of English-speaking people from the bor- ders of England and northern Ireland to the Appalachian backcountry between 1718 and 1775. Generally speaking, the first three waves correspond respectively to Elazar's moralistic, traditionalistic, and individualistic "core" subcultures. However, the fourth represents a new and distinctive subculture that Elazar at- tempts to represent as an Appalachian blend of his moralistic and traditionalistic streams.9
81t might be noted that three of the rotated factors do not appear as distinctive clusters. The "Native" stream, which has a weak correlation with the "Rurban" cluster, shares several cultural com- monalities with the "Rurban" stream including the representation of groups who tend to live in insti- tutional settings, spatially decentralized habitats, or west of the Mississippi River. The "Agrarian" and "Asian" streams are too small to be separately identifiable.
9The cultural similarities between Fischer's first three waves and Elazar's "core" cultures are clearly evident from Fischer's (1989, 785-86) summary descriptions. He describes the first, a Puritan wave, as "a very special culture with unique patterns of speech and architecture, distinctive ideas about mar- riage and the family, nucleated settlements, congregational churches, town meetings, and a tradition of
902 Joel Lieske
The extensions of Fischer's four "core" cultures are evident respectively in my Anglo-French, Blackbelt, Heartland, and Border subcultures (see figure 2). The Anglo-French subculture, of course, represents the extension of the Puritan stream into greater New England and the Upper Midwest as well as the trans- planted French-Acadian stream in Louisiana and the influx of French-Canadians into the Northeast. To obtain more detailed information on these four subcul- tures, as well as the six other subcultures identified in this study, I computed the respective cluster means for each of the 45 cultural indicators. As expected, the tabulated results (not reported here for reasons of space) reveal a number of dis- tinctive cultural traits for each subculture.
Thus, the Anglo-French subculture is a predominantly white, ethnically diverse region that represents a unique blend of the two largest ethnic groups-British and French-which are roughly the same size. The high concentration of non-Anglo Europeans, especially the French ethnics, also makes it one of the strongest Catholic regions in the country. On average, more than 35% of the population claim membership in the Catholic Church, placing it second after the Hispanic subculture in catholicity. Although the New England region is renown for its fine colleges, this subculture, overall, is not particularly distinctive in the proportions of college graduates, professionals, and managers in its work force.
The Blackbelt subculture includes most of what Gastil (1975) has labeled as the Lowland and Upland South. The Lowland South is predominantly an agricul- tural region of dispersed settlements that was originally based on a plantation economy and slavery. Known for its rich black soil and high concentrations of black residents, this original "Blackbelt" stretches from the tip of the Del-Mar-Va peninsula south through the eastern shore of Maryland, tidewater Virginia, and the eastern Carolinas, then west through the Gulf region and up the Mississippi Delta past Memphis. Gastil's Upland South represents the rolling Piedmont sec- tions of the Old Confederacy and contains most of the manufacturing centers that were established at the fall lines of major rivers. The blending of the two regions into a single consolidated Blackbelt subculture may be the result of cultural
ordered liberty." He argues that the second, a Cavalier wave, "was characterized by scattered settle- ments, extreme hierarchies of rank, strong oligarchies, Anglican churches, a highly developed sense of honor and an idea of hegemonic liberty." He contends that the third, a North Midlands wave, "was founded on a Christian idea of spiritual equality, a work ethic of unusual intensity, a suspicion of social hierarchy, and an austerity which Max Weber called 'worldly asceticism.'s' Moreover, he argues that the third wave "preserved many elements of North Midland speech, architecture, dress, and food ways" and that "it deliberately created a pluralistic system of reciprocal liberty in the Delaware Val- ley." Finally, while the emigrants from his fourth, or "border" wave, were of different ethnic stocks, Fischer maintains that they "shared a common border culture which was unique in its speech, archi- tecture, family ways and child-rearing customs." He also argues that the material culture of the "bor- der" wave "was marked by extreme inequalities of condition, and its public life was dominated by a distinctive ideal of natural liberty."

Regional Subcultures of the United States 903
accretion, brought on by the increasing mechanization of southern agriculture, the forces of industrialization and urbanization, and the consequent movement of blacks from the rural lowland to the urban upland.
The most distinctive feature of the Blackbelt, of course, is its racial composition (Key 1949). Black residents average more than 36% of the population. The largest European group consists of people who claim British ancestry, with an average of 27% of the population. Consistent with its Bible Belt reputation, this subculture also contains an unusually high concentration of Baptists. An average of almost 25% of the population are members of the Southern Baptist Convention. As ex- pected, there is also a high proportion of residents employed in manufacturing jobs (many of them at low wages), the highest concentration of any region, in- cluding the more industrialized Ethnic subculture (Luttbeg 1971; Pierce and Hagstrom 1984). Because there is so much poverty in the region, especially among blacks, this subculture also has the highest levels of income inequality.
The Heartland subculture, by comparison, largely coincides with what Elazar includes in his individualistic culture and_Gastil labels as the Central Midwest. It extends from the upper reaches of the Mohawk River Valley and the northern Ap- palachians westward in a broad swath across Ohio, Indiana, and Illinois into southern Iowa, Nebraska, Kansas, and eastern Colorado. Its midwestern sections tend to follow the westward movement of the U.S. population centroid and en- compass some of the richest and most productive agricultural land in the nation's breadbasket.10 Although a few isolated counties can be found further west, its western terminus appears to be the beginning of the Rockies, i.e., the boundary between Garreau's (1981) Breadbasket and Empty Quarter. Culturally, this is the most racially white and homogeneous of all the regions. Moreover, relatively few "white ethnics" are to be found, since on average more than 84% of the popula- tion claim either British, German, or (Scotch)-Irish ancestry.
Finally, the Border subculture represents the geographic extension of the largest, by far, of the four British migratory streams. Beginning in the Appa- lachian Mountains, Gastil's (1975) Mountain South, it extends in a southwesterly direction across the Border South states-Kentucky, Tennessee, Missouri, and Oklahoma-and includes substantial sections of Arkansas and Texas. This stream is not only the largest in area of the four streams but also the most geographically mobile and restless, as evidenced by its extensions into Florida, Michigan, and more recently the far West.11 These extensions appear to reflect a continuing love of the British border people for the backcountry and out-of-doors (Fischer 1989). In terms of cultural characteristics, this region is very similar to the Heartland
'?This midcontinent region is typified by states such as Ohio, whose motto is: "The heart of it all." Other reminders of this heartland psychology can be seen in the naming of business establishments such as the Heartland Motel chain in central Iowa.
"Its recent inroads into the far West can be seen in the growing number of counties with sizeable concentrations of residents who claim membership in the Southern Baptist Convention.

904 Joel Lieske
region. The major differences that seem to distinguish the two are the somewhat greater representation of blacks in the Border region, which is reflected in a greater heterogeneity of the population, and the pronounced role of the Southern Baptist Convention in the Border way of life.
In terms of historical settlement, the Hispanic subculture represents the oldest, and now perhaps the most territorially and culturally aggressive non-British stream. With a "core" in northern New Mexico established by the Spanish con- quistadors, it extends into southern Colorado to the north; southeast along the Texas border to the Houston metropolitan area; westward across the southern parts of New Mexico, Arizona, and California; and then finally up into the Central Valley. Geographically, this subculture bears a striking resemblance to Garreau's (1981) MexAmerica region. Not surprisingly, an average of more than 45% of the population in this region consider themselves Spanish-speaking. Notwithstand- ing, approximately 90%, on average, consider themselves white rather than a member of some other racial group such as mestizo. The still culturally dominant "Anglo" groups in this region are those of British, German, and (Scotch)-Irish an- cestry. Compared to other subcultures this is a religiously devout region, with an average of 60% of the population claiming membership in just three dominant re- ligious bodies-Catholic, Southern Baptist, and United Methodist.
Closely bordering and often interspersed throughout the Heartland subculture is the Germanic subculture. This stream originated in Philadelphia during the 1630s but extended its influence westward during subsequent waves emanating out of New York into Ohio, northern Indiana and Illinois, much of Wisconsin, into the upper Mississippi and Minnesota River Valleys, across northern Iowa, and then into the Dakotas and Nebraska. While one small stream out of New Or- leans headed for the hill country of Texas (Jordan 1966), most German immi- grants who embarked from this port headed north to the St. Louis area and then up the Missouri River Valley. Like the settlement patterns of the Border subcul- ture, the Germanic subculture exemplifies an unusual love of country, and like the Heartland subculture it encompasses some of the richest and most fertile land in the United States today.
Similar to the Heartland region, the Germanic subculture is overwhelmingly white and culturally homogeneous. It is also only one of two subcultures where the dominant ethnic group, Germans, also constitute a clear majority of the popu- lation. Although an average of more than one in every five residents claim membership in the Catholic Church, they are still significantly outnumbered by adherents of mainline Protestant denominations, particularly in the more agricul- tural subregions. Economically, this region has perhaps the healthiest and most diversified economic base, with almost 60% of the population, on average, en- gaged in manufacturing, agriculture, or natural resources.
The Nordic subculture constitutes another border culture that is closely related to the Germanic by language, religion, social customs, and life-style. But there

Regional Subcultures of the United States 905
are enough cultural differences to distinguish it from the latter even though on average German ethnics outnumber Scandinavian ethnics by more than a two-to- one ratio. Also overwhelmingly white and racially homogeneous, it is perhaps dominant in only two states-Minnesota and North Dakota-but its progressive influence also extends into the states of Wisconsin, South Dakota, and Montana (Nye 1951). Insulated by the Germanic subculture and situated off the major east- west migratory routes, the Nordic culture has enjoyed a high degree of cultural autonomy that is reinforced by an economic base of agriculture, natural resources, and high-tech industries.
Another relatively insulated subculture is the Mormon region. But its isolation is more one of design than accident. Beset by religious persecution and economic resentment, the Mormons finally found, after an exodus that criss-crossed the Heartland subculture, a sanctuary in the semi-arid region of the Great Basin, where it thrives today (O'Dea 1957; Mullen 1966; Lieske 1984). Since Mor- monism is a uniquely American Heartland religion that grew out of the Second Great Awakening of the 1820s, its converts for the most part were drawn from people of British ancestry.12 Their descendants help make this subculture the only other subculture (besides the Germanic) in which the dominant ethnic group and religion still constitute a majority of the population. Despite the lack of natural resources and industrial wealth, this subculture has produced a very civilized way of life that is distinguished by the stability of family life and an unusually well- educated and highly skilled work force (Lieske 1984).
The final two subcultures are the largest, with some 67 million residents apiece, and also the most inclusive, pluralistic, and spatially dispersed. The Ethnic sub- culture is an ethnic polyglot of metropolitan areas located primarily in the north- eastern and midwestern industrial corridors. With the exception of the Miami and Los Angeles areas, this subculture is being eclipsed in growth by metropolitan and "rurban" areas somewhat better equipped to compete in an emerging post- industrial and cybernetics economy (Elazar 1984). While both subcultures have highly educated and skilled work forces, the Rurban subculture is less dependent on the manufacturing sector. The emergence of this new Rurban subculture can be seen not only in the nucleated metropolitan areas spawned by large state uni- versities but also in the more prosperous and growing regions of the sunbelt.
The Social and Political Manifestations of the Subcultures
The value of any theory, of course, lies in its ability to explain social and po- litical behavior. A comprehensive test to assess the utility of my new cultural typology is beyond the scope of this paper. However, a more restricted test can be obtained by comparing the predictive power of my new measure with Elazar's on a
2This religion originated in Palmyra, NY, which lies just within the northeastern boundary of my Heartland subculture.
906 Joel Lieske
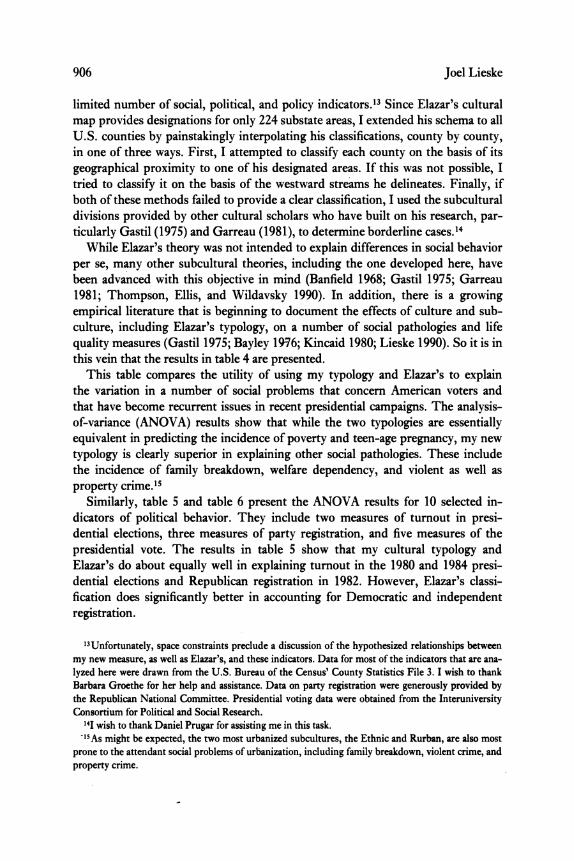
limited number of social, political, and policy indicators."3 Since Elazar's cultural map provides designations for only 224 substate areas, I extended his schema to all U.S. counties by painstakingly interpolating his classifications, county by county, in one of three ways. First, I attempted to classify each county on the basis of its geographical proximity to one of his designated areas. If this was not possible, I tried to classify it on the basis of the westward streams he delineates. Finally, if both of these methods failed to provide a clear classification, I used the subcultural divisions provided by other cultural scholars who have built on his research, par- ticularly Gastil (1975) and Garreau (1981), to determine borderline cases.14
While Elazar's theory was not intended to explain differences in social behavior per se, many other subcultural theories, including the one developed here, have been advanced with this objective in mind (Banfield 1968; Gastil 1975; Garreau 1981; Thompson, Ellis, and Wildavsky 1990). In addition, there is a growing empirical literature that is beginning to document the effects of culture and sub- culture, including Elazar's typology, on a number of social pathologies and life quality measures (Gastil 1975; Bayley 1976; Kincaid 1980; Lieske 1990). So it is in this vein that the results in table 4 are presented.
This table compares the utility of using my typology and Elazar's to explain the variation in a number of social problems that concern American voters and that have become recurrent issues in recent presidential campaigns. The analysis- of-variance (ANOVA) results show that while the two typologies are essentially equivalent in predicting the incidence of poverty and teen-age pregnancy, my new typology is clearly superior in explaining other social pathologies. These include the incidence of family breakdown, welfare dependency, and violent as well as property crime.15
Similarly, table 5 and table 6 present the ANOVA results for 10 selected in- dicators of political behavior. They include two measures of turnout in presi- dential elections, three measures of party registration, and five measures of the presidential vote. The results in table 5 show that my cultural typology and Elazar's do about equally well in explaining turnout in the 1980 and 1984 presi- dential elections and Republican registration in 1982. However, Elazar's classi- fication does significantly better in accounting for Democratic and independent registration.
13Unfortunately, space constraints preclude a discussion of the hypothesized relationships between my new measure, as well as Elazar's, and these indicators. Data for most of the indicators that are ana- lyzed here were drawn from the U.S. Bureau of the Census' County Statistics File 3. I wish to thank Barbara Groethe for her help and assistance. Data on party registration were generously provided by the Republican National Committee. Presidential voting data were obtained from the Interuniversity Consortium for Political and Social Research.
141 wish to thank Daniel Prugar for assisting me in this task. -'5As might be expected, the two most urbanized subcultures, the Ethnic and Rurban, are also most
prone to the attendant social problems of urbanization, including family breakdown, violent crime, and property crime.

C,)
(1 ~~~~~~~~~~~~~~~~~~~~~~~R 44~~~~~~~~~~~~
ri~~~~li to . ...I.I
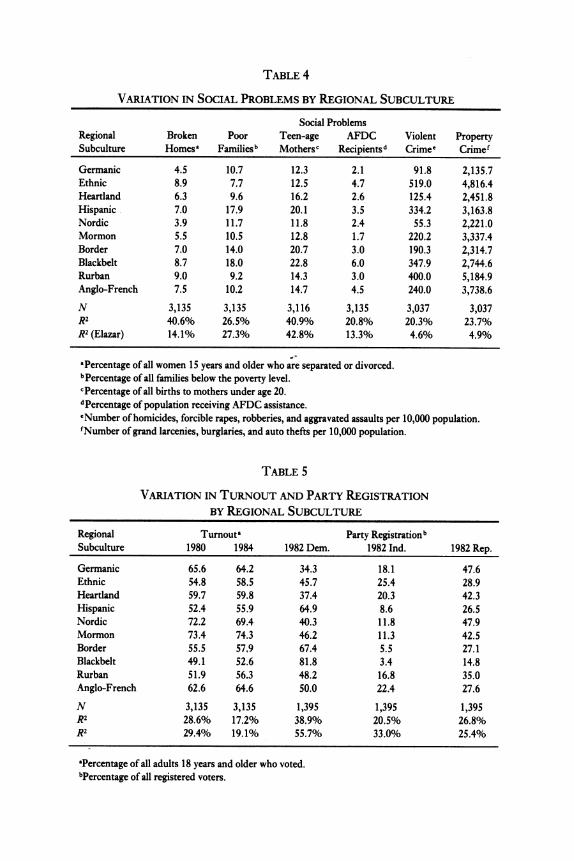
TABLE 4
VARIATION IN SOCIAL PROBLEMS BY REGIONAL SUBCULTURE
Social Problems Regional Broken Poor Teen-age AFDC Violent Property Subculture Homesa Familiesb Mothersc Recipientsd Crimee Crime'
Germanic 4.5 10.7 12.3 2.1 91.8 2,135.7 Ethnic 8.9 7.7 12.5 4.7 519.0 4,816.4 Heartland 6.3 9.6 16.2 2.6 125.4 2,451.8 Hispanic 7.0 17.9 20.1 3.5 334.2 3,163.8 Nordic 3.9 11.7 11.8 2.4 55.3 2,221.0 Mormon 5.5 10.5 12.8 1.7 220.2 3,337.4 Border 7.0 14.0 20.7 3.0 190.3 2,314.7 Blackbelt 8.7 18.0 22.8 6.0 347.9 2,744.6 Rurban 9.0 9.2 14.3 3.0 400.0 5,184.9 Anglo-French 7.5 10.2 14.7 4.5 240.0 3,738.6
N 3,135 3,135 3,116 3,135 3,037 3,037 R2 40.6% 26.5% 40.9% 20.8% 20.3% 23.7% R2 (Elazar) 14.1% 27.3% 42.8% 13.3% 4.6% 4.9%
aPercentage of all women 15 years and older who are separated or divorced. bPercentage of all families below the poverty level. cPercentage of all births to mothers under age 20. dPercentage of population receiving AFDC assistance. eNumber of homicides, forcible rapes, robberies, and aggravated assaults per 10,000 population. fNumber of grand larcenies, burglaries, and auto thefts per 10,000 population.
TABLE 5
VARIATION IN TURNOUT AND PARTY REGISTRATION BY REGIONAL SUBCULTURE
Regional Turnouta Party Registrationb Subculture 1980 1984 1982 Dem. 1982 Ind. 1982 Rep.
Germanic 65.6 64.2 34.3 18.1 47.6 Ethnic 54.8 58.5 45.7 25.4 28.9 Heartland 59.7 59.8 37.4 20.3 42.3 Hispanic 52.4 55.9 64.9 8.6 26.5 Nordic 72.2 69.4 40.3 11.8 47.9 Mormon 73.4 74.3 46.2 11.3 42.5 Border 55.5 57,9 67.4 5.5 27.1 Blackbelt 49.1 52.6 81.8 3.4 14.8 Rurban 51.9 56.3 48.2 16.8 35.0 Anglo-French 62.6 64.6 50.0 22.4 27.6
N 3,135 3,135 1,395 1,395 1,395 R2 28.6% 17.2% 38.9% 20.5% 26.8% R2 29.4% 19.1% 55.7% 33.0% 25.4%
aPercentage of all adults 18 years and older who voted. bPercentage of all registered voters.
908 Joel Lieske
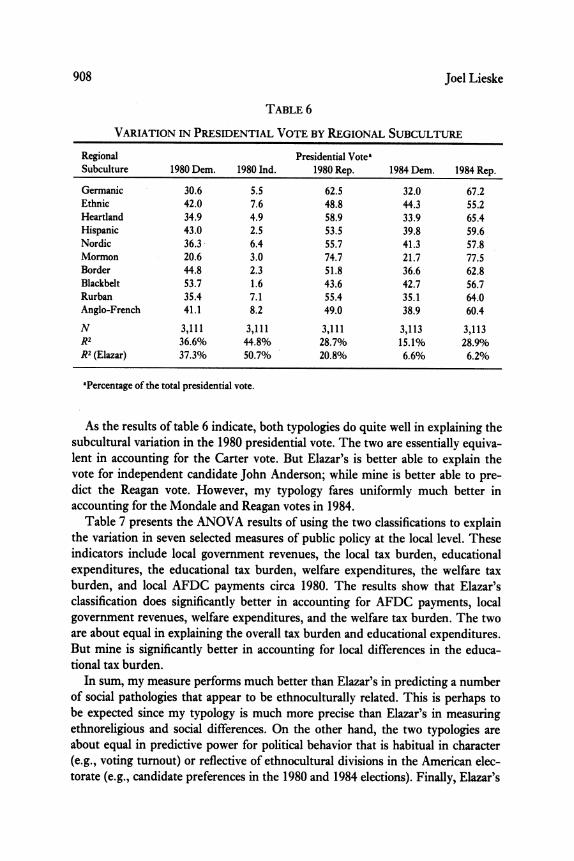
TABLE 6
VARIATION IN PRESIDENTIAL VOTE BY REGIONAL SUBCULTURE
Regional Presidential Votea Subculture 1980 Dem. 1980 Ind. 1980 Rep. 1984 Dem. 1984 Rep.
Germanic 30.6 5.5 62.5 32.0 67.2 Ethnic 42.0 7.6 48.8 44.3 55.2 Heartland 34.9 4.9 58.9 33.9 65.4 Hispanic 43.0 2.5 53.5 39.8 59.6 Nordic 36.3 6.4 55.7 41.3 57.8 Mormon 20.6 3.0 74.7 21.7 77.5 Border 44.8 2.3 51.8 36.6 62.8 Blackbelt 53.7 1.6 43.6 42.7 56.7 Rurban 35.4 7.1 55.4 35.1 64.0 Anglo-French 41.1 8.2 49.0 38.9 60.4
N 3,111 3,111 3,111 3,113 3,113 R2 36.6% 44.8% 28.7% 15.1% 28.9% R2 (Elazar) 37.3% 50.7% 20.8% 6.6% 6.2%
aPercentage of the total presidential vote.
As the results of table 6 indicate, both typologies do quite well in explaining the subcultural variation in the 1980 presidential vote. The two are essentially equiva- lent in accounting for the Carter vote. But Elazar's is better able to explain the vote for independent candidate John Anderson; while mine is better able to pre- dict the Reagan vote. However, my typology fares uniformly much better in accounting for the Mondale and Reagan votes in 1984.
Table 7 presents the ANOVA results of using the two classifications to explain the variation in seven selected measures of public policy at the local level. These indicators include local government revenues, the local tax burden, educational expenditures, the educational tax burden, welfare expenditures, the welfare tax burden, and local AFDC payments circa 1980. The results show that Elazar's classification does significantly better in accounting for AFDC payments, local government revenues, welfare expenditures, and the welfare tax burden. The two are about equal in explaining the overall tax burden and educational expenditures. But mine is significantly better in accounting for local differences in the educa- tional tax burden.
In sum, my measure performs much better than Elazar's in predicting a number of social pathologies that appear to be ethnoculturally related. This is perhaps to be expected since my typology is much more precise than Elazar's in measuring ethnoreligious and social differences. On the other hand, the two typologies are about equal in predictive power for political behavior that is habitual in character (e.g., voting turnout) or reflective of ethnocultural divisions in the American elec- torate (e.g., candidate preferences in the 1980 and 1984 elections). Finally, Elazar's

Regional Subcultures of the United States 909
TABLE 7
VARIATION IN PUBLIC POLICY BY REGIONAL SUBCULTURE
Public Policy
Regional Local Tax Education Welfare Subculture Rev., Burdenb Expend.c Burdend Expend.' Burdenf AFDC9
Germanic 444 5.5 526 6.3 31 .36 253 Ethnic 507 5.0 522 4.9 79 .76 279 Heartland 411 4.7 505 6.0 30 .37 236 Hispanic 394 6.5 670 9.1 31 .39 141 Nordic 521 4.8 585 7.3 77 .97 271 Mormon 317 4.5 636 8.2 4 .05 271 Border 276 3.2 422 5.7 9 .12 169 Blackbelt 289 3.0 415 6.2 13 .17 137 Rurban 343 4.5 561 5.8 29 .30 233 Anglo-French 411 5.5 501 6.1 41 .51 273
N 3,130 3,098 3,130 3,098 3,130 3,098 3,135 R2 23.9% 7.1% 6.2% 9.1% 3.3% 12.4% 33.5% R2 (Elazar) 31.7% 9.8% 6.0% 1.0% 8.8% 17.4% 57.3%/o
"Per capita local government revenues in dollars. bPer capita local government taxes as a percentage of per capita personal income. cPer capita local government expenditures on education in dollars. dPer capita local government expenditures as a percentage of per capita personal income. ePer capita local government expenditures on welfare in dollars. fPer capita local government expenditures on welfare as a percentage of per capita personal income. gAverage family monthly payment in dollars.
typology appears to be superior in explaining certain types of political behavior that result from state-level influences (e.g., policies that are primarily state-funded) or that are patterned along state-party lines (e.g., voting registration).
Overall, my measure appears to do about as well as Elazar's. At the same time, it is a statistically rigorous measure that avoids the problem of political circularity inherent in his measure. In addition, it remains faithful to a key assumption of his theory, namely, that subcultural differences are transmitted primarily by ethnic and religious groups. Last but not least, my new measure offers to researchers a major refinement to his "core" British subcultures (four not three) that first settled the United States, as well as a contemporary accounting of other ethnocul- tural streams-French, Germanic, Nordic, Hispanic, Mormon, Ethnic, and Rur- ban-that have left their subcultural imprint.
DISCUSSION AND CONCLUSION
The primary objective of this study was to develop the case, theory, and sta- tistical methodology for a new measure of American regional subcultures. A

910 Joel Lieske
secondary objective was to assess its utility in explaining differences in social and political behavior. Overall, the results support a number of conclusions.
First, the combined use of principal component and cluster analysis may offer cultural scholars a new and promising methodology for deriving rigorous sub- cultural measures. In using this methodology, however, researchers must exercise care in how they conceptualize culture and the indicators they select for analysis. In short, the technique only succeeds to the extent it is informed by theory.
Second, the results suggest that the entire population of U.S. counties can be partitioned into 10 distinctive subcultures that are relatively homogeneous and contiguous. In addition, these subcultures appear to make theoretical sense, as evidenced by their close relationship to those identified by other cultural scholars such as Elazar (1984), Gastil (1975), Garreau (1981), and Fischer (1989).
Third, it is evident that my new typology compares very favorably with Elazar's in accounting for differences in a variety of social and political indica- tors. Although my new measure is no more parsimonious than Elazar's typology (10 versus 9 categories), it is more precise and takes into account recent demo- graphic changes, especially the United States' greater cultural diversity. And while even better results might be obtained through the incorporation of some "effect" and "manifestation" indicators, their inclusion would defeat my effort to avoid the problem of circularity. For example, several measures of past poli- tical behavior could be included in the factor-cluster analysis that would enhance the predictive power of my typology. These might include, for instance, turnout in the 1976 presidential election, party registration levels in 1980, and local gov- ernment tax and spending figures circa 1970. Their inclusion might increase significantly the explanatory power of my typology, but only at the cost of ob- scuring the necessary theoretical distinction between cultural "causes" and politi- cal "effects."
Fourth, it would seem desirable to subject my new measure to further testing, especially at the state level. This could be done, for instance, by aggregating across counties and computing the respective proportions of the total state-wide population that are under the influence of each subculture. In effect the political culture of each state would be represented by a 10-dimensional vector variable. Presumably, this variable would measure the relative sizes of the contending sub- cultural constituencies within a state that vie for control of legislative districts and the governorship. And like Sharkansky's (1969) cultural index it could be used to predict differences among the states in political institutions and public policies.
Finally, my new measure may also prove useful in contextual research that con- ceptualizes subcultures as arenas of conflict (Schattschneider 1960). For example, it can be demonstrated that the factors which structure presidential voting behav- ior differ in their effects from one subculture or cultural region to another (Lieske 1989, 1991). To conclude, this study should help lay the theoretical and empirical

Regional Subcultures of the United States 911
bases for future studies that attempt to understand the effects of regional subcul- tures on American social and political behavior.
Manuscript submitted 18 October 1991 Final manuscript received 18 March 1993
REFERENCES
Anderberg, M. R. 1973. ClusterAnalysisforApplications. New York: Academic Press. Banfield, Edward C. 1960. The Unheavenly City. Boston: Little, Brown. Bayley, David H. 1976. "Learning about Crime-the Japanese Experience." Public Interest
(Summer): 55-68. Campbell, Angus, Philip Converse, Warren Miller, and Donald Stokes. 1960. The American Voter.
New York: Wiley. Cassels, Louis. 1965. What's the Difference?A Comparison of the Faiths Men Live By. Garden City, NY:
Doubleday. Collins, Ronald K. L., Peter J. Galie, and John Kiicaid. 1986. "State High Courts, State Constitu-
tions, and Individual Rights Litigation Since 1980: A Judicial Survey." Publius 16:141-61. Dran, Ellen M., Robert B. Albritton, and Mikel Wyckoff. 1991. "Surrogate versus Direct Mea-
sures of Political Culture: Explaining Participation and Policy Attitudes in Illinois." Publius 21:15-30.
Dreitzel, Hans Peter. 1977. "On the Political Meaning of Culture." In Beyond the Crisis, ed. Norman Birnbaum. London: Oxford University Press.
Elazar, DanielJ. 1970. Cities of the Prairie. New York: Basic. Elazar, DanielJ. 1984. American Federalism. 3d ed. New York: Harper & Row. Fischer, David Hackett. 1989. Albion's Seed. Oxford: Oxford University Press. Fitzpatrick, Jody L., and Rodney E. Hero. 1988. "Political Culture and Political Characteristics of the
American States: A Consideration of Some Old and New Questions." Western Political Quarterly 41: 145-53.
Garreau, Joel. 1981. The Nine Nations of North America. Boston: Houghton Mifflin. Gastil, Raymond D. 1975. Cultural Regions of the United States. Seattle: University of Washington
Press. Glenmary Research Center. 1982. Churches and Church Membership in the United States. Atlanta: GRC. Herzik, Eric B. 1985. "The Legal-Formal Structuring of State Politics: A Cultural Explanation."
Western PoliticalQuarterly 38:413-23. Holbrook, Stewart H. 1950. The Yankee Exodus. New York: Macmillan. Johnson, Charles A. 1976. "Political Culture in American States: Elazar's Formulation Examined."
American ournalofPoliticalScience 18:331-45. Jordan, Terry G. 1966. German Seed in Texas Soil: Immigrant Farmers in Nineteenth-Century Texas.
Austin, TX: University of Texas Press. Joslyn, Richard A. 1980. "Manifestations of Elazar's Political Subcultures: State Public Opinion and
the Content of Political Campaign Advertising." Publius 10:37-58. Key, V. O.,Jr. 1949. Southern Politics in State and Nation. New York: Knopf. Kincaid, John. 1980. "Political Culture and the Quality of Life." Publius 10:89-110. Kincaid, John. 1982. "Introduction." In Political Culture, Public Policy, and the American States, ed.
John Kincaid. Philadelphia: ISHI Press. I Kincaid, John. 1990. "From Cooperative to Coercive Federalism." The Annals of the American Acad-
emy of Political and Social Science 509: 139-52.

912 Joel Lieske
Kincaid, John, and Joel Lieske. 1991. "Political Subcultures of the American States: State of the Art and Agenda for Research." Paper delivered at the annual meeting of the American Political Science Association.
Kleppner, Paul. 1970. The Cross of Culture: A Social Analysis of Midwestern Politics, 1850-1900. New York: Free Press.
Lasswell, Harold D., and Abraham Kaplan. 1950. Power and Society: A Framework for Political In- quiry. New Haven: Yale University Press.
Lazarsfeld, Paul, Bernard Berelson, and Helen Gaudet. 1944. The Peopk's Choice. New York: Colum- bia University Press.
Leege, David C., Joel A. Lieske, and Kenneth D. Wald. 1991. "Toward Cultural Theories of Ameri- can Political Behavior: Religion, Ethnicity and Race, and Class Outlook." In Political Science: Look- ing to the Future, ed. William Crotty. Chicago: University of Northwestern Press.
Lieske, Joel A. 1984. "The Salvation of American Cities." In Rebuilding America's Cities: Roads to Recovery, eds. Paul R. Porter and David C. Sweet. New Brunswick, NJ: Rutgers University Press.
Lieske, Joel A. 1988. "The Culturl Origins of Political Partisanship." Paper delivered at the annual meeting of the Western Political Science Association.
Lieske, Joel A. 1989. "Subcultural Differences in the U.S. Presidential Vote: The Evidence from Re- cent Aggregate and Individual Level Data." Paper delivered at the annual meeting of the American Political Science Association, Atlanta.
Lieske, Joel A. 1990. "The Correlates of Life Quality in U.S. Metropolitan Areas." Publius 20:43-54. Lieske, Joel A. 1991. "Cultural Issues and Images in the 1988 Presidential Campaign: Why the Demo-
crats Lost-Again!" PS: Political Science and Politics 24:180-87. Lowery, David, and Lee Sigelman. 1982. "Political Culture and State Public Policy: The Missing
Link." Western Political Quarterly 35:376-84. Luttbeg, Norman R. 1971. "Classifying the American States: An Empirical Attempt to Identify Varia-
tions." Midwest journalofPolitical Science 15:703-21. Monroe, Alan D. 1977. "Operationalizing Political Culture: The Illinois Case." Publius 7:107-20. Morgan, David R., and Robert E. England. 1987. "Classifying the American States: An Update." So-
cial Science Quarterly 68:405-17. Morgan, David R., and Sheilah S. Watson. 1991. "Political Culture, Political System Characteristics,
and Public Policies among the American States." Publius 21:31-48. Mullen, Robert. 1966. The Latter-Day Saints. New York: Doubleday. Nardulli, Peter F. 1990. "Political Subcultures in the American States: An Empirical Examination of
Elazar's Formulation." American Politics Quarterly 18:287-315. Nye, Russel B. 1951. Midwestern Progressive Politics: A Historical Study of Its Origins and Development,
1870-1950. Lansing, MI: Michigan State University Press. Peirce, Neal R., and Jerry Hagstrom. 1984. The Book of America: Inside the Fifty States. New York:
W. W. Norton. Press, Charles, and Kenneth VerBurg. 1983. State and Community Governments in the Federal System.
2d ed. New York: Wiley. O'Dea, Thomas F. 1957. The Mormons. Chicago: University of Chicago Press. SAS Institute Inc. 1985. SAS User's Guide: Statistics. 5th ed. Cary, NC: SAS. Savage, Robert L. 1973. "Patterns of Multilinear Evolution in American States." Publius 3:75-108. Schattschneider, E. E. 1960. The Semi-Sovereign People. New York: Holt, Rinehart, and Winston. Sharkansky, Ira. 1969. "The Utility of Elazar's Political Culture." Polity 2:66-83. Thompson, Michael, Richard Ellis, and Aaron Wildavsky. 1990. Cultural Theory. Boulder, CO:
Westview. Wald, Kenneth D. 1987. Religion and Politics in the United States. New York: St. Martin's Press. Weber, Ronald E., and William R. Shaffer. 1972. "Public Opinion and American State Policy-
making." Midwest journal of Political Science 16:683-99.

Regional Subcultures of the United States 913
Wildavsky, Aaron. 1987. "Choosing Preferences by Constructing Institutions: A Cultural Theory of Preference Formation." American Political Science Review 81: 3-21.
Zelinsky, Wilbur. 1973. The Cultural Geography of the United States. Englewood Cliffs, NJ: Prentice-Hall.
Joel Lieske is associate professor of political science, Cleveland State Univer- sity, Cleveland, OH 44115.