regional planning partnership - sacog.org · regional planning partnership wednesday, april 23, ......
TRANSCRIPT
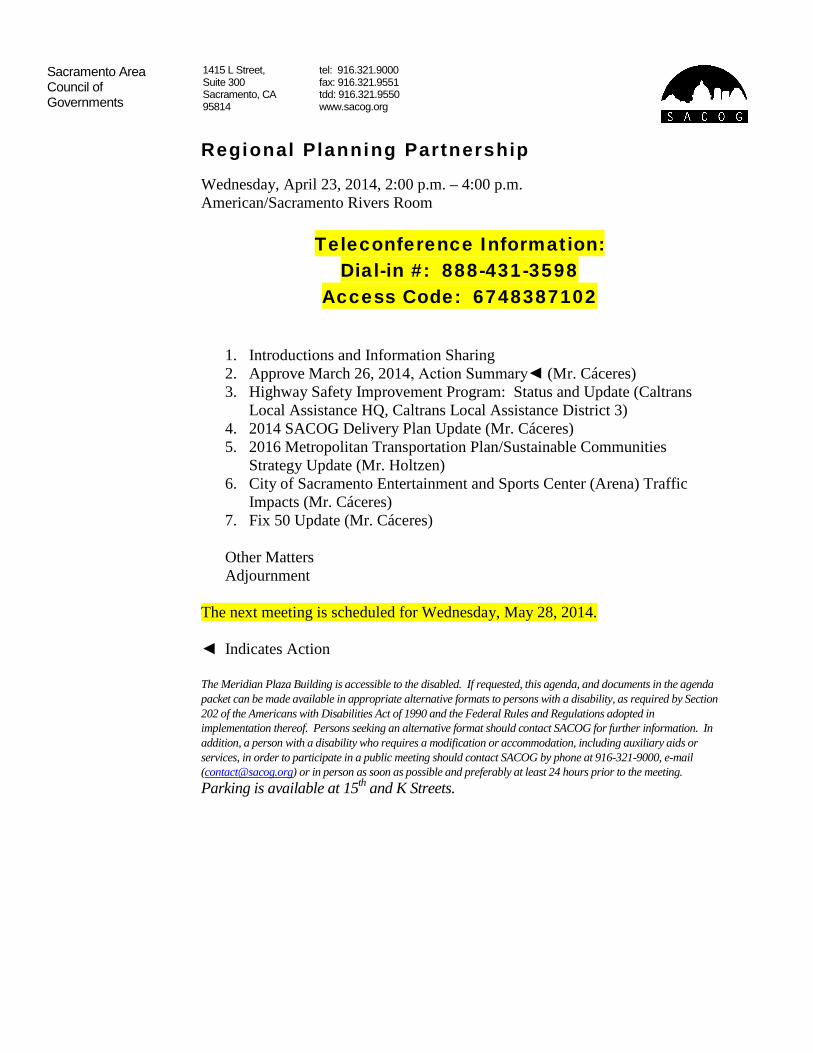
Sacramento Area Council of Governments
1415 L Street, Suite 300 Sacramento, CA 95814
tel: 916.321.9000 fax: 916.321.9551 tdd: 916.321.9550 www.sacog.org
Regional Planning Partnership
Wednesday, April 23, 2014, 2:00 p.m. – 4:00 p.m. American/Sacramento Rivers Room
Teleconference Information: Dial-in #: 888-431-3598
Access Code: 6748387102
1. Introductions and Information Sharing 2. Approve March 26, 2014, Action Summary◄ (Mr. Cáceres) 3. Highway Safety Improvement Program: Status and Update (Caltrans
Local Assistance HQ, Caltrans Local Assistance District 3) 4. 2014 SACOG Delivery Plan Update (Mr. Cáceres) 5. 2016 Metropolitan Transportation Plan/Sustainable Communities
Strategy Update (Mr. Holtzen) 6. City of Sacramento Entertainment and Sports Center (Arena) Traffic
Impacts (Mr. Cáceres) 7. Fix 50 Update (Mr. Cáceres)
Other Matters Adjournment
The next meeting is scheduled for Wednesday, May 28, 2014. ◄ Indicates Action The Meridian Plaza Building is accessible to the disabled. If requested, this agenda, and documents in the agenda packet can be made available in appropriate alternative formats to persons with a disability, as required by Section 202 of the Americans with Disabilities Act of 1990 and the Federal Rules and Regulations adopted in implementation thereof. Persons seeking an alternative format should contact SACOG for further information. In addition, a person with a disability who requires a modification or accommodation, including auxiliary aids or services, in order to participate in a public meeting should contact SACOG by phone at 916-321-9000, e-mail ([email protected]) or in person as soon as possible and preferably at least 24 hours prior to the meeting. Parking is available at 15th and K Streets.

Page 1 of 4
Regional Planning Partnership I tem #2
Action Summary March 26, 2014
Attendees: Cary Anderson, ARB Rick Bettis, Breathe California Sabrina Bradbury, SACOG José Luis Cáceres, SACOG Scott Carson, FHWA Rosemary Covington, Regional Transit Renee DeVere-Oki, SACOG Woody Deloria, EDCTC Chris Dougherty, City of West Sacramento Adrian Engel, Echelon Transportation Group Eric Fredericks, Caltrans Monica Hernandez, SACOG Clint Holtzen, SACOG Matt Jones, Yolo-Solano AQMD
Amy Lee, SACOG Amy Martin, SACOG Luke McNeel-Caird, PCTPA Marilee Mortenson, Caltrans Karina O’Connor, EPA Region 9 Andrew Phillips, Region Builders Dan Regan, Sacramento County DOT Eric Reitz, Yolo County Transportation
District Larry Robinson, SMAQMD Angie Rodony, Sacramento County Sam Shelton, SACOG Lacey Symons-Holtzen, SACOG Molly Wright, SMAQMD
1. Introductions & Information Sharing. No information was shared among the Partnership. 2. Approve February 25 Action Summary. Mr. McNeel-Caird moved to approve the action
summary from the February 25; Mr. Robinson seconded. The Partnership voted in favor of approving the action summary and the motion carried.
3. SACOG Six-County Regional Active Transportation Program Guidelines. Ms.
Symons-Holtzen informed the Partnership that the statewide Active Transportation Program (ATP) funding is now open and SACOG is encouraging all jurisdictions to apply. Caltrans District 3 will be holding a training session next week that interested participants should register for ahead of time. SACOG will release the regional ATP call for projects in May.
Ms. DeVere-Oki described the criteria that SACOG staff is proposing for its ATP based on the listening session at the last RPP and vetting with the transportation authorities in El Dorado and Placer Counties. These criteria are available in Attachment B to the staff item. Any changes or recommendations to the scoring criteria are welcomed. Please send them and any questions to Amy Martin at [email protected].
Ms. Symons-Holtzen outlined the program guidelines, included in the staff report as Attachment A. She informed the Partnership that the due date for proposals will be in July to give applicants exactly two months to prepare proposals. The project selection process will be a working group similar to the Bicycle/Pedestrian Funding program. SACOG’s ATP Team will do an initial review of the proposed projects based on the screening criteria and will then move applications to the working group. Ms. Symons-Holtzen solicited volunteers for the working group.
Page 2 of 4
Ms. Symons-Holtzen clarified that the “public health organization” that is to be part of the working group does not need to be an organization nor a governmental agency but rather a “representative” of public health interests. She further clarified that public works departments, transportation departments, public health departments, and school districts are eligible applicants, and all applicants must have a master agreement with Caltrans. If an interested agency does not have a master agreement, Caltrans encourages them to partner with an agency that does instead of going through the process of obtaining a master agreement for this programming round. Mr. Robinson moved to recommend that the Transportation Committee recommend that the SACOG Board approve the draft guidelines and scoring criteria for the MPO funding round and authorize staff to submit the guidelines to the CTC for action, and upon action of the CTC, authorize the CEO to issue the call for projects. Mr. Dougherty seconded the motion. The Partnership voted in favor of approving the motion and the motion carried.
4. Draft Amendment # 25 to the 2013/16 Metropolitan Transportation Improvement
Program, Draft Amendment #3 to the Metropolitan Transportation Plan/Sustainable Communities Strategy for 2035, and Draft Air Quality Conformity Analysis. Mr. Cáceres explained that the MTIP is the short-range implementation of the MTP/SCS and includes projects that are regionally significant and federally funded. He explained that this amendment is a Type 5 amendment, which amends the project scope, completion year, et cetera[s1], and requires a model run; however, modeling showed no impact on the SACOG region meeting its air quality attainment.
Mr. Cáceres informed the Partnership that a model run amendment occurs about twice every three years. Model runs take several months to complete and therefore are not performed more frequently. Mr. Jones moved to approve Draft Amendment #25 to the 2013/16 MTIP and Draft Amendment #3 to the MTP/SCS and the accompanying Draft Air Quality Conformity Analysis; Mr. Deloria seconded the motion. The Partnership voted in favor of approving the item and the motion carried.
5. May is Bike Month 2013 Recap and 2014 Campaign Update. Ms. Bradbury informed
the Partnership that the 2014 May is Bike Month Campaign will focus more on the vehicle trip replacement aspect than it has in years past. Messaging will reflect this focus. Additionally, the 2014 campaign will expand the bicycle-friendly business program, the Shop, Dine, Bike program, and provide more ways to sort and filter the mileage data on mayisbikemonth.com.
6. 2016 Metropolitan Transportation Plan/Sustainable Communities Strategy Update.
Mr. Holtzen reminded the Partnership that the SACOG Board adopted a policy framework in December to focus the 2016 MTP/SCS on implementation. Since December, SACOG staff and the Board have examined implementation issues in depth, such as transit needs, road maintenance needs, and state of good repair. The Board adopted the scenario

Page 3 of 4
development framework in March 2014, wherein the Plan’s scenarios will be refreshed but not completely reopened and recreated, because doing so would negate the ability to focus on implementation.
Staff will use this next year to perform analysis. Much of this analysis will focus on phasing of the projects in the plan instead of the “snapshot” method of comparing conditions today to those in 2036. This analysis will feed into SACOG’s public workshops and eventually a preferred scenario. The adoption of the framework for a preferred scenario will trigger the “meat” of the Plan, such as policies, environmental review, et cetera. Mr. Holtzen requested that local jurisdictions be in contact with him to ensure that project lists are up-to-date and on the appropriate timeline. He can be reached by phone or email, [email protected]. Ms. Hernández clarified how the Blueprint is still involved in SACOG’s work with the MTP/SCS, stating that the MTP/SCS is an implementation tool of the Blueprint but that the Blueprint is implemented at the local level, not the regional. The MTP/SCS will follow some of the land use patterns of the Blueprint if the Board adopts the “Blueprint-esque” scenario that focuses more on transit and active transportation. Furthermore, Senate Bill 375 was modeled after the Blueprint and links transportation and land use planning, which outlines the Sustainable Communities Strategy to incentivize smarter growth in both the urban infill and greenfield developments that will happen in the region.
7. 2016 Metropolitan Transportation Plan/Sustainable Communities Strategy Outreach
Update. Ms. Hernández explained how there are multiple avenues of outreach for this update of the MTP/SCS, including the Sounding Board of about 90 stakeholders from around the region, SACOG’s standing committees such as the RPP, as well as the formal public workshops to be held later this year. The Sounding Board receives updates and information at about the same pace as the SACOG Board, sometimes acting as a vetting group and sometimes after the Board makes a decision. Ms. Hernández noted how the Sounding Board offers the opportunity for diverse interests to be in the same room and have direct conversations, which is lost with interest-specific focus groups.
8. RPP Survey Assessment. Mr. Cáceres thanked those who responded to the RPP
assessment survey. He noted that all input will go to Victoria Cacciatore, who will address it in the near future.
9. Delivery Plan 2014 Process. Mr. Shelton informed the Partnership that the Delivery Plan
only concerns projects programmed this year. He explained that SACOG has been working with local jurisdiction staff to ensure that information in the Delivery Plan is up to date and that delivery hits projects’ targets. Questions regarding the Delivery Plan can be sent to Mr. Shelton at [email protected].

Page 4 of 4
10. Call to Update Projects – 2015/18 Metropolitan Transportation Improvement Program. Mr. Cáceres informed the Partnership that the MTIP is due for an update. The new MTIP will include four years of federally funded projects, starting with 2015 and ending with 2018. Project funds must be “reasonably available and committed” to be included in the MTIP, and as a whole, the TIP will need to meet guidelines such as air quality conformity and financial constraints.
Mr. Cáceres is currently asking project sponsors to update all projects with their most current titles, scopes, timelines, funding sources, et cetera. He emphasized that no projects will be carried over from the previous TIP, so all projects must be updated or they will be dropped. Revised project lists are due to Mr. Cáceres at SACOG by April 25, 2014.
11. Draft Air Quality Conformity Assumptions for Amendment #4 to the Metropolitan
Transportation Plan/Sustainable Communities Strategy for 2035 and Adoption of the 2015/18 Metropolitan Transportation Improvement Program. Ms. Abraham informed the Partnership of the new modeling assumptions that SACOG must adopt to amend the MTP/SCS and adopt the 2015/18 MTIP. The Assumptions will use EMFAC 2011 data and EPA’s criteria pollutant budgets. The list of Assumptions is attached to the item. Pending EPA’s release of a new PM2.5 budget for the SACOG region, staff will use the 2011 budget for an interim test. Mr. Deloria moved to approve the Assumptions for use in SACOG’s air quality conformity analysis; Mr. Jones seconded the motion. The Partnership voted in favor of approving the Assumptions and the motion carried.
12. Other matters. Mr. Frederick informed the Partnership of a Caltrans press release about
the Fix 50 project and urged anyone who uses Highway 50 or an adjacent highway to visit fix50.com for the most up-to-date information. Yolobus will be adding service during the construction; Regional Transit will make some adjustments to service as well. He encouraged everyone affected to plan their routes early as traffic delays are expected to be an hour or more. Ms. Hernández added that there will not be construction during the State Fair.
Mr. Deloria informed the Partnership that EDCTC will be facilitating a town hall meeting in coordination with the Tahoe Regional Planning Agency and the Tahoe basin counties to present the Tahoe Basin Roadway Plan. Mr. Regan informed the Partnership that the Scott Road open street will happen again this May for Bike Month, as will an open street in southern Sacramento County at Andrus Island. El Dorado County will be hosting a bike ride or open street during May is Bike Month; contact Jerry Barton for more information.
13. Adjournment. Mr. McNeel-Caird moved to adjourn the meeting; Mr. Fredericks
seconded the motion. The Partnership voted in favor of adjournment and the motion carried.
Item #3 Regional Planning Partnership April 16, 2014 Highway Safety Improvement Program: Status and Update Issue: What questions does the Partnership have regarding the Highway Safety Improvement Program? Recommendation: None. This is for information only. Discussion: Caltrans revised the Highway Safety and Improvement Program (HSIP) funding guidelines for the last cycle, Cycle 6, and is planning further changes for Cycle 7. This is part of an ongoing effort to increase the visibility of the federal safety programs and improve the delivery of HSIP projects. For example, for several years Caltrans has implemented a red-flag delivery process, requiring that project sponsors meet delivery milestones for their HSIP-funded projects.
Cycle 6 Summary of Key Results Sponsors in the SACOG region did exceptionally well in Cycle 6, receiving 10 percent of the funding, or $15,078,000 of the total $150,038,300. District 3 received 2/3 of the funding it requested ($19.9 million was funded out of $28.5 million requested). Caltrans provides more detail in Attachment A. Status of HSIP Delivery for 2014 Caltrans expects all agencies to deliver their safety projects within the time frames provided. Caltrans District and Headquarters staff will work with the local agency to use expedited project selection procedures (EPSP) and ensure that authorization requests for all phases are approved as quickly as possible. Caltrans explains how it uses EPSP in Attachment B.
Attachment C is the Caltrans Delivery Report, which lists all HSIP projects in the region and assigns colors to indicate delivery status. Local agencies with safety projects should check and monitor the delivery status of their projects by visiting the HSIP Delivery Status website at http://www.dot.ca.gov/hq/LocalPrograms/HSIP/delivery_status.htm
HSIP Changes Planned for Cycle 7 Caltrans wants to improve the HSIP’s delivery and efficiency, and refocus the program. See Attachment A for more information. For HSIP-related questions, please contact Jim Day at District 3 Local Assistance, (530) 741-5116, [email protected].
JLC:gg Attachments Key Staff: Sharon Sprowls, Senior Program Specialist, (916) 340-6235 Renée DeVere-Oki, Team Manager of Programming and Project Delivery, (916) 340-6219 José Luis Cáceres, MTIP Team Manager, (916) 340-6218

11/19/13
Summary of Key Results
2013 HSIP Cycle 6 Call for Projects
Final HSIP & HR3 funding levels
The final HSIP Cycle funding is: $150.0M
The total HR3 eligible projects funded in Cycle 6: $21.9 M (This is a subset of the total)
389 total applications were received
231 applications were funded
Overall Expected Transportation Benefits from the funding of these projects:
The overall B/C ratio for this call is 10.1 (The California public should receive 10 times more benefit from these projects in comparison to their costs)
Total expected transportation safety benefit expected from this call is $1.700,000,000. This benefit will be realized from reductions in future fatalities, serious injuries, and other crash related costs.
“Systemic” projects’ B/C was 40% higher than “Spot Location” projects (11.59 vs. 8.25)
“Roadway Segment” and “Intersection” projects’ had similar results (11.24 vs. 8.97)
Rural Roadway Funding
Primarily “Rural” projects received 23% of the overall funding
The average B/C for “Rural” projects was 11.9
“HR3” eligible projects received 15% of the overall funding (These are a subset of “Rural”)
The average B/C for “HR3” projects was 14.7
Similar to Cycle 5, all Caltrans’ more rural Districts (1, 2, 3, 5, 6, 9, and 10) received a
higher percentage of the overall funding than they would have received if funding was
based purely on their population share.
Non‐Motorized Funding
Elements of projects focusing on Non‐Motorized users received 34% of the overall funding
The average B/C for these “Non‐Motorized” projects was 11.5
The percent of funding going towards Non‐Motorized project elements was significantly
higher in Caltrans’ more urban districts, with 40% in District 4 and 56% in District 7.
The total funding focusing on Non‐Motorized users went from 26% in Cycle 5 to 34% in
Cycle 6 – a 31% increase. Once again showing that Non‐Motorized projects can compete
well in the Local HSIP B/C selection process.
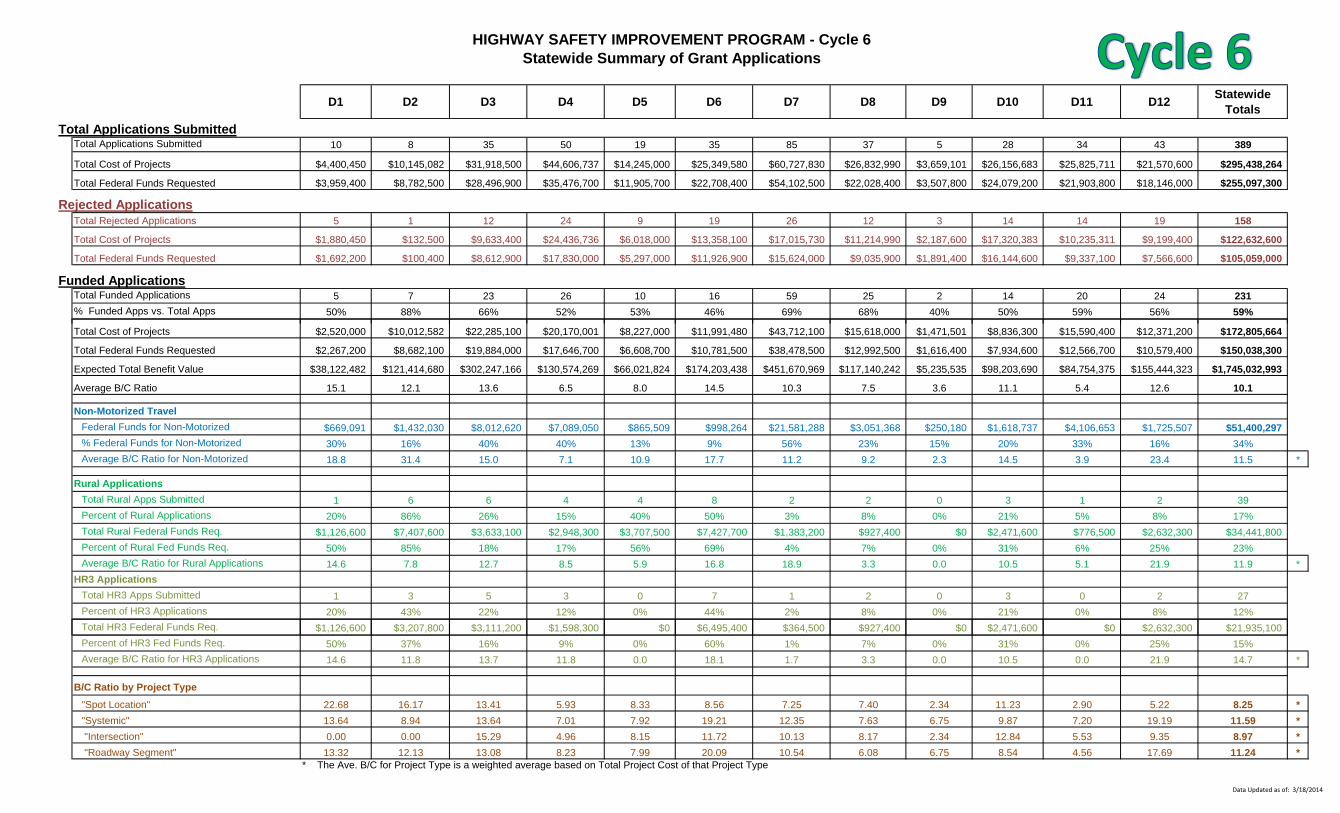
D1 D2 D3 D4 D5 D6 D7 D8 D9 D10 D11 D12 Statewide Totals
Total Applications SubmittedTotal Applications Submitted 10 8 35 50 19 35 85 37 5 28 34 43 389
Total Cost of Projects $4,400,450 $10,145,082 $31,918,500 $44,606,737 $14,245,000 $25,349,580 $60,727,830 $26,832,990 $3,659,101 $26,156,683 $25,825,711 $21,570,600 $295,438,264
Total Federal Funds Requested $3,959,400 $8,782,500 $28,496,900 $35,476,700 $11,905,700 $22,708,400 $54,102,500 $22,028,400 $3,507,800 $24,079,200 $21,903,800 $18,146,000 $255,097,300
Rejected ApplicationsTotal Rejected Applications 5 1 12 24 9 19 26 12 3 14 14 19 158
Total Cost of Projects $1,880,450 $132,500 $9,633,400 $24,436,736 $6,018,000 $13,358,100 $17,015,730 $11,214,990 $2,187,600 $17,320,383 $10,235,311 $9,199,400 $122,632,600
Total Federal Funds Requested $1,692,200 $100,400 $8,612,900 $17,830,000 $5,297,000 $11,926,900 $15,624,000 $9,035,900 $1,891,400 $16,144,600 $9,337,100 $7,566,600 $105,059,000
Funded ApplicationsTotal Funded Applications 5 7 23 26 10 16 59 25 2 14 20 24 231% Funded Apps vs. Total Apps 50% 88% 66% 52% 53% 46% 69% 68% 40% 50% 59% 56% 59%
HIGHWAY SAFETY IMPROVEMENT PROGRAM - Cycle 6Statewide Summary of Grant Applications
Total Cost of Projects $2,520,000 $10,012,582 $22,285,100 $20,170,001 $8,227,000 $11,991,480 $43,712,100 $15,618,000 $1,471,501 $8,836,300 $15,590,400 $12,371,200 $172,805,664
Total Federal Funds Requested $2,267,200 $8,682,100 $19,884,000 $17,646,700 $6,608,700 $10,781,500 $38,478,500 $12,992,500 $1,616,400 $7,934,600 $12,566,700 $10,579,400 $150,038,300
Expected Total Benefit Value $38,122,482 $121,414,680 $302,247,166 $130,574,269 $66,021,824 $174,203,438 $451,670,969 $117,140,242 $5,235,535 $98,203,690 $84,754,375 $155,444,323 $1,745,032,993
Average B/C Ratio 15.1 12.1 13.6 6.5 8.0 14.5 10.3 7.5 3.6 11.1 5.4 12.6 10.1
Non-Motorized Travel Federal Funds for Non-Motorized $669,091 $1,432,030 $8,012,620 $7,089,050 $865,509 $998,264 $21,581,288 $3,051,368 $250,180 $1,618,737 $4,106,653 $1,725,507 $51,400,297% Federal Funds for Non-Motorized 30% 16% 40% 40% 13% 9% 56% 23% 15% 20% 33% 16% 34%Average B/C Ratio for Non-Motorized 18.8 31.4 15.0 7.1 10.9 17.7 11.2 9.2 2.3 14.5 3.9 23.4 11.5 *
Rural Applications Total Rural Apps Submitted 1 6 6 4 4 8 2 2 0 3 1 2 39Percent of Rural Applications 20% 86% 26% 15% 40% 50% 3% 8% 0% 21% 5% 8% 17%Total Rural Federal Funds Req. $1,126,600 $7,407,600 $3,633,100 $2,948,300 $3,707,500 $7,427,700 $1,383,200 $927,400 $0 $2,471,600 $776,500 $2,632,300 $34,441,800Percent of Rural Fed Funds Req. 50% 85% 18% 17% 56% 69% 4% 7% 0% 31% 6% 25% 23%Average B/C Ratio for Rural Applications 14.6 7.8 12.7 8.5 5.9 16.8 18.9 3.3 0.0 10.5 5.1 21.9 11.9 *
HR3 ApplicationsTotal HR3 Apps Submitted 1 3 5 3 0 7 1 2 0 3 0 2 27Percent of HR3 Applications 20% 43% 22% 12% 0% 44% 2% 8% 0% 21% 0% 8% 12%T t l HR3 F d l F d RTotal HR3 Federal Funds Req. $1,126,600 $3,207,800 $3,111,200 $1,598,300 $0 $6,495,400 $364,500 $927,400 $0 $2,471,600 $0 $2,632,300 $21,935,100Percent of HR3 Fed Funds Req. 50% 37% 16% 9% 0% 60% 1% 7% 0% 31% 0% 25% 15%Average B/C Ratio for HR3 Applications 14.6 11.8 13.7 11.8 0.0 18.1 1.7 3.3 0.0 10.5 0.0 21.9 14.7 *
B/C Ratio by Project Type "Spot Location" 22.68 16.17 13.41 5.93 8.33 8.56 7.25 7.40 2.34 11.23 2.90 5.22 8.25 *"Systemic" 13.64 8.94 13.64 7.01 7.92 19.21 12.35 7.63 6.75 9.87 7.20 19.19 11.59 * "Intersection" 0.00 0.00 15.29 4.96 8.15 11.72 10.13 8.17 2.34 12.84 5.53 9.35 8.97 * "Roadway Segment" 13.32 12.13 13.08 8.23 7.99 20.09 10.54 6.08 6.75 8.54 4.56 17.69 11.24 *
* The Ave. B/C for Project Type is a weighted average based on Total Project Cost of that Project Type
Data Updated as of: 3/18/2014

0
50
100
150
200
250
300
350
400
450
Applications Submitted
Applications Funded
$0
$20,000,000
$40,000,000
$60,000,000
$80,000,000
$100,000,000
$120,000,000
$140,000,000
$160,000,000
Applications Funded
HR3 Eligiable
Rural Non‐Motorized Systemic Spot Location
Roadway Segment
Intersection
# of
App
licat
ion
Local HSIP Results from Cycle 5 and Cycle 6 Funded Projects
Fede
ral F
unds
Feb 19, 2014


Local HSIP Cycles 4, 5 and 6 Intersection & Roadway Improvements Per Million $ Invested
Cycle 4 Cycle 5 Cycle 6
Intersection Roadway0
5
10
15
20
25
30
# of
Inte
rsec
tions
/Mill
ion
$
Mile
s of
Roa
dway
/Mill
ion
$
0
5
10
15
20
25
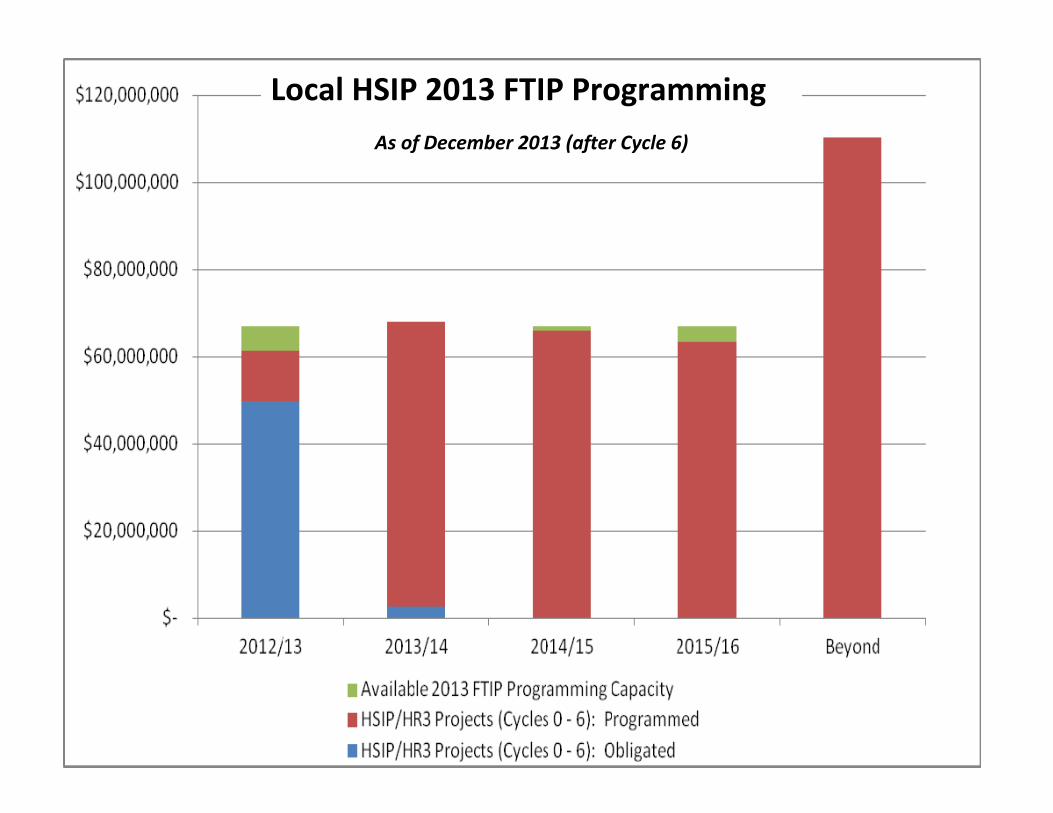
Local HSIP 2013 FTIP Programming
As of December 2013 (after Cycle 6)

January 23, 2014
Caltrans’ Strategic Planning for Local HSIP Cycle 7Constraints and Opportunities
CONSTRAINTS:Funding Level: The local Highway Safety Improvement Program (HSIP) funding went down withMAP 21 as compared to SAFETEA LU funding levels for HSIP and HR3. Currently the Local HSIPonly receives about 35% of the funds the state receives.Local HSIP Obligations: Total HSIP obligations have been significantly below past HSIPapportionments. The Division of Local Assistance’s (DLA) past programming strategies and alower than expected project delivery rate for local projects are two of the primary causes.Programming Capacity: Local HSIP has fully utilized programming capacity of the 2013 FTIP andthe majority of the future 2015 FTIP. DLA goal is to maximize the number of projectsprogrammed in the FTIP (active and beyond years) to maximize the future year obligations.o A large portion of the Local HSIP programming capacity is taken up by old HSIP projects from
Cycles 1 4 that were first programmed years before the 2013 FTIP. Cycles 5 and 6 take upthe remaining capacity; $111M, and $150M programmed in 2012, and 2013, respectively.
TIMING OF THE NEXT HSIP CALL FOR PROJECTS (CYCLE 7):Based on the current constraints, the DLA Office of Bridge and Safety Programs has concludedthe next HSIP call for projects needs to be pushed back to the spring of 2015.o Due to the lack of 2015 programming capacity, the call will likely still only be $100M or less.o Postponing the next call until spring 2015 creates several opportunities for major HSIP
program enhancements. DLA intends to pursue the following list below prior to Cycle 7
OPPORTUNTIES FOR IMPROVING THE EFFECTIVENESS OF THE LOCAL HSIP:Increasing the yearly local HSIP apportionments available for FTIP programming:o Work with the SHSP to evaluate the most effective use of California’s HSIP funding. (Based on
past crash data, the Local HSIP should receive more than 50% of California’s HISP funding)o Pursue the ability to program some of the old projects outside the HSIP’s active FTIP, including:
the $30M in old HR3 apportionments and the nearly $120+M in HSIP carryover OA.Increasing the efficiency of how HSIP projects are programmed: Develop a new process forcollecting accurate expected delivery dates and $$$ for PE, ROW and CON (to be updated yearly).This would enable DLA Program Managers to program projects in the FTIP based on their individualdelivery and could enable some older projects to be moved out of the active FTIP.Improved guidance documents and training for local agencies: Based on the results from Cycle 6,there is still a need for clearer program documents to guide agencies through the applicationprocess. New training options are also needed to complement these new documents.Expediting delivery of existing local HSIP projects: Keep agencies focused on delivering theirsafety projects per the delivery milestones by working with MPOs, RTPAs and Districts to contact allagencies that are late on their delivery and inquire about the delivery issues.Refocus the program further towards low cost systemic improvements: Limit the use of HSIPfunding to only the lowest cost countermeasures that have minimal impacts and can be deliveredquickly.o Considered reducing the time FTIP approval to CON milestone from 30 months to 24 monthsDevelop a new sub program to fund focused PSRs: Consider the opportunity to develop andadminister a new HSIP sub program to fund PSR projects that are focused on low cost, systemicimprovements. Key goals: 1) train and focus local agencies’ attention on safety improvements withthe highest expected benefit to cost ratios and lives saved; 2) provide agencies with pre identified,high B/C candidate projects for future HSIP calls for projects.
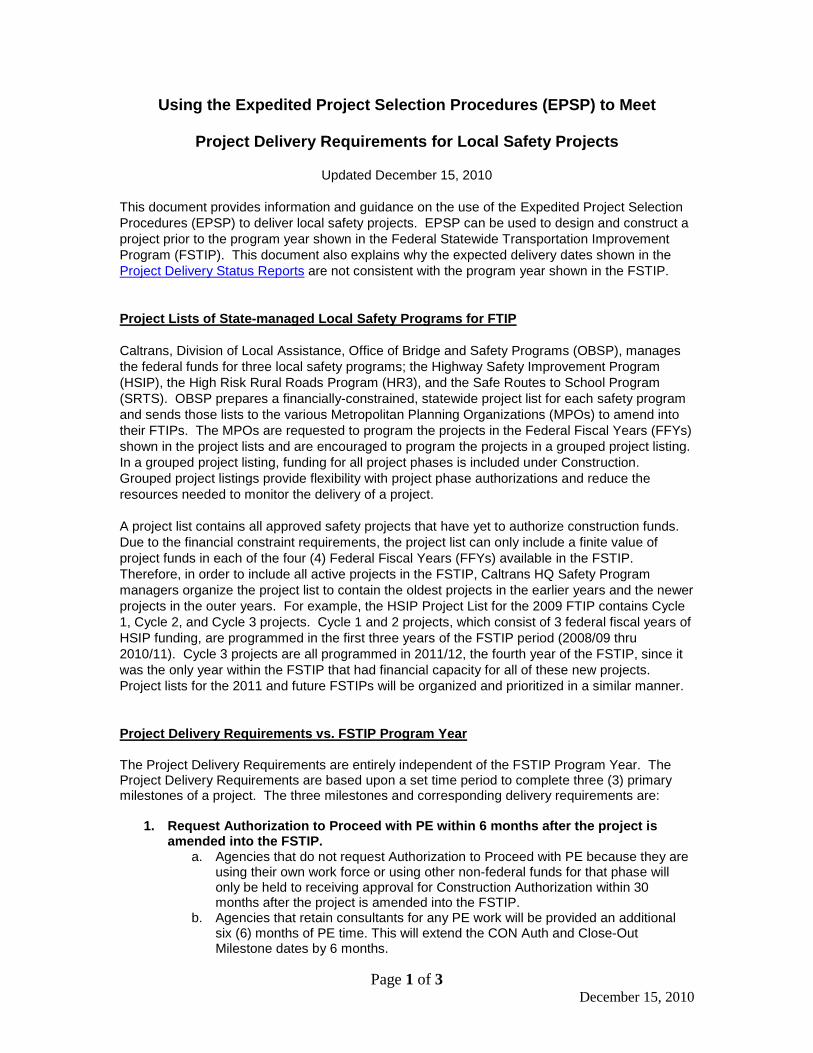
Page 1 of 3 December 15, 2010
Using the Expedited Project Selection Procedures (EPSP) to Meet
Project Delivery Requirements for Local Safety Projects
Updated December 15, 2010 This document provides information and guidance on the use of the Expedited Project Selection Procedures (EPSP) to deliver local safety projects. EPSP can be used to design and construct a project prior to the program year shown in the Federal Statewide Transportation Improvement Program (FSTIP). This document also explains why the expected delivery dates shown in the Project Delivery Status Reports are not consistent with the program year shown in the FSTIP. Project Lists of State-managed Local Safety Programs for FTIP Caltrans, Division of Local Assistance, Office of Bridge and Safety Programs (OBSP), manages the federal funds for three local safety programs; the Highway Safety Improvement Program (HSIP), the High Risk Rural Roads Program (HR3), and the Safe Routes to School Program (SRTS). OBSP prepares a financially-constrained, statewide project list for each safety program and sends those lists to the various Metropolitan Planning Organizations (MPOs) to amend into their FTIPs. The MPOs are requested to program the projects in the Federal Fiscal Years (FFYs) shown in the project lists and are encouraged to program the projects in a grouped project listing. In a grouped project listing, funding for all project phases is included under Construction. Grouped project listings provide flexibility with project phase authorizations and reduce the resources needed to monitor the delivery of a project. A project list contains all approved safety projects that have yet to authorize construction funds. Due to the financial constraint requirements, the project list can only include a finite value of project funds in each of the four (4) Federal Fiscal Years (FFYs) available in the FSTIP. Therefore, in order to include all active projects in the FSTIP, Caltrans HQ Safety Program managers organize the project list to contain the oldest projects in the earlier years and the newer projects in the outer years. For example, the HSIP Project List for the 2009 FTIP contains Cycle 1, Cycle 2, and Cycle 3 projects. Cycle 1 and 2 projects, which consist of 3 federal fiscal years of HSIP funding, are programmed in the first three years of the FSTIP period (2008/09 thru 2010/11). Cycle 3 projects are all programmed in 2011/12, the fourth year of the FSTIP, since it was the only year within the FSTIP that had financial capacity for all of these new projects. Project lists for the 2011 and future FSTIPs will be organized and prioritized in a similar manner. Project Delivery Requirements vs. FSTIP Program Year The Project Delivery Requirements are entirely independent of the FSTIP Program Year. The Project Delivery Requirements are based upon a set time period to complete three (3) primary milestones of a project. The three milestones and corresponding delivery requirements are:
1. Request Authorization to Proceed with PE within 6 months after the project is amended into the FSTIP.
a. Agencies that do not request Authorization to Proceed with PE because they are using their own work force or using other non-federal funds for that phase will only be held to receiving approval for Construction Authorization within 30 months after the project is amended into the FSTIP.
b. Agencies that retain consultants for any PE work will be provided an additional six (6) months of PE time. This will extend the CON Auth and Close-Out Milestone dates by 6 months.

Page 2 of 3 December 15, 2010
2. Request Authorization to Proceed with Construction within 30 months (2 ½ years) after the project is amended into the FSTIP.
3. Complete construction and close-out the project within 54 months (4 ½ years) after the project is amended into the FSTIP.
The date the project is first amended into the FSTIP (i.e. approved by the FHWA) is the date from which all future delivery performance is evaluated. As soon as a project is included in an approved FSTIP, local agencies are expected to move forward with their project delivery and request an authorization to proceed with PE, ROW, or CON, whichever phase is appropriate for their project. When the FFY of the project delivery schedule does not match the FFY in the FSTIP, local agencies must utilize the Expedited Project Selection Procedure (EPSP) prior to requesting authorization to begin work on the project. Expedited Project Selection Procedures (EPSP) Title 23, Code of Federal Regulations (CFR), Sections 450.220(e) and 450.330(a) allows for the advancement of projects within the active period of the approved FTIP and FSTIP. However, in order to access this provision, an MPO, or the California Department of Transportation acting as the MPO for the rural, non-MPO counties, must have an EPSP in place. An EPSP is a project selection process developed by the MPO, State, and public transportation operators, including transit operators, that provides for the advancement or delay of projects for implementation purposes within the active period of the approved FTIP and FSTIP without the need for immediately processing FTIP/FSTIP amendments, unless the EPSP action results in the project crossing analysis years for air quality conformity determinations. However, the impacts of the EPSP action must be included in future FTIP/FSTIP updates, amendments or administrative modifications. 23 CFR Section 450.330(a) specifies that “if the State or public transportation operator(s) wishes to proceed with a project in the second, third, or fourth year of the TIP, the specific project selection procedures stated in paragraphs (b) and (c) of this section must be used unless the MPO, the State, and the public transportation operator(s) jointly develop expedited project selection procedures to provide for the advancement of projects from the second, third, or fourth years of the TIP”. The EPSP must be agreed to by all parties in the project selection process as stated in 23 CFR 450.220(e), and be adopted by the MPO Board. Using the EPSP to Meet Project Delivery Requirements To facilitate the timely delivery of local safety projects, Caltrans anticipates that all agencies may need to use the EPSP. Each MPO is expected to have an EPSP in place which can be used for all federally-funded projects when needed. The following steps outline how Caltrans, local agencies, and MPOs can use the EPSP to ensure that ‘requests for authorization’ for safety projects are approved in a timely manner:
1. When a local agency wants to submit a Request for Authorization (RFA) to proceed with a project that is not programmed in the currently-active fiscal year of the FSTIP, the agency first needs to request approval from the Caltrans District Local Assistance Engineer (DLAE) to use EPSP and advance the project to the current program year.
2. The DLAE will review the EPSP request and the project’s readiness for authorization. If the DLAE determines that the project is ready for authorization, he/she will forward the EPSP request to the HQ Safety Program Manager for review and approval.

Page 3 of 3 December 15, 2010
3. The HQ Safety Program Manager will evaluate the financial capacity of the FSTIP for the current program year. If sufficient capacity exists, he/she will notify the DLAE that the EPSP request has been approved. The DLAE will then inform the local agency and HQ will notify the affected MPO.
4. After the local agency has received notification from the DLAE that their EPSP request was approved, the local agency can complete and submit the RFA to the DLAE. The local agency must indicate that EPSP has been approved on Exhibit 3E - Request for Authorization to Proceed Data Sheet(s) of the Local Assistance Procedures Manual.
Note: All correspondence relating to using the EPSP can be processed with emails. Formal agency letters with letterheads are not necessary.
Summary Through the use of the EPSP, all local agencies with safety projects are encouraged to proceed with the delivery of their project regardless of the year it is programmed in the FSTIP. Caltrans District and Headquarters staff will work with the respective MPO and responsible lead agency to use the EPSP and ensure that authorization requests for all phases are approved as quickly as possible. Internet Links to Related Documents Project Delivery Status Reports and Delivery Requirements http://www.dot.ca.gov/hq/LocalPrograms/HSIP/delivery_status.htm Project Lists of State-managed Local Safety Programs for FTIP: http://www.dot.ca.gov/hq/LocalPrograms/HSIP/FTIP_Info.html

Highway Safety Improvement Program (HSIP) Delivery Report Project List
Data as of 12/31/2013
Unique Project ID Agency Project Location Description of Work
Current Total Project Cost
Estimate($)
Current Programmed
Federal Funds($)
PE Auth Date ROW Auth Date CON Auth Date Closed out Date
Obligated Federal Amt
($)
Last Invoice Payment
Date
Expended Federal Amt
($)
FTIP Approval Date
*
Date PE should be
authorized.(typically 6
months after FTIP approval
date) **
Column1
Date CON should be
authorized.(typically 30 months after
FTIP approval date)
Column2
Delivery Milestone in or Prior to
FFY 13/14?
HSIP4-03-008 El Dorado County Cold Springs Rd. between Fox Print Ct. and Skyview Ln.
Modify super-elevation; widen shoulders; install
signs and striping $ 495,000 $445,500 4/26/2011 8/21/2013 $ 102,600 9/18/2013 $ 75,600 4/8/2011 10/8/11 10/7/13 No
HSIP3-03-008 El Dorado CountyCold Springs Rd., At The
Intersection With Mt. Shasta Ln. Between Pm 3.4 And 3.55
Realign Roadway; Widen Shoulders; Construct
Draininage Improvements; Install
Flashing Beacon Warning Signs
$ 1,024,400 $899,000 7/2/2010 3/7/2013 $ 252,900 9/18/2013 $ 164,965 5/12/2010 11/11/10 11/10/12 Yes
HSIP2-03-015 El Dorado CountyIntersection Of Green Valley Rd.
And North Shingle Rd. To Tennessee Creek Bridge
Realign Roadway; Add 8 Foot Shoulders; Install Traffic Signal With Left And Right Turn Lanes
$ 1,100,000 $900,000 2/9/2009 7/12/2010 $ 900,000 9/17/2013 $ 692,757 12/11/2008 Completed as of 3/31/10 3/31/12 No
HSIP2-03-018 El Dorado County Intersection Of Pleasant Valley Rd. And Oak Hill Rd.
Widen Shoulders; Construct Left Turn Lane $ 1,108,800 $900,000 1/14/2009 5/25/2010 8/14/2012 $ 900,000 9/17/2013 $ 278,649 12/11/2008 Completed
as of 3/31/10 3/31/12 No
HSIP5-03-004 El Dorado CountyIntersections of Green Valley Rd.
with Francisco Dr., El Dorado Hills Blvd and Silva Valley Pkwy.
Upgrade traffic signals (interconnect) $ 270,000 $242,700 3/7/2013 $ 43,300 9/18/2013 $ 15,409 1/22/2013 7/24/13 7/24/15 No
HRRR1-03-021 El Dorado County Latrobe Rd., PM 7.0 to 7.35 Realign Roadway $ 1,426,300 $963,971 8/15/2007 11/2/2007 2/28/2012 $ 1,280,771 10/8/2013 $ 319,510 6/29/2007 Completed as of 3/31/10 3/31/12 No
HRRR1-03-020 El Dorado CountyMarshall Road, one (1) mile east of
the intersection of Hwy 49 and Marshall Road.
Realign Roadway $ 540,600 $485,569 8/15/2007 5/13/2008 7/9/2012 $ 485,569 5/17/2012 $ 485,569 6/29/2007 Completed as of 3/31/10 Completed
as of 3/31/10 No
HSIP3-03-009 El Dorado CountySalmon Falls Rd., South Of The T-
Intersection At Glenesk Ln. Between Pm 7.79 And 7.89
Realign Roadway; Widen Shoulders; Construct
Drainage Improvements; Install Flashing Beacon
$ 1,133,400 $900,000 7/2/2010 9/4/2012 $ 233,100 9/18/2013 $ 202,500 5/12/2010 11/11/10 11/10/12 Yes
HSIP6-03-012 Placerville On Broadway between Carson Rd and Schnell School Rd
Upgrade crosswalks, speed tables, signing and
lighting $ 245,600 $213,500 $ - $ - TBD TBD No
HSIP5-03-006 Lincoln Lincoln Blvd. (SR 65) between Sterling Pkwy. and 7th St.
Upgrade traffic signals; install safety lighting and
bike lanes $ 1,080,000 $900,000 4/2/2013 $ 162,000 $ - 1/22/2013 7/24/13 7/24/15 No
HSIP6-03-010 Placer County 18 various locations throughout Placer County
Install High Friction Surface Treatment $ 1,537,600 $1,383,700 $ - $ - TBD TBD No
HSIP5-03-013 Placer CountyAuburn Folsom Rd. from
approximately 60' N of Willow Ln. to Robin Hood Ln
Construct sidewalks, curb ramps, curb and gutter;
install mid-block $ 994,800 $895,300 5/16/2013 $ 157,500 $ - 3/7/2013 9/6/13 9/6/15 No
HSIP3-03-006 Placer CountyForesthill Rd. 3.2 Miles East Of
The Intersection Of Sr 80 And The "Auburn Ravine - Foresthill Exit"
Improve Horizontal Geometry Of 3 Curves; Repave And Apply A
$ 1,000,000 $900,000 7/19/2010 4/10/2012 $ 900,000 10/15/2013 $ 852,990 5/12/2010 11/11/10 11/10/12 No
FFY 13/14 Delivery
RequirementGeneral Project Information Actual Project Delivery Information
Tracking of Project Delivery Milestones
* For projects in earlier cycles, the FTIP Approval Date shown may have been adjusted for the new program delivery requirements. See the delivery requirements on the DLA webpage for more
The project is in this delivery phase and has more than 3 months to meet the milestone
The project has met and/or moved past the milestone in this phase of delivery
The project has not met the minimum delivery requirement milestone in this phase.
The project has not met the minimum delivery requirement milestone in this phase.
The project is in this phase and will FLAG in the next Qtr Report if the milestone is not met
Page 1 of 5 Printed On: 4/11/2014

Highway Safety Improvement Program (HSIP) Delivery Report Project List
Data as of 12/31/2013
Unique Project ID Agency Project Location Description of Work
Current Total Project Cost
Estimate($)
Current Programmed
Federal Funds($)
PE Auth Date ROW Auth Date CON Auth Date Closed out Date
Obligated Federal Amt
($)
Last Invoice Payment
Date
Expended Federal Amt
($)
FTIP Approval Date
*
Date PE should be
authorized.(typically 6
months after FTIP approval
date) **
Column1
Date CON should be
authorized.(typically 30 months after
FTIP approval date)
Column2
Delivery Milestone in or Prior to
FFY 13/14?
FFY 13/14 Delivery
RequirementGeneral Project Information Actual Project Delivery Information
Tracking of Project Delivery Milestones
* For projects in earlier cycles, the FTIP Approval Date shown may have been adjusted for the new program delivery requirements. See the delivery requirements on the DLA webpage for more
The project is in this delivery phase and has more than 3 months to meet the milestone
The project has met and/or moved past the milestone in this phase of delivery
The project has not met the minimum delivery requirement milestone in this phase.
The project has not met the minimum delivery requirement milestone in this phase.
The project is in this phase and will FLAG in the next Qtr Report if the milestone is not met
HRRR2-03-017 Placer CountyForesthill Road from Lower Lake Clementine Road to Old Auburn
Road
Increase sight distance; construct acceleration
lane $ 1,082,000 $900,000 3/26/2009 4/18/2012 $ 900,000 7/9/2013 $ 860,000 12/11/2008 Completed
as of 3/31/10 3/31/12 No
HSIP4-03-007 Placer County King Rd. between Auburn Folsom Rd. and Sudor Ln.
Widen traveled lanes; construct drainage
improvements $ 645,900 $581,200 5/25/2011 $ 110,700 8/8/2013 $ 70,700 4/8/2011 10/8/11 1/6/14 No
HSIP3-03-005 Placer County
Rollins Lake Rd. For 2 Miles North Of Its Intersection With Sr 174, Including Its Intersection With
Norton Grade Rd.
Construct Segments Of Shoulder Widening And
Guardrail; Realign Roadway Intersection; Install Speed Limit And Curve Warning Signage
$ 1,110,200 $900,000 7/2/2010 2/20/2013 $ 900,000 2/6/2013 $ 181,673 5/12/2010 11/11/10 11/10/12 No
HSIP6-03-011 Placer County Various corridors throughout Placer County
Conduct a Roadway Safety Signing Audit and
upgrade signs $ 1,656,200 $1,490,500 $ - $ - TBD TBD No
HSIP5-03-012 Placer County Various locations throughout Placer County Install pavement markers $ 201,200 $181,000 5/17/2013 $ 16,200 $ - 3/7/2013 9/6/13 9/6/15 No
HSIP5-03-011 Placer County Various locations throughout the county
Install pavement markings $ 1,050,300 $900,000 5/17/2013 $ 20,000 $ - 3/7/2013 9/6/13 9/6/15 No
HSIP5-03-017 Roseville Roseville Rd. from Cirby Way to the city limits Realign roadway $ 3,539,500 $900,000 $ - $ - 3/7/2013 No PE Auth 9/6/15 No
HSIP4-03-006 Citrus Heights Old Auburn Rd. between Fair Oaks Blvd. and Wachtel Way
Widen shoulders; construct Class 1 multi-use trail; install Class II
bike lanes
$ 716,100 $644,400 6/22/2011 9/3/2013 $ 644,400 12/5/2013 $ 106,200 4/8/2011 10/8/11 11/6/13 No
HSIP6-03-001 Citrus HeightsOn Sunrise Blvd between
Woodmore Oaks Dr and Sayonara Dr
Pavement overlay; Construct curb ramp, sidewalk, curb, gutter,
drain inlet; Install lighting, traffic signals (interconnect) storm
$ 934,500 $840,800 $ - $ - TBD TBD No
HSIP4-03-003 Citrus Heights Sunrise Blvd./Sungarden Dr. Install traffic signals and sidewalks $ 1,113,900 $900,000 12/6/2011 $ 85,500 10/17/2013 $ 65,109 4/8/2011 10/8/11 4/8/14 No
HSIP5-03-005 Elk Grove
Franklin Blvd. between Elk Grove Blvd. and Big Horn Blvd.;
Bruceville Rd. between Elk Grove Blvd. and Big Horn Blvd.
Upgrade traffic signals (interconnect) $ 150,000 $131,000 4/23/2013 $ 96,067 $ - 3/7/2013 9/6/13 9/6/15 No
HSIP6-03-002 Elk GroveVarious locations on Grant Line Rd , Bradshaw Rd., Kammerer
Rd., and Waterman Rd.Modify shoulders $ 130,000 $117,000 $ - $ - TBD TBD No
Page 2 of 5 Printed On: 4/11/2014

Highway Safety Improvement Program (HSIP) Delivery Report Project List
Data as of 12/31/2013
Unique Project ID Agency Project Location Description of Work
Current Total Project Cost
Estimate($)
Current Programmed
Federal Funds($)
PE Auth Date ROW Auth Date CON Auth Date Closed out Date
Obligated Federal Amt
($)
Last Invoice Payment
Date
Expended Federal Amt
($)
FTIP Approval Date
*
Date PE should be
authorized.(typically 6
months after FTIP approval
date) **
Column1
Date CON should be
authorized.(typically 30 months after
FTIP approval date)
Column2
Delivery Milestone in or Prior to
FFY 13/14?
FFY 13/14 Delivery
RequirementGeneral Project Information Actual Project Delivery Information
Tracking of Project Delivery Milestones
* For projects in earlier cycles, the FTIP Approval Date shown may have been adjusted for the new program delivery requirements. See the delivery requirements on the DLA webpage for more
The project is in this delivery phase and has more than 3 months to meet the milestone
The project has met and/or moved past the milestone in this phase of delivery
The project has not met the minimum delivery requirement milestone in this phase.
The project has not met the minimum delivery requirement milestone in this phase.
The project is in this phase and will FLAG in the next Qtr Report if the milestone is not met
HSIP5-03-014 Rancho Cordova Aramon Dr. (Studarus Dr.)/Coloma Rd. Install traffic signals $ 532,200 $464,300 2/13/2013 $ 47,700 $ - 1/22/2013 7/24/13 7/24/15 No
HSIP5-03-015 Rancho Cordova Coloma Rd. between Folsom Blvd. and Sunrise Blvd.
Upgrade traffic signals (interconnect); install
traffic cameras $ 935,500 $833,300 2/13/2013 $ 70,100 $ - 1/22/2013 7/24/13 7/24/15 No
HSIP5-03-016 Rancho Cordova Douglas Rd./Grant Line Rd.
Install traffic signal; widen roadway (to
accommodate left-turn and right-turn pockets
and bike lanes)
$ 1,040,600 $702,400 $ - $ - 3/7/2013 No PE Auth 9/6/15 No
HSIP6-03-013 Rancho CordovaVarious locations on Sunrise Blvd, Folsom Blvd, Zinfandel Dr, and
White Rock Rd
Install new traffic signal controllers, expand the
existing coordinated signal system and install
$ 1,833,200 $1,500,000 $ - $ - TBD TBD No
HSIP4-03-001 Rancho Cordova White Rock Rd., W of Zinfandel Dr.
Install sidewalks, bike lanes, and crosswalks $ 398,000 $358,100 8/1/2011 6/21/2012 $ 358,100 7/9/2013 $ 308,290 4/8/2011 10/8/11 12/7/13 No
HSIP3-03-001 Sacramento 12Th St. Between Richards Blvd. And "L" St.
Upgrade Traffic Signal System; Repair Conduit Infrastructure Between
$ 1,300,000 $900,000 8/17/2010 9/17/2013 $ 900,000 6/13/2013 $ 81,000 5/12/2010 11/11/10 11/10/12 No
HSIP6-03-014 Sacramento 9 locations throughout the City of Sacramento Install flashing beacon $ 1,641,700 $1,477,500 $ - $ - TBD TBD No
HSIP2-03-001 Sacramento Intersection Of Alhambra Blvd. And Folsom Blvd.
Upgrade Traffic Signal With Protected/Split
Phases; Add And Upgrade Pedestrian
Improvements
$ 322,431 $290,188 12/3/2009 8/29/2011 $ 290,188 9/19/2013 $ 247,557 12/11/2008 Completed as of 3/31/10 3/31/12 No
HSIP1-03-001 Sacramento Intersection Of Rio Linda Blvd At Bell Avenue.
Upgrade Traffic Signals To Include Left Turn
Phase $ 405,100 $364,590 7/21/2008 1/31/2012 $ 364,590 6/6/2013 $ 324,590 10/1/2007 Completed
as of 3/31/10 3/31/12 No
HSIP5-03-018 Sacramento Mack Rd./Valley Hi Dr. (La Mancha Way)
Upgrade traffic signals; install right-turn lane $ 551,000 $493,800 5/9/2013 $ 69,400 11/29/2013 $ 1,399 3/7/2013 9/6/13 9/6/15 No
HSIP6-03-015 Sacramento
On Carlson Dr between approx. 250' north of H St and 250' south of J St; On H ST between Camilla
Ave and Carlson Dr
Upgrade traffic signals, signs, and striping;
Construct curb ramps and crosswalks
$ 1,308,400 $1,163,900 $ - $ - TBD TBD No
HSIP6-03-019 Sacramento County 32 intersections throughout Sacramento County Upgrade traffic signals $ 1,060,900 $954,700 $ - $ - TBD TBD No
HSIP2-03-014 Sacramento County At Intersection Of Watt Ave. And Larchmont Dr.
Install Traffic Signal; Construct Sidewalks,
Curb Ramps Pedestrian $ 444,800 $378,870 3/24/2011 2/22/2013 $ 378,870 7/3/2012 $ 378,870 12/11/2008 No PE Auth 9/30/12 No
HSIP5-03-019 Sacramento County Fair Oaks Blvd. between Day Dr. and Arden Way
Install sidewalks, curb ramps, curb and gutter $ 758,700 $682,600 4/2/2013 $ 121,500 12/27/2013 $ 35,100 3/7/2013 9/6/13 9/6/15 No
Page 3 of 5 Printed On: 4/11/2014
Highway Safety Improvement Program (HSIP) Delivery Report Project List
Data as of 12/31/2013
Unique Project ID Agency Project Location Description of Work
Current Total Project Cost
Estimate($)
Current Programmed
Federal Funds($)
PE Auth Date ROW Auth Date CON Auth Date Closed out Date
Obligated Federal Amt
($)
Last Invoice Payment
Date
Expended Federal Amt
($)
FTIP Approval Date
*
Date PE should be
authorized.(typically 6
months after FTIP approval
date) **
Column1
Date CON should be
authorized.(typically 30 months after
FTIP approval date)
Column2
Delivery Milestone in or Prior to
FFY 13/14?
FFY 13/14 Delivery
RequirementGeneral Project Information Actual Project Delivery Information
Tracking of Project Delivery Milestones
* For projects in earlier cycles, the FTIP Approval Date shown may have been adjusted for the new program delivery requirements. See the delivery requirements on the DLA webpage for more
The project is in this delivery phase and has more than 3 months to meet the milestone
The project has met and/or moved past the milestone in this phase of delivery
The project has not met the minimum delivery requirement milestone in this phase.
The project has not met the minimum delivery requirement milestone in this phase.
The project is in this phase and will FLAG in the next Qtr Report if the milestone is not met
HSIP4-03-004 Sacramento County Fair Oaks Blvd. between San Ramon Way and Eastern Ave. Install median barrier $ 758,700 $682,700 5/3/2011 10/18/2011 $ 613,146 12/6/2012 $ 548,870 4/8/2011 10/8/11 10/7/13 No
HSIP3-03-007 Sacramento County Florin Rd. At East Southgate Dr.; Fruitridge Rd. At Mendocino Blvd. Install Raised Median $ 99,368 $73,829 8/15/2011 12/11/2012 $ 73,829 8/14/2012 $ 73,829 5/12/2010 No PE Auth 11/10/12 No
HSIP5-03-020 Sacramento County Howe Ave. between El Camino Ave. and Shaw St.
Construct sidewalks, curb ramps, curb and gutter;
install mid-block signalized crosswalk
$ 799,400 $719,460 4/30/2013 $ 120,000 12/27/2013 $ 34,422 3/7/2013 9/6/13 9/6/15 No
HSIP1-03-007 Sacramento County Intersection Of Cypress Ave. And Garfield Ave.
Install Traffic Signals With Minor Widening. $ 877,250 $392,325 3/26/2008 9/6/2011 $ 392,325 4/7/2010 $ 392,325 10/1/2007 Completed
as of 3/31/10 Completed as of 3/31/10 No
HSIP6-03-016 Sacramento County On Cottage Way between Cortez Lane and Watt Ave
Install bike lanes, a "road diet" (reduce travel lanes from 4 to 3) and modify
$ 700,000 $630,000 $ - $ - TBD TBD No
HSIP5-03-021 Sacramento County Ten (10) signalized intersections throughout the city
Provide advanced "dilemma zone"
protection for the high $ 313,800 $282,200 8/1/2013 $ 50,400 $ - 3/7/2013 9/6/13 9/6/15 No
HSIP6-03-017 Sacramento County Various locations throughout Sacramento County
Construct sidewalks, curb ramps, curbs and gutters $ 1,488,200 $1,339,200 $ - $ - TBD TBD No
HSIP6-03-018 Sacramento County Various locations throughout Sacramento County
Construct sidewalks, curb ramps, curbs and gutters;
Upgrade traffic signals $ 1,570,100 $1,413,000 $ - $ - TBD TBD No
HSIP1-03-002 Live Oak Sr99 (Live Oak Blvd) At Elm Street.
Install New Traffic Signals With Interconnects To
Union Pacific Rr Crossing And Existing Signal At
Next Intersection.
$ 1,219,527 $641,274 6/10/2005 9/20/2011 $ 641,274 10/31/2013 $ 566,796 11/30/2007 Completed as of 3/31/10 3/31/12 No
HSIP2-03-010 Sutter County
Butte House Rd. Between Humphrey Rd. And A Point 3500 Feet East Of East Butte House
Rd
Widen Shoulders $ 882,200 $632,237 7/8/2009 12/11/2011 $ 632,237 7/11/2013 $ 491,943 12/11/2008 Completed as of 3/31/10 3/31/12 No
HSIP6-03-020 Sutter County Various locations throughout Sutter County
Install stripping, pavement markers, and
Raised pavement $ 897,300 $807,400 $ - $ - TBD TBD No
HSIP5-03-025 Yuba City 14 intersections within the City limits
Upgrade bike lanes striping $ 128,600 $115,700 $ - $ - 3/7/2013 9/6/13 9/6/15 Yes
HSIP5-03-003 Davis Intersetions of Fifth St. with C, D, E, I, J and K Streets.
Install crosswalks and safety lighting $ 304,000 $200,000 3/14/2011 7/18/2013 $ 200,000 9/25/2013 $ - 1/22/2013 7/24/13 7/24/15 No
HSIP1-03-008 Woodland Intersection Of Sr16 At Kentucky Ave/County Road 20.
Cooperative Project With Caltrans. Install New Traffic Signals And Modify Intersection.
Woodland Share 25% For Kentucky Avenue.
$ 1,988,800 $613,855 5/8/2009 9/6/2013 $ 613,855 10/7/2011 $ 613,855 10/1/2007 Completed as of 3/31/10 Completed
as of 3/31/10 No
Page 4 of 5 Printed On: 4/11/2014

Highway Safety Improvement Program (HSIP) Delivery Report Project List
Data as of 12/31/2013
Unique Project ID Agency Project Location Description of Work
Current Total Project Cost
Estimate($)
Current Programmed
Federal Funds($)
PE Auth Date ROW Auth Date CON Auth Date Closed out Date
Obligated Federal Amt
($)
Last Invoice Payment
Date
Expended Federal Amt
($)
FTIP Approval Date
*
Date PE should be
authorized.(typically 6
months after FTIP approval
date) **
Column1
Date CON should be
authorized.(typically 30 months after
FTIP approval date)
Column2
Delivery Milestone in or Prior to
FFY 13/14?
FFY 13/14 Delivery
RequirementGeneral Project Information Actual Project Delivery Information
Tracking of Project Delivery Milestones
* For projects in earlier cycles, the FTIP Approval Date shown may have been adjusted for the new program delivery requirements. See the delivery requirements on the DLA webpage for more
The project is in this delivery phase and has more than 3 months to meet the milestone
The project has met and/or moved past the milestone in this phase of delivery
The project has not met the minimum delivery requirement milestone in this phase.
The project has not met the minimum delivery requirement milestone in this phase.
The project is in this phase and will FLAG in the next Qtr Report if the milestone is not met
HSIP4-03-009 Woodland Main St./Cleveland St. Upgrade traffic signals $ 280,300 $252,200 8/29/2011 $ 30,548 6/11/2013 $ 21,737 4/8/2011 10/8/11 10/7/13 No
HSIP2-03-011 Yolo County County Road 22 From Cr 26 To Cr 128A
Widen Shoulders; Rehab Roadway; Install Rumble Strips On Shoulders And
$ 1,381,000 $900,000 3/4/2009 2/23/2011 $ 686,815 12/11/2012 $ 653,862 12/11/2008 Completed as of 3/31/10 3/31/12 No
HSIP5-03-024 Yolo County County Road 31/County Road 95 Install left-turn lanes $ 1,000,000 $899,900 8/22/2013 $ 160,560 $ - 3/7/2013 9/6/13 9/6/15 No
HSIP5-03-023 Yolo County County Road 98 between County Roads 25A and 27
Widen and pave shoulders; remove fixed
objects $ 1,415,100 $900,000 10/18/2001 11/4/2008 4/30/2013 $ 900,000 12/12/2013 $ 844,520 1/22/2013 7/24/13 7/24/15 No
HRRR1-03-018 Yolo County CR 140 between CR 141 and CR 142
Widen or Improve Shoulder $ 1,120,000 $900,000 12/18/2007 4/30/2010 11/8/2013 $ 900,000 6/27/2013 $ 900,000 6/29/2007 Completed
as of 3/31/10 3/31/12 No
HRRR1-03-019 Yolo County CR 23 between CR 86A and CR 86B
Widen or Improve Shoulder $ 680,000 $612,000 12/18/2007 9/17/2008 7/15/2010 9/12/2013 $ 612,000 6/27/2013 $ 612,000 6/29/2007 Completed
as of 3/31/10 3/31/12 No
HSIP6-03-022 Yuba CountyHammonton Smartville Rd
between S Golden Parkway and approx. 1 mile west
Widen and pave shoulder, including
installation of safety edge $ 665,000 $598,500 $ - $ - TBD TBD No
HSIP5-03-026 Yuba County
Hammonton-Smartsville Rd. from 0.18 mile E of Doolittle Gate Rd. to 2.28 miles E of Doolittle Gate
Rd.
Widen and pave shoulders, curve
corrections $ 1,123,600 $900,000 4/3/2013 $ 94,500 12/5/2013 $ 46,027 3/7/2013 9/6/13 9/6/15 No
HSIP3-03-003 Yuba CountyHammonton-Smartsville Rd. From 0.7 Miles West To 2 Miles West
Of South Golden Parkway
Widen The Typical Shoulder Section To 4' Of
Pavement With 3' Of Aggregate Base Rock
$ 645,000 $580,500 7/20/2010 2/20/2013 $ 580,500 8/13/2013 $ 544,045 5/12/2010 11/11/10 11/10/12 No
HSIP1-03-004 Yuba CountyIntersection Of Hammonton-
Smartville Road And Simpson Lane In Linda.
Install New 3-Phase Traffic Signal. $ 338,739 $323,180 4/4/2008 7/22/2009 8/12/2010 1/2/2013 $ 323,180 3/6/2012 $ 323,180 11/30/2007 Completed
as of 3/31/10 3/31/12 No
HRRR1-03-013 Yuba County Intersection of Spenceville Rd. at Camp Far West/Monarch Trail
New left-turn lane at nonsignalized intersection $ 395,000 $355,500 12/18/2007 3/4/2009 5/25/2010 8/1/2013 $ 355,500 6/26/2012 $ 355,500 6/29/2007 Completed
as of 3/31/10 3/31/12 No
HRRR2-03-014 Yuba County Loma Rica Road from Verjeles Rd. to Marysville Rd.
Widen shoulders; extend culverts; improve drainage; install
pavement markings and striping
$ 1,055,000 $900,000 3/4/2009 7/30/2012 8/22/2013 $ 900,000 12/5/2013 $ 132,377 12/11/2008 Completed as of 3/31/10 3/31/12 No
HSIP3-03-004 Yuba County North Beale Rd. From Feather River Blvd. To Linda Ave. Install Raised Median $ 1,100,000 $900,000 7/20/2010 9/18/2012 $ 900,000 12/5/2013 $ 796,001 5/12/2010 11/11/10 11/10/12 No
HSIP6-03-023 Yuba County On Feather River Blvd between County Rd 512 and Algodon Rd
Improve horizontal alignments $ 1,276,800 $1,149,100 $ - $ - TBD TBD No
Page 5 of 5 Printed On: 4/11/2014

4/15/2014
MPO Total # of Projects
Delay Projects In PE Phase
Delay Projects In CON Phase
Total Delay Projects
% of MPO Projects that are Currently Delayed
Cycle 6 FTIP Approval Date by FHWA
BCAG 12 1 2 3 25% 3/4/2014KCAG 4 1 0 1 25%MCTC 4 0 1 1 25% 2/10/2014RURAL 85 2 12 14 16% 12/2/2013SCAG 452 8 55 63 14%
AMBAG 31 0 4 4 13% 2/13/2014MTC 157 6 13 19 12% 2/26/2014
TCAG 25 0 3 3 12% 1/30/2014STANCOG 17 1 1 2 12% 1/9/2014
SACOG 70 1 6 7 10% 1/27/2014SBCAG 22 0 2 2 9% 1/1/2014
SANDAG 69 0 6 6 9% 2/27/2014FCOG 49 1 3 4 8% 2/10/2014SRTA 19 0 1 1 5% 2/20/2014
SJCOG 24 0 1 1 4%KCOG 31 0 0 0 0% 1/30/2014MCAG 6 0 0 0 0% 11/22/2013
SLOCOG 10 0 0 0 0%Total 1087 21 110 131 12%
HSIP & HRRR Projects with Milestone Delays
AS of April 1, 2014

Item #4 Regional Planning Partnership April 16, 2014 2014 SACOG Delivery Plan Update Issue: What projects are poised for delivery in 2014 and what is SACOG doing to ensure that it meets its project delivery goals and targets? Recommendation: None. This is for information only. Discussion: SACOG collected delivery information from sponsors of projects slated to receive the following federal funds: Congestion Mitigation and Air Quality (CMAQ), Regional Surface Transportation Program (RSTP), and Regional Improvement Program (RIP). The attached list shows which projects intend to submit requests for authorization (RFAs) in order to obligate federal funds in federal fiscal year (FFY) 2014 so that they can proceed with federally reimbursable work.
If all of the project funding in Tiers I and II of the 2014 Delivery Plan were obligated in FFY 2014, SACOG would exceed its obligation authority (OA) target by $16.5 million (134 percent of its $48.2 million target). OA is available capacity to expend funds. Apportionment targets are separate from OA; apportionment is available funding. If all CMAQ projects were to deliver, SACOG would exceed its CMAQ apportionment by $7.3 million (21 percent above $34.2 million target). If all RSTP projects delivered, SACOG would still have a balance of $13.5 million (63 percent below $38.5 million target). Projected delivery for 2014 is modest and may still meet SACOG’s targets. Although it would seem that the region is on track, historically, delivery of federally funded transportation projects has been well below 100 percent of projections. Often, only two thirds of those projects that said they would deliver actually delivered. Should delivery slip by more than 25 percent, SACOG would fall short of using its entire obligation authority. Creative Approaches for 2014 SACOG has had success creating opportunities for other projects to advance to balance delivery failure. One way SACOG does this is through its tiered prioritization process. Projects in Tier I have funds programmed in the current year, FFY 2014, and have delivery priority until February 1, 2014. Projects in Tier II are programmed in other years of the Metropolitan Transportation Improvement Program (MTIP), but share delivery priority with Tier I projects from February 1 until May 1, 2014. Tier III projects are those that desire a loan of CMAQ or RSTP funds. After May 1, 2014, SACOG may loan these projects funding in order to help meet overall delivery targets.
In past years, Tiers I and II added up to SACOG meeting 150 percent of its obligation authority (OA) delivery targets. This year, the two tiers add up to only 134 percent. In order to ensure more than 100 percent of OA delivery, SACOG will pursue Tier III loans for projects that wish to borrow CMAQ or RSTP funds and pay them back with local or state funds. Tier III currently has $23.2 million in projects wishing to deliver. If all three tiers delivered, SACOG would hit 182 percent of its OA delivery target.

There is a downside to this delivery strategy. If delivery is strong and SACOG runs out of apportionment or the state runs out of obligation authority, then some projects won’t be able to obligate in FFY 2014. They will need either to wait for their tier window in 2015, or else use advance construction. But the benefits are that SACOG is likely to win additional OA for the region by over-delivering its OA and participating in “August Redistribution,” which is the federal redistribution of leftover OA from the rest of the country. Purpose, Goals, Objectives, and Strategies[s1] The Delivery Plan is a tool SACOG employs as part of a series of objectives and strategies intended to help SACOG achieve its project delivery goals.
Goals 1. Promptly implement the Metropolitan Transportation Plan/Sustainable Communities Strategy
for 2035(MTP/SCS). 2. Ensure that no funding is lost from the region. 3. Win additional funding for the region.
Objectives
1. Help individual MTP/SCS projects deliver on time or earlier. 2. Deliver and exceed the region’s annual obligation authority (OA) early and before the end of
the fiscal year. 3. Deliver or exceed the region’s entire apportionment for CMAQ and RSTP early and before the
end of the fiscal year. Strategies
1. Coordinate with project sponsors, Caltrans Local Assistance, and federal partners through phone calls, emails, and regular meetings.
2. Provide any assistance possible, such as helping sponsors surmount delivery obstacles and streamlining MTIP amendments.
3. Pursue creative approaches, such as offering Tier III loans, facilitating funding swaps, borrowing apportionments and/or obligation authority from other regions, and taking advantage of toll credits.
JLC:gg Attachments Key Staff: Sharon Sprowls, Senior Program Specialist, (916) 340-6235 Renée DeVere-Oki, Programming and Project Delivery Team Manager, (916) 340-6219 Sam Shelton, Associate Planner, (916) 340-6251 José Luis Cáceres, Associate Planner, (916) 340-6218
1400701

SACOG 2014 Delivery Information for CMAQ and RSTP Funded ProjectsUpdated 04-15-2014
By Feb 1 By May 1 After May 1 Grand TotalTier I, II, and III projects with RSTP and CMAQ sorted by lead agencyTier I RSTP and CMAQ Obligated as of 04-13-2014 8,886,550$ 350,108$ -$ 9,236,658$
City of Placerville -$ 214,592$ -$ 214,592$ Clay Street at Cedar Ravine -$ 214,592$ -$ 214,592$
City of Rancho Cordova 1,879,000$ -$ -$ 1,879,000$ Sunrise Blvd. Complete Streets Rehabilitation 1,879,000$ -$ -$ 1,879,000$
City of Rocklin -$ 135,516$ -$ 135,516$ Pacific Street-Bikeway/Neighborhood Electric Vehicle Expansion Project -$ 135,516$ -$ 135,516$
City of Roseville 2,591,780$ -$ -$ 2,591,780$ Oak Street Improvements 2,591,780$ -$ -$ 2,591,780$
County of El Dorado 60,770$ -$ -$ 60,770$ Francisco Drive Right-Turn Pocket 60,770$ -$ -$ 60,770$
County of Yuba 3,569,000$ -$ -$ 3,569,000$ SR 70/Feather River Blvd. Interchange 3,569,000$ -$ -$ 3,569,000$
Sac. Metro Air Quality Management District 600,000$ -$ -$ 600,000$ Spare the Air Phase 2 600,000$ -$ -$ 600,000$
SACOG 186,000$ -$ -$ 186,000$ Programming and Monitoring (RSTP) Phase 2 186,000$ -$ -$ 186,000$
Tier I RSTP and CMAQ programmed in FFY 2014 6,589,647$ 22,866,695$ 12,131,090$ 41,587,432$ Caltrans District 3 -$ -$ 900,000$ 900,000$
Feather River Parkway -$ -$ 900,000$ 900,000$ City of Citrus Heights -$ 1,181,913$ -$ 1,181,913$
Auburn Blvd Complete Streets - Phase 2 (Rusch Park to Northern City Limits) -$ 1,062,000$ -$ 1,062,000$ Mariposa Safe Routes to School - Phase 3 -$ 119,913$ -$ 119,913$
City of Colfax -$ 200,000$ -$ 200,000$ Grass Valley Street Railroad Crossing Pedestrian and Bike Improvements -$ 200,000$ -$ 200,000$
City of Elk Grove 400,000$ 640,000$ -$ 1,040,000$ Complete Streets Reconstruction - Waterman Rd. -$ 576,000$ -$ 576,000$ ITS Master Plan - Phase 4 Implementation -$ 64,000$ -$ 64,000$ Old Town Elk Grove Streetscape Improvements - Phase 2 400,000$ -$ -$ 400,000$
Includes all projects planning to obligate CMAQ or RSTP, with expected RFAs for the entire FFY 2014, which covers October 2013 through September 2014. Some of these projects may have already obligated.
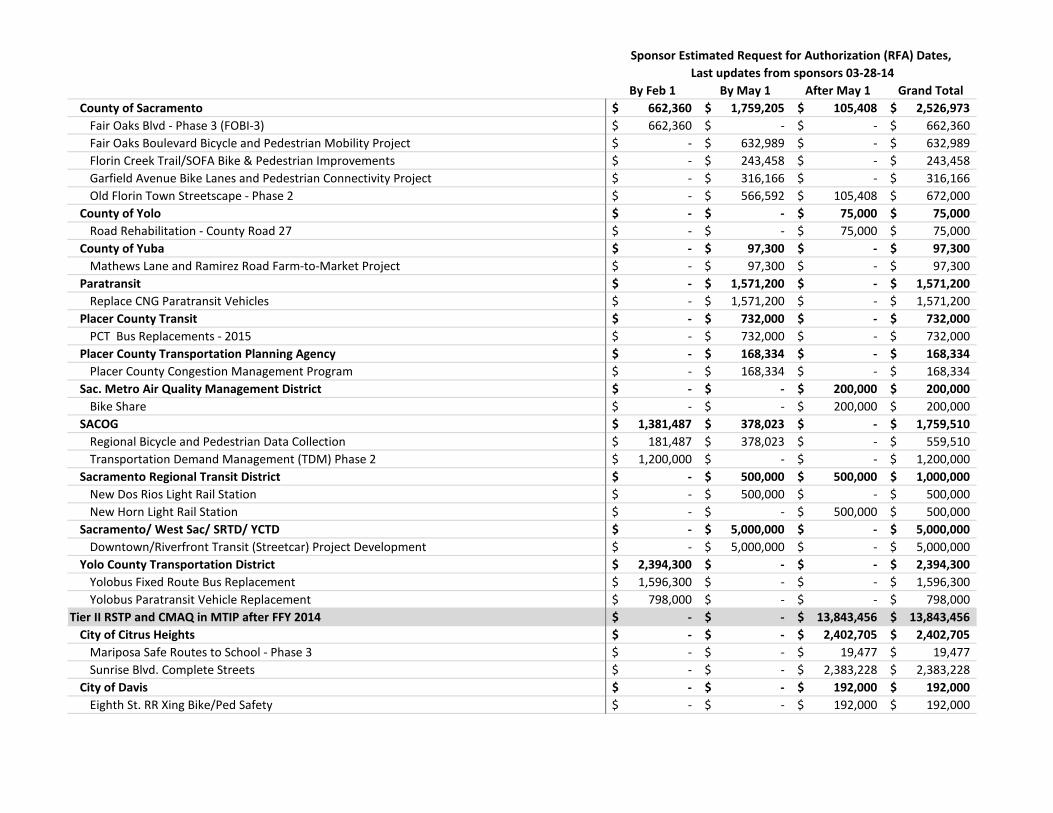
Sponsor Estimated Request for Authorization (RFA) Dates, Last updates from sponsors 03-28-14

By Feb 1 By May 1 After May 1 Grand Total
Sponsor Estimated Request for Authorization (RFA) Dates, Last updates from sponsors 03-28-14
City of Folsom -$ 500,000$ 1,715,100$ 2,215,100$ Green Valley Road Widening -$ 500,000$ -$ 500,000$ Lake Natoma Trail – Gap Closure -$ -$ 1,715,100$ 1,715,100$
City of Lincoln -$ 2,313,911$ -$ 2,313,911$ Lincoln Blvd. Streetscape - Phase 1 -$ 2,313,911$ -$ 2,313,911$
City of Placerville -$ -$ 762,000$ 762,000$ Western Placerville Interchanges Phase 1B -$ -$ 762,000$ 762,000$
City of Rancho Cordova 215,637$ 190,000$ 330,216$ 735,853$ Folsom Blvd Complete Streets -Phase 4 -$ -$ 330,216$ 330,216$ Rancho Cordova Elementary School Bicycle and Pedestrian Improvement Project 215,637$ -$ -$ 215,637$ Traffic Management Center -$ 190,000$ -$ 190,000$
City of Sacramento 100,000$ 1,680,416$ 2,700,000$ 4,480,416$ Complete Street Rehabilitation - Bell Avenue -$ 914,944$ -$ 914,944$ Complete Street Rehabilitation - Fruitridge Road -$ 110,000$ -$ 110,000$ Complete Street Rehabilitation - Power Inn Road 100,000$ -$ -$ 100,000$ Meadowview Road Streetscape Project -$ 443,000$ -$ 443,000$ R Street Corridors Phase II Streetscape Improvements, 16th to 18th Streets -$ -$ 2,700,000$ 2,700,000$ South Sacramento Parkway Trail - West -$ 212,472$ -$ 212,472$
City of West Sacramento 110,663$ 442,700$ -$ 553,363$ Broadway Bridge Project Study Report -$ 442,700$ -$ 442,700$ Sycamore Trail/Westacre and Bryte Bicycle Routes 110,663$ -$ -$ 110,663$
City of Winters -$ -$ 646,269$ 646,269$ Walnut Lane Roundabout -$ -$ 646,269$ 646,269$
City of Yuba City 680,000$ 3,185,000$ -$ 3,865,000$ Feather River Bridge at 5th Street -$ 3,185,000$ -$ 3,185,000$ Garden Highway Bicycle Lanes and Sidewalks 680,000$ -$ -$ 680,000$
County of El Dorado 645,200$ -$ 1,833,000$ 2,478,200$ El Dorado Trail Extension - Missouri Flat Road to El Dorado -$ -$ 745,000$ 745,000$ El Dorado Trail Extension -Los Trampas to Halcon -$ -$ 55,000$ 55,000$ Francisco Drive Right-Turn Pocket -$ -$ 708,000$ 708,000$ Northside School Class I Bike Path - Phase 1 & 2 645,200$ -$ -$ 645,200$ Silva Valley Bike Path -$ -$ 325,000$ 325,000$
County of Placer -$ 2,326,693$ 2,364,097$ 4,690,790$ Auburn Folsom Rd Class II Bike Lane -$ -$ 558,240$ 558,240$ Cook Riolo Road Pathway -$ -$ 880,857$ 880,857$ HMA Overlay, Various County Roads (Yr1) -$ 2,326,693$ -$ 2,326,693$ Pedestrian Improvements along Hwy 49, Education Street, and Town Court -$ -$ 925,000$ 925,000$
By Feb 1 By May 1 After May 1 Grand Total
Sponsor Estimated Request for Authorization (RFA) Dates, Last updates from sponsors 03-28-14
County of Sacramento 662,360$ 1,759,205$ 105,408$ 2,526,973$ Fair Oaks Blvd - Phase 3 (FOBI-3) 662,360$ -$ -$ 662,360$ Fair Oaks Boulevard Bicycle and Pedestrian Mobility Project -$ 632,989$ -$ 632,989$ Florin Creek Trail/SOFA Bike & Pedestrian Improvements -$ 243,458$ -$ 243,458$ Garfield Avenue Bike Lanes and Pedestrian Connectivity Project -$ 316,166$ -$ 316,166$ Old Florin Town Streetscape - Phase 2 -$ 566,592$ 105,408$ 672,000$
County of Yolo -$ -$ 75,000$ 75,000$ Road Rehabilitation - County Road 27 -$ -$ 75,000$ 75,000$
County of Yuba -$ 97,300$ -$ 97,300$ Mathews Lane and Ramirez Road Farm-to-Market Project -$ 97,300$ -$ 97,300$
Paratransit -$ 1,571,200$ -$ 1,571,200$ Replace CNG Paratransit Vehicles -$ 1,571,200$ -$ 1,571,200$
Placer County Transit -$ 732,000$ -$ 732,000$ PCT Bus Replacements - 2015 -$ 732,000$ -$ 732,000$
Placer County Transportation Planning Agency -$ 168,334$ -$ 168,334$ Placer County Congestion Management Program -$ 168,334$ -$ 168,334$
Sac. Metro Air Quality Management District -$ -$ 200,000$ 200,000$ Bike Share -$ -$ 200,000$ 200,000$
SACOG 1,381,487$ 378,023$ -$ 1,759,510$ Regional Bicycle and Pedestrian Data Collection 181,487$ 378,023$ -$ 559,510$ Transportation Demand Management (TDM) Phase 2 1,200,000$ -$ -$ 1,200,000$
Sacramento Regional Transit District -$ 500,000$ 500,000$ 1,000,000$ New Dos Rios Light Rail Station -$ 500,000$ -$ 500,000$ New Horn Light Rail Station -$ -$ 500,000$ 500,000$
Sacramento/ West Sac/ SRTD/ YCTD -$ 5,000,000$ -$ 5,000,000$ Downtown/Riverfront Transit (Streetcar) Project Development -$ 5,000,000$ -$ 5,000,000$
Yolo County Transportation District 2,394,300$ -$ -$ 2,394,300$ Yolobus Fixed Route Bus Replacement 1,596,300$ -$ -$ 1,596,300$ Yolobus Paratransit Vehicle Replacement 798,000$ -$ -$ 798,000$
Tier II RSTP and CMAQ in MTIP after FFY 2014 -$ -$ 13,843,456$ 13,843,456$ City of Citrus Heights -$ -$ 2,402,705$ 2,402,705$
Mariposa Safe Routes to School - Phase 3 -$ -$ 19,477$ 19,477$ Sunrise Blvd. Complete Streets -$ -$ 2,383,228$ 2,383,228$
City of Davis -$ -$ 192,000$ 192,000$ Eighth St. RR Xing Bike/Ped Safety -$ -$ 192,000$ 192,000$
By Feb 1 By May 1 After May 1 Grand Total
Sponsor Estimated Request for Authorization (RFA) Dates, Last updates from sponsors 03-28-14
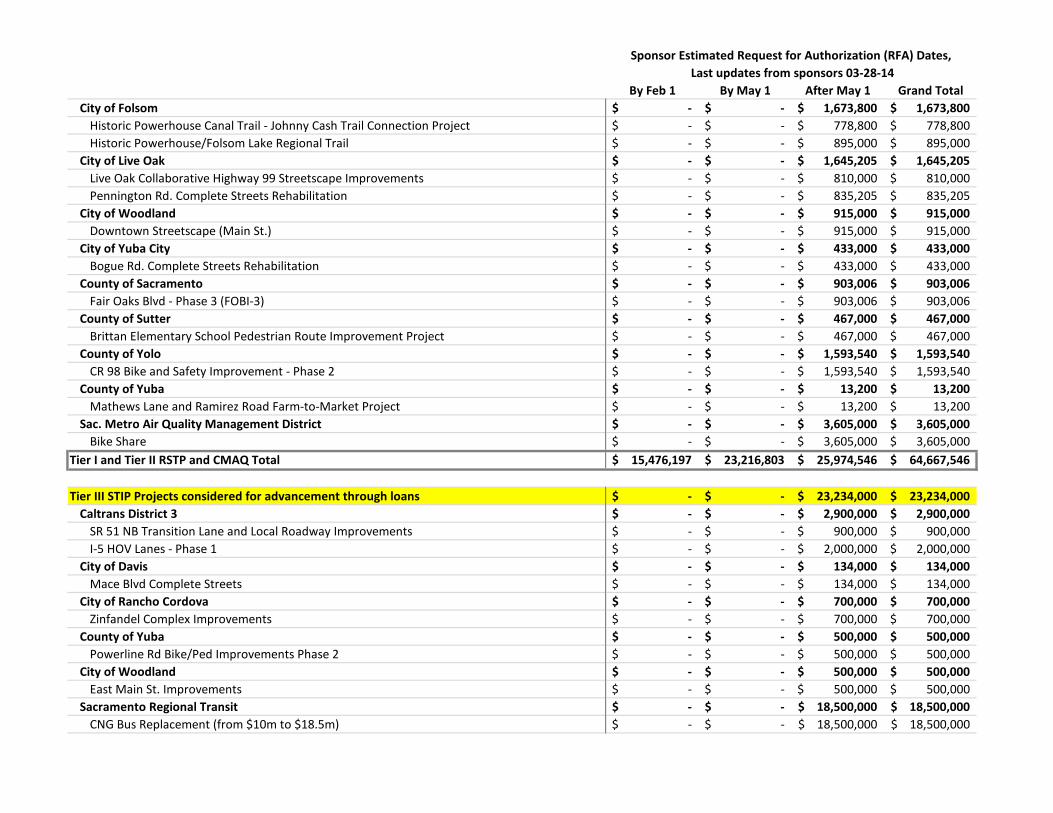
City of Folsom -$ -$ 1,673,800$ 1,673,800$ Historic Powerhouse Canal Trail - Johnny Cash Trail Connection Project -$ -$ 778,800$ 778,800$ Historic Powerhouse/Folsom Lake Regional Trail -$ -$ 895,000$ 895,000$
City of Live Oak -$ -$ 1,645,205$ 1,645,205$ Live Oak Collaborative Highway 99 Streetscape Improvements -$ -$ 810,000$ 810,000$ Pennington Rd. Complete Streets Rehabilitation -$ -$ 835,205$ 835,205$
City of Woodland -$ -$ 915,000$ 915,000$ Downtown Streetscape (Main St.) -$ -$ 915,000$ 915,000$
City of Yuba City -$ -$ 433,000$ 433,000$ Bogue Rd. Complete Streets Rehabilitation -$ -$ 433,000$ 433,000$
County of Sacramento -$ -$ 903,006$ 903,006$ Fair Oaks Blvd - Phase 3 (FOBI-3) -$ -$ 903,006$ 903,006$
County of Sutter -$ -$ 467,000$ 467,000$ Brittan Elementary School Pedestrian Route Improvement Project -$ -$ 467,000$ 467,000$
County of Yolo -$ -$ 1,593,540$ 1,593,540$ CR 98 Bike and Safety Improvement - Phase 2 -$ -$ 1,593,540$ 1,593,540$
County of Yuba -$ -$ 13,200$ 13,200$ Mathews Lane and Ramirez Road Farm-to-Market Project -$ -$ 13,200$ 13,200$
Sac. Metro Air Quality Management District -$ -$ 3,605,000$ 3,605,000$ Bike Share -$ -$ 3,605,000$ 3,605,000$
Tier I and Tier II RSTP and CMAQ Total 15,476,197$ 23,216,803$ 25,974,546$ 64,667,546$
Tier III STIP Projects considered for advancement through loans -$ -$ 23,234,000$ 23,234,000$ Caltrans District 3 -$ -$ 2,900,000$ 2,900,000$
SR 51 NB Transition Lane and Local Roadway Improvements -$ -$ 900,000$ 900,000$ I-5 HOV Lanes - Phase 1 -$ -$ 2,000,000$ 2,000,000$
City of Davis -$ -$ 134,000$ 134,000$ Mace Blvd Complete Streets -$ -$ 134,000$ 134,000$
City of Rancho Cordova -$ -$ 700,000$ 700,000$ Zinfandel Complex Improvements -$ -$ 700,000$ 700,000$
County of Yuba -$ -$ 500,000$ 500,000$ Powerline Rd Bike/Ped Improvements Phase 2 -$ -$ 500,000$ 500,000$
City of Woodland -$ -$ 500,000$ 500,000$ East Main St. Improvements -$ -$ 500,000$ 500,000$
Sacramento Regional Transit -$ -$ 18,500,000$ 18,500,000$ CNG Bus Replacement (from $10m to $18.5m) -$ -$ 18,500,000$ 18,500,000$

2013 MTIP 2014 RTIP2014 Delivery
Tiers *20132014 Tier I2015 Tier II2016 Tier II2017 Tier III2018 Tier III2019 Tier III
* Tier III delivery applies to projects programmed in the STIP
2014Adjustment for Over-Delivery
Caltrans Oversight Total
Obligation Authority 51,514,482$ (2,402,653)$ (945,036)$ 48,166,793$
Carry-Over/Prior Year 2014 De-obs thru Feb Total
CMAQ Apportionment 5,197,963$ 28,735,941$ 358,757$ 34,292,661$ RSTP Apportionment 11,679,527$ 25,297,826$ 1,498,426$ 38,475,779$
72,768,440
Tier III Request to Advance (STIP Funded Projects)
CMAQ RSTP
Rancho Cordova: Zinfandel Complex Improvments 700,000$ Caltrans: SR51 NB Transition Lanes 900,000$
Co. of Yuba: Powerline Rd. 500,000$ Davis: Mace Blvd. 134,000$ Woodland: East Main St. 500,000$ Caltrans: I5 HOV Lanes 2,000,000$
RT: CNG Bus Replacement 18,500,000$ Total 21,000,000$ 2,234,000$ 23,234,000$
Delivery Over/Under PercentageObligation Authority Predicted to Use $64,667,546 ($16,500,753) 134%CMAQ Predicted to Use $41,592,661 ($7,300,000) 121%RSTP Predicted to Use $24,975,779 $13,500,000 65%
Delivery Over/Under PercentageObligation Authority Predicted to Use $87,901,546 ($39,734,753) 182%CMAQ Predicted to Use $62,592,661 ($28,300,000) 183%RSTP Predicted to Use $27,209,779 $11,266,000 71%
Delivery Over/Under PercentageObligation Authority Predicted to Use $70,321,237 ($22,154,444) 146%CMAQ Predicted to Use-(Applying 20% here only) $50,074,129 ($15,781,468) 146%RSTP Predicted to Use-(Applying 20% here only) $21,767,823 $16,707,956 57%
What is the best possible delivery scenario if SACOG issues Tier 3 loans?
What is the most likely delivery scenario if SACOG does issue Tier 3 loans?
Covers 4 federal fiscal years Covers 5 state
fiscal years and stretches across
6 FFYs
SACOG 2014 Delivery Scenarios using Tier 3 loans
How are Delivery Plan "Tiers" associated with MTIP or RTIP program years?
How much Obligation Authority and Apportionment is available to SACOG?
Who requested Tier 3 loans to advance their RTIP funded projects?
How much money could SACOG loan to Tier 3 projects?
What is the best possible delivery scenario if SACOG does not issue Tier 3 loans?
Scenario 2: All Tiers I,II, and III Deliver
Scenario 1: All Tier I and Tier II Deliver
Scenario 3: Scenario 2 with 20% Failure
Item #5
Regional Planning Partnership
April 16, 2014 2016 Metropolitan Transportation Plan/Sustainable Communities Strategy Update Recommendation: None. This item is for information only. Discussion: SACOG staff will provide an update to the RPP on progress, milestones, and upcoming work on the 2016 MTP/SCS. Items for discussion this month include:
A. Transportation System Maintenance and Preservation B. Inventory of Adopted and Proposed Land Use Plans (Follow-up on Employment, Infill, and Rural
Residential) C. Approach to MTP/SCS Workshops
Please see April 3 Transportation Committee agenda item 6 and April 17 Board of Directors agenda item 13 for more information and attachments at www.sacog.org/calendar. CH:gg Key Staff: Sharon Sprowls, Senior Program Specialist, (916) 340-6235 Kacey Lizon, Senior Planner, (916) 340-6265
Clint Holtzen, Transportation Planner, (916) 340-6214

Item #6 Regional Planning Partnership April 16, 2014
City of Sacramento Entertainment and Sports Center (Arena) Traffic Impacts
Issue: What questions does the Partnership have for the City of Sacramento regarding the Arena project? Recommendation: None. This is for information only. Discussion: This summer, the City of Sacramento is scheduled to begin demolition work and construction of a new 17,500 seat capacity indoor, multi-use entertainment and sports center at the location of the existing Downtown Plaza shopping center. Ronald Fong, Senior Engineer for the City of Sacramento, will share more about the planned transportation impacts of the arena project. JLC:gg Key Staff: Sharon Sprowls, Senior Program Specialist, (916) 340-6235 José Luis Cáceres, MTIP Team Manager, (916) 340-6218

Item #7 Regional Planning Partnership April 16, 2014
Fix 50 Update
Issue: What questions does the Partnership have for Caltrans regarding the Fix 50 project? Recommendation: None. This is for information only. Discussion: Caltrans is scheduled to rehabilitate a section of U.S. Highway 50, known as the W/X Viaduct, beginning April 22, and wrapping up June 25, 2014. At the meeting, Caltrans District 3 staff will give a PowerPoint presentation on the project. Built in 1968, this section of freeway is comprised of two 2,530 foot-long parallel structures that carry six lanes of traffic over city streets, freight, and light rail lines in downtown Sacramento. These structures have extensive cracking on the deck and are in need of rehabilitation to enhance safety, reduce recurring maintenance costs, and increase the life of the concrete decks.
The project includes placing a 4-inch concrete deck on top of the existing deck and tying it to the girders, repairing cracks in the existing deck, adding steel column casings for seismic strengthening, and improving traffic operations throughout the project area. The service life of the structure decks will be extended to about 20 years, which will significantly reduce maintenance expenditures. The completed project will also provide widening at the shoulders, new joint seals, new concrete barriers and railings, energy-efficient lighting standards, and enhanced safety.
Each phase of the project will be worked on 24 hours per day, 7 days a week, as follows: Eastbound Highway 50: April 22 – May 21
• Phase 1: April 22 – May 6, the 11th Street on-ramp will be closed. • Phase 2: May 7 – May 21, The following ramps will be closed:
o 16th Street on ramp – connector ramp from eastbound Highway 50 to southbound Highway 99 o Connector ramp from eastbound Highway 50 to eastbound Business 80
• At least 3 lanes will be open • Westbound traffic will be fully open as normal with no impact
Westbound Highway 50: May 27 – June 25
• Phase 1: May 27 – June 10 • Phase 2: June 11 – June 25, The following ramps will be closed:
o 16th Street off-ramp o Connector ramp from westbound Business 80 to westbound Highway 50
• At least 3 lanes will be open • Eastbound traffic will be fully open as normal with no impact
JLC:gg Key Staff: Sharon Sprowls, Senior Program Specialist, (916) 340-6235 José Luis Cáceres, MTIP Team Manager, (916) 340-6218