regional evaluation municipal solid waste management … · country analitical report belize /...
TRANSCRIPT

COUNTRY ANALITICAL REPORT BELIZE / EVALUATION 2002
JUNE 2003
REGIONAL EVALUATION MUNICIPALSOLID WASTE MANAGEMENT SERVICES

1. EXECUTIVE SUMMARY 1
2. INTRODUCTION 3
2.1 Report Format 32.2 Solid Waste Management - The Last 10 Years 32.3 The Existing Situation 42.4 Legislation 52.5 The National Solid Waste Management Program 5
3. BACKGROUND 8
3.1 General Characteristics of Belize 83.1.1 Physical and Demographic 83.1.2 The Economy 103.1.3 Health 103.1.4 Other Human Development Indicators 11
3.2 The National Solid Waste Management Plan 133.3 Government Investment in Solid Waste Management 13
4. STRUCTURE OF SOLID WASTE MANAGEMENT SERVICES 15
4.1 Policy, Legal and Institutional Framework 154.2 National Solid Waste Management Plan 164.3 Rural Waste Management 184.4 Industrial Waste Management 18
5. MUNICIPAL SOLID WASTE SERVICES 20
5.1 Strengths, Weaknesses and Opportunities 205.2 Cost Analysis 23
6. SOLID WASTE MANAGEMENT AND HEALTH 25
7. PARTICIPATORY MANAGEMENT & FUTURE PERSPECTIVES 28
7.1 Future Perspectives 28
ANNEX A: BIBLIOGRAPHY 30
ANNEX B: ACRONYMS 31
ANNEX C: PARTICIPATING TEAM 32
ANNEX D: NATIONAL SITUATION OF NOTIFIABLE DISEASES, 1997-2000 33
LIST OF TABLES
Table 1 National Population by District, Belize 2000 8Table 2 Population of Major Cities, Towns Having Solid Waste Services 9Table 3 Demographic Indicators for Belize 2000 9
TABLE OF CONTENTS

Table 4 Summary of UNDP Human Development Indicators, 1999 12Table 5 Principal Information Relevant to Municipal Waste Management 16Table 6 Principal Activities for Solid Waste Management Project 17Table 7 SWOT analysis of Current Municipal Waste Management 21Table 8 Total Cases of Certain Diseases in Belize for 1997 - 2000 26
LIST OF FIGURES
Figure 1 Political Map of Belize 6Figure 2 Transfer Sites Covered by Western Route 7Figure 3 Population Vs. Annual Value of Contract 14Figure 4 Per Capita Value for Waste Services 23Figure 5 Total Budget Allocated per Year 24Figure 6 Solid Waste Budget as % of Total Municipal Budget 24Figure 7 Belize Malaria Cases 1991-2000 26Figure 8 Ten Principal Causes of Death for Belize 2000 26

Existing Situation
Solid waste management in Belize is a complex issue stemming from the lack of resources for its proper mana-gement. The lack of resources is conducive to inadequate enforcement of environmental and health laws,inadequate personnel and equipment for enforcement of laws, inadequate public education on solid wastepractices, inadequate disposal practices, and poor maintenance of landfills and dump sites.
In Belize, all landfills do not meet the technical requirements of a sanitary landfill. While the original objectivewhen these were established was to manage these sites as a sanitary landfill, lack of funds resulted in discon-tinuation of maintenance and these sites subsequently degenerated into modified landfills and open dumps.Degeneration of these sites into modified landfills has occurred, even at those sites, which are maintained byprivate services, since waste is disposed without any treatment and lack of soil cover is usually a deficiency.
The National Solid Waste Management Plan (NSWMP) was completed and adopted in the year 2000. Prior tothis adoption, solid waste management in Belize was deficient in all of its scope. Deficiencies have been iden-tified in policy at the management level, in conflicting legislation, in design and site criteria of land fills, in co-llection, transportation and disposal of waste, and in technological and public knowledge of waste manage-ment.
The NSWMP has resulted in the preparation of a comprehensive long-term management plan for solid waste,and commenced its pre-implementation stage in 2001.
Major achievements of the NSWMP up to date include the removal of obstacles such as the issue of conflictinglegislation on waste management, establishment of a management structure to oversee waste management,identification of the most suitable alternatives for waste collection, transport, treatment and disposal, and thefinalization of technical designs for sanitary landfills and transfer sites. Presently, the Board of Directors of theNational Solid Waste Management Authority (NSWMA) is exploring sources of financing for the NSWMP.
Until the NSWMP becomes fully implemented, deficiencies that existed, will still persist, particularly in the areasof local municipal management of solid waste, the operation of landfills, technical designs considerations asso-ciated with landfills, sustainability of waste sector at the local level, and the inadequate treatment and final dis-posal of waste. Deficiencies also exist in terms of public knowledge and education on issues of waste separa-tion at source, waste containment at source, payment for solid waste services, handling of waste and generalhealth related issues.
Prior to 1992, solid waste management was vested in the authority of local governments. Belize has Two Citiesand Seven Towns. The larger of the two cities, Belize City, was the first to see privatization of solid waste mana-gement in 1992. It was not until 1997, that the privatization of solid waste management was established in fourother municipalities. Today, only three municipalities do not have a private company contracted for managingsolid waste. These are Belmopan City (the Capital), Punta Gorda and San Pedro Towns. The privatization of solidwaste management included (in most cases), the contracting out of the maintenance of landfills.
Privatization of waste management services was limited to the collection, transportation and final disposal ofcontained waste. In most instances, contracts included provisions for the management of landfills, and for theremoval of cleared vegetation. However, contracts specified the collection of wastes and most cleared vegeta-tion in containers. Contracts also made provisions for collection of user fees from the business and industrialsector, but not for private residents. This has long become a problem of both enforcement of containment andanti littering laws, and has resulted in lack of sustainability of the collection service.
1. EXECUTIVE SUMMARY
REGIONAL EVALUATION OF MUNICIPAL SOLID WASTE MANAGEMENT SERVICES 1

Solid waste management poses similar problems in rural areas, except that at villages and small communities,the demographic pressures are less, thus minimizing the impacts of waste disposal. Nonetheless, in these vi-llages solid waste is still disposed at designated local dumps, and in many cases, illicit rural sites are used. Illicitrural dumps are often found on roadsides, in gullies, creeks, swamps and open or abandoned land.
Industrial waste is generated from the Citrus, Banana, Sugar Cane and Shrimp Industries. These are the mostimportant industries that generate solid waste. However, over the past few years, the shrimp industry has mul-tiplied substantially. As a result, the disposal of shrimp heads is becoming an increasing concern. Shrimp headsare usually buried for decomposition, but it has been determined that the decomposition process is retardeddue to the high clay content of the solid where shrimp farms are located. As a result, shrimp heads may needto be incinerated as an alternative.
The National Solid Waste Management Project
In 1997, an agreement for a Technical Assistance Project funded by the Japanese Government was signed,between the Government of Belize (GOB) and the Inter American Development Bank (IDB) for the preparationof a National Solid Waste Management Plan (NSWMP).
The National Solid Waste Management Project, under which the NSWMP was developed was divided in to fourphases, as follows;
Phase 1: Initial Data Gathering
Phase 2: Preparation of a conceptual Solid Waste Management Plan
Phase 3: Development of Public Awareness Program and Preliminary designs of Priority Regional WasteManagement Program(s)
Phase 4: Preparation of detailed Engineering Drawings for one Sanitary Landfill Site.
As part of its analysis of alternatives for project development several options were evaluated, of which, optioneight was selected by the Project Advisory Committee (PAC). Option Eight Includes, among other things, the(i) design and construction of a Central Sanitary Landfill to accommodate the entire Western Highway Corridor(Figure 2), (ii) establishment of Transfer Stations at Cayes, Belize City and Western Landfill, (iii) barging of wastesfrom Cayes and then trucking it to the Sanitary Landfill, (iv) Upgrading of existing sites in Orange Walk & Corozal,(v) construction of three new sites in South (Dangriga, Placencia & Punta Gorda) which will be a landfill typeoperation (including those of the north); and, (vi) development of a rural collection system for rural and smallcommunities.
Currently, with the Chairman of the National Solid Waste Management Authority (NSWMA), having been nomi-nated, the project has now phased into the pre-implementation stage. Initially, funds will be required for commen-cement of the construction and design of a sanitary landfill at mile 22, Western Highway (Figure 2). One of theprincipal activities of priority at this point, for which financing is currently being discussed between theAuthority, the Central Government and the IDB, is the construction and operation of this Central SanitaryLandfill.
In addition to its functions as the interim Secretariat of the Authority, the Department of Environment will carryout continuous monitoring of the operations of the landfill and all solid waste management issues throughoutBelize, once the Authority becomes fully functional.
REGIONAL EVALUATION OF MUNICIPAL SOLID WASTE MANAGEMENT SERVICES 2

2.1 Report Format
The Division of Health and Environment (HEP), of the Pan American Health Organization (PAHO), in coordina-tion with the Pan American Center for Sanitary Engineering and Environmental Sciences (CEPIS), are coordina-ting the Regional Evaluation of Solid Waste Management Services 2002.
Previous reports produced by these organizations revealed a deficiency of reliable information on solid wastein the region. The following critical aspects have been identified as guiding the indicators for strength andweaknesses: (1) institutional and legal (2) technical and operational (3) economic-financing (4) health, (5) envi-ronment and (6) social and community development (PAHO, Terms of Reference, 2002).
The analysis of data and information gathered in these six sectors was conducted for Belize. This report is asummary of the Findings for Belize.
The Belize investigation was conducted by carrying out a literature search into the available publications onsolid waste and solid waste management. Following this, data analyses and entry into an electronic copy of apre-designed questionnaire submitted by PAHO was commenced. During the preparation of the data for dataentry into the web site, data entry into the electronic copy of the questionnaire was discontinued due to thetime constraints. Data entry was then entered directly into the CEPIS Web site.
Substantial data was available from the recently completed volumes of solid waste reports prepared for theNational Solid Waste Management Project, by Stantec, a Canadian firm contracted by the Government of Belize(GOB) with funds provided mostly from the Inter American Development Bank (IDB) Japanese Funds. Data wasalso obtained from the Central Statistical Office, Belmopan or from other sources.
Data verification and updating was conducted by interviewing key stakeholders. Mayors, Town Administrators,and sanitation personnel from local municipal bodies, and private companies involved in waste managementservices were interviewed.
The National Coordinating Group comprised of personnel from PAHO, The Department of Environment (DOE),The Mayor's Association and Civil Society conducted data verification.
Data collected was representative of all municipalities, including rural communities. A brief description of theexisting situation of industrial waste was also included, as well as a summary of the existing National Solid WasteManagement Plan, recently completed and about to be implemented.
All figures used in the report are US Dollars (US$), and were estimated using the present foreign exchange ratesof 1BZ$ = US2.0175$, used by local banks.
2.2 Solid Waste Management - The Past 10 Years
Solid waste management in Belize continues to pose a challenge to Government and management authorities.While significant improvements in the areas of public health, public education and awareness, health andaccess to sanitation, and the onset of formal management system for solid waste have been taken over the lastfew years, there are still limitations, problems and lack of coherence in the way the relevant authorities are co-ping with the issues.
The beginning of the early 1990s was characterized by neglect of the waste management sector, and thusresulted in almost total lack of services. This was as a result of various factors, including lower demographicpressure, lower organization of the civil society, and lack of resources. Prior to the mid 1990s, when privatization
2. INTRODUCTION
REGIONAL EVALUATION OF MUNICIPAL SOLID WASTE MANAGEMENT SERVICES 3

was limited to Belize City, there were no established policies, laws and methodology for the management, treat-ment and disposal of solid waste.
Traditionally, solid waste collection at the municipality level was vested in City and Town administration. A per-cent of its total annual budget was allocated for the collection and disposal of solid waste in each municipali-ty. The first contractual agreement between a local government and a private company was issued in BelizeCity to Belize Waste Control in 1992.
Until a change of Government in 1998, the country saw its first change of policy to formal expansion of the pri-vatization of collection services. However, this privatization was not based on competitiveness or on sustainability,but instead was financed by the Central Government. Collection services in Town Councils were for bidding,but the contractual sum was equivalent to an equal sum of each Town's annual subvention from the CentralGovernment.
Today, several municipalities have a private company who offers the collection and disposal of as its principalbusiness.
2.3 The Existing Situation
It is estimated that Belize produces approximately 112,000 tons of solid waste annually from domestic house-holds and commercial establishments. This means that each person living in Belize produces approximately1.32 kg/person/day (Stantec, National Solid Waste Management Project 1999 & CSO 2002). This estimate wasconducted for nine urban centers, one at large size, two at medium size and six at small size.
Municipal waste includes waste generated by the commercial and business sector located within or nearmunicipalities. It also includes very little industrial waste.
There is no data on the municipal versus domestic waste, as there is no separation at source.
The composition of municipal waste has been estimated as follows:
Organics 60%Metals 5%Glass 5%Plastic 5%Paper 5%Other Waste 5%
Source: BSWMP and CSO, 2000.
The Belize Solid Waste Management Project (Stantec, 2000) and the Central Statistical Office, 2000, estimate thatmost domestic waste is organic (60%), while the remaining consists of metals, plastics, glass and paper com-pose 20% and other waste compose 5%.
Disposal Sites
All landfill sites in Belize, except that of Belmopan, are operating with inadequate resources, supervision andfinancial support. Sites deteriorate because of lack of equipment for the operation of landfills and cover mate-rial is not used in most cases. Most of these sites can best be described as controlled landfills.
In addition to the exiting landfills, there are many illegal open dumps and places where garbage is used for thefilling of yards. Illegal roadside dumps, dumping in rivers, dumping in sensitive areas, occur mostly in rural areas,outside existing villages and smaller communities.
REGIONAL EVALUATION OF MUNICIPAL SOLID WASTE MANAGEMENT SERVICES 4

2.4 Legislation
As part of Belize's Solid Waste Management Project Inception Report (Stantec 2000) and the Phase Two Report& Plan Volume 1 (Stantec 1999), there were several legislative changes that were recommended. Stantec'sreport included the examination of existing statutory provisions for solid waste management and the identifi-cation of legislative gaps along with recommendations for improvements.
Existing legislation include the Environmental Protection Act, 1995 the Pollution Regulations, 1996 and theLittering Offences Violation Tickets Regulations. The enforcement of these legislations requires further strengthening,and will be complemented by the recently commenced pre-implementation phase of the Solid Waste Mana-gement Project.
Coming out primarily from the recommendations of the NSWMP, several amendments to existing legislationhave recently been carried out. These included enactment of legislation to establish and environmental levy,regulatory provisions to provide for permits to construct and operated landfills and transfer stations, and themost important of these, is an amendment to the Solid Waste Management Authority Act, 1991. Prior to thisamendment, this Act was merely existed as paper legislation, until its recent amendment of 1998.
This Amendment Act should form the basis of the Solid Waste Management Authority, a Statutory Board recentlyappointed to deal with all matters relating to the National Solid Waste Management Plan. The current Chairmanof this Authority is the Mayor of Belize City, the largest urban center of Belize. The interim secretariat for thisboard which, recently held its first official meeting and is now functional, is the Department of Environment,with the Chief Environmental Officer is an ex-officio member of the Board.
The SWMA is now developing a budget, which requires approval from the Central Government, in order to exe-cute its mandate (Stantec, 1999). The mandate of the Authority, calls for overseeing the following activities:
Institutional establishment and strengthening (including the allocation of resources & revenue generation),Increased use of technology (modern technology be means of technical cooperation), waste reduction andrecycling (increased efforts in waste reduction, recycling, reduction at source & incentives for private sectorinvolvement), management of special wastes (deal with hazardous and industrial waste), and public educationand participation (includes the public motivation to become a partner in waste reduction and management(Stantec, 1999).
2.5 The National Solid Waste Management Program
In 1997, an agreement for a Technical Assistance Project funded by the Japanese Government was signed,between the Government of Belize (GOB) and the Inter American Development Bank (IDB) for the preparationof a National Solid Waste Management Plan (NSWMP).
As part of its analysis of alternatives for project development, several options were presented, of which optioneight was selected by the Project Advisory Committee (PAC). Option Eight Includes, among others, the (i)design and construction of a Central Sanitary Landfill to accommodate the entire Western Highway Corridor(Figure 2), (ii) establishment of Transfer Stations at Cayes, Belize City and Western Landfill, (iii) barging of wastesfrom Cayes and then trucking it to the Sanitary Landfill, (iv) Upgrading of existing sites in Orange Walk & Corozal,(v) construction of three new sites in South (Dangriga, Placencia & Punta Gorda) which will be a landfill typeoperation (including those of the north); and, (vi) development of a rural collection system for rural and smallcommunities.
Currently, with the Chairman of the National Solid Waste Management Authority (NSWMA), having been nomi-nated, the project has now phased into the pre-implementation stage. Initially, funds will need to be allocatedfor commencement of the construction and design of a final sanitary landfill at mile 27, Western Highway(Figure 2). As a priority for financing, currently being discussed between the Authority, the Central Governmentand the IDB, is the construction and operation of the Central Sanitary Landfill.
REGIONAL EVALUATION OF MUNICIPAL SOLID WASTE MANAGEMENT SERVICES 5

Figure 1: Political Map of Belize.
REGIONAL EVALUATION OF MUNICIPAL SOLID WASTE MANAGEMENT SERVICES 6

Figure 2: Transfer Sites Covered by Western Route.
Source: National Solid Waste Management Project, Stantec 1999.
REGIONAL EVALUATION OF MUNICIPAL SOLID WASTE MANAGEMENT SERVICES 7

3. BACKGROUND
3.1 General Characteristics of Belize
3.1.1 Physical & Demographic
Belize is located on the Southeastern edge of the Yucatan Peninsula, (Northern Central America) being bor-dered to the North by Mexico, to the South and West by Guatemala and to the East by the Caribbean Sea (Figure1). Belize is located between 15° 52´ 9" and 18° 29' 55" North latitude and 87° 28" and 89° 13' 67" WestLongitude. Using an offshore territorial limit of 20 km. (12 miles), the national territory covers about 46,620 sq.km (18,000 sq. m), of which 49% is land. Belize's land mass includes more than 1,000 tiny islands known as cayes(pronounced keys), totaling about 690 sq. km (266 sq. m).
Belize consists of six districts, which are comprised of cities, towns and villages. The northern districts of Corozaland Orange Walk (Figure 10) consist of predominantly Mestizo and Spanish-speaking ethnic groups. The Belizedistrict is comprised primarily of English-speaking Creole. The Cayo district, located in the geographic center ofthe country is more mixed, with Creole, Mestizo, Mayan, and Mennonite communities. Further south, theGarifuna dominates the Stann Creek district, while more than 60% of the Toledo district is Mayan. Three Mayanlanguages are spoken throughout Belize, Ket'chi, Mopan and Yucatec.
Belize is a sovereign state having gained independence from the United Kingdom on 21 September 1981. It isgoverned by a representative democracy with bicameral legislature based on the Westminster model. ThePrime Minister and Cabinet form the executive branch, while the National Assembly forms a bicameral legisla-ture comprising of a 29-member elected House of Representatives and a thirteen-member appointed Senate.
The population of Belize as at May 12, 2000 was 240,204 (CSO, 2003). When compared to the previous censuscount in 1991, the then recorded figure of 189,392 establishes an inter-censual growth rate is 2.7% per annum. Thisgrowth rate is approximately point one (0.1) percentage point higher than the growth between 1980 and 1991.
Since 1991, the Belize district continues to represent the largest proportional share of the total population(Table 1), i.e., 28%. While the Cayo district, the second largest populated district represents 22% of the total po-pulation; Orange Walk has a population of 16%, which remains the same as in 1991, while Corozal represents14% in 2000. The Southern Districts of Stann Creek has 10.33% and Toledo 9.7%, respectively.
Belize has a larger rural population than urban. In 1991, the urban/rural ratio was 48:52. In 2000, this ratioremains the same indicating that 52% of the population lives in the rural areas and 48% live in the towns.
Table 1: National Population by District, for Belize 2000.Source: CSO, 2003.
DISTRICT MALE FEMALE % GROWTH TOTAL
COROZAL 16,422 16,286 14.9 32,708
ORANGE WALK 19,948 18,942 26.8 38,890
BELIZE 34,035 34,162 19.4 68,197
CAYO 26,417 26,147 39.5 52,564
STANN CREEK 12,734 11,818 5.7 24,548
TOLEDO 11,722 11,575 33.6 23,297
TOTAL 121,278 118,930 28.32 240,204
REGIONAL EVALUATION OF MUNICIPAL SOLID WASTE MANAGEMENT SERVICES 8

Table 2: Population of Major Cities and Towns Having Solid Waste Services.Source: CSO, 2003 & Stantec 1999.
CITY/TOWN POPULATION (CSO) % GROWTH POPULATION (STANTEC) *
Belize City 49,050 11.25 82,000
Orange Walk 13,483 12 20,000
San Ignacio/Santa Elena 13,260 59 17,000
Corozal 7,888 11.9 11,000
San Pedro 4,499 144.2 5,000
Belmopan City 8,130 51 8,000
Benque Viejo 5,088 43 8,000
Dangriga 8,814 37 12,000
Punta Gorda 4,329 2.1 8,000
TOTAL/MEAN 114,541 43.74 171,000
* N.B. Stantec figures used are from the Stantec, 1999 Report (National Solid Waste Management, InceptionReport). See explanation below.
*N.B. CSO figures are official enumerated figures by the Central Statistical Office. Stantec figures represent figures usedin source number 1, Solid Waste Management Report prepared in 1999 by Stantec Consulting. These figures representthe official population plus the population of immediate communities, which are also served by the solid waste servi-ces being offered by the City or Town, which is an additional 25%. In Stantec's report (1999), figures used were utilizedto estimate total waste generation (ton/day), also used in the present Evaluation of Solid Waste Management, 2002.There are no updated available figures on present waste management but these figures generated by Stantec are con-sidered accurate for present day estimates. Total population with access to solid waste services is, therefore, 171,000.
Table 3: Demographic Indicators for Belize 2000.Source: CSO 2000 and National Health Information & Surveillance Unit, Ministry of Health, 2003.
Total Population 249,240
Crude birth rate (1,000 pop) 30.8
Crude death rate (1,000 pop) 6.1
Percentage of low birth weight % (babies) 5.4
Stillbirth rate 12.0
Infant Mortality rate (1,000 live births) 21.2
Population growth rate (%) 2.7
Total fertility rate 4.0
Percentage population > 65 years 4.2
Urban population (%) 48.6
Dependency ratio 45.2
Life expectancy at birth (1991) Total 71.9
Males 70.0
Females 74.1
REGIONAL EVALUATION OF MUNICIPAL SOLID WASTE MANAGEMENT SERVICES 9

Demographic indicators in Table 3 above, provides specific data for the year 2000 in Belize. Crude birth ratereported is 30.8 per 1,000 population. Infant mortality rate per 1,000 live births is 21.2, while stillbirth rate is 12.0and fertility rate is 4.0.
3.1.2 The Economy
Belize's major export market is the United States of America (USA), which accounted for approximately US$84.361 Million (52.7%) of total export value in 2001 (Government of Belize Medium Term Economic Strategy2003-2005, July 2002). The European Market accounted approximately US$50.061 Million (31.2%) of total exportvalue in 2001 (GOB Medium Term Economic Strategy 2003-2005).
The economy of Belize comprises the primary, secondary and service sectors. The economy of Belize is movinggradually from one that is primarily agricultural based to one that is more service-oriented. The Service sectorcontributed 59.5% to the GDP in 2001, whilst the primary sector contributed just 16.8% (GOB Medium TermEconomic Strategy, 2003-2005).
The primary sector consists of agriculture, forestry and logging, fishing and mining, the secondary consists of themanufacturing sector, electricity, water, and construction, and the service sectors involves trade, restaurants,hotels, transportation, communication, finance, insurance, real estate, business services, public administration andother services (Avila, 1998). Although all 3 sectors have grown proportionately with the national economy, themost important has been the services sector, with approximately 55% of the GDP in 1996. The increase of the ser-vice sector is attributed mainly to the healthy growth of the tourist industry, which took off during the late 1980'sand was still growing into the 1990's, bringing into the national economy about $80 million in 1996 (Avila, 1998).
The economy achieved a real Gross Domestic Product (GDP) growth rate of 1.4% in 1998, when the GDP wasUS$2,235 per capita. In 1998, the major exports of Belize were sugar, citrus, bananas, and shrimp, which toge-ther were valued at US $50.63 million. The major imports were fuel and finished goods valued at US $135.82million. Most of the exports are to USA, United Kingdom, Canada and CARICOM. Major imports are also fromthe same countries.
The real GDP increased to 6.4% in 1999 and 8.2 in the year 2000. The Per Capita GDP increased to $2,747.5 in1999 and $2,887.3 in 2000.
3.1.3 Health
Basic Services
The Government of Belize is the main provider of health services. The basic structure for health care delivery isprovided by seven government hospitals: one in each of the six districts and one in Belmopan. There are threeprivate hospitals, two in Belize City and one in Cayo.
Spending in health accounted for 33% of the GDP and 9% of public spending for the period between 1984 and1992. Total spending on health in 1992 was approximately US$ 10.3 million. During the same period, there wasa negative growth rate for spending in this area (the observed growth rate on average for 1982 until 1992 wasapproximately 5.25% per annum), and this trend is expected to continue.
Public health spending increased by 0.2% of GDP from 1996-98, but decreased by 0.4% in 1999 (NHDR, 1999,pg. 29). This spending includes a little less than 9% of the recurrent budget allocated to the health sector, butof which 73% is for salaries. Furthermore, the NHD 1999 reports that population increases have not been pa-ralleled by an increase in the number of doctors and number of hospital beds.
For the period 1999-2002, again public health spending increased. Revised estimates of expenditures for fiscalyear 1999-2000 was $13.457 million, for fiscal year 2001-2002 it was $15.011 million, and for fiscal year 2002-2003it was $15.478 million. Actual or final expenditures are usually a few million dollars beyond revised estimates.For example, actual spending for the fiscal year 2001-2002 was $17.835 million. Figures of actual spending for
REGIONAL EVALUATION OF MUNICIPAL SOLID WASTE MANAGEMENT SERVICES 10

remaining fiscal years are not available at this time. Nonetheless, the trend is for continued government invest-ment in the health sector.
The average number of doctors per 10,000 persons in Belize for the period 1996 to 1998 is 6.3 (CSO, 1999). Theaverage number of hospital bed per 10,000 persons for the same period is an estimated 24.3. The rating for num-ber of doctors and number of hospital beds were worse and much worse, respectively, in the NHD Report, 1999.
Government has initiated the Health Sector Reform Project. The primary objective is to provide Belizeansnationwide with better access to health services. There has been the improvement of secondary health facili-ties in three districts, and a focus on primary health care.
The National Health Insurance Program (NHI) has been another of GOB's initiatives towards improvement in thehealth sector. A pilot project was implemented on the south side of Belize City to collect data and test the sys-tem. The GOB intends to implement the NHI at an affordable rate throughout Belize.
Nutrition
A 1992 assessment of data gathered for children aged five and under attending clinics revealed that 25%showed some degree of malnutrition, 1.3% showed severe malnutrition, while 15% showed signs of obesity(PAHO/WHO/GOB, 1996). The age group most affected was the one to two year olds, followed by the groupssix to 12 months old. The National averages were heavily influenced by the Toledo district, which indicated thatmore than 40% of children showed some level of malnutrition, with 15.5% either moderately or severely mal-nourished (GOB, 1992 & 1996). According to the UNDP NHD Report, 1999, the indigent households (per dis-trict), with low daily calorie intake by percent are as follows: Toledo 40.2, Cayo 15.9, Corozal 5.9, Belize 4.9,Orange Walk 2.9 and Stann Creek 2.2. These results were given a rating of worse in this report.
Health and Sanitation
Belize endured several Cholera outbreaks in 1994, with 296 confirmed cases between 1992 and 1993 resultingin a high per capita incidence. Since then, cholera remains endemic and infected rivers continue to be a threatfor new outbreaks, although no significant outbreaks have been reported since 1998. According the GOBMedium Term Economic Strategy 2003-2005, there have been no new cases of cholera reported for the pasttwo years.
Other important water borne diseases commonly found throughout Belize are Diarrhea and Hepatitis.
Mosquito vector borne disease are one of the most important environmental health issues. Malaria andDengue are the most frequently occurring endemic diseases. A total of 1,853 cases of malaria were reportedthroughout Belize in 1999 and 1,498 in 2000, a decrease of 25% (Fernandez, for PAHO, 2001) (Figure 7). The threedistricts with the highest incidence for the year 2000 were Cayo, 753, Toledo, 691, and Stann Creek, 287, whichare the Southern Districts and also receive the most rainfall per annum.
Maternal and Child Health
Belize's life expectancy keeps improving annually. For the period 1996-1999, life expectancy increased from theprevious 1991 - 96 periods by about 3.5 years, 4.5 for women and 2 for men (UNDP, NHDR, 1999). The infantmortality rate fell by 4.9% between 1996 and 1998, rated as much improved in the report.
The infant mortality rate improved further over the past few years. Infant mortality rate has declined from 26per 1000 live births in 1996 to 24 in 1997 and to 21.2 in 2000 (GOB Medium Term Economic Strategy 2003-2005).
3.1.4 Other Human Development Indicators for Belize
The National Human Development Report, 1999 (NHDR) was prepared under the supervisory committee, withan aim at measuring Belize's status of human development up to that year (Table 4). Among others, there were
REGIONAL EVALUATION OF MUNICIPAL SOLID WASTE MANAGEMENT SERVICES 11

recommendations that while there was coordination among Government, NGOs and the private sector, certaingaps require addressing in order to accelerate human development.
Belize's global ranking on the UNDP Human Development Index rose in 199 to 58 from 83 during the previousyear. While the study found improvement in a number of areas, others showed decrease. A rating scheme wasused to rate the progress of numerical data on specific factors which contribute to human development, as fo-llows: Much worse - levels are worse for 2+ years, worse - levels are worse for 1 year, same- no change since lastyear, improved - level has improved since last year, much improved - level has improved last 2 years and N.A. -information not available.
Table 4: Summary of UNDP Human Development Indicators for 1999.
Source: National Human Development Report, 1999.
INDICATOR RELATIONSHIP WITH STATUS OF HUMAN FINDINGS RATINGDEVELOPMENT
Population Increase reduces per capita availability of services, <14 population increased 2.5% for Worsereducing quality of lifereducing quality of life 1996-1998
Fertility Rate Increase implies demand for health & educational services 1997-99 - Decreased from 3.6 to 3.2 Much Improved
GDP per Capita High GDP Shows Increased Productivity & Income Grew by 5.8% to BZ $5655 in 1999 after Improved3 years of decline
Labor Statistics Higher unemployment reduces income leading to Employed and unemployed labor force Sameincreased poverty and reduced access to social services increased. Unemployment fell by 1.5%
to 12.8 % in 1999.
Annual % Rate indicates annual change in consumer prices. Significant Decrease in 1999 Much Improved Change in Increase results in reduced consumer purchase & accessInflation to basic goods & services.
Poverty Estimates Income Below Poverty Line is Associated With ill health, Much more frequent in rural areas. About Worselimited education & low personal security. 1 in every 4 households is poor, and 1 in
every 3 individuals. 1 in 3 youth is poor,1 in 3 elderly is poor 1/3 of women andmen are poor, With more women thanmen poor
Public Emphasis on health, water & sanitation may represent a 1999 - Health & water investments Much WorseExpenditure need to cover basic needs. larger than educational investment.Ratio Most investment is allocated to salaries
rather than services
Rural Population Increase to access increases productivity & results in 1996-1999 remain unchanged Much WorseWith Access to national growth Available to half of rural populationHealth Services
Urban Population Improved access leads to improvements in health, Sanitary services have not kept pace Much WorseWith Access to environment & economic productivity with population growth.Sanitation
Literacy Rate Improvements may permit improvements in productivity, Remain almost unchanged Worse(Over 14 years) health and education of children About 75% of over 14 years is literate
Registered Increase may indicate increasing productivity with positive Increased in 1997-1999 by almost 50% ImprovedBusiness human benefits
REGIONAL EVALUATION OF MUNICIPAL SOLID WASTE MANAGEMENT SERVICES 12

3.2 The National Solid Waste Management Plan
In 1996, the Department of Environment identified solid waste management as one of Belize's most pressingenvironmental/health concerns and prioritized it in its program of activities.
In 1997, an agreement for a Technical Assistance Project funded by the Japanese Government was signed, atthat time, between the Ministry of Tourism and the Environment and the IDB for the preparation of a NationalSolid Waste Management Plan.
As part of its analysis of alternatives for project development, several options were
Presented, of which option eight was selected by the Project Advisory Committee (PAC)
Initially, funds will need to be allocated for commencement of the construction and design of a final sanitarylandfill at mile 27, Western Highway (Figure 2). Consequently, one of the principal activities of priority at thispoint, for which financing is currently being discussed between the Authority, the Central Government and theIDB, is the construction and operation of the Central Sanitary Landfill.
3.3 Government Investment in Solid Waste Management
The average budgetary allocations for solid waste management services for municipalities were 25% of the totalmunicipal budget from 1997-1999 (Stantec/GOB, 1999) (Figure 6). Most of the funds are used for the collectionand final disposal of waste. Only 6% of total annual budgets, or approximately $U.S. 85,000 was spent on themaintenance of three of the larger sanitary landfills.
During this same period (1997-99), Central Government subsidized about 20% of total municipal revenues.However, this subsidy represented almost 40% of Town Revenues.
This was increased in 1999/2000 when an increase of about 15% to all municipalities was granted in support ofa municipal services privatization program.
Belize City's present annual solid waste management budget of $US 2.25 Million, of which 0.74 Million is spenton the acquisition of services from a private company (Raymond Cox, Personal Communication). The City's totalannual budget is US 6 Million, of which solid waste services, both private and Local Government, represents25% of total municipal budget. However, total municipal solid waste budget for Belize City is approximately40% of total municipal budget (Figure 3).
REGIONAL EVALUATION OF MUNICIPAL SOLID WASTE MANAGEMENT SERVICES 13

N.B. Although Punta Gorda, Belmopan and San Pedro do not presently have a private contract, figures reflectcontractual costs if one were issued out.
From Figure 3, it can be seen that existing contractual estimates are proportional to the population beingserved.
Figure 3: Population Vs. Annual Value of Contract (US$)
0
10,000
20,000
30,000
40,000
50,000
60,000
Belize
City
Orange
Walk
San Ig
nacio
/S. Elen
a
Coroza
l
San Ped
ro
Belmop
an
Benqu
e Viej
o
Dangri
ga
Punta
Gorda
0
100,000
200,000
300,000
400,000
500,000
600,000
700,000
800,000
Population
Annual Valueof Contract(US$)
REGIONAL EVALUATION OF MUNICIPAL SOLID WASTE MANAGEMENT SERVICES 14

4.1 Policy, Legal and Institutional Framework
In Belize the allocation of municipal resources are generally intended for the provision of sweeping, collection,transportation and final disposal services.
In Belize, local municipalities have been traditionally entrusted with solid waste management and disposal asone of their principal municipal functions. Municipalities are managed by a City or Town Council, which is de-mocratically elected by the municipality's voters in a contested election, which is held in the Month of Marchevery three years in the case of town councils, and every four years in the case of Belize City. The Mayor and sixcouncilors head the Town Council.
As in the last ten years, municipal disposal of waste is still a high priority for town and city councils, althoughthe collection, transportation and disposal of waste have now been contracted out to the private sector inmany instances.
Prior to 1997, the only city, which had contracted out municipal disposal, was Belize City. The Reconstructionand Cooperation Development (RECONDEV) serviced Belmopan, the capital, which was under administrationof Central Government. RECONDEV functioned as a board, whose main thrust was the provision of solid wastemanagement (including the management of the landfill site), sewage waste and other municipal services toBelmopan. Until the year 2000, Belmopan did not have its own local administration, but was instead adminis-tered by the Central Government. In 2000, Belmopan elected its first municipal local government, which to overthe functions of RECONDEV.
In 1997, Central Government, through a cabinet decision, started the privatization of waste collection, trans-portation and disposal. Contracts included the management of controlled landfills, with the exception of theWestern Sanitary Landfill and the Belmopan Landfill. By the year 2003, private companies serviced all munici-palities except Belmopan, Toledo and San Pedro. Central Government subsidized all contracts issued, whichincludes approximately 60 to 70% of total municipal solid waste budgets. Each municipality serviced by a pri-vate company includes an additional 30 to 40% of their total municipal budget to solid waste management.San Pedro is the only municipality, which does not receive any central government subsidy (Alberto Villanueva,personal communication). The Town of San Pedro does its own collection, which has recently increased to$100,000 per annum or 10% of the total municipal budget (Table 5).
Belize City includes the largest amount towards additional waste management services. Belize City spends anadditional 1.2 M US on solid waste management. This includes the service of most primary schools within citylimits.
Solid waste management contracts provide for the disposal of contained waste. Uncontained waste is a commonproblem throughout the cities and towns, for which local municipalities include an additional resources for thesweeping, collection and disposal of uncontained waste, as described above. Uncontained waste has becomeburdensome, and its enforcement is difficult and time consuming. The enforcement of the Littering Act, whichcalls for ticketing for Violation Tickets up to a fine of $50.00 per individual and $250.00 per business or legallyregistered commercial establishments, is not readily enforced, primarily because of the local political implica-tions that the ticketing of voters may mean in influencing a ticketed person's opinion with respect to voting.Instead, municipalities have opted for a more favorable method of utilizing city or town resources to deal withuncontained waste. The situation of lack of enforcement of collection and containment of waste indicates theneed for an aggressive solid waste educational program at the municipal level.
4. STRUCTURE OF SOLID WASTE MANAGEMENT SERVICES
REGIONAL EVALUATION OF MUNICIPAL SOLID WASTE MANAGEMENT SERVICES 15

No municipal government levies a fee for solid waste management to residents, except Punta Gorda, whichlevies a $1.00 per person per week fee, and Benque Viejo levies a $2.00 per person per week fine. Nonetheless,these charges are not enforced, rendering it a voluntary contribution, of which a minimal percent of the totalpopulation contributes.
The business sector is the main contributor to solid waste management fees. These figures are illustrated inTable 5. Most municipalities levy an average fee estimated between $20.00 and $60.00 per month, while BelizeCity charges per cubic meter (approximately $5.00 per cubic meter). In all small municipalities, these rates arecharged as fixed rates, as opposed to the Belize City rates, which are levied by volume of waste. Certain esta-blishments in Belize City are known to pay a monthly bill of up to $2,500 per month (National Solid WasteManagement Project, 1999).
Table 5: Principal Information Relevant to Municipal Waste Management.
Source: Central Statistical Office, 2003 & National Solid Waste Management Project, 1999.
City/Town Population Tons per annum Tons per day Kg/capita/day % Of Total AVG. US$ leviedMunicipal Budget per business/month
Belize City 49,050 29,770 81.6 1.54 33.33 *1,000.00
Orange Walk 13,483 6,365 17.4 1.27 38 20.00
San Ignacio/ 13,260 7,104 19.5 1.32 40 25.00
Santa Elena
Corozal 7,888 4,680 12.8 1.5 40 12.50
San Pedro 4,499 3,900 10.7 2.18 10 62.50
Belmopan 8,130 3,510 9.6 1.18 40 33.75
Benque Viejo 5,088 2,080 5.7 1.13 0 20.00
Dangriga 8,814 3,120 8.5 0.95 40 20.00
Punta Gorda 4,329 1,560 4.3 0.99 45 10.00
TOTAL 114,541 62,089 170.1 12.06
MEAN 6,899 18.9 1.34 36.26 133.75
* This figure is using the average rate of $5.00 per cubic meter levied in Belize City. The remaining municipali-ties charge a fixed rate.
4.2 National Solid Waste Management Plan
As part of Government's process of decentralization, its policy is to continue supporting the privatization ofsolid waste services, and the improved management of solid waste throughout the country. The Solid WasteManagement Authority in coordination with the local municipal governments will implement this.
The SWMA is currently identifying its sources of start up capital in order to commence the construction of theMile 22 Western Sanitary landfill, which is the final disposal site for treated waste to serve the Western Corridor(Figure2). The SWMA will offer contracts by bids, the details of which will be made available at the stage ofimplementation. Currently, the Authority is preparing a report on revenues and expenditures for the imple-mentation phase, which will be submitted to the IDB for consideration for possible funding. One of the itemsof the report will be a summary of the identified sources of financial sustainability of the project. One of theexpected sources of revenues will be from the existing Environmental Tax. This tax is already being charged forplastic products, and is expected to supplement other sources of revenues. A decision will also be made as tothe charging of a fee to residential disposal of waste. While this has been identified as necessary, it is a politi-cally sensitive issue.
REGIONAL EVALUATION OF MUNICIPAL SOLID WASTE MANAGEMENT SERVICES 16

Table 6 presents some of the principal activities to be conducted through the SWMP, and the SWMA.
Table 6: Principal Activities for Solid Waste Management Project.
Source: Modified From Stantec, 2001.
No Location/Place Activity Year Comments
1 Country wide Establish SWMA 0 Already Established/Recentlybecame operational
2 National Scope Enact recommended legislation changes 0 Enacted
3 Mile 22 Western Sanitary Landfill Finalize land acquisition and tender for 1 Draft tender documents beingconstruction 1 discussed
4 Belize City Transfer Stations Tender package for construction 1 Draft being discussed
5 Western Corridor Public awareness plan to educate residents of 1Western Corridor about system
6 Countrywide National public awareness plan to educate 1public on waste disposal
7 Punta Gorda/Dangriga Develop modified landfill 1
8 Northern corridor Plan for sanitary landfill for northern corridor On going On going
9 Present Belize City site Rehabilitate & transfer waste to mile 22 site
10 Countrywide Develop appropriate medical waste practices 2
11 National Establish Industrial waste systems On going
12 National Develop international waste collection system On going
13 Northern & Southern corridors Develop public awareness program
14 Cayes Establish transport & haulage system for cayes 3
15 Rural areas Establish rural collection system 3
16 National Clean up existing sites and new systems On goingbecome operational
17 Western Sanitary landfill Close down and construct transfer station 3
18 Belmopan Commence haulage of Belmopan waste to mile 22
An immediate goal is also the construction of the Mile 22 Sanitary Landfill. Engineering designs have alreadybeen completed for the construction of this sanitary landfill, with an aim to commence the bidding process.
Subsequently, activities such as the design and implementation of a public awareness program will be con-ducted in order to sensitize the general users of the system and its mode of operation. The public will also beeducated with respect to the need to good waste management practices and on the separation of waste atsource. The aim is to sensitize the general public of the need for improved solid waste management in Belize,and in support of activities of the SWMA.
The project also includes provisions for collection of waste from villages along the corridors served by the sys-tems. The identification of collection points for each village and the placement of containers will be conduc-ted, which will be collected and transported to the Mile 22 Landfill.
Several existing sites will be rehabilitated and converted to "Transfer Stations", which will be designed for easeof waste collection. These sites have been deemed unsuitable for continued long- term use. Transfer Stationswill be constructed at the present Western Sanitary Landfill currently being operated as a modified dumpsite.The Belize City site will also be rehabilitated and converted to a transfer station.
REGIONAL EVALUATION OF MUNICIPAL SOLID WASTE MANAGEMENT SERVICES 17

The Authority will conduct continued monitoring of the Northern Corridor for future development of a finaldisposal site to service this sector. In addition, the Southern Districts will be served by a similar collection sys-tem, but present disposal sites will be rehabilitated. Land has already been identified to serve as modified land-fill sites for Punta Gorda and one for Dangriga.
Transfer sites will also be constructed at Ambergris Caye (Figure2) and at Caye Caulker. Transfer trailers from thecayes will be transported by barges and later transferred by road to the Mile 22 Landfill for treatment and finaldisposal (Table 6).
Many activities of the NSWMP are on-going in nature, and require implementation and supervision by theAuthority.
4.3 Rural Waste Management
Solid waste management poses similar problems in rural areas, except that at villages and small communities,the demographic pressures are less, thus minimizing the impacts of waste disposal. Nonetheless, in these vi-llages solid waste is still disposed at designated local dumps, and in many cases, illicit rural sites are used. Illicitrural dumps are often found on roadsides, in gullies, creeks, swamps and open or abandoned land.
Certain sectors of the country have local rural sites for the disposal of waste, but with no waste collection ser-vices. Wherever waste collection services exist, this is handled by small micro operators who are paid by resi-dents or by the local village councils for the transportation and disposal of waste. Disposal services are carriedout by the use of pick up trucks, and are transported to local sites. Many sites currently pose a nuisance to re-sidents and visitors, resulting in odor and contributing to loss of local aesthetics. This is seen negatively, parti-cularly in areas such as Placencia Village, which is a tourism destination.
4.4 Industrial Waste
Industrial waste is generated from the Citrus, Banana, Sugar Cane and recently, aquaculture Industry (shrimpfarming).
According to the National Solid Waste Management Project Report (Stantec 1999), and the Central StatisticalOffice, 2000, waste generated by the major industries (citrus, banana, sugar & shrimp) for the period 1995-2000,ranges between 400 and 650 thousand metric tons. There has been a progressive increase since 1995, whenapproximately 425 metric tons were produced. In 2000, almost 625 thousand metric tons were produced(Stantec, 1999 & CSO, 2003).
Solid waste from these industries is mostly organics (60%). Inorganic constituents consist of plastic productsused primarily in the banana industry. Organic constituents of waste from the banana industry come primari-ly from rejected fruits.
The organic contents of waste produced by the citrus industry are composed of rinds. Citrus peels are used ina composting project, which is producing compost for fertilizer.
The sugar industry produces bagasse as its primary solid waste. Approximately half of all bagasse is burnt forthe production of energy utilized within the sugar processing facility in Orange Walk. The remaining bagasse isdiscarded.
Over the past few years, the shrimp industry has grown substantially. As a result, the disposal of shrimp headsis becoming an increasing concern. Shrimp heads are usually buried for decomposition, but the decomposi-tion process has been found to be slowed down due to the high clay content of the solid where shrimp farmsare located. As a result, shrimp heads may need to be incinerated as an alternative. The potential for use ofshrimp heads as a feed was initially considered but due to the risk for transmission of pathogens, this conside-ration was not explored further.
REGIONAL EVALUATION OF MUNICIPAL SOLID WASTE MANAGEMENT SERVICES 18

The NSWMP has identified the issue of industrial solid waste as one of its target for long-term monitoring inorder to establish a management system. Presently, the production of electricity by co-generation (usingbagasse) is being discussed, and the establishment of a facility is in the final planning stages.
REGIONAL EVALUATION OF MUNICIPAL SOLID WASTE MANAGEMENT SERVICES 19

5.1 Strength, Weaknesses and Opportunities
The management of municipal of waste in Belize has always been faced with several limitations resulting frominadequate availability of resources, lack of technical skills and the lack of public sensitivity to the issues. Thishas not been as a result of lack of efforts on behalf of municipalities, but stemming from the lack of an esta-blished and on-going solid waste management plan whose consequences is the continued paucity of funds,particularly due to lack of sustainability of waste collection mechanisms. Conversely, municipalities continue toexperience both economic and demographic growth, which requires further managerial capacity and requiredresources to deal with cumulative increase in solid waste. The National Solid Waste Management Plan is a com-prehensive approach to the institutionalizing of waste management throughout the country.
Using the present criteria for this report, Belize has one medium - sized city, Belize City, with a population of49,050 persons and eight small cities (Table 2). Overall, the logistics in solid waste at the municipal level aremarred with several complexities, which compound the management issues. The logistical difficulties stemfrom inadequate resources, lack of adequate public education and lack of technical skills.
While considerable efforts have been made to privatize the collection, transportation and disposal of waste,solid waste management is still a problem facing the Municipalities. These have continuously pursued the co-llection of waste at the local and national level. There are several advantages that are considered from the pri-vatization of waste collection, transportation and disposal.
The SWOT analysis conducted, and summarized in Table 7 indicates the strengths, weaknesses, opportunitiesand threats of municipal solid waste management, divided into the identified areas of weakness by CEPIS -PAHO, 2002.
5. MUNICIPAL SOLID WASTE SERVICES
REGIONAL EVALUATION OF MUNICIPAL SOLID WASTE MANAGEMENT SERVICES 20

SCOP
E/ IS
SUE
Instit
ution
al &
Lega
l
Tech
nical
& Op
eratio
nal
Econ
omic-
Finan
cing
Envir
onm
ent &
Hea
lthSo
cial/C
omm
unity
Dev
elopm
ent
Stre
ngth
Impr
oved
enac
ted le
gislat
ion
(Red
uctio
n of c
onflic
ting
Legis
lation
& ov
er lap
s)
Estab
lishe
d Ins
titut
ion (N
ation
al So
lid W
aste
Man
agem
ent A
utho
rity)
with
adeq
uate
repres
entat
ionCo
ntinu
ed st
rengt
henin
g of lo
cal
Mun
icipa
l man
ageri
al ca
pacit
y
New
town
ships
have
incre
asing
Pla
nning
, & ut
ilities
serv
ices
Gene
ral ac
cessi
bility
of m
odifie
dlan
dfills
Cent
ral G
overn
men
t's C
omm
itmen
t to
solid
Was
te m
anag
emen
t
Priva
tizati
on tr
end
Activ
ated S
olid W
aste
Auth
ority
Exist
ing &
on
going
Initia
tives
in th
e hea
lth&S
anita
tion s
ecto
rsDe
cent
raliza
tion p
roces
s
Incre
asin
g or
gani
zatio
nal
Capa
bilit
ies &
Publi
c par
ticipa
tion i
n Dec
ision
-mak
ing
Increa
sing p
artic
ipatio
n of S
ocial
& co
mm
u-nit
y Rep
resen
tation
Wea
knes
sLa
ck of
enfor
cem
ent o
f ant
i Lit
ter la
wsIns
uffici
ent m
onito
ring c
apac
ity
Pauc
ity of
Fund
s Unt
ested
Syste
m
Poor
reve
nue G
enera
tion c
apac
itySo
lid w
aste
man
agem
ent is
still
in Its
infan
cy st
age
Defic
iencie
s in
town
Plan
ning
at th
e loc
alLe
vel
Ad-h
oc m
anne
r of d
ealin
g With
Solid
was
teM
anag
emen
tIns
uffic
ient r
esou
rces f
or m
ainten
ance
Insuf
ficien
t Res
ource
s
Poor
reve
nue g
enera
tion
Capa
city a
t loc
al m
unici
pal L
evel
Disin
tegrat
ion of
land
fills
Disa
greem
ents
over
hand
ing of
Rev
enue
ge-
nerat
ing ac
tivitie
s to M
unici
paliti
esDe
ficien
cies o
r abs
ence
of re
venu
e coll
ectio
n&
user
Fees
for w
aste
serv
ices
Diffic
ulties
in ke
eping
pace
with
The r
ate of
adva
nce
Inade
quate
publi
c acc
eptan
ce
& Un
derst
andin
g of s
ource
Sepa
ration
, redu
ction
& ba
gging
Oppo
rtun
ities
Progr
essiv
e set
of en
viron
men
talGu
idelin
es an
d acti
on pl
ans
Cleare
r & m
ore w
ell-d
efine
d role
sInc
reasin
g sup
port
from
Loca
lNG
Os, C
BOs &
Priva
te se
ctor
Has b
orrow
ing po
wer a
s new
entit
y An
d rev
enue
gene
rating
oppo
rtunit
ies
Relat
ively
low de
mog
raphic
pres
sure
Urba
n Cen
ters a
re rel
ative
ly Sm
all
In ge
ograp
hic ex
tent
Impr
oving
tech
nolog
ical a
dvan
ces
Natio
nal S
olid W
aste
Man
agem
ent
Plan a
lread
y dev
elope
dNa
tiona
l Soli
d Was
te M
anag
emen
t Pla
n (NS
WM
P) de
velop
edEn
acted
syste
m fo
r Env
ironm
ental
Ta
x to a
ddres
s soli
d was
te iss
ues
Grow
ing de
man
d for
impr
oved
serv
ices
Publi
c Awa
renes
s Prog
ram (N
SWM
P)He
alth S
ecto
r Refo
rm
Increa
sing a
uton
omy a
t Loc
al lev
el
Increa
se in
tech
nolog
ical T
ransfe
r Reg
ional
Com
mitm
ents
Increa
se in
natio
nal To
urism
visit
ation
Grea
ter nu
mbe
r of C
omm
unity
base
d Or
ganiz
ation
s hav
e Bec
ome a
ctive
over
the L
ast f
ew ye
arsInc
rease
in m
onito
ring o
fSo
cio-e
nviro
nmen
tal Tr
ends
Thre
ats
Increa
sing G
OBStr
eam
lining
of Re
sour
ces
Chan
ge of
Prior
ity of
Cent
ral G
ovt.
Limite
d sou
rces o
f Rev
enue
gene
ration
Resis
tance
from
loca
l Gov
ernm
ents
to p
ass
Resp
onsib
ility t
o SW
MA
NA NA NA Lack
of co
nsum
er Aw
arene
ss
Tab
le 7
: SW
OT
An
alys
is o
f Cur
ren
t M
unic
ipal
Was
te M
anag
emen
t Sy
stem
s.
REGIONAL EVALUATION OF MUNICIPAL SOLID WASTE MANAGEMENT SERVICES 21

Of all municipalities, Belize City represents that which has made the greatest advance in the process of beco-ming autonomous, and consequently becoming self-sustainable due to greater legal jurisdiction over its affairs,thus benefiting from greater revenue-generating and managerial capacity. In addition, the City's revenue baseis larger, and more comprehensive. While residents do not pay for solid waste services directly, the City main-tains a strict property tax administrative system, which is adequately enforced. This allows a total budget ofsome US $6.0 Million, of which 40% is used in solid waste management.
Solid waste services are therefore better managed and have a wider coverage in Belize City. The City offers co-llection services via a private contract, which is complemented by further waste collection by the council itself.There is also a contractual agreement for the chopping and collection of vegetation growth, separate from thesolid waste collection services. Solid waste services cover the entire city and additional special services are con-ducted at primary schools, parks, playgrounds and coastal environments.
At the small municipalities, new forms of solid waste management via private contracts, and community-basedorganizations are still in its infancy. The SWOT analysis represented by Table 7, illustrates several weaknesses ofsmall municipalities experience in solid waste management.
While central government is committed to supporting solid waste management, a new legislation, which faci-litates greater autonomy at the Town Council level, and Village Council are fairly recent. These legislations wereenacted in 1999, giving greater autonomy for local municipalities in managing their own affairs. Along withincreased autonomy, however, came the need for greater financial sustainability. This has become a problembecause municipalities had previously enjoyed a tradition of subsidy of most services. Subsidized servicesinclude solid waste management, public cleansing, with little or no tax base in most cases. In the Town of SanIgnacio/Santa Elena, for example, prior to the year 2000, only 20% of property taxes were levied to propertyowners. This tax averages approximately US $150, of which a previous decision to levy only 20% of charges hadresulted in a highly subsidized community. With the increase of the need for revenue generation, increasing itto full 100% collection has been faced with numerous difficulties.
The result has been a low revenue base in these small municipalities, with consequences of lowering of thequality and quantity of services rendered.
In general, most residents have access to public cleansing, including vegetation removal, bagging of waste incertain public areas, and solid waste collection, transportation and disposal. No small municipality has a privatecontract issued for public cleansing. Most towns have private contracts for solid waste collection, transporta-tion and disposal, with some having privatized the management of the local modified landfills.
In the case of San Ignacio/Santa Elena, a contract for four years had been issued for the management of theWestern Sanitary Landfill (which despite its name, is a modified landfill which often deteriorates to an opendump due to the lack of funds for servicing). During the life of the contract, this site was fairly well maintained,but the contractual services were not renewed by the central government primarily due to paucity of funds.This site has now once more deteriorated to an open dump, and is only serviced on a remedial basis. This sitereceives waste from approximately 20,000 inhabitants, resulting in rapid deterioration of the site when notmaintained by soil cover.
While other modified landfills receive greater attention, these too are often deteriorating to open dumps,although there are usually little or no residential sites nearby.
Solid waste coverage at the small municipalities has been faced with problems such as accessibility of certainsites. Poor access roads prohibit easy access, thus leading to small sites where open dumping occurs. Whilethis is less prolific than in days prior to privatization of waste services, it is still visible in some towns.
REGIONAL EVALUATION OF MUNICIPAL SOLID WASTE MANAGEMENT SERVICES 22
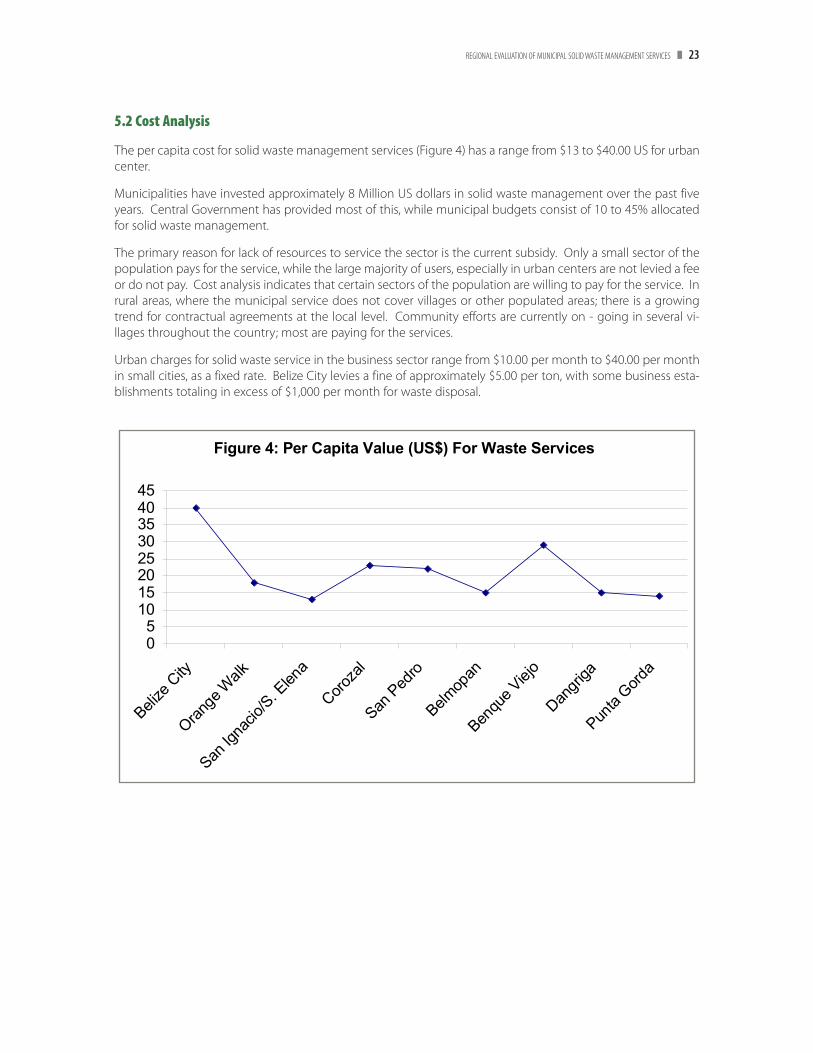
5.2 Cost Analysis
The per capita cost for solid waste management services (Figure 4) has a range from $13 to $40.00 US for urbancenter.
Municipalities have invested approximately 8 Million US dollars in solid waste management over the past fiveyears. Central Government has provided most of this, while municipal budgets consist of 10 to 45% allocatedfor solid waste management.
The primary reason for lack of resources to service the sector is the current subsidy. Only a small sector of thepopulation pays for the service, while the large majority of users, especially in urban centers are not levied a feeor do not pay. Cost analysis indicates that certain sectors of the population are willing to pay for the service. Inrural areas, where the municipal service does not cover villages or other populated areas; there is a growingtrend for contractual agreements at the local level. Community efforts are currently on - going in several vi-llages throughout the country; most are paying for the services.
Urban charges for solid waste service in the business sector range from $10.00 per month to $40.00 per monthin small cities, as a fixed rate. Belize City levies a fine of approximately $5.00 per ton, with some business esta-blishments totaling in excess of $1,000 per month for waste disposal.
Figure 4: Per Capita Value (US$) For Waste Services
05
1015202530354045
Belize
City
Orange
Walk
San Ig
nacio
/S. Elen
a
Coroza
l
San Ped
ro
Belmop
an
Benqu
e Viej
o
Dangri
ga
Punta
Gorda
REGIONAL EVALUATION OF MUNICIPAL SOLID WASTE MANAGEMENT SERVICES 23

Figure 5: Total Budget Allocated/Year
1,256,355
94,364
34,696
22,121
99,133
123,916
77,323
135,316
62,432
Belize CityOrange WalkSan Ignacio/S. ElenaCorozalSan PedroBelmopanBenque ViejoDangrigaPunta Gorda
Figure 6: Solid Waste Budget as % of Total Municipal Budget
33
38
40
401040
40
40
45 Belize CityOrange WalkSan Ignacio/S. ElenaCorozalSan PedroBelmopanBenque ViejoDangrigaPunta Gorda
REGIONAL EVALUATION OF MUNICIPAL SOLID WASTE MANAGEMENT SERVICES 24

There are no known reports or epidemiological studies in Belize that link solid waste and diseases. Althoughthere have not been any scientific data linking solid waste and diseases in Belize, it is known that deficienciesin solid waste management can contribute to diseases and poor health conditions. The Ministry of Health andspecifically the Public Health Department, cognizant of the relations between solid waste and illnesses, carryout on-going campaigns to promote health and sanitation throughout the country, and these programs oftenfocus on municipalities.
In 1957 the National Malaria Eradication Service (NMES) was established within the Ministry of Health. This wasas a direct result of the worldwide malaria eradication program promoted by the World Health Organization(WHO) and the Pan American Health Organization (PAHO).
The NMES of the Ministry of Health conducts an on-going aggressive campaign to control malaria by targetingthe habitat for mosquito and rodents. A component of the service includes visual inspections of private andpublic premises in order to ensure compliance with health laws, and in order to promote and enforce thecleansing of premises. Premises are screened for potential mosquito - bearing containers, and the presence ofsolid waste. If a premise is untidy, owners are advised to remove waste. The emphasis is on the prevention ofthe increase in the incidence of malaria and dengue, which are both endemic to the country and to the region.
Three of the four species of Plasmodium that cause malaria have been found in Belize. These are P. vivax, P. fal-ciparum, and P. malarie. P. vivax is the most common species accounting for about 95% of cases (Figure7). BothP. vivax and P. falciparum are found countrywide. The last case of P. malarie was recorded in the Belize District in1996 and is considered practically non-existent.
Figure 7 illustrates the number of malaria cases for the period 1991-2000. It is important to note the rise in casesin 1993 to 1996, with the year 1994 reporting the highest numbers (more than 10,000 cases) for the entire period.This is as a result of the reduction in the number of spraying with DDT which was being phased out for envi-ronmental reasons (Fernandez/PAHO, 2000). However, the importation of DDT for use as an insecticide reducedthe numbers considerable. DDT has now been replaced with other forms of pesticides, with a progressivedecrease in the malarial incidences, especially for the period 1998-2000.
The Districts with greatest number of cases are the Southern Districts of Stann Creek, Cayo and Punta Gorda,which are categorized as high-risk areas. Corozal and Orange Walk are classified as medium risk, and the BelizeDistrict as Low Risk (Fernandez/PAHO, 2000).
Workers and handlers of waste have the same privileges of other minimum wage workers. They have access tobasic health care, and provisions within the workers regulations allow for compensation fees for working underwet, rainy or similar deteriorating conditions. Municipal workers are offered compensation for working in wetconditions, in water and under the rain.
All workers are covered under Belize's Social Security Scheme. This system allows payment plans on behalf ofemployers and workers for coverage in the event of illness, accidents and for retirement benefits etc. No fur-ther insurance coverage is known to be employed to offer coverage to workers in the event of accidents andhealth.
6. SOLID WASTE MANAGEMENT AND HEALTH
REGIONAL EVALUATION OF MUNICIPAL SOLID WASTE MANAGEMENT SERVICES 25

42%
13% 9% 6%
6%
5% 5%
5% 3% 2% 4%
Table 8: Total Cases of Certain Diseases in Belize for 1997 - 2000.
Source: CSO, 2003 & National Health Information Unit, MOH 2003.
YEAR 1997 1998 1999 2000
Malaria 4,014 1,936 1,847 1,484
Dengue 8 23 0 3
Tetanus 2 1 1 1
Cholera 2 29 12 0
Tuberculosis 106 124 101 127
REGIONAL EVALUATION OF MUNICIPAL SOLID WASTE MANAGEMENT SERVICES 26
Figure 8: Ten Principal Causes of Death In Belize 2000Source: National Health Information Unit, MOH 2003
Disease of the circulatory system
Transport accidents, other causes of accidental injury
Neoplasms
Endocrine, nutritional & metabolic diseases
Diseases of the respiratory system
Certain infections & parasitic diseases
Certain conditions originating in the perinatal period
Signs, symptoms and abnormal clinical & laboratoryfindings, n.e.c.
Diseases of the digestive system
Congenital malformations, deformations
Other

Figure 8 illustrates the ten principal causes of death in Belize for the year 2000. While the figures have changesslightly over the subsequent years, they have remained relatively unchanged. Death by accidents, for example,continues to be the second leading cause of death in 2001 and 2002. While there are no figures associated illnessdirectly with deficiencies in solid waste management, infectious illness that accounts for 5% of the total (Figure8), as well as diseases of the digestive system (2%) (Figure 8) are often associated with poor hygienic practices,including deficient solid waste management.
Table 8 compares total reported cases of several vector-transmitted diseases. Malaria cases peaked in 1994(Figure 7 & Table 8), with a steady decrease until 2000 when 1,484 cases were reported. In 1998 a total of 23cases of dengue fever was reported but only three cases in 2000. Cases of tetanus are few, with 2 cases reportedin 1997 and one per year for the subsequent years.
The incidences of cholera are linked to poor sanitary conditions in Belize. A total of 29 cases were reported in1998, but no cases were reported in 2000. Since the year 1999, official reports indicate that no case of cholerahas been reported thus far. The reduced cases of cholera in Belize over the past few years have probably beendue to an aggressive health education campaign with respect to this disease conducted throughout Belize bythe MOH.
While the incidence of certain diseases has consistently decreased over the last few years, others have recentlybeen reported as increasing. Tuberculosis for example (Table 8) has increased since 1997. In 2000 127 cases oftuberculosis were reported. Latest figures for tuberculosis are 114 and 121 cases for the years 2001 and 2002respectively.
Annex D is a table with additional information on the national situation of notifiable diseases for the period1997 to 2000. The National Health Information Unit, MOH, compiled this information. Annex D reveals that themagnitude of reported cases of diphtheria for this period is in the low range. This, however, does not indicatethat there are no cases, but instead, the cases reported are insignificant in numbers. In 1998 60 cases of foodborne illness were reported but this number has been below 30 cases for subsequent years.
Gastroenteritis in children under the age of 5 years ranged in excess of a thousand cases in 1997 and 1998.These figures have decreased to less than half for the years 1999 and 2000 (Annex D).
REGIONAL EVALUATION OF MUNICIPAL SOLID WASTE MANAGEMENT SERVICES 27

Municipal special services occur as on-going services or occasionally as a clean up campaign. On-goingMunicipal special services include the public cleansing of parks and playgrounds, waste collection and dispo-sal from public areas such as markets, parks, cemeteries, playgrounds, beaches, river sides, roadsides, drains andin some instances, from old or disabled residential homes.
Occasionally, a combined effort between municipal governments, private entities, contracted companies, theMinistry of Work, schools, community organizations and NGOs often join forces in comprehensive clean upcampaigns. This results in the removal of debris, trees, illicit garbage sites, and derelict vehicles. It is estimatedthat in the Town of San Ignacio/Santa Elena, approximately 400 derelict vehicles were removed and transpor-ted to the Western Sanitary Landfill during 2000-2003.
Public services are usually accompanied by informal educational activities, such as signage programs targetinganti littering, radio spots, and television interviews.
Community organizations such as the Red Cross, Environmental NGOs, and Belize Alliance for CommunityServices, schools and government agencies occasionally participate in the offering of assistance for specialefforts in solid waste management. Micro enterprises and the business sector usually contribute as donors forspecial services and clean up campaigns.
These services are important, especially since they act as good forms of consumer education and promote civicpride, and public awareness of the issues related to health and environment. However, efforts in the area ofcooperating micro enterprises, NGOs, Community Organizations require further efforts as this is not a well -coordinated activity and lacks consistency. It is usually done on an ad hoc basis, usually as a result of comingcelebrations.
7.1 Future Prospective
With the NSWMP now in place, it is essential that GOB fulfill its obligations and commitments by making surethat good governance is supported by financial and institutional support. The NSWMP is a professional solu-tion to an increasing deteriorating situation. The NSWMP cannot succeed without the most important com-ponent - economic and financial sustainability.
Future commitments in the waste management sector should include provisions for further research anddevelopment into compost systems, recycling methods primarily for the industrial sector. This responsibilityfalls on industry to explore further and complementing technological advances and methodologies that allowsfor the reduction of waste and the recycling of waste.
The consumers are perhaps the most important of all sectors. Belizeans need to better appreciate the need forpayment for services, as this determines the quality of service provided. Furthermore, for the sector to becomeeffective and practical there is a need to introduce waste separation at source, containment of waste and over-all responsibility of the general public in the avoidance of littering and dumping.
A well-coordinated solid waste system will ensure greater reduction in environmental health risks, greater pro-ductivity and greater well being of the country.
Recently, a fire at the present Belize City modified Landfill burnt for months in an uncontrollable manner. Thissituation caused much discomfort to city residents as a result of smoke and odor emanating from burningmaterial. This situation served to highlight the urgent need for commencement of the first stages of imple-mentation of the NSWMP.
7. PARTICIPATORY MANAGEMENT & FUTURE PERSPECTIVES
REGIONAL EVALUATION OF MUNICIPAL SOLID WASTE MANAGEMENT SERVICES 28

Presently, a Cabinet Paper is in process of being submitted for consideration. This paper includes a draft budgetfor immediate commencement of the construction stage of the Mile 22 Sanitary Landfill, which is to serve theWestern Corridor.
It is no doubt that the country is in immediate need for full implementation of the NSWMP.
REGIONAL EVALUATION OF MUNICIPAL SOLID WASTE MANAGEMENT SERVICES 29

Central Statistical Office, Ministry of Finance. Environmental Statistics for Belize 2000.
Belmopan, July 2000.
Diagnostic Situation on the Use of DDT and the Control and Prevention of Malaria in Belize, PAHO, Belize 2001,by Fernandez, 2001.
Government of Belize, Medium Term Economic Strategy 2003-2005.
National Human Development Report, 1999. United Nations Development Program UNDP, Belmopan, Belize.
Census 2000 Major Findings, Central Statistical Office, 2003.
Environmental Statistics for Belize 2000. Environmental Statistics Unit, Central Statistical Office, Belmopan, 2000.
Health of Belize 2001. National Health Information Unit, Ministry of Health. Belmopan Belize 2003.
Belize Solid Waste Management Project, Phase 2 Report and Plan Volume I. Stantec, GOB, February 1999.
Belize Solid Waste Management Project, Phase 2 Report and Plan Volume II Appendices. Stantec, GOB, February1999.
Belize Solid Waste Management Project, Phase 3 Report Volume IV - Financial Implementation Plan. Stantec,GOB, Belmopan, October 2000.
Belize Solid Waste Management Project, Phase 3 Report - Predesign. Stantec, March 2000.
ANNEX A: BIBLIOGRAPHY
REGIONAL EVALUATION OF MUNICIPAL SOLID WASTE MANAGEMENT SERVICES 30

CEPIS Pan American Center for Sanitary Engineering and Environmental Sciences
CBO Community Based Organization
CSO Central Statistical Office, Government of Belize
EPA Environmental Protection Act, 1992
DOE Department of Environment
PAHO Pan American Health Organization
MOH Ministry of Health
MNRE&I Ministry of Natural Resources, Environment and Industry
NHD National Human Development
NHDR National Human Development Report
NHIU National Health Information Unit (Ministry of Health)
NSWMP National Solid Waste Management Plan
NSWMA National Solid Waste Management Authority
GOB Government of Belize
S.I. Statutory Instrument
UNDP United Nations Development Program
NGO Non - Government Organization
ANNEX B: ACRONYMS
REGIONAL EVALUATION OF MUNICIPAL SOLID WASTE MANAGEMENT SERVICES 31

Name
Ismael Fabro
Evaristo Avella
Rony Maza
David Fonseca
Godsman Ellis
Godwell Flores
Organization
Department of Environment
Wilderness Group Consulting
Pan American Health Organization
Solid Waste Management Authority
Cayo Civil Society
Public Health Department
Position
Chief Environmental Officer
Principal
Consultant Engineer
Chairman
Chairman
Public Health Principal Officer
Tel/Email
ANNEX C: PARTICIPATING TEAM
REGIONAL EVALUATION OF MUNICIPAL SOLID WASTE MANAGEMENT SERVICES 32

ANNEX D: NATIONAL SITUATION OF NOTIFIABLE DISEASES, 1997-2000
NATIONAL SITUATION OF NOTIFIABLE DISEASES, 1997-2000
Number of cases and rate of incidence per 100,000 population
1997 1998 1999 2000
No. Rate No. Rate No. Rate No. Rate
Immuno-preventible Diseases
Diphtheria - 0.0 - 0.0 - 0.0 - 0.0
Haemophilus influenzae - 0.0 - 0.0 - 0.0 - 0.0
Mumps 332 144.8 20 8.5 10 4.1 11 4.4
Acute Flaccid Paralysis 1 0.4 - 0.0 - 0.0 - 0.0
Rubella 175 76.3 5 2.1 14 5.8 - 0.0
Measels - 0.0 - 0.0 - 0.0 - 0.0
Tetanus (excluding neonatal) 1 0.4 1 0.4 1 0.4 1 0.4
Tetanus neonatorum 1 0.4 - 0.0 - 0.0 - 0.0
Pertussis - 0.0 1 0.4 - 0.0 - 0.0
Emergent & Re-emergent Diseases
Cholera 2 0.9 29 12.3 12 4.9 - 0.0
Yellow fever - 0.0 - 0.0 - 0.0 - 0.0
Malaria 4,014 1750.5 1,936 820.3 1,847 760.1 1,441 576.9
Acute conjunctivitis 2,074 904.5 847 358.9 266 109.5 241 96.5
Other
Dengue fever 8 3.5 23 9.7 - 0.0 3 1.2
Food-borne illness 47 20.5 60 25.4 25 10.3 28 11.2
Gastroenteritis (under 5 years) 1,092 476.2 1,642 695.8 545 224.3 390 156.1
Influenza 937 408.6 1,711 725.0 2,135 878.6 575 230.2
Leptospirosis - 0.0 1 0.4 - 0.0 - 0.0
Meningoccocal infections - 0.0 1 0.4 1 0.4 - 0.0
Rabies in man - 0.0 - 0.0 - 0.0 - 0.0
Scabies 61 26.6 105 44.5 63 25.9 125 50.0
Typhoid fever & paratyphoid fever 5 2.2 1 0.4 - 0.0 - 0.0
Viral hepatitis -B 1 0.4 1 0.4 3 1.2 - 0.0
Viral hepatitis -other 28 12.2 25 10.6 32 13.2 66 26.4
Source: National Health Information Unit, MOH 2003.
Symbols and Abbreviations:
- magnitude zero
0 magnitude less than half the measurement unit
REGIONAL EVALUATION OF MUNICIPAL SOLID WASTE MANAGEMENT SERVICES 33