regional development area ipswich and west moreton · 2011 (19 per cent) compared with both...
TRANSCRIPT
Slide 1
Ipswich and West Moreton Regional Development Area Overview of the Labour Market Presenter: Ivan Neville, Branch Manager, Labour Market Research and Analysis Branch
Ipswich and West Moreton
Regional Development AreaMay 2013
Ivan Neville Branch Manager
Labour Market Research and Analysis Branch
Ipswich and West Moreton
Regional Development AreaMay 2013
Ivan Neville Branch Manager
Labour Market Research and Analysis Branch
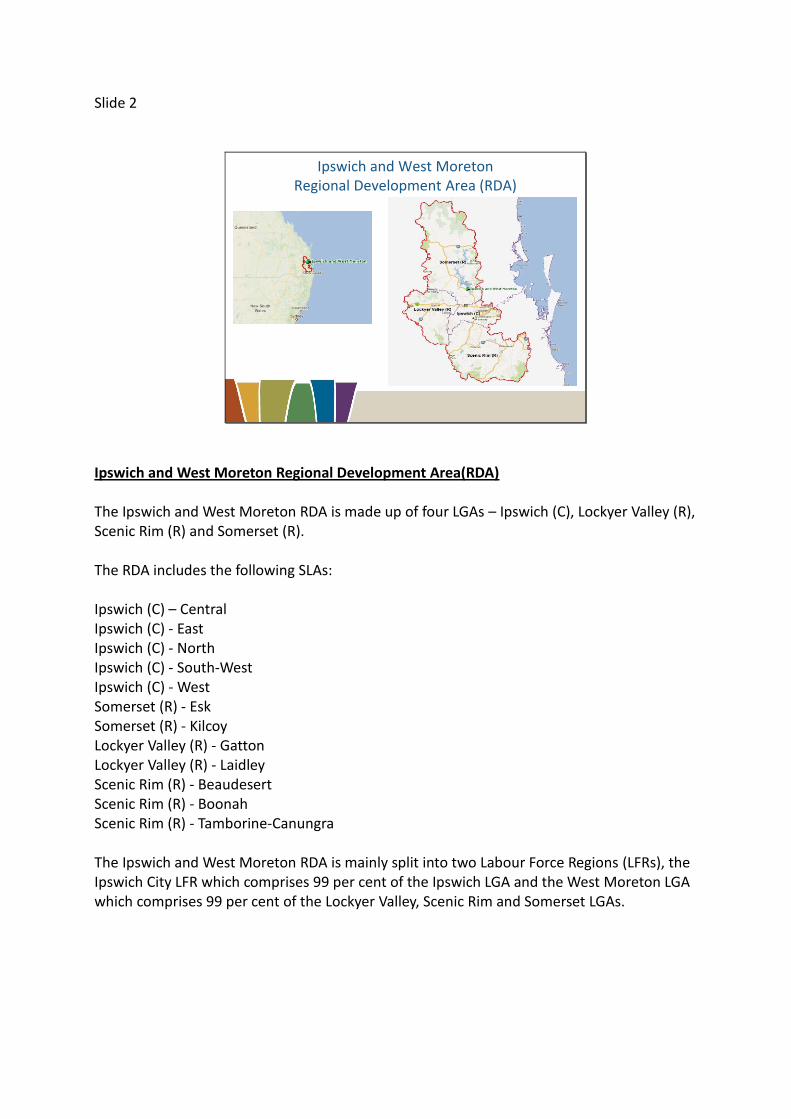
Slide 2
Ipswich and West Moreton Regional Development Area (RDA)
Ipswich and West Moreton Regional Development Area(RDA) The Ipswich and West Moreton RDA is made up of four LGAs – Ipswich (C), Lockyer Valley (R), Scenic Rim (R) and Somerset (R). The RDA includes the following SLAs: Ipswich (C) – Central Ipswich (C) - East Ipswich (C) - North Ipswich (C) - South-West Ipswich (C) - West Somerset (R) - Esk Somerset (R) - Kilcoy Lockyer Valley (R) - Gatton Lockyer Valley (R) - Laidley Scenic Rim (R) - Beaudesert Scenic Rim (R) - Boonah Scenic Rim (R) - Tamborine-Canungra The Ipswich and West Moreton RDA is mainly split into two Labour Force Regions (LFRs), the Ipswich City LFR which comprises 99 per cent of the Ipswich LGA and the West Moreton LGA which comprises 99 per cent of the Lockyer Valley, Scenic Rim and Somerset LGAs.
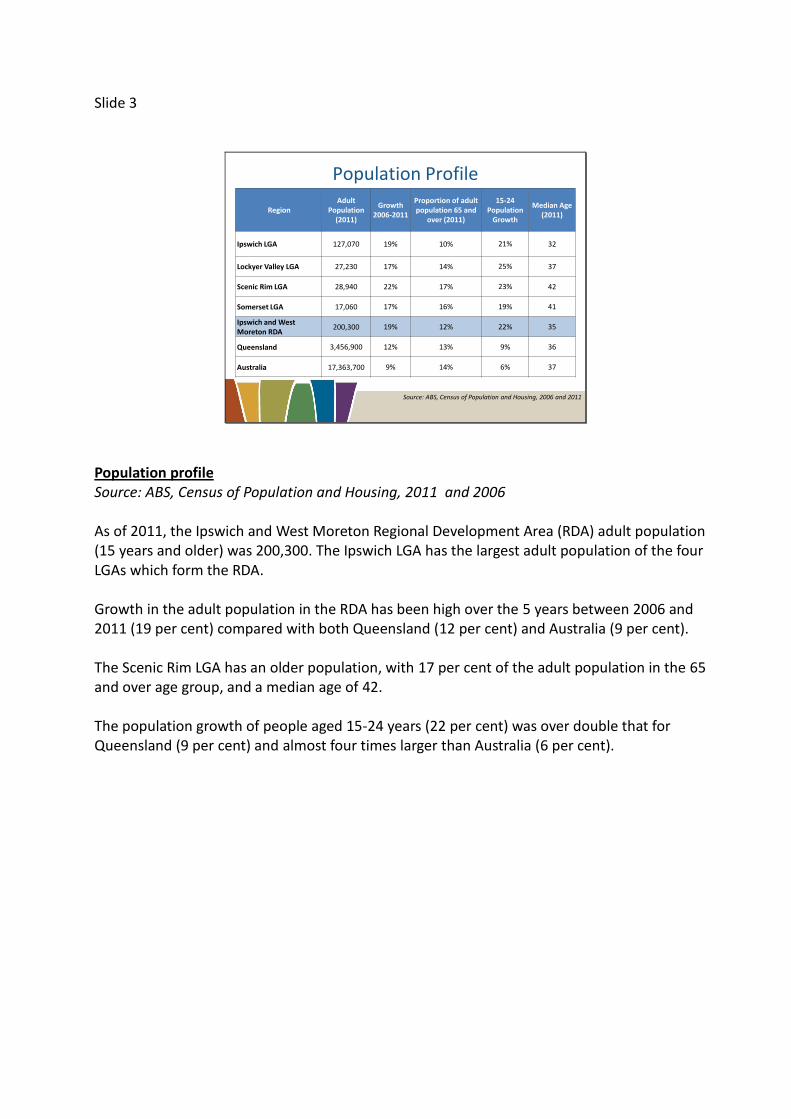
Slide 3
Source: ABS, Census of Population and Housing, 2006 and 2011
Population Profile
RegionAdult
Population (2011)
Growth 2006-2011
Proportion of adult population 65 and
over (2011)
15-24Population
Growth
Median Age (2011)
Ipswich LGA 127,070 19% 10% 21% 32
Lockyer Valley LGA 27,230 17% 14% 25% 37
Scenic Rim LGA 28,940 22% 17% 23% 42
Somerset LGA 17,060 17% 16% 19% 41
Ipswich and West Moreton RDA
200,300 19% 12% 22% 35
Queensland 3,456,900 12% 13% 9% 36
Australia 17,363,700 9% 14% 6% 37
Population profile Source: ABS, Census of Population and Housing, 2011 and 2006 As of 2011, the Ipswich and West Moreton Regional Development Area (RDA) adult population (15 years and older) was 200,300. The Ipswich LGA has the largest adult population of the four LGAs which form the RDA. Growth in the adult population in the RDA has been high over the 5 years between 2006 and 2011 (19 per cent) compared with both Queensland (12 per cent) and Australia (9 per cent). The Scenic Rim LGA has an older population, with 17 per cent of the adult population in the 65 and over age group, and a median age of 42. The population growth of people aged 15-24 years (22 per cent) was over double that for Queensland (9 per cent) and almost four times larger than Australia (6 per cent).

Slide 4
Source: ABS, Census of Population and Housing, 2011
Age distribution
Age distribution Source: ABS, Census of Population and Housing, 2011 The population of the Ipswich and West Moreton RDA follows a similar pattern of distribution to Queensland. However, the Scenic Rim and Somerset LGAs had a lower proportion of 20-34 year olds and a larger proportion of people aged over 45 years.
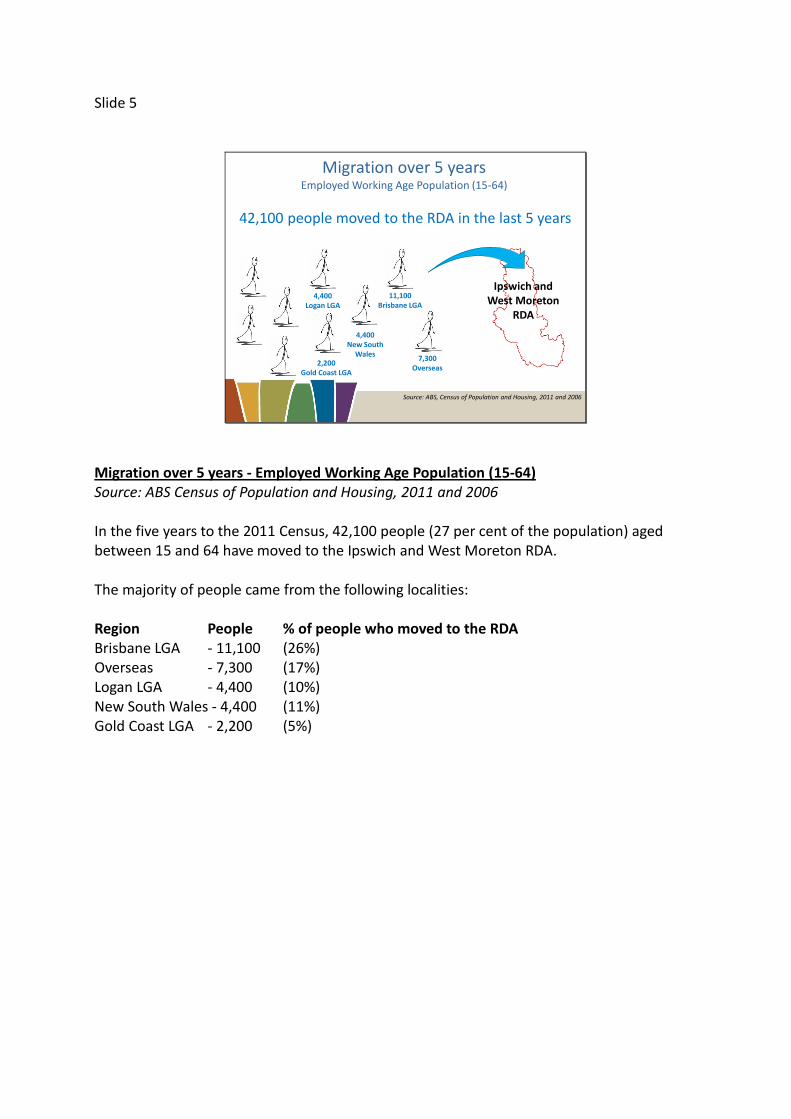
Slide 5
Migration over 5 yearsEmployed Working Age Population (15-64)
Ipswich and West Moreton
RDA
42,100 people moved to the RDA in the last 5 years
4,400Logan LGA
2,200Gold Coast LGA
11,100Brisbane LGA
4,400New South
Wales7,300
Overseas
Source: ABS, Census of Population and Housing, 2011 and 2006
Migration over 5 years - Employed Working Age Population (15-64) Source: ABS Census of Population and Housing, 2011 and 2006 In the five years to the 2011 Census, 42,100 people (27 per cent of the population) aged between 15 and 64 have moved to the Ipswich and West Moreton RDA. The majority of people came from the following localities: Region People % of people who moved to the RDA Brisbane LGA - 11,100 (26%) Overseas - 7,300 (17%) Logan LGA - 4,400 (10%) New South Wales - 4,400 (11%) Gold Coast LGA - 2,200 (5%)

Slide 6
Rising unemployment rate
Source: ABS Labour Force, March 2013 (12 month average)
Rising unemployment rate Source: ABS Labour Force, March 2013 (12 month average) The unemployment rate in the Ipswich and West Moreton RDA has fluctuated from October 2008 to December 2011. However, in the 15 months to March 2013, the unemployment rate has risen to stand at 5.7 per cent. It is currently just below Queensland (5.8 per cent) and above Australia (5.3 per cent). The RDA is made up of the Ipswich City (99 per cent) and West Moreton LFRs (99 per cent).

Slide 7
Unemployment Rate by LGA
Region Dec 11 Dec 12
Ipswich LGA 4.9% 5.6%
Lockyer Valley LGA 4.5% 7.3%
Scenic Rim LGA 4.3% 5.4%
Somerset LGA 4.4% 7.4%
Ipswich West Moreton RDA 4.7% 5.9%
Queensland 5.5% 5.8%
Source: DEEWR Small Area Labour Markets, December Quarter 2012 (Smoothed)
Unemployment Rate by LGA Source: DEEWR Small Area Labour Markets, December Quarter 2012 (Smoothed) In December 2012 the unemployment rate for the Ipswich West Moreton RDA was similar to Queensland (5.9 per cent compared to 5.8 per cent). The Somerset LGA had the highest unemployment rate in the PEA (7.4 per cent), whilst the Scenic Rim LGA recorded the lowest unemployment rate of 5.4 per cent.

Slide 8
Larger proportion of income support recipients
Source: DEEWR, Administrative data, March 2013; ABS, Census of Population and Housing, 2011
RegionProportion of the WAP on a benefit
(Mar 2013)
% change for all benefit recipients
(Mar 2012 to Mar 2013)
Proportion of the WAP on an
unemployment benefit
(Mar 2013)
% change for all unemployment
benefit recipients (Mar 2012 to
Mar 2013)
Ipswich LGA 23% 4% 7% 23%
Lockyer Valley LGA 25% 1% 7% 19%
Scenic Rim LGA 18% 3% 6% 21%
Somerset LGA 26% 5% 7% 25%
Ipswich and West Moreton RDA
23% 4% 7% 22%
Queensland 18% 1% 6% 17%
Australia 17% 0% 5% 19%
Larger proportion of income support recipients Source: DEEWR, Administrative data, March 2013; ABS, Census of Population and Housing, 2011 In March 2013, 23 per cent of the Working Age Population (WAP) were in receipt of an income support benefit in the Ipswich and West Moreton RDA. This was larger when compared with state and national levels (18 per cent and 17 per cent respectively). In the Lockyer Valley LGA a quarter of the WAP is receiving an income support benefit. Overall, the proportion of the WAP in the RDA in receipt of an income support benefit increased by 4 per cent in the year to March 2013. Some 7 per cent of the Ipswich and West Moreton RDA WAP were in receipt of an unemployment benefit, which is only slightly higher than both state and Australia levels (6 per cent and 5 per cent respectively). Some 8 per cent of the WAP in the Ipswich and West Moreton RDA were on Disability Support Pension (DSP). This is slightly more when compared to Queensland (5 per cent) and Australia (6 per cent).

Slide 9
Long-term unemployment
Source: ABS Labour Force Data, March 2013, (12 month average)
Region
Long-term unemployed (52 weeks or more)
Average duration of unemployment
PersonsPercent of all unemployed
Ipswich and West Moreton RDA 1,500 20% 34 weeks
Queensland 26,400 18% 35 weeks
Australia 121,100 19% 37 weeks
Long-term unemployment Source: ABS Labour Force Data, March 2013 12 month average Long-term unemployed are those who have been unemployed and looking for work for at least 52 weeks. The proportion of unemployed persons who were long-term unemployed in the Ipswich and West Moreton RDA (20 per cent) was slightly higher compared with the Queensland (18 per cent) and national averages (19 per cent). The average duration of unemployment in the Ipswich and West Moreton RDA (34 weeks) was similar to Queensland (35 weeks) and lower than Australia (37 weeks).
Slide 10
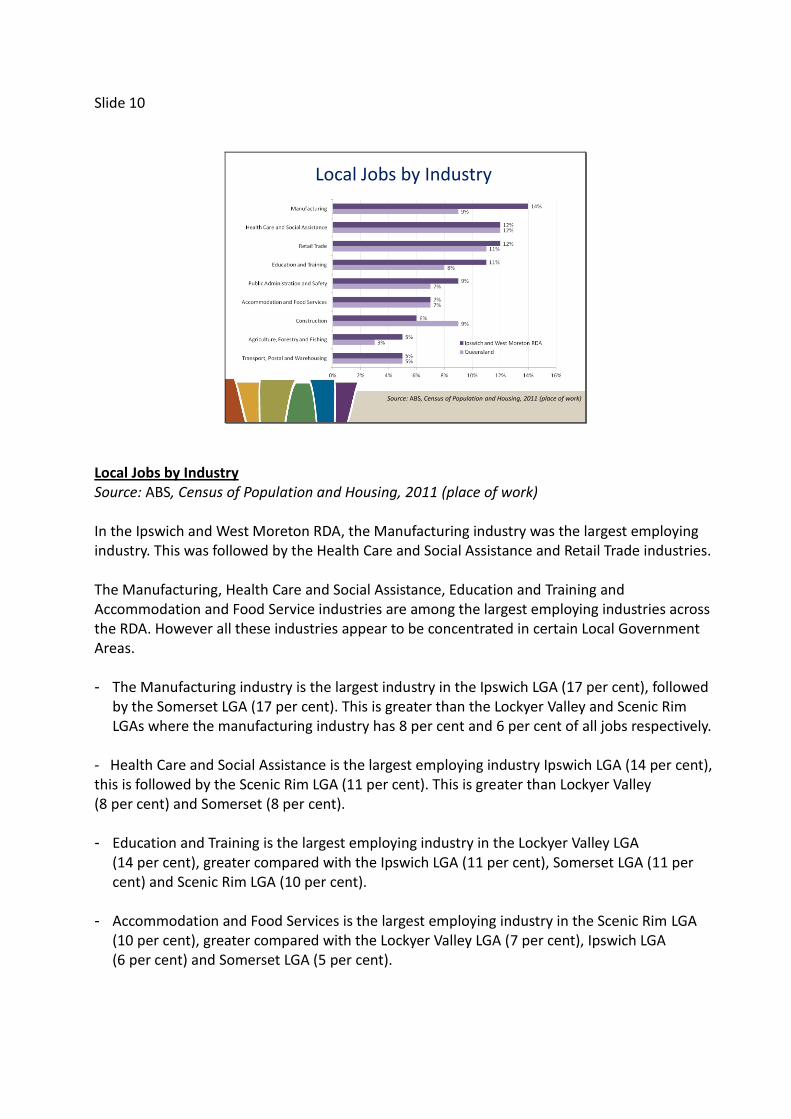
Local Jobs by Industry
Source: ABS, Census of Population and Housing, 2011 (place of work)
Local Jobs by Industry Source: ABS, Census of Population and Housing, 2011 (place of work) In the Ipswich and West Moreton RDA, the Manufacturing industry was the largest employing industry. This was followed by the Health Care and Social Assistance and Retail Trade industries. The Manufacturing, Health Care and Social Assistance, Education and Training and Accommodation and Food Service industries are among the largest employing industries across the RDA. However all these industries appear to be concentrated in certain Local Government Areas. - The Manufacturing industry is the largest industry in the Ipswich LGA (17 per cent), followed
by the Somerset LGA (17 per cent). This is greater than the Lockyer Valley and Scenic Rim LGAs where the manufacturing industry has 8 per cent and 6 per cent of all jobs respectively.
- Health Care and Social Assistance is the largest employing industry Ipswich LGA (14 per cent), this is followed by the Scenic Rim LGA (11 per cent). This is greater than Lockyer Valley (8 per cent) and Somerset (8 per cent). - Education and Training is the largest employing industry in the Lockyer Valley LGA
(14 per cent), greater compared with the Ipswich LGA (11 per cent), Somerset LGA (11 per cent) and Scenic Rim LGA (10 per cent).
- Accommodation and Food Services is the largest employing industry in the Scenic Rim LGA
(10 per cent), greater compared with the Lockyer Valley LGA (7 per cent), Ipswich LGA (6 per cent) and Somerset LGA (5 per cent).
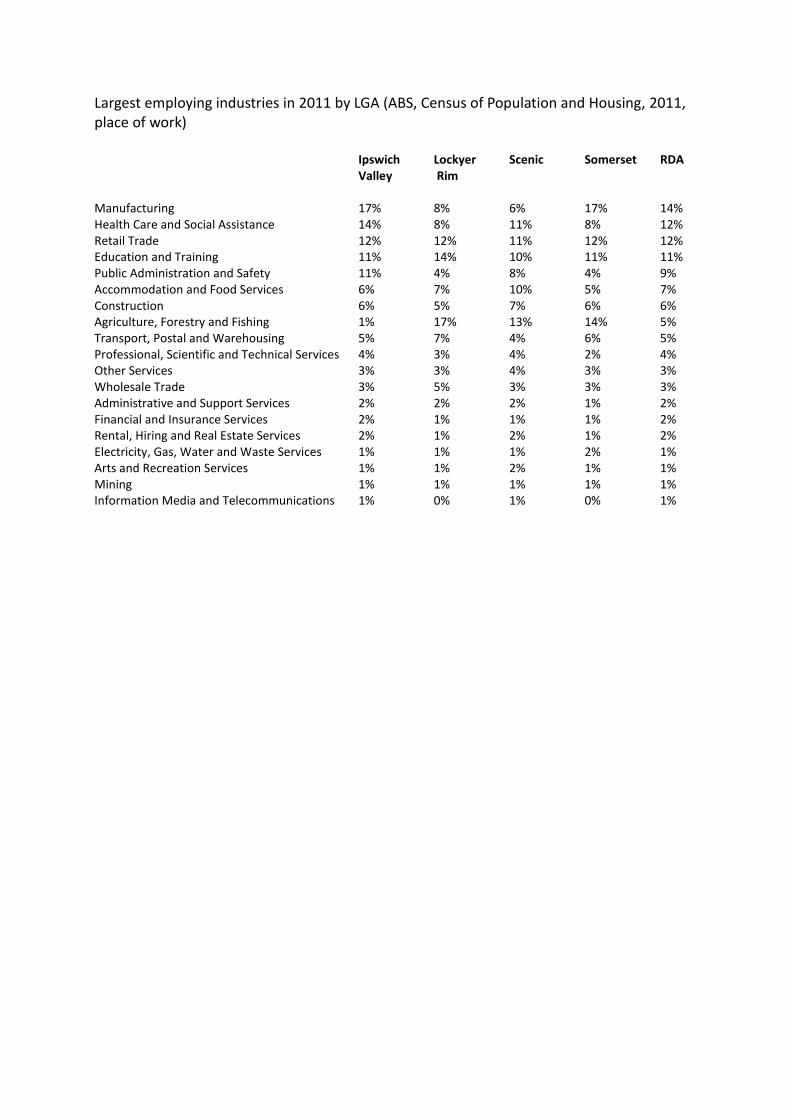
Largest employing industries in 2011 by LGA (ABS, Census of Population and Housing, 2011, place of work) Ipswich Lockyer Scenic Somerset RDA Valley Rim Manufacturing 17% 8% 6% 17% 14% Health Care and Social Assistance 14% 8% 11% 8% 12% Retail Trade 12% 12% 11% 12% 12% Education and Training 11% 14% 10% 11% 11% Public Administration and Safety 11% 4% 8% 4% 9% Accommodation and Food Services 6% 7% 10% 5% 7% Construction 6% 5% 7% 6% 6% Agriculture, Forestry and Fishing 1% 17% 13% 14% 5% Transport, Postal and Warehousing 5% 7% 4% 6% 5% Professional, Scientific and Technical Services 4% 3% 4% 2% 4% Other Services 3% 3% 4% 3% 3% Wholesale Trade 3% 5% 3% 3% 3% Administrative and Support Services 2% 2% 2% 1% 2% Financial and Insurance Services 2% 1% 1% 1% 2% Rental, Hiring and Real Estate Services 2% 1% 2% 1% 2% Electricity, Gas, Water and Waste Services 1% 1% 1% 2% 1% Arts and Recreation Services 1% 1% 2% 1% 1% Mining 1% 1% 1% 1% 1% Information Media and Telecommunications 1% 0% 1% 0% 1%
Slide 11
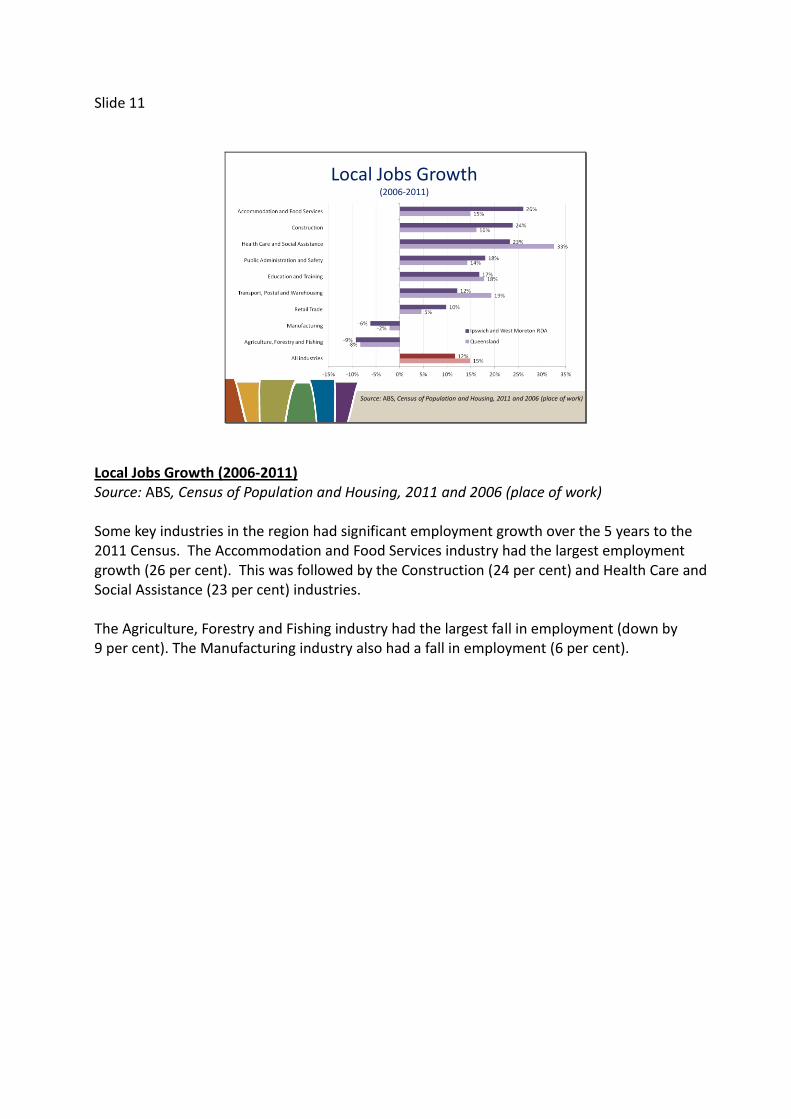
Local Jobs Growth(2006-2011)
Source: ABS, Census of Population and Housing, 2011 and 2006 (place of work)
Local Jobs Growth (2006-2011) Source: ABS, Census of Population and Housing, 2011 and 2006 (place of work)
Some key industries in the region had significant employment growth over the 5 years to the 2011 Census. The Accommodation and Food Services industry had the largest employment growth (26 per cent). This was followed by the Construction (24 per cent) and Health Care and Social Assistance (23 per cent) industries. The Agriculture, Forestry and Fishing industry had the largest fall in employment (down by 9 per cent). The Manufacturing industry also had a fall in employment (6 per cent).

Industry growth by LGA Industry Ipswich Lockyer Valley Scenic Rim Somerset Total
LGA LGA LGA LGA Agriculture, Forestry and Fishing -34% -14% 4% -5% -9% Mining 43% -17% 122% 50% 39% Manufacturing -11% 5% 3% 40% -6% Electricity, Gas, Water and Waste Services 15% 16% 43% 58% 22% Construction 27% 27% 7% 37% 24% Wholesale Trade 11% 13% 9% -4% 10% Retail Trade 12% 6% -2% 26% 10% Accommodation and Food Services 29% 44% 16% 0% 26% Transport, Postal and Warehousing 11% 20% 20% 0% 12% Information Media and Telecommunications -29% 32% 29% 37% -13% Financial and Insurance Services 16% 14% -2% -4% 13% Rental, Hiring and Real Estate Services 4% -17% 2% -1% 1% Professional, Scientific and Technical Services 13% 42% 26% 32% 18% Administrative and Support Services 31% 17% 32% 55% 31% Public Administration and Safety 28% 17% -18% -8% 18% Education and Training 17% 28% 8% 15% 17% Health Care and Social Assistance 23% 21% 27% 20% 23% Arts and Recreation Services 4% 36% 17% 33% 12% Other Services 21% 3% 28% 6% 19% Total 12% 11% 9% 15% 12%

Slide 12
Strong part-time employment growth to 2011
2011Change
(2011-2006)% Change
Total Employment 72,600 7,400 11%
Full-Time Employment 47,800 3,600 8%
Part-Time Employment 24,800 3,800 18%
Higher Skilled Occupations 32,900 3,200 11%
Lower Skilled Occupations 24,300 1,500 7%
Source: ABS, Census of Population and Housing, 2011 and 2006 (place of work)
Strong part-time employment growth to 2011 Source: ABS, Census of Population and Housing, 2011 and 2006 (place of work) Total employment in the RDA increased by 11 per cent, from 2006 to 2011. This increase in employment was primarily driven by part-time employment, which grew by 18 per cent. Employment in higher skilled occupations (11 per cent) experienced greater growth when compared with lower skilled occupations (7 per cent).

Slide 13
Job growth for males working part-time
Source: ABS, Census of Population and Housing, 2011 and 2006 (place of work)
5%
21%
15%
17%
11%
23%
16% 16%
0%
5%
10%
15%
20%
25%
Employed, worked full-time Employed, worked part-time Employed, worked full-time Employed, worked part-time
Male Female
Ipswich and West Moreton RDA
Queensland
Job growth for males working part-time Source: ABS, Census of Population and Housing, 2011 and 2006 (place of work) Job growth in the Ipswich and West Moreton RDA was lower for both males working full-time and part-time and females working full-time, compared with Queensland. Males working part-time experienced the largest growth in the RDA (21 per cent). This was followed by females working part-time (17 per cent). Although males working part-time experienced strong growth, it was still lower compared with Queensland.
Slide 14
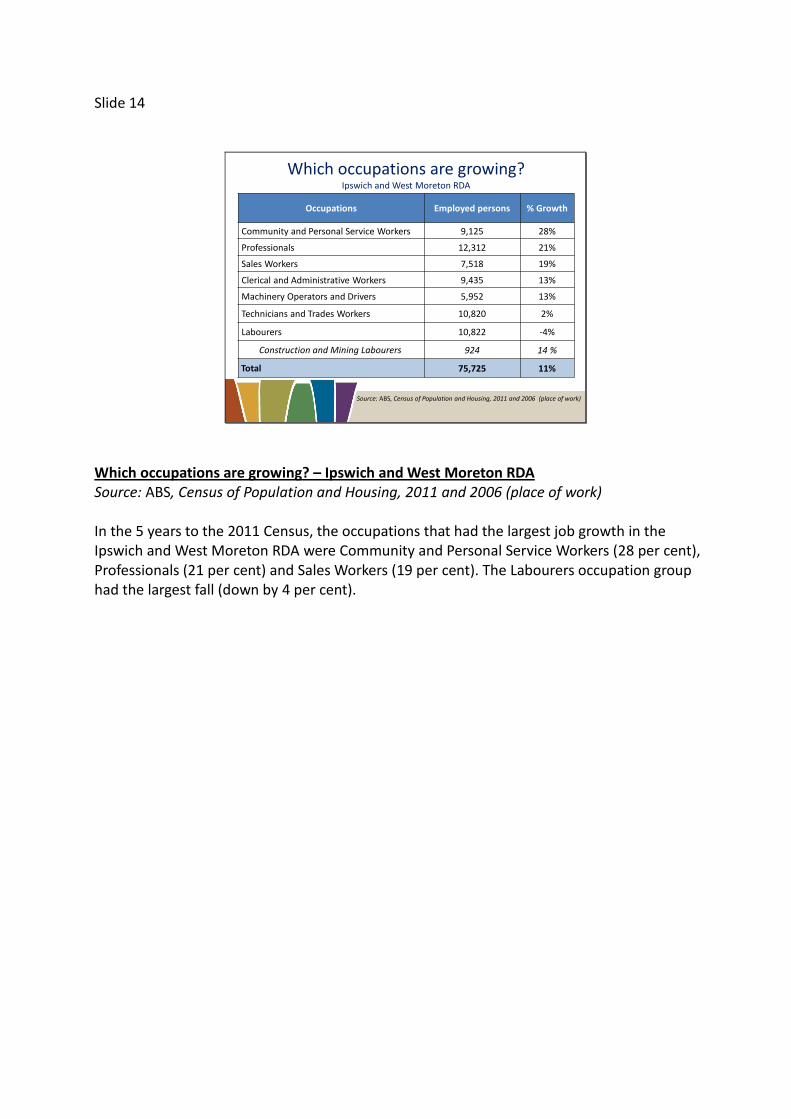
Occupations Employed persons % Growth
Community and Personal Service Workers 9,125 28%
Professionals 12,312 21%
Sales Workers 7,518 19%
Clerical and Administrative Workers 9,435 13%
Machinery Operators and Drivers 5,952 13%
Technicians and Trades Workers 10,820 2%
Labourers 10,822 -4%
Construction and Mining Labourers 924 14 %
Total 75,725 11%
Which occupations are growing?Ipswich and West Moreton RDA
Source: ABS, Census of Population and Housing, 2011 and 2006 (place of work)
Which occupations are growing? – Ipswich and West Moreton RDA Source: ABS, Census of Population and Housing, 2011 and 2006 (place of work) In the 5 years to the 2011 Census, the occupations that had the largest job growth in the Ipswich and West Moreton RDA were Community and Personal Service Workers (28 per cent), Professionals (21 per cent) and Sales Workers (19 per cent). The Labourers occupation group had the largest fall (down by 4 per cent).

Slide 15
Recent softening in recruitment activity for the Ipswich LGA
Survey results for the Ipswich LGA suggest a softening in labour demand between January 2012 and February 2013
o A substantially lower proportion of employers recruited in the year before the survey
o Employers recruited for fewer vacancies
o More job seekers are competing for limited vacancies
Employers’ outlook for the year following the survey had become more subdued
o Fewer employers expected to recruit or increase staff
Source: DEEWR, Survey of Employers’ Recruitment Experiences, Ipswich-Logan PEA, January 2012 and February 2013
Recent softening in recruitment activity for the Ipswich LGA Source: DEEWR, Survey of Employers’ Recruitment Experiences, Ipswich-Logan PEA, January 2012 and February 2013 Survey results for the Ipswich LGA suggest a softening in labour demand between January 2012 and February 2013 o A substantially lower proportion of employers recruited in the year before the survey o Employers recruited for fewer vacancies o More job seekers are competing for limited vacancies Employers’ outlook for the year following the survey had become more subdued o Fewer employers expected to recruit or increase staff
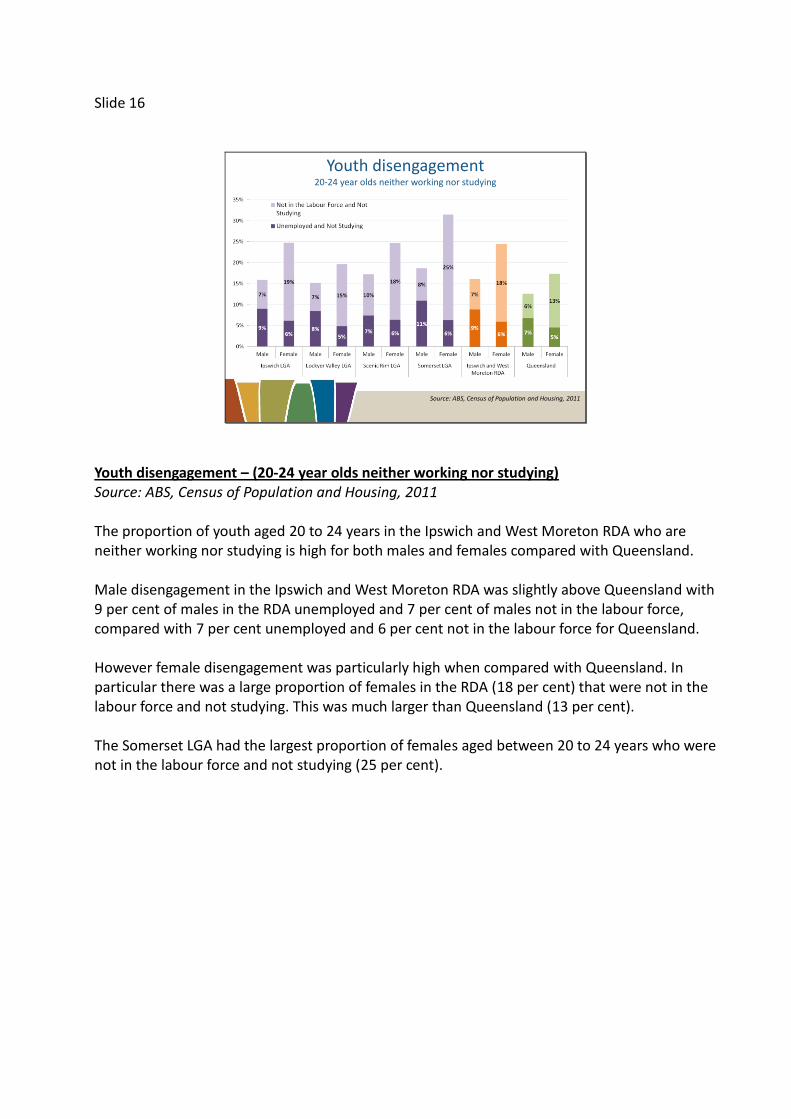
Slide 16
Youth disengagement20-24 year olds neither working nor studying
Source: ABS, Census of Population and Housing, 2011
Youth disengagement – (20-24 year olds neither working nor studying) Source: ABS, Census of Population and Housing, 2011 The proportion of youth aged 20 to 24 years in the Ipswich and West Moreton RDA who are neither working nor studying is high for both males and females compared with Queensland. Male disengagement in the Ipswich and West Moreton RDA was slightly above Queensland with 9 per cent of males in the RDA unemployed and 7 per cent of males not in the labour force, compared with 7 per cent unemployed and 6 per cent not in the labour force for Queensland. However female disengagement was particularly high when compared with Queensland. In particular there was a large proportion of females in the RDA (18 per cent) that were not in the labour force and not studying. This was much larger than Queensland (13 per cent). The Somerset LGA had the largest proportion of females aged between 20 to 24 years who were not in the labour force and not studying (25 per cent).

Slide 17
More Female income support recipients across the RDAFemales aged 20-24 years
Source: DEEWR, Administrative data, March 2013; ABS, Census of Population and Housing, 2011
Region% on Income
Support Payment
% on Unemployment
Benefits% on DSP
% on Parenting Payments
Ipswich LGA 37% 9% 3% 19%
Lockyer Valley LGA 40% 7% 2% 14%
Scenic Rim LGA 28% 9% 4% 13%
Somerset LGA 42% 11% 4% 21%
Ipswich and West Moreton RDA
37% 9% 3% 18%
Queensland 28% 7% 2% 10%
Australia 27% 7% 2% 8%
More Female income support recipients across the RDA - Females aged 20-24 years Source: DEEWR, Administrative data, March 2013; ABS, Census of Population and Housing, 2011 There is a large proportion of females Aged 20-24 years who are in receipt of an income support payment in the Ipswich and West Moreton RDA (37 per cent) compared with both Queensland (28 per cent) and Australia (27 per cent). The Somerset LGA had the largest proportion of females aged 20-24 years in receipt of an income support payment (42 per cent). Interestingly, 25 per cent of females in this age group in the Somerset LGA were neither working nor studying. A considerably large proportion of females (18 per cent) aged 20-24 in the Ipswich and West Moreton RDA are in receipt of a parenting payment. The Somerset LGA had 21 per cent of females in this age range receiving a type of parenting payment. This is far larger than Queensland (10 per cent) and Australia (8 per cent).
Slide 18
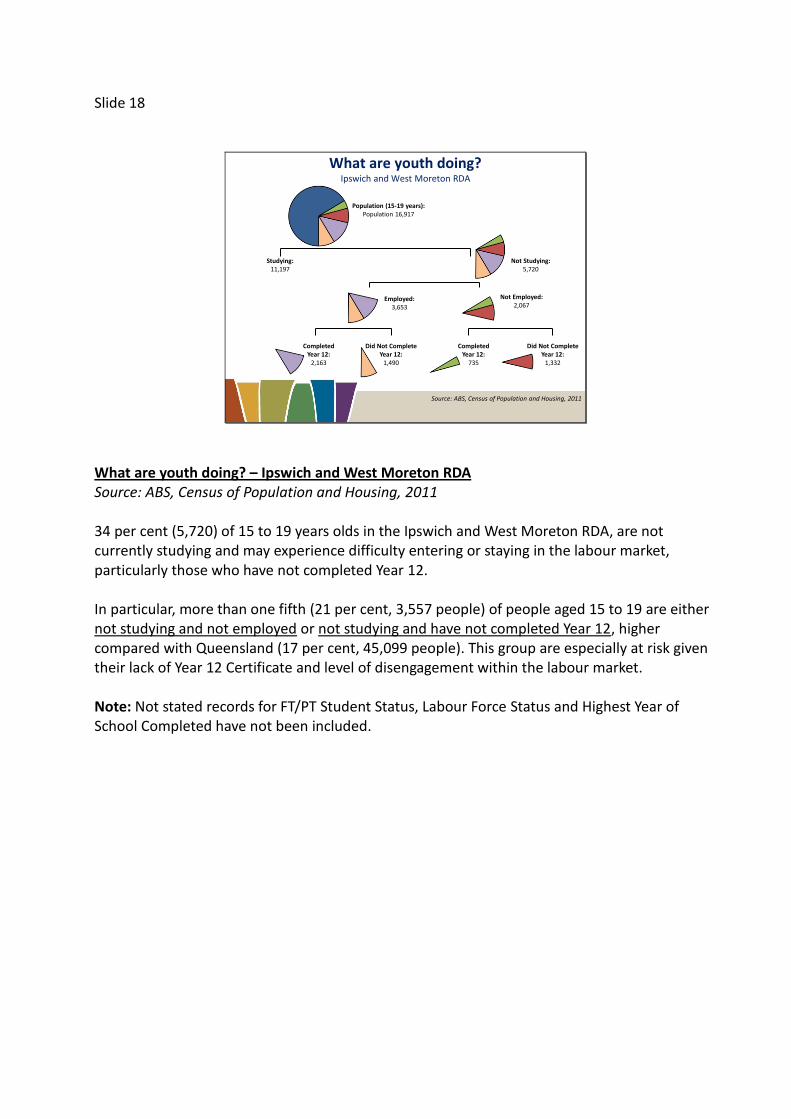
What are youth doing?Ipswich and West Moreton RDA
Population (15-19 years):Population 16,917
Studying:11,197
Not Studying:5,720
Not Employed:2,067
Employed:3,653
CompletedYear 12:
2,163
Did Not CompleteYear 12:
1,490
CompletedYear 12:
735
Did Not CompleteYear 12:
1,332
Source: ABS, Census of Population and Housing, 2011
What are youth doing? – Ipswich and West Moreton RDA Source: ABS, Census of Population and Housing, 2011 34 per cent (5,720) of 15 to 19 years olds in the Ipswich and West Moreton RDA, are not currently studying and may experience difficulty entering or staying in the labour market, particularly those who have not completed Year 12. In particular, more than one fifth (21 per cent, 3,557 people) of people aged 15 to 19 are either not studying and not employed or not studying and have not completed Year 12, higher compared with Queensland (17 per cent, 45,099 people). This group are especially at risk given their lack of Year 12 Certificate and level of disengagement within the labour market. Note: Not stated records for FT/PT Student Status, Labour Force Status and Highest Year of School Completed have not been included.

Slide 19
More Jobless Families(with children under 15 years old)
Source: ABS, Census of Population and Housing, 2011
RegionNumber of
jobless families
Proportion of all families
who are jobless
Proportion of couple families
who are jobless
Proportion of lone parent
families who are jobless
Ipswich LGA 3654 19% 6% 51%
Lockyer Valley LGA 739 21% 9% 56%
Scenic Rim LGA 569 16% 6% 47%
Somerset LGA 439 20% 8% 55%
Ipswich and West Moreton RDA 5401 19% 7% 51%
Queensland 62,170 14% 5% 43%
Australia 294,880 14% 5% 44%
More Jobless Families Source: ABS, Census of Population and Housing, 2011 The proportion of families with children under the age of 15 who are jobless in the Ipswich and West Moreton RDA was higher in 2011 (19 per cent) compared to Queensland and Australia (both 14 per cent). In the Lockyer Valley LGA, the proportion of families with children under the age of 15 who are jobless was particularly high (21 per cent) whereas the Scenic Rim LGA recoded the lowest proportion (16 per cent), still higher than the state and national levels. The Lockyer Valley LGA had the largest proportion of lone parent families who are jobless (56 per cent), followed by the Somerset LGA at 55 per cent. This was higher than the RDA (51 per cent) and Queensland (43 per cent).

Slide 20
Indigenous Labour Market Outcomes
Source: ABS, Census of Population and Housing, 2011
RegionIndigenous
proportion of WAP
Unemployment Rate Participation Rate
Non-Indigenous
IndigenousNon-
IndigenousIndigenous
Ipswich LGA 3% 7.0% 18.8% 75.8% 58.2%
Ipswich – West SLA 5% 5.7% 18.2% 71.3% 29.4%
Lockyer Valley LGA 2% 6.5% 16.4% 72.1% 57.5%
Scenic Rim LGA 2% 5.6% 15.1% 74.5% 62.1%
Scenic Rim –Beaudesert SLA
5% 6.3% 20.4% 72.9% 55.9%
Somerset LGA 2% 6.7% 13.6% 69.3% 53.1%
Ipswich and West Moreton RDA
3% 6.7% 17.8% 74.6% 58.2%
Queensland 3% 5.9% 18.1% 77.8% 59.7%
Australia 2% 5.5% 17.2% 76.4% 55.9%
Indigenous Labour Market Outcomes Source: ABS, Census of Population and Housing, 2011 The proportion of the working age population who identify as Indigenous in the Ipswich and West Moreton RDA is low (3 per cent) on a par with Queensland. Overall, labour market conditions for working age Indigenous people in the Ipswich and West Moreton RDA were similar compared with Queensland, with lower unemployment (17.8 per cent, compared with 18.1 per cent for Queensland) but also a lower participation rate (74.6 per cent compared with 77.8 per cent).

Slide 21
Educational attainment lower across the RDAPersons aged 25-34 years
Source: ABS, Census of Population and Housing, 2011
Regions % completed Yr 12
% attained Advanced Diploma,
Diploma or Certificate III/IV
% attained Bachelor Degree or higher
Ipswich LGA 67% 34% 17%
Lockyer LGA 63% 31% 17%
Scenic Rim LGA 66% 37% 16%
Somerset LGA 58% 33% 12%
Ipswich and West Moreton RDA 66% 34% 17%
Queensland 74% 32% 29%
Educational attainment lower across the RDA – (Persons aged 25-34 years) Source: ABS, Census of Population and Housing, 2011 Rates of educational attainment in the Ipswich and West Moreton RDA were generally lower compared with Queensland. Some 66 per cent of people aged 25-34 years in the Ipswich and West Moreton RDA completed a Year 12 certificate, lower compared with Queensland (74 per cent). Interestingly, the proportion of those aged 25 to 34 years who have obtained an Advanced Diploma, Diploma or Certificate III/IV was higher for the Ipswich and West Moreton RDA (34 per cent) compared with Queensland (32 per cent). The Scenic Rim LGA had the largest proportion of people obtaining an Advanced Diploma, Diploma or Certificate II/IV (37 per cent). The proportion of 25 to 34 year olds who obtained a Bachelor degree or higher was far lower than compared with Queensland (17 per cent compared with 29 per cent).

Slide 22
Educational attainment and labour market outcomesPersons aged 25-34 years
Source: ABS, Census of Population and Housing, 2011
Educational attainment and labour market outcomes – (Persons aged 25-34 years) Source: ABS, Census of Population and Housing, 2011 There is a strong relationship between educational attainment and employment outcomes. For those aged 25 to 34 years in the Ipswich and West Moreton RDA, there were extremely high unemployment rates for those who had completed Certificate I & II but had not completed Year 12 (10.3 per cent) and those who did not complete Year 12 without any further post school qualification (14.0 per cent). Unemployment rates are considerably lower for those who have completed a tertiary education at the Bachelor degree, Advanced Diploma and Diploma Level. It should also be noted that employment outcomes are better for those who have attained Certificate Levels III or IV. This emphasises the importance of post school education in ensuring success in gaining employment.

Slide 23
Literacy and Numeracy
Source: MySchool website, 2012
Region
Year 9 govt school students who did not meet minimum standard for literacy in 2012*
Year 9 govt school students who did not meet minimum standard for numeracy in 2012*
Ipswich LGA 13% 8%
Lockyer Valley LGA 10% 5%
Scenic Rim LGA 11% 6%
Somerset LGA 15% 5%
Queensland 8% 5%
Australia 7% 5%
* Figures in the table are based on a selected government school in the LGA and are not an average of schools in the LGA
Literacy and Numeracy http://www.myschool.edu.au 2012 Figures for Australia and Queensland represent proportions of all Year 9 students who did not meet minimum standards for literacy and numeracy. This slide shows the proportion of Year 9 students at a selected government high school in the Ipswich and West Moreton RDA who did not meet minimum standards for literacy and numeracy in 2012, compared with the proportions of Year 9 students who did not meet minimum standards for literacy and numeracy in Queensland and Australia. While the selected government schools’ data is not necessarily representative of all Year 9 students in the RDA, it demonstrates that there are at least pockets of disadvantage within this RDA.
Slide 24
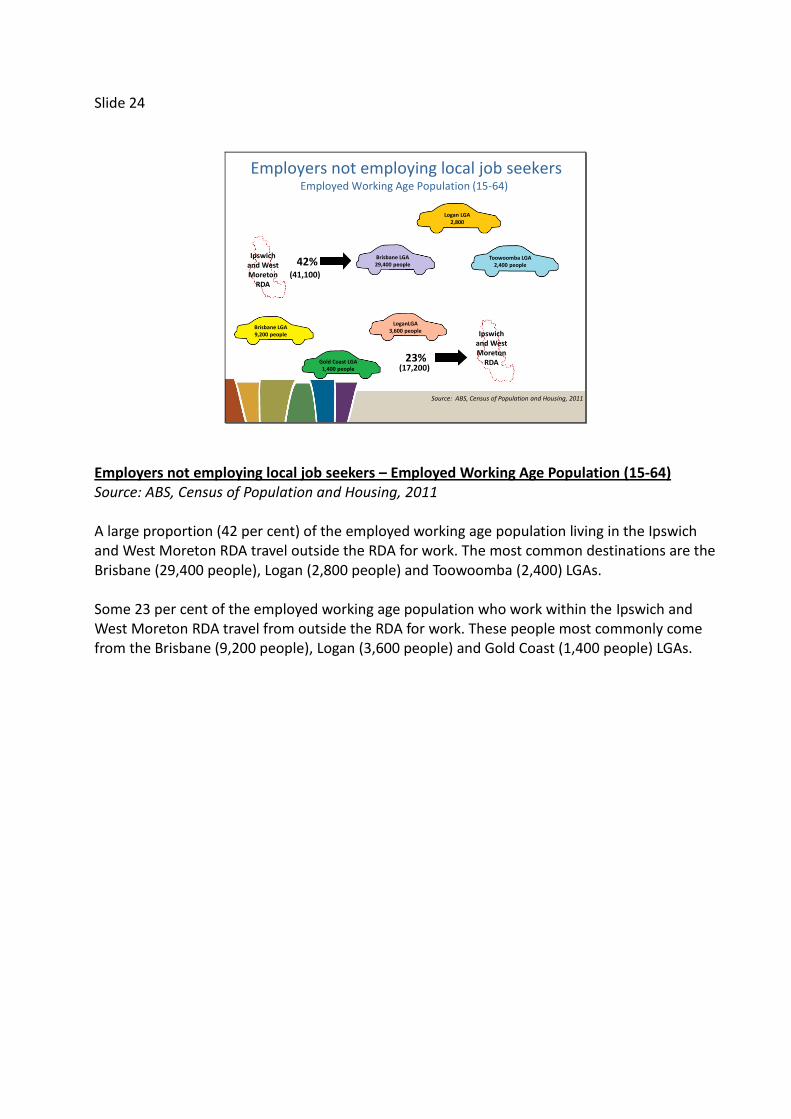
Employers not employing local job seekersEmployed Working Age Population (15-64)
Source: ABS, Census of Population and Housing, 2011
42%Brisbane LGA29,400 people
Logan LGA2,800
Toowoomba LGA2,400 people
Gold Coast LGA1,400 people
Brisbane LGA9,200 people
LoganLGA3,600 people
23%
(41,100)
(17,200)
Ipswich and West Moreton
RDA
Ipswich and West Moreton
RDA
Employers not employing local job seekers – Employed Working Age Population (15-64) Source: ABS, Census of Population and Housing, 2011 A large proportion (42 per cent) of the employed working age population living in the Ipswich and West Moreton RDA travel outside the RDA for work. The most common destinations are the Brisbane (29,400 people), Logan (2,800 people) and Toowoomba (2,400) LGAs. Some 23 per cent of the employed working age population who work within the Ipswich and West Moreton RDA travel from outside the RDA for work. These people most commonly come from the Brisbane (9,200 people), Logan (3,600 people) and Gold Coast (1,400 people) LGAs.

Slide 25
41,100 People Travel OUT
of the RDA for Work17,200 People Travel TO
the RDA for Work
Who is coming and going?Employed Working Age Population (15-64)
Source: ABS, Census of Population and Housing, 2011
Who is coming and going? Source: ABS, Census of Population and Housing, 2011 A large proportion of people travel out of the RDA for work. This slide shows the breakdown of the people coming in to the RDA for work and leaving the RDA for work, broken down by Occupation. Professionals make up 27 per cent of the 17,200 people who travel to the RDA for work. This is followed by 15 per cent for Technicians and Trades Workers. Clerical and Administrative workers make up 19 per cent of the 41,100 people who travel out of the RDA for work. This is followed by 17 per cent for Technicians and Trades Workers. The 27 per cent (4,600) of Professionals travelling to the RDA for work are made up primarily of: Education Professionals (37 per cent – 1,700) Health Professionals (24 per cent – 1,100) Design, Engineering, Science and Transport Professionals (16 per cent – 700)

Slide 26
ConclusionWhile unemployment has risen, labour market condition relatively strong, however…
– Employment declined in the Manufacturing and Agriculture, Forestry and Fishing industries
– Slowing recruitment activity in the Ipswich LGA
– Regional disparity among LGAs
– Youth disengagement, particularly females
– Ageing population in some areas
– Low educational attainment levels
– Many employers not employing local job seekers
Opportunities
– Strong population growth and participation rates are rising
– Employment growth stronger for higher skilled occupations, yet opportunities still exist for lower skilled occupations
– Employment opportunities for Technicians and Trade Workers and Professionals, and in Accommodation and Food Services, Construction and Health Care and Social Assistance industries
•Job seekers need to be job ready: literacy and numeracy / work experience / training / employability skills
•Collaboration amongst all key stakeholders
While unemployment has risen, labour market condition relatively strong, however… Employment declined in the Manufacturing and Agriculture, Forestry and Fishing industries Slowing recruitment activity in the Ipswich LGA Regional disparity among LGAs Youth disengagement, particularly females Ageing population in some areas Low educational attainment levels Many employers not employing locals
Opportunities Strong population growth and participation rates are rising Employment growth stronger for higher skilled occupations, yet opportunities still exist for lower skilled occupations Employment opportunities for Technicians and Trade Workers and Professionals, and in Accommodation and Food Services, Construction and Health Care and Social Assistance industries
Job seekers need to be job ready: literacy and numeracy / work experience / training / employability skills Collaboration amongst all key stakeholders

Slide 27
Further Information
www.deewr.gov.au/regional-reports-employers-recruitment-experiences
www.deewr.gov.au/lmip
www.deewr.gov.au/SkillShortages
www.deewr.gov.au/australianjobs
www.skillsinfo.gov.au
www.joboutlook.gov.au
www.deewr.gov.au/news/aussie-jobs
Further Information More information on labour market conditions and other research on small areas can be found on these web sites.
www.deewr.gov.au/regional-reports-employers-recruitment-experiences www.deewr.gov.au/lmip www.deewr.gov.au/SkillShortages www.deewr.gov.au/australianjobs www.skillsinfo.gov.au www.joboutlook.gov.au www.deewr.gov.au/news/aussie-jobs
This presentation will be placed on the regional reports section of the DEEWR website www.deewr.gov.au/regional-reports-employers-recruitment-experiences Thank you.

Slide 28
For any questions about this presentation please contact the
Regional and Industry Employer Surveys Section
on 1800 059 439 or email

Slide 29