regional cooperation towards multilateral … cooperation towards multilateral arrangements on...
TRANSCRIPT

WPE 065
Titik Anas Kurnya Roesad
March 2003
Economics Working Paper Series
http://www.csis.or.id/papers/wpe065
Regional Cooperation towards Multilateral Arrangements on Agriculture, Labour, and
Environment in the Context of Globalisation: The Case of Indonesia
The paper was presented at the conference on “Building A New Asia: Towards An Asian Economic Community“, organised by MIER, SPF and the Research and Information System for the Non-Aligned and Other Developing Countries (RIS), 11-12
March 2003, in Delhi.
CSIS WORKING PAPER SERIES
© 2004 Centre for Strategic and International Studies, Jakarta
The CSIS Working Paper Series is a means by which members of the Centre for Strategic andInternational Studies (CSIS) research community can quickly disseminate their research findings andencourage exchanges of ideas. The author(s) welcome comments on the present form of this WorkingPaper. The views expressed here are those of the author(s) and should not be attributed to CSIS Jakarta.

Regional Cooperation towards Multilateral Arrangements on Agriculture, Labour, and Environment in the Context of Globalisation: The Case of Indonesia Titik Anas Kurnya Roesad CSIS Working Paper Series WPE 065 March 2003
ABSTRACT This study looks at Indonesia’s commitments to multilateral trade agreements, and assesses
policies adopted by the government to meet the criteria set by those agreements. Particularly,
three sectors are of interest here: agriculture, labour and environment. One crucial question is
whether government and private sectors have successfully cooperated to prepare for further
liberalisation.
Keywords: Indonesia, multilateral trade agreements, agriculture, labour, environment, liberalisation
Titik Anas [email protected] Department of Economics CSIS Jakarta
Kurnya [email protected]
Department of EconomicsCSIS Jakarta

REGIONAL COOPERATION TOWARDS MULTILATERAL ARRANGEMENTS ON AGRICULTURE, LABOUR AND
ENVIRONMENT IN THE CONTEXT OF GLOBALISATION: THE CASE OF INDONESIA1
Titik Anas
And Kurnya Roesad
Introduction Indonesia has been a member of the GATT since 1950 through sponsorship of the Netherlands. In its membership period, Indonesia started to be more actively involved in the GATT/WTO system since the Uruguay Round in the period 1986-1994. This phase coincided with the progressive trade liberalization period. The Uruguay round achieved significant trade liberalization commitments among members, including agriculture. The change in approach towards GATT/WTO can be explained by at least two interrelated factors (Kartajoemena, 2001). Firstly, there were trade policy changes, from an inward-looking to an outward-looking policy regime. In the 1970s to mid 1980s, the government adopted an inward-looking trade regime. During this period, it adopted trade restrictions, tariff and non-tariff barriers to protect domestic producers, particularly manufacturing producers. In later periods, triggered by the oil crisis, the government shifted to an outward looking trade policy, as exports were expected to be the engine of growth. An export-oriented trade regime consequently required better access to foreign markets. On the other hand, the government also had to open its domestic market to imports to obtain more competitive raw materials and capital goods. Secondly, the manufacturing sector gained importance in the Indonesian economy. Indonesia was known as an agrarian economy. However, since 1990 the share of manufacturing sector in the GDP has surpassed that of agriculture. The growing importance of the manufacturing sector consequently needed a more open market, for imports as well as exports. This section will look at those two aspects in more detail. However, this paper will not address in detail why the manufacturing sector became more dominant. With regard to labor issues, there has been a rise in demands for linking labor standards and rights such as minimum wages and workers rights to trade policies at the bilateral, regional and multilateral levels. Indonesia has been a member of ILO and ratified major ILO conventions on labor. However, it is against linking trade with social clause. It considers a lower wage cost as a legitimate advantage. This paper will discuss in a more details Indonesian labor policies and its position in international fora. Indonesia is also a party to several major international multilateral environmental agreements (MEAs) and has implemented numerous aspects of these agreements
1 This working paper is based on a paper with the same title, commissioned by the Malaysian Insitute for Economic Research (MIER) and the Sagakawa Peace Foundation SPF).
Draft, not to be quoted 1

through regulations and other government actions. It has already ratified major conventions such as the Montreal Protocol and Kyoto Protocol. This paper will further elaborate Indonesia’s position in regard to environmental issues. Apart from a discussion on Indonesian domestic policies with regard to agriculture, labor and environment, this paper will also discuss Indonesia's preparation and its likely position in the next WTO round of negotiations and address the possible regional cooperation within Asia in these areas. A brief discussion on Indonesia’s trade policy changes in the last thirty years is presented in the first section. This discussion is essential to understand the changes in Indonesia's position towards multilateral arrangements, especially with regard to GATT/WTO. Section 3 outlines Indonesia’s position in Uruguay Round. Section 4 discusses Indonesia’s agriculture sector. It covers the performance, domestic policy and Indonesia position in the Uruguay Round with regard to agriculture. This section also discusses Indonesian two major agriculture exports: natural rubber and fishery product. Section 5 discusses trade related-labor issues, with special emphasis on social clause and Indonesia's position concerning the social clause. Section 6 discusses environmental issues and provides a short case study on the textiles industry’s capacity to meet environmental standards. Section 7 discusses the relations between ASEAN regional cooperation and the WTO. This section presents the potential for enhanced regional cooperation among ASEAN member countries in addressing the WTO related issues. Indonesia's Trade Policy Swings As briefly mentioned earlier, the change in approach towards GATT/WTO can be explained by trade policy swings in the last thirty years – from a liberal regime in the late 1960s to a more protectionist environment in the 1970s and back to a liberal regime since mid 1980s. The availability of domestic finance partly explained the swing. When the government is financially incapable, it subscribes to a more open trade regime. In contrast, when it becomes financially prosperous, it tends to be more protectionist. In other words, an open trade regime is like a ‘good friend for bad times’. The late 1960s was characterized by a relatively open trade regime to boost exports and ease imports as the economy needed imported capital goods. The New Order government took power in the late 1960s and was left with a totally bankrupt economy. The government adopted an open economic regime to mobilize resources in order to stabilize and rehabilitate the economy. The liberal trade regime did not last long, as Indonesia experienced huge oil revenues as a result of a sharp increase in oil price in the early 1970s and the late 1970s. Oil revenues enabled the government to finance ambitious capital-intensive investment. The state became directly involved in the production process. Increased nationalist sentiments led to a more protective trade environment. Industrialization process was targeted at import-substitute products, which can be financed by oil revenue windfall. It was backed up with trade protection.
Draft, not to be quoted 2

Falling oil prices, gradually in 1982-3 and then abruptly in 1985-6, produced an immediate and effective macroeconomic policy response, resulting in fiscal contraction and devaluation. To ameliorate the balance-of-payments (BOP) deficit due to declining terms of trade, the government took various measures: devaluation, rescheduling of capital-intensive projects, tariff reduction and customs reforms. However, during this period, some restrictive policies, especially in trade and industrial policies were also introduced. For example, in 1982, the government introduced a system called the approved importers system (Tata Niaga Impor),2 which became an instrument for quantitative restrictions on imports. It took a recession in 1985 and a plunge in oil prices in 1986, to halt the protectionist trends and to begin a substantive trade reform. The Rupiah was again devalued in September 1986 and this was followed by a series of substantive trade reforms in October 1986, January 1987, November 1988, May 1990, and June 1991. These major reforms were followed by a series of other trade and investment reforms in July 1992, June and October 1993, June 1994, May 1995, and June 1996. Table 1 presents the summary of trade reforms during 1986-1996. Post trade liberalization, import tariff decreased from 27 percent on average in 1986 to about 15 percent in 1995 and NTBs which covered 17 percent of traded-commodities in 1990 to about 63 percent in 1995.
Table 1 Summary of Trade Reforms during 1985-1996
Date Policy Changes Notes 1985, March Tariff Rationalization
Range reduction from 0-225% to 0-60% Number of tariff levels reduced from 25 to 11.
Some reduction in protection.
1985, April Customs Reform (INPRES No. 4)
Removal of Customs Dept in Goods Clearance. Appointment of Private Surveyor SGS. Removal of
Reduced subst. average time of imports and exports clearance. Important psychological
effect
1985, May (PAKEM)
Duty drawback and bypass monopoly Arms length transactions and computerized
processing.
Improve duty drawback process and important factor to increase exports.
1986, October
Some change from import licensing to general imports. Phasing down of NTBs with some increase in
tariff to offset Reduction in tariff needed in production.
Improved investment climate. Increased investments,
especially export oriented.
1987, January
Some change from import licensing to general imports
Reduction in NTB, increase transparency
2The system has been discussed at length in Pangestu (1996)
Draft, not to be quoted 3

Table 1 (Continued) Summary of Trade Reforms during 1985-1996
1987, July Simplification of Textile Quota
Transparency of allocation. Some allocation to newcomers and small scale.
Some improvements although now some complaints.
1988, November (PAKNOP)
Removal of import monopolies: plastic and steel. Inter-island shipping deregulation.
1990, May (PAKMEI)
Further removal and simplification of NTBs of 371 industrial items. Lift export controls of four agricultural
commodities. Deregulation of Pharmaceutical and Animal
Husbandry. Some adjustments in tariffs and reduce a
number of surcharges.
Improve investment climate. Coffee exporters’ and
joint coffee marketing groups lose monopoly status.
1991, June Reduce maximum tariff of finished goods to 30%, intermediate goods to 15%
Reduced protection
1992, July Tariff reduction of some minor items. Reduce or eliminate about two-thirds of tariff
surcharges.
Reduced protection
1994, June Tariff reductions of 739 items, reductions of 121 tariff surcharges. Some items on the approved importers list can
be imported by general importers.
Reduced protection
1995, May Reform tariff structure.& restructure import surcharges. Yet maintain import protection for steel and
plastic: Increase of import surcharge for steel and
polypropylene in relation to Krakatau Steel and Chandra Asri. Reduce coverage of import licensing from 242
items to 189. General target levels and a schedule of tariff
cuts to fulfill international commitments.
Reduced protection in general, but some policy consistencies started to emerge
1996, January
Reduce tariffs for 428 export-related products between 5 – 15%: …but backtracked on Chandra Asri a month
later, raising surcharge for propylene and ethylene by 5-25% Extend import duty drawback facility to goods
supplied to firms in special export processing zones. Wholly owned foreign trading companies can
export manufactured farm, forestry, fish and mining products.
Reduced protection, but the exclusion list continued
1996, June Reduce groups of products, reducing Indonesia’s unweighted tariff average to 12%. Simplified export procedures.
Source: Feridhanusetyawan (2001) Not long after the float of the Rupiah on August 14 1997, the financial crisis turned into an economic crisis. In October 1997, Indonesia asked for IMF assistance to rescue the economy. The bailout package was agreed in October 31,
Draft, not to be quoted 4

1997. The bailout fund was tied to an economic reform package, which included trade liberalization measures. During the IMF-led trade liberalization, Indonesia undertook substantial tariff and non-tariff reforms, which were relatively more progressive and comprehensive than Indonesian’s Uruguay Round commitments. It did not only cover manufacturing but also agricultural products (food and non food agriculture) and other sensitive commodities such as chemical and steels, as shown in Appendix 1. Under the IMF-led trade liberalization, import tariff on food items were already made 5 percent, while import tariff for non-food agriculture products would reach 10 percent by 2003. The abrupt trade liberalization under the IMF package made domestic producers of few agricultural commodities such as rice producers, sugar sugarcane farmers and sugar mills lost their grips in the market3. While, productivity is low, allowing cheap imported rice and sugar made domestic producers less competitive in the domestic market. The government responded to the request by granting protection to those commodities. There are few other cases where government policies are highly determined by public/interest group pressures. Indonesia’s Uruguay Commitments Indonesia became substantially more active in GATT/WTO trade negotiations since the Uruguay Round (UR), which is considered as the longest GATT/WTO negotiation round. It started in 1986 and concluded eight years later in 1994. As briefly described earlier, this coincides with the trade liberalization period in Indonesia which was characterized in the previous section as an export oriented trade policy regime/outward-looking policy. Kartadjoemena (2001) considers the Uruguay Round as the first serious interface that Indonesia has had with the GATT-WTO system in a comprehensive way. At the beginning, there were problems in dealing with tariff in a multi-sector way due to the lack of a framework and made this round needing eight years to conclude. At the end, the Round was concluded in 1994, achieving significant trade liberalization in goods. Indonesia signed the Uruguay Round Final Act in Marakesh in April 1994. Indonesia's commitments under the Uruguay Round for both goods and services include the following: 1. The binding majority of tariffs across-the-board at the ceiling of 40
percent. These binding covers 95 percent of the tariff lines, which consist of 7537 tariff lines of manufactured goods and 1341 tariff lines of agriculture. It covers 90 percent of Indonesian imports in 1992.
2. The tariffication and binding of all agriculture items with a reduction in the tariff of at least 10 percent per line item (24 percent overall) within 10 years and a guaranteed access threshold for rice imports of 70,000 tons annually (at a 90 percent tariff).
3. Removal of non-tariff barriers (NTBs) on tariff items included in Indonesian market access offer within 10 years. Upon signing the UR Final Act, this commitment affected 179 tariff lines (out of total of 269 tariff lines with NTBs). Of these NTBs 81 applied to agriculture items and
3 Low productivity of these two commodities resulted from different factors.
Draft, not to be quoted 5

98 applied to industrial items. In June 1994, Indonesia removed NTB measures on bound items, but another 87 NTBs still remain, which must be phased out over the coming 10 years as a result of UR.
4. Removal of all import surcharges on items that are included in the Indonesia’s market access offer within 10 years.
5. Exceptions related to items on the list of exceptions to Indonesia’s market access offer, for which licenses will not have to be removed, including 504 items (8.4 percent of tariff lines), out of which only 61 items (12 percent of total exception) are subject to applied tariff rates higher than 40 percent.
Table 2
Indonesia’s commitment at the Uruguay Round
TARIFF LINES Imports 1992
No. % US$m % A. TARIFF BINDING 1 Total Bound Manufactures 7537 80.3 22529 82.6 - Existing bindings 823 8.8 6227 22.8 - New Bindings 6714 71.6 16302 59.8 2 Total Agriculture (all bound) 1341 14.3 2464 9 3 Exceptions 504 5.4 2285 8.4 TOTAL 9382 100 27279 100 B AGRICULTURE 1 Tariffication and binding of all items
2 Duty reduction of 10 % by tariff line over 10 years
3 Elimination of local content requirement for milk products
4 Agreed access of 70000 tons of rice imports annually (at a 90 % tariff)
C. REMOVAL OF NON TARIFF BARRIERS ON BOUND TARIFF ITEMS
NTBs on 98 industrial tariff lines affecting $358 millions of imports to be removed within 10 years
D ELIMINATION OF IMPORT SURCHARGES ON BOUND TARIFF ITEMS
Surcharges varying between 5-25 % on 159 tariff lines affecting $838 million of imports to be removed within 10 years
Source : adopted from Erwidodo and Feridhanusetyawan (1997) In June 1994, the Parliament enacted the law to ratify Indonesian commitments under the Uruguay Round. In May 1995, the government introduced a reform package aimed at implementing Uruguay Round commitment of tariff reduction for the 1995-2003 period. Table 2.3 shows that by the year 2003, except those on automotive components and products, tariffs would be set at a maximum of 10 per cent, with most of the tariff lines falling in the 0-5 per cent range. On the other hand, at regional level, Indonesia also signed agreement with other ASEAN countries to establish a free trade area (AFTA) in the preferential tariff frameworks. In this context, 99 percent of Indonesian tariff lines for ASEAN countries were already in a range of 0-5 percent.
Draft, not to be quoted 6

Table 3
Schedule of Tariff Reductions under Uruguay Round, 1995-2003
Tariff before 23 May 1995 1995 1996 1997 1998 1999 2000 2001 2002 2003
5 5 5 5 5 5 max 5 10 5 5 5 5 5 max 5 15 10 10 5 5 5 max 5 20 15 15 10 10 5 max 5 25 20 15 15 10 10 10 10 10 max 10 30 25 20 20 15 15 10 10 10 max 10 35 30 25 25 20 20 15 15 10 max 10 40 30 25 25 20 20 15 15 10 max 10
Source: Minister of Trade and Industry Agriculture Indonesia was an agrarian economy. However, in the last thirty years, there was a significant structural change. Firstly, the manufacturing sector has gradually gained prominence in the economy, while the agricultural sector's share was reduced. Secondly, there was a transformation from a domestic oriented economy to a more open economy. Thirdly, the economy shifted from being a primary commodity exporter to become a manufacturing exporter. In the wake of economic development, the agricultural sector contributed less and less to national income, and was overtaken by the manufacturing sector. Anderson and Pangestu (1995) argued that the decline in the agricultural sector can be attributed to at least 3 factors: 1) demand elasticity for food is low compared to other commodities. 2) More rapid technological changes resulted in a higher yield/land. 3) The growth of use of intermediate inputs in the agricultural sector increased and resulted in lower valued added/farmer. Table 4 shows the decline in agriculture in contrast to manufacturing. The share of agriculture in the GDP declined from 37 percent in 1970 to 17 percent in the year 2000. On the other hand, manufacturing increased from about 8 percent in 1970 to 26 percent in the year 2000, 85 of which are non-oil and gas commodities.
Draft, not to be quoted 7

Table 4 Indonesia: Structural Shift
GDP by sector (in percent) 1970 1981 1990 1995 1996 1997 1998 1999 2000 Agriculture 36.6 23.4 20.1 16.1 15.4 14.9 16.9 17.2 16.7 Mining and Quarrying 20.1 17.2 10.5 9.3 9.1 8.9 10.0 9.6 9.4 Manufacturing Industry 7.8 14.0 20.5 23.9 24.7 24.8 25.3 26.1 26.4 Electricity, Gas & Clean Water 0.3 1.0 0.9 1.1 1.2 1.3 1.5 1.6 1.7 Construction 2.8 5.9 6.0 7.6 8.0 8.2 6.0 5.9 6.0 Trade, Hotel & Restaurant 14.9 15.0 16.7 16.7 16.8 17.0 16.0 15.9 16.0 Transportation & Communication 3.5 6.1 6.6 7.1 7.2 7.3 7.2 7.1 7.4 Fin., Leasing & Business Services 3.6 6.5 7.8 8.9 8.8 8.9 7.5 6.9 6.9 Services 10.4 11.0 10.9 9.2 8.8 8.8 9.7 9.8 9.6 Source: Central Board of Statistics The second structural change was a shift from a less open economy to a more open one, which is clearly shown in Figure 2.1. In 1970, trade, defined as exports plus imports, accounted for about 40 percent of GDP. In the 1980s, trade, on average, accounted for about 50 percent of GDP. Before the crisis, it increased to 52 percent (on average). In 1998, it peaked at 71 percent of GDP. Although, exports had the potential to boost during the crisis, it was restrained by export financing problem during the crisis, due to the collapse of the banking system. Otherwise, export sectors would have benefited greatly from the huge depreciation of the Rupiah.
Figure 1 Trade (% GDP), 1970-2001
-1020304050607080
1970
1973
1976
1979
1982
1985
1988
1991
1994
1997
2000
Trade (%GDP) Exports (%GDP) Imports (% GDP)
%
Note. Trade is defined as exports plus imports Source: Central Board of Statistics
In the 1990s, exports clearly played a greater role. Back in the 1970s, apart from oil and gas, Indonesian major export commodities in the 1970s were agricultural crops. However, since the 1980s, manufactured commodities led Indonesian non-oil and gas exports. The share of agricultural crops in total exports declined from 35 percent in 1970 to about 6 percent in 1999, while the share of manufacturing commodities increased from 17 percent to 68 percent in 1999. In the year 2001, the share of agriculture commodities declined further to about 4.4 percent of total
Draft, not to be quoted 8

exports, while the share of manufacturing commodities was almost the same, as of 1999.
Table 5 Export composition (percent)
Commodities 1970 1981 1990 1999 Agric. Crops 35.23 6.51 8.11 5.96 Manufactures 17.52 10.32 46.26 68.49 Minerals (excluding oil and gas) 0.00 0.81 2.48 5.40 Oil and gas 40.28 82.11 43.12 20.12 Others 6.98 0.25 0.02 0.03 TOTAL 100 100.00 100.00 100.00
Source: Central Board of Statistics Although agriculture contributes decreasingly to GDP in recent years, its contribution to employment is still large. In 1990, employment absorbed by this sector accounted for about 56 percent, compared with the manufacturing sector’s 10 percent. Employment absorbed by the agriculture sector declined to about 41 percent in 1997 compared to 13 percent in the manufacturing. During the crisis, agriculture became a safeguard: it absorbed labor retrenched from other sectors seriously hit by the crisis and boosted export. But, the export boom did not last long. Employment in the agriculture sector increased to 45 percent compared to the manufacturing sector’s 11 percent.
Figure 2 Agricultural exports 1996-2001 (millions of US$)
0
1,000
2,000
3,000
4,000
1996 1997 1998 1999 2000 2001
US$millions
Source: Central Board of Statistics
In agriculture, Indonesia is both an exporting and importing country. Indonesia’s leading exports are among others fish, coffee, tea, cocoa, spices, crude rubber, fruit and vegetables. Table 6 shows leading agricultural exports. In the world market, Indonesia is relatively a small player, be it as an exporter or an importer, except for few commodities such as coffee, natural rubber and certain fish products (in export market), rice, wheat and wheat flour, sugar and milk powder (in import market). Consequently, Indonesia would not be able to influence world prices of almost all agricultural products. Indonesia's position in the multilateral negotiation with respect to this sector is generally relatively weak compared to other countries in the region.
Draft, not to be quoted 9

Table 6 Indonesia’s leading agriculture exports (in US$ millions)
HS code Descriptions 1975 1980 1990 1996 1997 1998 1999 200003 Fish & fish preparations 83 211 971 1,677 1,619 1,614 1,526 1,583 07 Coffee, tea, cocoa, spices 186 876 840 1,276 1,285 1,517 1,289 1,111 23 Crude rubber 361 1,174 855 1,923 1,501 1,110 862 912 24 Wood, lumber & cork 502 1,816 279 326 279 197 309 379 05 Fruit & vegetables 27 59 248 370 245 201 374 301 12 Tobacco & tobacco BFD 36 60 125 219 246 254 212 221 08 Feeding stuff for animals 43 104 93 207 141 112 88 93 21 Hides, skins & fur skins 10 21 1 0 2 4 4 2
TOTAL EXPORT 7,103 21,909 25,675 49,815 53,444 48,848 48,665 62,124 Source. Central Board of Statistics Indonesia’s Uruguay Round Agriculture Commitments Indonesia's commitments for agricultural trade liberalization in terms of market access are to bind majority of tariffs at a ceiling rate of 40 percent, to reduce tariff by an overall 24 percent (and by 10 percent by line item) over a 10-year period and convert NTBs to tariffs and subject them to tariff reduction. As a result, the large majority of tariffs on agricultural items (1014 items) would settle at a bound tariff rate of 40 percent; several items (300 or 22 percent of total agricultural items) would be bound at rates higher than 40 percent; following the required reduction, few items (27 in total) would be bound at rates lower than 40 percent. Indonesia also guaranteed access through tariff quotas for: milk and cream (quota of 414,700 tons of fresh milk with an import quota
tariff of 40 percent) rice (quota of 70,000 tons with an import quota tariff rate of 90 percent),
exceeding which an import duty of 160 percent would apply. In terms of domestic support, Indonesia did not commit itself to any reduction in domestic support measures except for milk products. All existing measures of domestic support are submitted under the ‘Green Box’, which means exemption from reduction commitments. The buffer stock operation under BULOG, which meant to stabilize food prices and encourage adequate food supply, is exempted from liberalization as long as the particular commodity does not exceed the ‘de minimis’ rule of 10 percent of domestic consumption. In terms of export subsidies, rice is the only commodity to benefit from export subsidies. It is likely that the coverage of export subsidies would not increase in the future, as the Agreement on Agriculture prohibits countries to introduce new exports subsidies. In terms of special safeguard, Indonesia applied the Special Safeguard provisions in the Agreement on Agriculture for milk and cream, buttermilk, milk fat and cloves.
Draft, not to be quoted 10

How is the progress in the post-Uruguay Round period? In terms of tariffs, 98 percent of Indonesian tariff lines in agriculture items (HS Chapter 1-24) are already below the bound tariff rates4, as shown in Table 8.
Table 8 Indonesia: The 1996 MFN rates of Agriculture Commodities
Tariff Rate
Number of Tariff Lines
Percent
0 115 11.1 5 241 23.2
10 66 6.4 15 174 16.7 20 242 23.3 25 175 16.8 30 2 0.2 40 1 0.1 90 3 0.3
170 20 1.9 Agriculture items of HS 1-24 1039 100.0
Source. APEC database Agricultural Case Studies Natural rubber and fish products are among Indonesian leading agriculture exports. In 1999, exports of natural rubber accounted about 21.6 percent of Indonesian agriculture exports, while exports of fishery commodities accounted about 38.3 percent. Natural rubber was a traditional export commodity, whose contribution to agriculture exports declined overtime, from as high as 31.9 percent in 1975 to 21.6 percent in 1999. While fishery’s contribution to total exports increased from as little as 7.4 percent in 1975 to as much as 38.3 percent in 1999. Natural Rubber Production Natural rubber is one of Indonesia’s traditional export commodities, as the second largest producer after Thailand. Production of natural rubber peaked at 1.7 million tons in 1999. In the year 2001, total production of Indonesia declined slightly to 1.5 million tons, coming from 3.2 million hectares plantation areas, mainly in the islands of Sumatra (about 70 percent).
4 Notes that the coverage of Agreement on Agriculture covers HS 1-24 plus several other items.
Draft, not to be quoted 11

Table 9 Natural Rubber production
small estates share state estates share private share TOTAL
1990 913,425 72 216,702 17 145,168 11 1,275,295 1991 971,388 73 200,683 15 156,101 12 1,328,172 1992 1,030,380 74 205,396 15 162,672 12 1,398,448 1993 1,102,006 75 207,425 14 166,007 11 1,475,438 1994 1,138,099 76 188,122 13 172,409 12 1,498,630 1995 1,191,143 76 199,943 13 182,217 12 1,573,303 1996 1,193,146 76 202,021 13 178,859 11 1,574,026 1997 1,175,000 74 188,000 12 190,000 12 1,577,900 1998 1,243,000 75 192,000 12 227,000 14 1,662,000 1999 1,295,000 76 196,000 11 224,000 13 1,715,000 2000* 1,165,000 78 na na 1,501,000 2001* 1,219,000 79 na na 1,543,000 Source. Directorate General of Estate, Department of Forestry and Estate Crops, 2001 Small estates dominate this sector accounting for about 76 percent of total production, while state-owned plantation produce about 11 percent of total production and private owned plantation produce another 13 percent. In the period of 1990s, production grew at 3 percent per annum. The plantation area grew at 1.7 percent per annum, with small estates covered about 84 percent of natural rubber productive areas. Plantation areas were scattered along Sumatra and Java islands, with an uneven transportation infrastructure. Generally, rubber trees have been grown based on traditional best practices. The harvesting techniques are relatively simple, and farmers hardly pay much attention on the quality of their harvest. Booth (1988) showed that productivity of the sector, measured by yield per worker, in Indonesia is far less than in Malaysia. While in Malaysia rubber yields for smallholder plantations were about 756kg/planted hectare, in Indonesia it was about 331 kg per planted hectare. A recent interview with the rubber producers has indicate that the level of productivity has not changed much, although the respective government institution has provided assistance for a long time.
Table 10 Plantation Area (000 hectares)
Small-estates State-estates Private-estates TOTAL area share area Share area share 1996 2,978 85 246 7 294 8 3,518 1997 2,957 85 227 7 290 8 3,474 1998 3,082 85 230 6 295 8 3,607 1999 2,856 84 234 7 297 9 3,387 2000* 2,823 84 na na 3,372
Source. Directorate General of Estate, Department of Forestry and Estate Crops, 2001
Draft, not to be quoted 12

Exports The development of rubber plantation was driven by foreign market demand. Currently, the export share in total rubber production was about 80 percent, with the United States as the major export destination. In the year 2001, foreign exchange earnings from this sector reached US$ 786.6 million (2 percent of total non-oil and gas export earning of the same period). In terms of volume, total exports reached 1.45 million tons. Indonesia’s biggest export was TSNR (technically specified natural rubber) category (HS 400122), with a market share of about 50 percent, while exports in other categories were relatively small compared to other exporting countries as indicated in Table 2.11.
Table 11 Indonesia rubber exports and its share in the world market, 2001
Hs Code Description Value Volume Relative to world market
( US$M) (ton) Rank Share (%)
400110 Natural rubber latex, whether or not pre-vulcanized 7.2 10,375 7 2 400121 Natural rubber in other forms: smoked sheets 19.9 32,676 3 3 400122 Technically specified natural rubber (TSNR) 750.2 1,404,353 1 50 400129 Others 8.9 5,979 9 1
400130 Balata, gutta-percha,guayule, chicle and similar nat rubbers 0.4 311 8 4
Total 786.6 1,453,694 Source: ITC calculations based on COMTRADE statistics The main exports destination of smoke-sheets rubber were the US (36 percent), Japan (10 percent), China (9 percent) and Singapore (6 percent). While South Korea, Germany, Canada and Belgium accounted for about 4 % each of them. In the last 4 years, exports declined significantly, apart from rubber classified as HS 400129 (which represents a small portion of total natural rubber exports), as shown in Table 14. It is partly explained by the declining world price, which characterized the 1990s. Another reason for the decline in exports is the weakening export market due to global economic downturn.
Table 12 Exports trend 1997-2001
Hs Code Description Growth p.a Value Volume 400110 Natural rubber latex, whether or not pre-vulcanized -28 -19 400121 Natural rubber in other forms: smoked sheets -22 -11 400122 Technically specified natural rubber (TSNR) -14 -1 400129 Others 162 134 400130 Balata, gutta-percha,guayule, chicle and similar nat rubbers -51 -60 Source: ITC calculations based on COMTRADE statistics
Draft, not to be quoted 13

Fishery Products Production The fishery sector share in Indonesia’s GDP is quite low compared to estate crops. However, its share in GDP is increasing over time, from 1.6 percent in 1994 to 1.9 percent in 1998, indicating a significantly high growth. In the period 1994-1998, this sector grew at 3.6 percent per annum, while in the period 1998-1999, it grew at 9.5 percent per annum. In the year 2000, total production of the fishery sector accounted about 5.33 million tons, a 33 percent increase compared to 1994. Marine capture dominated this sector, with a 70 percent share of total fishery sector production. In the year 2000, total marine capture reached 4.36 million tons, a 28 percent increase from 1994. This is still much below Indonesia’s potentials. Indonesia, the biggest archipelago country in the world, consist of 17,508 big and small islands, which means hundreds of bays, seas and straits, and has coastal line of 81,000 km, the second longest after Canada. In total, Indonesia has a marine water area of 5.8 million km2, 3.1 million km2 of which is territorial water and 2.7 million km2 is Exclusive Economic Zone (EEZ). Most of Indonesia water area is still much below Maximum Sustainable Yield (MSY) level. Aquaculture contributes about 18 percent of total production. In the year 2000, total aquaculture production reached 1 million tons, a 62 percent increase from 1994. Apart from increasing land used for aquaculture, the increase in aquaculture production was also a result of a more intensified farming. However, this is much lower than Indonesia’s potential and there are still some big investors interested in aquaculture. Much of aquaculture players small scale and domestic-oriented so that most of them are not exposed to modern technology of farm-fishery and lacking of marketing capacity and channels.
Table13 Production (million ton)
1994 1995 1996 1997 1998 1999* 2000** TOTAL (million ton) 4.01 4.26 4.45 3.92 4.64 5.12 5.33 Capture (%) 85 85 84 83 86 82 82 Marine (%) 77 77 76 80 76 76 Others (%) 8 8 8 6 6 6 Farming (%) 15 15 16 17 14 18 18 Marine (%) 5 6 Bracket-pond (%) 9 8 9 9 8 7 7
Freshwater pond (%) 3 4 4 4 4 3 3
Paddy-cum-fish (%) 2 2 2 2 2 2 2
Cage (%) 1 1 1 1 0 0 0 Source. Ministry of Marine and Fishery, 2002
Draft, not to be quoted 14

Exports It is important to note that the export performance we present here underestimates the true exports of fishery commodities, given the unrecorded exports resulting from illegal fishing. In the world market, Indonesia is the biggest exporter of tuna and crabs with a market share of 24 percent and 22 percent, respectively. Those two commodities were only about 15 percent of Indonesia’s total fishery exports. The largest Indonesian exports were shrimp and prawns, which constituted 60 percent of Indonesia’s fishery exports in 2001. The main export destinations were Japan (62 percent), the US (15 percent, UK (4 percent) and Netherlands (4 percent). In the world market, Indonesia’s exports share of these two commodities was only 10 percent, Indonesia being the second largest exporter. In the period 1997-2001, Indonesia’s primary fishery exports, shrimps and prawns showed a small positive growth, of 1 percent per annum. A number of other leading fishery commodities, such as crabs, tuna and fish fillet, showed high positive growth. Crabs (HS 30624) even showed 82 percent growth per annum. On the demand side, the world demand for fishery commodities continued to increase. In the period 1997-2001, world imports of fishery commodities grew by 3 percent on average, while demand for tuna and crabs showed a relatively higher growth of 8 percent and 5 percent respectively. However, the recent declining trend (2000-2001) exports revenue, including those of shrimps and tuna, should cause Indonesia to be on alert to arrest this trend.
Table 14 Main fish products exports, 2001
Indonesia's Exports
HS rev. 0 Products
Value (000 US$)
Share in Indo's fishery exports
Growth 1997-2001,
% p.a
30613 Shrimps and prawns, frozen, in shell or not, incl boiled in shell 879,318 61 1
30232 Tuna,yellowfin, fresh/chilled, excl. heading No 03.04,livers& roes 66,950 5 26
30624 Crabs, not frozen, in shell or not, including boiled in shell 63,657 4 82
30420 Fish fillets frozen 58,309 4 19
30269 Fish nes, fresh or chilled excl heading No 03.04, livers and roes 30,871 2 -20
30569 Fish nes, salted and in brine, but not dried or smoked 24,242 2 9
30239 Tunas nes,fresh or chilled,excl. heading No 03.04,livers and roes 23,490 2 -5
30559 Fish nes, dried, whether or not salted but not smoked 22,723 2 -3
Draft, not to be quoted 15

Table 15 Declining growth: an Early Warning
HS rev. 0 Product Value (US$000)
Annual growth in value between 2000-2001, %
30613 Shrimps and prawns, frozen, in shell or not, including boiled in shell 879,318 -6
30232 Tunas,yellowfin,fresh or chilled,excl heading No 03.04,livers and roes 66,950 -10
30624 Crabs, not frozen, in shell or not, including boiled in shell 63,657 32
30420 Fish fillets frozen 58,309 33
30269 Fish nes, fresh or chilled excl heading No 03.04, livers and roes 30,871 -25
30569 Fish nes, salted and in brine, but not dried or smoked 24,242 70
30239 Tunas nes,fresh or chilled,excluding heading No 03.04,livers and roes 23,490 -18
30559 Fish nes, dried, whether or not salted but not smoked 22,723 -21
30342 Tunas, yellowfin, frozen excluding heading No 03.04, livers and roes 22,215 92
Trade Liberalization Measures As mentioned in the earlier section, Indonesia undertook a series of deregulations measures since the mid 1980s. Most of deregulation measures are aimed at improving country’s export performance. Trade liberalization was undertaken in the form of tariff reduction, elimination of NTBs, improved administration of remaining NTBs and customs procedures. Deregulation of foreign investment allowed 100 percent foreign ownership and opened up the previously closed sectors including ports and shipping. Before Indonesia undertook substantial trade liberalization measures, the average tariff rate was 27 percent. After the 1990 deregulation package, it fell substantially, reaching 15 percent in 1995. Processed fish, which was among those with high protection with a nominal rate of protection (NRP) of 21 percent in 1994 and an effective protection over 600 percent, was granted zero percent tariff, together with fish and shrimp meals, in June 1994 (Pangestu and Stephenson, 1995). Post-Liberalization Impact The BOP data clearly show that both exports and imports of goods increased significantly from 1985 to 1997, prior the economic crisis. Reforms that were specifically targeted to promote exports, as well as the sound macroeconomic management produced the export boom. Exports increased from US$ 19 billion in 1988 to more than US$ 56 billion in 1997 before it declined recently due to economic crisis. Similarly, imports had jumped from around $14 billion in 1988 to more than US$ 46 billion in 1997.
Draft, not to be quoted 16

Exports of natural rubber and fishery sector also showed consistent improvements in the post-liberalization period, although at a declining rate in the later period. We will discuss the declining growth rate of these sectors in the next section.
Figure 3 Export of Natural Rubber and Fishery commodities
Source. Central Board of Statistics, Exports
pediments to trade
donesia rubber exports faced relatively low trade barriers in its major export ’s
iff
lthough, trade barriers were relatively low, Indonesia’s exports of natural rubber
recent times, world supply of natural rubber increased resulting in over-tries,
0
500
1,000
1,500
2,000
2,500
1975
1976
1977
1978
1979
1980
1981
1982
1983
1984
1985
1986
1987
1988
1989
1990
1991
1992
1993
1994
1995
1996
23 Crude rubber
03 Fish & fish preparations
US$m
Im Indestination. Japan and the US, together accounted about 65 percent of Indonesianatural rubber exports, apply zero tariff barriers, while China, accounting for about 5 percent of total Indonesia rubber exports, imposes a relatively high tarof 40 percent, as in Table 2.16. The accession of China into WTO resulted in a lowering of tariff and non-tariff barriers. Currently, it applies a tariff of 8-12 percent on natural rubber, with an increased quota. Adeclined over time due to increasing competition in recent times, especially from the big new comer Vietnam, which has successfully penetrated into the markets ofChina and France. Insupplies, which push the price of natural rubber down. Three ASEAN counIndonesia, Thailand and Malaysia, once attempted to established cooperation to stabilize rubber price. However, this effort has failed to meet expectations. The question, whether there’s room for cooperation to promote exports of ASEAN countries remains.
Draft, not to be quoted 17

Table 16 Tariff and Non-tariff Barriers on Natural Rubber
HS Code Tariff rate Other Restrictions
HS Code
Tariff rate Other Restrictions
MFN MFN United States Singapore 400110 Free Free 400110 Free 400121 Free Free 400121 Free 400122 Free Free 400122 Free 400129 Free Free 400129 Free 400130 Free Free 400130 Free Japan South Korea
400110 Free Free 400110 1 Preferential treatments
400121 Free Free 400121 1 Preferential treatments
400122 Free Free 400122 1 Preferential treatments
400129 Free Free 400129 1 Preferential treatments
400130 Free Free 400130 Preferential treatments
China Canada 400110 40 400110 Free 400121 40 400121 Free 400122 40 400122 Free 400129 40 400129 Free 400130 40 400130 Free Source. APEC tariff database Shrimp and prawn exports faced zero percent tariff, but there are a few non-tariff measures still in place in Japan and the US. In the European markets, these exports face 12 percent tariff on average tariff and strict Sanitary and Phytosanitary (SPS) requirements. Exporters often got their exports returned, as they did not pass SPS control when entering the European market.
Table 17 Tariff and NTBs on Indonesian Fishery Exports
Countries MFN tariff Non-tariff measures or product description Japan 0% Labelling requirements
United States 0%
The importation of food is governed by the provisions of the Federal Food, Drug and Cosmetic Act administrated by the FDA. That Act prohibits the importation of articles that are adulterated or misbranded, including products thatare defective, unsafe, filthy or produced under unsanitary conditions. Imported products regulated by the FDA are subject to inspection at the time of entry
United Kingdom 12% - on average SPS inspection
The Netherlands 12% - on average SPS inspection
Source: National data reported to UNCTAD (TRAINS)
Draft, not to be quoted 18

The fishery sector also has some problems domestically. Firstly, productivity is low. Traditional fishermen, who are equipped with traditional fishing equipments, dominate Indonesia’s fishery sector. Seventy percent of them did not graduate from elementary school which makes transfer of modern technology extremely difficult. Secondly, there are imbalances of stock of fish across the nation. Highly populated islands are nearly over fished, while low/inhabitant ones are unexploited. Thirdly, some areas are already exposed to changes in the ecosystem. Similar to fishing activities, aquaculture is also characterized by low productivity as a result of low technology of fish breeding and post-harvest activities, high competition for land, and declining water quality. By comparisons, Thailand, whose volume of production is low, exports much more than Indonesia. Last, but certainly not the least problematic one for Indonesian government, is illegal fishing. Labor Indonesia's Policies Towards Labour Rights and Standards During the New Order, Indonesia has pursued an employment policy, which is very much in line with the arguments presented in the previous section. Policies relied heavily on the market mechanism, allowing for the expansion of labor-intensive manufacturing sectors based on cheap wage costs provided by flexible labor market conditions. Consequently, the government did not have a strong record on prioritizing labor rights for a long time. But the era of political reforms brought significant changes in this respect. A look at Table 18 reveals that Indonesia has ratified most important ILO conventions after the fall of Suharto’s New Order regime in May 1998.
Table 18 ILO Conventions Ratified by Indonesia
ILO Fundamental Human Rights Conventions Indonesian Law 1.Convention No.29 on Forced Labor Ratified by Government of Netherlands in 1933 2.Convention No.98 concerning the Application of the Principles of the Rights to Organize and Bargain Collectively
Ratified by Indonesia through Act No.18 in 1956
3.Convention No.100 concerning Equal Remuneration for Men and Women Workers for Work of equal Value -
Ratified by Act No. 80 in 1957
4.Convention No.87 concerning Freedom of Association and Protection of Rights to Organize
Ratified by Presidential Decree No.83 in 1998
5. Convention No. 19 concerning the Abolition of Forced Labor
Ratified by Act No.19 in 1999
6.Convention No.138 concerning Minimum Age for Admission to Employment
Ratified by Act No. 20 in 1999
7.Convention No. 111 concerning Discrimination Respect of Employment and Occupation
Ratified by Act No.21 in 1999
8. Convention No.182 concerning the Prohibition Immediate Action for the Elimination of the Worst forms of Child Labor
Ratified by Act No.1 in 2000
Source: ILO Labour market trends
Draft, not to be quoted 19

Table 19 shows the employment story of the New Order regime. The employment situation experienced a dramatic change during the period of non-oil export boom (1986-1997). Two trends can be detected. First, the labor market transformation followed a move of labor from agriculture to non-agricultural sectors. Manufacturing employment growth tripled from an annual average growth of 3.3 percent in 1980-86 to 9.1 percent in 1986-97. The growth of labor - intensive export-oriented industries, particularly in textiles, footwear, clothing wood products and furniture, was a major factor in contributing to overall economic growth. Agricultural employment fell in absolute terms during the same period. Second, in terms of employment, the Indonesian economy has been rapidly urbanized in recent years. Since the mid-1980s, growth of employment in urban areas has outpaced that of rural areas. Third, the formal sector's share in the economy has increased. In terms of employment, for instance, the formal sector as a whole expanded from 26 percent in 1986 to 37 percent in 1997 (Aswicahyono, Atje and Feridhanusetyawan 1999). The economic crisis brought about a reversal of several trends. The agricultural sector, which shrank during the non- oil export boom period, expanded by almost 10 percent during the crisis. On the other hand, all other sectors including manufacturing, which had previously expanded, shrank. The growth rate decreased sharply from 9 percent to minus 11 percent (Aswicahyono, Atje and Feridhanusetyawan 1999). The economy‘s formalization process also stopped. Formal sector employment (both in rural and urban sectors) dropped from 31.74 million in 1997 to 30.33 million in 1998.
Draft, not to be quoted 20

Table 19 Sectoral share and rate of growth in employment by sector
Sector Labor force in million
Annual growth rate in %
and sectoral % of total
1971 1980 1986 1997 1998 1971-80 1980-86 1986-97 1997-98
Agriculture 26.5 28.8 37.6 35.9 39.4 1.0 5.1 -0.4 9.9 64 56 55 41 45 Manufacturing 2.7 4.7 5.6 11.2 9.9 4.2 3.3 9.1 -11.4 7 9 8 13 11 Trade 4.3 6.7 9.8 17.2 16.8 6.3 7.7 7.0 -2.4 10 13 14 20 19 Services 5.2 7.1 10.2 17.4 17.2 4.3 6.7 6.7 -1.5 13 14 15 20 20 Other 2.7 4.2 5.2 5.4 4.3 6.4 3.8 0.3 -19.0 7 8 8 6 5
Urban 6.1 9.7 13.5 29.6 30.3 6.7 6.4 10.9 2.4 15 19 20 34 35 Rural 35.2 41.8 54.7 57.5 57.4 2.1 5.1 0.5 -0.2 85 81 80 66 65
Wage workers 13.3 14.5 17.5 30.5 28.8 1.1 3.4 6.7 -5.5 32 28 26 35 33 Non-wage 28.0 37.0 50.7 56.6 58.9 3.6 6.2 1.1 4.0 68 72 74 65 67
All 41.3 51.5 68.2 87.1 87.7 2.8 5.4 2.5 0.7
Minimum wages and labour relations The New Order government under Soeharto clearly prioritized economic growth and political stability. This required the political control of the labor force. The trade union was tightly controlled with the state regulating industrial relations through a system of arbitration and conciliation. Restrictions put on union activities had positive impacts on the flexibility of labor markets for a long period. In the 1990s, when signs of labor market tightening emerged, the government increasingly resorted to interventionist measures mainly using minimum wage policies (Feridhanusetyawan 1999). Minimum wages were introduced in the early 1970s, but the implementation was poor during the early period of economic development. In the 1980s, minimum wages remained rather a symbolic gesture than a reality (Feridhanusetyawan 1999). In the 1990s, the situation changed significantly. Despite the liberalization of the Indonesian economy, the government raised minimum wages by more than three times before the crisis in 1997. From 1988 to 1994, minimum wages increased by around 15 percent annually. After 1992, minimum wages increased by 20 percent annually, and exceeded labor productivity growth.
Draft, not to be quoted 21

The impact of the minimum wage on the labor market is considered to be minimal during the New Order. Two reasons account for this judgement. First, up until 1994, the minimum wage was not binding. Generally, minimum wages were set 50 - 60 percent below the market wage. However, after 1994, the increase in minimum wage was sufficient to be at par with the average wages in the lower wage industries and exceeded average wages among younger, less educated female workers (Manning and Sisira 1996). Second, enforcement of the minimum wage standards was poor, especially in the small and medium scale enterprises (Feridhanusetyawan 1999). Low compliance with the regulations was widespread outside Jakarta. Minimum wages were mainly enforced in large firms in Jakarta. In addition, most were willing to work for less than the prescribed minimum wage. Legislation on working hours, rest period, annual pay leave, maternity leave for women were also seldom enforced (Feridhanusetyawan 1999). Industrial relations were characterized by two policies. On the one hand, the government controlled the only allowed trade union, the SPSI (Serikat Pekerja Seluruh Indonesia, the All Indonesian Workers Union). On the other hand, the government used collective bargaining as the principal tool to set labor standards and to resolve labor disputes. The ineffective labor representation through the SPSI was clearly felt during the process of labor market tightening in the early 1990s.5 Rapid growth of the formal sector, especially of low skilled employment, increased workers’ bargaining power, at least in economic terms. As result, there was an increased demand for a more effective labor representation and better implementation of labor laws. While the labor market transformed from a labor-surplus to a labor-scarce economy during the booming periods in the early 1990s, the labor relations also transformed from the traditional system dominated by informal rules to a more modern system characterized by workers representation and negotiations. Some NGOs and labor activists set up several independent labor unions in the early 1990s. Because of the strong domestic and international pressures, the government did not ban these independent labor unions, but they were not recognized and their leaders were harassed. Since 1997, the economic crisis and the ensuing political reform process has changed labor policies significantly. Now workers have the right to organize independent labor unions. A new manpower bill, which sets new and controversial rules on labor union formations and activities, was passed by the parliament in September 1997. However, the newly gained political rights for labor went hand in hand with the adverse impacts of the economic crisis. The return to a labor-surplus economy means that the economic bargaining power of workers has decreased. So far, the increasing number of strikes proved to be not very effective, as replacement workers willing to work for lower than minimum wage rates are now easily found. Moreover, the newly gained political bargaining power of the labor movement can dramatically decrease Indonesia's competitiveness, especially in the manufacturing sector. For instance, some economists argue that the formal rule on
5 This section closely follows Feridhanusetyawan (1999).
Draft, not to be quoted 22

workers' dismissal is very restrictive and heavily leaning towards workers. Regulations discourage the dismissal of workers and make hiring decisions in the formal sector practically irreversible. Formal contracts, unless established for a fixed term, are regarded as permanent. Edwards (1996) argues that the flexibility of the system could be improved by allowing the termination of contracts by unilateral decision of workers or employers, and made possible by establishing a minimum compensation for dismissals. International pressure and domestic policy response: The Case of Child Labour Child labor is arguably the core issue for proponents of linking trade with social clause. In fact, it lies at the heart of the whole debate. Official policies during the New Order regime have always rejected an abolitionist6 approach to child labor. There was a broad consensus among the government bureaucracy, and even among the activists, that child labor cannot be eliminated within the foreseeable future (Bessell 1999). Thus, for a long time the government resisted any pressure to ratify ILO Convention No.138 on minimum age. However, in the 1990s there was a noticeable shift in the official response. First, in 1992 the government of Indonesia signed a memorandum of understanding with the ILO recognizing the existence of child labor in Indonesia and agreed to undertake action for its elimination. Second, in 1996, a draft of the new industrial relations legislation prohibited the employment of children under the age of fifteen. Third, the sixth official five-year development plan extended the period of basic education from six to nine years. This should be implemented within fifteen years. Fourth, a workshop held by the Coordinating Ministry of People’s Welfare, the Department of Manpower and the ILO recommended the ratification of ILO Convention No.138 (Bessel 1999). Finally, in 1999 the ILO convention was ratified. To some extent, international pressure on Indonesia can explain this shift in official policies. For instance, in 1993, the United Nations Committee on the Rights of the Child, commented on the lack of clarity in Indonesia’s child labor legislation. It lamented the lack of protection for working children, the leniency of penalties and the lack of supervision by inspectors of the Department of Manpower. By far the most significant pressure, however, came from the United States. The US exerted pressure on Indonesia by threatening to abolish Indonesia’s trading privileges under the General System of Preferences (GSP), unless labor standards were improved (Pangestu 1996). Pressure on Indonesia remained high, as subsequent reports by the US Department of Labor reprimanded the country for using forced labor in the fishing industry and noted widespread employment of children in the tobacco industry (Bessel 1999). 6 The literature on child labour differs between three schools of thought: First, the ‘abolitionist’ school which says that child labour, defined as waged employment of children should be eliminated. Second, the ‘protectionist’ line argues that the total elimination of child labour is not realistic and not necessarily a preferable goal. Proponents of this school argue that child labour constitute a necessity, as long as structural conditions of poverty and inequality persist. Moreover, as long as it occurs in non-exploitative and non-dangerous circumstances, work may be beneficial to children, as it provides income, vocational and social skills. Lastly children do have a right to work. Third, a last school of thought argues vehemently against all forms of child labour and demands immediate elimination of child labour. These voices became very prominent in the 1990s. See Bessel (1999) for a discussion.
Draft, not to be quoted 23

The ILO has played a constructive role in Indonesia. Although it has adopted an abolitionist stance on child labor issues, it has shied away from using trade sanctions to achieve its objectives. Instead, since 1992 the ILO has provided technical assistance to three key Ministries: Manpower, Education and the Central Bureau of Statistics. The ILO has also fostered training and funding to a number of NGOs. Gradually, the weaknesses in the national legislation were analyzed and discussed in various workshops and conferences, which in the end led to the ratification of important ILO Conventions. The continued economic crisis renders the long–term objective to bring the children under the age of fifteen from the working place into the classroom rather difficult to achieve. Instead, the reality of increased economic hardship should make it imperative to refine the domestic legislation7 and to find approaches that supports and protects working children from exploitative conditions and provide them with non-formal education. But this is likely to depend on external and international finance. Recent policies clearly attempt to placate the international pressure to ban all forms of child labor, as the ratification of ILO No.182 Convention on the Elimination of the Worst Forms of Child Labor in 2000 shows. Protection of Indonesian migrant workers Government policies Indonesian Government has embarked on an overseas employment programme since 1970’s. This step was taken mainly to address the growing problem of unemployment and dwindling foreign currency reserves by establishing a government institution which would play an active role in promoting labor migration flows. This institution,AKAN (or Center for Overseas Employment), is under the Department of Manpower. Recently the AKAN has been decentralized and has been replaced by the Directorate of Overseas Labour. Indonesian women have been inclined to be employed in Western Asia, especially in Saudi Arabia, although a substantial number also go to Malaysia. In the 1980’s Hong Kong, Taiwan and Singapore have become major destinations for female migrant workers from Indonesia. According to the Minister of Manpower, 206,036 women Indonesian workers were employed in Saudi Arabia, while 155,399 are in Malaysia as of 2002.8 The Indonesian Government recognises the economic opportunities in exporting excess labour. When the employment situation in Indonesia is gloomy, labour migration is viewed as the solution to the deteriorating unemployment. 9 The flows of remittances also become a big resource of Indonesian foreign exchange. From this perspective it seems that although number of reported abuses grows, the
7 By refining and enforcing Article 96 of the 1997 manpower bill. This article attempts to regulate employment for children and states various occupations from which children are barred from undertaking on the ground of health and safety (Bessell 1999). 8 Kompas Daily, 23 December 2002 9 According to the Minister of Manpower the number of unemployed people in Indonesia reached 40 million people in 2002, including the category of 'under-employed' people.
Draft, not to be quoted 24

Government will continue sending worker overseas, given the severity of the domestic economic situation. In order to improve the migrant workers’ protection, the Government is now also drafting a bill on migrant workers protection. This bill was proposed by the House of Representatives specifically to establish a legal basis for the protection of Indonesian workers abroad, since the existing laws on labour protection and development does not provide such protection. The draft of the bill includes, among other things, a maximum protection for IDHs which extends from the recruitment process to the return at the end of the working period. It also regulates the placement of Indonesian officials abroad to be in charge of the Indonesian workers. Recruitment practices in Indonesia The recruitment of IDHs in Indonesia is plagued with deception, inhumane treatment and exorbitant recruitment fees charged by employment agencies. In 1999, for instance, reports in some Indonesian newspapers claimed that 2,213 domestic helpers were cheated by intermediaries, brokers or agents in a time span of only six months. In Indonesia there are currently 390 employment agencies (PJTKI) that are authorized to send workers abroad. The Labor Department issued in a new rule in 1989 that required each employment agency to deposit 50 million rupiah before sending a worker abroad. Anecdotal evidence suggests that the amount has increased to 250 million rupiah. This amount is required on top of the capital that the agency needs to recruit workers. The deposit is credited to the Labour Department’s account at the bank appointed by the department in order that the money be used as a safety net in case the worker faces problems overseas. The full amount should be refunded to the agency if no problems with the worker occur. However, it is unclear as to who gets the interest earned from the deposit, whether the agency would keep the interest, or if it should be kept in the account in case the agency is at fault. In order to find workers to send abroad, employment agencies hire brokers called Calo, PR or Perantara (an intermediary). The intermediaries go to the villages with overseas job offers for the (mostly) women workers. The average broker commission given by employment agencies is estimated at around 1 million Rupiah. Reports suggest that some brokers would also charge prospective women workers 400-700,000 Rupiah of non - refundable broker or agency fees before they receive training in Jakarta or Surabaya. Data from the Asian Migrant yearbook suggest that fees imposed on workers as compensation for recruitment and training seem excessively high. The amount levied is set by the Director General of Binapenta (advisory and service) (Asian Migrant Yearbook 2000).
Draft, not to be quoted 25

Table 20 Approximate breakdown of Indonesian labor agents' charges
Service Fees in Rupah Marketing expenses and transport costs 2,500,000 Recruitment fees 2,450,000 Training fees 6,000,000 Departure costs 1,250,000 Gross income of employment agency 4,850,000 Total 18,050,000 Source: Asian Migrant Yearbook 2000, p.158
Recent trends: Industrial relations and investment climate 10 Since 1997, the economic crisis and the ensuing political reform process has changed labour policies significantly. Now workers have the right to organize independent labour unions and they have asserted their rights more forcefully to improve their positions when facing employers. Currently, unions are in a process in which they have to define their new role as conflict-mediating institutions. Currently, more than 60 unions compete nationally to represent workers. In addition, there are 140 labour unions and some 11,000 enterprise–based unions. The fragmented labour movement makes it difficult to establish coherent wage–setting mechanisms, as unions are frequently divided amongst themselves. As a result, there is the perception that labour conflicts are on the rise, but this is not confirmed in the statistics. Conflicts – disputes, strikes, demonstrations – may have been more vocal in recent years, but overall, there are no more industrial actions or lost working hours than in the mid–1990s. In part, the surprising lack of evidence may be deteriorating statistics, but labour conflicts hardly seem rampant.
Table 21 Labour Conflicts, 1991 – 2002
Year No. of industrial
actions No. of workers
involved Lost working hours
1991 130 64,474 534,610 1993 185 103,490 966,931 1995 276 128,855 1,300,001 1997 161 100,440 875,512 1999 125 49,232 915,105 2000 273 126,045 1,281,242 2001 174 109,845 1,165,032 2002 (until April) 89 46,174 259,553 Source: Department of Manpower However, the rapid increase in minimum wages is undeniable. For instance, minimum wages for industrial workers was increased from 172,500 rupiah in 1997 to 591,000 IDR in 2002. The increase in minimum wages, combined with the recent appreciation of the IDR is seen to become a competitive threat. But Indonesia’s minimum wage is still below that of the Philippines and Thailand and
10 The following section draws heavily from the author's contribution to the World Bank's CGI Brief " Maintaining stability, deepening reforms ", January 2003.
Draft, not to be quoted 26

barely higher than that of Vietnam. Compared to GNP per capita (a rough indicator of productivity) Indonesia’s minimum wage does not seem out of line with its competitors, although Thailand is more competitive. Before the rapid rise in Indonesian minimum wages, value added per worker was 6 times the minimum wage, comparable to that of the Philippines, but much less competitive than Thailand’s 17 times (World Development Indicators 2002).
Table 22: Comparison of nominal minimum wages in major urban industrial centers in Asia, April
2002
Major industrial centers Minimum Wages $ per year
Minimum Wages $ per month
GNP per capita $ in 2001 *
Manila 1,793 149 939 Bangkok 1,128 94 1,797 Jakarta 755 63 669 Hanoi 692 58 395 Source: Chris Manning, PEG Project, Bappenas *Calculated based on CEIC data, Vietnam figure is GDP per capita for 2000 The rapid increase in minimum wages, the perception of rising labour conflicts and the resulting threat of reduced employment growth can be blamed on the absence of an efficient industrial relations system. Two factors account for this. First, an effective labour legislation is not in place yet. Second, a wage – setting mechanism needs time to develop in Indonesia, particularly within a new decentralized system of governance. Currently, the industrial relations system is governed by the manpower bill of 1997. It has been controversial since it was passed by the parliament and efforts have been made to amend the bill in the past years. Recently the government has proposed two new bills to the House of Representatives (DPR): one on Labour Protection and one on Labour Dispute Settlement. But both drafts have met with heavy resistance from unions and employers, resulting in the Parliament’s decision to postpone the passing of the bills for an indefinite period. Meanwhile, the Parliament also decided to annul the existing Law No.25/1997 on manpower in order to prevent it from becoming effective by October 1, 2002. Effectively, this means that Indonesia’s industrial relations system is now governed by outdated laws and regulations: the 1957 law on labor dispute settlement, the 1964 law on labor dismissal by private companies and the Ministerial Decree No. 150/2000 on dispute settlement (Jakarta Post, 24 and 25 September 2002). The stalemate between labour and business centres around several issues (see Table 23) Labour representatives deem the bills as hurting their basic rights. Specifically, they point to the regulation on strikes, which requires workers to notify the management prior to any strike actions. This, according to labour activists, limits the basic right to strike freely. In addition, they demand that employers pay striking workers, also in cases where the dispute has been delegated to an Industrial Relations Dispute Settlement Court.
Draft, not to be quoted 27

Employers, on the other side, complain that the bills are too forthcoming to workers’ demands. For example, they point to employers’ obligation not to replace striking workers and to reduce basic hours for nightshift workers from 40 to 35 hours a week. In addition, the bills put too much emphasis on criminal penalties for employers in cases where they do violate regulations, leaving them open to extortions by third parties. The continued impasse between labor and business results in the absence of clear rules for handling industrial relations and increases legal uncertainty for businesses. Indonesia needs an integrated approach to determine minimum wage increases. The government needs to find a way to balance the need to improve the position of lowest paid workers and minimizing the costs of minimum wages in terms of reduced employment or increased inflation. Decentralization has made the decision–making process to set minimum wages more complex. The central government is not responsible anymore, leaving it now to the provinces and districts to set the minimum wage levels. Provinces set the floor to wages and then districts decide on the level of the minimum wages within their jurisdictions. Currently, minimum wages differ between provinces and between districts. In several provinces, districts have set their wages above the existing floor, and minimum wages do also vary within industries in a given district. For example, only one minimum wage was set for Jakarta in 2001 and 2002, whereas minimum wages were set for every district in West Java. In West Java the floor provincial level is 280,000 rupiah/month in 2002. Industrialized districts like Bogor and Bekasi have set the minimum wage at 576,000 rupiah, double the floor. Jakarta has the highest minimum wage with 591,000 rupiah, followed by Papua with 530,000 rupiah and East Kalimantan with 500,000 rupiah. Economic factors such as proximity to regions with higher wages explain some of the differences. But political factors also play a role in determining wage levels, as many regional administrations and parliaments are not free from pressure to implement populist measures. An efficient industrial relations system also needs well-organized unions and a professional system collecting data on wage costs. After having been sidelined and suppressed under the New Order regime for a long time, workers and trade unions now fully assert their rights to improve their positions. But the current uncoordinated wage–setting mechanisms can have negative effects on wage negotiations, which need to be based on accurate data information on true living costs for workers. Currently, wages research councils adjust minimum wages to price changes in the minimum living needs (KHM – Kebutuhan Hidup Minimum).11 But KHM estimates, submitted both by unions and employers to the regional wage research council, differ widely from changes in the CPI (Consumer Price Index). In 2001, for instance, unions in West and East Java reported increases in KHM in the range of 30-70 percent, while CPI actually increased by 10 – 15 percent. Those differences frustrate the attempt to craft a balanced approach for determining minimum wages. Thus, a more professional and de-politicized system of collecting data and estimating changes in the KHM would be a good first step to establish an efficient wage – setting mechanism.
11 The following is based on a paper by Chris Manning (2002), “ Minimum Wage Policy: Is Indonesia going the Latin American Route?” BAPPENAS – PEG Working Paper, unpublished.
Draft, not to be quoted 28

Table 23
Contentious articles in the labour protection bill Article Issues Position of employers Position of Unions 76 Night working hours 40 hrs/week 35 hrs/week 81 Breastfeeding babies Against Agree 86 Government sets minimum wages Against Agree 91 Payment for sick workers Against Agree 134 Strikes
No replacement of striking workers Striking workers paid
Must be notified Against Against
At any time Agree Agree
150 Service payments for resigning workers
Against Agree
152 Conditions for dismissal Against Agree Source: Draft Bill on Settlement of Industrial Disputes, Draft Bill on Manpower Development and Protection; Jakarta Post, 31 July 2002 Environment Trade, environment and development in Indonesia For developing countries like Indonesia, the principle of common, but differentiated responsibilities is the key phrase in negotiating fair trade rules. Countries share a common responsibility for the global environment, but they have different capabilities to contribute to environmental protection measures. Therefore, Indonesia has a vital interest to pursue two objectives. First, to keep markets open for its exports, liberalize its own economy and thus insist on upholding the basic principles of the WTO regime. And second, as a commitment to Multilateral Environmental Agreements (MEAs), it has to uphold obligations to safeguard environmentally sustainable development. How did it fare on these two issues? Linkages between economic growth, trade liberalization and the environment One common way to assess the linkages between growth and the environment is the environmental Kuznets curve. It describes the correlation between income and pollution levels. Lower income levels are certainly associated with lower pollution intensity. With higher income growth, pollution levels increase, but with increased income levels efforts to clean up the environment also increase and pollution levels stabilize. Thus, a clean environment is assumed to be a 'luxury good' and environmental expenditures should increase in the wake of development. Higher growth is supposed to translate into better environmental management via various channels. First, as income goes up, population growth declines and additional pressure on the ecosystem decreases. Second, higher levels of education should be reflected in better and efficient resource management. Third, technological innovation is also supposed to be correlated with better environmental management, as costs for abatement decrease. Fourth, on an aggregate level, a deregulated open economy contributes to a diversification of
Draft, not to be quoted 29

product and export base and thus reduces the dependence on natural resources as the main source of income. While detailed studies do not exist for Indonesia, the record for the environmental Kuznets curve seems to be at best mixed. Lower income levels are certainly associated with low pollution levels. Higher growth certainly translated into higher incomes, better education, declining population growth, technology transfer and a more diversified economy.12 Table 4 in the first part of the paper showed that the composition of output has diversified and reduced the share of natural resources and agriculture. Prior to the crisis, non-oil export growth was carried by an increasing role of the manufacturing sector with textiles, garments and plywood leading the way. Before the crisis, Indonesia was on the verge of entering a period of expansion in pollution- and capital-intensive industries, such as petrochemical, basic metals and chemical products. Higher growth rates have also increased pollution levels, particularly in urban areas where there is a high increase in human and solid waste and air pollution caused by vehicle emissions (World Bank 1994). While the correlation between advanced economic development and increasing pollution intensity seems to be straightforward, equating higher income levels with increasing pollution mitigation efforts and thus a better quality of the environment is questionable. A World Bank study (2001) argues that public expenditures on environmental activities were already low in Indonesia before the crisis. Table 24 shows that in terms of per capita expenditure level, percentage of GDP and percentage of government expenditure, Indonesia fared badly compared to other Asian countries. Moreover, cuts in environmental expenditures were also deeper than in other countries, once the economic crisis hit the country.
Table 24 Environmental expenditures in Asian countries affected by the crisis
Country Year Per capita
(current prices, US $)
Percent of GDPPercent of
government expenditure
Total (constant
prices, 1997=1)Indonesia 1997 $0.36 0.030% 0.163% 1.00 1998 $0.08 0.017% 0.079% 0.47 Malaysia 1997 $0.67 0.015% 0.067% 1.00 1998 $0.53 0.016% 0.070% 1.06 Thailand 1997 $5.47 0.22% 1.19% 1.00 1998 $3.25 0.18% 0.98% 0.72 Korea 1997 $28.09 0.27% 1.560% 1.00 1998 $19.78 0.29% 1.380% 0.99 Source: World Bank 2001 FDI and environment 12 The literature on Indonesian economic development during the 30 years of New Order regime is wide and need not be discussed in detail here. See for instance Hill (1996).
Draft, not to be quoted 30

What is the role of trade liberalization and foreign direct investment in impacting on the environment? Most economists argue that the links between trade policies and environmental impacts are indirect. As open trade regimes have a positive impact on growth performance, the physical scale of economic activities also increases. Thus, pollution and resource degradation levels increase. In Indonesia, the high rates of foreign and domestic investment prior to the crisis have certainly created industrial areas with high rates of pollution. The expansion of manufacturing industries since the late 1980s has resulted in pollution disputes around the country, with the highly polluted Jabotabek region as the prominent example. Water pollution is perhaps the most acute environmental problem caused by industries. For instance, high pollution levels in 1990 caused health costs of more than US$ 1 billion in Jakarta alone (World Bank 1994). In particular, the rapid expansion of pulp and paper industries since the latter half of the 1980s has triggered widely publicized disputes (Japan Environment Council 2000). On the other side, there is also evidence that deregulation could actually bring about better resource management. First, prior to the financial crisis in 1997, high levels of protection in manufacturing have favored the export of raw or nearly raw materials, thus exacerbating the rate of non-renewable natural resource use. Further liberalization of the economy would have helped to spread foreign direct investment more broadly across non-natural-resource-based sectors (NRMP 1995). Second, deregulation policies have also brought more sophisticated technologies into the country. A survey among representatives from the textile, leather, refrigerator, wood and shrimp industries in 1996 suggested that an increasing number of multinational corporations applied constant levels of environmental standards in all of their global operations (CSIS 1996). Third, investment decisions seem not to be exclusively concerned with environmental factors, but more with labor costs (CSIS 1996). In addition, pollution abatement costs of industries in Indonesia seem to be relatively low, estimated by the World Bank to be in the range of between 3 and 5 percent of total investment costs (Low 1992). There is plenty of evidence that environmental problems are also a result of domestic policy failures and protectionist policies. Distorted price regimes such as subsidies for fuel and pesticides have for a long time prevented efficient resource use. The World Bank, in 1994, estimated that the elimination of pesticide subsidies – initiated by end of the 1980s – have brought savings of US$ 150 million per year and reduced agricultural pollution. Under the IMF’s structural adjustment program since 1997, Indonesia has committed itself to a series of reductions in subsidies, a move that could help increase efficiency. The biggest current environmental problem is the rapid degradation of forest resources. Indonesia's forests are disappearing at an alarming rate: current estimates suggest that between 1985 and 1997 1.8 million hectares per year have been deforested. At these rates, there is now a strong possibility that forests will cease to function as a viable resource base in the foreseeable future. For instance, dry lowland forests in Sumatra will cease to exist as economically viable production forests by 2005. Overall, the nationwide gross forest area is now
Draft, not to be quoted 31

estimated to be at 96 million ha, compared to a 120 million ha in 1985 (World Bank, 2001). Increased worldwide demand for Indonesia’s forest products have undoubtedly provided the stimulus for the rapid expansion of wood-based industries. But the rapid deforestation rate – especially in the 1990s and since the onset of the crisis in 1997 – have more to do with massive governance problems rather than liberalization per se. In the past three decades, state-led resource management has led to the deterioration of forest resources. Two policies were important. First, state policies and business interests colluded to rapidly expand domestic timber processing industries. This was achieved by restrictions on log exports and tax concessions to build up processing industries. Effectively logs were subsidized. The resulting over-capacity of plywood mills increased the industries’ demand for timber.13 In addition, ambitious plans to make Indonesia a major pulp and paper producer also increase the pressures on forests.14 Second, large-scale land conversion for commercial purposes, such as the development of oil palm plantations, were mainly responsible for accelerating deforestation in the 1990s. Land conversion was a significant factor in causing the forest fires in 1997-98, resulting in the destruction of 5 million ha of forest and an estimated economic loss of about US$ 8 billion to Indonesia.15 As a result of both policies, demand for wood vastly exceeds supply. Estimations suggest that demand is four times greater than what can be legally supplied. This gap is filled by illegal logging (UK Tropical Forest Management Program 1999). Incidence of illegal logging has increased dramatically since 1998. A contributing factor is that the current decentralization process has also encouraged newly empowered districts to use forests as short-term revenue earners. Head of forest–rich districts issue clear felling permits (IPKs) which cover concession areas of up to 100 ha. The issuance of those small-scale logging concessions is undermining the central government’s adoption of a moratorium on the conversion of natural forest. In addition, since 8 October 2001, the central government has declared a ban on log exports for a trial period of six months. Indonesia’s Policies Towards Integrating Trade and Multilateral Environmental Agreements Indonesia is a party to several major international multilateral environmental agreements (MEAs) and has implemented numerous aspects of these agreements through regulations and other government actions (see Table 25). In the following, some selected MEAs will be discussed.
13 Brown, David W. (1999), " Addicted to Rent " , DFID/ITFMP Report, 7 September 1999. 14 Barber, Charles Victor (1997). “ The Case Study of Indonesia.” Occasional Paper. Project on Environmental Scarcities, State Capacity, and Civil Violence. Cambridge: American Academy of Arts and Sciences and the University of Toronto. 15 World Bank (2001), pp.6-28
Draft, not to be quoted 32

Table 25 Indonesia's implementation of Multilateral Environmental Agreements
Multilateral Environmental Agreement Legal Instrument 1 United Nations Convention on Biological Diversity Law No. 5 / 1994 2 UNEP Convention on International Trade Endangered Species of Wild Fauna and Flora (CITES) Presidential Decree No.43 / 1978 3 United Nations Framework Convention on Climate Change Law no.6 / 1994 4 International Plant Protection Convention Presidential Decree No.2 / 1977 5 Convention of the High Sea Law No. 19 / 1961 6 Convention of the Prohibition of Development, Production Presidential Decree No.58 / 1991 and Stockpiling of Bactewriological and Toxic Weapons and on their Destruction 7 Convention Concerning the Protection of the World Cultural Presidential Decree No. 17 / 1989 and Natural Heritage 8 Convention of the Physical Protection of Nuclear Material Presidential Decree No. 49 / 1986 9 United Nations Convention on the Law of the Sea Presidential Decree No. 82 / 1993 10 Internationa Tropical Timber Agreement Presidential Decree no.4 / 1995 11 ASEAN Agreement on the Conservation of Namture and Natural Resources Presidential Decree No. 26 / 12 Conveention on Early Notification of a Nuclear Accident Presidential Decree No. 81 / 1993 13 Vienna Convention for the Protection of the Ozone Layer Presdential Decree No. 23 / 1992 and Montreal Protocol on Substances that Deplete Ozone Layer as adjusted and amended by the Second Meeting of the parties London 27-29 June 1990 14 Convention on the Prevention of pollution from Ships Presidential decree No.46 / 1986 15 Protocol of 1992 to Amend the International Convention on Presidential Decree No. 52 / 1999 Civii liability for opil pollution damage 1969 16 Basel Convention on the control of transboundary movements of hazardous waste and their disposal Presidential Decree No. 61 / 1993 17 Revocation of Presidential Decree no. 19 / 1978 on Presidential Decree No. 41/ No. 1998 Ratification of the International Convention on the Establishment of an International Fund for Compensation for Compensation of Oil Pollution Damages 1971 18 Convention of Wetlands of International Importance Presidential Decree No.48 / 1991 19 United Nations Convedntion to Combat Desertification Keppres No.135/1998 20 International Plant Protection Convention Presidential Decree No.2/1977 Source: Environment Impact Management Agency Multilateral Environmental Agreements Montreal Protocol The Montreal Protocol was signed in September 1987 and became effective in 1989. Its objective is to protect the ozone layer by controlling the production and consumption of ozone depleting substances (ODS). Indonesia ratified the Montreal Protocol by Presidential Decree No.23 , issued on May 1992 and then developed a National Strategy for Ozone Layer Protection and ODS – Phase Out in January 1993. The plan aimed at phasing out all ODS consumption and production in Indonesia by end of 1997. Overall, the industries affected most by the Protocol – refrigerators and air – conditioner producers – managed well to
Draft, not to be quoted 33
cope with increased production costs. A CSIS study (1996) found that cost increases amounting to 10-15 percent of total production costs did not impair production. There was good co-operation between the government and the private sector to follow a well-defined action plan. Policies included financial assistance such as tax exemptions from import duties for environment- friendly equipment, World Bank funding to firms, awareness campaigns and prohibition of imports of new technologies using or containing ODS. Regulations were enforced and closely monitored. The relatively successful implementation of the requirements of the Protocol can be explained by the structure of the market. There are only a limited number of producers in Indonesia and they are mainly multinational corporations with access to latest environment-friendly technologies. There was active collaboration with Indonesian joint ventures. In addition, most CFCs and ODS could be substituted relatively cheaply (CSIS 1996). Kyoto Protocol and Clean Development Mechanism The Kyoto Protocol commits the industrialized countries (listed in Annex B of the Protocol) to reducing their collective greenhouse gas (GHG) emissions to about 5 percent below 1the 990 levels during the period between 2008 and 2012 on average. The protocol was ratified in Bonn in 2001. Generally, it is viewed only as a symbolic first step towards a more effective framework to combat climate change. It is generally regarded as a ‘toothless’ agreement, since the United States as the biggest net contributor to GHG emissions did not sign the treaty. Nevertheless, Indonesia has a vital interest to participate in any effort to combat climate change. As a country with one of the world’s longest coastlines, it can expect significant damages, if sea levels rise. Further negative effects could arise for the agricultural sector in the form of changing and prolonged drought and flood patterns. The severity of the El Nino and La Nina phenomena at the end of 1997 and early 1998 were a first foretaste for worse things to come. Indonesia is a party to the Kyoto Protocol, but has not yet put any commitments into domestic legislation. The Kyoto Protocol has exempted developing countries from any commitments to reduce their emissions to a quantified ceiling, but are obliged to formulate and implement policies to mitigate climate change. Thus, the principle of "common, but differentiated responsibilities" is carried to the extreme here by recognizing the developed countries’ explicit responsibilities to take the lead in reducing emissions. The argument is simple: since most of past and current emissions originate from Western countries, they should clean up first. Developing countries have the right to prioritize economic development, while getting financial and technical assistance to combat climate change. This principle is captured in Article 12 of the Kyoto Protocol under the " Clean Development Mechanism " (CDM). It allows Annex B countries (developed countries) to assist developing countries in achieving sustainable development. Investment by an Annex B country in a project in a developing country that leads to reduction in emissions will be certified. Those "certified emission reductions" (CERs) can be credited to the investing country. The mechanism should allow for transfer of resources and technology to developing countries (NSS 2001).
Draft, not to be quoted 34

Indonesia has basically two main options under the CDM. First, it could include its vast forest resources as sinks to absorb emissions. The majority of Indonesia’s CO2 emissions – 64 percent in 1990 and 74 percent in 1994 – came from forestry and land use change (Pelangi Indonesia 2000). Efforts to reduce emissions must mean halting rapid deforestation. But this would involve significant reduction in incomes derived from wood–based industries. Second, abatement strategies must be adopted in the energy sector. Overall, Indonesia's GHG emissions are projected to increase rapidly after the economic crisis has been overcome. Predictions estimate that CO2 from energy demand sectors will triple between 2000 and 2002 as the share of coal in energy supply is expected to increase by a factor of ten (NSS 2001). Indonesia has recently completed a National Strategy Study (NSS). Its main recommendation called for a strengthening of the capacity of the private sector and non–governmental organizations (NGOs) in implementing CDM. In addition, the study recommends the creation of a Designated National Authority (DNA) which should be established by a Presidential Decree. It should consist of two units. First, a national CDM Board representing a wide range of stakeholders. Second, a CDM Clearinghouse which would be in charge of day-to-day operations in capacity–building. Currently, 10 CDM projects are in operation in Indonesia with a potential reduction of about 3,5 MT CO2 equivalent (NSS 2001). Basel Convention Indonesia ratified the Basel Convention in July 1993. The traffic of hazardous waste is regulated by Government Regulation No. 19/1994. With regard to hazardous waste imports, Article 27 of the Regulation states that i) any person or enterprise shall be prohibited from importing hazardous and toxic waste materials (B3 waste) and ii) the transportation of B3 waste by third countries through the jurisdiction of the Republic of Indonesia must be reported in writing to the Indonesian government. On a regional level, an ASEAN Ministerial Resolution in April 1994 agreed to strengthen regional cooperation to ensure the effective implementation to reduce hazardous waste generation and enforcing regulations covering the trans-boundary movements of hazardous waste within ASEAN borders (CSIS 1996). However, the importation of hazardous waste continued to be a business, as domestic firms such as battery manufacturers still rely on used batteries as raw material inputs. In May 1995, the government issued a supplement to Regulation no.19 which allowed for temporary imports of used batteries. In 1997, regulation no.23 completely prohibits hazardous waste imports.16 Recent cases of hazardous waste imports include imports of toxic sand material from Singapore to Riau in early 2000. These were permitted by the provincial governor. As environmentalists argue, this violates existing national regulations and also requires agreements between the two national governments. 17 Convention of Biological Diversity
16 Interview with representative from BAPEDAL 17 Various media reports, for instance Suara Karya, 13 January 2000, Republika 18 January 2000)
Draft, not to be quoted 35

In 1994, Indonesia ratified the UN Convention on Biological Diversity. It was also among the first countries to adopt a National Biodiversity Strategy and Action Plan. It has implemented many priorities set out in the plan. For instance, many priority protected areas were financed by the government and external donors. Several new conservation areas such as the Bukit Tigapuluh National Park in Riau were created. Still, less than 10 percent of Indonesia's land area is allocated to conservation purposes and only one out of 40 national parks has been fully gazetted. Since the onset of the economic crisis, protected areas and remaining forests have been under increasing pressure. Decentralization of natural resource management activities and illegal logging result in increased loss of habitats, over- exploitation and extinction of plant and wildlife species. In the forest fires of 1997-1998 alone 5 million ha forest was lost (World Bank 2001). Trade – related environmental measures Ecolabelling / Forest Certification / ISO 14000 Indonesia's economy is vulnerable to trade-related environmental measures such as eco-labelling schemes. Table 26 shows the distribution of exports going into eco-sensitive markets. The numbers show that a significant proportion of Indonesia’s exports go to eco-sensitive markets. Prior to the crisis those exports were close to one-third of overall exports before dropping to 23 percent in the midst of the economic crisis. With the depreciation of the rupiah, exports rebounded and were strong in 1999 before dropping again the following year. The share of eco-sensitive products in non–oil exports is even higher and shows the significance of trade–related environmental measures for Indonesia. With global economic prospects declining, it is even more imperative for Indonesian policymakers in adjusting to developments in eco-labelling and other voluntary schemes in export markets. As a response to growing international pressure on timber-exporting countries to adopt sustainable forest management criteria, Indonesia decided to adopt a system of forest certification. In 1990, the ITTO (International Tropical Timber Organization) member countries agreed to work towards implementing sustainable forest management by the year 2000. Member states like Indonesia made non-binding commitments to develop national guidelines based on an approved set of ITTO's Guidelines for the Sustainable Management of Natural Tropical Forests (Elliott 2000). In 1993, the Ministry of Forestry issued decrees on criteria and indicators, based on proposals set forth by the Association of Indonesian Concession Holders (APHI). In 1997, the Indonesian Eco-labelling Institute, then still acting as a working group, finalized criteria and certification system and reached an agreement with APHI, the Ministry of Forestry and the national standards body (DSN). Finally, in early 1998, the Indonesian eco-labelling foundation (LEI) was set up to implement the certification program (Elliott 2000).
Draft, not to be quoted 36
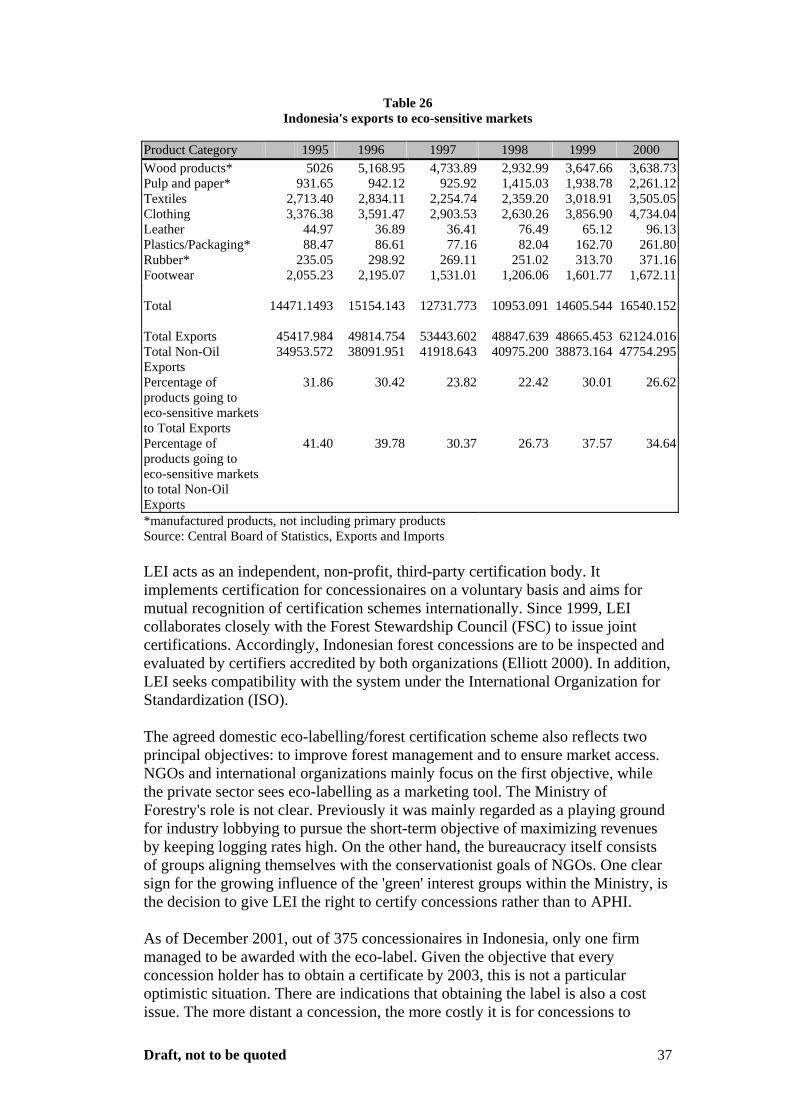
Table 26 Indonesia's exports to eco-sensitive markets
Product Category 1995 1996 1997 1998 1999 2000 Wood products* 5026 5,168.95 4,733.89 2,932.99 3,647.66 3,638.73Pulp and paper* 931.65 942.12 925.92 1,415.03 1,938.78 2,261.12Textiles 2,713.40 2,834.11 2,254.74 2,359.20 3,018.91 3,505.05Clothing 3,376.38 3,591.47 2,903.53 2,630.26 3,856.90 4,734.04Leather 44.97 36.89 36.41 76.49 65.12 96.13Plastics/Packaging* 88.47 86.61 77.16 82.04 162.70 261.80Rubber* 235.05 298.92 269.11 251.02 313.70 371.16Footwear 2,055.23 2,195.07 1,531.01 1,206.06 1,601.77 1,672.11 Total 14471.1493 15154.143 12731.773 10953.091 14605.544 16540.152 Total Exports 45417.984 49814.754 53443.602 48847.639 48665.453 62124.016Total Non-Oil Exports
34953.572 38091.951 41918.643 40975.200 38873.164 47754.295
Percentage of products going to eco-sensitive markets to Total Exports
31.86 30.42 23.82 22.42 30.01 26.62
Percentage of products going to eco-sensitive markets to total Non-Oil Exports
41.40 39.78 30.37 26.73 37.57 34.64
*manufactured products, not including primary products Source: Central Board of Statistics, Exports and Imports LEI acts as an independent, non-profit, third-party certification body. It implements certification for concessionaires on a voluntary basis and aims for mutual recognition of certification schemes internationally. Since 1999, LEI collaborates closely with the Forest Stewardship Council (FSC) to issue joint certifications. Accordingly, Indonesian forest concessions are to be inspected and evaluated by certifiers accredited by both organizations (Elliott 2000). In addition, LEI seeks compatibility with the system under the International Organization for Standardization (ISO). The agreed domestic eco-labelling/forest certification scheme also reflects two principal objectives: to improve forest management and to ensure market access. NGOs and international organizations mainly focus on the first objective, while the private sector sees eco-labelling as a marketing tool. The Ministry of Forestry's role is not clear. Previously it was mainly regarded as a playing ground for industry lobbying to pursue the short-term objective of maximizing revenues by keeping logging rates high. On the other hand, the bureaucracy itself consists of groups aligning themselves with the conservationist goals of NGOs. One clear sign for the growing influence of the 'green' interest groups within the Ministry, is the decision to give LEI the right to certify concessions rather than to APHI. As of December 2001, out of 375 concessionaires in Indonesia, only one firm managed to be awarded with the eco-label. Given the objective that every concession holder has to obtain a certificate by 2003, this is not a particular optimistic situation. There are indications that obtaining the label is also a cost issue. The more distant a concession, the more costly it is for concessions to
Draft, not to be quoted 37

arrange for evaluation teams to check the site. Currently, costs are estimated to be about 500 million rupiah (around US$ 50,000) per 100,000 ha.18 A serious obstacle for many concessionaires is the incidence of illegal logging within the managed site. LEI has already announced that it would not issue eco-label certificates to firms suspected of having obtained illegal logs. While LEI develops criteria for wood products, BAPEDAL (Environmental Impact Management Agency) 19and the Standardization Body (DSN) are responsible for developing criteria for eco-labelling certificates for all other product groups. ISO 14000 standards provide the guidelines for BAPEDAL and DSN. The adoption of ISO standards in Indonesia has been discussed since 1995. Six working groups deal with the following areas: Environmental Management System, Environmental Auditing, Environmental Labeling, Environmental Performance Evaluation Life Cycle Analysis and Terms and Definition. In April 1996, a report and recommendations were submitted to the ISO Secretariat in Geneva. So far, about 300 firms have been awarded with the ISO certificate. This is very small number, especially when compared to Malaysia, where around 3,000 firms have been awarded with ISO 14000.20 Table 27 shows the ISO standards, which are already adopted by the Indonesian Standardization Body (BSN).
18 Koran Tempo, 4 December 2001. Cost estimate prior to the crisis were estimated to be in the order of between 0.50 US$ and 14.50 US$/m3. WALHI, an environmental NGO, suggested that given a concessionaires profit of US$ 78/m3, forest certification cannot be a cost issue for concessionaires (Elliott 2000,p.108). 19 BAPEDAL is currently in the process of being abolished and its functions will be absorbed by the Ministry of the Environment. 20 Interview with BAPEDAL representative
Draft, not to be quoted 38

Table 27
ISO Standards in Indonesia ISO 14001* Environmental Management Systems - Specification with guidance for use ISO 14004* Environmental Management Systems - General Guidelines on Principles, Systems and Supporting Techniques ISO 14010* Guidelines for Environmental Auditing - General Principles on Environmental Auditing ISO 14011* Guidelines for Environmental Auditing - Audit Procedures - Auditing of Environmental Management Systems ISO 14012* Guidelines for Environmental Auditing - Qualification Criteria for Environmental Auditors ISO 14015 Environmental Assessment of Sites and Organizations ISO 14020 Environmental Labels and Declarations - General Principles ISO 14021 Environmental Labels and Declarations - Self Declaration and Environmental Claims Terms and Definitions ISO 14024 Environmental Labels and Declarations - Type 1 Environmental Labeling ISO 14025 Environmental Labels and Declarations - Type III Environmental Declaration ISO 14031 Environmental Performance Evaluation - Guidelines ISO/TR 14032 Environmental Performance Evaluation - Case Studies Illustrating the Use of ISO 14031 ISO 14040 Life Cycle Assessment - Principles and Framework ISO 14041 Life Cycle Assessment - Goal and Scope Definition and Inventory Analysis ISO 14042 Life Cycle Assessment - Life Cycle Impact Assessment ISO 14043 Life Cycle Assessment - Life Cycle Interpretation ISO 14047 Life Cycled Assessment – Examples of Application of ISO 14042 ISO 14048 Life Cycle Assessment - LCA Data Format ISO 14049 Life Cycle Assessment - Examples of Application of ISO 14041 ISO 14050 Environmental Management – Vocabulary Note: * already adopted by National Standardization Board Source: BAPEDAL (Environmental Impact Management Agency) Trade, environment and labor: case studies from the textiles industry The economic importance of the textiles industry Textiles have been produced in Indonesia since the 1930s and the industry receives particular attention by the government of Indonesia (GOI) as an important base for industrial development due to its simple technology and a big domestic market. Automatization occurred in the mid-1960s replacing hand loom completely and thus increased production. Until the end of the 1970s, the government pursued a strategy of import substitution. With the saturation of the local market and the decrease in oil prices, non-oil exports became increasingly important for the Indonesian economy. An outward- looking strategy combined with the diversification of the export base has been adopted since the mid-1980s, with the textile industry as one main beneficiary. Export Performance Until the early 1980s Indonesia’s manufacturing sector was very inward-oriented with exports of textile products playing only an insignificant role. However, this changed by the mid-1980s. Textiles and textile products (TTP) play an important
Draft, not to be quoted 39

role in the overall export performance of Indonesia and have been consistently the largest foreign exchange earner since the 1980s outside the oil and gas industries. Almost 48 percent of Indonesia's TTP is exported, with the largest foreign exchange earner being garments, followed by fabric, yarn and synthetic fibers (GTZ 2001) Before the crisis in 1997, TTP exports already started to decline. This affected the overall growth of non-oil exports, since textiles constitute around 17 % of total exports. The main reasons for this negative development are to be found in the decline of polyester fibre prices in 1993, sluggish international markets in general, rising competition from China , India, Bangladesh and Vietnam and the increased problems with government procedures to clear goods through customs and to process duty drawbacks (Pangestu and Azis 1994). The financial and ensuing economic crisis in Indonesia has aggravated these problems further.
Table 28: Foreign Exchange Earnings from Indonesia's Five Major Non-Oil and Gas Commodities, 1998
Commodity Export Value (US$
billion) Share of total Non-Oil and Gas
Exports (%) Textile and Textile Products 7,390 18.03 Timber Products 4,389 10.71 Agriculture Products 3,289 8.05 Electronics 3,259 7.95 Mining Products 2,667 6.51 Source: Department of Industry and Trade In 1999, TTP exports from Indonesia reached 130 countries. Indonesia had to agree on a quota system for its exports of textile and textile products and signed the Multi-Fibre Agreement in 1975. The quota is a fixing level, limiting the exports of textiles classified in certain categories. So-called quota countries are the United States, the European Union, Canada and Norway. According to GATT/WTO regulations, those quota systems will have to disappear by 2005, meaning that TTP exports will be quota-free. Exports to quota countries constitute around 44 % and exports to non-quota countries around 56 percent of overall exports of textiles and textile products. Production and exports by main textiles and textiles product categories Fiber Indonesia's main textile fibers consist of polyester, cotton, viscose rayon staple, acrylic and nylon. Polyester accounted for an estimated 51% of the total consumption in 1999 (GTZ 2001). All textile fibers are locally produced, except for cotton, which is almost entirely imported mainly from Australia and the US. The 1990s saw an impressive growth rate of synthetic fiber production and Indonesia was also part of this growth. In 1997, there were 24 fiber manufacturers in Indonesia, 19 of which produce polyester, 5 nylon, 3 viscose rayon and 2 acrylic fiber. Main production areas are in West Java. In 1994-1998, exports of fiber have almost tripled in volume before dropping during the 1997-1998 economic crisis. In 1999, Taiwan was the biggest export
Draft, not to be quoted 40

market for Indonesian textile fiber, followed by South Korea and the US. The number of factories reached 27 in 1999. Yarn The Indonesian yarn industry supplies 90% of the domestic demand. The primary consumers of yarn are the weaving and knitting industries. Secondary consumers include sewing thread, carpet, upholstery, fishing net, rope, shoes and leather industries. Indonesia produces single spun, mixed spun - and filament yarns. According to the Department of Trade and Industry, 166 spinning mills with a total capacity of 7.2 million spindles are operating in the country, with the vast majority located in West Java, the country's center of textile manufacturing. Production levels increased continuously by an average 13 percent annually before the crisis. The crisis brought a sharp downturn in production.
Table 29
Indonesia's Production of Textile Yarns, 1995-1998
Year Production ( in tons) Growth 1994 1,004,275 - 1995 1,142,217 13.7 1996 1,290,401 13.0 1997 1,263,231 (2.1) 1998 1,167,790 (7.6)
Source: Central Bureau of Statistics The main export markets are South Korea, Japan, and Hong Kong. For the first ten months of 1999, exports to these countries amounted to 184,157 tons valued at US$ 374 million, accounting for 35.5 percent and 38.5 percent of the total yarn exports by weight and value respectively (GTZ 2001).
Table 30 Indonesia's Export of Yarns
Volume Value Export Share
Year (Tons) (US$ '000) by volume (%) 1994 228,554 678,548 22.8 1995 254,469 813,090 22.3 1996 323,165 921,149 25.0 1997 280,624 778,123 22.2 1998 436,283 873,581 37.4 1999 519,230 977,531 n.a.
Source: Central Bureau of Statistics Fabrics The fabric industry is the second largest contributor to the country's foreign exchange earnings in TTP exports. Quality improvements of domestically produced fabric have allowed Indonesia to reduce imports of fabrics, which were previously required to meet the needs of export-oriented garment producers. Currently, there are 767 woven fabrics, 252 knitted and 12 non-woven fabrics factories in the country. Similarly to yarn, a decade-long increase in fabrics production came to a halt with the onset of the crisis in 1997. In addition,
Draft, not to be quoted 41

increased smuggling of cheap fabrics from India and China, sold 20 percent under the market price, constitute a major problem for the domestic industry. According to the Textiles Association (API), capacity utilization of the weaving industry dropped from 70 percent in 1997 to 60 percent in 1998, affecting mostly small- and medium-scale enterprises (GTZ 2001).
Table 31 Indonesia's Fabric Production (in tons)
Year Woven Fabrics Knitted Fabrics Non-Woven Total
(in tons) 1994 914,119 161,316 4,571 1,080,006 1995 939,230 214,688 6,559 1,160,477 1996 1,027,144 204,425 11,819 1,242,388 1997 1,093,841 172,261 15,191 1,281,293 1998 941,928 151,374 13,048 1,106,350
Source: CBS In terms of exports, quantity of fabrics grew substantially until 1998, but export value dropped sharply in the aftermath of the financial crisis. The devaluation of the Rupiah has not benefited the domestic textiles industry, as other countries in the region have also dropped their prices to become more competitive. Reportedly, foreign buyers demanded a 20-30 percent price cut from TTP exporters in Southeast Asia (GTZ 2001). In 1999, the United Arab Emirates was the primary destination of Indonesian fabrics (most of it for transit), absorbing 13 percent of the country's exports in value and 9.8 percent by volume, followed by the US, UK and Hong Kong.
Table 32 Indonesia's Exports of Fabrics
Year Volume (tons) Value (US$ '000) Export share by volume
(%) 1994 244,219 1,629,543 22.6 1995 243,470 1,707,609 21 1996 265,630 1,706,941 21.4 1997 221,893 1,348,139 17.3 1998 381,441 1,362,857 34.5
1999* 342,774 1,339,540 na * Jan-Oct; Source: Central Bureau of Statistics Garments Garments exporters contribute the largest share in TTP exports from Indonesia. There are currently 2,368 garment factories operating in the country, with a total production capacity of 583,1 million dozen pieces per year. West Java has the largest number of factories, accounting for 908 units with a total capacity of 242.9 million dozens or 41.6 % of the country's total capacity. Until the 1997 Asian financial crisis, domestic garment production showed a constant increase, but production dropped in 1998 due to reduced exports and domestic demand.
Draft, not to be quoted 42

Table 33 Indonesia's Production of Garments, 1994 - 1998, in tons
Year Production Growth 1994 251,295 1995 311,504 24 1996 331,071 6.3 1997 370,806 12 1998 350,406 -5.5
Source: Department of Industry and Trade, CBS Exports by both quantity and quality fell after the start of the crisis. Value of exports shrunk by 28 percent from 1996-1998. Problems in trade financing, rejection of Indonesian L/Cs in a number of countries and political uncertainties have hit the domestic industry. The main importers of Indonesia garments are the US, Germany, UK, Japan and the Netherlands.
Table 34 Indonesia's Exports of Garments
Year Volume (tons) Value (US$ '000) Export share by volume
(%) 1994 205,624 3,226,106 81.8 1995 221,299 3,388,120 71.1 1996 235,020 3,575,799 71 1997 267,670 3,394,742 72.2 1998 205,430 2,587,928 58.6
1999* 339,807 3,246,392 na * Jan-Oct; Source: CBS Employment The employment effects of the textiles industry are significant, as it offers employment to some 3,5 million workers directly and an additional 2.5 million people indirectly in distribution. This constitutes around 7 percent of the country's total 87 million workforce. The Indonesian Textiles Association (API) estimates that currently around 8,000 manufacturers of TTP operate in Indonesia, 73 percent (or 5,580) of which are located in West Java and Jakarta (GTZ 2001). Pollution and environmental regulations affecting Indonesia's textiles industry External environmental labelling schemes affecting Indonesian Textile and Textile Products21 Since a significant proportion of the Indonesian textile exports goes to the European markets, the discussion will focus on the eco-labelling schemes established in selected European countries. Specifically, four schemes are of relevance : the Swedish Good Environmental Choice (BM), the Dutch scheme, the Nordic Countries’ programme and the EU labelling scheme . 21 The following section relies heavily on UNEP (1995)
Draft, not to be quoted 43

The criteria set by the different eco-labeling schemes for textile products affect the production of fiber and the textile manufacturing process. There seems to be an agreement on the need to encourage organic cultivation methods for the production of natural fibres. The Swedish scheme (BM) , for instance , awards the A - Label to products made of natural fibres only if the fibre has been produced following the principles of organic agriculture. The content of pesticides in fiber has to be limited as well under the Nordic and the EU schemes. With regard to synthetic fibres, the EU establishes requirements for certain emissions and heavy metal residues, while the Nordic scheme only requires the manufacturer to provide information about the emissions. In short, all schemes use as reference the international and national lists for harmful chemicals. There is a consensus over the need to ban the use of chlorinated bleaching agents. The Nordic and the Swedish programmes emphasise more the biodegradability capability of the chemicals compared to the other two schemes. One of the environmentally most problematic parts of textile production is the use of certain harmful dyes and pigments. The Swedish and the EU schemes explicitly ban the use of certain dyes and pigments , and demand a declaration from the manufacturer, while the Dutch and the Nordic schemes rely on the indirect measurement of the composition of the final product. Proponents of less stricter standards concerning heavy metal residues base their arguments on the difficulties in the testing methods for measuring heavy metal residues in final products. The most comprehensive and detailed water emissions limits apply under the Swedish scheme, which considers, among others, the dye discharges into water - a parameter not included in the other schemes. Regarding energy consumption criteria, the EU and the Nordic countries’ schemes require detailed information on the consumption of energy and water during the different production phases, with the aim of incorporating the resource consumption requirements in the future criteria. A further review of the different schemes reveals that the Dutch scheme allows by far the highest levels of formaldehyde concentration. The Nordic scheme sets more detailed criteria concerning the consumer health effects. The EU includes several criteria for occupational exposure and the Dutch scheme intends to include them in the future (on the condition that agreements over the minimum requirements are reached in the bodies working on that particular issue). In terms of how to control and verify the compliance of the applicants with the eco-labelling criteria, the EU scheme relies in several issues on manufacturer’s own declarations, whereas the Nordic and the Dutch schemes prefer to use clearly measurable criteria. Another important market for Indonesian textile products is Germany. The Oeko-Tex standard 101 defines special conditions for granting the authorisation to use the mark “ Oeko-Tex “ for textile fabrics (woven fabrics, knitted fabrics,
Draft, not to be quoted 44

nonwovens) for clothing, with the exception of baby clothing. The Oeko-Tex- Standard 101 and 115 define the requirements for textile fabrics (woven fabrics, knitted fabrics, nonwovens) for clothing (with the exception of baby clothing) , spun fibres (yarn, ply - yarns) and initial products (loose stock, staple fibres) used for manufacturing of textile fabrics in industry and trade. Apart from the internationally recognised Oeko-Tex Standard there are two other schemes in Germany of which foreign producers have to be aware of, namely the “ Toxproof “ certification and the “ Eco-Tex “ scheme. The former is generally established for garments , whereas the latter requires participation in the Eco - Tex consortium. Membership in the Eco-Tex consortium is advisable for big export companies, that can afford the membership fees. One advantage of the scheme is that information about environmentally optimised production processes are distributed to all members and are also under frequent revision. It is also important to be aware of the German legislation applying to textiles. The most dangerous substances - pentachlorophenole (PCP) and formaldehyde - fall under strict regulations. Use of PCP is banned; compulsory labelling is required for the use of formaldehyde in excess of 1500 mg / kg since 1986; the use of carcinogenic substances is banned to reduce the flammability of fabrics ; and the use of asbestos yarns for protective clothing is banned. .The EU has also launched a PCP regulation, but the standard is still high at 1g/kg (1000 ppm) (Neitzel, Landtmann 1994, p.109). With regard to markets outside Europe, Japan constitutes a major market for Indonesian textile exports. Criteria to obtain an “ Eco-Mark “ exist for unbleached towels, cloth diapers, cloth shopping bags and for textiles made of waste fibres. The established criteria are also based on an impact assessment for the entire product life cycle. Domestic regulations Like many other industries, the textile sector is controlled under the Industrial Act, the Environmental Management Act , regulations based on both these Acts and the Nuisance Act. Two regulations are of specific importance for the textile industry. First, the Decree of the Minister for Population and the Environment Number 03 / 1991 states effluent quality standards for existing operations. The second important legislation is the Decree of the Ministry of Industry, No. 134 / M / SK / 1988 which lists all industrial activities requiring Preliminary Environmental Impact Studies (PIL) or an Environmental Impact Analysis. These EIAs contain a detailed explanation of the process of production, the chemicals used and a prediction of the impact of the particular factory on the environment and the firm’s measures to counteract those likely impacts. Effluent standards for the textiles industry is regulated by the Ministerial decree No. KEP - 51/MenLH/10/1995. This decree sets maximum levels of pollution loads of liquid waste allowed to be discharged into the environment by 21 kinds of industries. In 1989, the government launched a water pollution control program, known as the "Clean River program' (Prokasih). The initial focus was on the major industrial polluters (including textiles factories) along the 24 most highly polluted rivers,
Draft, not to be quoted 45

with the stated goal of reducing their pollution loads by 59 percent within two years. Firms in highly polluting industries were required to sign a letter of commitment to reduce pollution loads accordingly within an agreed time frame. Some progress has been reported in reducing industrial pollution, as more than 1,000 firms had signed the letter and pollution loads were reduced in 6 Prokasih rivers (Utami 1994). However, monitoring and controlling by the government has reduced significantly since the economic crisis hit in 1997 (see interviews further below). Data provided by the PROKASIH program suggest that the textile industry contributes about 70 percent of the total load of pollution into the West Java rivers covered under the Clean River Programme (CSIS 1996). A survey among textile firms: some insights Interviews with 2 textile firms give some insights on the response of the Indonesian textile industry towards internal and external environmental regulations and labor standards. Firm 1 is producing viscose staples fibers. It is a large-scale firm, with more than 1,500employers. The majority of shares is owned by a foreign firm. Annual sales in 2002 amounted to US$ 170 million. Exports are 35 percent of total revenues and the firm is among the leading firms in the product market, with a 48 percent market share in 2002. Firm 2 is has two owned subsidiaries and is an integrated manufacturer of yarns, fabrics and garments. The speciality is in the production of nylon filament, nylon twist, polyester texturized yarns and polyester or nylon spun-like yarns. This private firm is a leading player in domestic market for fabrics in nylon. General competitiveness issues: Both firms regard environmental issues as not detrimental to their competitiveness, but have more concerns about increasing labor cost, corruption costs and the uncertain political conditions in Indonesia. Firm 1 argues that environmental technology adopted in their operations is already world-class and chemicals used in their production process are disposed of properly adhering to existing environmental standards. Firm 2 cites labor issue as a more severe problem, and argues that currently it does not face external and internal pressures to comply with strict environmental standards, but is ready to do so, as this is also a question of market access. Access to information and the role of association of textile industry and government: Firm2 complained about the lack of information available for Indonesian exporters on the latest developments in overseas markets. There are clearly research disadvantages in this regard for Indonesian exporters. Information is generally obtained through magazines, articles in specific journals and sometimes through seminars which are quite costly. Generally, Indonesian exporters do not have sufficient access to information on environmental policies which may affect exports to OECD countries. The firm received information from its European buyers and through the garment manufacturers who wanted a written guarantee. The association is considered not to be an effective in developing a strategy to addressing trade-related environmental issues, and Firm 2 does not have the time to commit to the association's activities.
Draft, not to be quoted 46

Firm 1 stated that information is not easily available and if, they are not up-to-date. However, it gets all the relevant information on regulations and technology developments from the parent company in Europe. The trade association needs to influence the government in formulating a strategy, a role, which it is currently not fulfilling. According to this firm, the government does not have a clear strategy for the textile industry and should push for more quotas in export markets, as other countries also do not adhere to same trade rules. In addition, it should undertake measures to prevent the increased smuggling of textiles into Indonesia. Labor standards and costs: Firm 1 depends largely of high- skilled labor such as chemical and maintenance engineers. Hiring from domestic education system is a problem, as the education level is not considered good enough. Therefore it has a substantial amount of expatriate labor, for instance from India. Firm 1 provides formal in-house employee training programs and regards this as the most effective way to enhance skills among the workforce. Labor issues are not affecting the competitiveness of the firm, as wages are already higher than minimum wages and the firm follows government regulations. Wages for higher skilled labor are higher than industry average anyway. The firm identifies the lack of domestic skilled workers as a big problem. Currently it negotiates with 2 labor unions on labor and wage issues. The firm objects to the severance pay policies set by the latest drafted labor bill. In 2000-2002 labor costs have increased by around 17 percent per annum. Firm 2 relates high labor costs to low productivity. During 1999-2002, there were three increases in minimum wages, but they did not correspond to a significant rise in productivity. It was worsened by the implementation of the current bills on Labor Ministerial Decree No.150, particularly where the wage remains to be paid under the terms of dispute settlement. It faces only one union in negotiations, the main national trade union SBSI. Testing facilities : Firm 1 said that all textile process houses are obliged to install an effluent treatment plant by government decree and the maximum parameters for effluent discharge has been stipulated for each type of industry. The testing facilities are adequate to evaluate effluent parameters. Co-operation with international certificate bodies is needed, once certain dyes are banned. It is also reported that the transfer of environmental technology cannot be confirmed in Indonesia. There is a need for foreign help, but this involves higher costs for Indonesian firms. Firm 2 said that there are compulsory testing facilities to test for pollution loads, and samples are taken once a month from rivers affected by its operations. Products must be accredited to follow US (AAEETCC), European (DIN) and Japanese (JIS) quality standards. Waste treatment : Firm 2 argues that textile firms in Indonesia have already started to invest in implementing effluent treatment facilities. It has already introduced wastewater treatment facilities since the 1970s. Treatment is required by the government, but generally it is a question of economies of scale to invest in effluent treatment. The bigger the economies of scale, the cheaper it becomes for
Draft, not to be quoted 47

the firm to invest in upgraded technology. Firm 1 states that it already has invested in wastewater treatment facilities since the beginning of its operations in Indonesia, as it has adopted advanced pollution abatement technologies from the parent firm in Europe. Viscose products in Europe already require eco-certificates to be allowed into the market. Both firms did not receive government or other external public assistance for investing in wastewater treatment. Government regulations, ISO 14001 and eco-labelling: As far as the adoption of environmental management systems like ISO 9000 or ISO 14000 is concerned , Firm 1 stated that it has obtained the ISO 9002 certificate. The firm also intends to adopt ISO 14000 standards to improve its efficiency and hopes to reap high indirect benefits like cost savings and a better image. Firm1 hopes to have completed the requirements by 2004. However, there will be higher ongoing operational costs involved because of additional personnel needed for training and a change in the production process. The firm has, so far, not received any specific request from its trading partners regarding the adoption of ISO 14001 system. Firm 1 states that domestic eco-labelling should not be made mandatory, not because of cost issues, but because it believes that the implementation will not be fair. Unclear government regulation in measuring pollution loads also contributes to higher costs for business. Current corruption costs involving police using environmental legislation as a pretext to extract fees are already high. Firm 2 said that customers have not yet requested ISO 14001, but it has already obtained ISO 9002. Improvements in efficiency are the main reasons for doing so. Potential trade effects of eco-labelling: Both Firm 1 and Firm 2 stated that eco-labelling will not raise their production costs significantly, should it be also made mandatory in Indonesia. Both firms estimated cost increases to be at well below 10 percent, if eco-labelling is made compulsory. But both raise concerns about the capacity of the authorities to implement fair monitoring procedures in Indonesia. Firm 2 stated that environmental investments are positive investments for exports; but not for those producing only for the domestic market. Since a large 44.7 percent of total garment revenues comes from exports, environmental adjustment costs are necessary to meet competitive challenges. General economic conditions faced by the Indonesian textiles industry Despite its impressive growth rate in the 1980s and 1990s, the textile industry faces several 'structural' problems, which were aggravated during the economic crisis. These include inefficiency of machinery, excessive capacity utilization, lack of capital due to prevailing high interest rates, tighter competition in international markets, and problems associated with red tape. Aging machinery is one of the main problems faced by textile manufacturers. According to the GTZ (2001), the majority of the machinery in Indonesia is more than 20 years old and this causes a low productivity level. This affects the quality of produced export goods and constitutes a major problem in the tighter international markets, particularly when exporters face no import and export quotas through ASEAN and WTO agreements.
Draft, not to be quoted 48

The necessary restructuring of the industry is made difficult by the current financial constraints in the Indonesian economy. The banking crisis has seen a lack of credits and soaring interest rates during the past 5 years, making it difficult for textile producers to undertake investments and expand capacities. Production costs have also soared as a result of rising energy prices (between 15-25 percent in the past three years), increasing labor costs due to a rise in minimum wages (with lower productivity) and increased harbor handling fees. The low Rupiah has made the import of raw materials also expensive. Other obstacles include shortages in qualified human resources, irregular supplies of basic materials, inadequate marketing networks and general uncertainties due to exchange rate fluctuations. Environmental costs do not seem to constitute a major problem for the industry, at least among the large-scale manufacturers. Cost increases are not expected to be significant and upgrading environmental management systems are generally regarded as an investment towards achieving efficiency. Adherence to internationally acknowledged and voluntary certificates such as the ISO 14001 is the preferred method of environmental regulation in the industry compared to domestic eco-labelling initiatives. ASEAN, AFTA and WTO: regional cooperation towards multilateral arrangements Regional Cooperation and Initiatives Agriculture To date, AFTA has been successful as a training ground for trade liberalization among ASEAN countries in achieving their APEC and WTO commitments. In the year 2002, ASEAN Free Trade Area, which was planned in 1992, by six ASEAN countries - Brunei, Indonesia, Malaysia, Philippines, Singapore and Thailand, was finally effective. As ASEAN extended to Vietnam, Laos, Cambodia and Myanmar, those countries also became member of AFTA with different timeline of tariff reductions, which are 2006 for Vietnam, 2008 for Laos and Myanmar and 2010 for Cambodia. AFTA was set up on a voluntary basis, in which member countries are free to choose commodities they wanted to include in tariff reductions schedule, called Inclusion List (IL). Products submitted in IL are subject to preferential tariff reduction to reach 0-5 percent in 200222. When the CEPT scheme was initiated, agricultural products and services were excluded but in 1994, the 26th AEM agreed to include all unprocessed agricultural products. In general, within ASEAN, tariff rates were already lower than WTO commitments. In WTO, trade liberalization is decided through negotiation based on offer and request mechanism, so that individual member country’s success is highly determined by negotiators capabilities. In contrast to developed countries, developing countries have limited representatives at the WTO, not only in terms 22 Apart from IL, there are three other category lists of products, which are Temporary Exclusion List (TEL) including products temporarily excluded from tariff reductions schedule and should be phased into the IL in five installments, Sensitive List (SL), which includes products declared sensitive to the particular country22 and General Exception (GE) which products excluded from AFTA.
Draft, not to be quoted 49

of number of people but also capacity and capabilities, mostly due to limited budget. The imbalance in negotiation capacity between member countries within WTO might lead to imbalanced negotiations. Given this situation, a coalition among ASEAN countries might boost ASEAN member countries bargaining positions at the WTO. However, the questions then is whether ASEAN member countries have common interest worth to fight for? There are at least four issues regarding agricultural commodities in which ASEAN member countries might have similar positions. Firstly and might be the most important one is market access to developed countries. Most of ASEAN countries exports are to developed countries, where trade protection remains relatively high. Concerted requests upon developed countries to accelerate opening up of its market would be more powerful than individual requests. Secondly, related to market access, developed countries tend to impose new forms of trade barriers, such as Sanitary and Phytosanitary (SPS) and other standards. If this is not treated wisely might turn to be “trade harassment”. Indonesia, together with Vietnam and Myanmar had experienced huge losses with their shrimp exports being rejected in EU for failing to meet the SPS standard. ASEAN cooperation in addressing this issue would also be effective rather than individually fighting with importing countries: transparency of standards and mutual recognition of inspections and standards. ASEAN, joint forces could demand pre-shipment inspections, including transfer of technology and training of personnel (HRD). Else, EU can choose a private run inspection laboratories operated in ASEAN if required. Thirdly, S&D treatment might be common interest of ASEAN member countries. Unequal capacity and level of development between the developed and developing countries is a reasonable ground for S&D treatment. Developing countries should be granted longer time to adjust to new trade environment, not the other way around. Concerted actions demanding S&D treatments are another room for such coalition to fight for. Fourthly, non-trade concerns of developing countries such as rural development, poverty alleviation and food security. While farmers in the developing countries are always associated with poverty, ASEAN member countries should join forces pursuing multi-functionality of agricultural sector so as to protect its farmers, temporarily while domestic policies should be developed to enhance farmers’ position. This request should be put under S&D treatment. While China has become a member of WTO and agreed to establish a free trade area with ASEAN it would be beneficial to include China in ASEAN regional coalitions for WTO negotiations purposes. Especially as China offered liberalizing its agricultural sector in the early phase of ASEAN-China free trade initiatives. Will coalitions among ASEAN member countries at WTO bring different results compared to CAIRNS, which failed to echo developing countries interest? ASEAN countries differ from CAIRNS members. Firstly, ASEAN member countries are exporters of similar commodities. Secondly, ASEAN member countries are more or less in the same stage of development – developing countries, with Singapore as an exception. Those similarities would make ASEAN coalitions performed better than CAIRNS in member countries perspectives.
Draft, not to be quoted 50

Environment Indonesia's efforts to deal with integration of environmental and trade objectives have always prioritized the principles of "common, but differentiated responsibilities" and the "right to development". This stance has permeated its negotiations and position in WTO rounds and ASEAN as a regional cooperation mechanism was actively used to push this stance. Overall the government has always maintained a "free-trade-approach" in international trade negotiations. But this did not prevent domestic policies to ratify international agreements on the environment, as the preceding discussion has shown. Indonesia has been active in formulating ASEAN's stance on environmental issues, particularly since the launch of the ASEAN Senior Officials on the Environment (ASOEN) as a consultation mechanism. The ASEAN Plan of Action on the Environment for the period 1994-1998 was approved by the Sixth ASEAN Ministerial Meeting in Bandar Seri Begawan. It builds on the global strategies and issues formulated in Agenda 21 and the Singapore Resolution on environment and Development in 1992. A number of issues have pre-occupied ASEAN policymakers since then. These include: (1) tropical timber trade regulation, (2) green aid and transfer of environmentally sound technology, (3) biodiversity conservation, (4) greenhouse gas emissions, (5) harmonization of environmental quality standards, (6) eco-labelling, (7) trans-boundary movement of hazardous waste, (8) coastal and marine resource management, (9) watershed management, (10) energy conservation and management, and (11) pollution generated by commodity production (Montes and Magno 1999). In their trade negotiating positions, ASEAN and Indonesia have consistently pursued a free trade approach in trade-environment issues. The most important trade-environment issue is, of course, tropical timber trade regulation and eco-labelling. Indonesia and ASEAN have responded negatively to efforts by industrialized countries to link domestic logging practices to determining timber trade quotas. In 1990, an ASEAN delegation headed by the Indonesian Minister of Forestry was sent to the European Community. This resulted in a Joint Communique on ASEAN-EC Cooperation on Forestry Development. It endorsed the principle that the conservation of the world's forests is a shared responsibility and that forest development activities should be pursued in an environmentally, socially and economically sustainable manner (Montes and Magno 1999). In essence, ASEAN engaged other countries and regional organizations in constructive negotiations on environmental issues in order to prevent unilateral actions against their exports. However, as discussed above, this did not prevent Indonesia to recognize eco-labelling as a potentially beneficially trade instrument to achieve 'green' consumerism and trade domestically. The forest fires in Indonesia and the subsequent haze besetting the region in 1997-1998 have added a new dimension to the trade-environment debate within ASEAN. Overall costs of the haze are estimated to be in the order of US$ 4.5 billion (Cotton 1999). Environmentally sustainable logging practices and poor environmental governance have now direct and trans-boundary impacts which are felt by Indonesia ' s neighbors. Although a " Regional Haze Action Plan" was formulated in December 1997, ASEAN's dealing with the haze problem was
Draft, not to be quoted 51

widely considered as ineffective. It also challenged the "ASEAN way" of non-interference with each member states' domestic affairs, as Indonesia's failure to police its own regulations is a main cause of the problem (Cotton 1999). Position towards the WTO Agriculture Empirical studies on the impact of trade liberalization showed that trade liberalization would bring higher income and welfare gains to the Indonesian economy. Table 35 shows the result of previous studies using computable general equilibrium model23. The main message is that it is in Indonesia’s interest to press on with greater liberalization in the next round. However, sectoral impacts of the CGE model also suggest that trade liberalization would cause the agricultural sector to shrink, as resource reallocation takes place from the inefficient agricultural sector to more efficient sectors such as manufacturing. However, a one percent increase in productivity in the agricultural sector would bring better results as indicated by Stephenson and Pangestu (1996). Productivity improvement becomes a necessary condition for the development of the agriculture sector in the near future. However, this is a domestic policy issue rather than a WTO - related one.
Table 35 The Impact of Trade Liberalization, A Summary of Previous Studies
Change in GDP Agriculture sector NotesFeridhanusetyawan andErwidodo (1997)
increase in GDP andwelfare gain
decline in output, increase indomestic price
resource reallocation tookplace from relatvely lessefficient sector to a moreefficient sector
Pangestu andFeridhanusetyawan (1996)
increase in GDP andwelfare gain
decline in output, increase indomestic price
resource reallocation tookplace from relatvely lessefficient sector to a moreefficient sector
Hertel et.al (1995 quotedfrom Anderson and Pangestu(1995)
increase in GDP andwelfare gain
output would grow slightlylower than without UR tradelib
Stephenson and Pangestu(1996)
increase in GDP andwelfare gain
decline in output, increase indomestic price
adding a 10 percentproductivity improvementthe result is an increase inoutput of the agriculture
The calculation of the Revealed Comparative Advantage (RCA) for Indonesian agricultural products indicated that Indonesia has comparative advantages in several commodities: fish and fish products, eggs, coffee, cocoa, tea and mate, spices, margarine, shortening, tobacco, rubber crude and synthetic, vegetable and animal oil as shown in Table 36 Consequently, an improved market access would benefit Indonesian exports, including those of agricultural commodities.
Draft, not to be quoted 52
23 Most studies show the impact under different scenarios: liberalization under UR, AFTA and APEC

Table 36
Indonesia, RCA for Selected Agriculture Commodities Commodities 1970 1980 1990 1995 1996 1997 1998 1999 053 - FRUIT PRESERVED,PREPARED .01 .09 .41 .59 .97 .57 .31 1.01 032 - FISH ETC TINNED,PREPARED .35 .02 1.21 1.15 1.09 .84 1.39 1.19 062 - SUGAR PREPS NON- CHOCLATE .01 .40 1.15 .98 .76 .50 1.54 121 - TOBACCO UNMFD 1.07 1.50 1.55 1.30 1.35 1.46 2.45 1.61 025 – EGGS .04 .92 .83 1.05 1.11 1.49 2.42 031 - FISH FRESH,SIMPLY PRESVD .78 1.76 4.31 4.12 4.19 3.92 4.19 4.07 071 – COFFEE 5.82 4.37 5.62 4.06 4.39 3.04 4.12 4.12 074 - TEA AND MATE 7.98 5.22 8.72 4.70 5.57 3.73 4.82 4.27 431 - PROCESD ANML VEG OIL,ETC .22 .32 5.18 7.64 6.26 2.52 10.15 4.92 091 -MARGARINE,SHORTENING .11 .01 .61 .35 .42 2.17 3.58 7.69 072 – COCOA .02 .57 3.86 6.21 6.29 7.01 8.34 7.81 231 - RUBBER CRUDE, SYNTHETIC 32.41 11.23 12.46 15.47 14.35 13.14 12.49 10.88 075 – SPICES 10.32 7.01 14.85 14.06 9.50 10.48 12.43 12.04 422 - FIXED VEG OIL NONSOFT 16.76 6.44 11.23 13.63 16.84 23.78 13.41 21.62 Source. Author's calculations based on trade data As previously mentioned, in terms of market access to the Indonesian market, 98 percent of domestic tariff lines are already binding. In practice, tariff rates for agricultural items are already well below the GATT/WTO bound tariffs. In other words, the degree of trade liberalization in agriculture for Indonesia is already beyond current GATT/WTO commitments. Tariff on food items has been reduced by 5 percentage points, while non-food agriculture will be gradually reduced to reach maximum 10 percent by 2003. Nearly all import restrictions and other non-tariff barriers have been eliminated24. Recently, the relevant issue in the agricultural sector for Indonesia is not trade negotiation in international forum, but domestic issues. Feridhanusetyawan (2001) argues that Indonesia currently lacks a clear domestic agricultural policy. The government never stated a clear objective of agriculture policy, or its way to improve productivity of this sector. In the 1980s, the objective was very clear: rice-self-sufficiency at all cost. All inputs were subsidized: fertilizer, seed, irrigation and pesticide. The government also introduced high-yield rice. To stabilize the price, the government granted BULOG import monopoly licenses and control of domestic prices. Currently, the government does not have a budget to support subsidies (in addition to IMF commitments); domestic market is relatively more open; and no specific strategies are being taken to improve productivity. These, in the long run, would result in losing competitiveness of agricultural commodities. To some extent, Indonesia was too early in liberalizing, as the
24 . These are undertaken under the Indonesian-IMF Letter of Intent trade reform package in 1998.
Draft, not to be quoted 53

institutional setup needed to facilitate the structural changes, including access to information and access to credits for farmers, was not yet well-developed. In contrast, developed countries, which are more advanced in those terms, still exercise high tariff barriers and provide relatively high subsidies. The two case studies show that both rubber and fishery, although contributing significantly to Indonesia economy, have received inadequate attentions so far. Farmers in rubber plantations face inadequate transportations infrastructure, while, fishermen receive little attention in terms of weather and market information, which would make differences to their take-home income. Inadequate infrastructure does not entice the private sector to enter those sectors. Hence, the very low private participation in those two sectors. In agriculture, Indonesia’s main concern is not about international negotiations but rather on improving productivity. In terms of trade liberalization commitments, Indonesia has already offered substantial trade liberalization commitments. Indonesia should demand equal commitments from other countries. However, there’s not much left to offer in return, which might leave Indonesia in a weak bargaining position. A further reduction of tariff rates, converting the remaining NTBs to tariffs are among the limited options. In the coming negotiation round, Indonesia's objective is relatively clear: a substantial improvement in market access opportunities for Indonesian exports of agricultural products to ensure fair trade. It would be in Indonesia's interest to ask developed countries to accelerate tariff reduction, phase out non-tariff barriers and remove all forms of export subsidies and domestic subsidies. Indonesian Ministerial Declaration ((WTO/ WT/MIN(01)/ST/39 1 November 2001) did emphasize Indonesia's commitment to a comprehensive negotiation aimed at significantly improving market access, scaling down all forms of export subsidies to be phased out eventually and reducing trade- distorting domestic support. Apart from market access, there are other issues that need to be put forward in the next round. The issues, among others, are: • Implementation-related issues and concerns that need to be addressed fully
before stepping into a new package of commitments. In this regard, Indonesia finds it difficult to comply with the existing substantive and procedural obligations. Due to inadequate capacity, Indonesia might need technical assistance to improve their capacity to meet the WTO standards and procedures.
• SPS regulation. Indonesia is one of the exporting countries facing barriers in developed markets in the form of SPS standards. Indonesia, farmers in particular, experiences huge losses when exports of fish, shrimps and other fishery products were rejected in the importing countries for failing to meet the SPS standards. If the quality inspection (by importers) is undertaken in Indonesia rather than in importing countries, then losses would be minimized. The availability of technical assistance from developed countries for quality control infrastructure (including soft infrastructure) is an urgent issue.
Draft, not to be quoted 54

• Regarding non-trade concerns of developing countries such as rural development, poverty alleviation and food security, those issues should be fully accommodated in the ongoing negotiations. For Indonesia, food security means self-sufficiency. Food security is about accessibility, availability and stability of supplies, employment creation, farmers’ well-being, human rights (rights to have food/freedom of hunger) etc. Food security more or less means rice self-sufficiency for Indonesia as the majority of Indonesian population eat rice. It would be politically risky for Indonesia to rely on world market for rice, as domestic demand is much higher than world supply (Saragih, 2001). To this extent, rice would be unlikely to be out of ‘green box’. Indonesia would also be interested in collaboration, to pursue multi-functionality of agriculture so as to protect its farmers.
• In recognition of the unequal capacity and level of development of developed and developing countries, the special and differential (S&P) treatment for developing countries should be an integral element of the negotiations.
Environment On a general level, the government is committed to enhance the mutual supportiveness of trade and environment.25 It calls for: negotiations on the relationship between existing WTO rules and specific
trade obligations set out in MEAs. negotiations should be limited in scope to the applicability of existing WTO
rules as among parties to the WTO in question. establishing procedures for regular information exchange between MEA
Secretariats and the relevant WTO committees, and the criteria for granting of observer status.
reductions or, as appropriate, elimination of tariff and non-tariff barriers to environmental goods and services.
More specifically, the Indonesian government asks the Committee on Trade and Environment (CTE) to pay particular attention to effects of environmental measures on trade; the relevant provisions of the Agreement on Trade-Related Intellectual Property rights and labelling for environmental purposes. The government also emphasizes the importance of technical assistance and capacity-building to developing countries to reconcile trade and environmental objectives. Overall, the government is adamant in insisting that negotiations carried out should be compatible with the open and non-discriminatory nature of the multilateral trading system. Proposals to prepare negotiation positions emphasize the importance of fishery subsides to developing countries. Concerns have been raised on the issue of genetical engineering within the context of Trade-Related Intellectual Property Rights (TRIPs). Indonesia challenges efforts to enforce property rights on living creatures, as this would contradict domestic legislation. Trade in genetically engineered products should be discussed within the agreements made under the Convention of Biological Diversity which states nations' and indigenous communities' rights on natural resources. Currently,
25 The following is based on a summary of the Ministerial Declaration of 14th of November 2001.
Draft, not to be quoted 55

the government is preparing Government Regulation on Biosafety and Biotechnological Products Based on Genetically Engineering (Makarim 2001). Labour Recent political and economic reforms have initiated a change in Indonesian industrial relations policies. Most fundamental ILO Conventions have been implemented and currently the labor movement is undoubtedly in a stronger position than compared to the period under the New Order regime. International pressure on linking trade and the social clause will therefore shift from unilateral threats in adopting international norms towards monitoring the commitments Indonesia made by ratifying the ILO Conventions. However, the reality of the economic crisis makes it difficult for Indonesia to maintain its competitiveness in face of rising demand from labor unions to raise wages. This will undoubtedly make it difficult for the Indonesian government to maintain its past policies to reject any linkages between trade and social standards. Nevertheless, Indonesia’s policies in the WTO should aim at fostering cooperation and technical assistance provided by the ILO rather than bringing the labor issue within the WTO forum. Like many other developing countries, Indonesia has always taken a stance against the inclusion of social clause into the WTO mandate. Economic policies relied heavily on flexible labour markets and cheap labour. The government of Indonesia fully supported ASEAN's final statement of the 1996 Ministerial Meeting in Singapore to the trade-labor debate. The final statement recognized the reality of lower wage costs in the developing countries as a legitimate advantage. In addition, it views the ILO as the competent body to deal with labor standards (Tay 1999). Conclusion Indonesia has undertaken substantial trade liberalization since mid-1980s, which brought positive impact on economic growth and welfare improvements. Indonesia has been actively engaged in multilateral and regional economic cooperation. During the WTO negotiations, Indonesia has offered substantial trade liberalization, not only in the manufacturing but also in the agricultural sector. In terms of market access, Indonesia offered the majority of tariffs to be bound at a ceiling rate of 40 percent and converted NTBs to tariffs and subjected them to tariff reduction. Post UR, 98 percent of tariff lines of agriculture commodities are already below the bound tariff rates. AFTA, which was finally effective in 2002 was considered as a training ground for trade liberalization among ASEAN countries in achieving their APEC and WTO commitments. ASEAN countries, through the implementation of AFTA have been successful in bringing down tariff barriers. In general, within ASEAN, tariff rates were already lower than WTO commitments. Indonesia believes that the accession to the WTO will grant greater access to the world market. Although on paper all WTO members have committed to reduce their trade barriers, domestic supports and export subsidies over time, the reality is that the progress is very slow and imbalanced. Post UR, Indonesian agricultural
Draft, not to be quoted 56

exports including fishery products are still facing relatively high barriers in the foreign market, not only in terms of tariffs but also in terms of NTBs. Given that developed countries take a slower pace in liberalizing their agricultural sector, demanding better market access individually would not be a good strategy, at least for Indonesia due to limited bargaining power. A coalition among ASEAN countries might boost ASEAN member countries bargaining positions at the WTO. There are at least four issues regarding agricultural commodities in which ASEAN member countries might have similar positions. Firstly, market access to developed countries. Most of ASEAN countries exports are to developed countries, where trade protection remains relatively high. Concerted requests upon developed countries opening up its market would be more powerful than individual requests. Secondly, related to market access, developed countries tend to impose new forms of trade barriers, such as Sanitary and Phytosanitary (SPS) and other standards. Indonesia, together with Vietnam and Myanmar had experienced huge losses with their shrimp exports being rejected in EU for failing to meet the SPS standard. ASEAN cooperation in addressing this issue would also be effective by pushing for transparency of standards and mutual recognition of inspections and standards. ASEAN countries could demand pre-shipment inspections, including transfer of technology and training of personnel (HRD). In addition, EU can choose a private run inspection laboratories operated in ASEAN if required. Thirdly, S&D treatment might be a common interest of ASEAN member countries. Unequal capacity and level of development between the developed and developing countries is a reasonable ground for S&D treatment. Developing countries should be granted longer time to adjust to a new trade environment, not the other way around. Concerted actions demanding S&D treatments are another issue for such coalition to fight for. Fourthly, there are non-trade concerns of developing countries such as rural development, poverty alleviation and food security. While farmers in the developing countries are always associated with poverty, ASEAN member countries should join forces pursuing multi-functionality of agricultural sector so as to protect its farmers on a temporary basis, while domestic policies should be developed to enhance farmers’ position. This request should be put under S&D treatment. While China has become a member of WTO and agreed to establish a free trade area with ASEAN it would be beneficial to include China in ASEAN regional coalitions for WTO negotiations purposes, especially as China includes agricultural sectors in the liberalization package. Will coalitions among ASEAN member countries at WTO bring different results compared to CAIRNS, which failed to echo developing countries interest? ASEAN countries differ from CAIRNS members. Firstly, ASEAN member countries are exporters of similar commodities. Secondly, ASEAN member countries are more or less in the same stage of development, with Singapore as an exception. Those similarities would make ASEAN coalition perform better than under CAIRNS. As an importing country, however, issues relating to rural development, technology transfer, food security and a range of non-trade concerns appear to be major challenges in responding to the WTO negotiations on agriculture. Indonesia
Draft, not to be quoted 57

would be reluctant to open certain agricultural commodities such as rice as it might negatively affect its farmers, who are mostly poor. Here, the issue of S&D might be relevant to Indonesia. At the same time, this might be opposing to what Vietnam and Thailand be willing to pursue, as they are main exporters of rice. Indonesia's past policies in both the trade-social clause and the trade-environment debate has been consistently in favor of reducing market barriers in developed markets. Thus, Indonesia has always been promoting a position not to link trade issues with environmental and labor standards within the WTO regime. The most important fundamental ILO conventions and commitments to Multilateral Environmental Agreements have been ratified by Indonesia. The principle of common, but differentiated responsibilities holds for both issues. This calls for further pushing to eliminate trade restrictions for export goods in developed markets, while securing financial and technical assistance to improve and enforce domestic environmental and labor standards and regulations. Thus, Indonesia's future positions in the social clause and the environment debate are similar: de-link both issues from trade within the WTO regime and use instead the ILO and the various MEAs to address the issues. This means expanding exchange and collaboration between WTO and the ILO and the various Secretariats responsible for monitoring the implementations of MEAs. For the environment in particular, the current government position is to call for: Negotiations on the relationship between existing WTO rules and specific
trade obligations set out in MEAs. Negotiations should be limited in scope to the applicability of existing WTO
rules as among parties to the WTO in question. Establishing procedures for regular information exchange between MEA
Secretariats and the relevant WTO committees, and the criteria for granting of observer status.
Reductions or, as appropriate, elimination of tariff and non-tariff barriers to environmental goods and services.
Draft, not to be quoted 58

References Alejandra Cox Edwards. (1996) “Labor Regulations and Industrial Relations in
Indonesia.” World Bank Policy Research Working Paper, No. 1640, Washington, D. C.
Anderson, Kym and Mari Pangestu (1995), Agriculture and Rural Development in
Indonesia into the 21st Century, Centre for International Economic Studies, Seminar Paper no 95-05
Aswicahyono, Haryo, Raymond Atje and Tubagus Feridhanusetyawan (1999). "
Gender Dimensions of Globalization and Modern Sector employment in Indonesia." SEAPAT Working Paper No.5, ILO: Manila
Aswicahyono, Haryo and Titik Anas, Export Opportunities, paper presented for
East Asia Analytical Unit, 2000 Sharon Bessell (1999). " The Politics of Child Labor in Indonesia: Global Trends
and Domestic Policy." Pacific Affairs, Vol.72, No.3: pp.353-372 CSIS (1996). “ Trade and Environment Linkages: A Case Study from Indonesia.”
Unpublished country report for ASEAN and UNCTAD. Erwidodo and Tubagus Feridhanusetyawan (1997), Indonesia’s Agriculture:
Facing the APEC and WTO, The Indonesian Quarterly vo. XXV no 3, 1997
Feridhanusetyawan, Tubagus (2001), Indonesia’s trade policy and performance:
an overview, paper presented at the Seminar on Indonesian Economic Institution Building in a Global Economy, Jakarta (2001), also forthcoming in Indonesian Economic Institution Capacity Building
James Cotton (1999). " The 'Haze' Over Southeast Asia: Challenging the ASEAN
Mode of Regional Cooperation", Pacific Affairs, Vol 72, No. 3, pp.331-352.
GTZ (Gesellschaft fuer Technische Zusammenarbeit) (2001), " Market survey of
the Indonesian textile industry." Eschhorn, Germany. Hal Hill (1996). “ The Indonesian Economy since 1966: Southeast Asia’s
Emerging Giant.” Cambridge University Press: Cambridge. ILO (1999). " Konvensi ILO Yang Diratifikasi Indonesia." ILO/Departemen
Tenaga Kerja: Jakarta Christopher Elliott (2000). " Forest Certification: A Policy Perspective." Center
for International Forestry Research (CIFOR): Bogor. Tubagus Feridhanusetyawan (1999). " Security Implications of the Economic
Crisis for Indonesian Workers." CSIS: Jakarta
Draft, not to be quoted 59

Medelina K.Hendytio, Vidhyandika Moelyarto, Arya B.Gaduh and Tubagus Feridhanusetyawan 1999). " Indonesia: A Gender Review of Globalization, Legizlation, policies and Institutional Frameworks." SEAPAT Working Paper No.4, ILO: Manila
ICG (International Crisis Group) (2001). “ Indonesia: Natural Resources and Law
Enforcement.” Asia Report No. 29: Jakarta/Brussels Indonesia – UK Tropical Forest Management Programme (1999). “ Roundwood
supply and demand in the forest sector in Indonesia. Draft paper. Japan Environmental Council (Ed.) (2000). “ The State of the Environment in
Asia.” Springer: Insitute of Southeast Asian Studies, Singapore. Patrick Low (Ed.) (1992). “ International Trade and the Environment.” World
Bank Discussion papers. World Bank: Washington D.C. Chris Manning and Jayasuriya Sisira (1996). " Survey of Recent Developments."
Bulletin of Indonesian Economic Studies. Vol.32, 2, 1996. Nabiel Makarim, Minister of the Environment (2001). " Kebijakan lingkungan
hidup dalam pembangunan nasional untuk menghadapi liberalisasi perdagangan (Environmental policies in economic development within the context of trade liberalisation)." 8 October 2001, Minstry of Industry and Trade: Jakarta.
Manuel F. Montes and Francisco A. Magno (1999). " Trade and Environmental
Diplomacy: Strategic Options for ASEAN', Pacific Affairs, Vol.70, No.3, pp.351-372.
Natural Resource Management Project (NRMP) (1995). " A Study of the Natural
Resource Impact of Foreign Direct Investment in Indonesia. NRMP and BAPPENAS: Jakarta.
Neitzel, Harald and Landmann, Ute (1994). "Environmental Labelling Schemes
Abd Ecological Product Standards For Indonesian Export Products." Indonesian - German Government Cooperation, Advisory Assistance To The Ministry Of Trade. Duesseldorf, Jakarta 1994
Mari Pangestu (1996). " Social Clause and International Trade." Indonesian
Quarterly, Vol.XXIV/2: pp.128-139. Simon Tay and Daniel Esty (1996). “ Asian Dragons and Green Trade .” Times
Academic Press: National University of Singapore. Simon Tay (1999). " Trade, The Environment and Labour: Text, Insitutions and
Context." Unpublished draft paper based on a paper presented at the World Bank / PECC Seminar on the WTO, Manila, 19-20 July 1999.
Draft, not to be quoted 60

Kartadjoemena, Hassan (2001 a), Indonesia and the WTO: Facing the new millennium round and searching for a comprehensive trade policy, paper presented at the Seminar on Indonesian Economic Institution Building in a Global Economy, Jakarta (2001), also forthcoming in Indonesian Economic Institution Capacity Building
Kartadjoemena, Hassan (2001 b), Making Preparation for WTO Negotiations:
Key Issues for Indonesia, paper presented at the Seminar on Indonesian Economic Institution Building in a Global Economy, Jakarta (2001), also forthcoming in Indonesian Economic Institution Capacity Building
Pangestu, Mari (1996), Economic Reform, Deregulation and Privatization, Centre
for Strategic and International Studies, Jakarta Pangestu, Mari and Tubagus Feridhanusetyawan (1996), Liberalization of the
Agriculture Sector in Indonesia: External Pressures and Domestic Needs, paper presented in Conference on Food and Agriculture al Policy Challenges for Asia Pacific, in Manila, October 1-3, 1996
Rizal, Yose and Tubagus Feridhanusetyawan (2002) to get citation…. Stephenson, Sherry and Mari Pangestu (1996), Indonesia and the Emerging
Trading Environment, report prepared for the ADB Study of The Emerging Trading Environment and Developing Asia
UNEP (1995), "Criteria in Environmental Labelling : A Compatarative Analysis
Of Environmental Criteria In Selected Ecolabelling Schemes." Draft Paper. June 1995
World Trade Organization, Ministerial Conference, Fourth Session, Doha, 9-13
November 2001, Indonesian Ministerial Statement W.R. Boehning and Carmelo Noriel (1998). " Protecting Indonesian Migrant
Workers, with Special Reference to Private Agencies and Complaints Procedures." SEAPAT Working Paper No.3, ILO:Manila.
World Bank (1994) “ Indonesia: Environment and Development – Challenges for
the Future.” Washington D.C. World Bank (2001). “ Indonesia: Environment and Natural Resource
Management in a Time of Transition.” Washington D.C.
Draft, not to be quoted 61

Appendix Trade Reform during the crisis
No. Policy Action Target Date Status LOI no.
TARIFFS
1 Reduce by 5 percentage point tariffs on items currently subject to tariffs of 15 to 25 percent.
31-Mar-98 Done 2
2 Cut tariffs on all food items to a maximum of 5 percent. 1-Feb-98 Done 2 3 Reduce tariffs on non-food agricultural products by 5
percentage points. 1-Feb-98 Done 2
4 Gradually reduce tariffs on non-food agricultural products to amaximum of 10 percentage points.
2003 Under preparation
2
5 Reduce by 5 percentage point tariffs on chemical products. 1-Jan-98 Done 2 6 Reduce tariffs on steel/metal products by 5 percentage points. 1-Jan-98 Done 2 7 Reduce tariffs on chemical, steel/metal and fishery products to
5-10 percent. 2003 2
IMPORT RESTRICTIONS 8 Abolish import restrictions on all new and used ships. 1-Feb-98 Done 2 9 Phase out remaining quantitative import restrictions and other
non-tariff barriers. End-program 2
EXPORT RESTRICTIONS 10 Abolish export taxes on leather, cork, ores and waste
aluminum products. 1-Feb-98 Done 2
11 Reduce export taxes on logs, sawn timber, rattan and minerals to a maximum of 30 percent by April 15, 1998; 20 percent by end December 1998, 15 percent by end December 1999 and 10 percent by end December 2000
First Step by April 22, 1998
First step done
2
12 Phase in resource rent taxes on logs sawn timber and minerals. First Step by April 22, 1998
First step done
2
13 Replace remaining export taxes and levies by resource rent taxes as appropriate.
Over program period
2
14 Eliminate all other export restrictions Over program period
Under preparation
2
15 Remove ban on palm oil exports and replace by export tax of 40 percent. The level of the export tax will be reviewed for possible reduction, based on market prices and exchange rate and reduced to 10 percent by end December 1999.
22-Apr-98 Done. Tax raised to 60 percent in July
2
OTHER MEASURES Local Contents
16 Abolish local content regulations on motorvehichles 2000 done 1 17 Abolish local content regulations on dairy products. 1-Feb-98 Done 2
Free Trade Zone 18 Review the tax free status of the islands of Batam, Rempang
& Galang, based on the comprehensive feasibility study being undertaken. Defer any plans pending the completion of the study
Based on feasibility study to be completed by August 31, 1999. 12: Immediate.
11, 12
19 Review the effectiveness of policies for the Integrated Economic Development Zones (KAPETS), especially the fiscal concessions.
Based on study to be completed by December 31, 1999.
11
20 Start collecting value added tax from Batam island April 1, 2000. pending 12
Draft, not to be quoted 62

No. Policy Action Target Date Status LOI no.
21 Review the desirability of maintaining the income tax facilities and abolishing the indirect tax facilities for the Integrated Economic Development Zones (KAPETS). - Complete review
Complete review: Feb. 1, 2000, Implement measures: April 1, 2000
12
Custom Administration 22 Prepare draft amendments to the law on customs and issue
implementation regulations to provide for penalties & interest on unpaid duties & implementing short, issue oriented audits.
31-Oct-99 Done 11, 12
23 Develop & implement the plan to combat valuation fraud by (i) strengthening physical inspections; (ii) establishing special valuation units in the regions;(iii) undertaking special valuation audits; and (iv) developing a valuation database to help detect
31-Oct-99 Done 11, 12
24 Reduce exemptions to import tariffs on capital goods, rationalize & make tranparent the remaining exemptions.
April 1, 2000. 12
25 Dissolve restrictive marketing arrangements for cement, paper and plywood.
1-Feb-98 Done 2
26 Eliminate price controls on cement. 3-Nov-97 Done 2 27 Allow cement producers to export with only a general export
license. 1-Feb-98 Done 2
28 Free traders to buy, sell and transfer all commodities across district and provincial boundaries, including cloves, cashew nuts, and vanilla.
1-Feb-98 Done 2
29 Eliminate BPPC (Clove Marketing Board). 30-Jun-98 Done 2 30 Abolish quotas limiting the sale of livestock. 30-Sep-98 ? 2 31 Prohibit provincial governments from restricting trade within
and between provinces. 1-Feb-98 Done 2
32 Enforce prohibition of provincial and local-export taxes. Jan-98 Done 2 33 Take effective action to allow free competition in: 2
(i) importation of wheat, wheat flour, soybeans, and garlic; done 2 (ii) sale or distribution of flour; and done 2 (iii) importation and marketing of sugar. done 12
(iv) importation of rice done 6,12 Note: 1 = MEFP October 31, 1997 *structural
benchmark
2 = MEFP January 15, 1998 3 = SMEFP April 10, 1998 4 = SMEFP June 24, 1998 5 = MEFP July 29, 1998 6 = SMEFP September 11, 1998 7 = MEFP October 19,1998 8 = SMEFP November 13, 1998 9 = SMEFP March 16, 1999 10 = MEFP May 14,1999 11 = SMEFP July 22, 1999 12 = MEFP January 20, 2000. MEFP is Memorandum of Economic and Financial Policies SMEFP is Supplement to Memorandum of Economic and
Financial Policies
Source: IMF website
Draft, not to be quoted 63