regional co pollution over the indian-subcontinent and various transport pathways as observed by...
TRANSCRIPT

This article was downloaded by: [McMaster University]On: 16 December 2014, At: 06:53Publisher: Taylor & FrancisInforma Ltd Registered in England and Wales Registered Number: 1072954 Registeredoffice: Mortimer House, 37-41 Mortimer Street, London W1T 3JH, UK
International Journal of RemoteSensingPublication details, including instructions for authors andsubscription information:http://www.tandfonline.com/loi/tres20
Regional CO pollution over the Indian-subcontinent and various transportpathways as observed by MOPITTSachin D. Ghude a , G. Beig a , Pavan S. Kulkarni b , Vijay P.Kanawade c , Suvarna Fadnavis a , John J. Remedios c & S. H.Kulkarni aa Indian Institute of Tropical Meteorology , Pune, Maharashtra,411008, Indiab Geophysics Centre of Évora (CGE), University of Évora , 7000,Évora, Portugalc Earth Observation Science, Space Research Centre, Departmentof Physics and Astronomy , University of Leicester , Leicester, LE17RH, UKPublished online: 26 Jul 2011.
To cite this article: Sachin D. Ghude , G. Beig , Pavan S. Kulkarni , Vijay P. Kanawade , SuvarnaFadnavis , John J. Remedios & S. H. Kulkarni (2011) Regional CO pollution over the Indian-subcontinent and various transport pathways as observed by MOPITT, International Journal ofRemote Sensing, 32:21, 6133-6148, DOI: 10.1080/01431161.2010.507796
To link to this article: http://dx.doi.org/10.1080/01431161.2010.507796
PLEASE SCROLL DOWN FOR ARTICLE
Taylor & Francis makes every effort to ensure the accuracy of all the information (the“Content”) contained in the publications on our platform. However, Taylor & Francis,our agents, and our licensors make no representations or warranties whatsoever as tothe accuracy, completeness, or suitability for any purpose of the Content. Any opinionsand views expressed in this publication are the opinions and views of the authors,and are not the views of or endorsed by Taylor & Francis. The accuracy of the Contentshould not be relied upon and should be independently verified with primary sourcesof information. Taylor and Francis shall not be liable for any losses, actions, claims,proceedings, demands, costs, expenses, damages, and other liabilities whatsoever orhowsoever caused arising directly or indirectly in connection with, in relation to or arisingout of the use of the Content.

This article may be used for research, teaching, and private study purposes. Anysubstantial or systematic reproduction, redistribution, reselling, loan, sub-licensing,systematic supply, or distribution in any form to anyone is expressly forbidden. Terms &Conditions of access and use can be found at http://www.tandfonline.com/page/terms-and-conditions
Dow
nloa
ded
by [
McM
aste
r U
nive
rsity
] at
06:
53 1
6 D
ecem
ber
2014

International Journal of Remote SensingVol. 32, No. 21, 10 November 2011, 6133–6148
Regional CO pollution over the Indian-subcontinent and varioustransport pathways as observed by MOPITT
SACHIN D. GHUDE*†, G. BEIG†, PAVAN S. KULKARNI‡,VIJAY P. KANAWADE§, SUVARNA FADNAVIS†, JOHN J. REMEDIOS§
and S. H. KULKARNI††Indian Institute of Tropical Meteorology, Pune, Maharashtra 411008, India
‡Geophysics Centre of Évora (CGE), University of Évora, 7000 Évora, Portugal§Earth Observation Science, Space Research Centre, Department of Physics and
Astronomy, University of Leicester, Leicester LE1 7RH, UK
(Received 12 February 2010; in final form 16 June 2010)
We used day-side Measurement of Pollution in the Troposphere (MOPITT) carbonmonoxide (CO) retrievals (2000–2007) to examine the regional CO emission and itstransport pathways during the summer/winter monsoon, with a specific focus onthe Indian-subcontinent. It is observed that MOPITT CO retrievals at 850 hPalevel in general show large scale features of CO emission in India, as reflected inthe bottom-up inventory. In particular, high CO mixing ratios over the easternnorth-eastern part of India, along the Indo-Gangetic (IG) region, and low COmixing ratios over central India are generally captured from the MOPITT data.A strong plume with enhanced CO mixing ratios at 350 hPa is observed duringthe summer monsoon, demonstrating large scale vertical transport of the bound-ary layer CO from the Indian region into the upper troposphere. During winteroutflow CO from the Indian region is found to be transported over the ArabianSea and Bay of Bengal and reaches up to Saudi Arabia and north-eastern Africa.It is observed that emissions from Southeast Asia and the eastern north-easternIndian region have the greatest impact over the Bay of Bengal and the easternIndian Ocean, while emissions from the rest of India dominate over the ArabianSea and the western Indian Ocean.
1. Introduction
Carbon monoxide (CO) contributes to air pollution, acts as a precursor to tropo-spheric ozone and is a sink for hydroxyl (OH) radicals. The photochemical oxidizationof CO and hydrocarbon in the presence of nitrogen oxide (NOx) is a major sourceof tropospheric ozone at both regional and global scales (Crutzen 1988, 1995,Kondratyev and Varotsos 1996, Varotsos et al. 2003, 2005). It is a good indicatorfor sources and the distribution of air pollution in the atmosphere. Carbon monox-ide is emitted into the atmosphere by biomass burning activities and by various otheranthropogenic activities. Substantial amounts of CO are also produced in the atmo-sphere through the incomplete oxidation of methane and other hydrocarbons. Carbon
*Corresponding author. Email: [email protected]
International Journal of Remote SensingISSN 0143-1161 print/ISSN 1366-5901 online © 2011 Taylor & Francis
http://www.tandf.co.uk/journalshttp://dx.doi.org/10.1080/01431161.2010.507796
Dow
nloa
ded
by [
McM
aste
r U
nive
rsity
] at
06:
53 1
6 D
ecem
ber
2014

6134 S. D. Ghude et al.
monoxide can be measured from space and can be used to identify sources of air pol-lution (Deeter et al. 2004, Buchwitz et al. 2007, Kar et al. 2008). With a troposphericlifetime of weeks to ∼2 months, CO can be used to trace the advection of polluted airmasses.
Quantifying the continental outflow of CO, intercontinental transport and varioustransport pathways from South Asia using the Chemical Transport Model (CTM) hasbeen the focus of recent studies, because of strong industrial activities and biofuelburning in this region (Lelieveld et al. 2001, Heald et al. 2003, Liu et al. 2003). Someof the recent studies have revealed that deep convection associated with the south-west monsoon often lifts the boundary layer pollution from South Asia into the uppertroposphere followed by transport to the Middle East and Mediterranean (Li et al.2001, Lelieveld et al. 2002, Lawrence et al. 2003). Phadnis et al. (2002) showed thatSouth and Southeast Asian emissions have an impact on the Indian Ocean during thewinter–spring monsoonal outflow. Most of these studies relied on a combination of aCTM, aircraft measurements and ground based measurements. Space based measure-ments made by Measurements of Pollution in the Troposphere (MOPITT), since 2001,have further greatly enhanced our knowledge of pollution transport. The MOPITTmeasurements have been used effectively to study the intercontinental transport of pol-lution (Heald et al. 2003, Edwards et al. 2006), CO plumes from forest fires (Liu et al.2005b) and convective transport of pollution (Kar et al. 2004). Petron et al. (2004)and Kopacz et al. (2007) have used MOPITT measurements for inverse modelling toquantify surface sources of CO globally. More recently Kar et al. (2008) have shownthat MOPITT retrievals do provide information on lower tropospheric CO in selectedcontinental regions with strong thermal contrast and could be useful for pollutionstudies.
India is the second largest contributor of various emissions in Asia. Rapid indus-trialization, urbanization and traffic growth in India over the past two decades arebelieved to be responsible for increasing emissions of gaseous pollutants (Akimoto2003, Ghude et al. 2008, 2009a). Major sources of energy in India include coal,petroleum, biomass, nuclear power and hydropower. Combustion of these fuels isthe main source of pollution in the natural environment. The major source of COemission in India is traditional bio-fuel use, which is almost 50% of the total IndianCO emission (Dalvi et al. 2006). Coal is the primary fuel in thermal power plants,iron and cements industries, and contributes 24% of the total CO emissions in India(Garg et al. 2001). Gasoline and diesel are the primary fuels for automobiles and con-tribute about 10% of the total CO emission (Dalvi et al. 2006). The CO emission fromcrop residue burning contributes about 17% of the total CO emission. The varyingsectoral growth rates, consumption patterns and resource endowments in India haveled to widely different regional and sectoral emission distributions (Garg et al. 2001).Pockets of heavy pollution are created by emissions from major industrial zones andmega-cities in India.
Here, we use 8 years of space-based observations of tropospheric CO from theMOPITT instrument to investigate the regional CO pollution over India. We exam-ine spatial structures in the distribution of CO in the lower tropospheric MOPITTretrievals (850 hPa) and assess their consistency with CO sources in India as reflectedin the bottom-up emission inventory. We also examine various pollution trans-port pathways from the Indian-subcontinent by investigating vertical and horizontaltransport of CO during the summer and winter monsoon seasons.
Dow
nloa
ded
by [
McM
aste
r U
nive
rsity
] at
06:
53 1
6 D
ecem
ber
2014

Regional CO pollution 6135
2. Data
The MOPITT remote sensing instrument, onboard the National Aeronautics andSpace Administration (NASA) Earth Observing System (EOS) Terra satellite, provedthe feasibility of inferring tropospheric CO from upwelling infrared (IR) radiationnear 4.7 µm measurements by a nadir viewing gas-correlation radiometry. The COvertical profiles are reported at 7 levels (1000, 850, 700, 500, 350, 250 and 150 hPalevels), along with the total columns with near global coverage within 3 days. TheMOPITT CO mixing ratios at 7 levels are not independent of one another. However,MOPITT can generally distinguish between the lower and upper tropospheres (Karet al. 2004, 2008, Deeter et al. 2007).
We have used MOPITT version 3 retrievals at 1◦ × 1◦ resolution at 850, 700, 500,350, 250 and 150 hPa levels in this study. The MOPITT retrievals used in this analysishave been validated using in situ aircraft measurements and the results show goodagreements with the average bias being less than 20 ppb at all the levels (Emmonset al. 2004). As discussed in Kar et al. (2004) we have used only those profiles having‘percent a priori’ less than 50% in the retrievals at 700, 500 and 350 hPa levels.
3. Results
3.1 Spatial distribution
3.1.1 High CO mixing ratios over the Indo-Gangetic region. The MOPITT distri-bution of CO mixing ratios at 850 hPa level over the Indian region for the month ofMay, averaged for the 8-year period (2000–2007), is shown in figure 1(a). A signifi-cant gradient in CO mixing ratios between the southern and northern parts of Indiais clearly observed in the MOPITT data. As expected, CO mixing ratios are observedhighest over the northern plain of India, along the Indo-Gangetic (IG) region. Recentstudies have also reported that there is a steep gradient in the tracer concentrationsover the IG regions in comparison to other parts of India, with much higher valuesbeing reported over the IG region obtained by both observed and modelling studies(Fishman et al. 2003, Ghude et al. 2008, 2009b, Kar et al. 2008, Kulkarni et al. 2008).Carbon monoxide mixing ratios of the order of 185–220 ppb are observed over the IGregion, whereas around 145–180 ppb are observed over the rest of the Indian region.A large CO emission flux observed over the IG region can be explained in terms ofrural bio-fuel burning due to a large population density and an extensive rural pop-ulation in this area. In addition, large and congested industrial activities also lead toCO emission in this region.
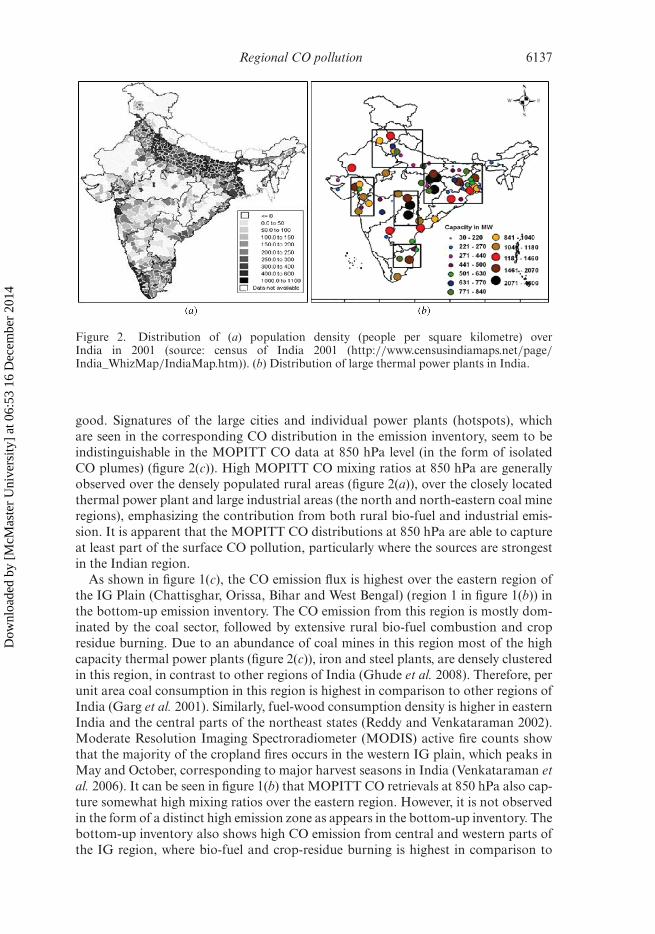
Figure 2(a) and (b) shows the population density (people per square kilo-metre during 2001) and the locations of major thermal power plants in India,respectively. Population density is highest in the IG region. Nearly 80% of thepopulation of the IG region lives in the rural areas (census of India 2001;http://www.censusindiamaps.net/page/India_WhizMap/IndiaMap.htm). In India,bio-fuel is mainly used for the household activities in rural areas. Therefore, bio-fuelusage in the form of fuel wood, crop residue and cow dung burning is expected tobe intense in this region. Similarly, industrial activities (figure 2(b)) are also denselyclustered in this region (Ghude et al. 2008) and therefore, coal and oil consumptionis also expected to be intense in comparison to other regions of India. This includesfuel consumption for energy in the utilities (power plants), industrial, domestic and
Dow
nloa
ded
by [
McM
aste
r U
nive
rsity
] at
06:
53 1
6 D
ecem
ber
2014

6136 S. D. Ghude et al.
Figure 1. Distribution of day-side Measurement of Pollution in the Troposphere (MOPITT)carbon monoxide (CO) mixing ratios (ppb) at 850 hPa over the Indian subcontinent (a) averagedduring May 2000–2007, (b) averaged for 2000–2007. (c) Distribution of CO emission in thebottom-up inventory from all sources for the year 2001. Adapted from Dalvi et al. (2006), usedwith permission.
transportation sectors, and feedstock/raw material in the industrial processes. Themajority of energy consumption in the utilities is from coal consumption and in thecase of transportation it is from diesel consumption. Also, annual biomass burning(forest and crop waste) in this region is significantly higher (peaking March–April–May) than the other regions of India (Venkataraman et al. 2006). A combination ofthese different sectors leads to high CO emission flux from the IG region.
3.1.2 Comparison between MOPITT data and emission inventory. The 8-year aver-aged distribution of MOPITT CO mixing ratios at 850 hPa level is shown in figure1(b). For comparison, figure 1(c) shows the geographical distribution of the total COemission in the Indian region derived from the bottom-up inventory (figure 1(c)). Thebottom-up inventory shown in figure 1(c) is for the year 2001 only. Spatial structuresin the distribution of CO in the lower tropospheric MOPITT retrievals (850 hPa) overIndia are somewhat similar to the total CO emission pattern seen in the bottom-upinventory, although overall comparison between the two quantities is not reasonably
Dow
nloa
ded
by [
McM
aste
r U
nive
rsity
] at
06:
53 1
6 D
ecem
ber
2014
Regional CO pollution 6137
Figure 2. Distribution of (a) population density (people per square kilometre) overIndia in 2001 (source: census of India 2001 (http://www.censusindiamaps.net/page/India_WhizMap/IndiaMap.htm)). (b) Distribution of large thermal power plants in India.
good. Signatures of the large cities and individual power plants (hotspots), whichare seen in the corresponding CO distribution in the emission inventory, seem to beindistinguishable in the MOPITT CO data at 850 hPa level (in the form of isolatedCO plumes) (figure 2(c)). High MOPITT CO mixing ratios at 850 hPa are generallyobserved over the densely populated rural areas (figure 2(a)), over the closely locatedthermal power plant and large industrial areas (the north and north-eastern coal mineregions), emphasizing the contribution from both rural bio-fuel and industrial emis-sion. It is apparent that the MOPITT CO distributions at 850 hPa are able to captureat least part of the surface CO pollution, particularly where the sources are strongestin the Indian region.
As shown in figure 1(c), the CO emission flux is highest over the eastern region ofthe IG Plain (Chattisghar, Orissa, Bihar and West Bengal) (region 1 in figure 1(b)) inthe bottom-up emission inventory. The CO emission from this region is mostly dom-inated by the coal sector, followed by extensive rural bio-fuel combustion and cropresidue burning. Due to an abundance of coal mines in this region most of the highcapacity thermal power plants (figure 2(c)), iron and steel plants, are densely clusteredin this region, in contrast to other regions of India (Ghude et al. 2008). Therefore, perunit area coal consumption in this region is highest in comparison to other regions ofIndia (Garg et al. 2001). Similarly, fuel-wood consumption density is higher in easternIndia and the central parts of the northeast states (Reddy and Venkataraman 2002).Moderate Resolution Imaging Spectroradiometer (MODIS) active fire counts showthat the majority of the cropland fires occurs in the western IG plain, which peaks inMay and October, corresponding to major harvest seasons in India (Venkataraman etal. 2006). It can be seen in figure 1(b) that MOPITT CO retrievals at 850 hPa also cap-ture somewhat high mixing ratios over the eastern region. However, it is not observedin the form of a distinct high emission zone as appears in the bottom-up inventory. Thebottom-up inventory also shows high CO emission from central and western parts ofthe IG region, where bio-fuel and crop-residue burning is highest in comparison to
Dow
nloa
ded
by [
McM
aste
r U
nive
rsity
] at
06:
53 1
6 D
ecem
ber
2014

6138 S. D. Ghude et al.
other parts of India. However, distinct high emission zones in central and westernparts of the IG region are not observed in the MOPITT CO distributions.
Figure 1(c) also shows relatively high CO emission from central and easternMaharashtra, Karnataka, Andra Pradesh, Tamil Nadu and Orissa (region 2 in figure1(b)). The CO emission from this region is mostly attributed to the bio-fuel combus-tion and crop-residue burning (Dalvi et al. 2006) followed by coal combustion andtransportation. The MODIS active fire counts also show that the majority of the crop-land fires occurs in this region during the harvest seasons (Venkataraman et al. 2006).A similar type of enhancement is also observed in MOPITT CO retrievals at 850 hPaover this region, but a comparison between the two quantities is not reasonably goodfor this region. However, low CO mixing ratios over the central Indian state (region 3)observed by MOPITT at 850 hPa level is generally consistent with the region of lowCO emission observed in the bottom-up inventory. Low CO emission from this regionis attributed to the absence of large industrial and transportation activities. In addi-tion, population density, bio-fuel combustion density, per unit area coal consumptionand crop-residue burning is low in this region in comparison to other regions of India(Dalvi et al. 2006, Ghude et al. 2008).
Thus a comparison between MOPITT CO at 850 hPa and the bottom-up inventorydemonstrates that qualitatively MOPITT CO retrievals at 850 hPa level capture onlythe broad features of regional CO emission in India, particularly where the sources arestrongest. A direct one-to-one correlation between CO emission (bottom-up inven-tory) with concentration (MOPITT) may not always be expected. The reason for thisdisagreement might be related to the lifetime of CO, local meteorology and data reso-lution. The distribution of CO shown in figure 1(c) (bottom-up inventory) is for 2001.Emission may have been changed substantially since 2001. The lifetime of CO is largeenough in the troposphere to be transported from the source region and therefore,transport cannot be neglected in the observed data. However, CO emissions shown infigure 1(c) have been deduced from the bottom-up inventory (which only aggregatesfuel combustion data and emission factors) (Dalvi et al. 2006) where transport is notaccounted for. Carbon monoxide emissions have strong seasonality but the emissioninventory shown in figure 1(c) is an annual average. Also, meteorological conditionsvary strongly (related to the monsoonal circulation in India), which has a large impacton the CO concentrations, even if emissions were constant. Keeping these facts inmind we do not expect a point-to-point agreement between the observed and emissioninventory CO distribution.
3.2 Convective transport
In summer, South Asia is subjected to the influence of Asian summer monsoon (ASM)and deep convection associated with the ASM often lifts the pollutant in the boundarylayer into the mid and upper tropospheres. To examine the effect of deep convec-tion, vertical profiles of CO mixing ratio are analysed over India. Measurements byMOPITT are generally sensitive to CO in the upper troposphere and can distinguishbetween the lower, mid and upper tropospheres (Deeter et al. 2004, Emmons et al.2004, Kar et al. 2004). We used CO retrievals at 850, 700, 500, 350, 250 and 150hPa along with the ‘percent a priori’ diagnostic available with the retrieved data. Onlythose profiles having ‘percent a priori’ less than 50% in the retrievals are used to plot avertical distribution of CO, as suggested in Kar et al. (2004).
Dow
nloa
ded
by [
McM
aste
r U
nive
rsity
] at
06:
53 1
6 D
ecem
ber
2014

Regional CO pollution 6139
Eight years averaged distribution of MOPITT CO mixing ratios at 350 hPa duringthe monsoon season (June–September) is shown in figure 3(a) for the ASM region.The effect of convection is clearly noticed over the Indian region. At 350 hPa theCO maximum is located over India and Southeast Asia, nearly overlying the regionof maximum deep convection. High CO mixing ratios (∼110–135 ppb) are seen overthe central IG region, northeast region and Bay of Bengal region. The observed COdistribution is quite similar to the Microwave Limb Sounder (MLS) observed CO at147 hPa, which shows a broad maximum (∼130 ppb) over northeast India, TibetanPlateau and South China associated with deep convection (Li et al. 2005a, Park et al.2009). The eastern north-eastern region is dominated by a strong low-level horizontalconvergent flow from southwest and the deep convection shows a maximum over theBay of Bengal and South China Sea, which is persistent throughout the monsoonseason (Park et al. 2009). It can be seen in figure 1 that the CO emission flux is highestover the eastern part of India. Some of the recent studies show that there is also somecontribution from deep convection associated with intense thunderstorm activities inthe eastern north-eastern region of South Asia during the monsoon season (Manoharet al. 1999). From the aircraft based measurements Dickerson et al. (1987) showedthat rapid convection associated with thunderstorms lead to the enhancement of COmixing ratios in the upper troposphere. This suggests that deep convective activitytogether with the high CO emission over this region is likely to contribute to the highCO mixing ratios observed at 350 hPa over India during the monsoon season.
Figure 3. (a) Day-side MOPITT CO mixing ratios (ppb) at 350 hPa for June–Septemberaveraged during 2000–2007 over the Asian summer monsoon region. (b) Pressure-latitudecross section plot of day-side MOPITT CO mixing ratios for June–September (mean 2000–2007) between 65
◦E–100
◦E (essentially Indian region). (c) Pressure-longitude cross section plot
of vertical velocities (omega, in Pascal s−1) for June–September (mean 2000–2007) between0
◦N–35
◦N (positive omega shows vertical motion).
Dow
nloa
ded
by [
McM
aste
r U
nive
rsity
] at
06:
53 1
6 D
ecem
ber
2014

6140 S. D. Ghude et al.
Figure 3. (Continued.)
Dow
nloa
ded
by [
McM
aste
r U
nive
rsity
] at
06:
53 1
6 D
ecem
ber
2014
Regional CO pollution 6141
To better illustrate the convective transport of CO over India, we show the aver-age MOPITT vertical profiles in figure 3, following the analysis of Kar et al. (2004).From June to September the South Asian region (India, Pakistan and the Bay ofBengal area) is subject to the ASM. The ASM is associated with one of the largestupper tropospheric anti-cyclones on Earth present from May to September (Hsu etal. 1999). Winds during the ASM are associated with a large scale cyclonic vortic-ity in the lower troposphere and Tibetan anticyclone in the upper troposphere. Thislow level convergence plays an important role in lifting pollution upwards. The south-westerly flow over Bangladesh and northern India encounters the southern slope ofthe Himalayas, resulting in orographic and convective lifting of pollution in north-east India and Bangladesh. Figure 3(b) shows the pressure latitude cross-section ofdaytime MOPITT retrieved CO over the region 65◦–100◦ E (essentially the Indianregion) during June to September, averaged for the 8-year (2000–2007) period. Theintense convective lifting of CO and its gradual transport towards lower latitudes inthe mid troposphere is noticed. On the northern side of India, there is a plume of highCO from the surface up to the mid troposphere, with over 110 ppb of CO found at350 hPa between 22◦–35◦ N. Gradual transport towards the lower latitude in the midtroposphere results from the divergence of CO out of the convective region by largescale circulation in the mid troposphere and anticyclonic circulation in the upper tro-posphere during the summer monsoon. A much weaker plume is also seen over thesouthern Indian (15◦–21◦ N) region. Figure 3(c) shows the average pressure latitudecross-section of vertical velocities (omega) during the monsoon season (2000–2007average) over the Indian region. As seen, in the monsoon (June–September) verticalvelocities are large and positive (upwards motion) from the surface to approximately650 hpa in the region between 23◦–33◦ N. Above 650 hPa the upwards motion is com-parably weaker. The same feature also appeared over the region between 15◦– 21◦N, however a much weaker positive upward motion is seen. Figure 3(a), (b) and (c)thus suggest that high CO mixing ratios within the mid-troposphere during the ASMare predominantly due to large scale convective lifting from the eastern north-easternregion of India associated with the ASM.
3.3 Horizontal transport
The meteorology over the Indian-subcontinent is influenced by the existence of twomajor monsoonal systems characterized by a complete reversal of the low level winds.The wintertime (December–March) flow from South Asia is responsible for transportbetween the Indian-subcontinent and the Indian Ocean. In contrast, the summer mon-soon (June–September) brings clean marine air from the Indian Ocean to much of theIndian landmass.
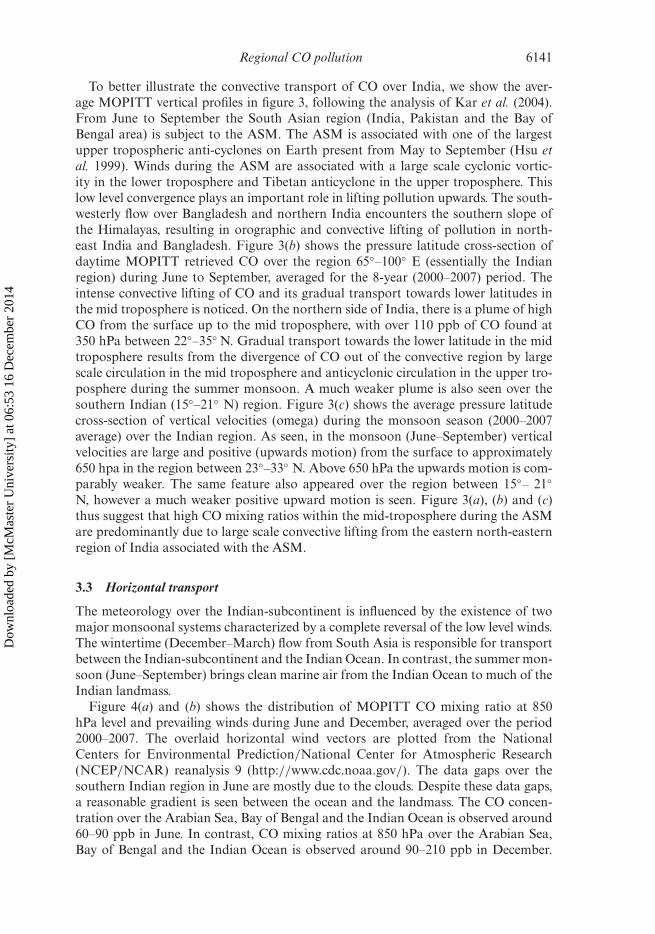
Figure 4(a) and (b) shows the distribution of MOPITT CO mixing ratio at 850hPa level and prevailing winds during June and December, averaged over the period2000–2007. The overlaid horizontal wind vectors are plotted from the NationalCenters for Environmental Prediction/National Center for Atmospheric Research(NCEP/NCAR) reanalysis 9 (http://www.cdc.noaa.gov/). The data gaps over thesouthern Indian region in June are mostly due to the clouds. Despite these data gaps,a reasonable gradient is seen between the ocean and the landmass. The CO concen-tration over the Arabian Sea, Bay of Bengal and the Indian Ocean is observed around60–90 ppb in June. In contrast, CO mixing ratios at 850 hPa over the Arabian Sea,Bay of Bengal and the Indian Ocean is observed around 90–210 ppb in December.
Dow
nloa
ded
by [
McM
aste
r U
nive
rsity
] at
06:
53 1
6 D
ecem
ber
2014
6142 S. D. Ghude et al.
Figure 4. Distribution of day-side MOPITT CO mixing ratios (ppb) at 850 hPa averagedduring 2000–2007 (a) for June (b) for December. (c) Increase in day-side MOPITT CO mix-ing ratios in December in comparison to June averaged for 2000–2007. (d) Pressure-longitudecross section plot of vertical velocities (omega, in Pascal s−1) for December (mean 2000–2007)between 0
◦N–35
◦N (negative omega shows downwards motion). Horizontal wind vectors from
the National Centers for Environmental Prediction/National Center for Atmospheric Research(NCEP/NCAR) reanalysis 9 (http://www.cdc.noaa.gov/) are overlaid.
Dow
nloa
ded
by [
McM
aste
r U
nive
rsity
] at
06:
53 1
6 D
ecem
ber
2014

Regional CO pollution 6143
Figure 4. (Continued.)
We find that during December, CO over the Indian Ocean north of the Inter TropicalConversion Zone (ITCZ) is concentrated in the marine boundary layer. This is dueto the fact that vertical velocities are negative and much weaker (downward motion)during December over almost the entire region, as seen in figure 4(d). This inhibits thevertical transport of the surface level CO in the mid and upper tropospheres.
Dow
nloa
ded
by [
McM
aste
r U
nive
rsity
] at
06:
53 1
6 D
ecem
ber
2014

6144 S. D. Ghude et al.
As our focus is primarily to demonstrate the transport of CO during the wintermonsoon, in figure 4(c) we plotted the difference between December and June COmixing ratios with prevailing winds during December. Figure 4(c) shows the impactof emission from South Asia on air quality over the surrounding Ocean. A clear tran-sition between the pristine and polluted atmosphere is observed during the wintermonsoon. When compared to June, CO mixing ratios over the majority of the Bayof Bengal area are increased by about 80–110 ppb in December. Over the ArabianSea, it increases up to 100 ppb near the coast and 60–80 ppb over the rest of theocean. As depicted in figure 4(b) and (c), the winds at the 850 hPa level over theBay of Bengal are mostly from the eastern north-eastern part of India (IG plume),Bangladesh and Southeast China (Southeast Asia plume) to the ITCZ. Over the west-ern Bay of Bengal, observed CO mixing ratios are mostly emitted from the IG plainof India and transported via the IG plume. Strong subsidence and lighter winds overwestern Bengal in the winter prevent venting of low altitude pollution to the higheraltitudes, accumulating it close to the source region. This makes it more suscepti-ble to transport effects by moderately high easterly winds (Di Girolamo et al. 2004),as can be seen in figure 4(b) and (c). Moving south towards the Indian Ocean, theobserved CO mixing ratios are a combined contribution from those transported viathe IG plume and the Southeast Asia plume. It is therefore evident that observedCO over the Bay of Bengal is mostly outflow towards the ITCZ from these threeregions.
In contrast, the surface flow over the Arabian Sea brings air masses from South Asia(figure 4(b) and (c)). Over the Arabian Sea and the western Indian Ocean observed COis emitted from the north-western region, central IG region and most of South Asia(transported via the Bombay plume). It can be seen from figure 4(b) and (c) that theprevailing northeasterly winds during the winter monsoon can transport South Asianpollution to Saudi Arabia and north-eastern Africa. However, it should be noted herethat the Southeast Asian CO plume continues across southern India and the north-ern Indian Ocean, out over the western Indian Ocean through persistent northeasterlyand easterly air flows. This implies that the CO mixing ratios observed over north-eastern Africa are influenced by the CO mixing ratios transported from South Asiaand Southeast Asia (of the order of 30–70 ppb, with larger contributions maybe fromSouth Asia). Over the south of the equator, up to 5◦ S, CO mixing ratios are increasedby about 20–40 ppb. This suggests that the wintertime flow from South Asia is respon-sible for cross-equatorial transport between the polluted north and pristine southaffected by eddies at the ITCZ.
To see the impact of the summer monsoon on the CO mixing ratios at 850 hPa, wehave plotted the difference between the June and December CO mixing ratios withprevailing winds during June (figure 5). During the summer monsoon CO concen-tration is decreased (in June compared to December) by about 60–100 ppb over theArabian Sea and about 100 ppb over much of the Bay of Bengal (except near thecoastal area). Over the southern part of India CO concentration is decreased by about80–100 ppb, whereas over the central and northern parts of India it is decreased byabout 10–40 ppb. During the summer monsoon the South Asian region is dominatedby the large influx of cleaner surface marine air (southwesterly) from the Indian Ocean(see the wind vectors in figure 4(a)). This drastically reduces the possible presence ofCO transported from the distance sources.
Dow
nloa
ded
by [
McM
aste
r U
nive
rsity
] at
06:
53 1
6 D
ecem
ber
2014

Regional CO pollution 6145
Figure 5. Decrease in day-side MOPITT CO mixing ratios in June in comparison toDecember averaged for 2000–2007.
4. Conclusion
In this study, we show that the MOPITT CO retrievals can be used to identify largescale pollution features over the Indian-subcontinent. The MOPITT CO retrievals at850 hPa show large CO emission from the IG region. Spatial structures in the distri-bution of CO mixing ratios in MOPITT retrievals at 850 hPa over India are foundsomewhat similar to the total CO emission pattern seen in the bottom-up inventory,although overall comparison between the two quantities is not reasonably good. Itis apparent that the MOPITT CO distributions are able to capture at least part ofthe surface CO pollution, particularly where the sources are strongest in the Indianregion. We have also presented evidence that MOPITT CO daytime retrievals areable to provide significant information on the vertical transport of CO associatedwith the deep convective activities during the ASM and horizontal transport duringthe winter monsoon. A strong plume with enhanced CO concentration at 350 hPais seen during the ASM. It can be concluded from this study that the developmentof convective activity associated with the ASM leads to large scale vertical transportof the boundary layer CO from the Indian region into the upper troposphere. Wefind that during the winter outflow, CO over the Indian Ocean north of the ITCZis concentrated in the marine boundary layer and can reach up to Saudi Arabia andnorth-eastern Africa. South Asian emission dominates over the Arabian Sea and thewestern Indian Ocean, whereas emission from the eastern north-eastern Indian regionand Southeast Asia has the greatest impact over the Bay of Bengal and Eastern IndianOcean.
Dow
nloa
ded
by [
McM
aste
r U
nive
rsity
] at
06:
53 1
6 D
ecem
ber
2014

6146 S. D. Ghude et al.
AcknowledgementsThe authors are thankful to the Director, IITM for his encouragement during theprogress of the work. The MOPITT CO data were obtained from the NASA LangleyResearch Center, Atmospheric Science Data Center. One of the authors (Pavan S.Kulkarni) is financed through project ‘SPATRAM-MIGE Polar Project’, funded bythe Portuguese Science Foundation – FCT.
ReferencesAKIMOTO, H., 2003, Global air quality and pollution. Science, 302, pp. 1716–1719.BUCHWITZ, M., KHLYSTOVA, I., BOVENSMANN, H. and BURROWS, J.P., 2007, Three years of
global carbon monoxide from SCIAMACHY: comparison with MOPITT and firstresults related to the detection of enhanced CO over cities. Atmospheric ChemistryPhysics, 7, pp. 2399–2411.
CRUTZEN, P.J., 1988, Tropospheric ozone: an overview. In Tropospheric Ozone, I.S.A. Isaksen(Ed.), pp. 3–32 (Dordrecht: D. Reidel).
CRUTZEN, P.J., 1995, Ozone in troposphere. In Composition, Chemistry, and Climate of theAtmosphere, H.B. Singh (Ed.), pp. 349–399 (New York: Van Nostrand Reinhold).
DALVI, M., BEIG, G., PATIL, U., KAGINALKAR, A., SHARMA, C. and MITRA, A.P., 2006, A GISbased methodology for gridding large scale emission inventories: application to carbon-monoxide emissions over Indian region. Atmospheric Environment, 40, pp. 2995–3007.
DEETER, M.N., EDMONDS, L.K., EDWARDS, D.P. and GILLE, G.C., 2004, Vertical resolutionand information content of CO profiles retrieved by MOPITT. Geophysical ResearchLetters, 31, p. L15112, doi: 10.1029/2004GL020235.
DEETER, M.N., EDWARDS, D.P., GILLE, J.C. and DRUMMOND, J.R., 2007, Sensitivity ofMOPITT observations to carbon monoxide in the lower troposphere. Journal ofGeophysical Research, 112, p. D24306, doi: 10.1029/2007JD008929.
DI GIROLAMO, L., BOND, T.C., BRAMER, D., DINER, D.J., FETTINGER, F., KAHN, R.A.,MARTONCHIK, J.V., RAMANA, M.V., RAMANATHAN, V. and RASCH, P.J., 2004,Analysis of multi-angle imaging spectroradiometer (MISR) aerosol optical depths overgreater India during winter 2001–2004. Geophysical Research Letters, 31, p. L23115,doi: 10.1029/2004GL021273.
DICKERSON, R.R., HUFFMAN, G.J., LUKE, W.T., NUNNERMACKER, L.J., PICKERING, K.E.,LESLIE, A.C.D., LINDSEY, C.G., SLINN, W.G.N., KELLY, T.J., DAUM, P.H., DELANY,A.C., GREENBERG, J.P., ZIMMERMAN, P.R., BOATMAN, J.F., RAY, J.D. and STEDMAN,D.H., 1987, Thunderstorms: an important mechanism in the transport of air pollutants.Science, 235, pp. 460–465.
EDWARDS, D.P., EMMONS, L.K., GILLE, J.C., CHU, A., ATTIE J.L., GIGLIO, L., WOOD, S.W.,HAYWOOD, J., DEETER, M.N., MASSIE, S.T., ZISKIN, D.C. and DRUMMOND, J.R., 2006,Satellite-observed pollution from Southern Hemisphere biomass burning. Journal ofGeophysical Research, 111, p. D14312.
EMMONS, L.K., DEETER, M.N., GILLE, J.C., EDWARDS, D.P., ATTIÉ, J.-L., WARNER, J., ZISKIN,D., FRANCIS, G., KHATTATOV, B., YUDIN, V., LAMARQUE, J.-F., HO, S.-P., MAO, D.,CHEN, J.S., DRUMMOND, J., NOVELLI, P., SACHSE, G., COFFEY, M. T., HANNIGAN,J.W., GERBIG, C., KAWAKAMI, S., KONDO, Y., TAKEGAWA, N., SCHLAGER, H., BAEHR,J. and ZIEREIS, H., 2004, Validation of measurements of pollution in the tropo-sphere (MOPITT) CO retrievals with aircraft in situ profiles. Journal of GeophysicalResearch, 109, D03309, doi: 10.1029/2003JD004101.
FISHMAN, J., WOZNIAK, A.E. and CREILSON, J.K., 2003, Global distribution of troposphericozone from satellite measurements using the empirically corrected tropospheric ozoneresidual technique: identification of the regional aspects of air pollution. AtmosphericChemistry Physics, 3, pp. 893–907.
Dow
nloa
ded
by [
McM
aste
r U
nive
rsity
] at
06:
53 1
6 D
ecem
ber
2014
Regional CO pollution 6147
GARG, A., SHUKLA, P.R., BHATTACHARYA, S. and DADHWAL, V.K., 2001, Subregion (district)and sector level SO2 and NOX emissions for India: assessment of inventories andmitigation flexibility. Atmospheric Environment, 35, pp. 703–713.
GHUDE, S.D., FADNAVIS, S., BEIG, G., POLADE, S.D. and VAN DER A, R.J., 2008, Detection ofsurface emission hot spots, trends, and seasonal cycle from satellite-retrieved NO2 overIndia. Journal of Geophysical Research, 113, D20305, doi: 10.1029/2007JD009615.
GHUDE, S.D., JAIN, S.L., ARYA, B.C., BEIG, G., AHAMMED, Y.N., KUMAR, A. and TYAGI, B.,2009b, Ozone in ambient air at tropical mega city, Delhi: characteristics, trends andcumulative ozone exposure indices. Journal of Atmospheric Chemistry, 60, pp. 237–252,doi: 10.1007/s10874-009-9119-4.
GHUDE, S.D., VAN DER A, R.J., BIEG, G., FADNAVIS, S. and POLADE, S.D., 2009a, Global distri-bution of tropospheric NO2 and its trend during past decade over major source regions.Environmental Pollution, 156, pp. 1873–1878, doi: 10.1016/j.envpol.2009.01.013.
HEALD, C.L., JACOB, D.J., FIORE, A.M., EMMONS, L.K., GILLE, J.C., DEETER, M.N., WARNER,J., EDWARDS, D.P., CRAWFORD, J.H., HAMLIN, A.J., SACHSE, G.W., BROWELL, E.V.,AVERY, M.A., VAY, S.A., WESTBERG, D.J., BLAKE, D.R., SINGH, H.B., SANDHOLM, S.T.,TALBOT, R.W. and FUELBERG, H.E., 2003, Asian outflow and trans-Pacific transportof carbon monoxide and ozone pollution: an integrated satellite, aircraft, and modelperspective. Journal of Geophysical Research, 108, p. 4804, doi: 10.1029/2003JD003507.
HSU, H., TERNG, C. and CHEN, C., 1999, Evolution of large-scale circulation and heating duringthe first transition of Asian summer monsoon. Journal of Climate, 12, pp. 793–810.
KAR, J., BREMER, H., DRUMMOND, J.R., ROCHON, Y.J., JONES, D.B.A., NICHITIU, F., ZOU,J., LIU, J., GILLE, J.C., EDWARDS, D.P., DEETER, M.N., FRANCIS, G., ZISKIN, D. andWARNER, J., 2004, Evidence of vertical transport of carbon monoxide from measure-ments of pollution in the troposphere (MOPITT). Geophysical Research Letters, 31,L23105, doi: 10.1029/2004GL021128.
KAR, J., JONES, D.B.A., DRUMMOND, J.R., ATTIE, J.L., LIU, J., ZOU, J., NICHITIU, F.,SEYMOUR, M.D., EDWARDS, D.P., DEETER, M.N., GILLE, J.C. and RICHTER, A., 2008,Measurement of low-altitude CO over the Indian subcontinent by MOPITT. Journal ofGeophysical Research, 113, D16307, doi: 10.1029/2007JD009362.
KONDRATYEV, K.Y. and VAROTSOS, C.A., 1996, Global total ozone dynamics – impact on sur-face solar ultraviolet radiation variability and ecosystems. 1. Global ozone dynamicsand environmental safety. Environmental Science and Pollution Research, 3, pp. 153–157.
KOPACZ, M., JACOB, D.J., HENZE, D.K., HEALD, C.L., STREETS, D.G. and ZHANG, Q., 2007,Comparison of adjoint and analytical Bayesian inversion methods for constrainingAsian sources of carbon monoxide using satellite (MOPITT) measurements of COcolumns. Journal of Geophysical Research, 113, D07302, doi: 10.1029/2007JD009264.
KULKARNI, P.S., JAIN, S.L., GHUDE, S.D., ARYA, B.C., DUBEY, P.K. and SHAHNWAZ, 2008,On some aspects of tropospheric ozone variability over the Indo-Gangetic (IG) basin,India. International Journal of Remote Sensing, 30, pp. 4111–4122.
LAWRENCE, M.G., RASCH, P.J., VON KUHLMANN, R., WILLIAMS, J., FISCHER, H., DE REUS,M., LELIEVELD, J., CRUTZEN, P.J., HUNTRIESER, H., HELAND, J., STOHL, A., FORSTER,C., SCHULTZ, M., STIER, P. and DICKERSON, R., 2003, Chemical weather forecasting asa tool for field campaign planning: predictions and observations of large-scale featuresduring INDOEX, MINOS, and CONTRACE. Atmospheric Chemistry Physics, 3, pp.267–289.
LELIEVELD, J., BERRESHEIM, H., BORMANN, S., CRUTZEN, P.J., DENTENER, F.J., FISCHER,H., FEICHTER, J., FLATAU, P.J., HELAND, J., HOLZINGER, R., KORMANN, R.,LAWRENCE, M.G., LEVIN, Z., MARKOWICZ, K.M., MIHALOPOULOS, N., MINIKIN,A., RAMANATHAN, V., DE REUS, M., ROELOFS, G.J., SCHEEREN, H.A., SCAIRE, J.,SCHLAGER, H., SCHULTZ, M., SIEGMUND, P., STEIL, B., STEPHANOU, E.G., STIER, P.,TRAUB, M., WARNEKE, C., WILLIAMS, J. and ZIEREIS, H., 2002, Global air pollutioncrossroads over the Mediterranean. Science, 298, pp. 794–799.
Dow
nloa
ded
by [
McM
aste
r U
nive
rsity
] at
06:
53 1
6 D
ecem
ber
2014

6148 S. D. Ghude et al.
LELIEVELD, J., CRUTZEN, P.J., RAMANATHAN, V., ANDREAE, M.O., BRENNINKMEIJER, C.A.M.,CAMPOS, T., CASS, G.R., DICKERSON, R.R., FISCHER, H., DE GOUW, J.A., HANSEL,A., JEFFERSON, A., KLEY, D., DE LAAT, A.T.J., LAL, S., LAWRENCE, M.G., LOBERT,J.M., MAYOL-BRACERO, O., MITRA, A.P., NOVAKOV, T., OLTMANS, S.J., PRATHER,K.A., REINER, T., RODHE, H., SCHEEREN, H.A., SIKKA, D. and WILLIAMS, J., 2001,The Indian Ocean experiment: widespread air pollution from South and South-EastAsia. Science, 291, pp. 1031–1036.
LI, Q., JACOB, D.J., PARK, R., WANG, Y., HEALD, C.L., HUDMAN, R., YANTOSCA, R.M.,MARTIN, R.V. and EVANS, M., 2005b, North American pollution outflow and the trap-ping of convectively lifted pollution by upper-level anticyclone. Journal of GeophysicalResearch, 110, D10301, doi: 10.1029/2004JD005039.
LI, Q., JIANG, J.H., WU, D.L., READ, W.G., LIVESEY, N.J., WATERS, J.W., ZHANG, Y., WANG,B., FILIPIAK, M.J., DAVIS, C.P., TURQUETY, S., WU, S., PARK, R.J., YANTOSCA, R.M.and JACOB, D.J., 2005a, Convective outflow of South Asian pollution: a global CTMsimulation compared with EOS MLS observations. Geophysical Research Letters, 32,L14826, doi: 10.1029/2005GL022762.
LI, Q.B., JACOB, D.J., LOGAN, J.A., BEY, I., YANTOSCA, R.M., LIU, H., MARTIN, R.V., FIORE,A.M., FIELD, B.D., DUNCAN, B.N. and THOURET, V., 2001, A tropospheric ozonemaximum over the Middle East. Geophysical Research Letters, 28, pp. 3235–3238.
LIU, H., JACOB, D.J., BEY, I., YANTOSCA, R.M., DUNCAN B.N. and SACHSE, G.W.,2003, Transport pathways for Asian pollution outflow over the Pacific: interannualand seasonal variations. Journal of Geophysical Research, 108, 8786, doi: 10.1029/
2002JD003102.LIU, J., DRUMMOND, J.R., LI, Q., GILLE J.C. and ZISKIN, D.C., 2005, Satellite mapping of CO
emission from forest fires in northwest America using MOPITT measurements. RemoteSensing of Environment, 95, pp. 502–516.
MANOHAR, G.K., KANDALGAONKAR, S.S. and TINMAKER, M.I.R., 1999, Thunderstorm activ-ity over India and the Indian southwest monsoon, Journal of Geophysical Research, 104,pp. 4169– 4188.
PARK, M., RANDEL, W.J., EMMONS, L.K. and LIVESEY, N.J., 2009, Transport pathways ofcarbon monoxide in the Asian summer monsoon diagnosed from model of ozoneand related tracers (MOZART). Journal of Geophysical Research, 114, D08303,doi: 10.1029/2008JD010621.
PETRON, G., GRANIER, C., KHATTATOV, B., YUDIN, V., LAMARQUE, J.-F., EMMONS, L.,GILLE, J. and EDWARDS, D.P., 2004, Monthly CO surface sources inventory basedon the 2000–2001 MOPITT satellite data. Geophysical Research Letters, 31, L21107,doi: 10.1029/2004GL020560.
PHADNIS, M.J., LEVY II, H. and MOXIM, W.J., 2002, On the evolution of pollution from Southand Southeast Asia during the winter-spring monsoon. Journal of Geophysical Research,107, 4790, doi: 10.1029/2002JD002190.
REDDY, M.S. and VENKATARAMAN, C., 2002, Inventory of aerosol and sulphur dioxide emis-sions from India: fossil fuel combustion, I. Atmospheric Environment, 36, pp. 677–697,doi: 10.1016/S1352-2310(01)00463-0.
VAROTSOS, C., ONDOV, J. and EFSTATHIOU, M., 2005, Scaling properties of air pollution inAthens, Greece and Baltimore, Maryland. Atmospheric Environment, 39, pp. 4041–4047.
VAROTSOS, C.A., EFSTATHIOU, M.N. and KONDRATYEV, K.Y., 2003, Long-term variation insurface ozone and its precursors in Athens, Greece. A forecasting tool. EnvironmentalScience and Pollution Research, 10, pp. 19–23.
VENKATARAMAN, C., HABIB, G., KADAMBA, D., SHRIVASTAVA, M., LEON, J.-F., CROUZILLE, B.,BOUCHER, O. and STREETS, D.G., 2006, Emissions from open biomass burning in India:integrating the inventory approach with high-resolution moderate resolution imagingspectroradiometer (MODIS) active-fire and land cover data. Global BiogeochemicalCycles, 20, GB2013, doi: 10.1029/2005GB002547.
Dow
nloa
ded
by [
McM
aste
r U
nive
rsity
] at
06:
53 1
6 D
ecem
ber
2014