regional ash fall hazard i: a probabilistic assessment methodology
TRANSCRIPT

RESEARCH ARTICLE
Regional ash fall hazard I: a probabilistic assessment methodology
Susanna Jenkins & Christina Magill & John McAneney &
Russell Blong
Received: 1 April 2011 /Accepted: 19 May 2012 /Published online: 13 June 2012# Springer-Verlag 2012
Abstract Volcanic ash is one of the farthest-reaching vol-canic hazards and ash produced by large magnitude explo-sive eruptions has the potential to affect communities overthousands of kilometres. Quantifying the hazard from ashfall is problematic, in part because of data limitations thatmake eruption characteristics uncertain but also because,given an eruption, the distribution of ash is then controlledby time and altitude-varying wind conditions. Any onelocation may potentially be affected by ash falls from one,or a number of, volcanoes so that volcano-specific studiesmay not fully capture the ash fall hazard for communities involcanically active areas. In an attempt to deal with theseuncertainties, this paper outlines a probabilistic frameworkfor assessing ash fall hazard on a regional scale. The meth-odology employs stochastic simulation techniques and isbased upon generic principles that could be applied to anyarea, but is here applied to the Asia-Pacific region. Averagerecurrence intervals for eruptions greater than or equal toVolcanic Explosivity Index 4 were established for 190 vol-canoes in the region, based upon the eruption history of eachvolcano and, where data were lacking, the averaged eruptivebehaviour of global analogous volcanoes. Eruption histories
are drawn from the Smithsonian Institution’s Global Volca-nism Program catalogue of Holocene events and unpub-lished data, with global analogues taken from volcanoes ofthe same type category: Caldera, Large Cone, Shield, Lavadome or Small Cone. Simulated are 190,000 plausible erup-tion scenarios, with ash dispersal for each determined usingan advection–diffusion model and local wind conditions.Key uncertainties are described by probability distributions.Modelled results include the annual probability of exceed-ing given ash thicknesses, summed over all eruption scenar-ios and volcanoes. A companion paper describes the resultsobtained for the Asia-Pacific region
Keywords Volcanic hazard . Hazard assessment .
Probabilistic modelling . Ash dispersion . Regional hazardassessment . Methodology
Introduction
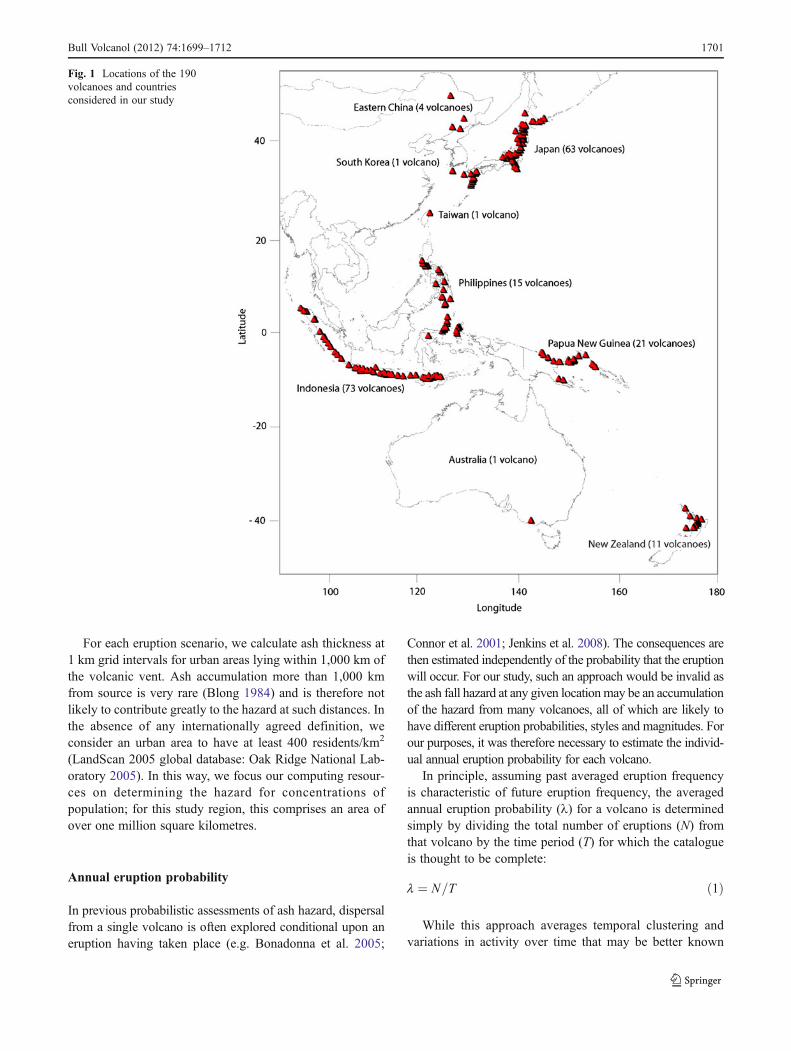
Home to 25 % of the world’s volcanoes and over two billioninhabitants, the Asia-Pacific region, on the western rim ofthe Pacific ‘ring of fire’, is one of the world’s most denselypopulated areas, with many cities and communities threat-ened by ash falls and other volcanic hazards, often frommultiple volcanoes. Parts of Honshu in Japan, for example,lie within reach of ash falls from any one of 60 differentvolcanoes situated within 1,000 km. Even relatively thin ashfalls (∼1 mm) are capable of disrupting vital lifelines such astransport, water supply, telecommunications and electricity(Blong 1984). This study develops a regional ash hazardassessment methodology using a probabilistic modellingframework. Modelled results for the Asia-Pacific regionare detailed in a companion paper (Jenkins et al. 2012).
Editorial responsibility: J.C. Phillips
S. Jenkins :C. Magill : J. McAneney : R. BlongRisk Frontiers, Macquarie University,Sydney, NSW 2109, Australia
S. Jenkins (*)Department of Earth Sciences, Wills Memorial Building,University of Bristol,Bristol BS8 1RJ, UKe-mail: [email protected]
R. BlongAonBenfield Australia,Sydney, NSW 2000, Australia
Bull Volcanol (2012) 74:1699–1712DOI 10.1007/s00445-012-0627-8
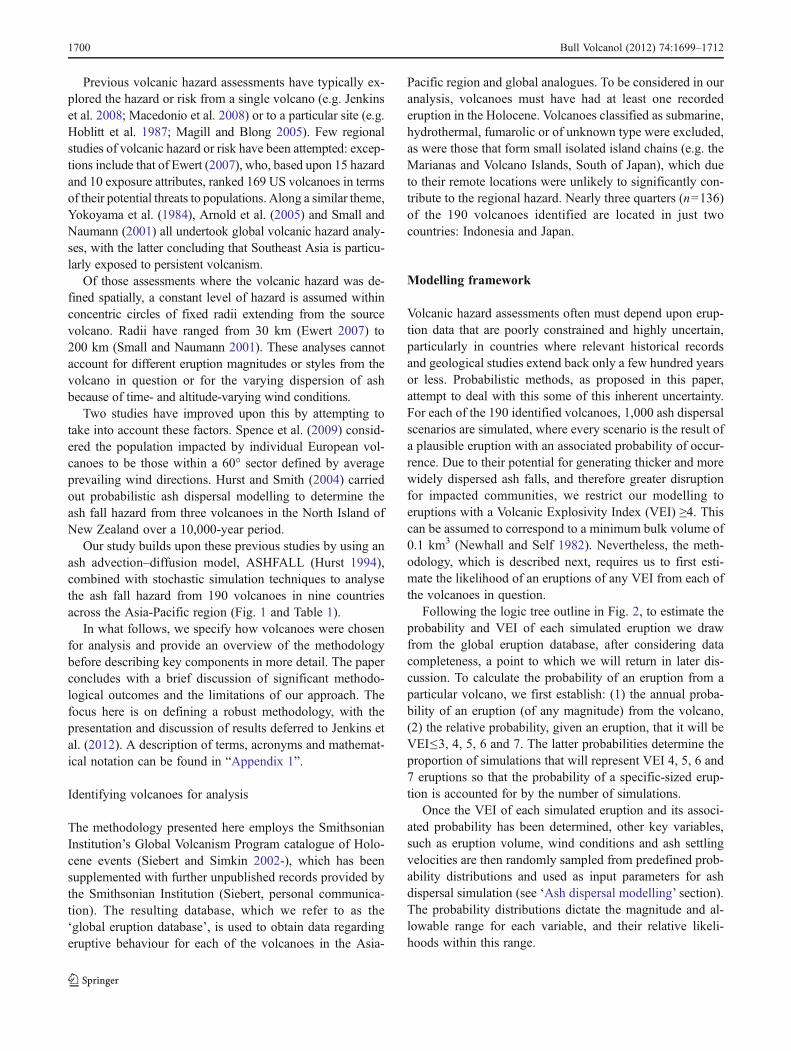
Previous volcanic hazard assessments have typically ex-plored the hazard or risk from a single volcano (e.g. Jenkinset al. 2008; Macedonio et al. 2008) or to a particular site (e.g.Hoblitt et al. 1987; Magill and Blong 2005). Few regionalstudies of volcanic hazard or risk have been attempted: excep-tions include that of Ewert (2007), who, based upon 15 hazardand 10 exposure attributes, ranked 169 US volcanoes in termsof their potential threats to populations. Along a similar theme,Yokoyama et al. (1984), Arnold et al. (2005) and Small andNaumann (2001) all undertook global volcanic hazard analy-ses, with the latter concluding that Southeast Asia is particu-larly exposed to persistent volcanism.
Of those assessments where the volcanic hazard was de-fined spatially, a constant level of hazard is assumed withinconcentric circles of fixed radii extending from the sourcevolcano. Radii have ranged from 30 km (Ewert 2007) to200 km (Small and Naumann 2001). These analyses cannotaccount for different eruption magnitudes or styles from thevolcano in question or for the varying dispersion of ashbecause of time- and altitude-varying wind conditions.
Two studies have improved upon this by attempting totake into account these factors. Spence et al. (2009) consid-ered the population impacted by individual European vol-canoes to be those within a 60° sector defined by averageprevailing wind directions. Hurst and Smith (2004) carriedout probabilistic ash dispersal modelling to determine theash fall hazard from three volcanoes in the North Island ofNew Zealand over a 10,000-year period.
Our study builds upon these previous studies by using anash advection–diffusion model, ASHFALL (Hurst 1994),combined with stochastic simulation techniques to analysethe ash fall hazard from 190 volcanoes in nine countriesacross the Asia-Pacific region (Fig. 1 and Table 1).
In what follows, we specify how volcanoes were chosenfor analysis and provide an overview of the methodologybefore describing key components in more detail. The paperconcludes with a brief discussion of significant methodo-logical outcomes and the limitations of our approach. Thefocus here is on defining a robust methodology, with thepresentation and discussion of results deferred to Jenkins etal. (2012). A description of terms, acronyms and mathemat-ical notation can be found in “Appendix 1”.
Identifying volcanoes for analysis
The methodology presented here employs the SmithsonianInstitution’s Global Volcanism Program catalogue of Holo-cene events (Siebert and Simkin 2002-), which has beensupplemented with further unpublished records provided bythe Smithsonian Institution (Siebert, personal communica-tion). The resulting database, which we refer to as the‘global eruption database’, is used to obtain data regardingeruptive behaviour for each of the volcanoes in the Asia-
Pacific region and global analogues. To be considered in ouranalysis, volcanoes must have had at least one recordederuption in the Holocene. Volcanoes classified as submarine,hydrothermal, fumarolic or of unknown type were excluded,as were those that form small isolated island chains (e.g. theMarianas and Volcano Islands, South of Japan), which dueto their remote locations were unlikely to significantly con-tribute to the regional hazard. Nearly three quarters (n0136)of the 190 volcanoes identified are located in just twocountries: Indonesia and Japan.
Modelling framework
Volcanic hazard assessments often must depend upon erup-tion data that are poorly constrained and highly uncertain,particularly in countries where relevant historical recordsand geological studies extend back only a few hundred yearsor less. Probabilistic methods, as proposed in this paper,attempt to deal with this some of this inherent uncertainty.For each of the 190 identified volcanoes, 1,000 ash dispersalscenarios are simulated, where every scenario is the result ofa plausible eruption with an associated probability of occur-rence. Due to their potential for generating thicker and morewidely dispersed ash falls, and therefore greater disruptionfor impacted communities, we restrict our modelling toeruptions with a Volcanic Explosivity Index (VEI) ≥4. Thiscan be assumed to correspond to a minimum bulk volume of0.1 km3 (Newhall and Self 1982). Nevertheless, the meth-odology, which is described next, requires us to first esti-mate the likelihood of an eruptions of any VEI from each ofthe volcanoes in question.
Following the logic tree outline in Fig. 2, to estimate theprobability and VEI of each simulated eruption we drawfrom the global eruption database, after considering datacompleteness, a point to which we will return in later dis-cussion. To calculate the probability of an eruption from aparticular volcano, we first establish: (1) the annual proba-bility of an eruption (of any magnitude) from the volcano,(2) the relative probability, given an eruption, that it will beVEI≤3, 4, 5, 6 and 7. The latter probabilities determine theproportion of simulations that will represent VEI 4, 5, 6 and7 eruptions so that the probability of a specific-sized erup-tion is accounted for by the number of simulations.
Once the VEI of each simulated eruption and its associ-ated probability has been determined, other key variables,such as eruption volume, wind conditions and ash settlingvelocities are then randomly sampled from predefined prob-ability distributions and used as input parameters for ashdispersal simulation (see ‘Ash dispersal modelling’ section).The probability distributions dictate the magnitude and al-lowable range for each variable, and their relative likeli-hoods within this range.
1700 Bull Volcanol (2012) 74:1699–1712
For each eruption scenario, we calculate ash thickness at1 km grid intervals for urban areas lying within 1,000 km ofthe volcanic vent. Ash accumulation more than 1,000 kmfrom source is very rare (Blong 1984) and is therefore notlikely to contribute greatly to the hazard at such distances. Inthe absence of any internationally agreed definition, weconsider an urban area to have at least 400 residents/km2
(LandScan 2005 global database: Oak Ridge National Lab-oratory 2005). In this way, we focus our computing resour-ces on determining the hazard for concentrations ofpopulation; for this study region, this comprises an area ofover one million square kilometres.
Annual eruption probability
In previous probabilistic assessments of ash hazard, dispersalfrom a single volcano is often explored conditional upon aneruption having taken place (e.g. Bonadonna et al. 2005;
Connor et al. 2001; Jenkins et al. 2008). The consequences arethen estimated independently of the probability that the eruptionwill occur. For our study, such an approach would be invalid asthe ash fall hazard at any given locationmay be an accumulationof the hazard from many volcanoes, all of which are likely tohave different eruption probabilities, styles and magnitudes. Forour purposes, it was therefore necessary to estimate the individ-ual annual eruption probability for each volcano.
In principle, assuming past averaged eruption frequencyis characteristic of future eruption frequency, the averagedannual eruption probability (1) for a volcano is determinedsimply by dividing the total number of eruptions (N) fromthat volcano by the time period (T) for which the catalogueis thought to be complete:
l ¼ N=T ð1Þ
While this approach averages temporal clustering andvariations in activity over time that may be better known
Fig. 1 Locations of the 190volcanoes and countriesconsidered in our study
Bull Volcanol (2012) 74:1699–1712 1701

for individual well-studied volcanoes, it does provide aconsistent methodology for the quantification of ash fallhazard across a region, where more detailed knowledge isoften lacking. This study is intended as a long-term estimateof ash fall hazard and not an estimate of the next likelyeruption. Values of 1 have been assigned to each of the 190study volcanoes, based on the eruption history of that
volcano. This demands an estimate of the T for which theeruption catalogue is thought to be complete.
Data completeness
Over the past 200 years, a sharp increase in the number oferuptions recorded globally has been observed, a feature that
Table 1 The 190 volcanoes identified for regional hazard assessment, grouped by country
Country Volcanoes
Australia (n01) Newer volcanic province
Eastern China (n04) Baitoushan, Jingbo, Longgang Group, Wudalianchi
Indonesia (n073) Ambang, Agung, Arjuno-Welirang, Awu, Batur, Cereme, Colo [Una Una], Dempo, Dieng Volc Complex, Dukono,Ebulobo, Egon, Galunggung, Gamalama, Gamkonora, Gede, Geureudong, Guntur, Ibu, Inierie, Inielika, Ijen, Iliboleng,Iliwerung, Iya, Iyang-Argapura, Kaba, Karangetang [Api Siau], Kelimutu, Kelut, Kerinci, Kiaraberes-Gagak, Krakatau,Lamongan, Leroboleng, Lewotobi, Lewotolo, Lokon-Empung, Mahawu, Makian, Marapi, Merapi, Merbabu, Muria,Paluweh, Papandayan, Penanggungan, Peuet Sague, Ranakah, Ranau, Raung, Rinjani, Ruang, Salak, Sangeang Api,Semeru, Sempu, Seulawah Agam, Sibayak, Sinabung, Sirung, Slamet, Soputan, Sorikmarapi, Sumbing, Sundoro,Talang, Tambora, Tandikat, Tangkubanparahu, Tengger Caldera, Tongkoko, Wilis
Japan (n063) Adatara, Akagi, Akan, Akita-Komaga-take, Akita-Yake-yama, Asama, Aso, Azuma, Bandai, Chokai, E-san, Fuji, Fukue-jima, Hakkoda Group, Hakone, Haku-san, Haruna, Hiuchi, Ibusuki Volc Field, Iwaki, Iwate, Izu-Tobu, Kanpu, Kikai,Kirishima, Komaga-take, Kozu-shima, Kuchinoerabu-jima, Kuju, Kurikoma, Kusatsu-Shirane, Kuttara, Mashu, Megata,Mikura-jima, Miyake-jima, Myoko, Nasu, Niigata-Yake-yama, Nii-jima, Nikko-Shirane, Nipesotsu-Maruyama, Niseko,On-take, Oshima, Oshima-Oshima, Osore-yama, Rausu, Rishiri, Sakura-jima, Shikotsu, Shiretoko-Iwo-zan, Sumiyoshi-ike, Tate-yama, Tokachi, To-shima, Towada, Tsurumi, Unzen, Usu, Yake-dake, Yotei, Zao
New Zealand (n011) Auckland Field, Egmont [Taranaki], Kaikohe-Bay of Islands, Maroa, Mayor Island, Okataina, Reporoa, Ruapehu, Taupo,Tongariro, White Island
Papua New Guinea(n021)
Ambitle, Bagana, Balbi, Bam, Bamus, Dakataua, Garbuna Group, Hargy, Kadovar, Karkar, Lamington, Langila, Lolobau,Loloru, Long Island, Manam, Pago, Rabaul, Ritter Island, Ulawun, Victory
Philippines (n015) Banáhao, Bulusan, Camiguin, Canlaon, Leonard Range, Mahagnoa, Makaturing, Mariveles, Matutum, Mayon, Parker,Pinatubo, Ragang, San Pablo Volc Field, Taal
Taiwan (n01) Kueishantao
South Korea (n01) Halla
Fig. 2 Logic tree fordetermining eruptionprobabilities and the relativenumber of eruptions simulatedfor each VEI
1702 Bull Volcanol (2012) 74:1699–1712

closely correlates with an exponential increase in globalpopulation and more effective recording (Simkin and Siebert1994). Clearly, correctly estimating the breakpoints fromwhich the time series of eruptions is complete is critical: arecord that is too long may lead to an underestimation oferuption frequency and therefore hazard, while too short arecord would needlessly eliminate valuable data.
Ideally, data completeness analyses would be carried outon a volcano-by-volcano basis. For well-studied volcanoeswith relatively complete or recently detailed eruptionrecords, rates of activity and temporal variations, e.g. openand closed systems, can reliably be constructed (e.g. Ho1990—Mauna Loa and Etna volcanoes; Klein 1984—Kilauea volcano); however, in the Asia-Pacific region, thislevel of data completeness is rare and many volcanoessimply do not have a sufficient number of recorded erup-tions to allow meaningful judgements. The first eruption ofSuoh caldera (Indonesia) recorded in the global eruptiondatabase was a VEI 4 eruption in 1933; similarly, Tambora(Indonesia) had no recorded eruptions prior to the VEI 7eruption of 1812–1815. In the study region, 6 % (n030) ofvolcanoes have only one eruption recorded.
There are a number of possible strategies for estimatingeruption data completeness and annual eruption frequency(e.g. Bacon 1982; Coles and Sparks 2006; Marzocchi andZaccarelli 2006); however, for the reasons stated above andgiven the geographically and volcanically diverse datasetrequired for this assessment, a rigorous completeness anal-ysis for all volcanoes in the Region is clearly impossible.We thus analysed completeness globally over areas definedby historical and geographical boundaries, using a ‘break-in-slope’ method.
Simkin and Siebert (1994) suggest that the record forsmaller magnitude eruptions (VEI≤3) is complete globallysince the 1960s, while the record for larger magnitudeeruptions (VEI≥4) is complete for at least the last centuryas larger magnitude eruptions are better preserved in geo-logical deposits as well as written and oral records. For thisreason, we split the global eruption database into eruptionsof VEI 4 or above (n0618) and those of VEI 3 and below(n06,716) and examined each subset separately by plottingthe cumulative number of eruptions against time (e.g.Fig. 3). Magnitude classifications of ‘C’ (related to calderacollapse) or ‘P’ (Plinian) were allocated to the large magnitude(VEI≥4) portion of the dataset. Countries with very few erup-tion records (e.g. eastern China, South Korea and Taiwan),were analysed together. In total, 21 geographical areas world-wide were analysed, with completeness identified by a linearincrease in the cumulative number of eruptions per unit time.
For large magnitude eruptions, Indonesia and the Philip-pines exhibit easily definable ‘breakpoints’ at approximately420 and 630 years before present (2006; Fig. 3a and b, left).These likely correspond with the arrival of colonisers in the
area; for example, Europeans first began to document erup-tions in Indonesia in 1512 (Simkin and Siebert 1994) andrecorded their first large magnitude eruption (Kelut) in1586. For some other countries, choosing this breakpointwas more problematic. In Japan, for example, a recentemphasis on tephrochronology (e.g. Machida and Arai1992) combined with a long written history has extendedcompleteness further back in time. The result is that a plot ofthe cumulative number of Japanese eruptions in the globaleruption database with time increases non-linearly with time(Fig. 3c). In cases such as this, it was necessary to make asubjective choice of breakpoint by dividing the curve intotwo approximately linear relations. Table 2 lists our bestestimates of the complete duration (T) of the small and largemagnitude eruption records worldwide: the first five entriesin the table refer to areas in the Asia-Pacific region.
Assigning eruption frequencies
Having assigned T for each country or sub-region, and eachmagnitude range (VEI≤3 and VEI≥4), we now estimateeach volcano’s 1 for an eruption of any magnitude (Eq. 1).Eruption probability was calculated for two magnitude sub-sets: small magnitude (VEI≤3) and large magnitude (VEI≥4). For example, volcano A has a record of four smallmagnitude (VEI≤3) eruptions in 100 years and three largemagnitude (VEI≥4) eruptions in 2,000 years. The T for eachsubset is derived from the period over which the catalogue isthought to be complete, in this example 100 and 2,000 years.To aggregate subsets, the different record lengths were nor-malised to one time period, assuming a constant eruptionrate. In this example, we estimate a total of 83 eruptions in a2,000-year period ((4×20)+3), giving an annual eruptionprobability of 0.041 and an average recurrence interval—theapproximate inverse of the annual eruption probability—of24 years for an eruption of any VEI magnitude.
In the unique case of Sumiyoshi-ike in Japan, only twosmall magnitude eruptions have been recorded, both ap-proximately 8,000 years ago. These eruptions fall outsidethe 500-year complete portion of the small magnitude erup-tion database for Japan and yet we still require an AverageRecurrence Interval (ARI) for this volcano. This was theonly volcano in this situation in the region and we chose toconsider the record from the earliest eruption, leading to anARI of approximately 4,000 years.
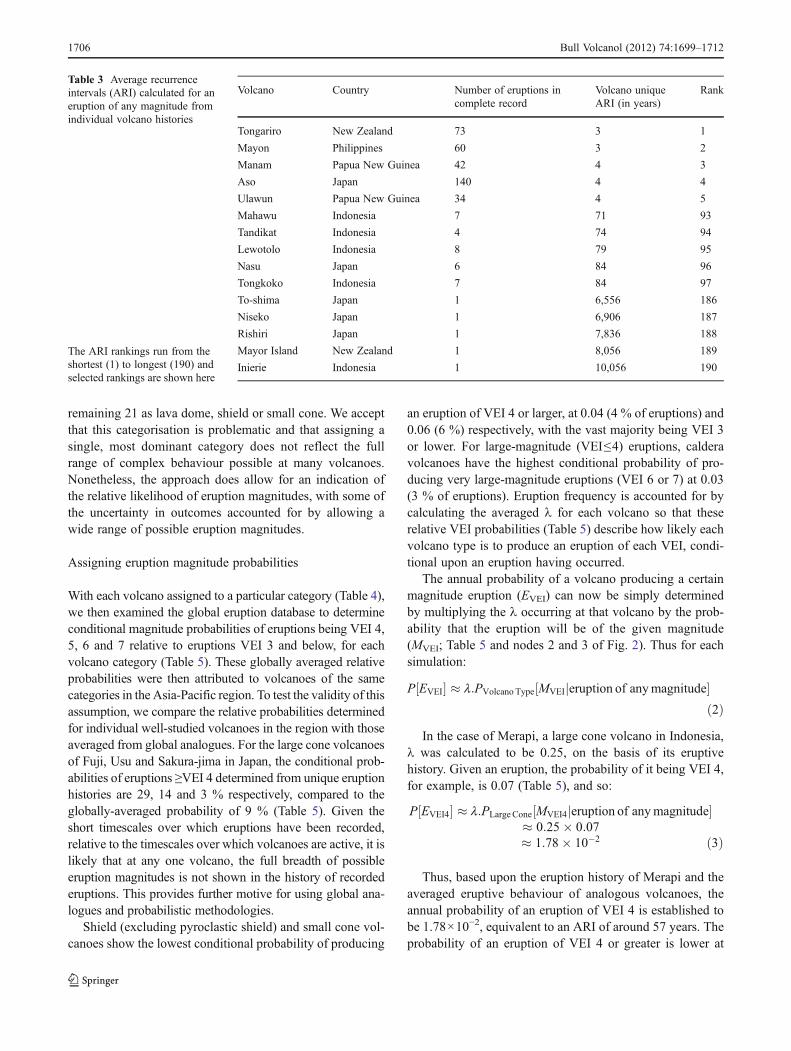
Figure 4 shows the ARIs calculated for all 190 volcanoes,grouped by country and Table 3 details the five volcanoeswith the smallest ARIs (rank 1–5), the five surrounding themedian (rank 93–97) and the five with the largest ARIs(rank 186–190). Estimated ARIs range over nearly 4 ordersof magnitude from approximately 3 years (Tongariro, NewZealand: 71 small magnitude eruptions in the last 232 yearsand two large and two unknown magnitude eruptions in the
Bull Volcanol (2012) 74:1699–1712 1703

last 6,706 years) to 10,056 years (Inierie, Indonesia: oneeruption of unknown magnitude 10,056 years ago).
Some of this spread in ARI can be attributed to inconsis-tent quality of data recordings and preservation of depositsbetween volcanoes and between countries; however, muchof the variation will reflect real differences in the tectonic,magmatic and environmental conditions between volcanoes.
Eruption magnitude probability
Previous discussion has centred on the calculation of annualprobabilities for each of the region’s volcanoes producing aneruption of any magnitude. Given an eruption at each
volcano, we now consider the conditional probability of thateruption being VEI≤3, 4, 5, 6 and 7. For many volcanoes, e.g.the Auckland Volcanic Field, New Zealand (one eruption) andHakone, Japan (three eruptions), there are very few eruptionsin the database, and even less in the portion considered com-plete. This may be indicative of a low eruption rate, poorhistorical record or a geological record that is less studied,less accessible and/or less well preserved. Of the region’s 190volcanoes, 77 % (n0146) have less than three eruptionsduring the time period for which their record is deemedcomplete and/or no record of both large and small magnitudeeruptions. With this in mind, we propose to use records fromanalogous volcanoes (those of the same type category) toprovide some perspective on likely eruption behaviour.
Fig. 3 Cumulative number of large magnitude (VEI≥4; left) and small magnitude (VEI≤3) eruptions (right) over time for a Indonesia, bPhilippines and c Japan. Data completeness is assumed for ages younger than that indicated by the dotted lines
1704 Bull Volcanol (2012) 74:1699–1712

Volcano category classification
With the purpose of inferring averaged eruptive behaviouracross analogous volcanoes, we follow the SmithsonianInstitution classification of volcanoes by type and assigneach volcano to a broad type category (Table 4) based uponits physical characteristics. The volcano type category
implicitly relates to previous eruption styles and magnitudesat the volcano and is indicative of magma composition, i.e.shields and small cones tend to be less silicic, and thereforeproduce less explosive eruptions, than large cones, lavadomes and calderas.
Of all the volcanoes considered, 79 % (n0151) werecategorised as large cones, 9 % (n018) as caldera and the
Table 2 Data completeness by area for the global eruption record
Area ‘Breakpoints’(years before 2006)
Number oferuptions during‘complete’ record
Proportion (%) oftotal eruptionsdeemed complete
Proportion (%) oftotal record lengthdeemed complete
Average Recurrence Intervalbetween eruptions (years)
VEI 0–3 VEI 4–7 VEI 0–3 VEI 4–7 VEI 0–3 VEI 4–7 VEI 0–3 VEI 4–7 VEI 0–3 VEI 4–7
Indonesia 203 420 1,047 28 89 85 3 10 2 months 15
Japan 501 3,096 892 71 83 71 5 28 7 months 44
New Zealand, SW Pacific 232 6,706 380 27 88 73 2 56 7 months 248
Papua New Guinea 134 1,866 191 23 92 82 31 20 8 months 81
Philippines 181 626 133 11 85 69 42 6 1 year 4 months 59
Africa 206 9,556 124 8 90 100 4 100 1 year 8 months 1,195
Alaska, Kamchatka, Kuriles 316 11,506 713 115 86 100 3 100 5 months 100
Azores, Madeira, Canaries 576 5,056 43 13 84 100 15 100 13 years 5 months 389
Canada, Lower 50 states USA 222 2,576 147 18 43 78 2 33 1 year 6 months 143
Chile, Argentina 448 9,426 339 17 97 100 5 100 1 year 4 months 554
Colombia 471 4,556 5,134 15 100 83 9 46 6 yrs 6 mths 304
Costa Rica, El Salvador 348 8,056 202 24 96 100 12 100 1 year 9 months 336
Ecuador 474 3,156 188 31 89 91 5 32 2 years 5 months 102
Guatemala 501 425 105 8 94 100 31 100 4 years 9 months 53
Iceland 1,156 1,106 147 26 69 72 10 9 6 years 10 months 43
Italy 1,219 4,506 242 21 87 91 12 51 5 years 215
Mexico 856 9,376 114 25 83 100 9 100 7 years 6 months 375
Nicaragua 157 8,056 130 10 85 100 33 100 1 year 2 months 806
Peru 552 3,326 39 4 91 100 10 100 14 years 2 months 832
West Indies 316 10,216 33 28 87 100 10 100 9 years 7 months 365
Few data points 366 9,356 399 16 93 100 3 100 11 months 585
Fig. 4 Average recurrenceintervals for an eruption of anymagnitude, based upon theeruption history of eachvolcano (diamond), calculatedfor 190 volcanoes in the Asia-Pacific region and grouped bycountry
Bull Volcanol (2012) 74:1699–1712 1705
remaining 21 as lava dome, shield or small cone. We acceptthat this categorisation is problematic and that assigning asingle, most dominant category does not reflect the fullrange of complex behaviour possible at many volcanoes.Nonetheless, the approach does allow for an indication ofthe relative likelihood of eruption magnitudes, with some ofthe uncertainty in outcomes accounted for by allowing awide range of possible eruption magnitudes.
Assigning eruption magnitude probabilities
With each volcano assigned to a particular category (Table 4),we then examined the global eruption database to determineconditional magnitude probabilities of eruptions being VEI 4,5, 6 and 7 relative to eruptions VEI 3 and below, for eachvolcano category (Table 5). These globally averaged relativeprobabilities were then attributed to volcanoes of the samecategories in the Asia-Pacific region. To test the validity of thisassumption, we compare the relative probabilities determinedfor individual well-studied volcanoes in the region with thoseaveraged from global analogues. For the large cone volcanoesof Fuji, Usu and Sakura-jima in Japan, the conditional prob-abilities of eruptions ≥VEI 4 determined from unique eruptionhistories are 29, 14 and 3 % respectively, compared to theglobally-averaged probability of 9 % (Table 5). Given theshort timescales over which eruptions have been recorded,relative to the timescales over which volcanoes are active, it islikely that at any one volcano, the full breadth of possibleeruption magnitudes is not shown in the history of recordederuptions. This provides further motive for using global ana-logues and probabilistic methodologies.
Shield (excluding pyroclastic shield) and small cone vol-canoes show the lowest conditional probability of producing
an eruption of VEI 4 or larger, at 0.04 (4 % of eruptions) and0.06 (6 %) respectively, with the vast majority being VEI 3or lower. For large-magnitude (VEI≤4) eruptions, calderavolcanoes have the highest conditional probability of pro-ducing very large-magnitude eruptions (VEI 6 or 7) at 0.03(3 % of eruptions). Eruption frequency is accounted for bycalculating the averaged 1 for each volcano so that theserelative VEI probabilities (Table 5) describe how likely eachvolcano type is to produce an eruption of each VEI, condi-tional upon an eruption having occurred.
The annual probability of a volcano producing a certainmagnitude eruption (EVEI) can now be simply determinedby multiplying the 1 occurring at that volcano by the prob-ability that the eruption will be of the given magnitude(MVEI; Table 5 and nodes 2 and 3 of Fig. 2). Thus for eachsimulation:
P EVEI½ � � l:PVolcano Type MVEIjeruption of anymagnitude½ �ð2Þ
In the case of Merapi, a large cone volcano in Indonesia,1 was calculated to be 0.25, on the basis of its eruptivehistory. Given an eruption, the probability of it being VEI 4,for example, is 0.07 (Table 5), and so:
P EVEI4½ � � l:PLarge Cone MVEI4jeruption of anymagnitude½ �� 0:25� 0:07� 1:78� 10�2 ð3Þ
Thus, based upon the eruption history of Merapi and theaveraged eruptive behaviour of analogous volcanoes, theannual probability of an eruption of VEI 4 is established tobe 1.78×10⁻², equivalent to an ARI of around 57 years. Theprobability of an eruption of VEI 4 or greater is lower at
Table 3 Average recurrenceintervals (ARI) calculated for aneruption of any magnitude fromindividual volcano histories
The ARI rankings run from theshortest (1) to longest (190) andselected rankings are shown here
Volcano Country Number of eruptions incomplete record
Volcano uniqueARI (in years)
Rank
Tongariro New Zealand 73 3 1
Mayon Philippines 60 3 2
Manam Papua New Guinea 42 4 3
Aso Japan 140 4 4
Ulawun Papua New Guinea 34 4 5
Mahawu Indonesia 7 71 93
Tandikat Indonesia 4 74 94
Lewotolo Indonesia 8 79 95
Nasu Japan 6 84 96
Tongkoko Indonesia 7 84 97
To-shima Japan 1 6,556 186
Niseko Japan 1 6,906 187
Rishiri Japan 1 7,836 188
Mayor Island New Zealand 1 8,056 189
Inierie Indonesia 1 10,056 190
1706 Bull Volcanol (2012) 74:1699–1712

44 years and for small magnitude (VEI≤3) eruptions atMerapi, the ARI is calculated as approximately 4 years,which is consistent with previous estimates (e.g. Newhallet al. 2000; Thouret et al. 2000; Voight et al. 2000). Followingfrom this, for every 1,000 eruptions simulated at Merapi, 732will be VEI 4, 210 VEI 5, 53 VEI 6 and 5 will be VEI 7.Calculated probabilities for each simulation are summed foreach grid cell where ash fall is simulated so that the annualprobability a grid cell (x) will be impacted by a VEI 4 eruption(EVEI 4) from Merapi is given by:
PMerapi EVEI4½ �x �Xi¼S
i¼1
PMerapi EVEI�4½ �� �=TotalS
� � ð4Þ
Where S is the number of simulations that produce thick-nesses exceeding the defined thresholds in grid cell x (≤732for a VEI 4 eruption), EVEI≥4 is the probability of an erup-tion of VEI 4, 5, 6 or 7 and TotalS is the total number oferuptions simulated, in this case 1,000. Therefore, if weassume that all VEI 4 simulated eruptions from Merapiimpact location x, the ARI for that grid cell will be approxi-mately 57 years (1/1.78×10−2); however, if only half of sim-ulated VEI 4 eruptions impact the grid cell, the ARI for that
cell will rise to approximately 114 years. Clearly, wind con-ditions are not constant and so the annual probability will varybetween grid cells, with those downwind showing higherprobabilities than those impacted by more unusual windconditions.
Ash dispersal modelling
The extent and thickness of ash fall is strongly influenced bythe vertical profile of wind speed and direction, eruptionmagnitude and the physical characteristics of ash particles.Having assigned an annual probability and VEI to eachsimulated eruption scenario from each volcano, we use theash advection–diffusion model ASHFALL (Hurst 1994) tosimulate the distribution and thickness of ash deposition.ASHFALL is a two-dimensional semi-analytical model thathas fast runtimes (1–2 min per simulation on a single pro-cessor) making it well suited to probabilistic assessments.The spatial distribution and thickness of ash is obtained bycalculating how ash falling out of the column is affected bywind. The following sections detail the probability distribu-tions and relationships determined for the remaining inputparameters.
Eruption volume
Eruption volumes follow directly from the VEI classifica-tion scheme. For a given VEI eruption, the model randomlysamples volumes to be equally probable between the lowerand upper limits on a logarithmic scale, i.e. a power lawdistribution. For example, a VEI 4 eruption would samplelog10 volume randomly from a Uniform distribution rangingbetween −1 (log100.1) and 0 (log101) so that smaller volumeswithin the range are preferentially simulated.
Eruption column height
Higher eruption columns will result in ash particles takinglonger to reach the ground and thus dispersed further. Foreach simulation, the eruption column heightH (in kilometres)is calculated from an assumed relationship with eruption
Table 4 Volcano counts when grouped into five type categories, basedon Siebert and Simkin (2002-)
Volcano typecategory
Includes Smithsonian Institution definitions of:
Caldera (n019) Caldera, Calderas, pyroclastic shield
Large cone(n0150)
Complex volcano, Complex volcanoes,Compound volcano, Somma volcano,Somma volcanoes, Stratovolcano,Stratovolcanoes, Volcanic complex
Shield (n06) Shield volcano, Shield volcanoes
Lava dome(n06)
Lava dome, Lava domes
Small cone(n09)
Cinder cone, Cinder cones, Cones, Crater rows,Explosion craters, Fissure vent, Fissure vents,Lava cone, Maar, Maars, Pyroclastic cone,Pyroclastic cones, Scoria cones, Tuff cones,Tuff rings, Volcanic field
For detailed descriptions, schematic profiles and figures the reader isreferred to Siebert and Simkin (2002-)
Table 5 Probabilities for eachvolcano category assumed for aneruption of VEI 3 or below, 4, 5,6 or 7, conditional upon aneruption occurring
Volcano type category Data (n) Probabilities, conditional upon an eruption of any magnitude
VEI≤3 VEI 4 VEI 5 VEI 6 VEI 7
Caldera 642 0.85 0.08 0.04 0.02 4.8×10⁻³
Large cone 4,825 0.91 0.07 0.02 4.8×10⁻³ 4.5×10⁻⁴
Shield 733 0.96 0.03 6.2×10⁻³ 2.0×10⁻³ 1.0×10⁻³
Lava dome 58 0.74 0.21 0.04 0.01 0
Small cone 117 0.94 0.05 8.0×10⁻³ 0 0
Bull Volcanol (2012) 74:1699–1712 1707

volume, V (in cubic kilometres):
H ¼ 8:67log10ðV Þ þ 20:20 ð5Þ
This relation is similar to that found by Carey andSigurdsson (1989) for Plinian eruptions and is derived froma regression analysis (r200.57) of large magnitude globalHolocene events with a VEI of 4 or greater (Jenkins et al.2007).
Ash settling velocities
Terminal settling velocities are extrapolated from particlesize and density. Particle size is modelled (in phi) from anormal distribution with limits 4 and −6 phi, i.e. a truncatedlog-normal distribution. To account for uncertainty in thisestimation, the mean is sampled uniformly between −2.5 phiand 1 phi and the standard deviation between 2 phi and 3phi. Particle density is fixed at 900 kg/m3 with the range insettling velocities accounted for by varying particle sizeestimates. Particle size distributions and uncertainty(Fig. 5) follow empirical evidence and theoretical argumentsmade by Woods and Bursik (1991).
We use 50 classes of terminal settling velocity, eachrepresented by its relative probability of occurrence withinthe ejected mass. ASHFALL analyses each settling velocityclass individually and then sums thicknesses calculated ateach grid point to give total thickness for the eruption.
Wind conditions
Ten years of wind data (January 1997 to December 2006)were obtained from the National Centres for EnvironmentalProtection (NCEP) and Atmospheric Research (NCAR)global reanalysis project at 2.5° intervals (200–275 km).Data, available for 17 pressure levels, were interpolated to
35 even height intervals between 1 and 34 km above sealevel. For each volcano, the resultant record comprises14,608 profiles—10 years of 6-h profiles (12 am, 6 am, 12pm and 6 pm)—of wind speed and direction. So as not tobias simulations towards particular seasonal or diurnal windconditions, for each volcano and for each of the 1,000eruption scenarios simulated, wind conditions were sampledrandomly from this record at the location closest to thevolcano, i.e. within 1.25°. Therefore, closely spaced volca-noes may utilise the same wind records.
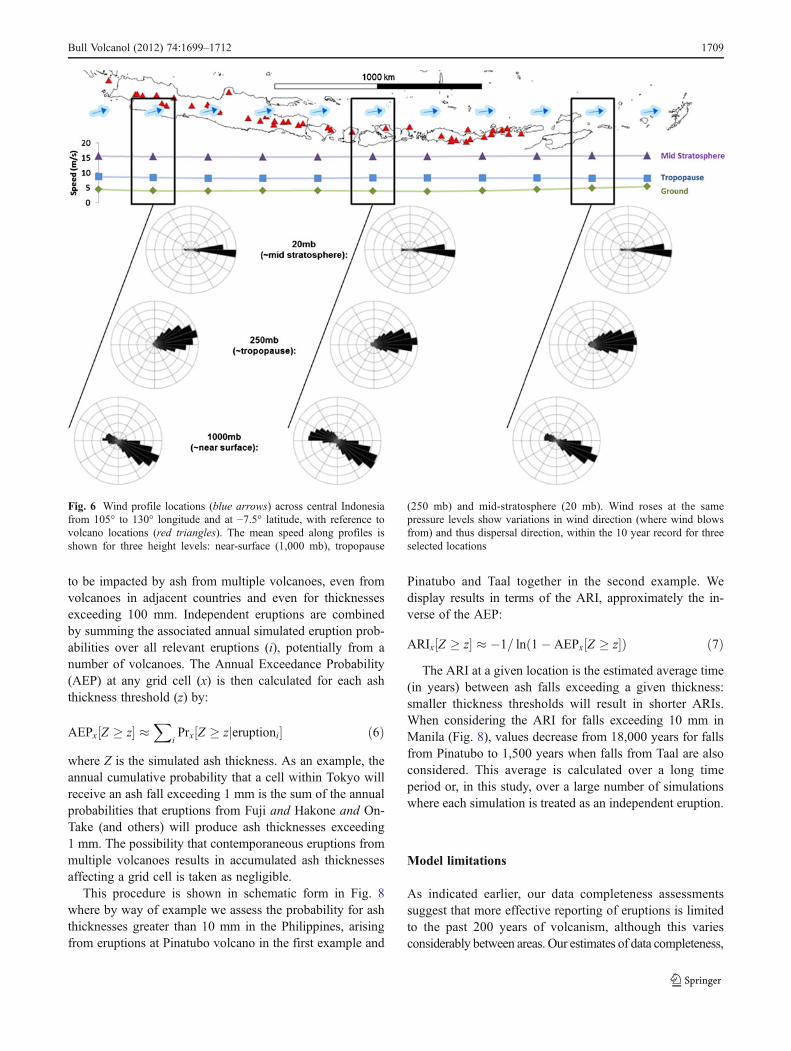
Using NCEP/NCAR wind profiles, ASHFALL accountsfor vertical, but not horizontal, changes in wind conditionswith distance from the volcano. Incorporating horizontalchanges in wind conditions requires the use of complexatmospheric or hybrid models, which are computationallyintensive and therefore currently unsuitable for probabilisticmodelling. An analysis of the variation in wind speed anddirection horizontally shows that mean wind direction andspeed downwind does not vary by more than 1 SD over themaximum extent ash dispersion is modelled (1,000 km):there is greater variation in wind conditions vertically withinthe one profile. The change in mean wind conditions acrossIndonesia, which has the greatest number of volcanoes andtherefore the greatest number of eruptions simulated as partof this study, is shown in Fig. 6 for approximately ground,tropopause and mid-stratosphere levels and demonstratesthat incorporating varying wind conditions horizontally(through more complex models) is unlikely to have a stronginfluence on simulated ash dispersion.
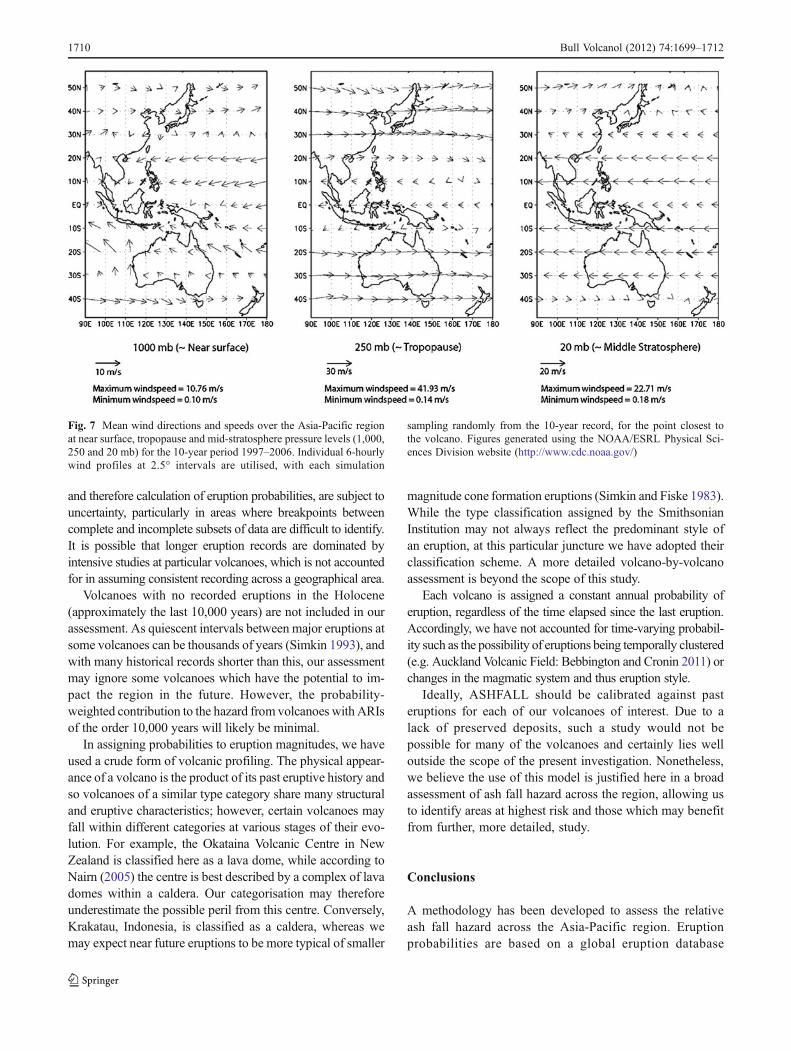
A more influential variable affecting the distribution ofash following an eruption is the height-varying profile ofwind speed and direction at the time of the eruption. Con-siderable variation in vertical wind profiles across the Asia-Pacific region means that some locations experience a com-plete reversal in wind direction between the troposphere andstratosphere (Fig. 7). This is accounted for within the modelby using profiles that describe wind speed and direction at1-km intervals vertically through the eruption column.
Hazard outcomes
Estimating annual exceedance probabilities for ash fallthicknesses
For each 1 km2 cell defined as urban area, the ash fall hazardis identified by accumulating all simulations from eachvolcano that impacts the grid cell. We then calculate foreach cell, from each volcano, the probability of reaching 1,10 and 100 mm accumulation thresholds: chosen to repre-sent the approximate onset of various forms of damage ordisruption to communities, infrastructure and economies(see part II for more detail). Many cells have the potential
Fig. 5 Probability density distributions for settling velocity classesused in ash dispersal modelling
1708 Bull Volcanol (2012) 74:1699–1712
to be impacted by ash from multiple volcanoes, even fromvolcanoes in adjacent countries and even for thicknessesexceeding 100 mm. Independent eruptions are combinedby summing the associated annual simulated eruption prob-abilities over all relevant eruptions (i), potentially from anumber of volcanoes. The Annual Exceedance Probability(AEP) at any grid cell (x) is then calculated for each ashthickness threshold (z) by:
AEPx Z � z½ � �X
iPrx Z � zjeruptioni½ � ð6Þ
where Z is the simulated ash thickness. As an example, theannual cumulative probability that a cell within Tokyo willreceive an ash fall exceeding 1 mm is the sum of the annualprobabilities that eruptions from Fuji and Hakone and On-Take (and others) will produce ash thicknesses exceeding1 mm. The possibility that contemporaneous eruptions frommultiple volcanoes results in accumulated ash thicknessesaffecting a grid cell is taken as negligible.
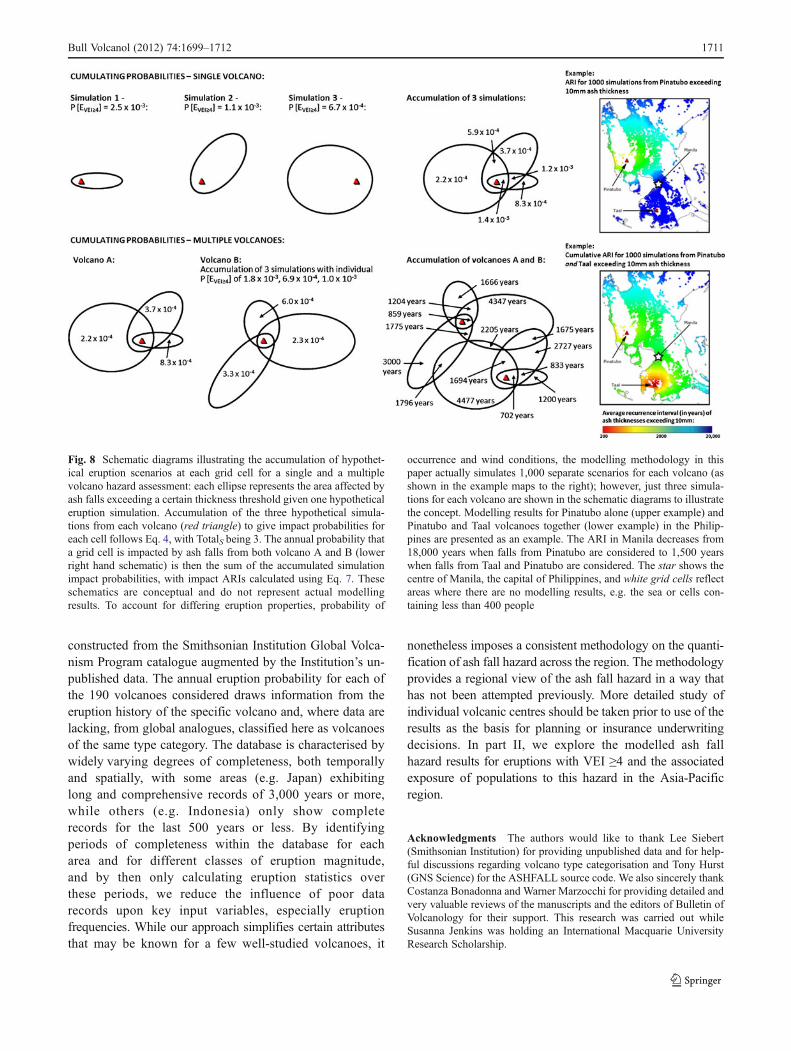
This procedure is shown in schematic form in Fig. 8where by way of example we assess the probability for ashthicknesses greater than 10 mm in the Philippines, arisingfrom eruptions at Pinatubo volcano in the first example and
Pinatubo and Taal together in the second example. Wedisplay results in terms of the ARI, approximately the in-verse of the AEP:
ARIx Z � z½ � � �1= ln 1� AEPx Z � z½ �ð Þ ð7ÞThe ARI at a given location is the estimated average time
(in years) between ash falls exceeding a given thickness:smaller thickness thresholds will result in shorter ARIs.When considering the ARI for falls exceeding 10 mm inManila (Fig. 8), values decrease from 18,000 years for fallsfrom Pinatubo to 1,500 years when falls from Taal are alsoconsidered. This average is calculated over a long timeperiod or, in this study, over a large number of simulationswhere each simulation is treated as an independent eruption.
Model limitations
As indicated earlier, our data completeness assessmentssuggest that more effective reporting of eruptions is limitedto the past 200 years of volcanism, although this variesconsiderably between areas. Our estimates of data completeness,
Fig. 6 Wind profile locations (blue arrows) across central Indonesiafrom 105° to 130° longitude and at −7.5° latitude, with reference tovolcano locations (red triangles). The mean speed along profiles isshown for three height levels: near-surface (1,000 mb), tropopause
(250 mb) and mid-stratosphere (20 mb). Wind roses at the samepressure levels show variations in wind direction (where wind blowsfrom) and thus dispersal direction, within the 10 year record for threeselected locations
Bull Volcanol (2012) 74:1699–1712 1709
and therefore calculation of eruption probabilities, are subject touncertainty, particularly in areas where breakpoints betweencomplete and incomplete subsets of data are difficult to identify.It is possible that longer eruption records are dominated byintensive studies at particular volcanoes, which is not accountedfor in assuming consistent recording across a geographical area.
Volcanoes with no recorded eruptions in the Holocene(approximately the last 10,000 years) are not included in ourassessment. As quiescent intervals between major eruptions atsome volcanoes can be thousands of years (Simkin 1993), andwith many historical records shorter than this, our assessmentmay ignore some volcanoes which have the potential to im-pact the region in the future. However, the probability-weighted contribution to the hazard from volcanoes with ARIsof the order 10,000 years will likely be minimal.
In assigning probabilities to eruption magnitudes, we haveused a crude form of volcanic profiling. The physical appear-ance of a volcano is the product of its past eruptive history andso volcanoes of a similar type category share many structuraland eruptive characteristics; however, certain volcanoes mayfall within different categories at various stages of their evo-lution. For example, the Okataina Volcanic Centre in NewZealand is classified here as a lava dome, while according toNairn (2005) the centre is best described by a complex of lavadomes within a caldera. Our categorisation may thereforeunderestimate the possible peril from this centre. Conversely,Krakatau, Indonesia, is classified as a caldera, whereas wemay expect near future eruptions to be more typical of smaller
magnitude cone formation eruptions (Simkin and Fiske 1983).While the type classification assigned by the SmithsonianInstitution may not always reflect the predominant style ofan eruption, at this particular juncture we have adopted theirclassification scheme. A more detailed volcano-by-volcanoassessment is beyond the scope of this study.
Each volcano is assigned a constant annual probability oferuption, regardless of the time elapsed since the last eruption.Accordingly, we have not accounted for time-varying probabil-ity such as the possibility of eruptions being temporally clustered(e.g. Auckland Volcanic Field: Bebbington and Cronin 2011) orchanges in the magmatic system and thus eruption style.
Ideally, ASHFALL should be calibrated against pasteruptions for each of our volcanoes of interest. Due to alack of preserved deposits, such a study would not bepossible for many of the volcanoes and certainly lies welloutside the scope of the present investigation. Nonetheless,we believe the use of this model is justified here in a broadassessment of ash fall hazard across the region, allowing usto identify areas at highest risk and those which may benefitfrom further, more detailed, study.
Conclusions
A methodology has been developed to assess the relativeash fall hazard across the Asia-Pacific region. Eruptionprobabilities are based on a global eruption database
Fig. 7 Mean wind directions and speeds over the Asia-Pacific regionat near surface, tropopause and mid-stratosphere pressure levels (1,000,250 and 20 mb) for the 10-year period 1997–2006. Individual 6-hourlywind profiles at 2.5° intervals are utilised, with each simulation
sampling randomly from the 10-year record, for the point closest tothe volcano. Figures generated using the NOAA/ESRL Physical Sci-ences Division website (http://www.cdc.noaa.gov/)
1710 Bull Volcanol (2012) 74:1699–1712
constructed from the Smithsonian Institution Global Volca-nism Program catalogue augmented by the Institution’s un-published data. The annual eruption probability for each ofthe 190 volcanoes considered draws information from theeruption history of the specific volcano and, where data arelacking, from global analogues, classified here as volcanoesof the same type category. The database is characterised bywidely varying degrees of completeness, both temporallyand spatially, with some areas (e.g. Japan) exhibitinglong and comprehensive records of 3,000 years or more,while others (e.g. Indonesia) only show completerecords for the last 500 years or less. By identifyingperiods of completeness within the database for eacharea and for different classes of eruption magnitude,and by then only calculating eruption statistics overthese periods, we reduce the influence of poor datarecords upon key input variables, especially eruptionfrequencies. While our approach simplifies certain attributesthat may be known for a few well-studied volcanoes, it
nonetheless imposes a consistent methodology on the quanti-fication of ash fall hazard across the region. The methodologyprovides a regional view of the ash fall hazard in a way thathas not been attempted previously. More detailed study ofindividual volcanic centres should be taken prior to use of theresults as the basis for planning or insurance underwritingdecisions. In part II, we explore the modelled ash fallhazard results for eruptions with VEI ≥4 and the associatedexposure of populations to this hazard in the Asia-Pacificregion.
Acknowledgments The authors would like to thank Lee Siebert(Smithsonian Institution) for providing unpublished data and for help-ful discussions regarding volcano type categorisation and Tony Hurst(GNS Science) for the ASHFALL source code. We also sincerely thankCostanza Bonadonna and Warner Marzocchi for providing detailed andvery valuable reviews of the manuscripts and the editors of Bulletin ofVolcanology for their support. This research was carried out whileSusanna Jenkins was holding an International Macquarie UniversityResearch Scholarship.
Fig. 8 Schematic diagrams illustrating the accumulation of hypothet-ical eruption scenarios at each grid cell for a single and a multiplevolcano hazard assessment: each ellipse represents the area affected byash falls exceeding a certain thickness threshold given one hypotheticaleruption simulation. Accumulation of the three hypothetical simula-tions from each volcano (red triangle) to give impact probabilities foreach cell follows Eq. 4, with TotalS being 3. The annual probability thata grid cell is impacted by ash falls from both volcano A and B (lowerright hand schematic) is then the sum of the accumulated simulationimpact probabilities, with impact ARIs calculated using Eq. 7. Theseschematics are conceptual and do not represent actual modellingresults. To account for differing eruption properties, probability of
occurrence and wind conditions, the modelling methodology in thispaper actually simulates 1,000 separate scenarios for each volcano (asshown in the example maps to the right); however, just three simula-tions for each volcano are shown in the schematic diagrams to illustratethe concept. Modelling results for Pinatubo alone (upper example) andPinatubo and Taal volcanoes together (lower example) in the Philip-pines are presented as an example. The ARI in Manila decreases from18,000 years when falls from Pinatubo are considered to 1,500 yearswhen falls from Taal and Pinatubo are considered. The star shows thecentre of Manila, the capital of Philippines, and white grid cells reflectareas where there are no modelling results, e.g. the sea or cells con-taining less than 400 people
Bull Volcanol (2012) 74:1699–1712 1711

Appendix 1
Description of terms, acronyms and mathematical notation
AEP Annual exceedance probabilityARI Average recurrence interval—
approximate inverse of the annualexceedance probability
ASHFALL Semi-analytical two-dimensional ashdispersion model developed by GNSScience, New Zealand
Global eruptiondatabase
The Smithsonian Institution’s GlobalVolcanism Program catalogue ofHolocene events supplemented withfurther unpublished records
1 Averaged annual eruption probabilityT Time period over which eruption
catalogue is thought to be completeVEI Volcanic explosivity index
References
Arnold M, Dilley M, Deichmann U, Chen RS, Lerner-Lam AL (2005)Natural disaster hotspots: a global risk analysis. In: Disaster riskmanagement 5. World Bank: Washington, DC. pp 1–145
Bacon CR (1982) Time-predictable bimodal volcanism in the CosoRange, California. Geology 10(2):65–69
Bebbington M, Cronin S (2011) Spatio-temporal hazard estimation inthe Auckland Volcanic Field, New Zealand, with a new event-ordermodel. Bull Volcanol 73(1):55–72
Blong RJ (1984) Volcanic hazards: a sourcebook on the effects oferuptions. Academic, Australia, pp 1–424
Bonadonna C, Connor CB, Houghton BF, Connor L, Byrne M, LaingA, Hincks TK (2005) Probabilistic modeling of tephra dispersal:hazard assessment of a multiphase rhyolitic eruption at Tarawera,New Zealand. J Geophys Res 110(B03203):1–21
Carey S, Sigurdsson H (1989) The intensity of plinian eruptions. BullVolcanol 51(1):28–40
Coles SG, Sparks RSJ (eds) (2006) Extreme value methods for mod-elling historical series of large volcanic magnitudes. Special Pub-lications of IAVCEI, Geological Society, London
Connor CB, Hill BE, Winfrey B, Franklin NM, La Femina PC (2001)Estimation of volcanic hazards from tephra fallout. Nat HazardsRev 2(1):33–42
Ewert JW (2007) System for ranking relative threats of U.S. volcanoes.Nat Hazards Rev 8(4):112–124
Ho C-H (1990) Bayesian analysis of volcanic eruptions. J VolcanolGeotherm Res 43(1–4):91–98
Hoblitt RP, Miller CD, Scott WE (1987) Volcano hazards with regardto siting nuclear power-plants in the Pacific Northwest. UnitedStates Geological Survey open-file report 87–297
Hurst AW (1994) ASHFALL, a computer program for estimatingvolcanic ash fallout: report and users guide. Institute of Geological& Nuclear Sciences Science Report 94
Hurst T, Smith W (2004) A Monte Carlo methodology for modellingashfall hazards. J Volcanol Geotherm Res 138(3–4):393–403
Jenkins SF, Magill CR, McAneney KJ (2007) Multi-stage volcanicevents: a statistical investigation. J Volcanol Geotherm Res 161(4):275–288
Jenkins S, Magill C, McAneney J, Hurst AW (2008) Multi-stagevolcanic events: tephra hazard simulations for the Okataina Vol-canic Center, New Zealand. J Geophys Res (Earth Surface) 113(F04012)
Jenkins S, McAneney J, Magill C, Blong R (2012) Regional ash fallhazard II: Asia-Pacific modelling results and implications. BullVolcanol. doi:10.1007/s00445-012-0628-7
Klein FW (1984) Eruption forecasting at Kilauea volcano, Hawaii. JGeophys Res 89(B5):3059–3073
Macedonio G, Costa A, Folch A (2008) Ash fallout scenarios atVesuvius: numerical simulations and implications for hazardassessment. J Geophys Res 178(3):366–377
Machida H, Arai F (1992) Atlas of tephra in and around Japan.University of Tokyo Press (in Japanese), Tokyo, pp 1–276
Magill C, Blong R (2005) Volcanic risk ranking for Auckland, NewZealand. II: hazard consequences and risk calculation. Bull Vol-canol 67(4):340–349
Marzocchi W, Zaccarelli L (2006) A quantitative model for the time–size distribution of eruptions. J Geophys Res 111(B4):B04204
Nairn IA (2005) Volcanic hazards at Okataina Volcanic Centre. GNSScience
Newhall CG, Self S (1982) The volcanic explosivity index (VEI)—anestimate of explosive magnitude for historical volcanism. J Geo-phys Res 87:1231–1238
Newhall CG, Bronto S, Alloway B, Banks NG, Bahar I, del MarmolMA, Hadisantono RD, Holcomb RT, McGeehin J, Miksic JN,Rubin M, Sayudi SD, Sukhyar R, Andreastuti S, Tilling RI,Torley R, Trimble D, Wirakusumah AD (2000) 10,000 years ofexplosive eruptions of Merapi Volcano, Central Java: archaeolog-ical and modern implications. J Volcanol Geotherm Res 100(1–4):9–50
Oak Ridge National Laboratory (2005) LandScanTM Global Popula-tion Database
Siebert L, Simkin T (2002-) Volcanoes of the world: an illustratedcatalog of Holocene volcanoes and their eruptions. SmithsonianInstitution, Global Volcanism Program digital information series,GVP-3. (http://www.volcano.si.edu/world/)
Simkin T (1993) Terrestrial volcanism in space and time. Annu RevEarth Planet Sci 21:427–452
Simkin T, Fiske R (1983) Krakatau 1883: the volcanic eruption and itseffects. Smithsonian Institution Press, New York
Simkin T, Siebert L (1994) Volcanoes of the world. Geoscience Press,Tucson, pp 1–349
Small C, Naumann T (2001) The global distribution of human popu-lation and recent volcanism. Global Environ Chang Part B: Envi-ron Hazards 3(3–4):93–109
Spence R, Gunesekara R, Zuccaro G (2009) Insurance risks fromvolcanic eruptions in Europe. WRN Research Bulletin, WillisResearch Network
Thouret J-C, Lavigne F, Kelfoun K, Bronto S (2000) Toward a revisedhazard assessment at Merapi volcano, Central Java. J VolcanolGeotherm Res 100(1–4):479–502
Voight B, Constantine EK, Siswowidjoyo S, Torley R (2000) Historicaleruptions of Merapi Volcano, Central Java, Indonesia, 1768–1998. J Volcanol Geotherm Res 100(1–4):69–138
Woods AW, Bursik MI (1991) Particle fallout, thermal disequilibriumand volcanic plumes. Bull Volcanol 53:559–570
Yokoyama I, Tilling R, Scarpa R (1984) International mobile early-warning system(s) for volcanic eruptions and related seismicactivities. FP/2106-82-01 (2286), UNESCO, Paris
1712 Bull Volcanol (2012) 74:1699–1712