regional and local new particle formation events observed...
TRANSCRIPT

Regional and local new particle formation events observedin the Yangtze River Delta region, ChinaLiang Dai1 , Honglei Wang2, Luyu Zhou1, Junlin An2, Lili Tang3 , Chunsong Lu2, Wenlian Yan4,Ruiyang Liu4, Shaofei Kong5, Mindong Chen1, Shanhu Lee6 , and Huan Yu1
1School of Environmental Science and Engineering, Nanjing University of Information Science and Technology, Nanjing,China, 2School of Atmospheric Physics, Nanjing University of Information Science and Technology, Nanjing, China, 3JiangsuEnvironmental Monitoring Center, Nanjing, China, 4Jiangsu Meteorological Observatory, Nanjing, China, 5Department ofAtmospheric Science, China University of Geosciences, Wuhan, China, 6Department of Atmospheric Science, University ofAlabama in Huntsville, Huntsville, Alabama, USA
Abstract To study the spatial inhomogeneity of new particle formation (NPF) in the polluted atmosphereof China, we conducted simultaneous measurements at an urban site near a petrochemical industrial areaand a regional background site in the Yangtze River Delta region from September to November 2015. At theurban site we observed a type of local NPF event (number of events: n=5), in which nucleation was limited toa small area but persisted for 6.8 h on average during the daytime. Formation rates of 5 nm particles (J5)were found to be correlated positively with the H2SO4 proxy (log J5 versus log[H2SO4] slope near 1) in bothlocal and regional events. Furthermore, J5 was enhanced by the anthropogenic volatile organic carbon (VOC)plumes from nearby industrial area in the local events compared to the regional events. Size-dependentaerosol dynamics calculation showed that in comparison with the observed regional events, the local eventswere featured with high nucleation rate (J1.3> 1000 cm�3 s�1), high growth rate of sub-3 nm particles(GRsub-3> 20 nmh�1), and high number concentration of nucleation mode particles (mean peak N5-20:6 × 104 cm�3). Considering these features, the local NPF events of anthropogenic origin may also be animportant contributor to cloud condensation nuclei concentrations in urban and regional scales. In addition,the comparison of simultaneous regional NPF events between the two sites (number of events: n=7)suggested that regional NPF intensity may be underestimated by the single-point measurement at an urbansite, due to the heterogeneity of air masses.
1. Introduction
New particle formation (NPF) is an important source of secondary aerosols in the atmosphere. Field studiesand model simulations have consistently shown that NPF contributes significantly to global cloud condensa-tion nuclei (CCN) production [Matsui et al., 2013;Merikanto et al., 2009; Pierce and Adams, 2009; Spracklen et al.,2008;Wiedensohler et al., 2009; Yu and Luo, 2009; Yue et al., 2011]. It is generally assumed that NPF is a regionalphenomenon that could extend over distances of hundreds of kilometers. This is confirmed by satellitemeasurements [Kulmala et al., 2011] and multiple-station measurements [Crippa and Pryor, 2013; Dal Masoet al., 2007; Hussein et al., 2009; Jeong et al., 2010; Stanier et al., 2004; Vana et al., 2004; Wehner et al., 2007].Nucleation in such NPF event is triggered by regional-scale photochemistry, and the size of new particlesgrows over time for a few hours. Consequently, a well-defined “banana-shaped” aerosol size evolution canbe observed from stationary measurements.
Intense nucleation burst without subsequent growth has also been frequently observed in single- ormultiple-station measurements. Such nucleation burst is usually characterized by high intensity, short dura-tion, and high frequency [Dall’Osto et al., 2013; Hussein et al., 2009; Jeong et al., 2010]. The maximum particlesizes are usually below ~30 nm, which indicated their recent formation from nearby sources. Sources andmechanisms of nucleation bursts are complicated and may differ from location to location. Nucleation burstcould be from iodine oxides in the coastal marine boundary layer [O’Dowd et al., 2002; Sipilä et al., 2016],low-volatility vapors in industrial plumes [Brock et al., 2002, 2003; Sarnela et al., 2015], or nucleation insidevehicle engines [Alanen et al., 2015; Jayaratne et al., 2009; Karjalainen et al., 2016]. The available knowledgeon nucleation burst is scarce due to the complexity and variability of the phenomenon.
Heavily polluted urban areas in developing counties like China are becoming hot spots of NPF [Herrmannet al., 2014; Kulmala et al., 2016; Nie et al., 2014; Wang et al., 2014, 2015; Xiao et al., 2015; Yu et al., 2016]. In
DAI ET AL. SIMULTANEOUS NPF MEASUREMENTS AT TWO SITES 1
PUBLICATIONSJournal of Geophysical Research: Atmospheres
RESEARCH ARTICLE10.1002/2016JD026030
Special Section:East Asian Study ofTropospheric Aerosols andImpact on Cloud andPrecipitation
Key Points:• We observed strong local nucleationevent in anthropogenic VOC plumesat an urban site near a petrochemicalindustrial area
• The local NPF events had higherparticle formation and growth ratesthan the regional NPF events insub-3 nm size range
• The regional new particle formationintensity may be underestimated bythe single-point measurement at anurban site
Correspondence to:H. Yu and J. An,[email protected];[email protected]
Citation:Dai, L., et al. (2017), Regional and localnew particle formation events observedin the Yangtze River Delta region, China,J. Geophys. Res. Atmos., 122, doi:10.1002/2016JD026030.
Received 30 SEP 2016Accepted 10 FEB 2017Accepted article online 14 FEB 2017
©2017. American Geophysical Union.All Rights Reserved.

general, NPF is an unexpected phenomenon in polluted environments, due to exceedingly high loadings ofpreexisting aerosol particles. However, recent sub-3 nm particle measurements at nine locations around theworld indicate that the production of sub-3 nm particles is determined by the availability of precursor vaporsrather than the coagulation sink [Kontkanen et al., 2016]. Therefore, it is possible that emissions of abundantanthropogenic SO2 and volatile organic carbon (VOC) and the high oxidation capacity typically found in thepolluted urban atmosphere can actually provide a strong source of sulfuric acid and/or low-volatility organiccompounds. Understanding NPF strength, sources, and spatial/temporal variations in urban areas is useful inmaking regional air quality policies and developing air quality models.
In our previous paper [Yu et al., 2016], we have measured the seasonal variation and the cluster dynamics ofsub-3 nm particles at an urban site in the vicinity of a petrochemical industrial area in Nanjing, a megacity inthe Yangtze River Delta (YRD) of eastern China. Sub-3 nm particle formation was observed on nearly half ofobservation days, but these particles did not grow to sizes larger than a few nanometers. The present studyis a continuation of thework by Yu et al. [2016]. In addition to the urban site in Yu et al. [2016], we chose a regio-nal background site 100 km south to the urban site to conduct simultaneous NPF measurements fromSeptember to November 2015, one of the seasons that are most favorable for NPF in Nanjing. To the best ofour knowledge, multiple-point simultaneous NPF measurement in China has only been conducted by Wanget al. [2013] at an urban site in Beijing and a nearby regional background site in theNorth China Plain. The focusof the present study is to address the following questions: (1) Can themeasurement at an urban site representthe NPF features in its surrounding region? (2) How do petrochemical industrial emissions affect NPF at theurban site? (3) Is it possible to differentiate the spatial extent of NPF events, such as local versus regionalevents? (4) What are the size dependences of formation rate and growth rate in the size range of 1–50 nm?.
2. Experiments2.1. Measurement Sites
The urban site (32.30°N, 118.72°E, Figure 1) is located in a university campus that is about 15 km to the north-west of downtown Nanjing. Three to 15 km to the east of the site are clusters of industrial facilities in theNanjing Chemical Industry District [An et al., 2015; Wang et al., 2014]. The urban site is occasionally affectedby industrial plumes, probably containing SO2, NOx, NH3, VOCs, and amines [Zheng et al., 2015], emittedthrough a variety of petrochemical processes, including smelting, petroleum refining, and gas flaring atpetrochemical facilities. The prevailing wind direction at the site during the campaign was easterly duringthe observational period (see wind rose plot, Figure 1).
The regional background site (RB site, 31.30°N, 118.93°E) is one of the two regional background monitoringstations run by the Nanjing Environmental Protection Bureau. The RB site is 100 km south to the urban site
Figure 1. Locations of urban and regional background (RB) sites and wind rose plots during the campaign. Red circlesindicate city clusters in the YRD region.
Journal of Geophysical Research: Atmospheres 10.1002/2016JD026030
DAI ET AL. SIMULTANEOUS NPF MEASUREMENTS AT TWO SITES 2

and located at the center of the west part of the YRD region (Figure 1). The site is situated at the north shoreof Lake Gucheng and is surrounded by lakes, farms, and fish ponds. It is one of the places with best air qualityin Nanjing. Local air quality is mainly influenced by regional pollutants transported from city clusters alongthe Yangtze River and the east side of Taihu Lake. The prevailing wind direction at the site varied betweennortheasterly and southeasterly during the campaign (Figure 1).
While air at the urban site was directly affected by local or nearby emission sources, the RB site was affectedby pollutants transported from more distant sources. Here are some evidences: concentrations of SO2, NO2,CO, and PM2.5 were higher at the urban site than the RB site (Table 1). On the other hand, secondary pollutantO3 concentrations at the RB site were higher than the urban site. On average, the modal diameter of aerosolparticles was smaller at the urban site (53 ± 20 nm) than that at the RB site (96 ± 35 nm).
2.2. Instrumentation
Particle number size distributions were measured at the urban site by a TSI nano-SMPS (a differential mobilityanalyzer DMA3085 and a condensation particle counter CPC3776; scanning range: 4–70 nm) and a MSP wide-range particle spectrometer (MSP Corp., WPS XP-1000; scanning range: 70–750 nm). It was determined in ourprevious field measurements that our WPS number concentration was on average 47% (range: 39–68%)lower than that of TSI SMPS in 10–500 nm size range [Wang et al., 2011]. Therefore, we scaled up the particlenumber concentrations counted by the WPS (N70-750) by a factor of 1.88 to match the counts between theSMPS and WPS. By doing this, smooth size spectra were obtained in the size range of 4–750 nm for themajority of the campaign. Although the scaling might bring an uncertainty up to ±27% in N70-750, it wasproven to be the best smoothing strategy to facilitate the mode fitting in the 4–750 nm size range for themajority of campaign data. At the RB site particle size distributions in the range from 3 to 750 nm wereobtained by integrating a TSI nano-SMPS (DMA3085 and CPC3776; scanning range: 3–64 nm) and a TSI longSMPS (DMA3081 and CPC3775; scanning range: 64–750 nm). Prior to the campaign, calibration of particleinstruments was made using standard polystyrene latex particles. Particle number concentrations measuredwith the instruments deployed at the urban site were 6% higher than those at the RB site but with anexcellent correlation (R2 = 0.98).
Air sampling inlet at the RB site was a 72 cm long and 1.0 cm inner diameter (ID) horizontally oriented stain-less steel (SS) tube with an airflow of 12 standard liters per minute (sLpm). The inlet at the urban site was a150 cm long and 1.0 cm ID vertically oriented SS tube with an airflow of 5 sLpm. Transport loss of particlesin the inlets was corrected using the size-dependent particle survival ratios calculated with a particle losscalculator tool [von der Weiden et al., 2009]. Scanning cycles of both systems were 4min. Because the lowerends of the two scanning systems were slightly different (3 nm at the urban site versus 4 nm at the RB site),we calculated the formation rates of 5 nm particles to reconcile the comparison between the two sites (seenext section).
To derive size-resolved formation and growth rates down to ~1 nm in NPF events, a nano CondensationNucleus Counter system (nCNC, Airmodus Oy, Finland) was deployed at the RB site (8–24 October 2015)and the urban site (25 October to 12 November 2015). The system consists of a Particle Size Magnifier(PSM, model A10) and a butanol CPC (model A20). The system (hereafter, referred to as PSM) sampled
Table 1. Summary of NPF Classification and Trace Gas and Aerosol Quantities at the Two Measurement Sites Duringthe Campaign
Urban Regional Background
Total valid observation day 55 55Regional event number 7 11Simultaneous regional event number 7 7Local event 5 0Non-NPF or unidentified 43 44CS (s�1) 0.04 ± 0.025 0.026 ± 0.014PM2.5 (μgm
�3) 48.6 ± 39.5 37.5 ± 21.9SO2 (ppbv) 6.4 ± 5.2 3.63 ± 2.57NO2 (ppbv) 18.3 ± 10.8 10.8 ± 5.9CO (ppmv) 0.96 ± 0.53 0.58 ± 0.23O3 (ppbv) 17.4 ± 13.6 34.6 ± 19.7
Journal of Geophysical Research: Atmospheres 10.1002/2016JD026030
DAI ET AL. SIMULTANEOUS NPF MEASUREMENTS AT TWO SITES 3

ambient air via a separate sampling tube of 72 cm long and 1.0 cm ID (airflow rate: 12 sLpm). The PSM wasoperated in a continuous scanning mode with a cycle of 240 steps between saturator flow rates of 0.1and 1.0 sLpm within 240 s. A Gaussian method developed by Lehtipalo et al. [2014] was used to invertraw scanning data to size-resolved concentrations in sub-3 nm size range (time resolution: 4min),which were classified into six size bins, i.e., 1.3–1.5, 1.5–1.8, 1.8–2.0, 2.0–2.3, 2.3–2.6, and 2.6–3.0 nm.Using nonnegative least squares fitting function, the Gaussian method reduces the noise level of sizespectra compared to the stepwise method that we used previously [Yu et al., 2016]. Loss of 1.3–3.0 nmparticles in the sampling inlet was corrected using the size-dependent particle transport survival ratiosof 67–86%.
A gas chromatograph system (GC 5000, AMA Instruments GmbH, Germany) was set up at the urban site tomonitor VOC plumes during the campaign. The system monitored hourly concentrations of 56 differentC2-C12 ozone precursors designated by the U.S. Environmental Protection Agency, including alkanes,alkenes, alkynes, and aromatics. The calibration of the GC instrument was described by An et al. [2014]. Atboth sites sulfur dioxide (SO2), ozone (O3), carbon monoxide (CO), and nitrogen oxide (NO2) were measuredevery 1min with Thermo Environmental Instruments (model 43i-TLE, 49i, 48i, and 42i). PM2.5 was monitoredwith Thermo Scientific TEOM 1405. Meteorological variables including wind speed, wind direction, relativehumidity (RH), and temperature were recorded every 1 h during the campaign at both sites. Global radiationwas measured every 1 h at the urban site.
2.3. Size-Dependent Formation Rate and Growth Rate Calculation
Rapid growth of small particles in the urban atmosphere was the motivation to use the general dynamicequation (GDE) to calculate particle growth and formation rates [Yu et al., 2016]. The method wasdescribed in detail by Yu et al. [2016]. Briefly, we first define a few successive size bins from the lowerend of size spectrum to 50 nm. For an aerosol population that is growing via condensation and coagula-tion, the evolution of number concentration in a size bin between particle diameters Dp1 and Dp2
(Dp2>Dp1) is
dN Dp1;Dp2; t� �
dt¼ J Dp1; t
� �� J Dp2; t� �� CoagSnk Dp1;Dp2; t
� �þ CoagSrc Dp1;Dp2; t� �
(1)
where N(Dp1,Dp2, t) is the particle number concentration in the size bin, inverted from the PSM or SMPS scan-ning data. J is condensational growth flux (i.e., particle formation rate) across the lower (Dp,1) or upper (Dp,2)boundaries of the size bin. CoagSnk(Dp1,Dp2, t) and CoagSrc(Dp1,Dp2, t) are the calculated sink and sourceterms defining the coagulation out of and into the size bin. By assuming J(50 nm, t) in the largest size bin(i.e., the condensational growth flux out of 50 nm) to be negligible [Yu et al., 2016], we can calculate theformation rates J(Dp, t) across all size bin boundaries. After the formation rates J(Dp, t) were obtained, conden-sational growth rate GR(Dp, t) was calculated from the relationship GR(Dp, t) = J(Dp, t)/n(Dp, t), where n(Dp, t) isparticle size distribution calculated from n(Dp, t) = dN(t)/dDp for each size bin.
Five size bins of 5–10, 10–20, 20–30, 30–40, and 40–50 nm were defined for the SMPS/WPS scanning at bothsites. Accordingly, we obtained J(5 nm, t), GR(10 nm, t), GR(20 nm, t), GR(30 nm, t), and GR(40 nm, t)(hereafter J5, GR10, GR20, GR30, and GR40). For the period when the PSM was operated, there were anotherseven size bins defined below 5nm: six size bins from 1.3 nm to 3.0 nm for the PSM scanning (see thepreceding section) and a size bin of 3–5 nm, which were calculated from the difference betweenN3 measuredwith the PSM and N5 measured with the SMPS. Therefore, during the NPF events when PSM was operating,we were able to calculate the formation rates and growth rates at the lower boundaries of 12 size bins downto 1.3 nm (except GR1.3).
The GR(Dp, t) here is the condensational growth rate due to the striking of gas molecules onto particle surface.In contrast, mode fitting method yields apparent growth rate or modal growth rate, which is the sum ofcondensational growth rate and the growth rate due to intramodal and intermodal coagulations [Leppäet al., 2011]. To compare with and verify our GDEmethod, we also calculated the condensational growth ratesfrom modal growth rates for all banana-shaped events. The approach was adapted from Stolzenburg et al.[2005]. First, a nucleation mode and a preexisting mode (30–300 nm, in the size range of Aitken mode andaccumulation mode) were fit for each particle number size distribution, using a least squares fitting program.Second, linear fits of the mode diameter Dg of nucleation mode versus time yielded the apparent growth
Journal of Geophysical Research: Atmospheres 10.1002/2016JD026030
DAI ET AL. SIMULTANEOUS NPF MEASUREMENTS AT TWO SITES 4

rates at 10 nm, 20 nm, 30 nm, and 40 nm, respectively. Third, the growth rates of the nucleation mode due tointramodal and extramodal coagulations were calculated for the periods when Dgwere 10 nm, 20 nm, 30 nm,and 40 nm, respectively. Fourth, condensational growth rates were calculated by subtracting the coagulationgrowth rates from the apparent growth rates at the four sizes, respectively.
The results of condensational growth rates calculated with the GDE method (GRCond,GDE) and the modefitting method (GRCond,mf) are shown in Figure 2 for 14 regional NPF events that had distinctive bananacontour plots. Overall, the agreement between the two methods was good. It can be seen that GRCond,GDEwas lower than GRCond,mf with a GRCond,GDE/GRCond,mf ratio of 0.92 (Pearson’s correlation coefficientr=0.89), 0.88 (r=0.48), and 0.79 (r=0.8) at 20, 30, and 40 nm, respectively. On the other hand, at 10 nmGRCond,GDE was higher than GRCond,mf (GRCond,GDE/GRCond,mf = 1.43, r=0.24). This can be explained as follows.The GDE method underestimated J20, J30, and J40 (thus GR20, GR30, and GR40), because we assumed J50 to bezero. At the smaller size of 10 nm, however, the modal growth rate not only resulted from condensationalgrowth and coagulation but also was strongly slowed down in a persistent nucleation event by addition ofnewly formed particles smaller than 10 nm into the nucleation mode. By neglecting the effect of nucleationin the calculation (i.e., GRCond,mf =GRapparent�GRcoag), GRCond,mf was underestimated at 10 nm. The compar-ison in Figure 2 thus suggests that the growth rates calculated from our GDE method can avoid the potentialunderestimation in the mode fitting method in small size ranges. Hence, GRCond,GDE is used in the rest of thispaper to represent growth rates.
Formation rates J(Dp, t) and growth rates GR(Dp, t) in a NPF event are both size dependent and time depen-dent. To decouple the dependence of J(Dp, t) on time, we first found the maximum formation rate J(Dp)max atparticle size Dp during the entire event period, which was assumed to be representative of the formation rateat that size. For a typical banana-shaped event, J(Dp)max was also the formation rate during the period whenthe mode diameter of nucleation mode surpassed Dp. The representative growth rate GR(Dp) at the particlesize Dp was then calculated as GR(Dp) = J(Dp)max/n(Dp), where n(Dp) is size distribution. The results of size-dependent J(Dp)max and GR(Dp) are discussed in section 3.4.
Figure 2. Comparisons of condensational growth rates calculated from the GDE method (GRCond,GDE) and the modefitting method (GRCond,mf) at 10, 20, 30, and 40 nm during the regional events.
Journal of Geophysical Research: Atmospheres 10.1002/2016JD026030
DAI ET AL. SIMULTANEOUS NPF MEASUREMENTS AT TWO SITES 5

3. Results and Discussion3.1. NPF Classification at the Two Sites
Conventional NPF classification in most previous studies was based on Dal Maso et al.’s [2005] scheme, thefocus of which is the banana-shaped regional event. Here we defined two types of NPF events, regionalversus local, on the basis of the comparison of size spectra between the two measurement sites.3.1.1. Regional NPF EventsA regional NPF event in this study is the same as a Class I event defined by Dal Maso et al. [2005]. A typicalnumber size-time plot of the regional event is shown in Figure 3a. Out of 55 total observation days, therewere seven regional events occurring simultaneously at the two sites (Table 1). In addition, there were fourregional events observed at the RB site but not the urban site. It has been recognized that spatial variationsof nucleation and growth in an inhomogeneous air mass could lead to different temporal evolution patternsof particle size spectra observed at a fixed monitoring location [Kivekäs et al., 2016]. In the case of the regionalevent like Figure 3a, spatial component SJ(X) and temporal component TJ(t) of nucleation rates J weresketched on the right panel of Figure 3a, in which time-dependent and upwind distance-dependent J isdefined as Jmax × SJ(X) × TJ(t). Here Jmax is the maximum nucleation rate during the event. TJ(t) is the dimen-sionless temporal component of J(X,t), and SJ(X) is the dimensionless spatial component of J(X,t). The sketchshows that nucleation occurred in a large spatial extent but was limited in a short period from 10:00 A.M. to13:00 P.M. (local time). As a result, a banana-shaped contour was observed at a fixed monitoring location.
During the regional event in Figure 3a, the growth of new particles lasted for more than 12 h from the morn-ing to midnight. By tracing back trajectories calculated with the NOAA Hybrid Single-Particle Lagrangian
Figure 3. Aerosol size spectra during a typical (a) regional and (b) local events. Spatial component SJ(X) and temporal com-ponent TJ(t) of nucleation rates J(X, t) are sketched on the right side panels for the regional and local events, respectively.
Journal of Geophysical Research: Atmospheres 10.1002/2016JD026030
DAI ET AL. SIMULTANEOUS NPF MEASUREMENTS AT TWO SITES 6

Integrated Trajectory model [Draxler and Rolph, 2010] during the growth period all the way back to theupwind locations where nucleation occurred, we estimated the minimum spatial scales of such regionalNPF events to be 500–700 km upwind of the measurement site in the seven regional events. Theestimation approach was described by Yu et al. [2014] in detail. Our estimation is roughly consistent withprevious estimations [Crippa and Pryor, 2013; Hussein et al., 2009; Kulmala et al., 2001].3.1.2. Local NPF EventsAt the urban site we observed another type of strong particle formation event starting from the lower end ofsize spectrum, but the mode diameter of nucleation mode never grew beyond 20 nm. The events were notsporadic nucleation burst or particle spray but lasted for at least 5 h. N5-20 exhibited a clear diurnal variationwith peak concentration higher than 1 × 104 cm�3 at around noontime. Therefore, the events were mostlikely linked to photochemistry. We defined the events that fulfill the above criteria as local events, because(1) the events were only observed at the urban site, not the RB site, and (2) the new particles did not haveenough time to grow to larger than 20 nm, as they were transported from nearby upwind areas. A typicalcontour plot of the local event is shown in Figure 3b. During the campaign the local event occurred five times.In our previous paper [Yu et al., 2016], we had also occasionally observed such local events in various seasonsat the urban site.
In the case of the local event, nucleation was limited in a small area around the measurement site (shown asSJ(X) in Figure 3b), but it persisted throughout the daytime when the photochemistry is active (shown as TJ(t)).The persistent nucleation and growth throughout the day supplied new particles continuously, forming anucleation mode with Dg smaller than 20 nm and relatively large variance σg (1.7 ± 0.3 in local events versus1.5 ± 0.16 in regional events). Using typical growth rates of 5–10 nmh�1 below 20 nm that were integratedfrom the size-dependent GR(Dp), it took 2–4 h for new particles to grow to 20 nm. By tracing the
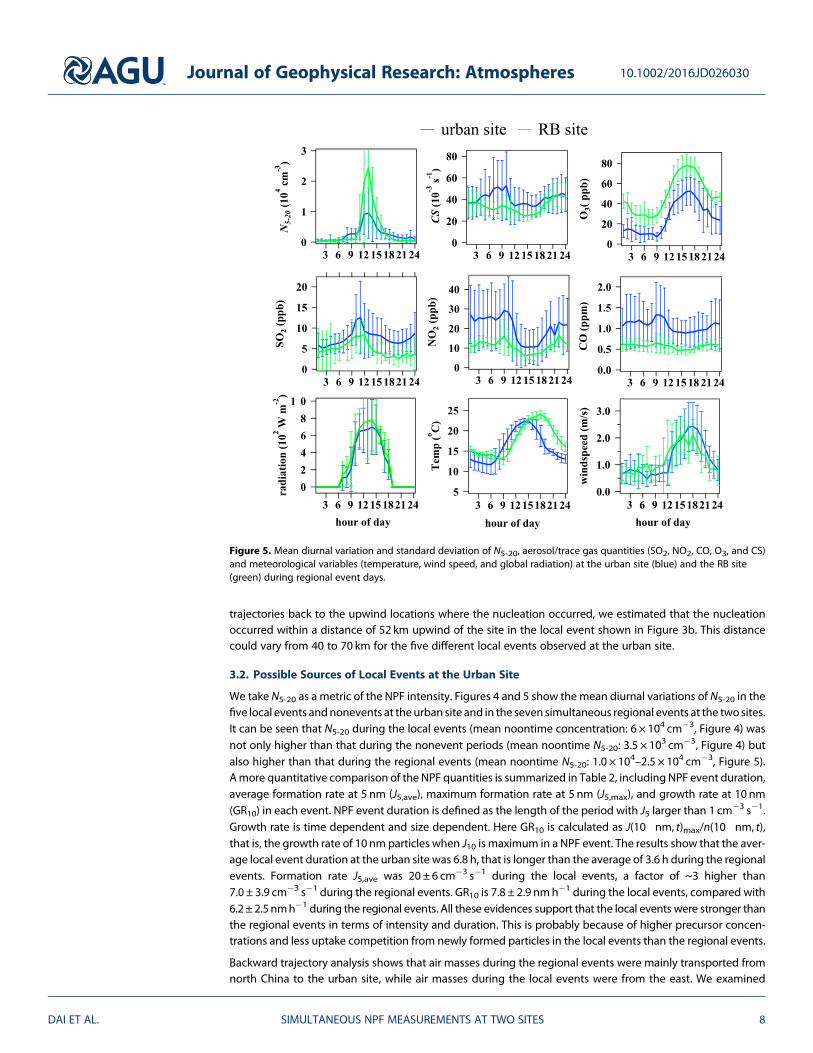
Figure 4. Mean diurnal variation and standard deviation of N5-20, aerosol/trace gas quantities (SO2, NO2, CO, O3, and CS),and meteorological variables (temperature, wind speed, and global radiation) during local event days (red) and noneventdays (grey) at the urban site.
Journal of Geophysical Research: Atmospheres 10.1002/2016JD026030
DAI ET AL. SIMULTANEOUS NPF MEASUREMENTS AT TWO SITES 7
trajectories back to the upwind locations where the nucleation occurred, we estimated that the nucleationoccurred within a distance of 52 km upwind of the site in the local event shown in Figure 3b. This distancecould vary from 40 to 70 km for the five different local events observed at the urban site.
3.2. Possible Sources of Local Events at the Urban Site
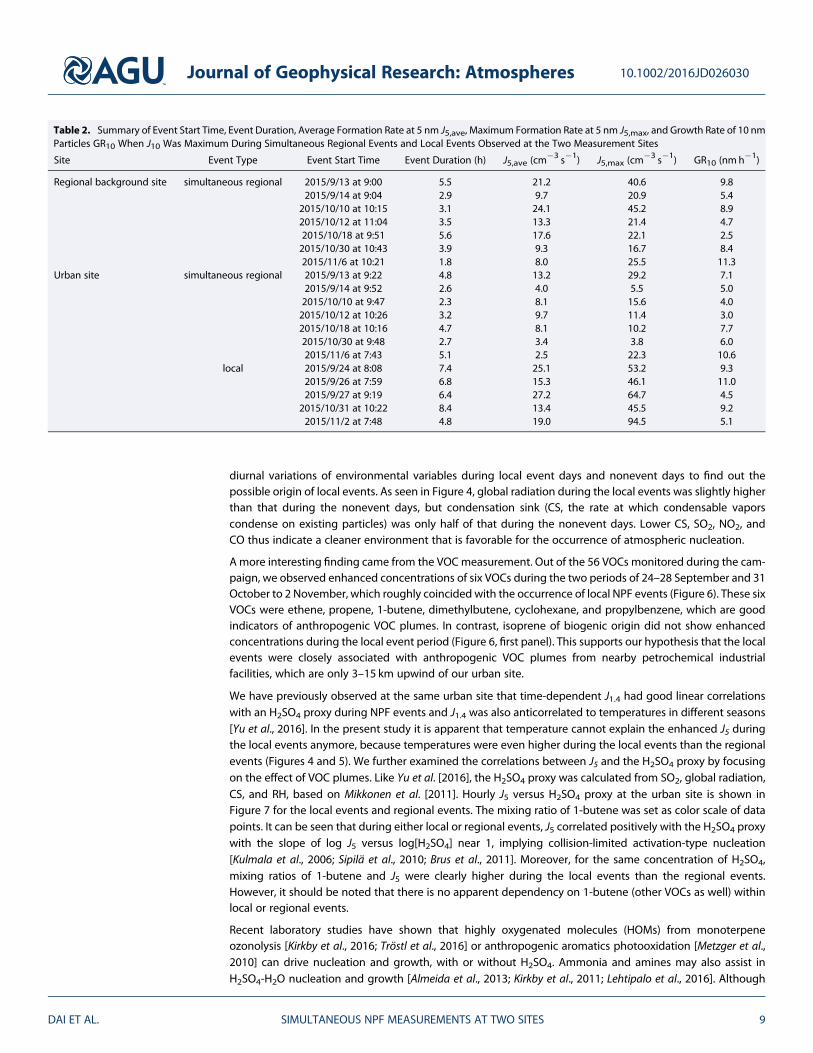
We take N5-20 as a metric of the NPF intensity. Figures 4 and 5 show themean diurnal variations of N5-20 in thefive local events andnonevents at theurban site and in the seven simultaneous regional events at the two sites.It can be seen that N5-20 during the local events (mean noontime concentration: 6 × 104 cm�3, Figure 4) wasnot only higher than that during the nonevent periods (mean noontime N5-20: 3.5 × 103 cm�3, Figure 4) butalso higher than that during the regional events (mean noontime N5-20: 1.0 × 10⁴–2.5 × 104 cm�3, Figure 5).Amore quantitative comparison of the NPF quantities is summarized in Table 2, including NPF event duration,average formation rate at 5 nm (J5,ave), maximum formation rate at 5 nm (J5,max), and growth rate at 10 nm(GR10) in each event. NPF event duration is defined as the length of the period with J5 larger than 1 cm�3 s�1.Growth rate is time dependent and size dependent. Here GR10 is calculated as J(10 nm, t)max/n(10 nm, t),that is, the growth rate of 10 nm particles when J10 is maximum in a NPF event. The results show that the aver-age local event duration at the urban site was 6.8 h, that is longer than the average of 3.6 h during the regionalevents. Formation rate J5,ave was 20 ± 6 cm�3 s�1 during the local events, a factor of ~3 higher than7.0 ± 3.9 cm�3 s�1 during the regional events. GR10 is 7.8 ± 2.9 nmh�1 during the local events, compared with6.2± 2.5nmh�1 during the regional events. All these evidences support that the local events were stronger thanthe regional events in terms of intensity and duration. This is probably because of higher precursor concen-trations and less uptake competition from newly formed particles in the local events than the regional events.
Backward trajectory analysis shows that air masses during the regional events were mainly transported fromnorth China to the urban site, while air masses during the local events were from the east. We examined
Figure 5. Mean diurnal variation and standard deviation of N5-20, aerosol/trace gas quantities (SO2, NO2, CO, O3, and CS)and meteorological variables (temperature, wind speed, and global radiation) at the urban site (blue) and the RB site(green) during regional event days.
Journal of Geophysical Research: Atmospheres 10.1002/2016JD026030
DAI ET AL. SIMULTANEOUS NPF MEASUREMENTS AT TWO SITES 8
diurnal variations of environmental variables during local event days and nonevent days to find out thepossible origin of local events. As seen in Figure 4, global radiation during the local events was slightly higherthan that during the nonevent days, but condensation sink (CS, the rate at which condensable vaporscondense on existing particles) was only half of that during the nonevent days. Lower CS, SO2, NO2, andCO thus indicate a cleaner environment that is favorable for the occurrence of atmospheric nucleation.
A more interesting finding came from the VOCmeasurement. Out of the 56 VOCs monitored during the cam-paign, we observed enhanced concentrations of six VOCs during the two periods of 24–28 September and 31October to 2 November, which roughly coincided with the occurrence of local NPF events (Figure 6). These sixVOCs were ethene, propene, 1-butene, dimethylbutene, cyclohexane, and propylbenzene, which are goodindicators of anthropogenic VOC plumes. In contrast, isoprene of biogenic origin did not show enhancedconcentrations during the local event period (Figure 6, first panel). This supports our hypothesis that the localevents were closely associated with anthropogenic VOC plumes from nearby petrochemical industrialfacilities, which are only 3–15 km upwind of our urban site.
We have previously observed at the same urban site that time-dependent J1.4 had good linear correlationswith an H2SO4 proxy during NPF events and J1.4 was also anticorrelated to temperatures in different seasons[Yu et al., 2016]. In the present study it is apparent that temperature cannot explain the enhanced J5 duringthe local events anymore, because temperatures were even higher during the local events than the regionalevents (Figures 4 and 5). We further examined the correlations between J5 and the H2SO4 proxy by focusingon the effect of VOC plumes. Like Yu et al. [2016], the H2SO4 proxy was calculated from SO2, global radiation,CS, and RH, based on Mikkonen et al. [2011]. Hourly J5 versus H2SO4 proxy at the urban site is shown inFigure 7 for the local events and regional events. The mixing ratio of 1-butene was set as color scale of datapoints. It can be seen that during either local or regional events, J5 correlated positively with the H2SO4 proxywith the slope of log J5 versus log[H2SO4] near 1, implying collision-limited activation-type nucleation[Kulmala et al., 2006; Sipilä et al., 2010; Brus et al., 2011]. Moreover, for the same concentration of H2SO4,mixing ratios of 1-butene and J5 were clearly higher during the local events than the regional events.However, it should be noted that there is no apparent dependency on 1-butene (other VOCs as well) withinlocal or regional events.
Recent laboratory studies have shown that highly oxygenated molecules (HOMs) from monoterpeneozonolysis [Kirkby et al., 2016; Tröstl et al., 2016] or anthropogenic aromatics photooxidation [Metzger et al.,2010] can drive nucleation and growth, with or without H2SO4. Ammonia and amines may also assist inH2SO4-H2O nucleation and growth [Almeida et al., 2013; Kirkby et al., 2011; Lehtipalo et al., 2016]. Although
Table 2. Summary of Event Start Time, Event Duration, Average Formation Rate at 5 nm J5,ave, Maximum Formation Rate at 5 nm J5,max, and Growth Rate of 10 nmParticles GR10 When J10 Was Maximum During Simultaneous Regional Events and Local Events Observed at the Two Measurement Sites
Site Event Type Event Start Time Event Duration (h) J5,ave (cm�3 s�1) J5,max (cm
�3 s�1) GR10 (nmh�1)
Regional background site simultaneous regional 2015/9/13 at 9:00 5.5 21.2 40.6 9.82015/9/14 at 9:04 2.9 9.7 20.9 5.4
2015/10/10 at 10:15 3.1 24.1 45.2 8.92015/10/12 at 11:04 3.5 13.3 21.4 4.72015/10/18 at 9:51 5.6 17.6 22.1 2.52015/10/30 at 10:43 3.9 9.3 16.7 8.42015/11/6 at 10:21 1.8 8.0 25.5 11.3
Urban site simultaneous regional 2015/9/13 at 9:22 4.8 13.2 29.2 7.12015/9/14 at 9:52 2.6 4.0 5.5 5.02015/10/10 at 9:47 2.3 8.1 15.6 4.02015/10/12 at 10:26 3.2 9.7 11.4 3.02015/10/18 at 10:16 4.7 8.1 10.2 7.72015/10/30 at 9:48 2.7 3.4 3.8 6.02015/11/6 at 7:43 5.1 2.5 22.3 10.6
local 2015/9/24 at 8:08 7.4 25.1 53.2 9.32015/9/26 at 7:59 6.8 15.3 46.1 11.02015/9/27 at 9:19 6.4 27.2 64.7 4.5
2015/10/31 at 10:22 8.4 13.4 45.5 9.22015/11/2 at 7:48 4.8 19.0 94.5 5.1
Journal of Geophysical Research: Atmospheres 10.1002/2016JD026030
DAI ET AL. SIMULTANEOUS NPF MEASUREMENTS AT TWO SITES 9

the C2–C9 VOCs observed in this study were too volatile to participate in nucleation or growth, they aregood indicators of anthropogenic VOC plumes. It is possible that these plumes contained highconcentrations of ammonia, amines, or HOMs produced from these VOCs, which are potential drivers ofstrong local NPF events.
3.3. Comparisons of Simultaneous Regional Events Between the Urban and RB Sites
There were seven banana-shaped regional events that occurred simultaneously at the urban and the RB sites.It is instructive to compare the intensity and duration of NPF between the two sites. We found that both J5,aveand GR10 were lower at the urban site (7.0 ± 3.9 cm�3 s�1, 6.2 ± 2.5 nmh�1) than those at the RB site(14.7 ± 6.5 cm�3 s�1, 7.2 ± 3.5 nmh�1). Smaller GRs were also observed in the Paris city center(4.6 ± 1.9 nmh�1) compared to the surrounding suburban area (6.1 ± 1.8 or 5.5 ± 4.1 nmh�1 depending onsites) during regional NPF events [Pikridas et al., 2015]. Recent field measurements have observed strongatmospheric NPF in polluted urban locations in Shanghai [Xiao et al., 2015] and Nanjing [Herrmann et al.,
2014; Yu et al., 2016] of the YRD region.The results of the present study thussuggest that on a regional scale, theNPF intensity could be underestimatedby single-point measurements at urbansites due to the heterogeneity ofair masses.
Our observation seemed to contradictwith another two-point simultaneousmeasurement made in Beijing by Wanget al. [2013], who reported that both J3and GR were higher at an urban site ofBeijing (PKU) than those at a nearbyregional background site (SDZ). Forexample, in fall 2008, J3 and GR were10.5 cm�3 s�1 and 4.6 nmh�1 at theirurban site, compared with 2.7 cm�3 s�1
and 3.7 nmh�1 at their regional back-ground site. Although formation andgrowth rates may not be directly
Figure 7. Correlations between log J5 and log[H2SO4] at the urban site forlocal events (log J5 = 0.91 × log[H2SO4]� 5.9, R2 = 0.22) and regionalevents (log J5 = 1.18 × log[H2SO4]� 9, R2 = 0.30), respectively. Symbolcolors indicate the mixing ratio of 1-butene during the same periods.
Figure 6. Time series of N5-20 and the mixing ratios of isoprene, propylbenzene, cyclohexan, dimethylbutane, butene,propene, and ethene. The periods of local NPF events are highlighted with boxes.
Journal of Geophysical Research: Atmospheres 10.1002/2016JD026030
DAI ET AL. SIMULTANEOUS NPF MEASUREMENTS AT TWO SITES 10

comparable between the two studies due to different data analysis schemes, there are at least three factorsleading to such differences. First, CS was highest at our urban site (0.04 s�1) among all measurement sites (RB:0.026 s�1, PKU: 0.022 s�1, and SDZ 0.014 s�1). Although high CS might not necessarily hinder the formation ofthe smallest particles, it might have decelerated their growth to larger sizes (e.g., 5 nm). Therefore, J5 at oururban site with high CS was lower than that at the RB site with lower CS. Second, the RB site is a typical ruralarea surrounded by lakes, farms, and fish ponds. The area is thus likely a hot spot of biogenic organicsemissions (e.g., amines from fish ponds), which may assist in particle formation and growth. [Almeida et al.,2013; Ehn et al., 2014; Tröstl et al., 2016]. Third, in spite of lower levels of primary pollutants SO2, NO2, andCO, higher concentration of secondary pollutant O3 at the RB site (Figure 5) implied that secondaryformation of aerosols might be more active at the RB site and thus promoted the growth of new particles.
3.4. Size-Dependent Formation Rates and Growth Rates During Local and Regional Events
J(Dp)max versus Dp and GR(Dp) versus Dp down to 1.3 nm in the local and regional events at the urban siteare shown in Figure 8. One important feature is that particle formation and growth rates were highduring the local events. In the sub-3 nm size range, J1.3 was up to more than 1000 cm�3 s�1 and GR(Dp)was higher than 20 nmh-1. J5 were 45.5–94.5 cm�3 s�1 during the local events, higher than3.8–45.2 cm�3 s�1 during the regional events. In 20–40 nm size range, however, we did not observe higherJ(Dp)max and GR(Dp) during the local events than the regional events, which corresponded to the “inter-rupted” particle growth beyond 20 nm during the local events (see Figure 3b). Our explanation is thatfurther growth of particles beyond 20 nm was not followed any more at our fixed measurement site.Nevertheless, considering long event durations (Table 2) and high formation rates (Table 2 and Figure 8,left), local NPF events under the influence of anthropogenic VOC plumes could also be an importantcontributor to CCN concentrations.
Another striking feature in Figure 8 is that GR(Dp) in the sub-3 nm size range was even higher than GR(Dp) in3–40 nm size range. This is more pronounced during the local events when GR(Dp) was around 30 nmh�1 inthe sub-3 nm size range. In contrast, previous studies based on appearance time (AT) method have reportedmonotonically increasing growth rates with Dp in forest or remote sites [Kulmala et al., 2013; Lehtipalo et al.,2014]. Such GR discrepancy was probably linked to the relative abundance of extremely low-volatility organiccompounds versus low-volatility or semivolatile OCs (LVOCs or SVOCs) in different locations. A decreasingGR(Dp) trend is entirely possible if condensing vapor is almost nonvolatile [Tröstl et al., 2016], while an increas-ing trend is due to the strong Kelvin effect of LVOCs/SVOCs or increasing vapor concentrations during theGR measurement.
We also examined whether the GR discrepancy between our sites and boreal forest could be in part due tomeasurement uncertainties in both locations. Lehtipalo et al. [2016] stated that the AT method was likelyto underestimate the GR below 3nm. Underestimation of the GR is possible if the appearing time differencein the two successive size bins is shorter than the scanning time interval of the PSM (e.g., 4min) [Kulmala
Figure 8. (left) Formation rates J(Dp)max versus Dp and (right) growth rates GR(Dp) versus Dp from 1.3 nm to 40 nm in tworegional events and two local events at the urban site, during which PSM was operated to measure particles down to1.3 nm.
Journal of Geophysical Research: Atmospheres 10.1002/2016JD026030
DAI ET AL. SIMULTANEOUS NPF MEASUREMENTS AT TWO SITES 11
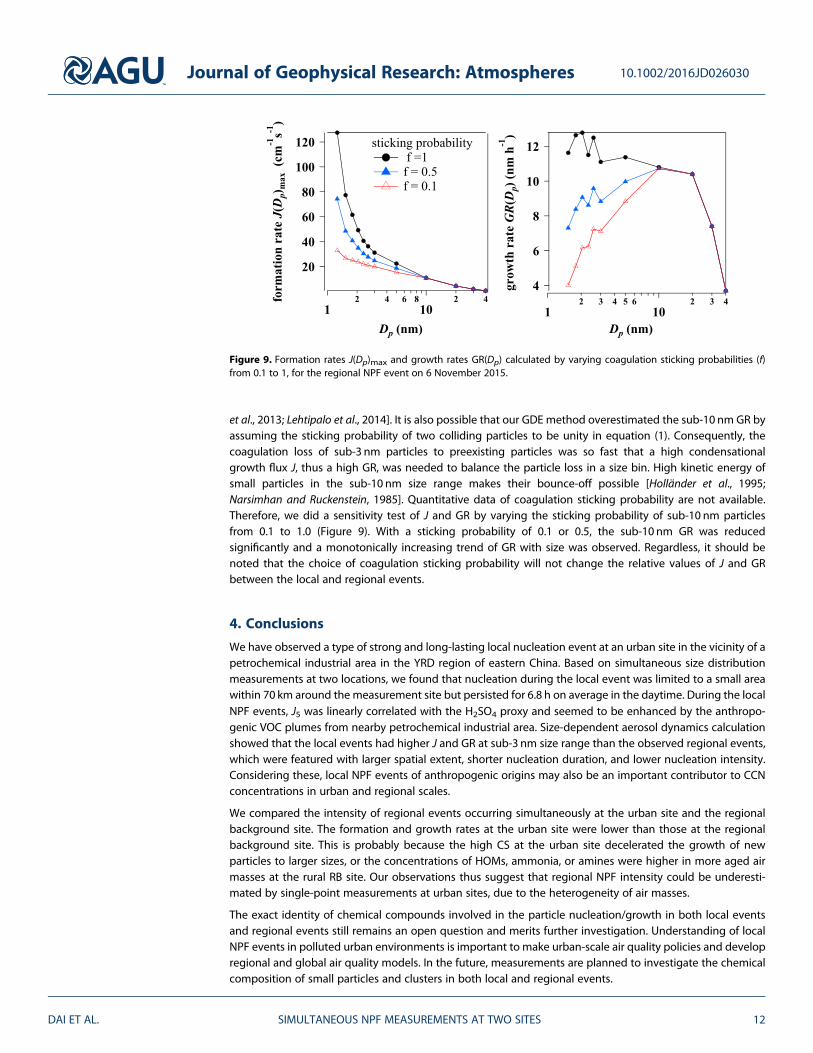
et al., 2013; Lehtipalo et al., 2014]. It is also possible that our GDE method overestimated the sub-10 nm GR byassuming the sticking probability of two colliding particles to be unity in equation (1). Consequently, thecoagulation loss of sub-3 nm particles to preexisting particles was so fast that a high condensationalgrowth flux J, thus a high GR, was needed to balance the particle loss in a size bin. High kinetic energy ofsmall particles in the sub-10 nm size range makes their bounce-off possible [Holländer et al., 1995;Narsimhan and Ruckenstein, 1985]. Quantitative data of coagulation sticking probability are not available.Therefore, we did a sensitivity test of J and GR by varying the sticking probability of sub-10 nm particlesfrom 0.1 to 1.0 (Figure 9). With a sticking probability of 0.1 or 0.5, the sub-10 nm GR was reducedsignificantly and a monotonically increasing trend of GR with size was observed. Regardless, it should benoted that the choice of coagulation sticking probability will not change the relative values of J and GRbetween the local and regional events.
4. Conclusions
We have observed a type of strong and long-lasting local nucleation event at an urban site in the vicinity of apetrochemical industrial area in the YRD region of eastern China. Based on simultaneous size distributionmeasurements at two locations, we found that nucleation during the local event was limited to a small areawithin 70 km around the measurement site but persisted for 6.8 h on average in the daytime. During the localNPF events, J5 was linearly correlated with the H2SO4 proxy and seemed to be enhanced by the anthropo-genic VOC plumes from nearby petrochemical industrial area. Size-dependent aerosol dynamics calculationshowed that the local events had higher J and GR at sub-3 nm size range than the observed regional events,which were featured with larger spatial extent, shorter nucleation duration, and lower nucleation intensity.Considering these, local NPF events of anthropogenic origins may also be an important contributor to CCNconcentrations in urban and regional scales.
We compared the intensity of regional events occurring simultaneously at the urban site and the regionalbackground site. The formation and growth rates at the urban site were lower than those at the regionalbackground site. This is probably because the high CS at the urban site decelerated the growth of newparticles to larger sizes, or the concentrations of HOMs, ammonia, or amines were higher in more aged airmasses at the rural RB site. Our observations thus suggest that regional NPF intensity could be underesti-mated by single-point measurements at urban sites, due to the heterogeneity of air masses.
The exact identity of chemical compounds involved in the particle nucleation/growth in both local eventsand regional events still remains an open question and merits further investigation. Understanding of localNPF events in polluted urban environments is important to make urban-scale air quality policies and developregional and global air quality models. In the future, measurements are planned to investigate the chemicalcomposition of small particles and clusters in both local and regional events.
Figure 9. Formation rates J(Dp)max and growth rates GR(Dp) calculated by varying coagulation sticking probabilities (f)from 0.1 to 1, for the regional NPF event on 6 November 2015.
Journal of Geophysical Research: Atmospheres 10.1002/2016JD026030
DAI ET AL. SIMULTANEOUS NPF MEASUREMENTS AT TWO SITES 12

ReferencesAlanen, J., et al. (2015), The formation and physical properties of the particle emissions from a natural gas engine, Fuel, 162, 155–161,
doi:10.1016/j.fuel.2015.09.003.Almeida, J., et al. (2013), Molecular understanding of sulphuric acid-amine particle nucleation in the atmosphere,Nature, 502(7471), 359–363,
doi:10.1038/nature12663.An, J., B. Zhu, H. Wang, Y. Li, X. Lin, and H. Yang (2014), Characteristics and source apportionment of VOCs measured in an industrial area of
Nanjing, Yangtze River Delta, China, Atmos. Environ., 97, 206–214, doi:10.1016/j.atmosenv.2014.08.021.An, J., H. Wang, L. Shen, B. Zhu, J. Zou, J. Gao, and H. Kang (2015), Characteristics of new particle formation events in Nanjing, China: Effect of
water-soluble ions, Atmos. Environ., 108, 32–40, doi:10.1016/j.atmosenv.2015.01.038.Brock, C. A., et al. (2002), Particle growth in the plumes of coal-fired power plants, J. Geophys. Res., 107(D12), 4155, doi:10.1029/
2001JD001062,Brock, C. A., et al. (2003), Particle growth in urban and industrial plumes in Texas, J. Geophys. Res., 108(D3), 4111, doi:10.1029/2002JD002746.Brus, D., K. Neitola, A. P. Hyvärinen, T. Petäjä, J. Vanhanen, M. Sipilä, P. Paasonen, M. Kulmala, and H. Lihavainen (2011), Homogenous
nucleation of sulfuric acid and water at close to atmospherically relevant conditions, Atmos. Chem. Phys., 11(11), 5277–5287, doi:10.5194/acp-11-5277-2011.
Crippa, P., and S. C. Pryor (2013), Spatial and temporal scales of new particle formation events in eastern North America, Atmos. Environ., 75,257–264, doi:10.1016/j.atmosenv.2013.04.051.
Dal Maso, M., M. Kulmala, I. Riipinen, R. Wagner, T. Hussein, P. Aalto, and E. J. Lehtinen (2005), Formation and growth rates of freshatmospheric aerosols: Eight years of aerosol size distribution data from SMEARII, Hyytiälä, Finland, Boreal Environ. Res., 10, 323–336.
Dal Maso, M., et al. (2007), Aerosol size distribution measurements at four Nordic field stations: Identification, analysis and trajectory analysisof new particle formation bursts, Tellus B, 59(3), 350–361, doi:10.1111/j.1600-0889.2007.00267.x.
Dall’Osto, M., X. Querol, A. Alastuey, C. O’Dowd, R. M. Harrison, J. Wenger, and F. J. Gómez-Moreno (2013), On the spatial distribution andevolution of ultrafine particles in Barcelona, Atmos. Chem. Phys., 13(2), 741–759, doi:10.5194/acp-13-741-2013.
Draxler, R. R., and G. D. Rolph (2010), HYSPLIT (HYbrid Single-Particle Lagrangian Integrated Trajectory) Model access via NOAA ARL READYWebsite (http://ready.arl.noaa.gov/HYSPLIT.php), NOAA Air Resources Laboratory, Silver Spring, Md.
Ehn, M., et al. (2014), A large source of low-volatility secondary organic aerosol, Nature, 506(7489), 476–479, doi:10.1038/nature13032.Herrmann, E., et al. (2014), Aerosols and nucleation in eastern China: First insights from the new SORPES-NJU station, Atmos. Chem. Phys., 14,
2169–2183, doi:10.5194/acp-14-2169-2014.Holländer, W., H. Windt, and Y. Bo (1995), Reduced sticking upon Brownian contact of submicrometer particles coated with an organic liquid,
J. Colloid Interface Sci., 173(2), 478–485, doi:10.1006/jcis.1995.1349.Hussein, T., H. Junninen, P. Tunved, A. Kristensson, M. Dal Maso, I. Riipinen, P. P. Aalto, H. C. Hansson, E. Swietlicki, andM. Kulmala (2009), Time
span and spatial scale of regional new particle formation events over Finland and Southern Sweden, Atmos. Chem. Phys., 9(14), 4699–4716,doi:10.5194/acp-9-4699-2009.
Jayaratne, E. R., Z. D. Ristovski, N. Meyer, and L. Morawska (2009), Particle and gaseous emissions from compressed natural gas and ultralowsulphur diesel-fuelled buses at four steady engine loads, Sci. Total Environ., 407(8), 2845–2852, doi:10.1016/j.scitotenv.2009.01.001.
Jeong, C. H., G. J. Evans, M. L. McGuire, R. Y. W. Chang, J. P. D. Abbatt, K. Zeromskiene, M. Mozurkewich, S. M. Li, and W. R. Leaitch (2010),Particle formation and growth at five rural and urban sites, Atmos. Chem. Phys., 10(16), 7979–7995, doi:10.5194/acp-10-7979-2010.
Karjalainen, P., et al. (2016), Time-resolved characterization of primary particle emissions and secondary particle formation from a moderngasoline passenger car, Atmos. Chem. Phys., 16(13), 8559–8570, doi:10.5194/acp-16-8559-2016.
Kirkby, J., et al. (2011), Role of sulphuric acid, ammonia and galactic cosmic rays in atmospheric aerosol nucleation, Nature, 476(7361),429–433, doi:10.1038/nature10343.
Kirkby, J., et al. (2016), Ion-induced nucleation of pure biogenic particles, Nature, 533(7604), 521–526, doi:10.1038/nature17953.Kivekäs, N., J. Carpman, P. Roldin, J. Leppä, E. Connor, A. Kristensson, and E. Asmi (2016), Coupling an aerosol box model with
one-dimensional flow: A tool for understanding observations of new particle formation events, Tellus B, 68, doi:10.3402/tellusb.v68.29706.Kontkanen, J., et al. (2016), A global view on atmospheric concentrations of sub-3 nm particles measured with the Particle Size Magnifier,
submitted to Atmos. Chem. Phys. Discuss., 2016, 1–43, doi:10.5194/acp-2016-847.Kulmala, M., M. dal Maso, J. M. Makela, L. Pirjola, M. Vakeva, P. Aalto, P. Miikkulainen, K. Hameri, and C. D. O’Dowd (2001), On the formation,
growth, and composition of nucleation mode particles, Tellus B, 53, 479–490.Kulmala, M., K. E. J. Lehtinen, and A. Laaksonen (2006), Cluster activation theory as an explanation of the linear dependence between
formation rate of 3 nm particles and sulphuric acid concentration, Atmos. Chem. Phys., 6(3), 787–793, doi:10.5194/acp-6-787-2006.Kulmala, M., A. Arola, T. Nieminen, L. Riuttanen, L. Sogacheva, G. de Leeuw, V. M. Kerminen, and K. E. J. Lehtinen (2011), The first estimates of
global nucleation mode aerosol concentrations based on satellite measurements, Atmos. Chem. Phys., 11(21), 10,791–10,801, doi:10.5194/acp-11-10791-2011.
Kulmala, M., et al. (2013), Direct observations of atmospheric aerosol nucleation, Science, 339(6122), 943–946, doi:10.1126/science.1227385.
Kulmala, M., et al. (2016), On secondary new particle formation in China, Front. Environ. Sci. Eng., 10(5), 1–10, doi:10.1007/s11783-016-0850-1.Lehtipalo, K., et al. (2014), Methods for determining particle size distribution and growth rates between 1 and 3 nm using the Particle Size
Magnifier, Boreal Environ. Res., 19, 215–236.Lehtipalo, K., et al. (2016), The effect of acid-base clustering and ions on the growth of atmospheric nano-particles, Nat. Commun., 7, 11,594,
doi:10.1038/ncomms11594.Leppä, J., T. Anttila, V. M. Kerminen, M. Kulmala, and K. E. J. Lehtinen (2011), Atmospheric new particle formation: Real and apparent growth
of neutral and charged particles, Atmos. Chem. Phys., 11(10), 4939–4955, doi:10.5194/acp-11-4939-2011.Matsui, H., M. Koike, N. Takegawa, Y. Kondo, A. Takami, T. Takamura, S. Yoon, S. W. Kim, H. C. Lim, and J. D. Fast (2013), Spatial and temporal
variations of new particle formation in East Asia using an NPF-explicit WRF-chem model: North-south contrast in new particle formationfrequency, J. Geophys. Res. Atmos., 118, 11,647–611,663, doi:10.1002/jgrd.50821.
Merikanto, J., D. V. Spracklen, G. W. Mann, S. J. Pickering, and K. S. Carslaw (2009), Impact of nucleation on global CCN, Atmos. Chem. Phys., 9,8601–8616, doi:10.5194/acp-9-8601-2009.
Metzger, A., et al. (2010), Evidence for the role of organics in aerosol particle formation under atmospheric conditions, Proc. Natl. Acad. Sci.U.S.A., 107(15), 6646–6651, doi:10.1073/pnas.0911330107.
Mikkonen, S., et al. (2011), A statistical proxy for sulphuric acid concentration, Atmos. Chem. Phys., 11, 11,319–11,334, doi:10.5194/acpd-11-20141-2011.
Journal of Geophysical Research: Atmospheres 10.1002/2016JD026030
DAI ET AL. SIMULTANEOUS NPF MEASUREMENTS AT TWO SITES 13
Acknowledgments
This work was supported by theNational Science Foundation of China(grants 41405116, 41675124, 21577065and 91544231), the Natural ScienceFoundation of Jiangsu Province (grantBK20140989), the National Key Researchand Development Program of China(2016YFC0203100), Chinese Academyof Sciences Strategic Priority ResearchProgram (grant XDB05020206), and theJiangsu Specially Appointed ProfessorGrant. The authors comply with AGU’sdata policy, and the data could beobtained from H. Yu ([email protected]).

Narsimhan, G., and E. Ruckenstein (1985), The Brownian coagulation of aerosols over the entire range of Knudsen numbers: Connectionbetween the sticking probability and the interaction forces, J. Colloid Interface Sci., 104(2), 344–369, doi:10.1016/0021-9797(85)90044-X.
Nie, W., et al. (2014), Polluted dust promotes new particle formation and growth, Sci. Rep., 4, doi:10.1038/srep06634.O’Dowd, C. D., et al. (2002), Coastal new particle formation: Environmental conditions and aerosol physicochemical characteristics during
nucleation bursts, J. Geophys. Res., 107(D19), 8107, doi:10.1029/2000JD000206.Pierce, J. R., and P. J. Adams (2009), Uncertainty in global CCN concentrations from uncertain aerosol nucleation and primary emission rates,
Atmos. Chem. Phys., 9(4), 1339–1356, doi:10.5194/acp-9-1339-2009.Pikridas, M., et al. (2015), In situ formation and spatial variability of particle number concentration in a European megacity, Atmos. Chem.
Phys., 15(17), 10,219–10,237, doi:10.5194/acp-15-10219-2015.Sarnela, N., et al. (2015), Sulphuric acid and aerosol particle production in the vicinity of an oil refinery, Atmos. Environ., 119, 156–166,
doi:10.1016/j.atmosenv.2015.08.033.Sipilä, M., et al. (2010), The role of sulfuric acid in atmospheric nucleation, Science, 327(5970), 1243–1246, doi:10.1126/science.1180315.Sipilä, M., et al. (2016), Molecular-scale evidence of aerosol particle formation via sequential addition of HIO3, Nature, 537(7621), 532–534,
doi:10.1038/nature19314.Spracklen, D. V., et al. (2008), Contribution of particle formation to global cloud condensation nuclei concentrations, Geophys. Res. Lett., 35,
L06808, doi:10.1029/2007GL033038.Stanier, C. O., A. Y. Khlystov, and S. N. Pandis (2004), Ambient aerosol size distributions and number concentrations measured during the
Pittsburgh Air Quality Study (PAQS), Atmos. Environ., 38(20), 3275–3284, doi:10.1016/j.atmosenv.2004.03.020.Stolzenburg, M. R., P. H. McMurry, H. Sakurai, J. N. Smith, R. L. Mauldin, F. L. Eisele, and C. F. Clement (2005), Growth rates of freshly nucleated
atmospheric particles in Atlanta, J. Geophys. Res., 110, D22S05, doi:10.1029/2005JD005935.Tröstl, J., et al. (2016), The role of low-volatility organic compounds in initial particle growth in the atmosphere, Nature, 533(7604), 527–531,
doi:10.1038/nature18271.Vana, M., M. Kulmala, M. Dal Maso, U. Hõrrak, and E. Tamm (2004),Comparative study of nucleation mode aerosol particles and intermediate
air ions formation events at three sites, J. Geophys. Res., 109, D17201, doi:10.1029/2003JD004413.von der Weiden, S. L., F. Drewnick, and S. Borrmann (2009), Particle Loss Calculator—A new software tool for the assessment of the
performance of aerosol inlet systems, Atmos. Meas. Tech., 2(2), 479–494, doi:10.5194/amt-2-479-2009.Wang, F., B. Zhu, K. Han-qing, and G. Jin-hui (2011), Comparative observations on summer aerosol number concentration measured by
APS-SMPS-WPS in Nanjing, China Environ. Sci., 31(9), 1416–1423.Wang, H., B. Zhu, L. Shen, J. An, Y. Yin, and H. Kang (2014), Number size distribution of aerosols at Mt. Huang and Nanjing in the Yangtze River
Delta, China: Effects of air masses and characteristics of new particle formation, Atmos. Res., 150, 42–56, doi:10.1016/j.atmosres.2014.07.020.
Wang, Z. B., M. Hu, J. Y. Sun, Z. J. Wu, D. L. Yue, X. J. Shen, Y. M. Zhang, X. Y. Pei, and A. Wiedensohler (2013), Characteristics of regional newparticle formation in urban and regional background environments in the North China Plain, Atmos. Chem. Phys., 13, 12,495–12,506,doi:10.5194/acpd-13-20531-2013.
Wang, Z. B., M. Hu, X. Y. Pei, R. Y. Zhang, P. Paasonen, J. Zheng, D. L. Yue, Z. J. Wu, M. Boy, and A. Wiedensohler (2015), Connection oforganics to atmospheric new particle formation and growth at an urban site of Beijing, Atmos. Environ., 103, 7–17, doi:10.1016/j.atmosenv.2014.11.069.
Wehner, B., H. Siebert, F. Stratmann, T. Tuch, A. Wiedensohler, T. PetÄJÄ, M. Dal Maso, and M. Kulmala (2007), Horizontal homogeneity andvertical extent of new particle formation events, Tellus B, 59(3), 362–371, doi:10.1111/j.1600-0889.2007.00260.x.
Wiedensohler, A., et al. (2009), Rapid aerosol particle growth and increase of cloud condensation nucleus activity by secondary aerosolformation and condensation: A case study for regional air pollution in northeastern China, J. Geophys. Res. 114, D00G08, doi:10.1029/2008JD010884.
Xiao, S., et al. (2015), Strong atmospheric new particle formation in winter in urban Shanghai, China, Atmos. Chem. Phys., 15(4), 1769–1781,doi:10.5194/acp-15-1769-2015.
Yu, F., and G. Luo (2009), Simulation of particle size distribution with a global aerosol model: Contribution of nucleation to aerosol and CCNnumber concentrations, Atmos. Chem. Phys., 9(20), 7691–7710, doi:10.5194/acp-9-7691-2009.
Yu, H., et al. (2014), New particle formation and growth in an isoprene-dominated Ozark forest: From sub-5 nm to CCN-active sizes, AerosolSci. Technol., 48(12), 1285–1298, doi:10.1080/02786826.2014.984801.
Yu, H., L. Zhou, L. Dai, W. Shen, W. Dai, J. Zheng, Y. Ma, andM. Chen (2016), Nucleation and growth of sub-3 nm particles in the polluted urbanatmosphere of a megacity in China, Atmos. Chem. Phys., 16(4), 2641–2657, doi:10.5194/acp-16-2641-2016.
Yue, D. L., et al. (2011), Potential contribution of new particle formation to cloud condensation nuclei in Beijing, Atmos. Environ., 45(33),6070–6077, doi:10.1016/j.atmosenv.2011.07.037.
Zheng, J., Y. Ma, M. Chen, Q. Zhang, L. Wang, A. F. Khalizov, L. Yao, Z. Wang, X. Wang, and L. Chen (2015), Measurement of atmosphericamines and ammonia using the high resolution time-of-flight chemical ionization mass spectrometry, Atmos. Environ., 102, 249–259,doi:10.1016/j.atmosenv.2014.12.002.
Journal of Geophysical Research: Atmospheres 10.1002/2016JD026030
DAI ET AL. SIMULTANEOUS NPF MEASUREMENTS AT TWO SITES 14