region ix analyses contra costa county, california · hydrologic analyses contra costa county,...
TRANSCRIPT

Contra Costa County, California Hydrologic Analyses
FEMA Region IX
Hydrologic Analyses
Contra Costa County, California CONTRACT NUMBER: HSFEHQ‐09‐D‐0368
TASK ORDER HSFE09‐09‐J‐0001
October 2011

Contra Costa County, California Hydrologic Analyses
Document History
Document Location
Location
Z:\Risk MAP Production\REGION 9\CALIFORNIA\CONTRA COSTA COUNTY\09‐09‐3059S\Hydrology
Revision History
Version Number Version Date Summary of Changes Team/Author
01 04/11/2011 1st Draft K. Labuhn
02 10/1/2011
Client Distribution
Name Title/Organization Location
Eric Simmons FEMA MIP, see Appendix C. http://www.bakeraecom.com/index.php/california/contra-costa-county/

May 2011 i
Contra Costa County, California Hydrologic Analyses
Table of Contents
1. TASK SUMMARY ................................................................................................................................................... 1
1.1. INTRODUCTION ............................................................................................................................................. 1 1.2. SCOPE OF WORK ........................................................................................................................................... 1 1.3. UPDATES TO SCOPE OF WORK ...................................................................................................................... 1
2. WATERSHED LOCATIONS AND DESCRIPTIONS ................................................................................... 1
2.1. BRUSHY CREEK ............................................................................................................................................ 1 2.2. FRISK CREEK ................................................................................................................................................ 1 2.3. KELLOGG CREEK .......................................................................................................................................... 2 2.4. MT. DIABLO CREEK ...................................................................................................................................... 3 2.5. DEM PREPROCESSING .................................................................................................................................. 4 2.6. HEC-GEOHMS SUBBASIN DELINEATION ..................................................................................................... 5 2.7. HEC-HMS MODEL SETUP ............................................................................................................................ 5 2.7.1. SOIL MOISTURE ACCOUNTING LOSS METHOD ......................................................................................... 5 2.7.2. USER SPECIFIED S-CURVE TRANSFORM METHOD .................................................................................... 6 2.7.3. BASEFLOW METHOD ................................................................................................................................ 7 2.7.4. RESERVOIRS ............................................................................................................................................. 7 2.7.5. REACHES .................................................................................................................................................. 7 2.7.6. RAINFALL DATA AND DISTRIBUTION ....................................................................................................... 7 2.8. MARSH CREEK .............................................................................................................................................. 8
3. RESULTS ............................................................................................................................................................ 9
3.1. COMPARISON TO PREVIOUS FLOW CALCULATIONS .................................................................................... 10
Appendices Appendix A Hydrologic Analysis Appendices A‐1 – Landuse and Infiltration Rate Calculations A‐2 – Lag Time Calculations
A‐3 – Reservoir Information A‐4 – Reach Information Appendix B TSDN Documents B‐1 – Deliverables Checklist B‐2 – Contact Report List B‐3 – Hydrologic Analyses Index B‐4 – Certification of Compliance Appendix C C‐1 ‐ Hydrologic Analyses QA/QC Reviews Appendix D Digital Data on the MIP


July 2011 1
Contra Costa County, California Hydrologic Analyses
1. Task Summary
1.1. Introduction BakerAECOM has completed the Hydrologic Analyses activities in accordance with Task Order HSFE09‐09‐J‐0001 for Contra Costa County, California under Contract No. HSFEHQ‐09‐D‐0368. The project location and a detailed map of the county are shown in Figure 1.
1.2. Scope of Work
Scope: The primary tasks are to conduct detailed hydrologic analyses of four streams (Brushy, Frisk, Kellogg and Mt. Diablo Creeks), update previous model for Marsh Creek and to perform QC of the study currently being conducted by the county for Wildcat and San Pablo Creeks. Specific tasks will include:
Compare discharges calculated by the county against results of the HEC‐HMS model for Brushy, Frisk, Mt. Diablo and Kellogg Creeks
Update the HEC‐HMS model for Marsh Creek to reflect existing landuse conditions (based on the 2008 aerial photos provided by the county) and edit the storage data on Sand Creek to reflect existing conditions
Review the hydrologic analysis conducted by the county for Wildcat and San Pablo Creeks as part of the levee certification process
Standards: Hydrologic Data Development work shall be performed in accordance with the standards specified in Section 4 ‐ Standards. The DCS must be met for this deliverable to be acceptable.
Deliverables: BakerAECOM shall make the products available to FEMA and any other deliverables associated with this activity that are defined in the updated Appendix M (Data Capture Standards) by uploading the digital data to the MIP.
1.3. Updates to Scope of Work The hydrologic analysis submitted by Contra Costa County for Wildcat and San Pablo Creeks is not currently included in this document.


July 2011 1
Contra Costa County, California Hydrologic Analyses
Figure 1. Scoping Map


July 2011 1
Contra Costa County, California Hydrologic Analyses
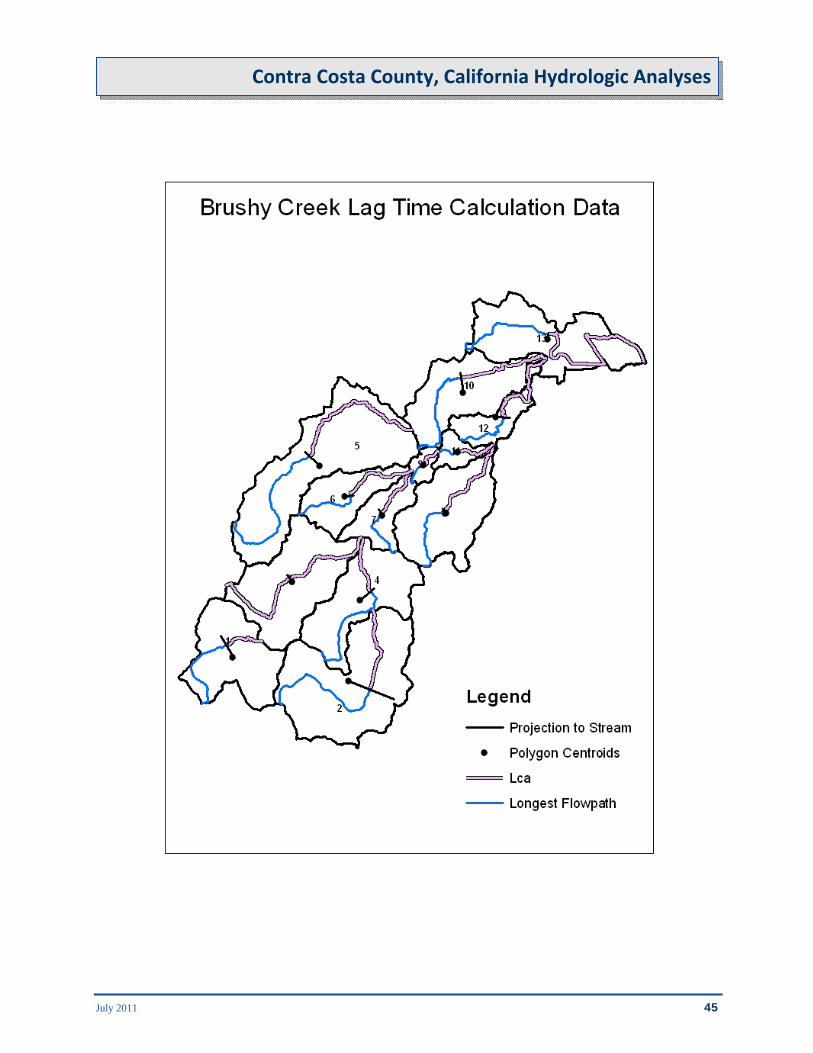
2. Watershed Locations and Descriptions 2.1. Brushy Creek Figure 2 below shows the Brushy Creek watershed. The creek begins in the Canada de los Vaqueros hills near the border of Contra Costa and Alameda Counties and flows in a generally north to northeast direction until its confluence with Clifton Court Forebay. The watershed is approximately 16.4 square miles and is composed mostly of public lands/open space, agricultural lands and some low density residential development. The Byron Airport is partially located within the Brushy Creek watershed.
Figure 2. Brushy Creek Watershed
2.2. Frisk Creek Figure 3 below shows the Frisk Creek watershed. The creek begins in the Canada de los Vaqueros hills and flows in a generally north to northeast direction until it reach the east side of Byron Highway where it turns and flows due north to its confluence with Discovery Bay. The watershed is approximately 12.2 square miles and is composed mostly of public lands/open space, agricultural lands and some low density residential development. The community of Byron is located in the Frisk Creek watershed.
July 2011 2
Contra Costa County, California Hydrologic Analyses
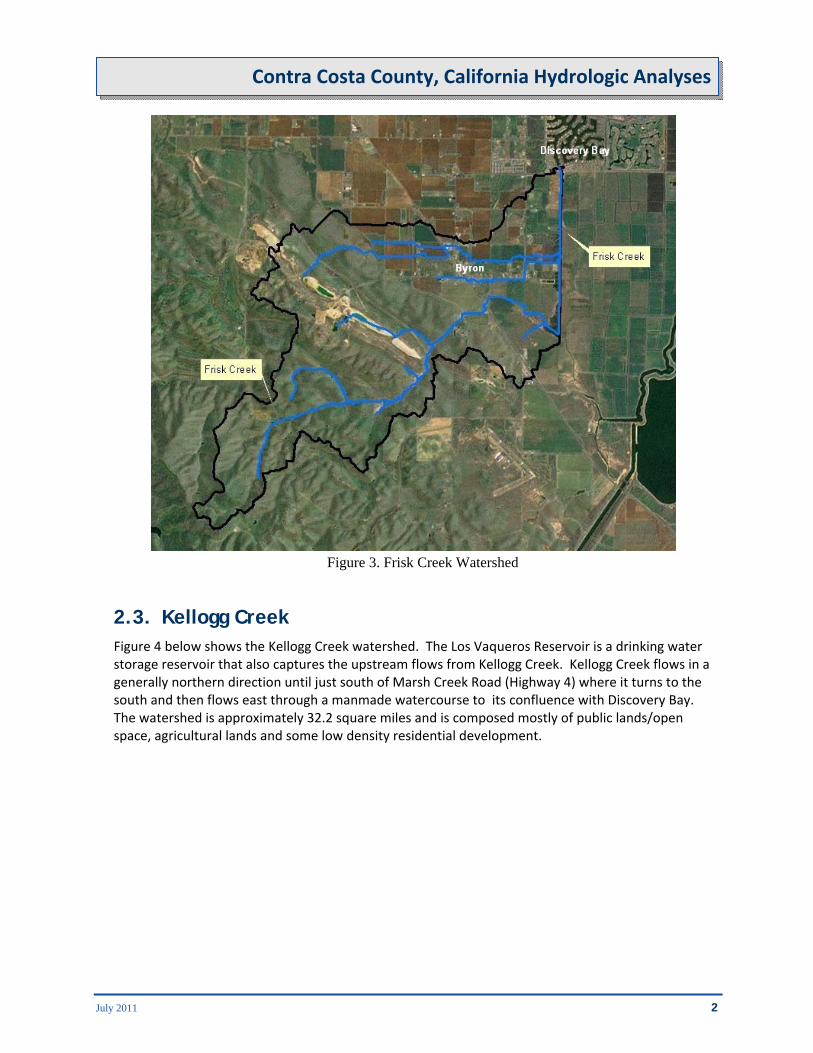
Figure 3. Frisk Creek Watershed
2.3. Kellogg Creek Figure 4 below shows the Kellogg Creek watershed. The Los Vaqueros Reservoir is a drinking water storage reservoir that also captures the upstream flows from Kellogg Creek. Kellogg Creek flows in a generally northern direction until just south of Marsh Creek Road (Highway 4) where it turns to the south and then flows east through a manmade watercourse to its confluence with Discovery Bay. The watershed is approximately 32.2 square miles and is composed mostly of public lands/open space, agricultural lands and some low density residential development.

July 2011 3
Contra Costa County, California Hydrologic Analyses
Figure 4. Kellogg Creek Watershed
2.4. Mt. Diablo Creek
Mt. Diablo Creek starts in the Mount Diablo State Park and flows to the northwest to its confluence with Suisun Bay. The watershed is located in the City of Concord and Contra Costa County and encompasses land that was part of the former Concord Naval Weapons Base. That base has been decommissioned and will eventually become property of the City of Concord and the county. The watershed is 32.7 square miles and consists of residential and commercial lands in the headwaters and open space on the former Concord Naval Weapons Base lands. Mt. Diablo Creek was studied previously by FEMA but that study ended at Bailey Road and did not show any flood hazards on the Naval Weapons Base. This study is intended to determine the flood hazards downstream of Kirker Pass Road to Mt. Diablo Creek’s confluence with Suisun Bay.

July 2011 4
Contra Costa County, California Hydrologic Analyses
Figure 5. Mt. Diablo Creek Watershed
2.5. DEM Preprocessing
Since Brushy, Frisk and Kellogg Creeks are adjacent to one another the tile digital elevation models
(DEMs) provided by Contra Costa County were mosaiced together to create one DEM to use for the
analysis. There were some areas where the tiles did not meet each other and there were other small
areas of missing data. In order to “fill in” the missing elevation data from some grid cells the raster
calculator focalmean function was used. The focalmean function looks at the elevation data in the
cells surrounding the empty cell and calculates a mean value for that empty cell. In this case the
focalmean statement was written to look at a 3 cell by 3 cell rectangle surrounding the empty cell
and calculate the mean. This filled in the necessary missing data in the DEM and could then be used
for further analysis. A similar process was used to construct a DEM for the Mt. Diablo Creek
watershed.

July 2011 5
Contra Costa County, California Hydrologic Analyses
2.6. HEC-GeoHMS Subbasin Delineation
Once the DEMs were constructed the next step was to delineate the subbasins for each creek. In
order to do this the ArcGIS extension HEC‐GeoHMS was used. The standard process for HEC‐GeoHMS
was followed including performing a “fill” operation to fill in the sink in the DEMs and then the tools
were run to define the streams and determine the subbasins. Once the draft streams and subbasins
were determined a manual review of the stream locations and subbasins was completed and a
number of edits were made to correct the automated process. In particular, the DEMs did not always
locate the streams correctly as shown on the provided aerial photos so these were corrected and the
subbasins edited manual as needed. Some of the smaller subbasins were combined and a few were
split at points were flows were needed.
2.7. HEC-HMS Model Setup
A number of discussions were held with Contra Costa County to determine which loss and transform
methods would be most appropriate for use in the county. Typically FEMA will use the NRCS curve
number and unit hydrograph method but Contra Costa County has a large library of data concerning
the hydrology of the county. They have provided guidance regarding methods that have been used
previously in the county to calculate flows. A review of these methods (Reference 1) shows that they
are appropriate for in this project. The loss method used is the Soil Moisture Accounting method and
the transform method is the User Specific S‐curve. The necessary inputs for these methods are land
use and Manning’s n data.
The only exception to this methodology was for subbasin 1 in the Kellogg Creek watershed. Subbasin
1 is the direct drainage area to the Los Vaqueros Reservoir and for this subbasin the NRCS methods
were used. The curve number and lag time were obtained from the HEC‐1 model completed for a
previous LOMR submittal (case number 03‐09‐0909P).
Additionally, Mt. Diablo Creek was previously studied by FEMA and there are an effective discharge
values available, with the most downstream available discharge at Bailey Road. In order to determine
if this flow was still reasonable two models were created for Mt. Diablo Creek. The first followed the
methods described in this section and the section treated the flow upstream of Bailey Road as a
constant source input using the effective flow.
2.7.1. Soil Moisture Accounting Loss Method
The Soil Moisture Accounting loss method in HEC‐HMS allows for a number of inputs including
storage in different units such as canopy, surface, soil and groundwater storage. For flood events the
only inputs that would have an appreciable impact on flows are the infiltration rate and soil storage
amount (or initial infiltration loss). The County provided BakerAECOM with a conversion chart that
links landuse with minimum, average and maximum infiltration rates. For the Brushy, Frisk, Kellogg
and Mt. Diablo Creek watersheds the landuse shapefile was intersected with the subbasin shapefile
to find the landuse by subbasin. Then area weighted average infiltration rate was calculated based
on the average values provided by the County. Appendix A‐1 provides tables of this data. The initial
infiltration loss was set to a standard 0.25 inches which comes from the County’s standard.

July 2011 6
Contra Costa County, California Hydrologic Analyses
Contra Costa County provided BakerAECOM with a landuse shapefile names GPLU_Edited. As
discussed with the County, this is a shapefile of landuse designations that come from the Contra Costa
County general plan and also from information provided by the incorporated cities in the County.
This shapefile is of the zoned/planned landuse (i.e., future conditions), not necessarily how the land is
currently being used. Since FEMA models existing, not future conditions, the landuse categories were
reviewed against the aerial photos provided by the County to determine if the planned landuse
compared to the current landuse. In the Frisk and Kellogg Creek watersheds the planned landuse
seemed to correspond to the current landuse and no changes were made. The Brushy Creek
watershed extends into Alameda County to the south. A review of aerial photos in Alameda County
shows no appreciable differences from Contra Costa County so the landuse type associated with
subbasins in the Contra Costa County were extended into the subbasins in Alameda County. In the
Mt. Diablo Creek watershed the area downstream of Bailey Road was reviewed and it was found that
near the Mallard Reservoir there were some areas that are designated as commercial but currently
appear to be open space. Additionally, there were a few areas that appeared to be dense residential
but were planned as low density residential. Edits were made to the landuse as necessary. Appendix
A‐1 provides maps and tables showing the breakdown of landuse for each watershed.
2.7.2. User Specified S-Curve Transform Method
Contra Costa County uses an S‐curve that was developed in a 1971 study of Walnut Creek by the U.S.
Army Corps of Engineers. This is now the Contra Costa County Flood Control District standard. This
curve was reviewed by BakerAECOM and found to be appropriate for use in this study. The curve is
input as a percentage curve in HEC‐HMS as a table of paired data. The other parameter needed is the
lag time. The Flood Control District uses the following formula to calculate lag time:
24 .
.
Where: Tlag Elapsed time from the centroid (or 50‐percent of volume) of the effective rainfall to the
centroid (or 50‐percent of volume) of the resulting runoff (hours) N weighted watershed Manning’s n coefficient L Length of the longest watercourse (miles) Lca Length along that drainage path from a point opposite the centroid of the watershed to the
outlet point (miles) S Overall slope of the main watercourse (feet/mile)
The length of the stream reaches was calculated using ArcGIS. ArcGIS was also used to find the
centroid of each subbasin and a line was then drawn to intersect with the stream centerline. The
distance between that point to the outlet, also calculated using ArcGIS, is Lca. The slope was found
from creating a contour map of the DEMs and reading the upstream and downstream elevations.
July 2011 7
Contra Costa County, California Hydrologic Analyses
In addition to infiltration rates the County also provided a conversion table between landuse and
Manning’s n value. Similar to the infiltration rate calculations the area weighted average Manning’s
n value was calculated for each subbasin. Appendix A‐2 contains maps and tables of the data used
for these calculations.
2.7.3. Baseflow Method
Baseflow is typically not included in calculations of flood events so the baseflow method was set to
none for the Brushy, Frisk, Kellogg and Mt. Diablo Creek models.
2.7.4. Reservoirs
There are two reservoirs in the studied watersheds. The first is the Los Vaqueros water supply
reservoir in the headwaters of Kellogg Creek. The water in this reservoir is delivered and withdrawn
by the canal system. This reservoir was previously modeled as part of a Letter of Map Revision case
number 03‐09‐0909P. The storage‐elevation and outlet information was taken from the HEC‐1 model
and input into the HEC‐HMS model (see Appendix A‐3).
The other reservoir of interest is Mallard Reservoir in the Mt. Diablo Creek watershed. Discussions
with the water district (Reference 2) revealed that there are no outlet structures for this reservoir to
the creek so it is not included in the modeling effort for Mt. Diablo Creek.
2.7.5. Reaches
The Muskingum‐Cunge method was used to route the flood flows through the watershed. The length
and slope were calculated as described in Section 2.5.2. The Manning’s n used was based on aerial
photos of the area and guidance from Contra Costa County. The bottom width and side slopes were
estimated from the two foot topographic data. Appendix A‐4 contains tables of the input data.
2.7.6. Rainfall Data and Distribution
The SCS method is the rainfall method most commonly used by FEMA. The two parameters
necessary are the rainfall distribution curve type (I, IA, II or III) and the storm depth in inches.
According to the figures in Appendix B of the NRCS publication “Urban Hydrology for Small
Watersheds” the boundary between the Type I and IA distributions falls approximately through
Contra Costa County. The County has reviewed the distributions and compared them to historical
analyses done in the county. They have concluded that the Type I distribution is the most
appropriate for the County and BakerAECOM agree. The 24‐hour rainfall depths were estimated at a
midpoint in the watershed and assumed to be an average for the entire watershed. In April 2011 the
National Oceanic and Atmospheric Administration (NOAA) released a new analysis of rainfall depths
in the western United States that supersedes the data in their publication Atlas 2. Rainfall frequency
depths can now be obtained via latitude and longitude from NOAA’s website at
http://hdsc.nws.noaa.gov/hdsc/pfds/.
Table 1 below lists the locations and precipitation frequency estimates obtained from the NOAA
website and used in the analysis.

July 2011 8
Contra Costa County, California Hydrologic Analyses
Table 1. Rainfall Frequency Depth Estimates
Stream Location
Latitude/longitude
10% ‐ 24‐Hour
Storm Depth
(in)
2% ‐ 24‐Hour
Storm Depth
(in)
1% ‐ 24‐Hour
Storm Depth
(in)
0.2% ‐ 24‐Hour
Storm Depth
(in)
Brushy Creek At Vasco Road
37.819902
‐121.655488
2.53 3.58 4.07 5.31
Frisk Creek At Vasco Road
37.851772
‐121.648243
2.47 3.49 3.96 5.15
Kellogg Creek At Walnut
Boulevard
37.871930
‐121.699067
2.87 4.02 4.53 5.76
Mt. Diablo
Creek
At Bailey Road
37.971826
‐121.969951
3.33 4.65 5.25 6.70
Marsh Creek At Union Pacific
Railroad Crossing
37.942633
‐121.706373
2.58 3.67 4.18 5.51
2.8. Marsh Creek
Contra Costa County provided Baker/AECOM with a HEC‐HMS model of Marsh Creek but it was
completed using future landuse conditions (expected maximum build out) and expansions to the Sand
Creek retention basin (Reference 3).
Baker/AECOM compared the planned landuse shapefile discussed above in Section 2.5.1 to the aerial
photos provided and it was found that there were many locations where the residential development
currently built did not match the planned landuse density. For example, there were areas that were
planned to be low density residential but the aerial photos showed that high density residential
development had already occurred. Numerous changes were made to the land use so that it
conformed to the current conditions in the watershed, especially in the residential areas. This
resulted in changes to the infiltration rates and Manning’s n values as compared to the model
provided by the County. Appendices A‐1 and A‐2 provide further details regarding the changes to the
landuse, infiltration rates, and Manning’s n values.
Baker/AECOM worked closely with the County to modify the elevation‐storage relationship for the
Sand Creek retention basin using the submitted DEM data and GIS software. Additionally, the County
provided original construction drawings for the basin to determine the outlet structure geometry and

July 2011 9
Contra Costa County, California Hydrologic Analyses
elevation. Appendix A‐3 provides further details regarding the elevation‐storage calculations and the
data regarding the outlets to the basin.
Additionally, changes were made to the elevation‐storage, storage‐discharge curves for some of the
reservoirs in the model, specifically, the Vinyards North and South Reservoirs, Deer Creek Basin, the
Fairview Basin, the Freedom Basin, and the Laurel Basin. The changes were made based on a
spreadsheet of basin information provided by the county, the DEM data for the Marsh Creek area and
best engineering judgment to extrapolate data points from the submitted data. Appendix A‐3 has
further information regarding the changes made to each reservoir.
There is one area in the Marsh Creek watershed, noted as Drainage Area 52D that was included in
the submitted HEC‐HMS model but was ultimately not modeled with HEC‐HMS due to the
complexity of the retention pond hydraulics. This area was modeled using EPASWMM and the
County is working to submit the model to BakerAECOM so that that it can be run for the FEMA
storm events. Due to the size of the retention ponds it is not expected that these flows will be
significant portion of the flow to Marsh Creek but they should be included to document the worst
case scenario expected. As soon as the model is received this report will be updated to include
those flows.
3. Results The results of the HEC‐HMS modeling are listed below in Table 2 and Table 3.
Table 2. HEC‐HMS Peak Flows at Junctions for Brushy, Frisk, Kellogg and Mt. Diablo Creeks Flooding Source and Junction Number
Drainage Area
(square miles)
Peak Discharges (cfs)
10% Annual Chance Flood
2% Annual Chance Flood
1% Annual Chance Flood
0.2% Annual Chance Flood
Brushy Creek
1 7.027 908.8 1,933.5 2,404.2 3,588.7
2 8.380 1,051.6 2,268.6 2,830.3 4,247.3
3 8.853 1,063.4 2,299.0 2,870.0 4,311.1
4 10.258 1,228.1 2,691.2 3,370.5 5,088.8
5 14.747 1,421.3 3,162.1 3,981.2 6,097.9
Outlet 16.395 1,418.5 3,190.4 4,027.9 6,203.4
Frisk Creek
1 2.635 300.5 651.0 811.9 1,218.9
2 5.585 545.5 1,228.0 1,546.6 2,361.5
3 6.438 587.4 1,356.1 1,716.2 2,639.0
4 2.284 199.6 436.3 545.6 826.4
5 11.364 682.1 1,737.6 2,248.7 3,602.8
Outlet 12.161 498.5 1,430.2 1,899.5 3,175.9

July 2011 10
Contra Costa County, California Hydrologic Analyses
Flooding Source and Junction Number
Drainage Area
(square miles)
Peak Discharges (cfs)
10% Annual Chance Flood
2% Annual Chance Flood
1% Annual Chance Flood
0.2% Annual Chance Flood
Kellogg Creek
1 20.359 417.3 793.5 954.5 1,339.3
2 21.829 676.2 1,315.3 1,591.1 2,250.2
3 25.782 1,090.8 2,235.0 2,739.7 3,963.5
4 27.427 1,164.0 2,465.2 3,051.0 4,485.9
5 28.426 1,137.6 2,466.5 3,070.1 4,592.5
6 30.703 1,142.9 2,560.3 3,210.5 4,882.8
7 31.975 1,163.6 2,644.9 3,333.3 5,108.4
Outlet 32.214 1,152.9 2,626.1 3,311.2 5,083.6
Mt. Diablo Creek
Effective Flow 21.832 3,670.0 5,670.0 6,350.0 7,760.0
2 23.080 4,294.3 6,709.7 7,566.8 9,380.6
3 24.210 4,895.2 7,759.3 8,799.9 11,028.4
4 25.209 5,816.2 9,498.2 10,909.4 13,974.6
5 28.058 6,298.8 10,376.9 11,963.1 15,432.5
6 29.918 6,495.9 10,787.5 12,488.7 16,232.8
Outlet 29.943 6,319.5 10,476.9 12,134.1 15,787.2
Table 3. Results of HEC‐HMS Modeling for Marsh Creek at Effective Locations and Road Crossings
Location Drainage
Area (square miles)
Peak Discharges (cfs)
10% Annual Chance Flood
2% Annual Chance Flood
1% Annual Chance Flood
0.2% Annual Chance Flood
At Concord Boulevard
52.674 498.9 570.9 603.9 780.7
At Balfour Road 58.221 918.8 1,365.5 1,568.4 2,117.4
At Central Avenue 65.049 1,169.6 1,755.0 2,017.5 2,699.6
At Union Pacific Railroad
81.010 1,721.4 2,751.2 3,678.8 6,204.2
At Delta Road 85.735 2,202.6 3,703.6 4,398.1 6,610.9
At Santa Fe Railroad 88.984 2,476.2 4,215.0 5,029.1 7,209.4
3.1. Comparison to Previous Flow Calculations
The Contra Costa County Flood Control District provided Baker/AECOM with some flow estimates for Frisk, Brushy and Kellogg Creeks and there are flows published for Marsh Creek in the effective FIS. Table 4 below compares the new HEC-HMS flows to those previously calculated. The comparison locations were not exact for Brushy Creek because the Flood Control District calculated the flows to the Southern Pacific Railroad but the HEC-HMS model was not setup to report the flows at that point, instead the flows from the next upstream junction are reported below.

July 2011 11
Contra Costa County, California Hydrologic Analyses
In 2002, a Letter of Map Revision (LOMR) was submitted that included modeling of Kellogg Creek with and without the Los Vaqueros Reservoir in order to revise the floodplain at the downstream end of Kellogg Creek. That LOMR was approved and the modeling was obtained for review in this study. That LOMR only calculated the 1% annual chance flood discharge and that information is listed below.

July 2011 12
Contra Costa County, California Hydrologic Analyses
Table 4. Comparison of HEC-HMS Discharges to Previously Calculated Discharges
Flooding Source and Location
HEC‐HMS Peak Discharges (cfs)
Location Previously Calculated Peak Discharges (cfs)
10% Annual Chance Flood
2% Annual Chance Flood
1% Annual Chance Flood
0.2% Annual Chance Flood
10% Annual Chance Flood
2% Annual Chance Flood
1% Annual Chance Flood
0.2% Annual Chance Flood
Brushy Creek
Upstream of Byron Hot Springs
1,447 3,195 4,017 6,147 At the Southern Pacific Railway
1,480 2,580 2,950 N/A
Frisk Creek
At the Southern Pacific Railway
593 1,378 1,741 2,661 At the Southern Pacific Railway
660 1,170 1,310 N/A
Kellogg Creek
At the Southern Pacific Railway
1,097 2,474 3,108 4,736 At the Southern Pacific Railway
N/A N/A 1,609 N/A
Marsh Creek
At Balfour Road 919 1,366 1,568 2,117 At Balfour Road 890 1,900 2,500 5,100
At Union Pacific Railroad
1,721 2,751 3,679 6,204 At Union Pacific Railroad
2,100 4,200 5,200 8,300
At Santa Fe Railroad
2,476 4,215 5,029 7,209 At Santa Fe Railroad
2,300 4,000* 4,000* 4,000*
*the effective FIS notes that the 2, 1, and 0.2% annual chance flows are reduced due to overbank spills and non‐returning flows

July 2011 13
Contra Costa County, California Hydrologic Analyses
Since the 1% annual chance flows for Kellogg Creek have increased significantly from the values
calculated in the 2002 LOMR, the inputs for the LOMR HEC‐1 model were compared to the inputs to
the HEC‐HMS model to determine potential explanations. The first difference between the two
models was the precipitation values used. The HEC‐1 model used different precipitation values for
different subbasins, starting with 4.8 inches in the headwater subbasin and ending with 3.4 inches at
the outlet. The HEC‐HMS model used a constant precipitation value of 4.53 inches for all subbasins.
Additionally, the subbasins in the HEC‐1 model used the SCS’s curve number and unit hydrograph
methods while the HEC‐HMS model used the methods recommended by Contra Costa County (the
soil moisture accounting method and the County derived S‐Curve). This has resulted in large
differences in flows from subbasins of similar size. Table 5 below shows some comparisons between
subbasin size and calculated flow rate. These differences appear to explain the change in flows
between the LOMR HEC‐1 and HEC‐HMS models.
Table 5. Comparisons of 1% Annual Chance Flows at Kellogg Creek Subbasins
between HEC‐1 and HEC‐HMS
HEC‐1 HEC‐HMS
Subbasin
Number
Subbasin Size
(sq miles)
Flow (cfs) Subbasin
Number
Subbasin Size
(sq miles)
Flow (cfs)
2007 0.82 56 5 0.821 396.4
2005 1.32 107 7 1.427 361.1
2004 0.92 128 9 0.999 656.7
The currently effective FIS for Marsh Creek lists flows at 3 locations and those values are also listed in
Table 4. The effective flows were calculated using the unit hydrograph method where flood
hydrographs were developed for the upper reaches of Marsh Creek, routed through the Marsh Creek
flood‐control reservoir and then summed with hydrographs developed for lower reaches. For the
10% annual chance event the newly calculated flows are comparable to the effective flows. For the
2% annual chance event the flows at Balfour Road have been reduced by about 30%. This is likely
due to the five detention ponds and the Marsh Creek Reservoir that store approximately 1,893 acre‐
feet during the 2% annual chance event. Additionally, as discussed above for Kellogg Creek, the
rainfall data has been updated which could result in changes to the flow rates. Similarly, at the
Union Pacific Railroad the 2% annual chance flows have been reduced by about 35%. This is likely
due to additional detention ponds storing approximately 453 acre‐feet during the 2% annual chance
event. For the 1% annual chance event the flows have been reduced by 48 and 39%, respectively, at
Balfour Road and the Union Pacific Railroad. For the 0.2% annual chance event the flows have been
reduced by 59 and 25%, respectively, at Balfour Road and the Union Pacific Railroad due to detention
pond storage. At the Santa Fe Railroad the effective discharges have been reduced due to overbank
spills and non‐returning flows. Since the new modeling accounts for overbanks spills and non‐
returning flows have been removed, the new flows calculated cannot be compared to the effective
flows for the 2% annual chance event.
July 2011 14
Contra Costa County, California Hydrologic Analyses
References
1. Contra Costa County Flood Control and Water Conservation District. “Verification of the
District’s Standards”. Draft December 2010.
2. Personal Communication (phone call). Contra Costa Water District (Mark Seedall). April 19,
2011.
3. Contra Costa County Flood Control and Water Conservation District. “Marsh Creek Hydrology
Report GeoHMS and HEC‐HMS Analysis”. May 10, 2010. (and accompanying HEC‐HMS model)

July 2011 15
Contra Costa County, California Hydrologic Analyses
Appendix A‐1
Landuse and Infiltration Rate Calculations

July 2011 16
Contra Costa County, California Hydrologic Analyses
July 2011 17
Contra Costa County, California Hydrologic Analyses
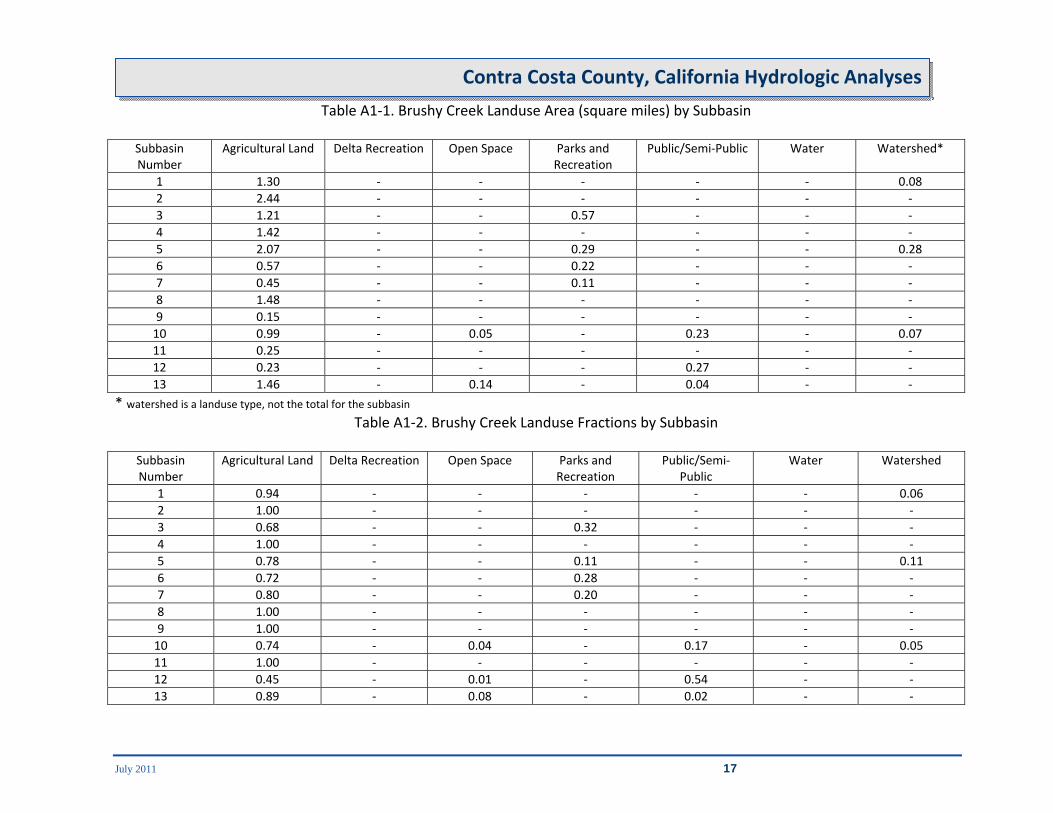
Table A1‐1. Brushy Creek Landuse Area (square miles) by Subbasin
Subbasin Number
Agricultural Land Delta Recreation Open Space Parks and Recreation
Public/Semi‐Public Water Watershed*
1 1.30 ‐ ‐ ‐ ‐ ‐ 0.08
2 2.44 ‐ ‐ ‐ ‐ ‐ ‐
3 1.21 ‐ ‐ 0.57 ‐ ‐ ‐
4 1.42 ‐ ‐ ‐ ‐ ‐ ‐
5 2.07 ‐ ‐ 0.29 ‐ ‐ 0.28
6 0.57 ‐ ‐ 0.22 ‐ ‐ ‐
7 0.45 ‐ ‐ 0.11 ‐ ‐ ‐
8 1.48 ‐ ‐ ‐ ‐ ‐ ‐
9 0.15 ‐ ‐ ‐ ‐ ‐ ‐
10 0.99 ‐ 0.05 ‐ 0.23 ‐ 0.07
11 0.25 ‐ ‐ ‐ ‐ ‐ ‐
12 0.23 ‐ ‐ ‐ 0.27 ‐ ‐
13 1.46 ‐ 0.14 ‐ 0.04 ‐ ‐
* watershed is a landuse type, not the total for the subbasin Table A1‐2. Brushy Creek Landuse Fractions by Subbasin
Subbasin Number
Agricultural Land Delta Recreation Open Space Parks and Recreation
Public/Semi‐Public
Water Watershed
1 0.94 ‐ ‐ ‐ ‐ ‐ 0.06
2 1.00 ‐ ‐ ‐ ‐ ‐ ‐
3 0.68 ‐ ‐ 0.32 ‐ ‐ ‐
4 1.00 ‐ ‐ ‐ ‐ ‐ ‐
5 0.78 ‐ ‐ 0.11 ‐ ‐ 0.11
6 0.72 ‐ ‐ 0.28 ‐ ‐ ‐
7 0.80 ‐ ‐ 0.20 ‐ ‐ ‐
8 1.00 ‐ ‐ ‐ ‐ ‐ ‐
9 1.00 ‐ ‐ ‐ ‐ ‐ ‐
10 0.74 ‐ 0.04 ‐ 0.17 ‐ 0.05
11 1.00 ‐ ‐ ‐ ‐ ‐ ‐
12 0.45 ‐ 0.01 ‐ 0.54 ‐ ‐
13 0.89 ‐ 0.08 ‐ 0.02 ‐ ‐

July 2011 18
Contra Costa County, California Hydrologic Analyses
Table A1‐3. Brushy Creek Area‐Weighted Infiltration Rate by Subbasin/Landuse
Subbasin Number
Agricultural Land
Delta Recreation
Open Space
Parks and Recreation
Public/Semi‐Public
Water Watershed Total
Average Infiltration
Rate (in/hr)
0.175 0.175 0.175 0.175 0.175 0.175 0.175
1 0.165 ‐ ‐ ‐ ‐ ‐ 0.010 0.175
2 0.119 ‐ ‐ 0.056 ‐ ‐ ‐ 0.175
3 0.175 ‐ ‐ ‐ ‐ ‐ ‐ 0.175
4 0.137 ‐ ‐ 0.019 ‐ ‐ 0.019 0.175
5 0.126 ‐ ‐ 0.049 ‐ ‐ ‐ 0.175
6 0.141 ‐ ‐ 0.034 ‐ ‐ ‐ 0.175
7 0.175 ‐ ‐ ‐ ‐ ‐ ‐ 0.175
8 0.175 ‐ ‐ ‐ ‐ ‐ ‐ 0.175
9 0.129 ‐ 0.006 ‐ 0.031 ‐ 0.009 0.175
10 0.175 ‐ ‐ ‐ ‐ ‐ ‐ 0.175
11 0.079 ‐ 0.002 ‐ 0.095 ‐ ‐ 0.175
12 0.156 ‐ 0.014 ‐ 0.004 ‐ ‐ 0.175
13 0.165 ‐ ‐ ‐ ‐ ‐ 0.010 0.175
Please note that the landuse coverage ends at the Alameda/Contra Costa County border. Aerial photos were reviewed to determine if the area of the watershed in Alameda County was being used differently than in Contra Costa County. There did not appear to be a difference in landuse between the two counties so the Contra Costa landuse was applied to the subbasins that fall either partly or entirely in Alameda County.

July 2011 19
Contra Costa County, California Hydrologic Analyses

July 2011 20
Contra Costa County, California Hydrologic Analyses
Table A1‐4. Frisk Creek Landuse Area (square miles) by Subbasin
Subbasin Number
Agricultural Core Land
Agricultural Land Commercial Light Industry Multiple Family Residential Low
Multiple Family Residential Medium
Open Space
1 ‐ 0.886 ‐ ‐ ‐ ‐ ‐2 ‐ 0.673 ‐ ‐ ‐ ‐ ‐3 ‐ 1.758 ‐ ‐ ‐ ‐ ‐4 ‐ 1.082 ‐ ‐ ‐ ‐ ‐5 0.149 1.475 ‐ ‐ ‐ ‐ ‐6 0.480 0.163 ‐ ‐ ‐ ‐ ‐7 0.035 0.875 0.013 0.006 ‐ 0.002 ‐8 ‐ 0.845 ‐ ‐ ‐ ‐ ‐9 ‐ 0.977 ‐ ‐ ‐ ‐ ‐10 0.106 0.295 0.010 0.005 0.015 ‐ ‐11 0.099 0.613 ‐ 0.002 ‐ ‐ 0.051
Subbasin Number Parks and Recreation
Public/Semi‐Public Single Family Residential High
Single Family Residential Medium
Single Family Residential Very
Low
Water Watershed
1 ‐ ‐ ‐ ‐ ‐ ‐ 0.9972 ‐ ‐ ‐ ‐ ‐ ‐ 0.0783 ‐ ‐ ‐ ‐ ‐ ‐ 0.0174 ‐ ‐ ‐ ‐ ‐ ‐ 0.0945 ‐ 0.001 ‐ 0.001 ‐ ‐ 0.0126 ‐ 0.004 ‐ ‐ ‐ ‐ ‐7 ‐ 0.012 0.050 0.070 0.045 ‐ ‐8 ‐ 0.008 ‐ ‐ ‐ ‐ ‐9 ‐ 0.035 0.021 ‐ ‐ ‐ ‐10 ‐ 0.013 0.049 0.008 ‐ ‐ ‐11 ‐ 0.030 0.002 0.001 ‐ ‐ ‐

July 2011 21
Contra Costa County, California Hydrologic Analyses
Table A1‐5. Brushy Creek Landuse Fractions by Subbasin
Subbasin Number
Agricultural Core Land
Agricultural Land Commercial Light Industry Multiple Family Residential Low
Multiple Family Residential Medium
Open Space
1 ‐ 0.471 ‐ ‐ ‐ ‐ ‐2 ‐ 0.896 ‐ ‐ ‐ ‐ ‐3 ‐ 0.991 ‐ ‐ ‐ ‐ ‐4 ‐ 0.920 ‐ ‐ ‐ ‐ ‐5 0.091 0.900 ‐ ‐ ‐ ‐ ‐6 0.742 0.252 ‐ ‐ ‐ ‐ ‐7 0.032 0.790 0.012 0.006 ‐ 0.002 ‐8 ‐ 0.991 ‐ ‐ ‐ ‐ ‐9 ‐ 0.946 ‐ ‐ ‐ ‐ ‐10 0.212 0.590 0.020 0.009 0.030 ‐ ‐11 0.124 0.768 ‐ 0.002 ‐ ‐ 0.064
Subbasin Number Parks and
Recreation Public/Semi‐Public Single Family
Residential High Single Family Residential Medium
Single Family Residential Very
Low
Water Watershed
1 ‐ ‐ ‐ ‐ ‐ ‐ 0.5292 ‐ ‐ ‐ ‐ ‐ ‐ 0.1043 ‐ ‐ ‐ ‐ ‐ ‐ 0.0094 ‐ ‐ ‐ ‐ ‐ ‐ 0.0805 ‐ 0.001 ‐ 0.001 ‐ ‐ 0.0076 ‐ 0.006 ‐ ‐ ‐ ‐ ‐7 ‐ 0.011 0.045 0.063 0.040 ‐ ‐8 ‐ 0.009 ‐ ‐ ‐ ‐ ‐9 ‐ 0.034 0.021 ‐ ‐ ‐ ‐10 ‐ 0.026 0.097 0.016 ‐ ‐ ‐11 ‐ 0.037 0.003 0.002 ‐ ‐ ‐

July 2011 22
Contra Costa County, California Hydrologic Analyses
Table A1‐6. Frisk Creek Area‐Weighted Infiltration Rate by Subbasin/Landuse
Subbasin Number
Agricultural Core Land
Agricultural Land
Commercial Light Industry
Multiple Family
Residential Low
Multiple Family
Residential Medium
Open Space Parks and Recreation
Average Infiltration
Rate (in/hr)
0.175 0.175 0.025 0.035 0.058 0.055 0.175 0.175
1 ‐ 0.082 ‐ ‐ ‐ ‐ ‐ ‐
2 ‐ 0.157 ‐ ‐ ‐ ‐ ‐ ‐
3 ‐ 0.173 ‐ ‐ ‐ ‐ ‐ ‐
4 ‐ 0.161 ‐ ‐ ‐ ‐ ‐ ‐
5 0.016 0.157 ‐ ‐ ‐ ‐ ‐ ‐
6 0.130 0.044 ‐ ‐ ‐ ‐ ‐ ‐
7 0.006 0.138 ‐ ‐ ‐ ‐ ‐ ‐
8 ‐ 0.173 ‐ ‐ ‐ ‐ ‐ ‐
9 ‐ 0.165 ‐ ‐ ‐ ‐ ‐ ‐
10 0.037 0.103 0.001 ‐ 0.002 ‐ ‐ ‐
11 0.022 0.134 ‐ ‐ ‐ ‐ 0.011 ‐

July 2011 23
Contra Costa County, California Hydrologic Analyses
Table A1‐6. Frisk Creek Area‐Weighted Infiltration Rate by Subbasin/Landuse (cont.)
Subbasin Number
Public/Semi‐Public
Single Family Residential
High
Single Family Residential Medium
Single Family Residential Very Low
Water Watershed Total
Average Infiltration
Rate (in/hr)
0.175 0.066 0.087 0.155 0.175 0.175
1 ‐ ‐ ‐ ‐ ‐ 0.093 0.175
2 ‐ ‐ ‐ ‐ ‐ 0.018 0.175
3 ‐ ‐ ‐ ‐ ‐ 0.002 0.175
4 ‐ ‐ ‐ ‐ ‐ 0.014 0.175
5 ‐ ‐ ‐ ‐ ‐ 0.001 0.175
6 0.001 ‐ ‐ ‐ ‐ ‐ 0.175
7 0.002 0.003 0.005 0.006 ‐ ‐ 0.161
8 0.002 ‐ ‐ ‐ ‐ ‐ 0.175
9 0.006 0.001 ‐ ‐ ‐ ‐ 0.173
10 0.004 0.006 0.001 ‐ ‐ ‐ 0.155
11 0.007 ‐ ‐ ‐ ‐ ‐ 0.174

July 2011 24
Contra Costa County, California Hydrologic Analyses

July 2011 25
Contra Costa County, California Hydrologic Analyses
Table A1‐7. Kellogg Creek Landuse Area (square miles) by Subbasin
Subbasin Number Agricultural Core
Land Agricultural Land Commercial Light Industry Multiple Family
Residential Low Office Park Open Space
2 ‐ ‐ ‐ ‐ ‐ ‐ ‐3 ‐ ‐ ‐ ‐ ‐ ‐ ‐4 ‐ 0.20 ‐ ‐ ‐ ‐ ‐5 ‐ ‐ ‐ ‐ ‐ ‐ ‐6 ‐ 7.01 ‐ ‐ ‐ ‐ ‐7 ‐ 382.63 ‐ ‐ ‐ ‐ ‐8 138.26 94.76 ‐ ‐ ‐ ‐ ‐9 448.35 466.18 ‐ ‐ ‐ ‐ ‐10 535.97 ‐ ‐ ‐ ‐ ‐ ‐11 420.02 0.03 ‐ ‐ ‐ ‐ ‐12 353.97 0.06 ‐ ‐ ‐ ‐ ‐13 10.82 98.34 8.87 2.40 1.88 0.04 19.6914 ‐ ‐ ‐ ‐ ‐ ‐ ‐
Subbasin Number Parks and Recreation Public/Semi‐Public Single Family
Residential High Single Family
Residential Medium Water Watershed
2 6.55 ‐ ‐ ‐ ‐ 683.113 ‐ ‐ ‐ ‐ 8.71 543.214 ‐ ‐ ‐ ‐ ‐ 415.275 ‐ ‐ ‐ ‐ ‐ 525.266 43.86 ‐ ‐ ‐ ‐ 1572.477 ‐ ‐ ‐ ‐ ‐ 906.068 529.51 27.58 ‐ ‐ ‐ 112.939 354.85 51.20 ‐ ‐ ‐ ‐10 ‐ 0.28 ‐ ‐ ‐ ‐11 ‐ 7.00 ‐ ‐ ‐ ‐12 ‐ 3.71 ‐ ‐ ‐ ‐13 ‐ 36.37 ‐ ‐ ‐ ‐14 ‐ ‐ 1.04 10.08 0.04 ‐

July 2011 26
Contra Costa County, California Hydrologic Analyses
Table A1‐8. Kellogg Creek Landuse Fractions by Subbasin
Subbasin Number Agricultural Core
Land Agricultural Land Commercial Light Industry Multiple Family
Residential Low Office Park Open Space
2 ‐ ‐ ‐ ‐ ‐ ‐ ‐
3 ‐ ‐ ‐ ‐ ‐ ‐ ‐
4 ‐ ‐ ‐ ‐ ‐ ‐ ‐
5 ‐ ‐ ‐ ‐ ‐ ‐ ‐
6 ‐ ‐ ‐ ‐ ‐ ‐ ‐
7 ‐ 0.008 ‐ ‐ ‐ ‐ ‐
8 ‐ 0.363 ‐ ‐ ‐ ‐ ‐
9 0.216 0.148 ‐ ‐ ‐ ‐ ‐
10 0.490 0.510 ‐ ‐ ‐ ‐ ‐
11 0.987 ‐ ‐ ‐ ‐ ‐ ‐
12 0.991 ‐ ‐ ‐ ‐ ‐ ‐
13 0.907 ‐ ‐ ‐ ‐ ‐ ‐
14 0.071 0.642 0.058 0.016 0.012 ‐ 0.129
Subbasin Number Parks and Recreation Public/Semi‐Public Single Family
Residential High Single Family
Residential Medium Water Watershed
2 0.009 ‐ ‐ ‐ ‐ 0.991
3 ‐ ‐ ‐ ‐ 0.016 0.984
4 ‐ ‐ ‐ ‐ ‐ 1.000
5 ‐ ‐ ‐ ‐ ‐ 1.000
6 0.027 ‐ ‐ ‐ ‐ 0.973
7 ‐ ‐ ‐ ‐ ‐ 0.992
8 0.503 0.026 ‐ ‐ ‐ 0.107
9 0.555 0.080 ‐ ‐ ‐ ‐
10 ‐ ‐ ‐ ‐ ‐ ‐
11 ‐ 0.013 ‐ ‐ ‐ ‐
12 ‐ 0.009 ‐ ‐ ‐ ‐
13 ‐ 0.093 ‐ ‐ ‐ ‐
14 ‐ ‐ 0.007 0.066 ‐ ‐

July 2011 27
Contra Costa County, California Hydrologic Analyses
Table A1‐9. Kellogg Creek Area‐Weighted Infiltration Rate by Subbasin/Landuse
Subbasin Number
Agricultural Core Land
Agricultural Land
Commercial Light Industry
Multiple Family
Residential Low
Office Park Open Space Parks and Recreation
Average Infiltration
Rate (in/hr)
0.175 0.175 0.025 0.035 0.058 0.025 0.175 0.175
2 ‐ ‐ ‐ ‐ ‐ ‐ ‐ 0.002
3 ‐ ‐ ‐ ‐ ‐ ‐ ‐ ‐
4 ‐ ‐ ‐ ‐ ‐ ‐ ‐ ‐
5 ‐ ‐ ‐ ‐ ‐ ‐ ‐ ‐
6 ‐ ‐ ‐ ‐ ‐ ‐ ‐ 0.005
7 ‐ 0.001 ‐ ‐ ‐ ‐ ‐ ‐
8 ‐ 0.064 ‐ ‐ ‐ ‐ ‐ 0.088
9 0.038 0.026 ‐ ‐ ‐ ‐ ‐ 0.097
10 0.086 0.089 ‐ ‐ ‐ ‐ ‐ ‐
11 0.173 ‐ ‐ ‐ ‐ ‐ ‐ ‐
12 0.173 ‐ ‐ ‐ ‐ ‐ ‐ ‐
13 0.159 ‐ ‐ ‐ ‐ ‐ ‐ ‐
14 0.012 0.112 0.001 0.001 0.001 ‐ 0.022 ‐

July 2011 28
Contra Costa County, California Hydrologic Analyses
Table A1‐9. Kellogg Creek Area‐Weighted Infiltration Rate by Subbasin/Landuse (cont.)
Subbasin Number
Public/Semi‐Public
Single Family Residential
High
Single Family Residential Medium
Water Watershed Total
Average Infiltration
Rate (in/hr)
0.175 0.066 0.087 0.175 0.175
2 ‐ ‐ ‐ ‐ 0.173 0.175
3 ‐ ‐ ‐ 0.003 0.172 0.175
4 ‐ ‐ ‐ ‐ 0.175 0.175
5 ‐ ‐ ‐ ‐ 0.175 0.175
6 ‐ ‐ ‐ ‐ 0.170 0.175
7 ‐ ‐ ‐ ‐ 0.174 0.175
8 0.005 ‐ ‐ ‐ 0.019 0.175
9 0.014 ‐ ‐ ‐ ‐ 0.175
10 ‐ ‐ ‐ ‐ ‐ 0.175
11 0.002 ‐ ‐ ‐ ‐ 0.175
12 0.002 ‐ ‐ ‐ ‐ 0.175
13 0.016 ‐ ‐ ‐ ‐ 0.175
14 ‐ ‐ 0.006 ‐ ‐ 0.156

July 2011 29
Contra Costa County, California Hydrologic Analyses

July 2011 30
Contra Costa County, California Hydrologic Analyses
Table A1‐10. Mt. Diablo Creek Landuse Area (square miles) by Subbasin
Subbasin Number
Agricultural Land Commercial Heavy Industry Landfill Light Industry Multiple Family Residential Low
Multiple Family Residential Medium
Office Park
1 6.816 0.153 0.007 0.055 ‐ 0.166 0.131 0.0032 ‐ ‐ ‐ ‐ ‐ ‐ ‐ ‐3 0.000 ‐ ‐ 0.112 ‐ ‐ ‐ ‐4 ‐ ‐ ‐ ‐ ‐ ‐ ‐ ‐5 0.024 ‐ ‐ 0.094 ‐ ‐ ‐ ‐6 0.177 ‐ ‐ ‐ ‐ ‐ ‐ ‐7 ‐ ‐ ‐ ‐ 0.088 ‐ ‐ ‐8 ‐ ‐ ‐ ‐ ‐ ‐ ‐ ‐9 0.594 ‐ ‐ ‐ 0.542 ‐ 0.002 ‐10 ‐ ‐ ‐ ‐ ‐ ‐ ‐ ‐11 ‐ ‐ ‐ ‐ ‐ ‐ ‐ ‐12 ‐ ‐ ‐ ‐ ‐ ‐ ‐ ‐
Subbasin Number Open Space Parks and
Recreation Public/Semi‐Public Single Family
Residential High Single Family
Residential Low Single Family Residential Medium
Single Family Residential Very
Low
1 1.949 7.962 0.603 3.625 0.053 ‐ 0.3102 ‐ ‐ 0.063 0.000 0.000 ‐ ‐3 ‐ ‐ 1.068 0.004 ‐ ‐ ‐4 ‐ ‐ 0.131 ‐ ‐ ‐ ‐5 ‐ ‐ 0.882 ‐ ‐ ‐ ‐6 0.003 ‐ 3.531 ‐ ‐ 0.002 ‐7 0.511 ‐ 0.075 ‐ ‐ ‐ ‐8 0.335 ‐ 0.028 ‐ ‐ ‐ ‐9 0.116 0.249 0.808 0.176 ‐ ‐ ‐10 0.003 ‐ 0.072 ‐ ‐ ‐ ‐11 0.000 ‐ 1.111 ‐ ‐ ‐ ‐12 0.024 ‐ 0.002 ‐ ‐ ‐ ‐
July 2011 31
Contra Costa County, California Hydrologic Analyses
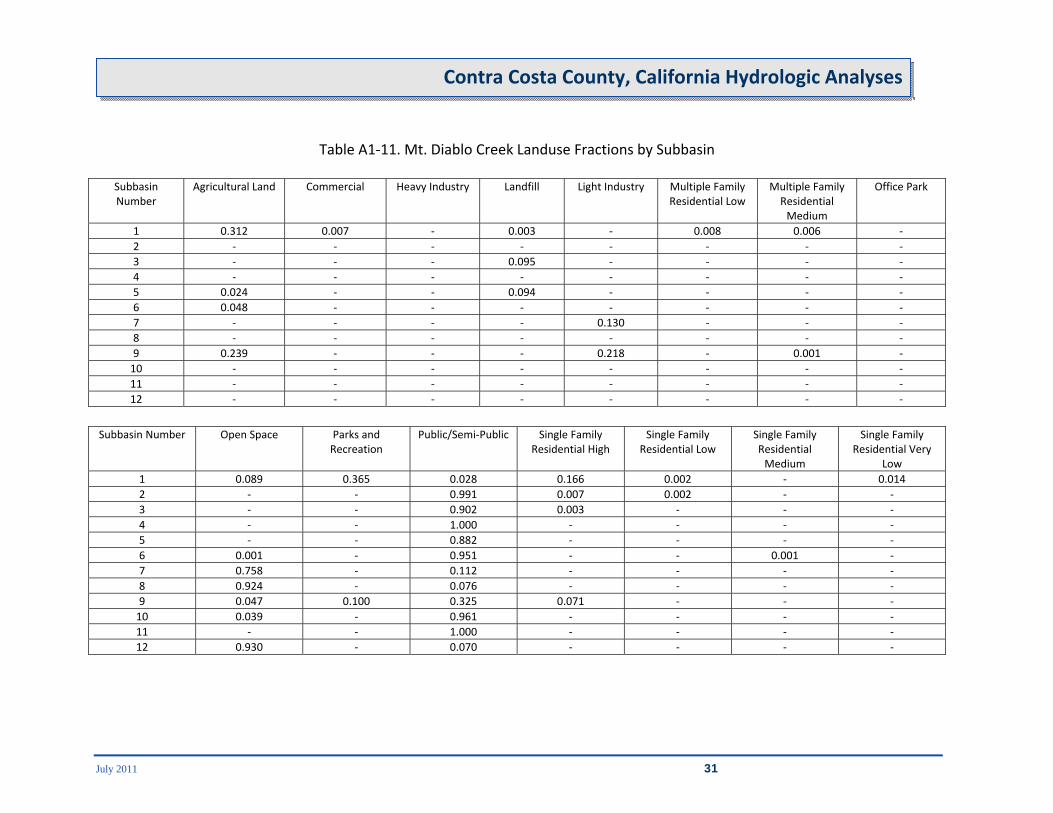
Table A1‐11. Mt. Diablo Creek Landuse Fractions by Subbasin
Subbasin Number
Agricultural Land Commercial Heavy Industry Landfill Light Industry Multiple Family Residential Low
Multiple Family Residential Medium
Office Park
1 0.312 0.007 ‐ 0.003 ‐ 0.008 0.006 ‐
2 ‐ ‐ ‐ ‐ ‐ ‐ ‐ ‐
3 ‐ ‐ ‐ 0.095 ‐ ‐ ‐ ‐
4 ‐ ‐ ‐ ‐ ‐ ‐ ‐ ‐
5 0.024 ‐ ‐ 0.094 ‐ ‐ ‐ ‐
6 0.048 ‐ ‐ ‐ ‐ ‐ ‐ ‐
7 ‐ ‐ ‐ ‐ 0.130 ‐ ‐ ‐
8 ‐ ‐ ‐ ‐ ‐ ‐ ‐ ‐
9 0.239 ‐ ‐ ‐ 0.218 ‐ 0.001 ‐
10 ‐ ‐ ‐ ‐ ‐ ‐ ‐ ‐
11 ‐ ‐ ‐ ‐ ‐ ‐ ‐ ‐
12 ‐ ‐ ‐ ‐ ‐ ‐ ‐ ‐
Subbasin Number Open Space Parks and
Recreation Public/Semi‐Public Single Family
Residential High Single Family
Residential Low Single Family Residential Medium
Single Family Residential Very
Low
1 0.089 0.365 0.028 0.166 0.002 ‐ 0.014
2 ‐ ‐ 0.991 0.007 0.002 ‐ ‐
3 ‐ ‐ 0.902 0.003 ‐ ‐ ‐
4 ‐ ‐ 1.000 ‐ ‐ ‐ ‐
5 ‐ ‐ 0.882 ‐ ‐ ‐ ‐
6 0.001 ‐ 0.951 ‐ ‐ 0.001 ‐
7 0.758 ‐ 0.112 ‐ ‐ ‐ ‐
8 0.924 ‐ 0.076 ‐ ‐ ‐ ‐
9 0.047 0.100 0.325 0.071 ‐ ‐ ‐
10 0.039 ‐ 0.961 ‐ ‐ ‐ ‐
11 ‐ ‐ 1.000 ‐ ‐ ‐ ‐
12 0.930 ‐ 0.070 ‐ ‐ ‐ ‐

July 2011 32
Contra Costa County, California Hydrologic Analyses
Table A1‐12. Mt. Diablo Creek Area‐Weighted Infiltration Rate by Subbasin/Landuse
Subbasin Number
Agricultural Land
Commercial Heavy Industry
Landfill Light Industry Multiple Family
Residential Low
Multiple Family
Residential Medium
Office Park
Average Infiltration
Rate (in/hr)
0.175 0.025 0.040 0.175 0.035 0.058 0.055 0.025
1 0.055 ‐ ‐ ‐ ‐ ‐ ‐ ‐
2 ‐ ‐ ‐ ‐ ‐ ‐ ‐ ‐
3 ‐ ‐ ‐ 0.017 ‐ ‐ ‐ ‐
4 ‐ ‐ ‐ ‐ ‐ ‐ ‐ ‐
5 0.004 ‐ ‐ 0.016 ‐ ‐ ‐ ‐
6 0.008 ‐ ‐ ‐ ‐ ‐ ‐ ‐
7 ‐ ‐ ‐ ‐ 0.005 ‐ ‐ ‐
8 ‐ ‐ ‐ ‐ ‐ ‐ ‐ ‐
9 0.042 ‐ ‐ ‐ 0.008 ‐ ‐ ‐
10 ‐ ‐ ‐ ‐ ‐ ‐ ‐ ‐
11 ‐ ‐ ‐ ‐ ‐ ‐ ‐ ‐
12 ‐ ‐ ‐ ‐ ‐ ‐ ‐ ‐
July 2011 33
Contra Costa County, California Hydrologic Analyses
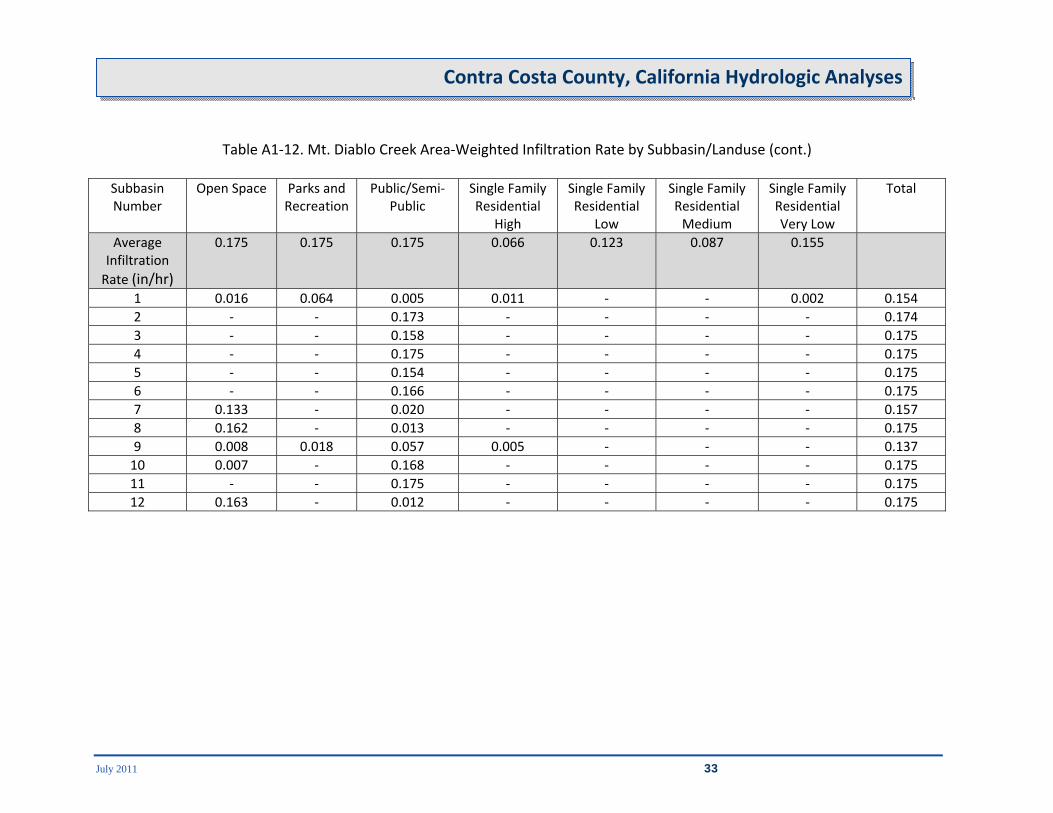
Table A1‐12. Mt. Diablo Creek Area‐Weighted Infiltration Rate by Subbasin/Landuse (cont.)
Subbasin Number
Open Space Parks and Recreation
Public/Semi‐Public
Single Family Residential
High
Single Family Residential
Low
Single Family Residential Medium
Single Family Residential Very Low
Total
Average Infiltration
Rate (in/hr)
0.175 0.175 0.175 0.066 0.123 0.087 0.155
1 0.016 0.064 0.005 0.011 ‐ ‐ 0.002 0.154
2 ‐ ‐ 0.173 ‐ ‐ ‐ ‐ 0.174
3 ‐ ‐ 0.158 ‐ ‐ ‐ ‐ 0.175
4 ‐ ‐ 0.175 ‐ ‐ ‐ ‐ 0.175
5 ‐ ‐ 0.154 ‐ ‐ ‐ ‐ 0.175
6 ‐ ‐ 0.166 ‐ ‐ ‐ ‐ 0.175
7 0.133 ‐ 0.020 ‐ ‐ ‐ ‐ 0.157
8 0.162 ‐ 0.013 ‐ ‐ ‐ ‐ 0.175
9 0.008 0.018 0.057 0.005 ‐ ‐ ‐ 0.137
10 0.007 ‐ 0.168 ‐ ‐ ‐ ‐ 0.175
11 ‐ ‐ 0.175 ‐ ‐ ‐ ‐ 0.175
12 0.163 ‐ 0.012 ‐ ‐ ‐ ‐ 0.175
July 2011 34
Contra Costa County, California Hydrologic Analyses
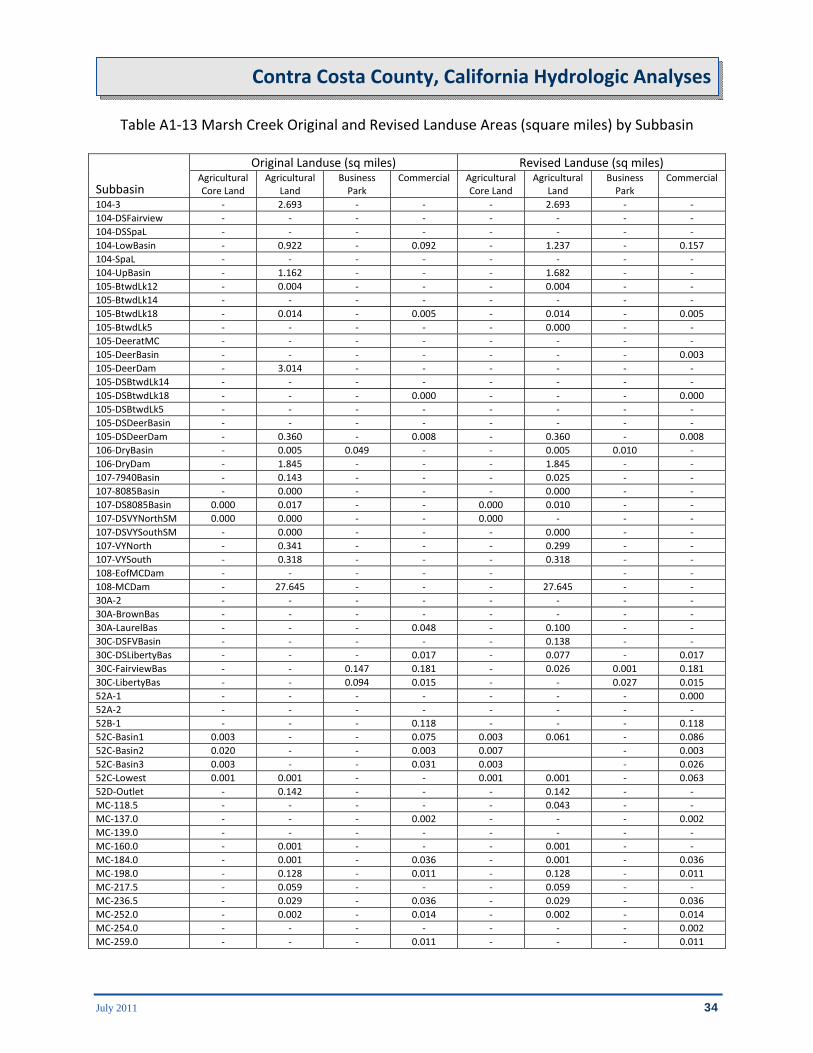
Table A1‐13 Marsh Creek Original and Revised Landuse Areas (square miles) by Subbasin
Subbasin
Original Landuse (sq miles) Revised Landuse (sq miles)Agricultural Core Land
Agricultural Land
Business Park
Commercial Agricultural Core Land
Agricultural Land
Business Park
Commercial
104‐3 ‐ 2.693 ‐ ‐ ‐ 2.693 ‐ ‐
104‐DSFairview ‐ ‐ ‐ ‐ ‐ ‐ ‐ ‐
104‐DSSpaL ‐ ‐ ‐ ‐ ‐ ‐ ‐ ‐
104‐LowBasin ‐ 0.922 ‐ 0.092 ‐ 1.237 ‐ 0.157
104‐SpaL ‐ ‐ ‐ ‐ ‐ ‐ ‐ ‐
104‐UpBasin ‐ 1.162 ‐ ‐ ‐ 1.682 ‐ ‐
105‐BtwdLk12 ‐ 0.004 ‐ ‐ ‐ 0.004 ‐ ‐
105‐BtwdLk14 ‐ ‐ ‐ ‐ ‐ ‐ ‐ ‐
105‐BtwdLk18 ‐ 0.014 ‐ 0.005 ‐ 0.014 ‐ 0.005
105‐BtwdLk5 ‐ ‐ ‐ ‐ ‐ 0.000 ‐ ‐
105‐DeeratMC ‐ ‐ ‐ ‐ ‐ ‐ ‐ ‐
105‐DeerBasin ‐ ‐ ‐ ‐ ‐ ‐ ‐ 0.003
105‐DeerDam ‐ 3.014 ‐ ‐ ‐ ‐ ‐ ‐
105‐DSBtwdLk14 ‐ ‐ ‐ ‐ ‐ ‐ ‐ ‐
105‐DSBtwdLk18 ‐ ‐ ‐ 0.000 ‐ ‐ ‐ 0.000
105‐DSBtwdLk5 ‐ ‐ ‐ ‐ ‐ ‐ ‐ ‐
105‐DSDeerBasin ‐ ‐ ‐ ‐ ‐ ‐ ‐ ‐
105‐DSDeerDam ‐ 0.360 ‐ 0.008 ‐ 0.360 ‐ 0.008
106‐DryBasin ‐ 0.005 0.049 ‐ ‐ 0.005 0.010 ‐
106‐DryDam ‐ 1.845 ‐ ‐ ‐ 1.845 ‐ ‐
107‐7940Basin ‐ 0.143 ‐ ‐ ‐ 0.025 ‐ ‐
107‐8085Basin ‐ 0.000 ‐ ‐ ‐ 0.000 ‐ ‐
107‐DS8085Basin 0.000 0.017 ‐ ‐ 0.000 0.010 ‐ ‐
107‐DSVYNorthSM 0.000 0.000 ‐ ‐ 0.000 ‐ ‐ ‐
107‐DSVYSouthSM ‐ 0.000 ‐ ‐ ‐ 0.000 ‐ ‐
107‐VYNorth ‐ 0.341 ‐ ‐ ‐ 0.299 ‐ ‐
107‐VYSouth ‐ 0.318 ‐ ‐ ‐ 0.318 ‐ ‐
108‐EofMCDam ‐ ‐ ‐ ‐ ‐ ‐ ‐
108‐MCDam ‐ 27.645 ‐ ‐ ‐ 27.645 ‐ ‐
30A‐2 ‐ ‐ ‐ ‐ ‐ ‐ ‐ ‐
30A‐BrownBas ‐ ‐ ‐ ‐ ‐ ‐ ‐ ‐
30A‐LaurelBas ‐ ‐ ‐ 0.048 ‐ 0.100 ‐ ‐
30C‐DSFVBasin ‐ ‐ ‐ ‐ ‐ 0.138 ‐ ‐
30C‐DSLibertyBas ‐ ‐ ‐ 0.017 ‐ 0.077 ‐ 0.017
30C‐FairviewBas ‐ ‐ 0.147 0.181 ‐ 0.026 0.001 0.181
30C‐LibertyBas ‐ ‐ 0.094 0.015 ‐ ‐ 0.027 0.015
52A‐1 ‐ ‐ ‐ ‐ ‐ ‐ ‐ 0.000
52A‐2 ‐ ‐ ‐ ‐ ‐ ‐ ‐ ‐
52B‐1 ‐ ‐ ‐ 0.118 ‐ ‐ ‐ 0.118
52C‐Basin1 0.003 ‐ ‐ 0.075 0.003 0.061 ‐ 0.086
52C‐Basin2 0.020 ‐ ‐ 0.003 0.007 ‐ 0.003
52C‐Basin3 0.003 ‐ ‐ 0.031 0.003 ‐ 0.026
52C‐Lowest 0.001 0.001 ‐ ‐ 0.001 0.001 ‐ 0.063
52D‐Outlet ‐ 0.142 ‐ ‐ ‐ 0.142 ‐ ‐
MC‐118.5 ‐ ‐ ‐ ‐ ‐ 0.043 ‐ ‐
MC‐137.0 ‐ ‐ ‐ 0.002 ‐ ‐ ‐ 0.002
MC‐139.0 ‐ ‐ ‐ ‐ ‐ ‐ ‐ ‐
MC‐160.0 ‐ 0.001 ‐ ‐ ‐ 0.001 ‐ ‐
MC‐184.0 ‐ 0.001 ‐ 0.036 ‐ 0.001 ‐ 0.036
MC‐198.0 ‐ 0.128 ‐ 0.011 ‐ 0.128 ‐ 0.011
MC‐217.5 ‐ 0.059 ‐ ‐ ‐ 0.059 ‐ ‐
MC‐236.5 ‐ 0.029 ‐ 0.036 ‐ 0.029 ‐ 0.036
MC‐252.0 ‐ 0.002 ‐ 0.014 ‐ 0.002 ‐ 0.014
MC‐254.0 ‐ ‐ ‐ ‐ ‐ ‐ ‐ 0.002
MC‐259.0 ‐ ‐ ‐ 0.011 ‐ ‐ ‐ 0.011

July 2011 35
Contra Costa County, California Hydrologic Analyses
Subbasin
Original Landuse (sq miles) Revised Landuse (sq miles)Agricultural Core Land
Agricultural Land
Business Park
Commercial Agricultural Core Land
Agricultural Land
Business Park
Commercial
MC‐263.0 ‐ ‐ ‐ 0.008 ‐ ‐ ‐ 0.008
MC‐287.0 ‐ ‐ ‐ 0.000 ‐ ‐ ‐ 0.000
MC‐305.5 ‐ ‐ ‐ 0.064 ‐ ‐ ‐ 0.064
MC‐312.0 ‐ ‐ ‐ 0.000 ‐ ‐ ‐ 0.016
MC‐312.5 ‐ ‐ ‐ 0.077 ‐ ‐ ‐ 0.077
MC‐331.1 ‐ ‐ ‐ ‐ ‐ ‐ ‐ ‐
MC‐338.5 ‐ ‐ ‐ ‐ ‐ ‐ ‐ ‐
MC‐363.6 ‐ ‐ ‐ ‐ ‐ ‐ ‐ ‐
MC‐372.0 ‐ ‐ ‐ ‐ ‐ ‐ ‐ ‐
MC‐379.5 ‐ ‐ ‐ ‐ ‐ ‐ ‐ ‐
MC‐380.5 ‐ ‐ ‐ ‐ ‐ ‐ ‐ ‐
MC‐386.0 ‐ ‐ ‐ ‐ ‐ ‐ ‐ ‐
MC‐387.0 ‐ ‐ ‐ ‐ ‐ ‐ ‐ ‐
MC‐389.0 ‐ ‐ ‐ ‐ ‐ ‐ ‐ ‐
MC‐393.4 ‐ ‐ ‐ ‐ ‐ ‐ ‐ ‐
MC‐401.0 ‐ ‐ 0.011 0.003 ‐ 0.011 0.003
MC‐404.2 0.003 ‐ ‐ ‐ 0.003 ‐ ‐ ‐
MC‐404.7 ‐ ‐ ‐ ‐ ‐ ‐ ‐ ‐
MC‐at30ALaruelOut ‐ ‐ ‐ 0.040 ‐ 0.073 ‐ 0.040
MC‐at30Coutlet ‐ ‐ ‐ 0.012 ‐ 0.000 ‐ 0.012
MC‐at52C ‐ 0.000 ‐ ‐ ‐ 0.000 ‐ ‐
MC‐at52D‐Outlet ‐ ‐ ‐ ‐ ‐ ‐ ‐ ‐
MC‐at52D‐OutletSM ‐ ‐ ‐ ‐ ‐ ‐ ‐ ‐
MC‐at8085Basin 0.036 0.067 ‐ ‐ 0.036 0.065 ‐ ‐
MC‐atDS7940Basin 0.135 0.015 ‐ ‐ 0.135 ‐ ‐ ‐
MC‐atDS7940BasSM ‐ 0.001 ‐ ‐ ‐ ‐ ‐ ‐
MC‐atVYNorth 0.040 0.009 ‐ ‐ 0.040 0.009 ‐ ‐
MC‐atVYSouth ‐ 0.001 ‐ ‐ 0.001 ‐ ‐
MC‐DSECCID 0.000 0.000 ‐ ‐ 0.000 0.000 ‐ ‐
MC‐ECCID 0.418 0.012 ‐ ‐ 0.418 0.007 ‐ ‐
MC‐Outlet3 ‐ ‐ ‐ 0.011 ‐ ‐ ‐ 0.011
MC‐US30ALaruelOut ‐ ‐ ‐ 0.000 ‐ ‐ ‐ 0.000
Subbasin
Original Landuse (sq miles) Revised Landuse (sq miles)Light
Industry MultiFamily
Low MultiFamilyMedium
Mobile Homes
Light Industry
MultiFamily Low
MultiFamily Medium
Mobile Homes
104‐3 ‐ ‐ ‐ ‐ ‐ ‐ ‐ ‐
104‐DSFairview ‐ ‐ ‐ ‐ ‐ ‐ ‐ ‐
104‐DSSpaL ‐ ‐ ‐ ‐ ‐ ‐ ‐ ‐
104‐LowBasin ‐ 0.056 0.053 ‐ ‐ 0.001 ‐ ‐
104‐SpaL ‐ ‐ ‐ ‐ ‐ ‐ ‐ ‐
104‐UpBasin ‐ ‐ ‐ ‐ ‐ ‐ ‐ ‐
105‐BtwdLk12 ‐ ‐ ‐ ‐ ‐ ‐ ‐ ‐
105‐BtwdLk14 ‐ ‐ ‐ ‐ ‐ ‐ ‐ ‐
105‐BtwdLk18 ‐ ‐ ‐ ‐ ‐ ‐ ‐ ‐
105‐BtwdLk5 ‐ ‐ ‐ ‐ ‐ ‐ ‐ ‐
105‐DeeratMC ‐ 0.050 ‐ ‐ ‐ ‐ ‐
105‐DeerBasin ‐ 0.001 0.012 ‐ ‐ ‐ 0.022 ‐
105‐DeerDam ‐ ‐ ‐ ‐ ‐ ‐ ‐ ‐
105‐DSBtwdLk14 ‐ ‐ ‐ ‐ ‐ ‐ ‐ ‐
105‐DSBtwdLk18 ‐ ‐ 0.004 ‐ ‐ ‐ 0.004 ‐
105‐DSBtwdLk5 ‐ ‐ ‐ ‐ ‐ ‐ ‐ ‐
105‐DSDeerBasin ‐ ‐ ‐ ‐ ‐ ‐ ‐ ‐
105‐DSDeerDam ‐ 0.007 0.000 ‐ ‐ 0.006 0.000 ‐
106‐DryBasin ‐ 0.018 ‐ ‐ ‐ ‐ ‐ ‐

July 2011 36
Contra Costa County, California Hydrologic Analyses
Subbasin
Original Landuse (sq miles) Revised Landuse (sq miles)Light
Industry MultiFamily
Low MultiFamilyMedium
Mobile Homes
Light Industry
MultiFamily Low
MultiFamily Medium
Mobile Homes
106‐DryDam ‐ ‐ ‐ ‐ ‐ ‐ ‐ ‐
107‐7940Basin ‐ ‐ ‐ ‐ ‐ ‐ ‐ ‐
107‐8085Basin ‐ ‐ ‐ ‐ ‐ ‐ ‐ ‐
107‐DS8085Basin ‐ ‐ ‐ ‐ ‐ ‐ ‐ ‐
107‐DSVYNorthSM ‐ ‐ ‐ ‐ ‐ ‐ ‐ ‐
107‐DSVYSouthSM ‐ ‐ ‐ ‐ ‐ ‐ ‐ ‐
107‐VYNorth ‐ ‐ ‐ ‐ ‐ ‐ ‐ ‐
107‐VYSouth ‐ ‐ ‐ ‐ ‐ ‐ ‐ ‐
108‐EofMCDam ‐ ‐ ‐ ‐ ‐ ‐ ‐ ‐
108‐MCDam ‐ ‐ ‐ ‐ ‐ ‐ ‐ ‐
30A‐2 ‐ 0.001 ‐ ‐ ‐ ‐ ‐ ‐
30A‐BrownBas ‐ ‐ ‐ ‐ ‐ ‐ ‐ ‐
30A‐LaurelBas ‐ 0.010 ‐ ‐ ‐ ‐ ‐ ‐
30C‐DSFVBasin ‐ 0.000 ‐ ‐ ‐ ‐ ‐ ‐
30C‐DSLibertyBas ‐ 0.006 ‐ ‐ ‐ ‐ ‐ ‐
30C‐FairviewBas ‐ 0.099 0.003 ‐ ‐ ‐ 0.023 ‐
30C‐LibertyBas ‐ ‐ ‐ ‐ ‐ ‐ ‐ ‐
52A‐1 0.078 0.024 0.000 0.009 0.078 0.024 ‐ 0.009
52A‐2 0.012 ‐ 0.005 ‐ 0.012 ‐ ‐ ‐
52B‐1 0.018 0.046 0.021 ‐ 0.018 ‐ 0.021 ‐
52C‐Basin1 0.131 0.014 0.014 0.046 0.131 0.003 0.014 0.046
52C‐Basin2 ‐ 0.000 0.038 ‐ ‐ ‐ 0.038 ‐
52C‐Basin3 ‐ 0.174 0.005 ‐ ‐ ‐ 0.005 ‐
52C‐Lowest ‐ ‐ ‐ ‐ ‐ ‐ ‐ ‐
52D‐Outlet ‐ 0.213 ‐ ‐ ‐ ‐ ‐ ‐
MC‐118.5 ‐ 0.000 ‐ ‐ ‐ ‐ ‐ ‐
MC‐137.0 ‐ 0.000 ‐ ‐ ‐ ‐ ‐ ‐
MC‐139.0 ‐ 0.000 ‐ ‐ ‐ ‐ ‐ ‐
MC‐160.0 ‐ 0.000 ‐ ‐ ‐ ‐ ‐ ‐
MC‐184.0 ‐ ‐ ‐ ‐ ‐ ‐ ‐ ‐
MC‐198.0 ‐ ‐ ‐ ‐ ‐ ‐ ‐ ‐
MC‐217.5 ‐ ‐ ‐ ‐ ‐ ‐ ‐ ‐
MC‐236.5 ‐ ‐ ‐ ‐ ‐ ‐ ‐ ‐
MC‐252.0 ‐ 0.012 ‐ ‐ ‐ ‐ ‐ ‐
MC‐254.0 ‐ 0.020 ‐ ‐ ‐ ‐ ‐ ‐
MC‐259.0 ‐ 0.016 ‐ ‐ ‐ ‐ ‐ ‐
MC‐263.0 ‐ 0.002 ‐ ‐ ‐ ‐ ‐ ‐
MC‐287.0 ‐ 0.000 ‐ ‐ ‐ ‐ ‐ ‐
MC‐305.5 ‐ ‐ ‐ ‐ ‐ ‐ ‐ ‐
MC‐312.0 ‐ ‐ ‐ ‐ ‐ ‐ ‐ ‐
MC‐312.5 0.000 ‐ 0.000 ‐ 0.000 ‐ 0.000 ‐
MC‐331.1 0.000 ‐ ‐ ‐ 0.000 ‐ ‐ ‐
MC‐338.5 0.000 ‐ ‐ ‐ 0.000 ‐ ‐ ‐
MC‐363.6 ‐ 0.007 ‐ ‐ ‐ ‐ ‐ ‐
MC‐372.0 ‐ 0.002 ‐ ‐ ‐ ‐ ‐ ‐
MC‐379.5 ‐ ‐ ‐ ‐ ‐ ‐ ‐ ‐
MC‐380.5 ‐ ‐ ‐ ‐ ‐ ‐ ‐ ‐
MC‐386.0 ‐ ‐ ‐ ‐ ‐ ‐ ‐ ‐
MC‐387.0 ‐ ‐ ‐ ‐ ‐ ‐ ‐ ‐
MC‐389.0 ‐ ‐ ‐ ‐ ‐ ‐ ‐ ‐
MC‐393.4 ‐ ‐ ‐ ‐ ‐ ‐ ‐ ‐
MC‐401.0 ‐ 0.035 ‐ ‐ ‐ 0.000 ‐ ‐
MC‐404.2 ‐ ‐ ‐ ‐ ‐ ‐ ‐ ‐
MC‐404.7 ‐ ‐ ‐ ‐ ‐ ‐ ‐ ‐
MC‐at30ALaruelOut ‐ 0.095 ‐ ‐ ‐ ‐ ‐ ‐
MC‐at30Coutlet ‐ 0.024 ‐ ‐ ‐ ‐ ‐ ‐
MC‐at52C ‐ ‐ ‐ ‐ ‐ ‐ ‐ ‐

July 2011 37
Contra Costa County, California Hydrologic Analyses
Subbasin
Original Landuse (sq miles) Revised Landuse (sq miles)Light
Industry MultiFamily
Low MultiFamilyMedium
Mobile Homes
Light Industry
MultiFamily Low
MultiFamily Medium
Mobile Homes
MC‐at52D‐Outlet ‐ 0.000 ‐ ‐ ‐ ‐ ‐ ‐
MC‐at52D‐OutletSM ‐ 0.000 ‐ ‐ ‐ ‐ ‐ ‐
MC‐at8085Basin ‐ ‐ ‐ ‐ ‐ ‐ ‐ ‐
MC‐atDS7940Basin ‐ ‐ ‐ ‐ ‐ ‐ ‐ ‐
MC‐atDS7940BasSM ‐ ‐ ‐ ‐ ‐ ‐ ‐ ‐
MC‐atVYNorth ‐ ‐ ‐ ‐ ‐ ‐ ‐ ‐
MC‐atVYSouth ‐ ‐ ‐ ‐ ‐ ‐ ‐ ‐
MC‐DSECCID ‐ ‐ ‐ ‐ ‐ ‐ ‐ ‐
MC‐ECCID ‐ ‐ ‐ ‐ ‐ ‐ ‐ ‐
MC‐Outlet3 0.000 0.004 ‐ ‐ 0.000 ‐ ‐ ‐
MC‐US30ALaruelOut ‐ 0.000 ‐ ‐ ‐ ‐ ‐ ‐
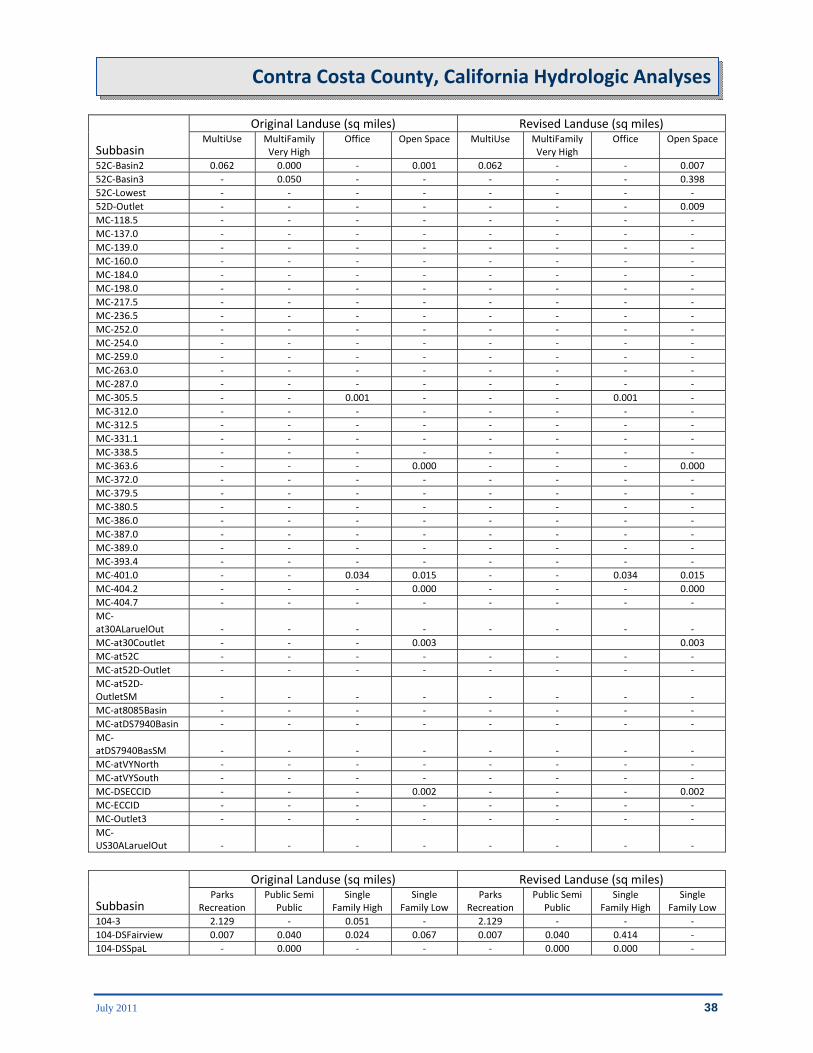
Subbasin
Original Landuse (sq miles) Revised Landuse (sq miles)MultiUse MultiFamily
Very High Office Open Space MultiUse MultiFamily
Very High Office Open Space
104‐3 ‐ ‐ ‐ 0.388 ‐ ‐ ‐ 0.565
104‐DSFairview ‐ ‐ ‐ 0.004 ‐ ‐ ‐ 0.077
104‐DSSpaL ‐ ‐ ‐ ‐ ‐ ‐ ‐ ‐
104‐LowBasin ‐ ‐ ‐ 0.296 ‐ ‐ ‐ 0.909
104‐SpaL ‐ ‐ ‐ 0.003 ‐ ‐ ‐ 0.003
104‐UpBasin ‐ ‐ ‐ 0.849 ‐ ‐ ‐ 1.487
105‐BtwdLk12 ‐ ‐ ‐ 0.013 ‐ ‐ ‐ 0.013
105‐BtwdLk14 ‐ ‐ ‐ ‐ ‐ ‐ ‐ ‐
105‐BtwdLk18 ‐ ‐ ‐ 0.025 ‐ ‐ ‐ 0.025
105‐BtwdLk5 ‐ ‐ ‐ 0.001 ‐ ‐ ‐ 0.001
105‐DeeratMC ‐ ‐ ‐ 0.002 ‐ ‐ ‐ 0.002
105‐DeerBasin ‐ ‐ ‐ 0.020 ‐ ‐ ‐ 0.020
105‐DeerDam ‐ ‐ ‐ 0.945 ‐ ‐ ‐ 0.945
105‐DSBtwdLk14 ‐ ‐ ‐ ‐ ‐ ‐ ‐ ‐
105‐DSBtwdLk18 ‐ ‐ ‐ 0.000 ‐ ‐ ‐ 0.000
105‐DSBtwdLk5 ‐ ‐ ‐ ‐ ‐ ‐ ‐ ‐
105‐DSDeerBasin ‐ ‐ ‐ 0.012 ‐ ‐ ‐ 0.012
105‐DSDeerDam ‐ ‐ ‐ 0.022 ‐ ‐ ‐ 0.022
106‐DryBasin ‐ ‐ ‐ 0.044 ‐ ‐ ‐ 0.074
106‐DryDam ‐ ‐ ‐ 0.085 ‐ ‐ ‐ 0.085
107‐7940Basin ‐ ‐ ‐ 0.017 ‐ ‐ ‐ 0.017
107‐8085Basin ‐ ‐ ‐ 0.006 ‐ ‐ ‐ 0.006
107‐DS8085Basin ‐ ‐ ‐ 0.014 ‐ ‐ ‐ 0.014
107‐DSVYNorthSM ‐ ‐ ‐ ‐ ‐ ‐ ‐ ‐
107‐DSVYSouthSM ‐ ‐ ‐ ‐ ‐ ‐ ‐ ‐
107‐VYNorth ‐ ‐ ‐ 0.000 ‐ ‐ ‐ 0.000
107‐VYSouth ‐ ‐ ‐ ‐ ‐ ‐ ‐ ‐
108‐EofMCDam ‐ ‐ ‐ ‐ ‐ ‐ ‐ ‐
108‐MCDam ‐ ‐ ‐ 1.651 ‐ ‐ ‐ 1.651
30A‐2 ‐ ‐ ‐ 0.003 ‐ ‐ ‐ 0.003
30A‐BrownBas 0.034 ‐ ‐ ‐ 0.034 ‐ ‐ ‐
30A‐LaurelBas ‐ ‐ ‐ ‐ ‐ ‐ ‐ ‐
30C‐DSFVBasin ‐ ‐ ‐ ‐ ‐ ‐ ‐ ‐
30C‐DSLibertyBas ‐ ‐ ‐ ‐ ‐ ‐ ‐ ‐
30C‐FairviewBas ‐ ‐ 0.133 0.003 ‐ 0.138 0.003
30C‐LibertyBas ‐ ‐ ‐ ‐ ‐ ‐ ‐ ‐
52A‐1 0.003 0.000 ‐ ‐ 0.003 ‐ ‐ 0.000
52A‐2 ‐ ‐ ‐ 0.000 ‐ ‐ ‐ 0.000
52B‐1 0.051 0.000 0.022 0.000 0.058 ‐ 0.022 0.000
52C‐Basin1 0.027 0.005 ‐ 0.053 0.027 ‐ ‐ 0.115
July 2011 38
Contra Costa County, California Hydrologic Analyses
Subbasin
Original Landuse (sq miles) Revised Landuse (sq miles)MultiUse MultiFamily
Very High Office Open Space MultiUse MultiFamily
Very High Office Open Space
52C‐Basin2 0.062 0.000 ‐ 0.001 0.062 ‐ ‐ 0.007
52C‐Basin3 ‐ 0.050 ‐ ‐ ‐ ‐ ‐ 0.398
52C‐Lowest ‐ ‐ ‐ ‐ ‐ ‐ ‐ ‐
52D‐Outlet ‐ ‐ ‐ ‐ ‐ ‐ ‐ 0.009
MC‐118.5 ‐ ‐ ‐ ‐ ‐ ‐ ‐ ‐
MC‐137.0 ‐ ‐ ‐ ‐ ‐ ‐ ‐ ‐
MC‐139.0 ‐ ‐ ‐ ‐ ‐ ‐ ‐ ‐
MC‐160.0 ‐ ‐ ‐ ‐ ‐ ‐ ‐ ‐
MC‐184.0 ‐ ‐ ‐ ‐ ‐ ‐ ‐ ‐
MC‐198.0 ‐ ‐ ‐ ‐ ‐ ‐ ‐ ‐
MC‐217.5 ‐ ‐ ‐ ‐ ‐ ‐ ‐ ‐
MC‐236.5 ‐ ‐ ‐ ‐ ‐ ‐ ‐ ‐
MC‐252.0 ‐ ‐ ‐ ‐ ‐ ‐ ‐ ‐
MC‐254.0 ‐ ‐ ‐ ‐ ‐ ‐ ‐ ‐
MC‐259.0 ‐ ‐ ‐ ‐ ‐ ‐ ‐ ‐
MC‐263.0 ‐ ‐ ‐ ‐ ‐ ‐ ‐ ‐
MC‐287.0 ‐ ‐ ‐ ‐ ‐ ‐ ‐ ‐
MC‐305.5 ‐ ‐ 0.001 ‐ ‐ ‐ 0.001 ‐
MC‐312.0 ‐ ‐ ‐ ‐ ‐ ‐ ‐ ‐
MC‐312.5 ‐ ‐ ‐ ‐ ‐ ‐ ‐ ‐
MC‐331.1 ‐ ‐ ‐ ‐ ‐ ‐ ‐ ‐
MC‐338.5 ‐ ‐ ‐ ‐ ‐ ‐ ‐ ‐
MC‐363.6 ‐ ‐ ‐ 0.000 ‐ ‐ ‐ 0.000
MC‐372.0 ‐ ‐ ‐ ‐ ‐ ‐ ‐ ‐
MC‐379.5 ‐ ‐ ‐ ‐ ‐ ‐ ‐ ‐
MC‐380.5 ‐ ‐ ‐ ‐ ‐ ‐ ‐ ‐
MC‐386.0 ‐ ‐ ‐ ‐ ‐ ‐ ‐ ‐
MC‐387.0 ‐ ‐ ‐ ‐ ‐ ‐ ‐ ‐
MC‐389.0 ‐ ‐ ‐ ‐ ‐ ‐ ‐ ‐
MC‐393.4 ‐ ‐ ‐ ‐ ‐ ‐ ‐ ‐
MC‐401.0 ‐ ‐ 0.034 0.015 ‐ ‐ 0.034 0.015
MC‐404.2 ‐ ‐ ‐ 0.000 ‐ ‐ ‐ 0.000
MC‐404.7 ‐ ‐ ‐ ‐ ‐ ‐ ‐ ‐
MC‐at30ALaruelOut ‐ ‐ ‐ ‐ ‐ ‐ ‐ ‐
MC‐at30Coutlet ‐ ‐ ‐ 0.003 0.003
MC‐at52C ‐ ‐ ‐ ‐ ‐ ‐ ‐ ‐
MC‐at52D‐Outlet ‐ ‐ ‐ ‐ ‐ ‐ ‐ ‐
MC‐at52D‐OutletSM ‐ ‐ ‐ ‐ ‐ ‐ ‐ ‐
MC‐at8085Basin ‐ ‐ ‐ ‐ ‐ ‐ ‐ ‐
MC‐atDS7940Basin ‐ ‐ ‐ ‐ ‐ ‐ ‐ ‐
MC‐atDS7940BasSM ‐ ‐ ‐ ‐ ‐ ‐ ‐ ‐
MC‐atVYNorth ‐ ‐ ‐ ‐ ‐ ‐ ‐ ‐
MC‐atVYSouth ‐ ‐ ‐ ‐ ‐ ‐ ‐ ‐
MC‐DSECCID ‐ ‐ ‐ 0.002 ‐ ‐ ‐ 0.002
MC‐ECCID ‐ ‐ ‐ ‐ ‐ ‐ ‐ ‐
MC‐Outlet3 ‐ ‐ ‐ ‐ ‐ ‐ ‐ ‐
MC‐US30ALaruelOut ‐ ‐ ‐ ‐ ‐ ‐ ‐ ‐
Subbasin
Original Landuse (sq miles) Revised Landuse (sq miles)Parks
Recreation Public Semi
Public Single
Family High Single
Family Low Parks
Recreation Public Semi
Public Single
Family High Single
Family Low
104‐3 2.129 ‐ 0.051 ‐ 2.129 ‐ ‐ ‐
104‐DSFairview 0.007 0.040 0.024 0.067 0.007 0.040 0.414 ‐
104‐DSSpaL ‐ 0.000 ‐ ‐ ‐ 0.000 0.000 ‐

July 2011 39
Contra Costa County, California Hydrologic Analyses
Subbasin
Original Landuse (sq miles) Revised Landuse (sq miles)Parks
Recreation Public Semi
Public Single
Family High Single
Family Low Parks
Recreation Public Semi
Public Single
Family High Single
Family Low
104‐LowBasin 0.008 0.169 0.762 ‐ 0.141 0.169 0.385 ‐
104‐SpaL 0.017 0.005 ‐ 0.000 0.017 0.005 0.592 ‐
104‐UpBasin 0.741 0.259 1.304 0.039 1.323 0.268 0.865 ‐
105‐BtwdLk12 0.101 ‐ 0.144 ‐ 0.101 ‐ 0.144 ‐
105‐BtwdLk14 0.027 ‐ 0.022 ‐ 0.026 ‐ 0.024 ‐
105‐BtwdLk18 0.074 ‐ 0.030 ‐ 0.074 ‐ 0.030 ‐
105‐BtwdLk5 0.036 0.005 0.021 ‐ 0.036 0.005 0.022 ‐
105‐DeeratMC 0.001 0.014 0.008 ‐ 0.001 0.014 0.227 ‐
105‐DeerBasin 0.102 0.117 0.093 0.175 0.072 0.117 0.387 0.018
105‐DeerDam 0.021 0.018 ‐ ‐ 0.021 0.018 ‐
105‐DSBtwdLk14 0.076 0.000 0.040 ‐ 0.017 0.000 0.098 0.000
105‐DSBtwdLk18 0.008 ‐ 0.001 ‐ 0.008 ‐ 0.001 ‐
105‐DSBtwdLk5 0.014 ‐ 0.039 ‐ 0.014 ‐ 0.039 ‐
105‐DSDeerBasin 0.003 0.001 0.034 0.060 0.003 0.001 0.099 ‐
105‐DSDeerDam 0.087 0.180 0.131 ‐ 0.087 0.181 0.131 ‐
106‐DryBasin 0.139 0.124 0.062 0.010 0.139 0.122 0.314 ‐
106‐DryDam 0.716 0.036 0.146 ‐ 0.716 0.036 0.196 ‐
107‐7940Basin 0.028 0.062 ‐ 0.008 0.028 0.062 0.237 ‐
107‐8085Basin ‐ 0.016 ‐ 0.062 ‐ 0.016 0.063 ‐
107‐DS8085Basin ‐ 0.013 ‐ 0.034 ‐ 0.013 0.042 ‐
107‐DSVYNorthSM 0.001 ‐ ‐ ‐ 0.001 ‐ 0.000 ‐
107‐DSVYSouthSM ‐ ‐ ‐ ‐ ‐ ‐ ‐ ‐
107‐VYNorth 0.340 0.058 ‐ ‐ 0.340 0.058 0.042 ‐
107‐VYSouth 0.060 0.000 ‐ ‐ 0.060 0.000 ‐ ‐
108‐EofMCDam 0.486 ‐ ‐ ‐ 0.486 ‐ ‐ ‐
108‐MCDam 20.013 0.247 ‐ ‐ 20.013 0.247 0.000 ‐
30A‐2 ‐ 0.002 0.000 ‐ ‐ 0.002 0.016 ‐
30A‐BrownBas ‐ 0.037 0.007 0.057 ‐ 0.038 0.219 0.055
30A‐LaurelBas 0.008 0.046 0.244 0.106 0.039 0.046 0.281 0.187
30C‐DSFVBasin ‐ 0.025 ‐ 0.000 ‐ 0.057 0.133 0.000
30C‐DSLibertyBas ‐ 0.000 ‐ 0.435 ‐ 0.011 0.265 0.283
30C‐FairviewBas ‐ 0.102 0.000 ‐ 0.252 0.107 0.147
30C‐LibertyBas ‐ 0.116 ‐ 0.350 ‐ 0.168 0.391 0.181
52A‐1 0.004 0.025 ‐ ‐ 0.073 0.025 0.282 ‐
52A‐2 ‐ 0.003 0.009 ‐ 0.034 0.003 0.122 ‐
52B‐1 0.007 0.030 ‐ 0.000 0.007 0.030 0.074 0.000
52C‐Basin1 0.001 0.073 ‐ ‐ 0.001 0.073 0.567 ‐
52C‐Basin2 0.004 0.096 0.083 ‐ 0.004 0.096 0.183 ‐
52C‐Basin3 0.000 0.009 0.266 ‐ 0.000 0.009 0.174 ‐
52C‐Lowest 0.046 0.110 0.063 ‐ 0.046 0.110 ‐ ‐
52D‐Outlet 0.003 0.014 ‐ ‐ 0.003 0.014 0.203 ‐
MC‐118.5 ‐ 0.001 0.158 ‐ ‐ 0.001 0.165 0.001
MC‐137.0 0.012 0.010 0.265 0.007 0.012 0.010 0.201 0.017
MC‐139.0 ‐ 0.008 0.022 ‐ ‐ 0.008 0.024 ‐
MC‐160.0 ‐ 0.010 0.084 ‐ ‐ 0.010 0.169 ‐
MC‐184.0 ‐ 0.005 0.163 0.172 ‐ 0.005 0.001 0.172
MC‐198.0 ‐ 0.009 0.024 0.034 ‐ 0.009 ‐ 0.128
MC‐217.5 ‐ 0.002 ‐ ‐ ‐ 0.002 ‐ ‐
MC‐236.5 ‐ 0.006 0.000 0.088 ‐ 0.006 0.019 0.098
MC‐252.0 ‐ 0.001 0.000 ‐ ‐ 0.001 0.012 ‐
MC‐254.0 ‐ 0.002 0.002 ‐ ‐ 0.002 0.020 ‐
MC‐259.0 ‐ 0.002 ‐ ‐ ‐ 0.002 0.016 ‐
MC‐263.0 ‐ 0.009 ‐ ‐ ‐ 0.009 0.002 ‐
MC‐287.0 ‐ 0.007 ‐ 0.106 ‐ 0.007 0.000 0.106
MC‐305.5 ‐ 0.003 ‐ 0.000 ‐ 0.003 0.000 0.000
MC‐312.0 ‐ 0.020 ‐ 0.233 ‐ 0.020 0.071 0.149
MC‐312.5 ‐ 0.016 ‐ 0.053 ‐ 0.016 0.011 0.044
MC‐331.1 ‐ 0.003 ‐ ‐ ‐ 0.003 0.000 ‐

July 2011 40
Contra Costa County, California Hydrologic Analyses
Subbasin
Original Landuse (sq miles) Revised Landuse (sq miles)Parks
Recreation Public Semi
Public Single
Family High Single
Family Low Parks
Recreation Public Semi
Public Single
Family High Single
Family Low
MC‐338.5 ‐ 0.004 ‐ ‐ ‐ 0.004 0.000 ‐
MC‐363.6 ‐ 0.003 ‐ ‐ ‐ 0.003 0.007 ‐
MC‐372.0 ‐ 0.002 ‐ ‐ ‐ 0.002 0.162 ‐
MC‐379.5 ‐ 0.000 ‐ ‐ ‐ 0.000 0.016 ‐
MC‐380.5 ‐ 0.002 ‐ ‐ ‐ 0.002 0.009 ‐
MC‐386.0 ‐ 0.000 ‐ ‐ 0.000 0.000 0.019 ‐
MC‐387.0 ‐ 0.001 ‐ ‐ ‐ 0.001 0.023 ‐
MC‐389.0 ‐ 0.002 ‐ ‐ ‐ 0.002 0.007 ‐
MC‐393.4 ‐ 0.003 ‐ ‐ 0.000 0.003 0.045 ‐
MC‐401.0 0.097 0.094 0.079 0.023 0.097 0.129 0.239 ‐
MC‐404.2 ‐ 0.008 ‐ ‐ 0.000 0.008 0.143 ‐
MC‐404.7 ‐ 0.003 ‐ ‐ ‐ 0.003 0.065 ‐
MC‐at30ALaruelOut ‐ 0.006 0.008 ‐ 0.008 0.006 0.213 0.016
MC‐at30Coutlet ‐ 0.005 ‐ ‐ ‐ 0.005 0.024 ‐
MC‐at52C ‐ 0.007 ‐ ‐ ‐ 0.007 ‐ ‐
MC‐at52D‐Outlet ‐ 0.007 ‐ ‐ ‐ 0.007 0.000 ‐
MC‐at52D‐OutletSM ‐ 0.000 ‐ ‐ ‐ 0.000 0.000 ‐
MC‐at8085Basin ‐ 0.000 ‐ ‐ ‐ 0.000 0.002 ‐
MC‐atDS7940Basin 0.000 ‐ ‐ ‐ 0.000 ‐ 0.015 ‐
MC‐atDS7940BasSM ‐ ‐ ‐ ‐ ‐ 0.001 ‐
MC‐atVYNorth 0.007 0.022 ‐ ‐ 0.007 0.022 ‐ ‐
MC‐atVYSouth 0.051 ‐ ‐ ‐ 0.051 ‐ ‐ ‐
MC‐DSECCID 0.002 0.010 ‐ ‐ 0.002 0.010 0.001 ‐
MC‐ECCID ‐ 0.012 ‐ 0.011 ‐ 0.012 0.016 ‐
MC‐Outlet3 ‐ 0.009 ‐ ‐ ‐ 0.009 0.004 ‐
MC‐US30ALaruelOut ‐ 0.006 ‐ ‐ ‐ 0.006 0.000 ‐
Subbasin
Original Landuse (sq miles) Revised Landuse (sq miles)Single Family Medium
Single Family Very Low
Watershed Single Family Medium
Single Family Very Low
Watershed
104‐3 0.125 ‐ ‐ ‐ ‐ ‐
104‐DSFairview 0.397 0.056 ‐ 0.056 ‐ ‐
104‐DSSpaL 0.000 ‐ ‐ ‐ ‐ ‐
104‐LowBasin 0.646 ‐ ‐ 0.006 ‐ ‐
104‐SpaL 0.592 0.000 ‐ 0.000 ‐ ‐
104‐UpBasin 1.270 ‐ ‐ ‐ ‐ ‐
105‐BtwdLk12 ‐ ‐ ‐ ‐ ‐ ‐
105‐BtwdLk14 0.000 ‐ ‐ ‐ ‐ ‐
105‐BtwdLk18 ‐ ‐ ‐ ‐ ‐ ‐
105‐BtwdLk5 0.000 ‐ ‐ ‐ ‐ ‐
105‐DeeratMC 0.169 0.002 ‐ 0.002 ‐ ‐
105‐DeerBasin 0.127 ‐ ‐ ‐ ‐ ‐
105‐DeerDam ‐ ‐ ‐ ‐ ‐ ‐
105‐DSBtwdLk14 0.000 ‐ ‐ ‐ ‐ ‐
105‐DSBtwdLk18 ‐ ‐ ‐ ‐ ‐ ‐
105‐DSBtwdLk5 ‐ ‐ ‐ ‐ ‐ ‐
105‐DSDeerBasin 0.005 0.000 ‐ 0.000 ‐ ‐
105‐DSDeerDam ‐ ‐ ‐ ‐ ‐ ‐
106‐DryBasin 0.214 ‐ ‐ ‐ ‐ ‐
106‐DryDam 0.050 ‐ ‐ ‐ ‐ ‐
107‐7940Basin 0.111 ‐ ‐ ‐ ‐ ‐
107‐8085Basin 0.000 ‐ ‐ ‐ ‐ ‐
107‐DS8085Basin 0.000 ‐ ‐ ‐ ‐ ‐
107‐DSVYNorthSM ‐ ‐ ‐ ‐ ‐ ‐

July 2011 41
Contra Costa County, California Hydrologic Analyses
Subbasin
Original Landuse (sq miles) Revised Landuse (sq miles)Single Family Medium
Single Family Very Low
Watershed Single Family Medium
Single Family Very Low
Watershed
107‐DSVYSouthSM ‐ ‐ ‐ ‐ ‐ ‐
107‐VYNorth 0.000 ‐ ‐ ‐ ‐ ‐
107‐VYSouth ‐ ‐ ‐ ‐ ‐ ‐
108‐EofMCDam ‐ ‐ 0.028 ‐ ‐ 0.028
108‐MCDam ‐ 0.311 1.164 ‐ 0.311 1.164
30A‐2 0.015 ‐ ‐ ‐ ‐ ‐
30A‐BrownBas 0.286 ‐ ‐ 0.074 ‐ ‐
30A‐LaurelBas 0.351 ‐ ‐ 0.161 ‐ ‐
30C‐DSFVBasin 0.165 0.139 ‐ 0.000 ‐ ‐
30C‐DSLibertyBas 0.119 0.221 ‐ 0.072 0.075 ‐
30C‐FairviewBas 0.244 0.059 ‐ 0.079 0.015 ‐
30C‐LibertyBas 0.018 0.274 ‐ 0.018 0.067 ‐
52A‐1 0.351 ‐ ‐ ‐ ‐ ‐
52A‐2 0.142 ‐ ‐ ‐ ‐ ‐
52B‐1 0.035 ‐ ‐ 0.000 ‐ ‐
52C‐Basin1 0.685 ‐ ‐ ‐ ‐ ‐
52C‐Basin2 0.093 ‐ ‐ ‐ ‐ ‐
52C‐Basin3 0.077 ‐ ‐ ‐ ‐ ‐
52C‐Lowest ‐ ‐ ‐ ‐ ‐ ‐
52D‐Outlet ‐ ‐ ‐ ‐ ‐ ‐
MC‐118.5 0.051 0.061 ‐ 0.061 ‐ ‐
MC‐137.0 ‐ 0.003 ‐ 0.058 ‐ ‐
MC‐139.0 0.002 ‐ ‐ ‐ ‐ ‐
MC‐160.0 0.092 0.020 ‐ 0.027 ‐ ‐
MC‐184.0 0.000 0.064 ‐ 0.226 ‐ ‐
MC‐198.0 0.093 0.053 ‐ 0.078 ‐ ‐
MC‐217.5 ‐ ‐ ‐ ‐ ‐ ‐
MC‐236.5 0.057 0.001 ‐ 0.029 ‐ ‐
MC‐252.0 0.000 0.024 ‐ 0.024 ‐ ‐
MC‐254.0 ‐ ‐ ‐ ‐ ‐ ‐
MC‐259.0 ‐ ‐ ‐ ‐ ‐ ‐
MC‐263.0 ‐ ‐ ‐ ‐ ‐ ‐
MC‐287.0 0.015 ‐ ‐ 0.015 ‐ ‐
MC‐305.5 0.000 ‐ ‐ ‐ ‐
MC‐312.0 0.005 ‐ ‐ 0.002 ‐ ‐
MC‐312.5 0.002 ‐ ‐ ‐ ‐
MC‐331.1 0.000 0.005 ‐ 0.005 ‐ ‐
MC‐338.5 0.000 0.056 ‐ 0.056 ‐ ‐
MC‐363.6 0.000 ‐ ‐ ‐ ‐ ‐
MC‐372.0 0.159 ‐ ‐ ‐ ‐ ‐
MC‐379.5 0.016 ‐ ‐ ‐ ‐ ‐
MC‐380.5 0.009 ‐ ‐ ‐ ‐ ‐
MC‐386.0 0.019 ‐ ‐ ‐ ‐ ‐
MC‐387.0 0.023 ‐ ‐ ‐ ‐ ‐
MC‐389.0 0.007 ‐ ‐ ‐ ‐ ‐
MC‐393.4 0.045 ‐ ‐ ‐ ‐ ‐
MC‐401.0 0.138 ‐ ‐ ‐ ‐ ‐
MC‐404.2 0.144 ‐ ‐ ‐ ‐ ‐
MC‐404.7 0.065 ‐ ‐ ‐ ‐ ‐
MC‐at30ALaruelOut 0.207 ‐ ‐ ‐ ‐ ‐
MC‐at30Coutlet 0.000 ‐ ‐ 0.000 ‐ ‐
MC‐at52C ‐ ‐ ‐ ‐ ‐ ‐
MC‐at52D‐Outlet 0.000 0.000 ‐ 0.000 ‐ ‐
MC‐at52D‐OutletSM ‐ ‐ ‐ ‐ ‐ ‐
MC‐at8085Basin ‐ ‐ ‐ ‐ ‐ ‐
MC‐atDS7940Basin ‐ ‐ ‐ ‐ ‐ ‐
MC‐atDS7940BasSM ‐ ‐ ‐ ‐ ‐ ‐
MC‐atVYNorth ‐ ‐ ‐ ‐ ‐ ‐

July 2011 42
Contra Costa County, California Hydrologic Analyses
Subbasin
Original Landuse (sq miles) Revised Landuse (sq miles)Single Family Medium
Single Family Very Low
Watershed Single Family Medium
Single Family Very Low
Watershed
MC‐atVYSouth ‐ ‐ ‐ ‐ ‐ ‐
MC‐DSECCID 0.001 ‐ ‐ ‐ ‐ ‐
MC‐ECCID ‐ ‐ ‐ ‐ ‐ ‐
MC‐Outlet3 ‐ ‐ ‐ ‐ ‐ ‐
MC‐US30ALaruelOut ‐ ‐ ‐ ‐ ‐ ‐
Table A1‐14. Marsh Creek Original versus Revised Infiltration Rates by Subbasin
Subbasin Original Infiltration Rate
(in/hr)
Revised Infiltration Rate
(in/hr)
Subbasin Original Infiltration Rate
(in/hr)
Revised Infiltration Rate
(in/hr)
104‐3 0.175 0.170 108‐MCDam 0.175 0.173
104‐DSFairview 0.091 0.089 30A‐2 0.093 0.096
104‐DSSpaL 0.155 0.066 30A‐BrownBas 0.084 0.084
104‐LowBasin 0.153 0.113 30A‐LaurelBas 0.108 0.081
104‐SpaL 0.070 0.090 30C‐DSFVBasin 0.131 0.114
104‐UpBasin 0.158 0.126 30C‐DSLibertyBas 0.107 0.124
105‐BtwdLk12 0.115 0.114 30C‐FairviewBas 0.095 0.056
105‐BtwdLk14 0.123 0.123 30C‐LibertyBas 0.105 0.123
105‐BtwdLk18 0.148 0.132 52A‐1 0.083 0.075
105‐BtwdLk5 0.138 0.126 52A‐2 0.087 0.080
105‐DeeratMC 0.073 0.083 52B‐1 0.052 0.040
105‐DeerBasin 0.104 0.110 52C‐Basin1 0.084 0.077
105‐DeerDam 0.175 0.176 52C‐Basin2 0.086 0.073
105‐DSBtwdLk14 0.082 0.134 52C‐Basin3 0.136 0.063
105‐DSBtwdLk18 0.130 0.128 52C‐Lowest 0.132 0.063
105‐DSBtwdLk5 0.095 0.095 52D‐Outlet 0.115 0.103
105‐DSDeerBasin 0.081 0.108 MC‐118.5 0.089 0.090
105‐DSDeerDam 0.155 0.146 MC‐137.0 0.081 0.075
106‐DryBasin 0.121 0.103 MC‐139.0 0.093 0.066
106‐DryDam 0.168 0.167 MC‐160.0 0.075 0.084
107‐7940Basin 0.105 0.075 MC‐184.0 0.097 0.097
107‐8085Basin 0.094 0.115 MC‐198.0 0.132 0.129
107‐DS8085Basin 0.116 0.105 MC‐217.5 0.175 0.172
107‐DSVYNorthSM 0.151 0.167 MC‐236.5 0.105 0.102
107‐DSVYSouthSM 0.175 0.040 MC‐252.0 0.072 0.098
107‐VYNorth 0.169 0.101 MC‐254.0 0.073 0.059
107‐VYSouth 0.175 0.061 MC‐259.0 0.059 0.044
108‐EofMCDam 0.175 0.171 MC‐263.0 0.103 0.043

July 2011 43
Contra Costa County, California Hydrologic Analyses
Table A1‐14. Marsh Creek Original versus Revised Infiltration Rates by Subbasin (cont).
Subbasin Original Infiltration Rate (in/hr)
Revised Infiltration Rate (in/hr)
MC‐287.0 0.122 0.115 MC‐305.5 0.031 0.022 MC‐312.0 0.105 0.117 MC‐312.5 0.074 0.062 MC‐331.1 0.118 0.121 MC‐338.5 0.092 0.149 MC‐363.6 0.096 0.059 MC‐372.0 0.067 0.086 MC‐379.5 0.067 0.087 MC‐380.5 0.082 0.083 MC‐386.0 0.067 0.087 MC‐387.0 0.070 0.086 MC‐389.0 0.086 0.082 MC‐393.4 0.073 0.085 MC‐401.0 0.112 0.089 MC‐404.2 0.071 0.087 MC‐404.7 0.071 0.086 MC‐at30ALaruelOut 0.091 0.071 MC‐at30Coutlet 0.074 0.056 MC‐at52C 0.175 0.061 MC‐at52D‐Outlet 0.171 0.063 MC‐at52D‐OutletSM 0.159 0.060 MC‐at8085Basin 0.112 0.087 MC‐atDS7940Basin 0.007 0.162 MC‐atDS7940BasSM 0.066 0.040 MC‐atVYNorth 0.085 0.140 MC‐atVYSouth 0.175 0.167 MC‐DSECCID 0.165 0.088 MC‐ECCID 0.010 0.167 MC‐Outlet3 0.088 0.043 MC‐US30ALaruelOut 0.170 0.058

July 2011 44
Contra Costa County, California Hydrologic Analyses
Appendix A‐2
Lag Time Calculations
July 2011 45
Contra Costa County, California Hydrologic Analyses

July 2011 46
Contra Costa County, California Hydrologic Analyses
Table A2-1. Brushy Creek Area-Weighted Manning’s N Calculations
Subbasin Number
Agricultural Land
Delta Recreation
Open Space
Parks and Recreation
Public/Semi‐Public
Water Watershed Total
Average Manning’s n
0.085 0.058 0.085 0.075 0.028 0.028 0.085
1 0.080 ‐ ‐ ‐ ‐ ‐ 0.007 0.087
2 0.085 ‐ ‐ ‐ ‐ ‐ ‐ 0.085
3 0.058 ‐ ‐ 0.043 ‐ ‐ ‐ 0.100
4 0.085 ‐ ‐ ‐ ‐ ‐ ‐ 0.085
5 0.067 ‐ ‐ 0.022 ‐ ‐ 0.024 0.112
6 0.061 ‐ ‐ 0.017 ‐ ‐ ‐ 0.078
7 0.068 ‐ ‐ 0.008 ‐ ‐ ‐ 0.077
8 0.085 ‐ ‐ ‐ ‐ ‐ ‐ 0.085
9 0.085 ‐ ‐ ‐ ‐ ‐ ‐ 0.085
10 0.063 ‐ 0.004 ‐ 0.007 ‐ 0.006 0.079
11 0.085 ‐ ‐ ‐ ‐ ‐ ‐ 0.085
12 0.038 ‐ ‐ ‐ 0.008 ‐ ‐ 0.046
13 0.076 ‐ 0.012 ‐ 0.001 ‐ ‐ 0.088

July 2011 47
Contra Costa County, California Hydrologic Analyses
Table A2-2. Brushy Creek Lag Time Calculations
Subbasin Number Stream Length
(miles) Lca Length (miles)
Upstream Elevation (feet)
Downstream Elevation (feet)
Slope (ft/mile)
Manning’s n Lag time (hours)
1 2.021 0.622 1356 820 265.155 0.087 0.789
2 3.500 1.342 1292 438 243.990 0.085 1.292
3 3.129 1.491 1214 336 280.623 0.100 1.477
4 2.740 0.914 1026 336 251.852 0.085 1.011
5 4.875 2.379 1198 152 214.552 0.112 2.460
6 2.156 1.163 990 214 360.006 0.078 0.868
7 1.766 0.868 814 214 339.671 0.077 0.718
8 2.604 1.410 792 102 264.958 0.085 1.158
9 0.762 0.375 368 168 262.505 0.085 0.440
10 3.067 1.459 320 44 89.978 0.079 1.425
11 1.158 0.740 168 102 57.000 0.085 0.892
12 3.028 1.980 236 44 63.417 0.046 0.991
13 4.976 3.401 216 4 42.605 0.088 3.033

July 2011 48
Contra Costa County, California Hydrologic Analyses

July 2011 49
Contra Costa County, California Hydrologic Analyses
Table A2‐3. Frisk Creek Area‐Weighted Manning’s N Calculations
Subbasin Number
Agricultural Core Land
Agricultural Land
Commercial Light Industry
Multiple Family
Residential Low
Multiple Family
Residential Medium
Open Space Parks and Recreation
Average Manning’s N
0.075 0.085 0.028 0.053 0.028 0.028 0.085 0.075
1 ‐ 0.040 ‐ ‐ ‐ ‐ ‐ ‐
2 ‐ 0.076 ‐ ‐ ‐ ‐ ‐ ‐
3 ‐ 0.084 ‐ ‐ ‐ ‐ ‐ ‐
4 ‐ 0.078 ‐ ‐ ‐ ‐ ‐ ‐
5 0.007 0.076 ‐ ‐ ‐ ‐ ‐ ‐
6 0.056 0.021 ‐ ‐ ‐ ‐ ‐ ‐
7 0.002 0.067 ‐ ‐ ‐ ‐ ‐ ‐
8 ‐ 0.084 ‐ ‐ ‐ ‐ ‐ ‐
9 ‐ 0.080 ‐ ‐ ‐ ‐ ‐ ‐
10 0.016 0.050 0.001 0.001 0.001 ‐ ‐ ‐
11 0.009 0.065 ‐ ‐ ‐ ‐ 0.005 ‐

July 2011 50
Contra Costa County, California Hydrologic Analyses
Table A2‐3. Frisk Creek Area‐Weighted Manning’s N Calculations (cont.)
Subbasin Number
Public/Semi‐Public
Single Family Residential
High
Single Family Residential Medium
Single Family Residential Very Low
Water Watershed Total
Average Manning’s N
0.028 0.028 0.028 0.028 0.028 0.085
1 ‐ ‐ ‐ ‐ ‐ 0.045 0.085
2 ‐ ‐ ‐ ‐ ‐ 0.009 0.085
3 ‐ ‐ ‐ ‐ ‐ 0.001 0.085
4 ‐ ‐ ‐ ‐ ‐ 0.007 0.085
5 ‐ ‐ ‐ ‐ ‐ 0.001 0.084
6 ‐ ‐ ‐ ‐ ‐ ‐ 0.077
7 ‐ 0.001 0.002 0.001 ‐ ‐ 0.075
8 ‐ ‐ ‐ ‐ ‐ ‐ 0.084
9 0.001 0.001 ‐ ‐ ‐ ‐ 0.082
10 0.001 0.003 ‐ ‐ ‐ ‐ 0.072
11 0.001 ‐ ‐ ‐ ‐ ‐ 0.081

July 2011 51
Contra Costa County, California Hydrologic Analyses
Table A2-4. Frisk Creek Lag Time Calculations
Subbasin Number
Stream Length (miles)
Lca Length (miles)
Upstream Elevation (feet)
Downstream Elevation (feet)
Slope (ft/mile)
Manning’s n Lag time (hours)
1 3.315 1.739 922 116 243.113 0.085 1.398
2 1.919 0.911 380 116 137.566 0.085 0.990
3 3.104 1.678 352 56 95.353 0.085 1.607
4 2.419 1.258 236 56 74.412 0.085 1.373
5 3.562 2.366 342 32 87.030 0.084 1.940
6 2.037 0.924 182 32 73.649 0.077 1.038
7 3.002 2.000 94 8 28.651 0.075 1.880
8 1.400 0.368 44 30 9.998 0.084 1.012
9 2.739 1.846 30 8 8.031 0.082 2.452
10 2.071 1.231 32 8 11.590 0.072 1.548
11 2.267 0.776 28 2 11.468 0.081 1.515

July 2011 52
Contra Costa County, California Hydrologic Analyses

July 2011 53
Contra Costa County, California Hydrologic Analyses
Table A2‐5. Kellogg Creek Area‐Weighted Manning’s N Calculations
Subbasin Number
Agricultural Core Land
Agricultural Land
Commercial Light Industry
Multiple Family
Residential Low
Office Park Open Space Parks and Recreation
Average Manning’s N
0.075 0.085 0.028 0.053 0.028 0.028 0.085 0.075
2 ‐ ‐ ‐ ‐ ‐ ‐ ‐ 0.001
3 ‐ ‐ ‐ ‐ ‐ ‐ ‐ ‐
4 ‐ ‐ ‐ ‐ ‐ ‐ ‐ ‐
5 ‐ ‐ ‐ ‐ ‐ ‐ ‐ ‐
6 ‐ ‐ ‐ ‐ ‐ ‐ ‐ 0.002
7 ‐ 0.001 ‐ ‐ ‐ ‐ ‐ ‐
8 ‐ 0.031 ‐ ‐ ‐ ‐ ‐ 0.038
9 0.016 0.013 ‐ ‐ ‐ ‐ ‐ 0.042
10 0.037 0.043 ‐ ‐ ‐ ‐ ‐ ‐
11 0.074 ‐ ‐ ‐ ‐ ‐ ‐ ‐
12 0.074 ‐ ‐ ‐ ‐ ‐ ‐ ‐
13 0.068 ‐ ‐ ‐ ‐ ‐ ‐ ‐
14 0.005 0.055 0.002 0.001 ‐ ‐ 0.011 ‐

July 2011 54
Contra Costa County, California Hydrologic Analyses
Table A2‐5. Kellogg Creek Area‐Weighted Manning’s N Calculations (cont.)
Subbasin Number
Public/Semi‐Public
Single Family Residential
High
Single Family Residential Medium
Water Watershed Total
Average Manning’s N
0.028 0.028 0.028 0.028 0.085
2 ‐ ‐ ‐ ‐ 0.084 0.085
3 ‐ ‐ ‐ ‐ 0.084 0.084
4 ‐ ‐ ‐ ‐ 0.085 0.085
5 ‐ ‐ ‐ ‐ 0.085 0.085
6 ‐ ‐ ‐ ‐ 0.083 0.085
7 ‐ ‐ ‐ ‐ 0.084 0.085
8 0.001 ‐ ‐ ‐ 0.009 0.078
9 0.002 ‐ ‐ ‐ ‐ 0.073
10 ‐ ‐ ‐ ‐ ‐ 0.080
11 ‐ ‐ ‐ ‐ ‐ 0.074
12 ‐ ‐ ‐ ‐ ‐ 0.075
13 0.003 ‐ ‐ ‐ ‐ 0.071
14 ‐ ‐ 0.002 ‐ ‐ 0.076

July 2011 55
Contra Costa County, California Hydrologic Analyses
Table A2-6. Kellogg Creek Lag Time Calculations
Subbasin Number
Stream Length (miles)
Lca Length (miles)
Upstream Elevation (feet)
Downstream Elevation (feet)
Slope (ft/mile)
Manning’s n Lag time (hours)
2 2.545 1.337 1178 202 383.508 0.085 1.049
3 1.923 0.797 1258 254 522.185 0.084 0.722
4 2.193 0.791 1171 202 441.851 0.085 0.791
5 2.286 1.344 961 205 330.722 0.085 1.038
6 3.238 1.657 921 136 242.423 0.085 1.361
7 3.642 2.099 693 136 152.957 0.085 1.699
8 2.802 1.011 397 3 140.612 0.078 1.087
9 2.654 1.424 359 3 134.116 0.073 1.145
10 4.161 1.624 181 3 42.781 0.080 1.944
11 2.460 1.347 77 3 30.080 0.074 1.467
12 2.032 1.000 51 3 23.616 0.075 1.292
13 2.051 1.253 45 3 20.473 0.071 1.374
14 1.430 0.832 23 3 13.989 0.076 1.180
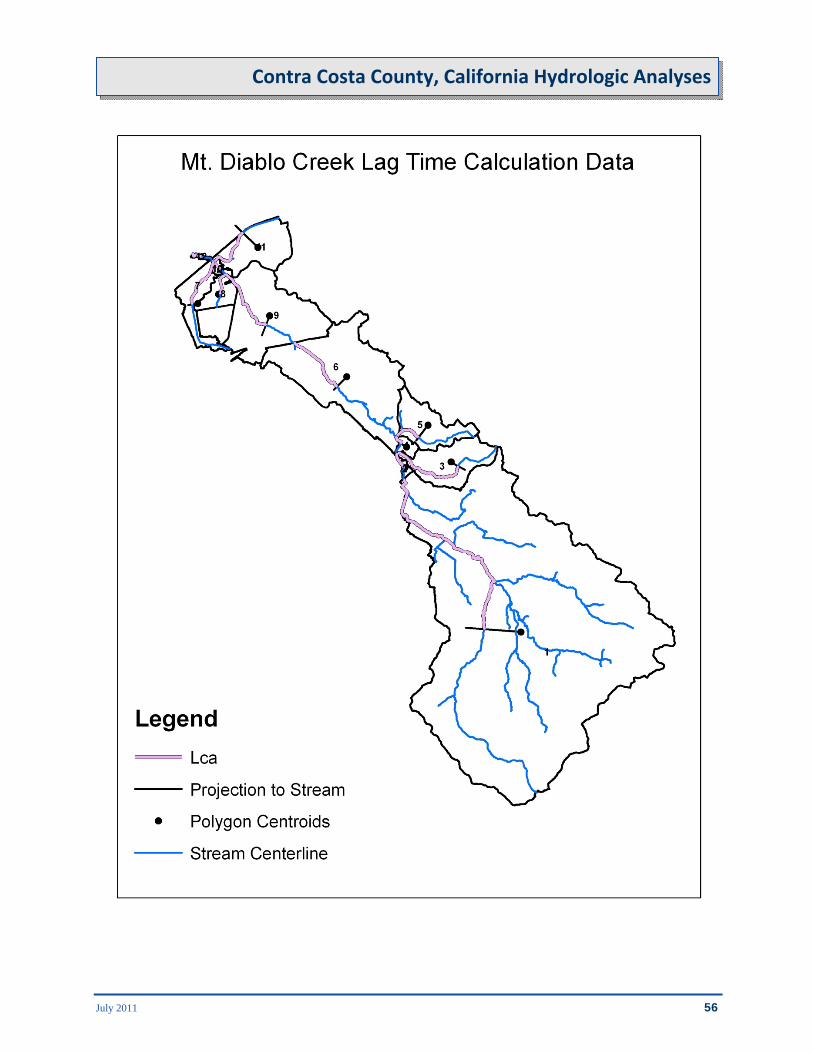
July 2011 56
Contra Costa County, California Hydrologic Analyses

July 2011 57
Contra Costa County, California Hydrologic Analyses
Table A2‐7. Mt. Diablo Creek Area‐Weighted Manning’s N by Landuse
Subbasin Number
Agricultural Land
Commercial Heavy Industry
Landfill Light Industry Multiple Family
Residential Low
Multiple Family
Residential Medium
Office Park
Average Manning’s N
0.085 0.028 0.038 0.035 0.053 0.028 0.028 0.028
1 0.027 ‐ ‐ ‐ ‐ ‐ ‐ ‐
2 ‐ ‐ ‐ ‐ ‐ ‐ ‐ ‐
3 ‐ ‐ ‐ 0.003 ‐ ‐ ‐ ‐
4 ‐ ‐ ‐ ‐ ‐ ‐ ‐ ‐
5 0.002 ‐ ‐ 0.003 ‐ ‐ ‐ ‐
6 0.004 ‐ ‐ ‐ ‐ ‐ ‐ ‐
7 ‐ ‐ ‐ ‐ 0.007 ‐ ‐ ‐
8 ‐ ‐ ‐ ‐ 0.002 ‐ ‐ ‐
9 0.020 ‐ ‐ ‐ 0.012 ‐ ‐ ‐
10 ‐ ‐ ‐ ‐ ‐ ‐ ‐ ‐
11 ‐ ‐ ‐ ‐ ‐ ‐ ‐ ‐
12 ‐ ‐ ‐ ‐ ‐ ‐ ‐ ‐

July 2011 58
Contra Costa County, California Hydrologic Analyses
Table A2‐7. Mt. Diablo Creek Area‐Weighted Manning’s N by Landuse (cont.)
Subbasin Number
Open Space Parks and Recreation
Public/Semi‐Public
Single Family Residential
High
Single Family Residential
Low
Single Family Residential Medium
Single Family Residential Very Low
Total
Average Manning’s N
0.085 0.075 0.028 0.028 0.028 0.028 0.028
1 0.008 0.027 0.001 0.005 ‐ ‐ ‐ 0.068
2 ‐ ‐ 0.028 ‐ ‐ ‐ ‐ 0.028
3 ‐ ‐ 0.025 ‐ ‐ ‐ ‐ 0.029
4 ‐ ‐ 0.028 ‐ ‐ ‐ ‐ 0.028
5 ‐ ‐ 0.025 ‐ ‐ ‐ ‐ 0.030
6 ‐ ‐ 0.027 ‐ ‐ ‐ ‐ 0.031
7 0.064 ‐ 0.003 ‐ ‐ ‐ ‐ 0.074
8 0.036 ‐ 0.005 ‐ ‐ ‐ ‐ 0.053
9 0.004 0.008 0.009 0.002 ‐ ‐ ‐ 0.054
10 0.003 ‐ 0.027 ‐ ‐ ‐ ‐ 0.030
11 ‐ ‐ 0.028 ‐ ‐ ‐ ‐ 0.028
12 0.079 ‐ 0.002 ‐ ‐ ‐ ‐ 0.081

July 2011 59
Contra Costa County, California Hydrologic Analyses
Table A2-8. Mt. Diablo Creek Lag Time Calculations
Subbasin Number
Stream Length (miles)
Lca Length (miles)
Upstream Elevation (feet)
Downstream Elevation (feet)
Slope (ft/mile)
Manning’s n Lag time (hours)
1 11.653 5.872 3800 218 307.388 0.068 2.738
2 0.730 0.409 218 186 43.864 0.028 0.207
3 3.246 1.992 1438 186 385.701 0.029 0.456
4 0.735 0.474 318 168 204.140 0.028 0.164
5 1.966 0.688 1176 168 512.793 0.030 0.247
6 4.048 1.632 168 58 27.174 0.031 0.814
7 2.678 1.060 122 4 44.062 0.074 1.286
8 1.202 0.478 26 4 18.304 0.053 0.593
9 2.275 1.512 58 6 22.854 0.054 1.144
10 0.373 0.222 6 4 5.364 0.030 0.203
11 2.137 1.333 602 2 280.726 0.028 0.343
12 0.513 0.239 4 0 7.792 0.081 0.593

July 2011 60
Contra Costa County, California Hydrologic Analyses
Table A2‐9. Marsh Creek Original and Revised Manning’s n and Lag Time by Subbasin
Subbasin Original Manning’s n
Revised Manning’s n
Original lag time (hrs)
Revised lag time (hrs)
104‐3 0.0733 0.0810 2.004 2.216
104‐DSFairview 0.0253 0.0359 0.243 0.344
104‐DSSpaL 0.0240 0.0280 0.007 0.008
104‐LowBasin 0.0445 0.0709 1.048 1.672
104‐SpaL 0.0253 0.0295 0.519 0.605
104‐UpBasin 0.0613 0.0712 1.616 1.877
105‐BtwdLk12 0.0437 0.0499 0.395 0.451
105‐BtwdLk14 0.0361 0.0525 0.136 0.198
105‐BtwdLk18 0.0384 0.0667 0.327 0.568
105‐BtwdLk5 0.0574 0.0554 0.242 0.233
105‐DeeratMC 0.0250 0.0285 0.269 0.307
105‐DeerBasin 0.0265 0.0358 0.349 0.473
105‐DeerDam 0.0751 0.0847 2.008 2.264
105‐DSBtwdLk14 0.0445 0.0350 0.346 0.272
105‐DSBtwdLk18 0.0275 0.0575 0.077 0.161
105‐DSBtwdLk5 0.0322 0.0407 0.211 0.267
105‐DSDeerBasin 0.0264 0.0351 0.198 0.265
105‐DSDeerDam 0.0557 0.0605 0.961 1.045
106‐DryBasin 0.0328 0.0446 0.616 0.838
106‐DryDam 0.0720 0.0779 1.324 1.432
107‐7940Basin 0.0245 0.0380 0.260 0.403
107‐8085Basin 0.0268 0.0322 0.119 0.143
107‐DS8085Basin 0.0262 0.0453 0.174 0.301
107‐DSVYNorthSM 0.0581 0.0743 0.033 0.043
107‐DSVYSouthSM 0.0404 0.0850 0.019 0.039
107‐VYNorth 0.0624 0.0726 0.820 0.956
107‐VYSouth 0.0561 0.0834 0.433 0.643
108‐EofMCDam 0.0748 0.0755 0.955 0.964
108‐MCDam 0.0748 0.0805 6.160 6.624
30A‐2 0.0257 0.0360 0.095 0.133
30A‐BrownBas 0.0250 0.0280 0.295 0.330
30A‐LaurelBas 0.0249 0.0372 0.224 0.336
30C‐DSFVBasin 0.0267 0.0519 0.377 0.732
30C‐DSLibertyBas 0.0273 0.0335 0.489 0.601
30C‐FairviewBas 0.0235 0.0297 0.415 0.525
30C‐LibertyBas 0.0272 0.0280 0.411 0.423
52A‐1 0.0245 0.0389 0.497 0.789
52A‐2 0.0248 0.0391 0.263 0.414
52B‐1 0.0225 0.0303 0.349 0.469
52C‐Basin1 0.0246 0.0400 0.505 0.819
52C‐Basin2 0.0251 0.0305 0.307 0.373

July 2011 61
Contra Costa County, California Hydrologic Analyses
Table A2‐9. Marsh Creek Original and Revised Manning’s n and Lag Time by Subbasin (cont.)
Subbasin Original Manning’s n
Revised Manning’s n
Original lag time (hrs)
Revised lag time (hrs)
52C‐Basin3 0.0239 0.0652 0.400 1.090
52C‐Lowest 0.0239 0.0384 0.296 0.476
52D‐Outlet 0.0318 0.0516 0.624 1.011
MC‐118.5 0.0253 0.0372 0.257 0.377
MC‐137.0 0.0245 0.0300 0.345 0.422
MC‐139.0 0.0240 0.0280 0.150 0.175
MC‐160.0 0.0251 0.0284 0.232 0.262
MC‐184.0 0.0258 0.0282 0.359 0.392
MC‐198.0 0.0329 0.0487 0.355 0.525
MC‐217.5 0.0445 0.0833 0.216 0.405
MC‐236.5 0.0280 0.0356 0.344 0.437
MC‐252.0 0.0265 0.0306 0.111 0.128
MC‐254.0 0.0236 0.0280 0.099 0.117
MC‐259.0 0.0228 0.0280 0.090 0.110
MC‐263.0 0.0227 0.0280 0.075 0.092
MC‐287.0 0.0268 0.0280 0.148 0.155
MC‐305.5 0.0215 0.0280 0.121 0.157
MC‐312.0 0.0269 0.0280 0.322 0.335
MC‐312.5 0.0238 0.0280 0.138 0.163
MC‐331.1 0.0271 0.0281 0.100 0.104
MC‐338.5 0.0287 0.0280 0.173 0.169
MC‐363.6 0.0236 0.0281 0.067 0.079
MC‐372.0 0.0252 0.0280 0.248 0.276
MC‐379.5 0.0252 0.0280 0.087 0.097
MC‐380.5 0.0250 0.0280 0.067 0.076
MC‐386.0 0.0252 0.0280 0.096 0.107
MC‐387.0 0.0251 0.0280 0.077 0.086
MC‐389.0 0.0249 0.0280 0.073 0.081
MC‐393.4 0.0251 0.0280 0.101 0.112
MC‐401.0 0.0253 0.0382 0.413 0.624
MC‐404.2 0.0255 0.0293 0.307 0.352
MC‐404.7 0.0251 0.0280 0.177 0.197
MC‐at30ALaruelOut 0.0243 0.0407 0.209 0.350
MC‐at30Coutlet 0.0234 0.0316 0.121 0.164
MC‐at52C 0.0538 0.0288 0.185 0.099
MC‐at52D‐Outlet 0.0464 0.0280 0.187 0.113
MC‐at52D‐OutletSM 0.0237 0.0280 0.005 0.006
MC‐at8085Basin 0.0304 0.0839 0.172 0.476

July 2011 62
Contra Costa County, California Hydrologic Analyses
Table A2‐9. Marsh Creek Original and Revised Manning’s n and Lag Time by Subbasin (cont.)
Subbasin Original Manning’s n
Revised Manning’s n
Original lag time (hrs)
Revised lag time (hrs)
MC‐atDS7940Basin 0.0428 0.0794 0.379 0.702
MC‐atDS7940BasSM 0.0259 0.0280 0.020 0.021
MC‐atVYNorth 0.0465 0.0681 0.364 0.532
MC‐atVYSouth 0.0739 0.0752 0.399 0.406
MC‐DSECCID 0.0553 0.0399 0.325 0.235
MC‐ECCID 0.0435 0.0816 0.551 1.032
MC‐Outlet3 0.0227 0.0280 0.111 0.137
MC‐US30ALaruelOut 0.0236 0.0280 0.081 0.097

July 2011 63
Contra Costa County, California Hydrologic Analyses
Appendix A‐3
Reservoir Information

July 2011 64
Contra Costa County, California Hydrologic Analyses
EDITS TO RESERVOIR ELEMENTS IN THE MARSH CREEK MODEL Mark Boucher from the Contra Costa Flood Control and Water Conservation District provided a spreadsheet with the elevation‐storage‐discharge information for all of the reservoirs in the Marsh Creek model. Some of the reservoir curves had to be extended because the elevation computed with the HEC‐HMS model was above the elevation originally in the model. If data was available from the County then the curves were extended using that information. If there was no additional information then a combination of extrapolation and/or topographic information was used to extend the basin curves. The information below explains where the reservoir data came from and what changes were made. Basin Name in Model: 107‐VYSouth Name from County information: Vinyards South Basin Source Information: County reports source as November 2005 Report by Balance Hydrologics for “Vinyards at Marsh Creek” Notes: the information provided by Contra Costa County was extended using the topographic data. Figure A3‐1 below shows the 107‐VYSouth basin and from the contour data it appears that the elevation‐storage‐discharge data provided by the county can be extrapolated to about elevation 137.5. At 138 the basin will start to experience weir flow. The elevation‐storage relationship up to elevation 138 was maintained but at 138 the discharge would start to increase to account for the weir flow. At this point the discharge at 138 was calculated using the standard weir flow equation.
/ For this situation: C = 2.6 (average coefficient for a broad crested weir) L = 86 feet (measured in GIS) H = 0.5 feet Q = 79.0 cfs

July 2011 65
Contra Costa County, California Hydrologic Analyses
Figure A3‐1. 107‐VY Basin with contours and weir location Figures A3‐2 and A3‐3 below show the changes to the elevation‐storage and storage‐discharge curves. The values are listed in the table A3‐1.
Figure A3‐2. Reservoir 107‐VY South Storage‐Discharge Curve
0
10
20
30
40
50
60
70
80
90
0 5 10 15 20 25 30 35
Storage
(ac‐ft)
Discharge (cfs)
107‐VY South Storage‐Discharge
Modified Storage‐Discharge Curve Original Storage‐Discharge Curve

July 2011 66
Contra Costa County, California Hydrologic Analyses
Figure A3‐3 Reservoir 107‐VYSouth Elevation‐Storage Curve
Table A3‐1. Reservoir 107‐VYSouth Elevation‐Storage‐Discharge Data
Elevation (ft) Storage (ac‐ft) Discharge (cfs)
122 0 0
124 2.1 1.6
126 4.6 2.3
128 7.6 11.7
130 11.1 16.9
132 15 20.7
134 19.6 23.9
136 24.7 26.7
138 30.3 79.0
The last data point was added to the paired data tables in the model.
0
5
10
15
20
25
30
35
40
120 125 130 135 140 145
Storage
(ac‐ft)
Elevation (ft)
107‐VY South Elevation‐Storage
Modified Elevation‐Storage Curve Original Elevation‐Storage Curve

July 2011 67
Contra Costa County, California Hydrologic Analyses
Basin Name in Model: 107‐VYNorth Name from County information: Vinyards North Basin Source Information: County reports source as November 2005 Report by Balance Hydrologics for “Vinyards at Marsh Creek” Notes: A review of the aerial photo and topographic data shows an elevation of about 124 to 124.5 for most of the road that surrounds the basin. It was assumed that water will not overflow the basin at elevation 124 so the two curves were extended slightly to 124 and the corresponding data entered into the model. Figures A3‐4 and A3‐5 below show the changes to the elevation‐storage and storage‐discharge curves. The values are listed in the table A3‐2.
Figure A3‐4. Reservoir 107‐VYNorth Storage‐Discharge Curve
0
10
20
30
40
50
60
0 10 20 30 40 50 60 70 80
Discharge
(cfs)
Storage (ac‐ft)
107‐VYNorth Storage‐Discharge
Modified Storage‐Discharge Curve Original Storage‐Discharge Curve

July 2011 68
Contra Costa County, California Hydrologic Analyses
Figure A3‐5. Reservoir 107‐VYNorth Elevation‐Discharge Curve
Table A3‐2. Reservoir 107‐VYNorth Elevation‐Storage‐Discharge Data
Elevation (ft) Storage (ac‐ft) Discharge (cfs)
107 0 0
108 0.6 0.7
110 4.5 1.3
111 7.7 1.6
112 11.3 5.4
113.2 15.3 11.4
114 18.7 13.7
116 26.9 21.8 118 35.7 33.2 120 45.3 40.4 122 56 46.3
124 67.4 52.2
The last data point was added to the paired data tables in the model.
0
10
20
30
40
50
60
70
80
105 110 115 120 125
Storage
(ac‐ft)
Elevation (ft)
107‐VYNorth Elevation‐Storage
Modified Elevation‐Storage Curve Original Elevation‐Storage Curve

July 2011 69
Contra Costa County, California Hydrologic Analyses
Basin Name in Model: 105 Deer Crk Basin Name from County information: None Source Information: County reports source as HYDRO2 Model in the “Deer Creek Hydrology Report” dated November 10, 1997, File No. 3105‐04 Notes: the information from the County was extended by using ArcGIS to create 0.5 foot contours from the DEMs provided by the County. The area was calculated at the 95 and 98 contours and additional storage values were calculated. The equation in the County’s spreadsheet was used to calculate the corresponding discharge values. A review of the topography and a review of the area in Google StreetView seems to show that water will not start flooding over the roads until the elevation reaches about 99 feet so it was assumed that the discharge equation used by the County would still be accurate at 98 feet. Figures A3‐6 and A3‐7 below show the changes to the elevation‐storage and storage‐discharge curves. The values are listed in the table A3‐3.
Figure A3‐6. Reservoir Deer Crk Storage‐Discharge Curve
0
50
100
150
200
250
0 20 40 60 80 100 120 140 160 180
Discharge
(cfs)
Storage (ac‐ft)
Deer Crk Basin Storage‐Discharge
Modified Storage‐Discharge Curve Original Storage‐Discharge Curve

July 2011 70
Contra Costa County, California Hydrologic Analyses
Figure A3‐7. Reservoir Deer Crk Basin Elevation‐Storage Curve
Table A3‐3. Reservoir Deer Crk Elevation‐Storage‐Discharge Data
Elevation (ft) Storage (ac‐ft) Discharge (cfs)
77 0 0
79 0 48.12
81 6.5 83.34
83 17.5 107.59
85 33.5 127.31
87 48.5 144.35
89 66 159.59
91 87 173.49 93 105.7 186.36
95 120.7 198.4 98 154.1 215.2
The last two data points were added to the paired data tables in the model.
020406080
100120140160180
70 75 80 85 90 95 100
Storage
(ac‐ft)
Elevation (ft)
Deer Crk Basin Elevation‐Storage
Modified Elevation‐Storage Curve Original Elevation‐Storage Curve

July 2011 71
Contra Costa County, California Hydrologic Analyses
Basin Name in Model: 30C Fairview Name from County information: None Source Information: County reports source as HYDRO2 Model of unknown date Notes: the information from the County was extended by using ArcGIS to create 0.5 foot contours from the DEMs. It appears the basin will not experience weir flow until the water reaches about 98.5so the elevation‐storage‐discharges curves were extended slightly up to 98.5 feet. At 99 the basin will start to experience weir flow with water overflowing to the east‐northeast toward the Union Pacific Railroad, see Figure A3‐8 below. The elevation‐storage relationship up to elevation 98.5 was maintained but at 99 the discharge would start to increase to account for the weir flow. At this point the discharge at 99 was calculated using the standard weir flow equation noted above assuming an effective weir length of 500 feet. Figures A3‐9 and A3‐10 below show the changes to the elevation‐storage and storage‐discharge curves. The values are listed in the table A3‐4.
Figure A3‐8. 30C‐Fairview Basin with contours and weir location
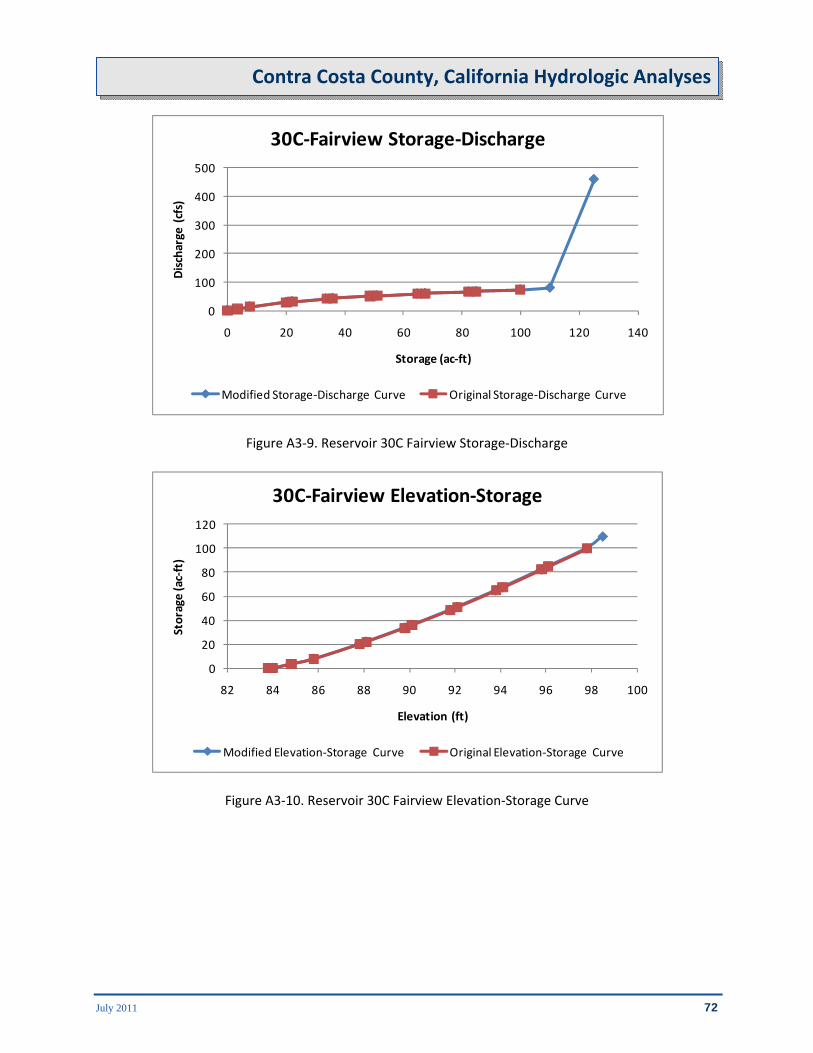
July 2011 72
Contra Costa County, California Hydrologic Analyses
Figure A3‐9. Reservoir 30C Fairview Storage‐Discharge
Figure A3‐10. Reservoir 30C Fairview Elevation‐Storage Curve
0
100
200
300
400
500
0 20 40 60 80 100 120 140
Discharge
(cfs)
Storage (ac‐ft)
30C‐Fairview Storage‐Discharge
Modified Storage‐Discharge Curve Original Storage‐Discharge Curve
0
20
40
60
80
100
120
82 84 86 88 90 92 94 96 98 100
Storage
(ac‐ft)
Elevation (ft)
30C‐Fairview Elevation‐Storage
Modified Elevation‐Storage Curve Original Elevation‐Storage Curve

July 2011 73
Contra Costa County, California Hydrologic Analyses
Table A3‐4. Reservoir 30C Fairview Elevation‐Storage‐Discharge Data
Elevation (ft) Storage (ac‐ft) Discharge (cfs)
83.8 0 0
84 0.001 1.2
84.8 3.42 6
85.8 7.7 13.91
87.8 20 29.73
88.1 22.06 32.1
89.8 33.7 41.96
90.1 35.94 43.7 91.8 48.6 51.44 92.1 51.03 52.8 93.8 64.8 59.43 94.1 67.43 60.6 95.8 82.3 66.47 96.1 84.9 67.67 97.8 99.9 73.67
98.5 110 79.67 99 125 460
The last two data points were added to the paired data tables in the model.

July 2011 74
Contra Costa County, California Hydrologic Analyses
Basin Name in Model: 30C Freedom (basin shapefile names this as 30C LibertyBas) Name from County information: None Source Information: County reports source as HYDRO2 Model of unknown date Notes: the information from the County was extended by using ArcGIS to create 0.5 foot contours from the DEMs. It appears the basin will not experience weir flow until the water reaches about 80.5 so the original elevation‐storage‐discharges curves were maintained up to 80 feet. At 80.5 it was assumed that the basin will start to experience weir flow with water overflowing to the east toward O’Hara Street , see Figure A3‐11 below. The elevation‐storage relationship up to elevation 80.5 was maintained but at 80.5 the discharge would start to increase to account for the weir flow. At this point the discharge at 80.5 was calculated using the standard weir flow equation noted above assuming an effective weir length of 150 feet. Figures A3‐9 and A3‐10 below show the changes to the elevation‐storage and storage‐discharge curves. The values are listed in the table A3‐5.
Figure A3‐11. 30CFreedom Basin with contours and weir location

July 2011 75
Contra Costa County, California Hydrologic Analyses
Figure A3‐12. Reservoir 30C Freedom Storage‐Discharge Curve
Figure A3‐13. Reservoir 30C Freedom Elevation‐Storage Curve
050
100150200250300350400450
0 10 20 30 40 50 60 70 80 90
Discharge
(cfs)
Storage (ac‐ft)
30C Freedom Storage‐Discharge
Modified Storage‐Discharge Curve Original Storage‐Discharge Curve
0
20
40
60
80
100
66 68 70 72 74 76 78 80 82
Storage
(ac‐ft)
Elevation (ft)
30C Freedom Elevation‐Storage
Modified Elevation‐Storage Curve Original Elevation‐Storage Curve
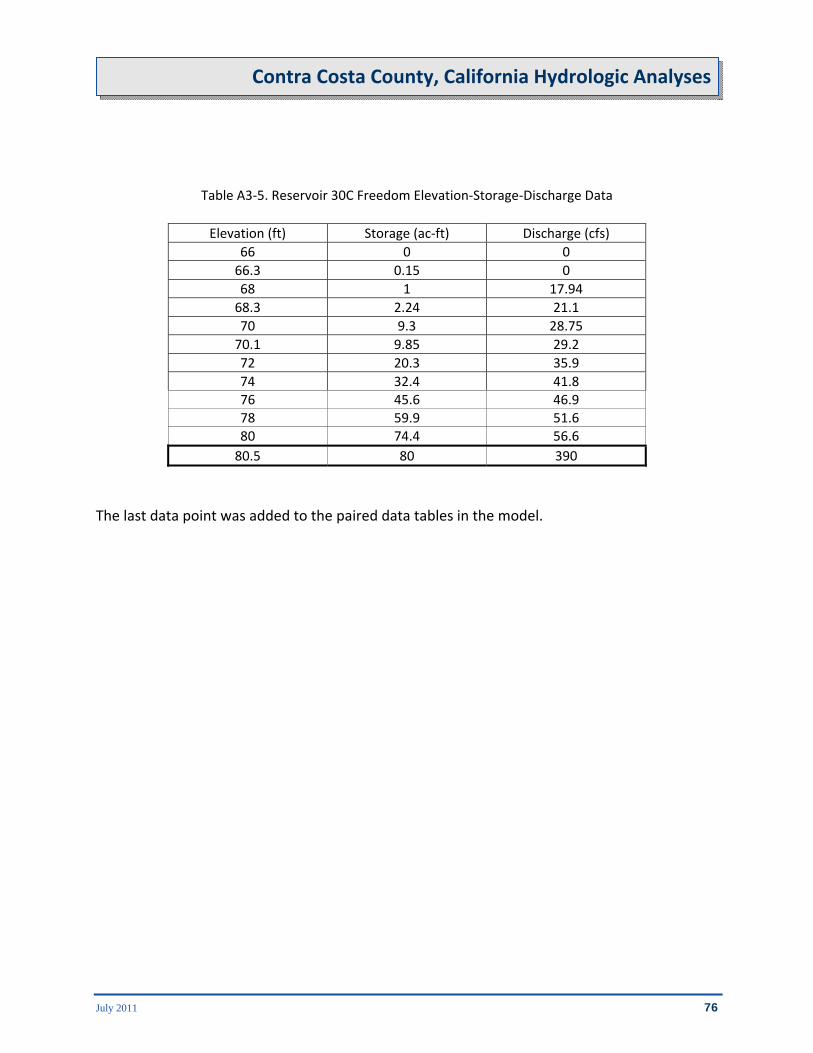
July 2011 76
Contra Costa County, California Hydrologic Analyses
Table A3‐5. Reservoir 30C Freedom Elevation‐Storage‐Discharge Data
Elevation (ft) Storage (ac‐ft) Discharge (cfs)
66 0 0
66.3 0.15 0
68 1 17.94
68.3 2.24 21.1
70 9.3 28.75
70.1 9.85 29.2
72 20.3 35.9
74 32.4 41.8 76 45.6 46.9 78 59.9 51.6 80 74.4 56.6
80.5 80 390
The last data point was added to the paired data tables in the model.

July 2011 77
Contra Costa County, California Hydrologic Analyses
Basin Name in Model: 30A Laurel Basin Name from County information: None Source Information: County reports source as HYDRO2 Model of unknown date Notes: the information from the County was extended by using ArcGIS to create 0.5 foot contours from the DEMs. Based on the topographic data it appears that the basin will be overflowing at 33 feet but due to the heavy vegetation to the northwest of the basin the LIDAR may be slightly off. It was assumed that the basin will not start overflowing until it reached 33.5 feet and then it will overflow to the northwest. Figure A3‐ 14 below shows the 33 contour location and the assumed direction of overflow. The elevation‐storage relationship up to elevation 33.5 was maintained but at 33.5 the discharge would start to increase to account for the weir flow. At this point the discharge at 33.5 was calculated using the standard weir flow equation noted above assuming an effective weir length of 235 feet, figure A3‐15 shows the location of the weir. Figures A3‐16 and A3‐17 below show the changes to the elevation‐storage and storage‐discharge curves. The values are listed in the table A3‐6.
Figure A3‐14. 30ALaurel Basin with contours and assumed direction of overflow

July 2011 78
Contra Costa County, California Hydrologic Analyses
Figure A3‐15. 30A Laurel Basin with contours and weir location
Figure A3‐16. Reservoir 30A Laurel Bas Storage‐Discharge Curve
0
50
100
150
200
250
0 20 40 60 80 100 120
Discharge
(cfs)
Storage (ac‐ft)
30A Laurel Storage‐Discharge
Modified Storage‐Discharge Curve Original Storage‐Discharge Curve

July 2011 79
Contra Costa County, California Hydrologic Analyses
Figure A3‐17. Reservoir 30A Laurel Bas Elevation‐Storage Curve
Table A3‐5. Reservoir 30A Laurel Bas Elevation‐Storage‐Discharge Data
Elevation (ft) Storage (ac‐ft) Discharge (cfs)
20 0 0
21 0.1 4.6
22 0.3 8.5
23 1.9 10.5
24 6.9 12.2
25 14.2 13.6
26 22.4 15.1
27 31 16.4 28 40.3 17.7 29 50.3 18.8 30 61 19.8 31 72.4 20.8
32 84.3 21.7
33 96.2 22.6
33.5 108.2 216
The last data point was added to the paired data tables in the model.
0
20
40
60
80
100
120
20 22 24 26 28 30 32 34 36
Storage
(ac‐ft)
Elevation (ft)
30A Laurel Elevation‐Storage
Modified Elevation‐Storage Curve Original Elevation‐Storage Curve
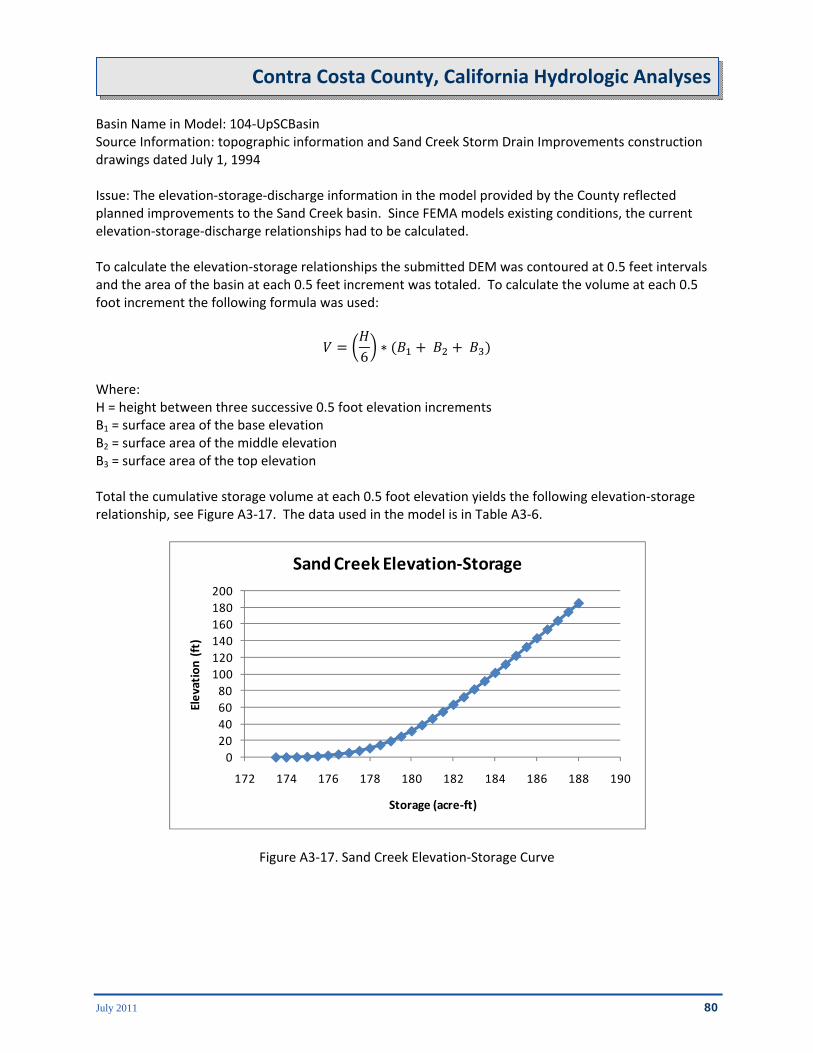
July 2011 80
Contra Costa County, California Hydrologic Analyses
Basin Name in Model: 104‐UpSCBasin Source Information: topographic information and Sand Creek Storm Drain Improvements construction drawings dated July 1, 1994 Issue: The elevation‐storage‐discharge information in the model provided by the County reflected planned improvements to the Sand Creek basin. Since FEMA models existing conditions, the current elevation‐storage‐discharge relationships had to be calculated. To calculate the elevation‐storage relationships the submitted DEM was contoured at 0.5 feet intervals and the area of the basin at each 0.5 feet increment was totaled. To calculate the volume at each 0.5 foot increment the following formula was used:
6
Where: H = height between three successive 0.5 foot elevation increments B1 = surface area of the base elevation B2 = surface area of the middle elevation B3 = surface area of the top elevation Total the cumulative storage volume at each 0.5 foot elevation yields the following elevation‐storage relationship, see Figure A3‐17. The data used in the model is in Table A3‐6.
Figure A3‐17. Sand Creek Elevation‐Storage Curve
0
20
40
60
80
100
120
140
160
180
200
172 174 176 178 180 182 184 186 188 190
Elevation (ft)
Storage (acre‐ft)
Sand Creek Elevation‐Storage

July 2011 81
Contra Costa County, California Hydrologic Analyses
Table A3‐5. Sand Creek Reservoir Elevation‐Storage Data
Elevation (ft) Storage (ac‐ft)
172.5 0.000 173.0 0.000 174.0 0.040 175.0 0.556 176.0 2.169 177.0 5.326 178.0 10.808 179.0 19.347 180.0 31.388 181.0 46.312 182.0 63.183 183.0 81.540 184.0 101.300 185.0 121.774 186.0 142.722 186.5 153.235 187.0 163.763 187.5 174.305 188.0 184.854
To calculate the discharge from the basin the outlet structures option was used. Contra Costa County provided a set of drawings titled “Sand Creek Storm Drain Improvements” dated July 1, 1994 that included information regarding the outlet from the basin. The major outlet is 42.4 feet of corrugated metal pipe that measures 54”. The following information was used for this outlet, entrance and exit coefficients and Manning’s n were obtained from the HEC‐RAS hydraulic reference manual. The scale was based on aerial photos and the construction drawings of the outlet.
Table A3‐6. Outlet Structure Information
Shape Circular
Chart 2: corrugated metal pipe
Scale 2: mitered to conform to slope
Length (ft) 42.4
Diameter (ft) 4.5
Inlet Elevation (ft) 172.5
Entrance Coefficient 0.7
Outlet Elevation (ft) 171
Exit Coefficient 1
Mannings n 0.024

July 2011 82
Contra Costa County, California Hydrologic Analyses
The construction drawings and photos also show two risers that act as emergency outlets but according to the drawings the elevation of the tops of the risers is 188, which is above the overtopping elevation for the basin so these risers were not included in the model. Based on the topographic data is appears that the basin will start to overtop to the east at an elevation just above 186 feet, flowing directly to Marsh Creek. To account for this the dam over tops function was also used. Figure A3‐18 shows the basin with contours and the assumed weir location and length.
Figure A3‐18. Sand Creek basin with contours and weir location
It was assumed that weir flow would begin at 186 feet and the length of the weir was estimated at 530 feet with a typical broad crested weir coefficient of 2.6.
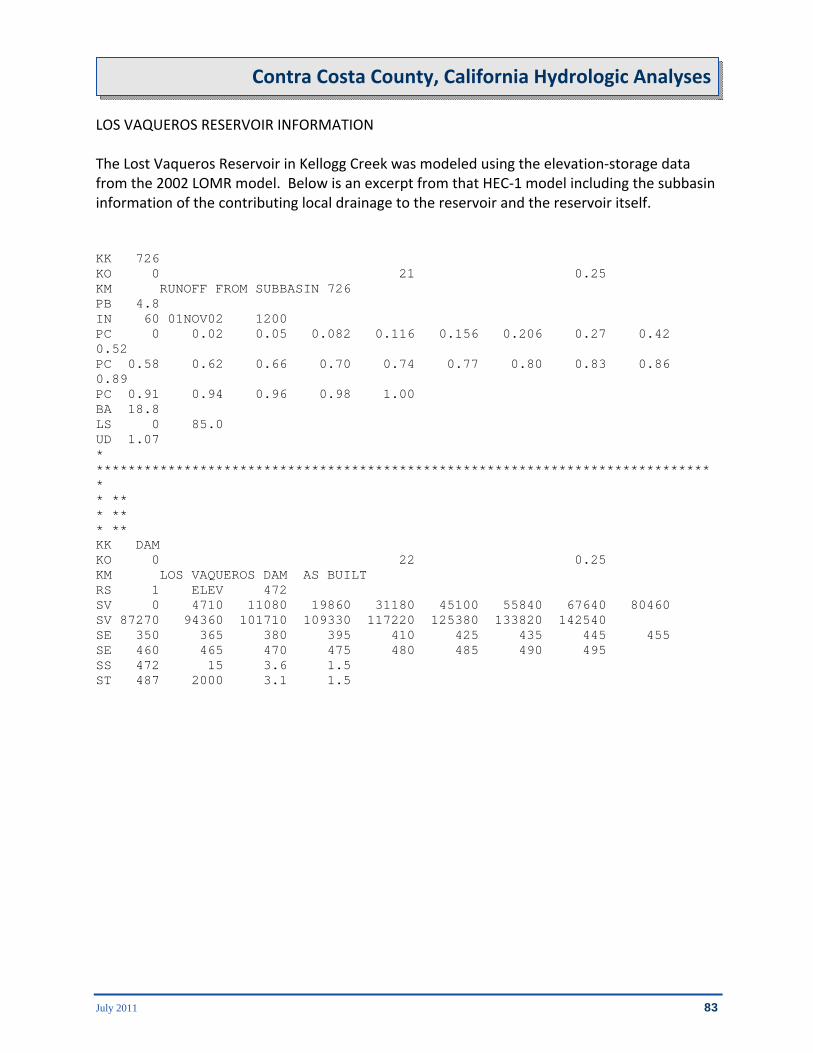
July 2011 83
Contra Costa County, California Hydrologic Analyses
LOS VAQUEROS RESERVOIR INFORMATION The Lost Vaqueros Reservoir in Kellogg Creek was modeled using the elevation‐storage data from the 2002 LOMR model. Below is an excerpt from that HEC‐1 model including the subbasin information of the contributing local drainage to the reservoir and the reservoir itself. KK 726 KO 0 21 0.25 KM RUNOFF FROM SUBBASIN 726 PB 4.8 IN 60 01NOV02 1200 PC 0 0.02 0.05 0.082 0.116 0.156 0.206 0.27 0.42 0.52 PC 0.58 0.62 0.66 0.70 0.74 0.77 0.80 0.83 0.86 0.89 PC 0.91 0.94 0.96 0.98 1.00 BA 18.8 LS 0 85.0 UD 1.07 * ****************************************************************************** * ** * ** * ** KK DAM KO 0 22 0.25 KM LOS VAQUEROS DAM AS BUILT RS 1 ELEV 472 SV 0 4710 11080 19860 31180 45100 55840 67640 80460 SV 87270 94360 101710 109330 117220 125380 133820 142540 SE 350 365 380 395 410 425 435 445 455 SE 460 465 470 475 480 485 490 495 SS 472 15 3.6 1.5 ST 487 2000 3.1 1.5
July 2011 84
Contra Costa County, California Hydrologic Analyses
Appendix A‐4
Reach Information

July 2011 85
Contra Costa County, California Hydrologic Analyses
Table A4-1. Brushy Creek Reach Information
Reach Length (ft) Slope (ft/ft) Manning’s n Shape Bottom Width (Ft)
Side Slope (xH:1V)
1 13,736 0.035 0.035 Trapezoid 15 2 2 6,544 0.015 0.035 Trapezoid 10 2 3 7,325 0.023 0.035 Trapezoid 15 2 4 2,852 0.023 0.035 Trapezoid 15 2 5 6,116 0.011 0.035 Trapezoid 10 2 6 14,651 0.004 0.035 Trapezoid 10 2 7 13,620 0.008 0.035 Trapezoid 10 2 8 15,513 0.0026 0.035 Trapezoid 10 2
Table A4-2. Frisk Creek Reach Information
Reach Length (ft) Slope (ft/ft) Manning’s n Shape Bottom
Width (Ft) Side Slope (xH:1V)
1 11,433 0.0054 0.035 Trapezoid 20 2 2 6,580 0.004 0.035 Trapezoid 20 2 3 14,788 0.0015 0.035 Trapezoid 20 2 4 6,979 0.0001 0.035 Trapezoid 20 2
Table A4-3. Kellogg Creek Reach Information
Reach Length (ft) Slope (ft/ft) Manning’s n Shape Bottom
Width (Ft) Side Slope (xH:1V)
1 11,433 0.0054 0.035 Trapezoid 20 2 2 6,580 0.004 0.035 Trapezoid 20 2 3 14,788 0.0015 0.035 Trapezoid 20 2 4 6,979 0.0001 0.035 Trapezoid 20 2 5 3408 0.0012 0.035 Trapezoid 25 2 6 18,881 0.0023 0.04 Trapezoid 20 2 7 9,201 0.0033 0.04 Trapezoid 15 2 8 4,451 0.0018 0.035 Trapezoid 15 2
Table A4-4. Mt. Diablo Creek Reach Information
Reach Length (ft) Slope (ft/ft) Manning’s n Shape Bottom
Width (Ft) Side Slope (xH:1V)
1 3,872 0.008 0.035 Trapezoid 25 2 2 3,073 0.006 0.035 Trapezoid 25 2 3 21,424 0.005 0.035 Trapezoid 25 2 4 12,064 0.004 0.035 Trapezoid 25 2 5 1,940 0.001 0.035 Trapezoid 25 1 6 2,840 0.001 0.035 Trapezoid 25 1

July 2011 86
Contra Costa County, California Hydrologic Analyses
TSDN CATEGORY DATA TYPE DATA SUBMITTED
Engineering Analyses (Hydrologic Analyses)
Hydrologic Analyses Index X
Summary Report of Hydrologic Analyses X Computer Models, Calculations and Execution
X
Summary Report for Independent QA/QC

July 2011 87
Contra Costa County, California Hydrologic Analyses
Appendix B‐2
Contact Report List

July 2011 88
Contra Costa County, California Hydrologic Analyses
CONTACT REPORT INDEX
Community Name and State:
Contra Costa County, California
Community ID No. 06013
Compiled By: Katherine Labuhn
Date TSDN Submitted:
Report Date Report Subject Firm/Agency
Contacted
December 21, 2010 Marsh Creek hydrology Contra Costa Flood Control District
April 18, 2011 Flows from Los Vaqueros and Mallard Reservoirs Contra Costa County Water Department

July 2011 89
Contra Costa County, California Hydrologic Analyses
Appendix B‐3
Hydrologic Analyses Index

July 2011 90
Contra Costa County, California Hydrologic Analyses
HYDROLOGIC ANALYSES INDEX Community Name:
Contra Costa County, California
Community ID No.
06013
Compiled By: BakerAECOM
Date TSDN Submitted:
Flooding Source/Stream
Name
Hydrologic Method/Model
Used Method/Model Analysis
Date
Exhibit No.
Paper Copy Electronic Media
Brushy Creek HEC-HMS May 6, 2011 X
Frisk Creek HEC-HMS May 6, 2011 X
Kellogg Creek HEC-HMS May 6, 2011 X
Marsh Creek HEC-HMS May 6, 2011 X
Mt. Diablo Creek
HEC-HMS May 6, 2011
X

July 2011 91
Contra Costa County, California Hydrologic Analyses
Appendix B‐4
Certification of Compliance

July 2011 92
Contra Costa County, California Hydrologic Analyses
CERTIFICATION OF COMPLIANCE
Project Name: Contra Costa County, California Hydrologic Analysis
Statement of Work No.: HSFEHQ-09-D-0368 Task Order HSFE09-09-J-0001
Interagency Agreement No.:
CTP Agreement No.:
Certification Date:
Tasks/Activities Covered by This Certification (Check All That Apply)
❏ Entire Project
❏ Topographic Data Development
❏ Hydrologic Analyses
❏ Hydraulic Analyses
❏ Coastal Flood Hazard Analyses
❏ Floodplain Mapping
This is to certify that the work summarized above was completed in accordance with the statement/agreement cited above and all amendments thereto, together with all such modifications, either written or oral, as the Regional Project Officer and/or Assistance Officer or their representative have directed, as such modifications affect the statement/agreement, and that all such work has been accomplished in accordance with the provisions contained in Guidelines and Specifications for Flood Hazard Mapping Partners cited in the contract document, and in accordance with sound and accepted engineering practices within the contract provisions for respective phases of the work.
Name: Katherine Labuhn, P.E.
Title: Civil Engineer I
Firm/Agency Represented: Michael Baker Jr., Inc.
Registration No.: Virginia P.E. 0402039567
Signature:
This form must be signed by a representative of the firm contracted to perform the work who is registered as a Professional Engineer or by the responsible official of a government agency.
X

July 2011 93
Contra Costa County, California Hydrologic Analyses
Appendix C‐1 Hydrologic Analyses QA/QC Reviews

July 2011 94
Contra Costa County, California Hydrologic Analyses
Appendix D Digital Data on the MIP
J:\ R09\CALIFORNIA\CONTRA COSTA COUNTY\09-09-3059S\Hydrology\1804003 and 18050001
Correspondence General Supplemental Information