regime shift in a large river fish community: body size structure and trophic change mark pyron...
TRANSCRIPT

Regime Shift in a Large River Fish Community: Body Size Structure and
Trophic Change
Mark PyronCenter of Aquatic Biology and FisheriesEnvironmental Science
Kyle Broadway, Brent MurryInstitute for Great Lakes Research, Central Michigan University

Wabash River• 2nd largest trib of Ohio River
• 85,000 km2 watershed
• 764 km long

Carroll
Tippecanoe
Warren
Fountain
Parke
Verm
illio
n
Vigo
Sullivan
Terre Haute
Clinton
10 km
Indiana
N
Collections
James Gammon 1974-98Mark Pyron 2000-8
28 sites
230 km

Jim Gammon began project 1974-98
•500-m sites
•Boat electrofishing

• Electrofish 500 m• Collect all fishes• Measure, release
Sampling Protocol:

Examine organisms by size
• Convert size-abundance matrix into size bins• Regress abundances against size bins

Examine organisms by size
• Convert size-abundance matrix into size bins• Regress abundances against size bins• Steeper with exploitation• Steep regression = inefficient ecological transfer

Wabash River size spectra analysis

-1 -0.5 0 0.5 1 1.5
-4
-2
0
2
4
6
8
1974-1978 SIZE STRUCTURE
MEAN LOG2TL
AB
UN
DA
NC
E

-1 -0.5 0 0.5 1 1.5
-5
-4
-3
-2
-1
0
1
2
3
4
5
1979-1982 SIZE STRUCTURE
MEAN LOG2TL
AB
UN
DA
NC
E

-1 -0.5 0 0.5 1 1.5
-6
-4
-2
0
2
4
6
1983-1988 SIZE STRUCTURE
MEAN LOG2TL
AB
UN
DA
NC
E

-1 -0.5 0 0.5 1 1.5
-6
-4
-2
0
2
4
61989-1993 Size Structure
Mean Log2TL
Ab
un
dan
ce

-1 -0.5 0 0.5 1 1.5
-4
-3
-2
-1
0
1
2
3
4
1994-1998 SIZE STRUCTURE
MEAN LOG2TL
AB
UN
DA
NC
E

-1 -0.5 0 0.5 1 1.5
-2
-1
0
1
2
3
4
5
6
2001-2008 SIZE STRUCTURE
MEAN LOG2TL
AB
UN
DA
NC
E

-4.5
-4
-3.5
-3
-2.5
-2
-1.5
-1
-0.5
0
1970 1975 1980 1985 1990 1995 2000 2005 2010
Size
-Spe
ctra
Slop
eSize spectra slope:
Proxy for ecological (transfer) efficiency
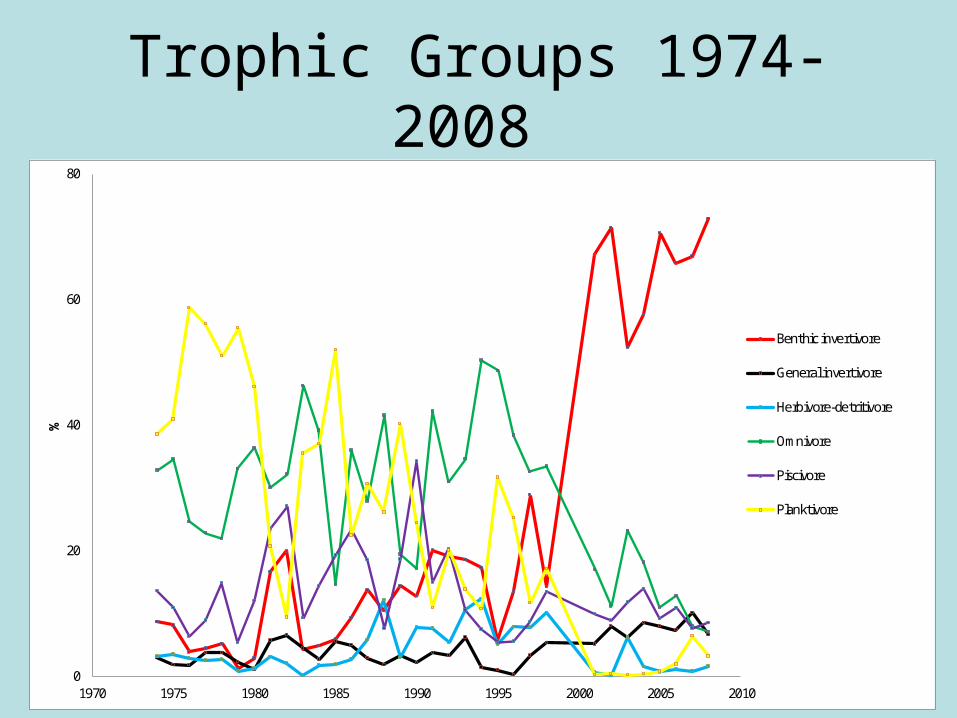
Trophic Groups 1974-2008
0
20
40
60
80
1970 1975 1980 1985 1990 1995 2000 2005 2010
%
Benthic invertivore
General invertivore
Herbivore-detritivore
Omnivore
Piscivore
Planktivore

Next
• Isotope analyses: 13C and 15N ratiosMuseum archives 1974-2008
Planktivore = gizzard shad
Omnivore = spotfin shiner
Piscivore = spotted bass

Summary
• Switch in functional group dominance• Omnivores + planktivores to benthivores• Large disturbance? Change in trophic base?

Funding:
Eli Lilly and Company
Duke Energy
Ball State University
Indiana Water Resources Research Center
Wabash River Enhancement Corporation
Collaborators:
Tom Lauer, BSU
Jim Gammon, Depauw U
Reuben Goforth, Purdue U
Many BSU students