regaining upward momentum - fancl ファン …renewed items such as fenatty and mild cleansing oil...
TRANSCRIPT

A N N U A L R E P O RT 2 0 0 5
R E G A I N I N G U P W A R D M O M E N T U M
AN
NU
AL R
EPOR
T 2005FA
NC
L Co
rpo
ration
fancl_05_cover_下 05.7.13 3:25 PM ページ2

CORPORATE PROFILE
FANCL as a Specialist in Both Inner and Outer “Beauty and Health”
Since our establishment in 1980, FANCL has continued to rewrite the industry’s “established practices”
with its basic management philosophy of “eliminating negative qualities like insecurity and inconvenience”
for consumers in their pursuit of beauty and health.
In our first attempt to remove the barrier of the industry’s established practices, we developed cosmetics
free of preservatives and other additives that women with sensitive skin can use without anxiety. The mar-
ket for “preservative-free cosmetics,” a first in the Japanese cosmetics industry, expanded rapidly as such
cosmetics helped to eliminate concerns for many consumers with skin problems. Following, in 1994, in
the sector of nutritional supplements, where essential but expensive daily products were the industry
norm, we created “high-quality and reasonably priced” nutritional supplements by establishing an integrat-
ed in-house system that covers all aspects of the business from raw materials procurement to manufactur-
ing and sales. As a new line of healthy food, we also developed “high nutritional value and easy-to-eat” ger-
minated brown rice and “easy-to-drink and reasonably priced” kale juice.
Setting out on our “second foundation,” we are proposing products from our unique perspective of fus-
ing cosmetics and nutritional supplements by advancing FANCL as a specialist in both inner and outer
“beauty and health.” We are addressing beauty and health from both inside and outside the body while
reinforcing our “product strategy based on added value.” This puts us before our competitors in terms of
“ingredients and materials” and “functionality,” in addition to “reliable, safe, gentle, and preservative-free”
brand assets.
CAUTIONARY NOTE REGARDING FORWARD-LOOKING STATEMENTSStatements made in this annual report with respect to FANCL’s current plans, strategies, estimates, and beliefs, as well as other statements that are not histori-
cal facts, are forward-looking statements about the future performance of FANCL. These statements are based on management’s beliefs in light of informationavailable to it at the time of the writing of this report. The actual performance of the Company could differ significantly from these forward-looking statementsas a result of unpredictable factors such as changes in customer preferences, social conditions, and economic conditions. Moreover, FANCL is under no obliga-tion to revise forward-looking statements, irrespective of new data, future events, or other developments. Readers should therefore not place undue reliance onthem.
CONTENTS
1 Snapshot
2 Financial Highlights
4 A Message from the President
9 Special Feature: Store Enhancement and Product Differentiation Strategies
13 Business Overview and Strategy / Management System
14 At a Glance
16 Business Overview and Strategy, by Segment
16 Cosmetics Business
18 Nutritional Supplements Business
20 Other Businesses
22 Business Overview and Strategy, by Sales Channel
Mail-Order Sales
Retail Store Sales
Wholesale Sales
25 Overseas Development
26 Intellectual Property Strategy
27 Corporate Social Responsibility
28 Corporate Governance, Compliance, and Investor Relations
30 Directors and Officers
31 Financial Section (including Business Risks)
54 Shareholder Information
55 Corporate Information
fancl_05_cover_下 05.7.13 3:25 PM ページ3

SNAPSHOT
SIGNS OF CHANGE SEEN TOWARD NEW GROWTH
1.Sales of Products with Original Ingredients and New Functions Rising Sharply
Sales were strongly driven by products with original ingredients and new functions developed in-house, including
renewed items such as FENATTY and MILD CLEANSING OIL in the cosmetics field and TWINTOSE, which drasti-
cally enhances the absorption of minerals, in the nutritional supplements field. Note: Please refer to Special Feature 2 (page 12).
2.Strengthened Retail Store Sales Channel Reaps Results
—Sales at existing stores increase 6.4% in rapid recovery
Retail store sales are expanding thanks to the proactive establishment of new stores
and renewal of existing stores. At the end of fiscal 2005, the number of retail stores
stood at 168, a net increase of 26 stores year-on-year. Our renewal of retail stores
with the main theme of “easy-to-look around, easy-to-buy, and easy-to-choose”
and our efforts to strengthen the human resources base, that is, build a mechanism
to raise skills and motivate our staff, along with the building of the new visual
identity, have produced positive results.
Note: Please refer to Special Feature 1 (pages 10-11) and Business Overview and Strategy, By Sales Channel(pages 22-24).
3.Recovery Trend in Number of Mail-Order Sales Customers
In the mail-order sales channel, the number of active
customers is once again on an upward trend, albeit moderate,
after bottoming out in October 2003 for cosmetics and
October 2004 for nutritional supplements. Contributing to
this has been aggressive spending on marketing and a growth
of mail-order sales over the Internet.
*For marketing purposes, we define “active customers” as customers who havemade at least one purchase during the preceding seven-month period.
Year-on-Year Sales Trends
0
20
40
60
80
100
120
140
4 5 6 7 8 9 10 11 122004 2005
1 2 30
60
40
20
80
100
120
140
160
180
4 5 6 7 8 9 10 11 122004 2005
1 2 3
FENATTY (%)Four TWINTOSE-incorporated mineral supplements (%)MILD CLEANSING OIL (%)
0
50
100
150
200
250
300
4 5 6 7 8 9 10 11 122004 2005
1 2 3
Renewal
Renewal
Renewal
Retail Store Sales Performance
0
5,000
10,000
15,000
20,000
25,000(Millions of yen) (%)
-8
-4
0
4
8
12
02 03 04 05
All-store salesYear-on-Year change on existing store basis
-6.3
17,073 17,744 17,722
20,067
1.8
-8.0
6.4
Number of Active Mail-Order Customers
400
550
500
450
600
650
700
750(1,000 Customers)
4 5 6 7 8 9 10 11 12 1 2 3 4 5 6 7 8 9 10 11 12 1 2 32003 20052004
CosmeticsNutritional supplements Bottom
1

2 ANNUAL REPORT 2005
FINANCIAL HIGHLIGHTSFANCL CORPORATION and Consolidated Subsidiaries
Thousands ofMillions of yen U.S. dollars
Years ended March 31 2005 2004 2003 2002 2001 2005
FOR THE YEAR:
Net sales ...................................................... ¥87,937 ¥84,957 ¥90,026 ¥84,657 ¥65,418 $818,857
Cosmetics ................................................ 37,098 34,926 37,155 36,748 35,669 345,451
Nutritional supplements ........................ 31,132 29,656 29,211 28,995 25,408 289,897
Others ...................................................... 19,707 20,375 23,660 18,914 4,341 183,509
Operating income (loss) ............................ 5,428 7,769 11,526 11,118 8,632 50,545
Cosmetics ................................................ 4,745 6,283 8,099 8,406 8,320 44,184
Nutritional supplements ........................ 4,638 5,371 6,879 5,960 4,694 43,189
Others ...................................................... (1,967) (1,821) (1,646) (1,681) (2,532) (18,316)
Net income ................................................ 1,710 3,387 6,429 5,995 4,867 15,923
Advertising expenses .................................. 11,105 9,865 9,262 10,213 8,896 103,416
Sales promotion expenses .......................... 9,475 7,998 8,615 8,161 5,810 88,234
Net cash provided by operating activities .... 4,638 5,861 9,828 7,426 6,083 43,188
Net cash used in investing activities .......... (4,807) (4,117) (5,582) (5,416) (4,838) (44,762)
Net cash used in financing activities .......... (1,090) (4,533) (5,432) (2,456) (1,410) (10,150)
AT YEAR-END:
Total assets ................................................ 79,416 78,479 79,804 79,026 75,481 739,510
Shareholders’ equity .................................. 66,203 65,613 66,350 64,719 59,482 616,473
Yen U.S. dollars
PER SHARE:
Net income ................................................ ¥80.3 ¥154.6 ¥279.5 ¥307.6 ¥249.8 $0.75
Shareholders’ equity .................................. 3,111.2 3,082.4 2,976.3 3,320.2 3,051.4 28.97
Cash dividends .......................................... 50.0 42.5 35.0 25.0 25.0 0.47
%
RATIOS:
Operating income margin .......................... 6.2 9.1 12.8 13.1 13.2
Advertising and sales promotion
expenses ratio .......................................... 23.4 21.0 19.9 21.7 22.5
ROE ............................................................ 2.6 5.1 9.8 9.7 8.5
Equity ratio.................................................. 83.4 83.6 83.1 81.9 78.8
Note: U.S. dollar amounts are the yen equivalent, calculated, for convenience only, at a rate of 107.39 = U.S.$1, the approximate Tokyo foreign exchange marketrate as of March 31, 2005.

3
Net Sales and Operating Income Margin
0
20,000
40,000
60,000
80,000
100,000
0
3
6
9
12
15(Millions of yen) (%)
01 02 03 04 05
Net sales
Operating income margin (%)
Cash Flows
-6,000
-4,000
-2,000
0
4,000
2,000
6,000
8,000
10,000(Millions of yen)
01 02 03 04 05
Net cash provided by operating activities Net cash used in investing activities Net cash used in financing activities
Advertising Expenses and Sales Promotion Expenses
0
4,000
2,000
6,000
8,000
10,000
12,000
(Millions of yen)
01 02 03 04 05
Advertising expenses
Sales promotion expenses
Advertising and sales promotion expenses ratio
Shareholders’ Equity and Equity Ratio
0
20,000
40,000
60,000
80,000
0
50
100(Millions of yen) (%)
01 02 03 04 05
Shareholders’ equity
Equity ratio
Net Income and ROE
0
2,000
4,000
6,000
8,000
0
4
2
6
8
10
12(Millions of yen) (%)
0
10
5
15
20
25
30(%)
01 02 03 04 05
Net income
ROE (%)
Net Income per Share
0
150
200
50
100
250
300
350(Yen)
01 02 03 04 05
Please refer to Six-Year Summary (page 32).

FISCAL 2005 CONSOLIDATED RESULTS
In fiscal 2005, the year ended March 31, 2005, despite a
stagnant trend in the cosmetics industry as a whole, some
areas recorded growth, notably skin care cosmetics such
as sun-block products and beauty lotions. At the same
time, the Nutritional Supplements Business expanded
thanks to the general strengthening of interest among the
public in health and health products, characterized by the
boom in popularity of co-enzyme Q10. Expansion was,
however, offset somewhat by intensified competition
brought about by new market entrants.
Amid these conditions, FANCL bolstered its activities
toward rebuilding brand vitality. For this, we invested in
product renewal, prioritized advertising and sales promo-
tion expenses, refurbished retail stores, and actively
increased our number of stores. These efforts have proved
effective, with sales growing in both the cosmetics and
nutritional supplements sectors, and consolidated sales
rising 3.5% to ¥87.9 billion compared with the previous
year. The Cosmetics Business, which marked a fall in
revenue in the previous year, bounced back thanks to a
renewal of the FENATTY series and MILD CLEANSING
OIL, almost recovering to levels of two years ago with a
year-on-year increase in sales of 6.2% to ¥37.1 billion.
Moreover, growth in the Nutritional Supplements Business,
including co-enzyme Q10 and TWINTOSE-incorporated
mineral supplements, accelerated to an increase of 5.0%
year-on-year to ¥31.1 billion.
Meanwhile, in terms of profitability, we were obliged
to sacrifice profitability temporarily, as we prioritized
forward-looking investment in rebuilding our brands and
customer base in fiscal 2005. Operating income declined
30.1% year-on-year to ¥5.4 billion, due to such factors as
temporary increases in marketing expenses, which
amounted to a rise of ¥2.7 billion for advertising and sales
promotion. In addition, net income for the period was
down 49.5% from a year before to ¥1.7 billion, incorpo-
rating the loss arising from a cancellation of leases due to
the introduction of a new method to manufacture germi-
nated brown rice. Net income per share dropped by ¥74.3
from the previous year to ¥80.3.
We now have within sight the goal of a top-line
recovery for our core businesses. From fiscal 2006, we are
sure that we will be able to achieve a convincing about-
turn in our bottom-line products while maintaining and
strengthening top-line growth momentum by shifting our
emphasis to pinpoint marketing. We, therefore, have
decided to implement annual dividends of ¥50 per share
in this period, an increase of ¥7.5 per share.
EFFORTS RELATING TO THE THREE-YEARMEDIUM-TERM MANAGEMENT PLAN (FANCL CHANGE & CHALLENGE PLAN)
Increasingly intense market competition has brought us to
a point where our previously successful campaigns to
promote our preservative-free cosmetics and reasonably
Factors Affecting Operating IncomePositive FactorsImproved margins for nutritional supplements +0.6Improved income from FANCL Square ............ +0.2Negative FactorsHigher advertising expenses ............................. -1.2Higher sales promotion expenses ..................... -1.5Increased store-related expenses....................... -0.4
Balance .............................................................. -2.3
Factors for Sales Growth and Decline Positive FactorsFANCL cosmetics ............................................. +1.4ATTENIR cosmetics.......................................... +0.9Nutritional supplements ................................... +1.5Kale juice........................................................... +0.5Sundries, undergarments, and others ............... +0.1Negative FactorsGerminated brown rice ..................................... -0.3IIMONO OHKOKU........................................... -1.1
Balance .............................................................. +3.0
4 ANNUAL REPORT 2005
A MESSAGE FROM THE PRESIDENT
TO OUR SHAREHOLDERS AND ALL OUR STAKEHOLDERS
Over the previous year, we have focused our efforts on achieving a renaissance for the FANCL brand. We have
been rewarded with results including a revival in cosmetics sales and further growth achieved in nutritional
supplements. Boosted by our achievements and determined to see that they continue to grow, we will persist
in the current fiscal year to introduce new and unique products that proudly bear the FANCL brand name.
FY2005 Earnings (Billions of yen)

priced nutritional supplements are no longer sufficient to
guarantee success in a highly competitive market. We
must now make further efforts to achieve market recog-
nition of the unique added value provided by FANCL
products, including functionality. We now have an
opportunity to provide new value in FANCL products
and raise the curtain on the Company's “second founda-
tion.” As a first step along this path, in fiscal 2005 we
launched a three-year management plan known as the
FANCL Change & Challenge Plan (CC Plan). FANCL is
making the best of this new start, positioning fiscal 2005
as a year for “change and structure,” followed by “struc-
ture and progress” in fiscal 2006, and “progress” in fiscal
2007.
1. Even with a Downward Revision to Final Targets under the CC Plan, Earnings Targets in Our Core Businesses Remain Unchanged
Fiscal 2005 was the launch year of the CC Plan, during
which we targeted change and structure as a means of
achieving a renaissance in the FANCL brand. In the
Cosmetics Business, which had marked a fall in revenue in
the previous fiscal year, post-renewal sales of our MILD
CLEANSING OIL with its outstanding functionality
surged to twice their previous level, and were the driving
force behind our sales turnaround. Our core brand
FENATTY series also contributed to enhanced sales after
its renewal, in which we further enhanced its unique func-
tionality. Moreover, in the nutritional supplements sector,
sales of products with TWINTOSE-incorporated mineral
supplements achieved approximately 20% growth in
comparison to sales prior to the addition of this new ingre-
dient. These facts have provided us with definite and clear
feedback that our differentiation strategy is capable of real-
izing a renaissance of the FANCL brand and that there is
still plenty of growth potential.
As the figures clearly show, while our core businesses
of cosmetics and nutritional supplements are on track as
originally planned, our other businesses, especially
IIMONO OHKOKU (Kingdom of Wonderful Things)
mail-order sales and germinated brown rice are still facing
difficulties. We set an overall sales target for the initial
year of the CC Plan in fiscal 2005 of ¥93 billion. However,
impacted by the sluggish sales performance of IIMONO
OHKOKU and germinated brown rice, actual sales reached
a level ¥5 billion lower than the figure set out in the initial
plan. Faced with these results, we have conducted a revi-
sion of the fiscal 2007 final targets, focusing on the
“others” sector of our businesses, revising sales downward
from ¥120 billion to ¥105 billion, and operating income
down from ¥16 billion to ¥12 billion. I would like to
stress, however, that the profit targets for our core sectors
of cosmetics and nutritional supplements remain
unchanged.
I am sure that a downward revision in the CC Plan
after the first year of its launch must be a cause of great
concern to all our shareholders. However, I would like to
assure you that we are achieving definite results in our
change and structure phase, which is dedicated to
restoring FANCL to a healthy growth track. Using these
results as a new springboard, we will aim to achieve a
turnaround in sales and operating income, working
toward the objective of achieving historic bests in both
sales and profitability in fiscal 2007.
2. Revitalizing Our Other Businesses
The Germinated Brown Rice Business was positioned as a
growth business in the CC Plan. However, its underper-
formance, coupled with lackluster figures for our
IIMONO OHKOKU Mail-Order Business, has made the
Kenji Fujiwara President and Representative Director
FANCL Corporation 5

6 ANNUAL REPORT 2005
revision of the original CC Plan inevitable. By revising the
income structure in our Other Businesses sector, we
expect to swiftly eliminate deficits and turn them into
profitable businesses.
In the Kale Juice Business, sales of the frozen type
which had been suspended due to a lack of raw materials
brought about by inclement weather were restarted in May
2004. In July, we launched sales of the powder type
containing TWINTOSE with mineral absorption properties.
The highly profitable powder type has performed strongly
since its launch and in the second half of fiscal 2005 its sales
reached a breakeven point. In fiscal 2006 we expect this
business to become profitable with the frozen type making a
comeback as a product containing TWINTOSE .
Meanwhile, with the Germinated Brown Rice Busi-
ness, we will be implementing a comprehensive cost
structure revision. We will be converting to a strategy that
seeks to ensure stability in sales, working to expand clients
who place standing orders, for example, from a strategy of
expanding our client base by actively investing in
marketing expenses. We will make further active efforts in
the development of processed foods.
Moreover, in the IIMONO OHKOKU Mail-Order
Business, by implementing significant cost reductions we
achieved a profit in the second half of fiscal 2005. Moving
forward, as we pursue enhanced efficiency within the
group as a whole. The IIMONO OHKOKU Business will
take over purchasing and quality control operations of the
sundry division of FANCL. In this way, we will continue
to seek cost reductions. We will also seek to build a stable
profit structure by developing products that are likely to
encourage customers to make repeat purchases.
MAJOR STRATEGIES FOR FISCAL 2006
1. Product Strategy—Further enhancing our strong points
(1) Cosmetics Business
In the Cosmetics Business, we will create peerless brand
strength in our preservative-free skin care products, one
of the strengths of FANCL cosmetics. To this end, at the
same time as we continue to expand the market for MILD
CLEANSING OIL and FENATTY, during the first half of
this fiscal year we are planning to engage in a renewal of
our facial washing powder products, adding further
unique functionality. The facial washing powder market
Mid-Term Management Plan FY2007—Revision of Final Targets (Billions of yen)
FY2005 FY2007
Initial Results Difference Initial Revised Differenceplan Plan plan
Sales .................................... ¥93.0 ¥87.9 ¥(5.1) ¥120.0 ¥105.0 ¥(15.0)Cosmetics ............................. 36.3 37.1 0.8 48.6 46.2 (2.4)Nutritional supplements ...... 31.5 31.1 (0.4) 36.1 37.5 1.4 Others................................... 25.2 19.7 (5.5) 35.3 21.3 (14.0)
Germinated brown rice... 7.2 5.0 (2.2) 13.0 5.5 (7.5)Kale juice ........................ 4.1 3.5 (0.6) 7.0 4.5 (2.5)IIMONO OHKOKU ........ 10.0 7.2 (2.8) 11.6 7.6 (4.0)Others ............................. 3.9 4.0 0.1 3.7 3.7 0.0
Operating income................ 5.2 5.4 0.2 16.0 12.0 (4.0)Cosmetics ............................. 4.8 4.7 (0.1) 8.6 8.6 0.0Nutritional supplements ...... 3.7 4.6 0.9 5.2 5.2 0.0Others................................... (1.4) (2.0) (0.6) 4.0 0.0 (4.0)
Operating income ratio ....... 5.6% 6.2% 0.6 pt 13.3% 11.4% (1.9) ptInitial plan: Announced Nov. 2003. Revised plan: Announced Apr. 2005.
Mid-Term Management Plan FY2007 (Revised)
0
40
60
80
100
120
0
5
20
10
15(Billions of yen) (%)
03 04 05 06Plan
07Plan
Sales Operating income Operating income ratio
9085 88
93
105
11.4
8.6
6.2
9.1
12.8
118 5 8
12

7
FANCL seeks to target is rapidly expanding, given the
appeal of its hydrating properties and the appearance of
foaming types (amounting to an estimated market value
of ¥32.3 billion in 2003). With the renewed products, we
aim to capture a prominent share of this market. In addi-
tion, as the centerpiece of the second half of the fiscal
year, we plan to introduce anti-aging products, given an
upswing in needs in this area of business due to the aging
population. Not forgetting the ATTENIR range, which
continues to outperform sales figures each year thanks to
its sales points of “high quality, high functionality at a
reasonable price,” our objective is to achieve further
growth by introducing aging-prevention care products,
targeting women in their 30s and above.
(2) Nutritional Supplements Business
In the Nutritional Supplements Business, we will first
further enhance our differentiation strategy, using TWIN-
TOSE as a potent weapon. TWINTOSE is a type of
oligosaccharide that drastically improves mineral absorp-
tion. As such, we expect that demand will expand for
TWINTOSE to be incorporated into various food prod-
ucts. In addition to our present lineup of supplements
that incorporate TWINTOSE, we will work to activate
sales of TWINTOSE in a powder form. Using the appeal
of TWINTOSE’s particularly strong property to improve
calcium absorption, we expect to develop needs for this to
be mixed with milk or yogurt.
Secondly, we are going to pursue synergy effects in
terms of our “inner and outer beauty” strategy, in cooper-
ation with our Cosmetics Business operations. To this
end, we will be paring down from the current ten to six
items our range of beauty supplements that support beau-
tiful skin and anti-aging from within based on the
concept of “inner and outer beauty.” We are also aiming
to expand our product range incorporating our propri-
etary ingredient “HTC Collagen.”
2. Marketing Strategy—Effective promotion through a pinpoint approach
In fiscal 2006, as we return to a standard momentum in
terms of advertising and sales promotion expenses, we aim
to promote pinpoint marketing to utilize promotion costs
optimally. In these efforts, it will be important to establish
just what products we should make efforts to promote, as
well as the targets and elements we can use to differentiate
our products. Before investing in high-cost television
commercials, we will clarify our product strategy, accu-
rately analyze current customer needs and provide
accurate and timely information to customers through
direct mailing campaigns, renovate our stores to provide
an “easy to see, easy to buy, easy to choose” environment,
and improve store staff's customer care skills. We are sure
that by shifting sales promotion activities from a quantita-
tive to a qualitative approach, we will be in a ripe position
to control costs and see further sales growth.
However, with regard to popular products that have
been or will be renewed, including MILD CLEANSING
OIL and facial washing powder, by continuing to promote
these actively we aim to expand our client base. To
achieve this, we would like to see our number of active
customers increase (those who have made a purchase
within the previous seven months), particularly those in
the currently troubled mail-order channel, excluding
Internet sales.
At the same time, as a means of making our pinpoint
marketing highly effective it will be necessary to enhance
our customer information gathering and analysis and to
improve precision in strategy formulation. To this end,
we newly established a Marketing Headquarters in
November 2004. The Marketing Headquarters consists of
a Marketing Division, which is responsible for the gath-
ering and analysis of customer information, and an
Advertising Division, which formulates advertising strate-
gies and area vitalization strategies based on information
from the Marketing Division. Through this new organiza-
tion, we aim to enable seamless and more precise
marketing activities—our pinpoint strategy.
Trends in Advertising and Sales Promotion Expenses as a Proportion of Sales
0
5
10
15
20
2522.5 21.7
19.921.0 23.4 20.5
13.612.1
10.311.6 12.6
10.4
8.9 9.6 9.6 9.410.8 10.1
(%)
01 02 03 04 05 06Plan
Advertising and sales promotion expenses ratio Advertising expenses ratio Sales promotion expenses ratio

8 ANNUAL REPORT 2005
3. Retail Store Strategy—Active increase of store numbers and reinvigoration of existing stores
In fiscal 2005, combined retail store sales from new and
existing stores marked a year-on-year increase of 13.2%
(fiscal 2004 sales were down 0.1% compared with fiscal
2003). Breaking this figure down further shows that sales
at existing retail stores were up 6.4% on the year (fiscal
2004 sales were down 8.0% compared with fiscal 2003).
We are demonstrating a rapid recovery in an intensely
competitive environment.
Bringing our key FANCL concept of “caring for beauty
and health both on the inside and the outside” to greater
prominence, we are accelerating our store expansion,
focusing on the FANCL House model and FANCL House J
model, which is a store concept to attract all customers,
regardless of gender or age. We are also advancing refur-
bishments to our existing stores with the aim of creating a
new visual identity, an environment that provides an
optimum purchasing setting for customers and an ideal
working environment for staff. In order to dynamically
promote improvements in staff skills and motivation, we
have implemented a series of measures. These are: (1)
revising of wage system and training system; (2) enhancing
counseling skills through the cultivation of inner and outer
beauty advisors (providing in-house certification to staff);
and (3) strengthening the store guidance system through a
new structure including supervisors. We regard the strong
sales results of our stores as an indication that these meas-
ures are working well.
Given the excellent performance of our retail stores,
we are aiming to quickly move to establish a 300 retail
store chain, which was laid out in the sales channel
strategy of the CC Plan, with 61 new stores planned for
fiscal 2006. By the end of this fiscal year we aim to have a
229-store chain.
CORPORATE GOVERNANCE
It is vital that we are a company trusted by all our stake-
holders, including our shareholders. To maintain the trust
of our stakeholders, we have created a through-going
structure of corporate governance. This has been achieved
by: (1) dividing supervisory and operating functions
through a managing officer system; (2) improving trans-
parency and improving oversight functions through an
outside director system; (3) strengthening legal compli-
ance by moving the Compliance Office to inside the
Administrative Headquarters; and (4) strengthening
systems for the protection and management of the
personal information of our customers. Furthermore, from
June 2005, the term of office for a company director will
be shorted from two years to one year. This will enable us
to further clarify the management responsibility of direc-
tors and to create an appropriate management structure
that responds to changes in management needs in a quick
and flexible manner.
With the changes scheduled to take effect in June
2005, the founder of FANCL and one of our major share-
holders, Mr. Kenji Ikemori, will leave his position as
director. He will continue to serve at the company in the
capacity as Founder, and we look forward to continuing
to benefit from his advice on management aspects as a
representative of our shareholders.
TOWARD THE EXPANSION OF CORPORATE VALUE
By reinvigorating the highly profitable Cosmetics and
Nutritional Supplements Businesses, we are aiming to
achieve operating income of ¥12 billion in fiscal 2007,
which would set a new record for FANCL and be a way of
expressing our gratitude to our shareholders. This is not
our ultimate goal, however. In order to maintain long-
term growth, we must acquire the ability to be able to
continuously create peerless products that will be chosen
by our customers—“one of a kind” products. With a new
and enhanced lineup, we will strive to step up our
marketing power and product development prowess and
move proactively forward to respond accurately to
changing needs in a health-conscious and aging society.
We are dedicated to strengthening FANCL’s presence as a
specialist in inner and outer “beauty and health.”
I ask for your continued support and understanding
in our ongoing efforts as we move forward.
Kenji Fujiwara, President and Representative Director
July 2005

SPECIAL FEATURE
STORE ENHANCEMENT AND PRODUCT DIFFERENTIATION STRATEGIES
—Drivers for Restoring FANCL’s High-Growth Momentum
9

10 ANNUAL REPORT 2005
SPECIAL FEATURE 1: Reforming the Retai l Store Channel
In fiscal 2005, we strengthened our retail store network, positioning it more strategically as an important
sales channel. This has involved efforts to broadly strengthen both the operational aspects of our business
as well as the expansion of our network and refurbishment of existing stores. The fruits of our efforts are
already translating into increased sales.
FIRST EXPANSION PHASE: From Showrooms to Secondary Sales Channels
Trends in Retail Store Sales
0
5,000
10,000
15,000
20,000
25,000(Millions of yen) (%)
-8
-4
0
4
8
12
02
-6.3
1.8
-8.0
6.4
03 04 05
All-store salesYoY change on anexisting-store basis
Growth +3.9%
Growth -0.1%
Growth +13.2%
Trends and Projections in Retail Store Expansion
0
100
200
300(Number of stores)
99 00 01 02 03 04 05 06(Plan)
07(Plan)
Relaunch of network expansion
Freezing of retail store network expansion
FANCL began operations as a mail-order retailer, initiallypositioning retail stores as our showrooms or supplemen-tary outlets to our mail-order sales channel. Over time,retail stores have increased in importance to become asignificant second sales channel.
Our retail stores trace their history to 1995. Thepopularity of our preservative-free cosmetics createddemand from department stores to open retail outlets. Inresponse, we opened the first FANCL HOUSE as a pilot
store in Shizuoka City. Our first store proved to be a greatsuccess. Even more importantly, the store was a valuablesource of information for identifying customer needs,given the fact that customers were able to see and try theproducts for themselves, something that is not possiblethrough mail-order sales. This led to our realization thatretail stores were a highly promising sales channel. Withthis encouraging start, we expanded our store network,which by August 2000 totaled more than 100 stores.
GROWTH PLATEAU: Freezing of Retail Store Network Expansion Strategy from Fiscal 2002 to Fiscal 2004
Once our retail store network reached the 100-outletlevel, expansionary moves that had been progressingrobustly began to stall, while existing store sales alsobegan to gradually plateau. As a result, fiscal 2002 becamea period of stagnation for us. We, therefore, made thedecision to freeze our expansion strategy from fiscal 2002and shift our priority to reinvigorating existing stores. Italso became apparent that one reason for our lack of sales
vigor in existing stores was that our expansionary moveshad continued without a clear chain store operationstructure in place. Moreover, given that personnel andtraining systems were not sufficiently developed,personnel turnover at retail stores was high, and thisincreasing personnel turnover rate led to a drop in servicequality, which prompted customers to shop elsewhere.
SECOND EXPANSION PHASE:Relaunch Retail Store Network Expansion, Aiming for 300 Stores Nationwide Starting in Fiscal 2005During fiscal 2005, we recruited personnel with retailexperience from outside the Company. Through theestablishment of a chain store operation and bybolstering our personnel base in this way, we were ableto relaunch simultaneously our retail store networkexpansion strategy.
Although our basic sales style remains unchanged inthat we offer advice to our customers only when they askfor it, what we have changed is a structure through whichwe are able to promote more actively our new products
and unique brand appeal. Moreover, strengthenedcommunication between headquarters and retail storeshas enabled us to initiate promotional activities at storesin synchronization with advertising campaigns run byheadquarters. These efforts resulted in fiscal 2005 netsales at existing stores increasing 6.4% from the previousyear. The results, coupled with the effect of opening newstores, have been the driving force behind FANCL’s salesfigures recovery.

SPECIFIC MEASURES FOR FISCAL 2005(1) Enhancing Systems and Structures—Nurturing retail store staff adept at providing counseling in response to
customer requests
Tokai/Hokuriku/Shinetsu: 19 stores
Kinki: 35 stores
Kyushu/Okinawa: 11 stores
Chugoku/Shikoku: 12 stores
Kanto: 81 stores
Tohoku: 5 stores
Hokkaido: 5 stores
11
Enhancing Counseling Capabilities•Introduction of a new training system based on an
analysis of retail store staff sales skills•Establishment of a FANCL ACADEMY in combination
with in-store training as measures to strengthen theeducation system
•Strengthen training of inner and outer “beauty andhealth” advisers* (store staff possessing qualifications:87 persons)
* This is an in-house qualification accredited by FANCL to staff who haveacquired knowledge about nutrition, dermatology, the FANCL concepts ofbeauty, and have the capability to provide counseling services for bothnutritional supplements and cosmetics.
Improving Motivation•Reforms to move from a seniority-based wage system to
a system based on roles and responsibilities •Creation of a registration system for contract employees
to become full-time employees•Creation of a reemployment system for those returning
after maternity or childcare leave
Developing a Chain Store Management Structure •Systemization of the store supervisor (SV) system (from
July 2004) •Introduction of area-based retailing advisors (from
November 2004)
(2) Enhancing Hardware—Stores gather customers and convey FANCL’s brand
In May 2004, the construction of a new visual identity wascompleted, and in fiscal 2005, we implemented the refurbish-ment of a total of 54 retail stores. We have moved away from abusiness model in which our retail stores were centered oncosmetics to a new style of “stores that provide beauty andvitality” based on our unique concept of inner and outer “beautyand health.”
Additionally, we launched FANCL House J as a new storemodel in May 2004. In comparison to the FANCL Houseconcept, which is aimed at women in their 20s and 30s, theFANCL House J stores are designed to attract a wider age-range and also appeal to male customers.
(3) Area Strategy
Under the Medium-Term Management Plan (FANCLChange & Challenge Plan) we are scheduled to completedevelopment of a 300-store network by the end of fiscal2007. Our stores are generally 40 to 50m2 in area and weplan for them to be located generally in department stores,shopping centers, and railroad station buildings. There areapproximately 900 potential locations for stores, and fromthese we intend to choose 130 locations, actively estab-lishing new stores over the coming two-year period.
Our policy is to focus our expansion strategy onprefectures where we currently have no representation(there were seven such prefectures as of the end ofMarch 2005), as well as metropolitan and city areas.
Age Composition by Store Type
0
10
5
15
20
25
30(%)
1-19 20-24 25-29 30-34 35-39 40-44 45-49 50-54 55-59 60-64 65-69 70
FANCL HOUSEFANCL HOUSE J
Retail Store Network (Please also see page 23 for “Retail storeExpansion”)

12 ANNUAL REPORT 2005
SPECIAL FEATURE 2: Achieving a Renaissance in Product Brand Powerthrough New and Unique Funct ional i ty and Ingredients
Key to the FANCL Brand Renaissance is two concepts: our overarching preservative-free concept, as well as
the pursuit of new and unique functionality and ingredients. In fiscal 2005, under this new differentiation
strategy, our sales revival was led by the renewed MILD CLEANSING OIL and FENATTY in the cosmetics
sector and TWINTOSE, a unique ingredient that drastically improves mineral absorption capabilities, in
the nutritional supplements sector.
MILD CLEANSING OIL—Introduction of nano-cleansing system
MILD CLEANSING OIL is FANCL’s largest single product,with sales doubling after its branding renewal in August2004.
The nano-cleansing system (patent applied) that weintroduced with the renewal of the MILD CLEANSINGOIL is characterized by its ability to quickly and completelycleanse skin. This is achieved through a natural oil thatcomprises a unique blend of ingredients that lift off make-up and dirt instantly, deconstructing components to anano-size. Other cleansing oils on the market that “can beused with wet hands” generally are water-based to enablethem to blend easily with water. However, given this water-based composition, it is difficult for such oils to blend withmake-up. FANCL’s unique design ensures that water parti-cles mix with oil at the nano-level, ensuring that it is
possible even with wet hands to enjoy a high degree ofcleansing. Our efforts have born fruit in a ground-breakingproduct that naturally gives the user a feeling of havingused extremely pure, natural plant extract oils and alsoprovides a high degree of functionality, so that it can beused easily even in a home bathroom.
Nano-Cleansing System
Cleansing oil
Make-up
Skin Skin Skin
Make-up floats in cleansing oil film
Oil and make-up (nano to micro-size)
Wash away Water
TWINTOSE—Booster of mineral absorption properties
Given ever-worsening chronic mineral deficiencies,including calcium, iron, magnesium, and zinc, FANCLdecided to focus its efforts on TWINTOSE* as an ingredientcapable of boosting mineral absorption properties. Receivinga research subsidy grant from the government in November2001, a joint industry-academia-government research projectwas launched in cooperation with Hokkaido University andNippon Beet Sugar Manufacturing Co., Ltd. The fruits of thisjoint research were not only an increase in mineral absorp-tion properties, but also the revealing of functions thatenable drastically improved body retention rates forminerals. Having established the world’s first technology forits mass-production, we moved in fiscal 2005 to create acommercial product and bring it to the market.
TWINTOSE is a new ingredient that combines theexcellent qualities of freshness and sweetness of flavorwith highly promising processing characteristics such thatwe have positioned it with confidence as a blockbusterproduct that has many uses in compounds with food prod-ucts and not just as a supplement. Given TWINTOSE’sexcellent absorption properties and body retentionpromoting effects for calcium, we expect needs to beparticularly large in milk and yogurt-based products.
We are also progressing with the discovery of newproperties. TWINTOSE is a low calorie compound, and is,therefore, capable of controlling sudden upswings in bloodsugar levels and not adversely affecting them. This propertyis particularly useful for people who have dietary restric-tions due to diabetes or people who are dieting. Given itsstable construction, it is also heat resistant and could beeasily used in hot foods such as stews. TWINTOSE reallyis a new compound with limitless potential.
*What is TWINTOSE? TWINTOSE is a refined ingredient created from water-soluble enzyme-processedplant fiber extracted from chicory. Given its characteristics as an oligosaccharidederived from natural vegetables, it has a high degree of safety for consumption;however, the biggest issue to overcome was how to extract sufficient quantities ofthe fiber. FANCL was successful in developing the world’s first technology for itsmass-production. This technology has enabled us to create TWINTOSE, whichwhen combined with calcium in particular, has been proven to increase absorptionrates by as much as 1.4 times, and body retention rates by six times.
Improvements in Calcium Absorption Rates Achieved in Humans
0
20
10
30
40Calcium absorption rate (%)
Absorption rate increased 1.4 times!
Calcium
TWINTOSE+
calciumChicory

13
BUSINESS OVERVIEW AND STRATEGY / MANAGEMENT SYSTEM
BUSINESS OVERVIEW AND STRATEGY
FANCL’s businesses include its Cosmetics Business, the Nutritional Supplements Business, as well as Other
Businesses (germinated brown rice, kale juice, IIMONO OHKOKU mail-order, and others). In Japan, we
have three sales channels: mail-order, retail store, and wholesale sales. We also sell cosmetics and
nutritional supplements overseas, centering on Asia.
CONTENTS
14 At a Glance
16 Business Overview and Strategy, by Segment
16 Cosmetics Business
18 Nutritional Supplements Business
20 Other Businesses
22 Business Overview and Strategy, by Sales Channel
25 Overseas Development
MANAGEMENT SYSTEM
FANCL, in a bid to be a corporation that shareholders and all other stakeholders can trust, is making
efforts to improve corporate governance and compliance, as well as the fair and prompt disclosure of
information. While contributing to society through business activities that focus on “beauty and health,”
we are also proactively involved in environmental conservation activities as well as community service
activities as a “good corporate citizen.”
CONTENTS
26 Intellectual Property Strategy
27 Corporate Social Responsibility
28 Corporate Governance, Compliance, and Investor Relations
30 Directors and Officers

14 ANNUAL REPORT 2005
AT A GLANCE
PRODUCTS NET SALES AND OPERATING INCOME (LOSS)
C O S M E T I C SB U S I N E S S
N U T R I T I O N A LS U P P L E M E N T SB U S I N E S S
O T H E RB U S I N E S S E S
42.2%OF TOTAL NET SALES
•FANCL cosmetics(Preservative-free cosmeticsthat contain no ingredientsknown to cause skin allergies)
•ATTENIR cosmetics(Attractive, quality cosmeticsat reasonable prices)
35.4%OF TOTAL NET SALES
•Health supplements(High-quality nutritionalsupplements at competitiveprices)
•Beauty supplements(Nutritional supplements forinner beauty)
22.4%OF TOTAL NET SALES
•Germinated brown rice•Kale juice•Comfort undergarments•Health equipment and lifestyle
goods
0
10,000
20,000
30,000
40,000
0
10
20
30
40(Millions of yen) (%)
03 04 05
0
10,000
20,000
30,000
40,000
0
10
20
30
40(Millions of yen) (%)
03 04 05
-10,000
0
10,000
20,000
40,000
30,000
-10
0
10
20
40
30
(Millions of yen) (%)
03 04 05

SALES CHANNEL BREAKDOWNSMAJOR DEVELOPMENTS DURING FISCAL 2005 AND STRATEGIC FOCUS FOR FISCAL 2006
15
SUMMARY FOR FISCAL 2005
• Sales of FANCL cosmetics improved, driven by MILDCLEANSING OIL and FENATTY with added unique functions.
• The number of active customers using ATTENIR cosmetics set anew record, repeating the previous term’s performance, and salesalso reached a new high thanks to the effects of advertising andsales promotion activities.
• Sales at existing retail stores improved as measures to enhanceretail store sales capacity proved successful.
• Operating income declined due to aggressive advertising and salespromotion activities associated with product renewal.
STRATEGIC FOCUS FOR FISCAL 2006
• We will renew our facial washing powder product by addingunique functions and focus on the differentiation of FANCLcosmetics.
SUMMARY FOR FISCAL 2005
• As a result of the renewal of minerals supplements byincorporating the new functional ingredient TWINTOSE, sales ofTWINTOSE-incorporated products increased as a whole.
• Mail-order sales were firm thanks in part to the co-enzyme Q10
boom.
• Retail store sales grew in part because of the effect of new storeopenings of FANCL House J, carrying a broad range of nutritionalsupplements.
• Operating income declined as we aggressively spent onadvertising to promote consumer recognition of TWINTOSE.
STRATEGIC FOCUS FOR FISCAL 2006
• In addition to the line of TWINTOSE-incorporated products, wewill push ahead with product differentiation by introducing orig-inal ingredients such as HTC Collagen.
SUMMARY FOR FISCAL 2005
• Sales of germinated brown rice declined despite efforts to improvethe taste significantly by adopting a new processing method.
• Sales of kale juice increased, with the powdered versionincorporating TWINTOSE and the frozen version recording astrong performance.
• Stagnant sales in the main catalogue business resulted in a declinein revenue from the IIMONO OHKOKU (Kingdom of WonderfulThings) Mail-Order Business.
• Operating loss in other businesses increased, affected by the poorperformance of the IIMONO OHKOKU Mail-Order Business.
STRATEGIC FOCUS FOR FISCAL 2006
• We will seek to improve profitability through a review of our coststructure.
Sales Breakdown by Sales Channel Year Ended March 31, 2005
Mail-Order Sales 61.5%
Retail Store Sales 31.0%
Others 7.5%
Sales Breakdown by Sales Channel Year Ended March 31, 2005
Mail Order Sales 53.7%
Retail Store Sales 23.0%
Others 23.3%
Sales Breakdown by Sales Channel Year Ended March 31, 2005
Mail Order Sales 76.1%
Retail Store Sales 7.1%
Others 16.8%

Millions of yen
2007 (plan) 2006 (plan) 2005 2004 2003
Net sales .................................................................. 46,200 39,600 37,098 34,926 37,155FANCL cosmetics ............................................. 34,200 29,500 27,759 26,370 29,683ATTENIR cosmetics.......................................... 11,600 9,800 9,042 8,147 7,078Others................................................................ 400 300 297 407 394
Gross profit ............................................................. 29,300 27,592 26,394 28,407Selling, general and administrative expenses ......... 23,600 22,847 20,111 20,308
Advertising expenses......................................... 4,600 5,073 3,932 3,328Operating income ................................................... 8,600 5,700 4,745 6,283 8,099Operating income margin ....................................... 18.6% 14.4% 12.8% 18.0% 21.8%
Customers
Number of active customers* at fiscal year-end:FANCL cosmetics (Mail-order and retail store)........... 1,157,014 1,041,054 1,128,785ATTENIR cosmetics (Mail-order)..................... 432,200 372,679 306,327
16 ANNUAL REPORT 2005
FISCAL 2004 RESULTS
—Sales of FANCL cosmetics improve, ATTENIR cosmetics achieve record sales
Sales
Cosmetics Business sales improved, increasing 6.2% over
the previous year to ¥37,098 million. For FANCL
cosmetics with the preservative-free concept, to achieve a
brand revitalization of basic skincare products, we
renewed our best-selling single item MILD CLEANSING
OIL in August and our mainstay brand in the line of skin-
care products FENATTY in September. For ATTENIR
cosmetics with the concept of reasonable prices, high
quality, and high functionality, we renewed makeup
products and launched the high-functionality skin-light-
ening beauty lotion NIGHT WHITE CC.
As a result, sales of FANCL cosmetics rose 5.3% from
the previous year to ¥27,759 million, with renewal prod-
ucts providing the driving force in the second half to
make up for pre-renewal buying restraints in the first half.
ATTENIR cosmetics posted record sales of ¥9,042
million, a rise of 11.0% over the previous year, with both
new products and renewal products faring well thanks to
effective advertising and sales promotion activities.
Sales, by Sales Channel
Mail-order sales increased 4.4% over the previous year to
¥22,829 million. Mail-order sales of FANCL cosmetics
rose 1.4% year-on-year to ¥14,432 million on the strength
of makeup products and limited-time seasonal products
as well as renewal products. Mail-order sales of ATTENIR
cosmetics continued to show strong growth, rising 10.0%
over the previous year to ¥8,392 million.
In retail store sales, existing-store sales improved as a
result of proactive efforts to boost sales capability, such as
measures to help raise the motivation of store staff and
store renovations. These efforts, combined with the
effects of new store openings (please refer to page 23),
pushed retail store sales of cosmetics up 8.3% year-on-
year to ¥11,491 million.
Other sales channels increased 13.5% year-on-year to
¥2,777 million. While convenience store sales fell short of
the previous year’s level, this was offset by strong overseas
sales in Hong Kong and other markets.
Profit and Loss
Operating income dropped 24.5% year-on-year to ¥4,745
million, while operating income margin fell 5.2 percentage
BUSINESS OVERVIEW AND STRATEGY, BY SEGMENT
COSMETICS BUSINESS
Cosmetics Business Performance and CC Plan (Targets)
*Active customers: Customers making at least one purchase during the preceding seven months. Sundries customers are included in the number of FANCL cosmetics’ active customers in 2003, but not in 2004 and 2005.

17
points from the previous year to 12.8%. In addition to
higher fixed costs due to the start-up of the Shiga Factory
and higher personnel costs associated with the increase in
store numbers, operating income was weighed down by
aggressive spending on advertising and sales promotion
activities associated with product renewal.
FISCAL 2005 OVERVIEW AND FISCAL 2006 STRATEGY
—Renewal of facial washing powder in fiscal 2006
In fiscal 2005, we primarily sought to reinforce our line of
skincare products by differentiating them from competing
products through the renewal of the FENATTY series. As a
consequence, monthly sales of the post-renewal FENATTY
line rose about 20% from the previous year’s level, and we
succeeded in turning around the FENATTY line of preser-
vative-free skincare products, the mainstay of FANCL
cosmetics. Moreover, sales of MILD CLEANSING OIL
doubled after the renewal, making us even more confident
in our strategy to revive brands through the incorporation
of “original ingredients and unique functions.”
In fiscal 2006, we will continue to engage in proactive
sales promotion activities to convince potential customers
of the excellent product attributes of MILD CLEANSING
OIL and FENATTY. We will also renew our facial washing
powders, the starting point of skincare, by renewing them
as products with appealing unique functionality, and
launch them by the end of the first half. Furthermore, we
are planning to launch high-functionality anti-aging
beauty lotion employing our original materials.
Active Cosmetics Customers
0
200,000
600,000
800,000
1,000,000
1,200,000
-20
-10
400,000 0
10
20
30
40
(Number of customers) (%)
03/4 05/303/8 03/12 04/4 04/8 04/12
Number of active mail-order and retail store customers (FANCL cosmetics)
Number of active mail-order customers (ATTENIR cosmetics)
Year-on-year change (FANCL cosmetics)
Year-on-year change (ATTENIR cosmetics)
Cosmetics Business Net Sales andOperating Income Margin
0
10
20
30
40
50
0
5
10
15
20
25(Billions of yen) (%)
03 04 05 07Plan
06Plan
FANCL cosmetics
ATTENIR cosmetics
Others
Operating income margin
FANCL cosmeticsFENATTY series
ATTENIR cosmeticsNIGHT WHITE CC
FANCL cosmeticsMILD CLEANSINGOIL

18 ANNUAL REPORT 2005
FISCAL 2005 RESULTS
—Higher sales increase on the TWINTOSE effect and the co-enzyme Q10 boom
Sales
Nutritional Supplements Business sales increased 5.0%
over the previous year to ¥31,132 million. Amid the
continued expansion of the supplements market against
the backdrop of heightened health consciousness, higher
sales were achieved in April and May 2004 by four
mineral supplements renewed with the incorporation of
TWINTOSE, which boosts the body’s capacity to absorb
minerals.
Meanwhile, co-enzyme Q10 became highly popular
across Japan after it was introduced as an ingredient with
powerful antioxidant properties in a health information
television program. Sales of FANCL’s reasonably priced
Q10 supplement soared sevenfold following the television
program in September from the monthly average sales the
previous year. Demand for Q10 supplements was fueled
further by regulatory approval of the use of Q10 in
cosmetics in October 2004.
Sales, by Sales Channel
Mail-order sales increased 1.6% year-on-year to ¥16,709
million, supported by the Q10 boom and the solid
performance of TWINTOSE-incorporated products.
Retail store sales posted a strong rise of 19.7% over
the previous year to ¥7,175 million as more customers of
cosmetics-oriented FANCL House took interest in the
“inner and outer beauty” concept advocated by FANCL as
well as the increase in the number of FANCL House J
stores, which carry a more extensive line of nutritional
supplements than FANCL House stores.
Other sales channels were up 0.3% year-on-year to
¥7,246 million. Although sales at convenience stores and
supermarkets declined from the previous year due to
intensified competition, sales in Hong Kong and other
overseas markets increased.
Profit and Loss
Operating profit decreased 13.6% year-on-year to ¥4,638
million and operating income margin also declined 3.2
Nutritional Supplements Business Performance and CC Plan (Targets)
Millions of yen
2007 (plan) 2006 (plan) 2005 2004 2003
Net sales .................................................................. 37,500 33,200 31,132 29,656 29,211Gross profit ............................................................. 21,450 20,623 19,047 19,161Selling, general and administrative expenses ......... 16,850 15,985 13,676 12,282
Advertising expenses......................................... 3,200 3,291 2,501 1,825Operating income ................................................... 5,200 4,600 4,638 5,371 6,879Operating income margin ....................................... 13.9% 13.9% 14.9% 18.1% 23.5%
Customers
Number of active customers* at fiscal year-end:Mail-order and Retail store ............................... 1,114,282 1,066,078 1,109,821
*Active customers: Customers making at least one purchase during the preceding seven months.
BUSINESS OVERVIEW AND STRATEGY, BY SEGMENT
NUTRITIONAL SUPPLEMENTS BUSINESS

19
percentage points to 14.9%, due principally to aggressive
spending on advertising to help boost consumer recogni-
tion of TWINTOSE. An improvement in the cost ratio
through a review of raw materials prices and other meas-
ures did not offset this increased spending.
FISCAL 2005 OVERVIEW AND FISCAL 2006 STRATEGY
—Focus on sales expansion of TWINTOSE and beauty supplements
In fiscal 2005, our strategy to revitalize existing minerals
supplements with the incorporation of TWINTOSE
proved successful. According to one survey, however, the
degree of recognition of TWINTOSE, which we position
as a major growth product that would also affect the food
industry, was only 4%, far lower than the 57% mark for
catechin and the 42% mark for DHA.
Under these circumstances, we will redouble efforts
to push for further growth of products incorporating
TWINTOSE, centering on the powdered version of
TWINTOSE that can effectively boost the body’s capacity
to absorb calcium when mixed with milk or yogurt.
While responding to the strong underlying demand for
co-enzyme Q10, we will also strengthen our line of beauty
supplements using original materials such as HTC*
Collagen, thereby aggressively promoting the concept of
“inner and outer beauty.”
*HTC: High Tripeptide Containing
Active Nutritional Supplements Customers
0
200,000
600,000
80,0000
1,000,000
1,200,000
-20
-10
400,000 0
10
20
30
40
(Number of customers) (%)
03/4 05/303/8 03/12 04/4 04/8 04/12
Number of active mail-order and retail store customers
Year-on-year change
Nutritional Supplements Business Net Sales and Operating Income Margin
0
10
20
30
40
50
0
5
10
15
20
25(Billions of yen) (%)
03 04 05 07Plan
06Plan
Net sales
Operating income margin
TWINTOSE andTWINTOSE-incorporatedmineral supplements
HTC Collagen Co-enzyme Q10

20 ANNUAL REPORT 2005
FY2005 RESULTS
—Kale juice and IIMONO OHKOKU mail-order turnprofitable in the 2nd half
Sales
Other Businesses sales dropped 3.3% year-on-year to
¥19,707 million.
Sales, by Category
Germinated Brown Rice Business sales fell 6.6% year-on-
year to ¥5,026 million. We launched germinated brown
rice with an improved taste, smell, and texture, processed
with under a new method. We began to aggressively push
mail-order and retail store sales of this new germinated
brown rice in June and wholesale sales to supermarkets in
September. However, we were not able to fully differentiate
the new product with competing products offered by other
companies. The number of mail-order sales customers
continued to decline, while sales to supermarkets failed to
make a substantial recovery.
Kale Juice Business sales rose 18.1% year-on-year to
¥3,524 million. In fiscal 2004, we found ourselves in a
serious situation when we could not procure materials due
to bad weather and were forced to suspend the supply of
kale juice from mid-February. In fiscal 2005, however, we
increased the acreage of land contracted for growing kale in
warmer regions as well as regions less affected by typhoons,
and we resumed sales of kale juice through all sales channels
in May 2004. In addition to the conventional frozen version,
the TWINTOSE-added powdered version launched in July
fared strongly, with sales increasing in all sales channels.
IIMONO OHKOKU (Kingdom of Wonderful Things)
Mail-Order Business sales declined 13.5% year-on-year to
¥7,153 million. According to a thorough review of the
business, catalog sales were sluggish.
Other Related Businesses sales rose 7.1% year-on-
year to ¥4,002 million thanks to strong sales of
undergarments and sundries.
Profit and Loss
Operating loss widened ¥146 million from the previous
year to ¥1,967 million, due chiefly to larger losses by the
IIMONO OHKOKU Mail-Order Business. In the second
half, however, the profitability of the Kale Juice Business
improved thanks to the launch of the highly profitable
TWINTOSE-added kale juice and that of the IIMONO
OHKOKU Business also improved due to restructuring
effects, with both the Kale Juice Business and IIMONO
OHKOKU Business pulling out of loss-making situations.
Other Business Performance and CC Plan (Targets)
Millions of yen
2007 (plan) 2006 (plan) 2005 2004 2003
Net sales .................................................................. 21,300 20,220 19,707 20,375 23,660Germinated brown rice ..................................... 5,500 5,200 5,026 5,383 6,844Kale juice........................................................... 4,500 4,000 3,524 2,985 2,501IIMONO OHKOKU mail-order......................... 7,600 7,400 7,153 8,270 10,936Others................................................................ 3,700 3,600 4,002 3,736 3,376
Gross profit ............................................................. 10,350 9,689 10,254 11,413Selling, general and administrative expenses ......... 10,750 11,656 12,075 13,059
Advertising expenses......................................... 1,900 2,740 3,430 4,107Operating income ................................................... 0 (400) (1,967) (1,821) (1,646)Operating income margin ....................................... 0.0% (2.0%) (10.0%) (8.9%) (7.0%)
Customers
Number of active customers at fiscal year-ended:Germinated brown rice (Mail-order) ................ 236,304 340,764 464,264Kale juice (Mail-order)...................................... 99,564 113,775 116,146
*Active customers: Customers making at least one purchase during the preceding seven months.
BUSINESS OVERVIEW AND STRATEGY, BY SEGMENT
OTHER BUSINESSES

21
FISCAL 2005 OVERVIEW AND FISCAL 2006 STRATEGY
—High expectations for TWINTOSE-added kale juice in fiscal 2006
In the Germinated Brown Rice Business, though the
number of active mail-order customers was on a down-
ward trend, customers placing standing orders increased.
We will continue to strive to increase the number of these
customers and boost the development of new products
geared toward processed food manufacturers. In April
2005, we started production of private-brand products for
major retailers. We will seek to enhance profitability by
raising capacity utilization.
In the Kale Juice Business, we will seek to improve
profitability by adding high value-added products incor-
porating TWINTOSE, which abundantly boosts the
body’s capacity to absorb minerals contained in kale juice,
to the loss-making frozen version. We will also revamp
the system for stable procurement by diversifying loca-
tions of kale-growing land and promote product
differentiation over the medium term by introducing new
growing methods to augment the nutritious value of kale.
The IIMONO OHKOKU Mail-Order Business will
take over the purchasing and quality control operations of
the Sundry Division of FANCL, thereby contributing to
higher efficiency across the Group. We will also make
cost-cutting efforts on a continuing basis, and seek to
establish stable profitability by developing products that
are likely to prompt customers to make recurrent
purchases.
Active Germinated Brown Rice and Kale Juice Customers
0
200,000
30,0000
400,000
500,000
-100
-50100,000
0
50
100
150
(Number of customers) (%)
03/4 05/303/8 03/12 04/4 04/8 04/12
Number of active germinated brown rice customers (mail-order)
Number of active kale juice customers (mail-order)
Year-on-year change (germinated brown rice)
Year-on-year change (kale juice)
Other Businesses Net Sales andOperating Income Margin
-20
-10
0
10
20
30
-10
-5
0
5
10
15(Billions of yen) (%)
03 04 05 07Plan
06Plan
Germinated Brown Rice
Kale Juice
IIMONO OHKOKU
Others
Operating income margin
Germinated brown riceproducts
Powdered kale juice IIMONO OHKOKUmail-order catalogs

22 ANNUAL REPORT 2005
POSITIONING OF EACH SALES CHANNEL
Mail-order sales (including the Internet) are our main sales
channel and account for some 62% of total sales. FANCL’s
preservative-free cosmetics are produced in factories in an
aseptic condition, with the manufacturing date displayed
on all products. Mail-order is the most appropriate channel
to directly deliver freshly-made products to customers. At
the same time, mail-order is widely used as a convenient
channel to purchase nutritional supplements.
On the other hand, retail stores are increasingly gaining
importance for their role as a place where customers can
actually see and try products. Many Japanese consumers
prefer to make purchases at retail stores, and retail stores
can attract new customers who cannot be won over through
the mail-order channel. As such, under the CC Plan, we are
working to build a network of 300 retail stores, about
double the number in fiscal 2004.
For wholesale sales, we have been strategically
increasing our number of business partners, centering on
supermarkets and convenience stores, as a channel to
enhance the “convenience of customers,” and we also
launched efforts to sell our products to medical and phar-
maceutical institutions as a new channel.
BUSINESS OVERVIEW AND STRATEGY, BY SALES CHANNEL
FANCL has a multiple-channel sales system of mail-order, retail store, and wholesale sales. While giving
importance to mail-order sales as the principal channel of sales, the FANCL Change & Challenge Plan (CC
Plan) identifies the expansion of the retail store network as a priority task to expand the new customer base.
Sales Composition, by Channel
0
40
60
80
100
20
(%)
02 03 04 05 06Plan
Mail-order sales
Retail store sales
Other (Wholesale sales and overseas sales)
67.1 65.9 64.1 62.058.9
20.2 19.7 20.8 22.8 26.2
12.7 14.4 15.1 15.2 14.9
MAIL-ORDER SALES
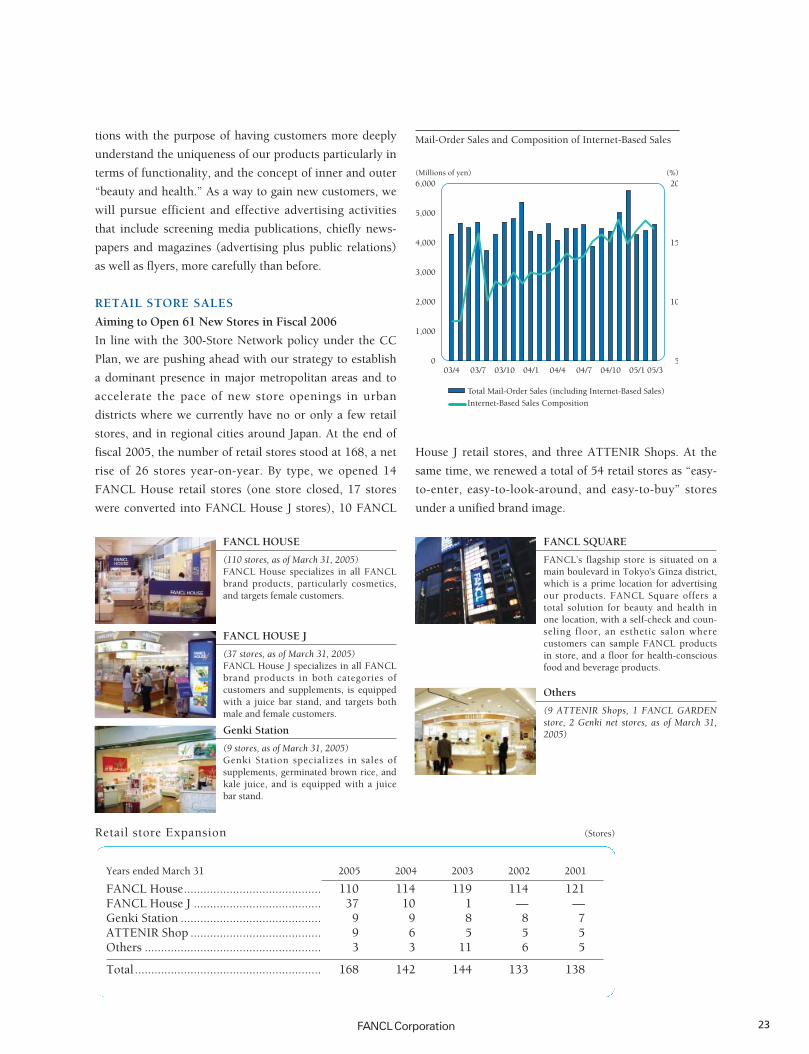
Internet-Based Sales Growing Steadily
The number of active mail-order customers is recovering
for both cosmetics and nutritional supplements. In partic-
ular, the number of active customers using the Internet
has been increasing steadily. As a way to further increase
the number of new customers acquired over the Internet,
we are strengthening the mechanism to guide customers
visiting portal sites in search of the types of products that
we offer. This is an efficient means of introducing FANCL
products. We will also provide our Internet customers
with timely information via e-mail according to their
characteristics and closely follow up our correspondence
to make them enthusiasts of FANCL products, as well as
regular repeat users.
Raising the Level of Mail-Order Sales as a Whole
While Internet-based sales are increasing, other mail-
order sales are still at a low level. Given this situation, we
are intensifying proactive and detailed sales promotion
activities according to customer attributes based on a
detailed analysis of customer data by our Marketing
Headquarters. We also started a review of our publica-
Number of Active Mail-Order Customers, by Products
0
400
600
800
200,
(1,000 Customers)
03/4 03/7 03/10 04/1 04/4 04/7 04/10 05/1 05/3
FANCL cosmetics Nutritional supplements
Germinated brown rice Kale juice
Active customers: Customers making at least one purchase during the preceding seven months
632
425236
618642
695
536614
234127
88 100
23
tions with the purpose of having customers more deeply
understand the uniqueness of our products particularly in
terms of functionality, and the concept of inner and outer
“beauty and health.” As a way to gain new customers, we
will pursue efficient and effective advertising activities
that include screening media publications, chiefly news-
papers and magazines (advertising plus public relations)
as well as flyers, more carefully than before.
RETAIL STORE SALES
Aiming to Open 61 New Stores in Fiscal 2006
In line with the 300-Store Network policy under the CC
Plan, we are pushing ahead with our strategy to establish
a dominant presence in major metropolitan areas and to
accelerate the pace of new store openings in urban
districts where we currently have no or only a few retail
stores, and in regional cities around Japan. At the end of
fiscal 2005, the number of retail stores stood at 168, a net
rise of 26 stores year-on-year. By type, we opened 14
FANCL House retail stores (one store closed, 17 stores
were converted into FANCL House J stores), 10 FANCL
House J retail stores, and three ATTENIR Shops. At the
same time, we renewed a total of 54 retail stores as “easy-
to-enter, easy-to-look-around, and easy-to-buy” stores
under a unified brand image.
Mail-Order Sales and Composition of Internet-Based Sales
0
3,000
4,000
5,000
6,000
2,000
1,000
5
15
20
10
(Millions of yen) (%)
03/4 03/7 03/10 04/1 04/4 04/7 04/10 05/1 05/3
Total Mail-Order Sales (including Internet-Based Sales)
Internet-Based Sales Composition
Years ended March 31 2005 2004 2003 2002 2001
FANCL House.......................................... 110 114 119 114 121FANCL House J ....................................... 37 10 1 — —Genki Station ........................................... 9 9 8 8 7ATTENIR Shop ........................................ 9 6 5 5 5Others ...................................................... 3 3 11 6 5
Total......................................................... 168 142 144 133 138
Retail store Expansion (Stores)
FANCL SQUARE
FANCL’s flagship store is situated on amain boulevard in Tokyo’s Ginza district,which is a prime location for advertisingour products. FANCL Square offers atotal solution for beauty and health inone location, with a self-check and coun-seling floor, an esthetic salon wherecustomers can sample FANCL productsin store, and a floor for health-consciousfood and beverage products.
Genki Station
(9 stores, as of March 31, 2005) Genki Station specializes in sales ofsupplements, germinated brown rice, andkale juice, and is equipped with a juicebar stand.
FANCL HOUSE J
(37 stores, as of March 31, 2005) FANCL House J specializes in all FANCLbrand products in both categories ofcustomers and supplements, is equippedwith a juice bar stand, and targets bothmale and female customers.
FANCL HOUSE
(110 stores, as of March 31, 2005)FANCL House specializes in all FANCLbrand products, particularly cosmetics,and targets female customers.
Others
(9 ATTENIR Shops, 1 FANCL GARDENstore, 2 Genki net stores, as of March 31,2005)

24 ANNUAL REPORT 2005
In fiscal 2006, we will seek to establish a network of 229
stores by opening 60 new retail stores, focusing mainly on
FANCL House and FANCL House J stores, and one
ATTENIR Shop. We also plan to renovate 70 existing stores.
On the other hand, the rapid increase in the number of
retail stores has presented a problem of standardizing
retail store operations. To deal with this, we are estab-
lishing a chain store management system at a torrid pace
by introducing a store supervisor (SV) system and an
area-based training system.
Revamp of Retail Store Staff Personnel
and Education Systems
In parallel with the renovation of retail stores, we are
making efforts to build a mechanism for raising both the
skills and motivation of our retail store staff. Specifically,
we have established the FANCL Academy with a retail
store as an educational institution for training. We are
also seeking to upgrade staff capabilities, from waiting on
customers to counseling them, by creating an in-house
qualification system for inner and outer “beauty and
health” advisers. As part of the review of the personnel
system, we created a system of promoting retail store
staff—most of whom are contract workers—to regular
permanent employees, and changed the wage system to
one that reflects the roles and responsibilities of
employees more precisely. We also made efforts to
improve working conditions, including the creation of a
system of reemployment for female employees after
childbirth.
WHOLESALE SALES
Expanding the Business Sphere from General
Merchandise Store (GMS), Convenience Store (CVS) to
the Medical Sector
Wholesale sales are an important channel to secure large-
volume sales of vitamins, which are widely recognized to
be effective and efficacious, as well as germinated brown
rice and kale juice. Beginning with Seven-Eleven Japan
Co., Ltd. in 1999, we have concluded contracts for whole-
sale sales of nutritional supplements with limited
business partners who understand the brand value of
FANCL products, including GMSs (such as Ito-Yokado
and JUSCO) and CVSs (such as Seven-Eleven and
Lawson). We are now seeking to increase business part-
ners for germinated brown rice and kale juice, centering
on GMS and CVS.
Amid increasing interest in the health support function
of supplements, we created a sales force dedicated to
wholesale sales to medical and pharmaceutical institu-
tions in order to mount a full-fledged effort to cultivate
this particular market. We are already engaged in activi-
ties to approach medical professionals by making active
use of academic conferences and seminars, including
setting up a booth at the Integrated Medicine Exhibition
and Conference 2005, the first joint exhibition in Japan
on preventive and alternative medicine.
Seeking to Bolster Our Sales Force
Given the evolution of our business primarily based on
mail-order sales, we cannot deny the lack of know-how
about the highly competitive wholesale sales market. To
make up for this deficiency, we are hiring wholesale sales
specialists with a meticulous sales approach to bolster our
sales activities with wholesale clients. At the same time,
we are reviewing our sales system that has relied heavily
on clients for sales promotion. Specifically, we are making
self-allocation proposals with the highly precise collection
and analysis of store floor information and by capitalizing
on our “support ladies” who engage in sales promotion
activities. For germinated brown rice and kale juice, we
will seek to encourage repeat purchases through the
distribution of coupons.
As for the struggling Germinated Brown Rice Business,
for which wholesale sales are positioned as the main
sales channel, we will bolster our sector-specific sales
forces for such sectors as processed food, take-home
meals, school lunches, and restaurants. For example, we
will broaden our approach to schools for lunches, and
enhance our ability to propose menus to restaurants in
cooperation with our processed food development divi-
sion.

Overseas Development (As of March 31, 2005)
China3 retail stores
U.S.A.Mail-order,Wholesales
Hong Kong27 retail stores
Indonesia8 retail stores
Taiwan12 retail stores
Thailand3 retail stores
SingaporeOversesas salesmanagement,13 retail stores
25
HONG KONG SALES CONTINUE TO GROW
Sales in Hong Kong (through our distributor) continued
to show a solid performance. On the domestic market,
sales of collagen drinks have been on a constant rise,
together with MILD CLEANSING OIL and FENATTY,
which underwent a product renewal the previous year.
Taiwan is a very promising market, with sales per retail
store increasing steadily.
FANCL SHOP OPENING IN SHANGHAI
In November 2004,
FANCL Shop Shanghai,
our first retail store
in mainland China,
opened at Parkson
Department Store.
Many Asian women
tend not to use much
makeup until they
reach adulthood, taking
great care of the natural beauty of their skin. In that
sense, Asia is a very promising market for FANCL, due to
our focus on skincare. For the time being, we will
conduct an intensive campaign in the Shanghai area to
promote a “preservative-free, reliable, and safe” brand
image of our products in order to enhance consumer
recognition of FANCL. For business in China, we have an
exclusive contract with a distributor, who has been very
successful in Hong Kong.
FULL LAUNCH OF BOSCIA IN THE UNITED
STATES
In the United States,
focusing on the trend
toward natural prod-
ucts, we initiated test
marketing for our
high-quality plant-
derived natural skin
care brand “boscia”
(Botanical Science) from October 2002. Since then boscia
has gone on to win a number of significant awards in the
U.S., including the Health Beauty Award. Based on the
success of our two-year test marketing period, we decided
to make the first step toward a full launch of the brand in
the U.S. From November 2004, a boscia Travel Kit was
launched in major U.S. cities. We have secured sales
space in highly prestigious locations, including Henry
Bendel in New York, Nordstrom, and cosmetic retailers
such as Sephora and Bath & Body Works.
OVERSEAS DEVELOPMENT
Overseas Sales
0
1,000
500
2,000
1,500
2,500
3,500
3,000
(Millions of yen)
00
932
1,219
2,4972,665
2,376
3,124
01 02 03 04 05
Boscia Travel Kit
FANCL’s overseas business started with distributor sales in Hong Kong in October 1996. Currently, we are
expanding our business in Hong Kong, Singapore, Taiwan, China, Indonesia, Thailand, and the United
States, mainly through our Singapore-based subsidiary FANCL ASIA (PTE.,) LTD. Combined overseas
wholesale and retail sales for fiscal 2005 totaled ¥3,124 million, an increase of 31.5% year-on-year.
Shanghai Pacific Ocean store

26 ANNUAL REPORT 2005
INTELLECTUAL PROPERTY STRATEGY
Recognizing that the development and commercialization of differentiated original ingredients will prove
to be the driving force of growth, FANCL believes it is important to utilize effectively our intellectual prop-
erty accumulated over the years.
RESEARCH AND DEVELOPMENT
FANCL, through its Central Research Center, carries out
research and development with the main concept of inner
and outer “beauty and health” to pursue beauty and
health from inside and outside the body. In order to
secure speedy and efficient research and development
activities, we are expanding the network of joint research
and development with universities, government agencies,
and other companies. FANCL’s Central Research Center,
which has been a leading force in the popularization of
nutritional supplements, is one of the best institutions in
Japan in this field and has a large accumulation of
research data.
Successive Application for Patents
on Original Ingredients and Functions
Since the CC Plan declared our pursuit of a value-based
appeal strategy, FANCL successively commercialized orig-
inal ingredients and unique functions and also filed patent
applications to protect its intellectual property rights.
FANCL is consolidating its peerless position through intel-
lectual property rights protection for the development of
original ingredients and functions as well as for the in-
house development of unique manufacturing technologies.
Investing Aggressively in Verification Research
Demonstrative research is gaining importance in the
process of product development. While we are not
allowed to claim the effects and efficacy of nutritional
supplements, it is necessary to conduct tests at the levels
required by the Ministry of Health, Labour and Welfare if
we plan to apply for the designation as food for specified
health use. Also, it is essential to conduct verification
research to prove the reliability of products at the highest
possible level to offer high-quality products to customers.
As we discover new ingredients and new functions, it is
becoming necessary to increase our budget allocation for
verification research. We intend to gradually increase the
ratio of research and development expenses to sales from
the current 2.2%.
Supplement-Drug-Interaction Search Service Launched
On April 1, 2004, we launched a
service using the SDI (Supple-
ment-Drug-Interaction) search
system (patent applied). The
system, developed by our staff
who have medical and pharma-
cist licenses, allows us to
immediately search for possible
interactions between FANCL nutritional supplements
(about 100 items) and prescription and over-the-counter
drugs (about 19,000 and 13,000 items, respectively). Our
staff at the SDI Information Desk responds to customers’
inquiries about possible interactions between supple-
ments and drugs by making use of the this search system.
Additionally, in order to make the medical field our new
sales channel, we launched the new publication, The
Doctor’s Complete Guide to Alternative Medicines, in August in a
bid to make doctors, pharmacists, nutritionists, and others
in the medical profession aware of the importance of nutri-
tional supplements as part of one’s diet.
R&D-Related Data R&D Expenses
0
500
1,000
1,500
2,000(Millions of yen)
01 02 03 0504
For the years ended March 31 2005 2004 2003 2002 2001
R&D expenses (millions of yen) ... 1,958 1,720 1,683 1,524 1,294Sales ratio .............................. 2.2% 2.0% 1.9% 1.8% 2.0%Researchers............................ 114 103 94 84 75Patent applications ................ 64 51 97 94 63

27
CORPORATE SOCIAL RESPONSIBILITY
As a good corporate citizen, FANCL naturally seeks to contribute to society through its corporate activ-
ities and is actively making efforts in a wide range of community service and environmental
conservation activities.
1. LAUNCH OF THE CSR PROMOTION
COMMITTEE
In April 2005, we launched the CSR Promotion Committee,
headed by FANCL’s President. In this way, we have
further vitalized our CSR structure, creating a company-
wide system that before had only been undertaken by the
various divisions of the Company on an incremental basis.
The CSR Promotion Committee is comprised of a total of
six working groups: Community Service, Environmental
Conservation, Information Disclosure, IT Security, Risk
Management, and Corporate Ethics. We will continue to
promote a structure that can easily transmit and implement
a CSR strategy throughout the Company.
2. COMMUNITY SERVICE ACTIVITIES
FANCL SMILE Expanding Employment Opportunities
for Persons with Intellectual Disabilities
In February 1999, FANCL
established FANCL SMILE
Co., Ltd., a non-consoli-
dated special subsidiary
devoted to the promotion
of employment for persons
with disabilities. FANCL
SMILE is engaged in a variety of work for FANCL Group
companies, including the layout and setup of catalogs and
other documents as well as packaging work for products.
In addition, persons who have forklift truck licenses also
work in Group companies, strongly supporting our busi-
nesses. In this way, we are nurturing eager human
resources who will support FANCL. In the mid to long-
term, we aim to realize a stable and profitable company,
expand the scope of FANCL SMILE’s work nationwide,
and employ more persons with intellectual disabilities.
3. ENVIRONMENTAL CONSERVATION
ACTIVITIES
Details and Results of Environment-Related Activities
Recognizing that global environmental conservation is one
of the most important common challenges facing
humankind, the FANCL Group is promoting environmental
conservation activities in all aspects of our business. The
FANCL Group attained ISO 14001 environmental
management certification in November 2002.
In fiscal 2005, we formulated the four specific action
plans detailed below. In implementing these, we achieved
success in each of the four categories. In addition, fiscal 2005
was the first year for the FANCL Group Community and
Environmental Activities Report to be published. We will
continue to enhance our activities in these areas.
FY2005 Details and Results of Environmental Conservation Activities
Item
Promote resource conser-vation and recycling
Promote a reduced envi-ronmental burden attime of delivery
Green purchasing
Environmental commu-nications
* The customer-designated delivery service was introduced in January 1997.It is a system designed to obviate the need for redelivery due to customersnot being at home at the time of delivery and thereby contributes toreducing greenhouse gases that are emitted through delivery rounds.
Environmentally Friendly Products
At the FANCL Group, we take great care in the design and
development of containers and components of all our prod-
ucts to ensure that they are environmentally friendly. For
example, we were the first company in Japan to introduce
PEN resin into the containers of our preservative-free
cosmetics range. PEN resin does not emit endocrine
disrupters even when burned, and given its lightweight and
crack resistant properties, it is possible to use it in simple
packaging. In addition, our Ecopacks are refillable
containers designed from the point of view of “ecology” and
“economy.” Ecopacks are comprised of an airless compact
film, the first such product in the cosmetics industry, and a
special holder for which a patent was applied.
FY2005 Results
We have achieved an 89% recyclingrate of waste disposed from all ouroffices and plants
Customer-designated delivery service*and the post-in delivery method nowaccount for 35% of all deliveries
Introduction of envelopes with smallerair-cushions (from January 2005)
Improvement of purchase rate of envi-ronmentally friendly office goods to 58%
Publication of the Community andEnvironmental Activities Report

28 ANNUAL REPORT 2005
CORPORATE GOVERNANCE, COMPLIANCE, AND INVESTOR RELATIONS
FANCL regards the enhancement of corporate governance and compliance as an important management
issue to become a corporation trusted by shareholders and other stakeholders.
1. CORPORATE GOVERNANCE
We have introduced the managing officer system for the
purpose of ensuring the separation of supervisory and
operating functions of management. The Board of Direc-
tors, which consists of eight directors (including one
outside director), makes decisions on important operating
issues and other statutory matters and provides manage-
ment oversight on the basis of reports regarding the
operations of FANCL and its subsidiaries. The Manage-
ment Conference, made up of the board directors and
managing officers, considers matters to be decided by the
Board of Directors in advance and deliberates on impor-
tant management issues within the bounds of authority
devolved by the Board of Directors. At a general share-
holders meeting in June 2005, a decision was taken to
shorten the term of office of board directors from two
years to one year in a bid to clarify management respon-
sibility, strengthen the management base, and flexibly
build an appropriate management system in response to
changes in the management environment.
Four auditors, all from outside, attend all Board of
Directors meetings as well as management conferences
and other meetings of importance, and have a regular
exchange of views with top executives to ensure appro-
priate management oversight. There are no business
dealings or other business interests between our company
and the outside director or outside auditors, thereby
ensuring the objectivity of the governance function.
The compensation for Board of Directors and Auditors in
fiscal 2005 is described below:
Board member compensation package:
•Annual total remuneration of board directors
12 directors ¥241 million(Covers three board members who retired during the term, but does notinclude an amount equivalent to the portion of employee compensation whena board member is concurrently a company employee.)
Auditor compensation package:
•Annual total remuneration of auditors
4 auditors ¥40 million
•Remuneration regarding the audit
certificate based on audit contract ¥20 million
•Remuneration for services other than
those described above ¥1 million
2. COMPLIANCE AND
RISK MANAGEMENT SYSTEM
1) Overall System
The Internal Audit Division under the direct control of
the president conducts an audit of operations for each
division, while the Administrative Headquarters leads
company-wide efforts to improve various office regula-
tions and conduct educational activities to ensure that
compliance is duly observed in corporate activities and
that individual employees behave on the basis of solid
corporate ethics. Specifically, in October 2004, the
Compliance Office was assigned to the Administrative
Headquarters, and the Committee for CSR Promotion
was created in April 2005 to strengthen the internal
control system.
The Consumer Center, which gathers and analyzes
public comments and requests regarding our behavior
and attitude, has been placed under direct control of the
president so that our customers’ points of view can also
serve as a checking function for us.

29
2) Bolstering Protection of Personal Information
Most of our customers are individuals. Therefore, we have
asked all employees to submit written pledges “not to leak
personal information” in order to ensure the prevention of
personal information leakage. With the law for the protec-
tion of personal information put into force in April 2005,
we are redoubling efforts to strengthen our information
management system. Specifically, we have introduced a
host of security measures such as fingerprint authentica-
tion and encryption. We have also built a system that
records all access logs and allows us to track any source of
information leakage should this actually occur, thereby
serving as a major deterrent against information leakage.
3. INVESTOR RELATIONS
FANCL is working to ensure information disclosure in a
timely, appropriate, and speedy manner to improve
management transparency.
1) Promotion of Speedy and Fair Disclosure
We make a timely disclosure of monthly sales data and are
making efforts toward the announcement of financial
results as soon as possible after the end of the term. Infor-
mation on financial results is uploaded to the IR section of
our website as promptly as possible after official
announcements of business results. We are also striving
toward a fair disclosure of information to help narrow the
information disparity among stakeholders by, among other
measures, offering a video recording of earning results
briefings over the Internet.
Our IR activities are not limited to the domestic investor
base. Top management representatives make individual
calls on European and U.S. investors once a year.
2) Net-Based Online Execution of Voting Rights
Launched
As another example of how we are utilizing the Internet
to enhance shareholder convenience, online voting was
made available from the June 2004 General Meeting of
Shareholders as an alternative to the execution of voting
rights by means of conventional posting.
GENERAL MEETING OF SHAREHOLDERS
Board of DirectorsInternal and external directors
Audit BoardExternal auditors
Management ConferenceDirectors and managing officers
Each headquarter andsubsidiary and affiliate companies
Internal Audit Division
Accou
ntin
g aud
itors
Audits
Audits
Audits
Appointments,dismissals
Appointments,dismissals
Appointments,dismissals
Reports Supervision
Corporate Governance System
For further information, please contact:
Investor Relations Group
Tel: 81(45)226-1470
Fax: 81(45)226-1203
http://www.fancl.co.jp
e-mail: [email protected]
http://www.fancl.co.jp/corporate/ir/index.html

30 ANNUAL REPORT 2005
DIRECTORS AND OFFICERS(As of June 18, 2005)
President and Representative Director
Kenji Fujiwara
Senior Executive Managing Officer
Yasuyuki Yogoro
Executive Managing Officers and Directors
Kazuyoshi Miyajima
Sumiya Nakajima
Yoshinori Harigae
Executive Managing Officer
Toshihiro Nasuno
Director
Yoshifumi Narimatsu
Managing Officers and Directors
Kenichi Ishiwata
Yukio Ikemori
Managing Officers
Katsumi Maruyama
Shoji Shiba
Tomoko Tsuji
Haruki Murakami
Toshinori Ryuchi
Noburou Katase
Tomochika Yamaguchi
Akira Yajima
Yutaka Hirano
Outside Director
Yoshiharu Hayakawa
Statutory Auditors
Taiji Yamada
Fumiko Ikeda
Katsunori Koseki
Akira Tobishima
1 23
7 5 6
4
1. Kenji FujiwaraPresident and Representative Director
2. Kazuyoshi MiyajimaExecutive Managing Officer and Director
3. Sumiya NakajimaExecutive Managing Officer and Director
4. Yoshinori HarigaeExecutive Managing Officer and Director
5. Yoshifumi NarimatsuDirector
6. Kenichi IshiwataManaging Officer and Director
7. Yukio IkemoriManaging Officer and Director

31
FINANCIAL SECTION
CONTENTS
32 Six-Year Summary
33 Quarterly Financial and Stock Information / Monthly Sales Data
34 Management’s Discussion and Analysis
37 Business Risks
38 Consolidated Balance Sheets
40 Consolidated Statements of Income
41 Consolidated Statements of Shareholders’ Equity
42 Consolidated Statements of Cash Flows
43 Notes to Consolidated Financial Statements
53 Report of Independent Auditors

32 ANNUAL REPORT 2005
FOR THE YEAR:Net sales .................................................................
Cosmetics ...........................................................Nutritional supplements .....................................Others .................................................................
Net sales, by sales channel: Mail-order sales ..................................................Retail store sales .................................................Others .................................................................
Gross profit .............................................................Gross profit margin (%) .........................................Selling, general and administrative expenses .........Selling, general and
administrative expense ratio (%) ........................Operating income ...................................................
Cosmetics ...........................................................Nutritional supplements .....................................Others .................................................................
Operating income margin (%) ...............................Net income .............................................................Net income to net sales (%) ...................................ROE (%) .....................................................................
Advertising expenses ..............................................Sales promotion expenses ......................................Research and development expenses .....................Capital expenditures ..............................................Depreciation ...............................................................
Net cash provided by operating activities ..............Net cash used in investing activities ......................Net cash (used in) provided
by financing activities .........................................Net (decrease) increase in cash and
cash equivalents ....................................................
PER SHARE: Net income .............................................................Shareholders’ equity ...............................................Cash dividends ...........................................................
AT YEAR-END: Total assets .............................................................Shareholders’ equity ...............................................Equity ratio (%) ......................................................Interest-bearing debt ..............................................Working capital .........................................................
Number of stores ........................................................Number of consolidated subsidiaries........................
S IX-YEAR SUMMARY
FANCL CORPORATION and Consolidated SubsidiariesFor the years ended March 31
¥ 62,980 38,03921,898
3,043
45,94214,143
2,89344,969
71.4 33,426
53.1 11,54310,712
3,587(641)18.3
6,72310.7 15.3
¥ 6,0815,6151,3027,1382,424
¥ 5,681 (7,736)
13,006
10,949
¥ 459.53,678.9
30.0
¥ 67,657 55,146
81.5 2,780
29,219
862
¥ 87,937 37,098 31,132 19,707
54,54420,06713,32657,905
65.8 52,477
59.7 5,4284,745 4,638
(1,967)6.2
1,7101.9 2.6
¥ 11,105 9,475 1,9582,2572,463
¥ 4,638 (4,807)
(1,090)
(1,254)
¥ 80.33,111.2
50.0
¥ 79,416 66,203
83.4 —
28,622
1686
Millions of yen
2000
¥ 65,418 35,66925,408
4,341
43,36015,632
6,42647,034
71.9 38,402
58.7 8,6328,3204,694
(2,532)13.2
4,8677.4 8.5
¥ 8,896 5,810 1,2942,7272,379
¥ 6,083 (4,838)
(1,410)
(162)
¥ 249.83,051.4
25.0
¥ 75,481 59,482
78.8 3,086
28,456
1383
2001
¥ 84,657 36,74828,99518,914
56,82117,07310,76356,682
67.0 45,564
53.9 11,118
8,4065,960
(1,681)13.1
5,9957.1 9.7
¥ 10,213 8,161 1,5243,5892,245
¥ 7,426 (5,416)
(2,456)
(437)
¥ 307.63,320.2
25.0
¥ 79,026 64,719
81.9 1,092
31,082
1334
2002
¥ 90,026 37,15529,21123,660
59,33417,74412,94858,982
65.5 47,456
52.7 11,526
8,0996,879
(1,646)12.8
6,4297.1 9.8
¥ 9,262 8,615 1,6835,3972,268
¥ 9,828 (5,582)
(5,432)
(1,213)
¥ 279.52,976.3
35.0
¥ 79,804 66,350
83.1 350
29,805
1446
2003
¥ 84,957 34,92629,65620,375
54,43917,72212,79655,696
65.6 47,927
56.4 7,7696,2835,371
(1,821)9.1
3,3874.0 5.1
¥ 9,865 7,998 1,7204,8642,556
¥ 5,861 (4,117)
(4,533)
(2,809)
¥ 154.63,082.4
42.5
¥ 78,479 65,613
83.6 —
29,214
1426
20042005
SIX-YEAR SUMMARY
FANCL CORPORATION and Consolidated SubsidiariesFor the years ended March 31
SIX-YEAR SUMMARY
FANCL CORPORATION and Consolidated SubsidiariesFor the years ended March 31
SIX-YEAR SUMMARY
FANCL CORPORATION and Consolidated SubsidiariesFor the years ended March 31
Yen
Millions of yen
SIX-YEAR SUMMARY
FANCL CORPORATION and Consolidated SubsidiariesFor the years ended March 31
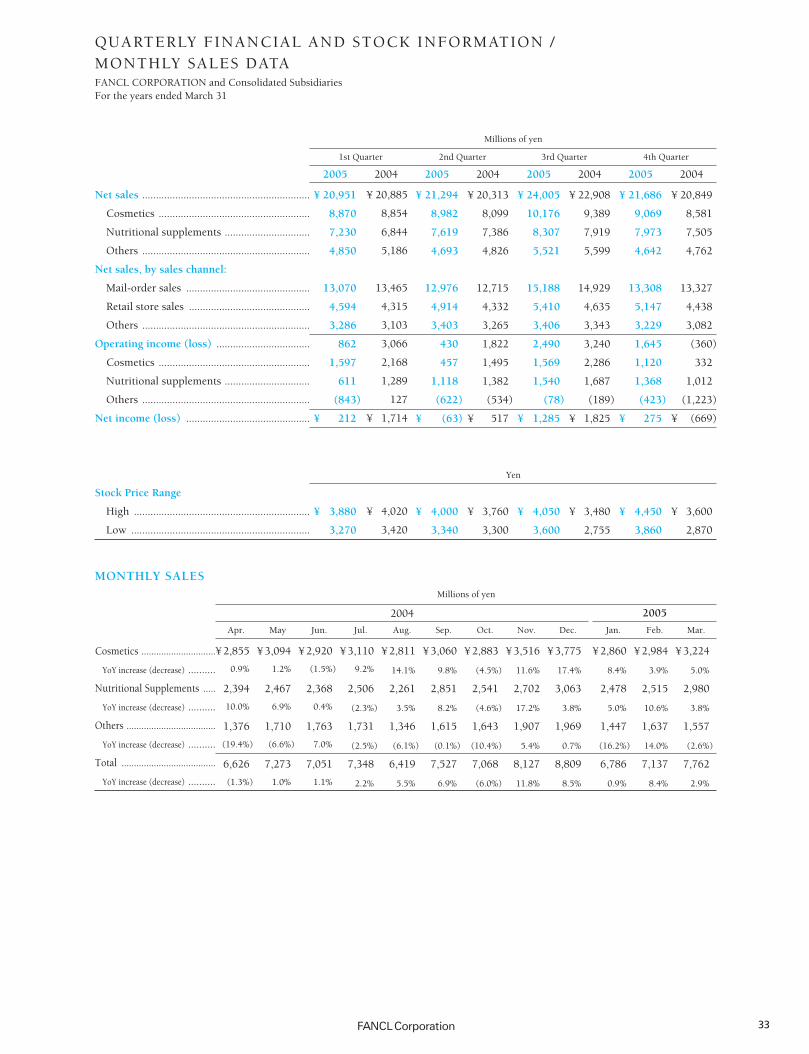
Net sales .............................................................
Cosmetics .......................................................
Nutritional supplements ...............................
Others .............................................................
Net sales, by sales channel:
Mail-order sales .............................................
Retail store sales ............................................
Others .............................................................
Operating income (loss) ..................................
Cosmetics .......................................................
Nutritional supplements ...............................
Others .............................................................
Net income (loss) .............................................
Stock Price Range
High ................................................................
Low .................................................................
33
QUARTERLY FINANCIAL AND STOCK INFORMATION /MONTHLY SALES DATAFANCL CORPORATION and Consolidated SubsidiariesFor the years ended March 31
Millions of yen
4th Quarter3rd Quarter2nd Quarter1st Quarter
2005 2004 2005 2004 2005 2004 2005 2004
¥ 21,686
9,069
7,973
4,642
13,308
5,147
3,229
1,645
1,120
1,368
(423)
¥ 275
¥ 4,450
3,860
¥ 20,951
8,870
7,230
4,850
13,070
4,594
3,286
862
1,597
611
(843)
¥ 212
¥ 3,880
3,270
¥ 20,849
8,581
7,505
4,762
13,327
4,438
3,082
(360)
332
1,012
(1,223)
¥ (669)
¥ 3,600
2,870
¥ 22,908
9,389
7,919
5,599
14,929
4,635
3,343
3,240
2,286
1,687
(189)
¥ 1,825
¥ 3,480
2,755
¥ 21,294
8,982
7,619
4,693
12,976
4,914
3,403
430
457
1,118
(622)
¥ (63)
¥ 4,000
3,340
¥ 20,313
8,099
7,386
4,826
12,715
4,332
3,265
1,822
1,495
1,382
(534)
¥ 517
¥ 3,760
3,300
¥ 20,885
8,854
6,844
5,186
13,465
4,315
3,103
3,066
2,168
1,289
127
¥ 1,714
¥ 4,020
3,420
¥ 24,005
10,176
8,307
5,521
15,188
5,410
3,406
2,490
1,569
1,540
(78)
¥ 1,285
¥ 4,050
3,600
Yen
Cosmetics ..............................
YoY increase (decrease) ..........
Nutritional Supplements .....
YoY increase (decrease) ..........
Others ....................................
YoY increase (decrease) ..........
Total ......................................
YoY increase (decrease) ..........
¥ 3,224
5.0%
2,980
3.8%
1,557
(2.6%)
7,762
2.9%
¥ 2,984
3.9%
2,515
10.6%
1,637
14.0%
7,137
8.4%
¥ 2,860
8.4%
2,478
5.0%
1,447
(16.2%)
6,786
0.9%
¥ 3,775
17.4%
3,063
3.8%
1,969
0.7%
8,809
8.5%
¥ 3,516
11.6%
2,702
17.2%
1,907
5.4%
8,127
11.8%
¥ 2,883
(4.5%)
2,541
(4.6%)
1,643
(10.4%)
7,068
(6.0%)
¥ 3,060
9.8%
2,851
8.2%
1,615
(0.1%)
7,527
6.9%
¥ 2,811
14.1%
2,261
3.5%
1,346
(6.1%)
6,419
5.5%
¥ 3,110
9.2%
2,506
(2.3%)
1,731
(2.5%)
7,348
2.2%
¥ 2,920
(1.5%)
2,368
0.4%
1,763
7.0%
7,051
1.1%
¥ 3,094
1.2%
2,467
6.9%
1,710
(6.6%)
7,273
1.0%
¥ 2,855
0.9%
2,394
10.0%
1,376
(19.4%)
6,626
(1.3%)
2004 2005
Mar.Feb.Jan.Dec.Nov.Oct.Sep.Aug.Jul.Jun.MayApr.
MONTHLY SALESMillions of yen
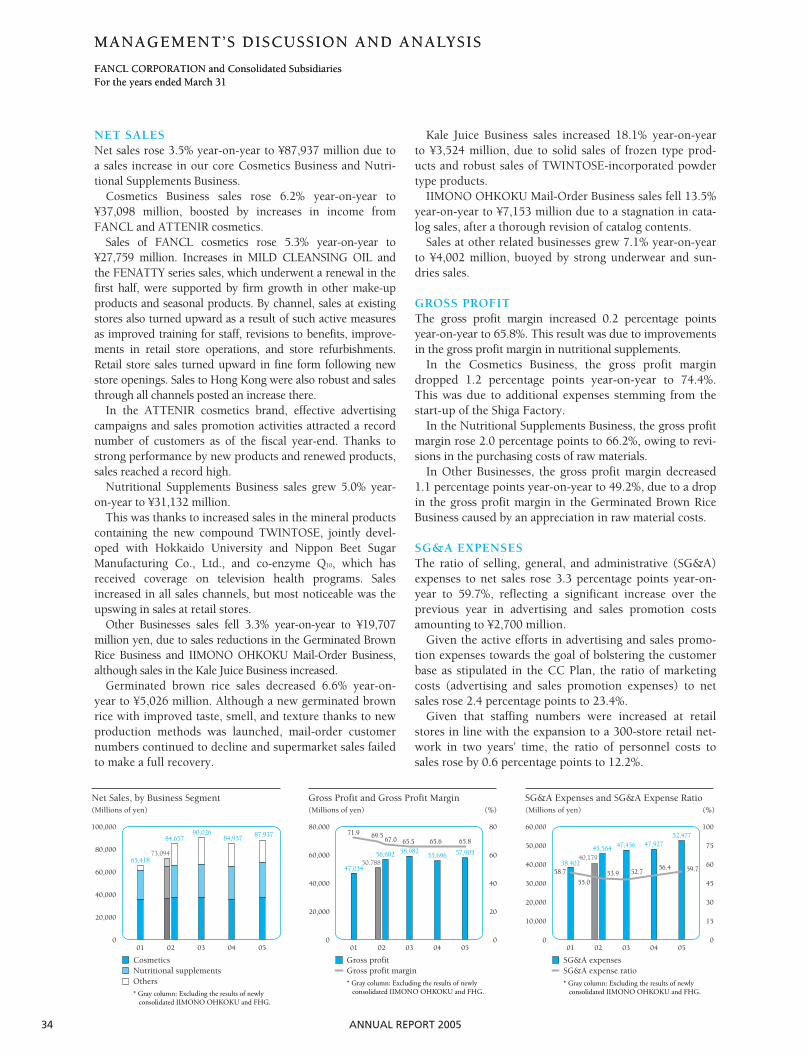
34 ANNUAL REPORT 2005
MANAGEMENT’S DISCUSSION AND ANALYSIS
FANCL CORPORATION and Consolidated SubsidiariesFor the years ended March 31
NET SALES Net sales rose 3.5% year-on-year to ¥87,937 million due toa sales increase in our core Cosmetics Business and Nutri-tional Supplements Business.
Cosmetics Business sales rose 6.2% year-on-year to¥37,098 million, boosted by increases in income fromFANCL and ATTENIR cosmetics.
Sales of FANCL cosmetics rose 5.3% year-on-year to¥27,759 million. Increases in MILD CLEANSING OIL andthe FENATTY series sales, which underwent a renewal in thefirst half, were supported by firm growth in other make-upproducts and seasonal products. By channel, sales at existingstores also turned upward as a result of such active measuresas improved training for staff, revisions to benefits, improve-ments in retail store operations, and store refurbishments.Retail store sales turned upward in fine form following newstore openings. Sales to Hong Kong were also robust and salesthrough all channels posted an increase there.
In the ATTENIR cosmetics brand, effective advertisingcampaigns and sales promotion activities attracted a recordnumber of customers as of the fiscal year-end. Thanks tostrong performance by new products and renewed products,sales reached a record high.
Nutritional Supplements Business sales grew 5.0% year-on-year to ¥31,132 million.
This was thanks to increased sales in the mineral productscontaining the new compound TWINTOSE, jointly devel-oped with Hokkaido University and Nippon Beet SugarManufacturing Co., Ltd., and co-enzyme Q10, which hasreceived coverage on television health programs. Salesincreased in all sales channels, but most noticeable was theupswing in sales at retail stores.
Other Businesses sales fell 3.3% year-on-year to ¥19,707million yen, due to sales reductions in the Germinated BrownRice Business and IIMONO OHKOKU Mail-Order Business,although sales in the Kale Juice Business increased.
Germinated brown rice sales decreased 6.6% year-on-year to ¥5,026 million. Although a new germinated brownrice with improved taste, smell, and texture thanks to newproduction methods was launched, mail-order customernumbers continued to decline and supermarket sales failedto make a full recovery.
Kale Juice Business sales increased 18.1% year-on-yearto ¥3,524 million, due to solid sales of frozen type prod-ucts and robust sales of TWINTOSE-incorporated powdertype products.
IIMONO OHKOKU Mail-Order Business sales fell 13.5%year-on-year to ¥7,153 million due to a stagnation in cata-log sales, after a thorough revision of catalog contents.
Sales at other related businesses grew 7.1% year-on-yearto ¥4,002 million, buoyed by strong underwear and sun-dries sales.
GROSS PROFITThe gross profit margin increased 0.2 percentage pointsyear-on-year to 65.8%. This result was due to improvementsin the gross profit margin in nutritional supplements.
In the Cosmetics Business, the gross profit margindropped 1.2 percentage points year-on-year to 74.4%.This was due to additional expenses stemming from thestart-up of the Shiga Factory.
In the Nutritional Supplements Business, the gross profitmargin rose 2.0 percentage points to 66.2%, owing to revi-sions in the purchasing costs of raw materials.
In Other Businesses, the gross profit margin decreased1.1 percentage points year-on-year to 49.2%, due to a dropin the gross profit margin in the Germinated Brown RiceBusiness caused by an appreciation in raw material costs.
SG&A EXPENSESThe ratio of selling, general, and administrative (SG&A)expenses to net sales rose 3.3 percentage points year-on-year to 59.7%, reflecting a significant increase over theprevious year in advertising and sales promotion costsamounting to ¥2,700 million.
Given the active efforts in advertising and sales promo-tion expenses towards the goal of bolstering the customerbase as stipulated in the CC Plan, the ratio of marketingcosts (advertising and sales promotion expenses) to netsales rose 2.4 percentage points to 23.4%.
Given that staffing numbers were increased at retailstores in line with the expansion to a 300-store retail net-work in two years’ time, the ratio of personnel costs tosales rose by 0.6 percentage points to 12.2%.
Net Sales, by Business Segment
65,41873,094
84,65790,026
84,957 87,937
0
20,000
40,000
60,000
80,000
100,000
01 02 03 04 05
CosmeticsNutritional supplementsOthers
* Gray column: Excluding the results of newly consolidated IIMONO OHKOKU and FHG.
(Millions of yen)
Gross Profit and Gross Profit Margin(%)(Millions of yen)
Gross profitGross profit margin
* Gray column: Excluding the results of newly consolidated IIMONO OHKOKU and FHG.
47,03450,788
56,682 58,982 57,90555,696
71.9 69.567.0 65.5 65.865.6
0
20,000
40,000
60,000
80,000
0
20
40
60
80
01 02 03 04 05
SG&A Expenses and SG&A Expense Ratio(%)(Millions of yen)
* Gray column: Excluding the results of newly consolidated IIMONO OHKOKU and FHG.
SG&A expensesSG&A expense ratio
38,40240,179
45,564 47,456 47,92752,477
58.7 53.955.0
52.756.4 59.7
0
30
15
45
60
100
75
0
10,000
20,000
30,000
40,000
60,000
50,000
01 02 03 04 05
MANAGEMENT’S DISCUSSION AND ANALYSIS
FANCL CORPORATION and Consolidated SubsidiariesFor the years ended March 31

35
OPERATING INCOMEReflecting the aforementioned factors, operating incomedecreased 30.1% year-on-year to ¥5,428 million, and the oper-ating income margin declined 2.9 percentage points to 6.2%.
In the Cosmetics Business, operating income fell 24.5%year-on-year to ¥4,745 million, and the operating incomemargin shrank 5.2 percentage points to 12.8%, due main-ly to the increase in advertising and sales promotionexpenses in accordance with product renewals.
In the Nutritional Supplements Business, operating incomedecreased 13.6% year-on-year to ¥4,638 million, and theoperating income margin slipped 3.2 percentage points to14.9%. Although revisions to costs for raw materials resultedin an improvement in the costs of goods sold ratio, this wasoffset by significant increases in advertising costs to raiseawareness about the new compound TWINTOSE.
Other Businesses posted an operating loss of ¥1,967million, which was ¥146 million larger than the previousfiscal year’s result, reflecting the further expansion oflosses in the IIMONO OHKOKU Mail-Order Business.
OTHER INCOME (EXPENSES)Loss on retirements of inventories deteriorated ¥277 mil-lion from ¥404 million in the previous fiscal year to standat ¥681 million, as old products were disposed of in linewith renewal activities.
Introduction of a new production method for germinat-ed brown rice resulted in a loss on cancellation of leasingcontacts amounting to ¥434 million.
Other, net expenses improved by ¥1,181 million year-on-year to stand at ¥332 million. This was due to the factthat provisions for reserves for retirement allowances fordirectors were made in the previous fiscal year. No suchprovisions were required this year, leading to improve-ment in other, net expenses.
INCOME BEFORE INCOME TAXES Income before income taxes decreased 29.7% year-on-year to ¥4,367 million. Income before income taxes as apercentage of net sales was 5.0%, down 2.3 percentagepoints compared with the previous fiscal year.
NET INCOMEAs a result of the liquidation of deferred tax assets forconsolidated subsidiaries posting a loss, net income fell49.5% year-on-year to ¥1,710 million, and the ratio of netincome to net sales fell 2.1 percentage points to 1.9%.
Net income per share was ¥80.29. As of the end of thefiscal year under review, FANCL had no outstandingunexercised convertible bonds or equity warrants.
ROE fell 2.5 percentage points compared with the previousfiscal year to 2.6%, due to a reduction in net income by half.
ASSETSCurrent AssetsCurrent assets remained almost unchanged from the previ-ous fiscal year at ¥39,080 million. Although cash and cashequivalents decreased, notes and accounts receivable rose.
Cash and cash equivalents decreased by ¥1,254 milliondue to a ¥1,500 million transfer to long-term deposits.Meanwhile notes and accounts receivable and inventoriesrose by ¥932 million and ¥192 million respectively, due tohigher sales.
Property, Plant and Equipment Property, plant and equipment remained almost unchangedfrom the previous fiscal year at ¥26,534 million, and whilethe opening of new stores and refurbishment of existingstores was undertaken actively, this was offset by an absenceof large-scale investment.
Intangible Assets Mainly due to the consolidation of IIMONO OHKOKU Co.,Ltd., the Company posted additional goodwill, which is beingamortized on a straight-line method over a period of five years.
Investments and Other Assets Investments and other assets increased ¥1,599 million to¥13,503 million, reflecting increases in long-term deposits.Investment securities rose ¥1,035 million through theacquisition of unlisted bonds. Other assets rose ¥1,216 mil-lion due to increases in long-term deposits. Meanwhile,long-term loans receivable decreased ¥347 million.
Operating Income and Operating Income Margin(%)(Millions of yen)
* Gray column: Excluding the results of newly consolidated IIMONO OHKOKU and FHG.
13.212.8
9.1
6.2
14.5 13.1
8,632
10,60911,526
7,769
5,428
11,118
0
5,000
10,000
15,000
01 02 03 04 05
Operating incomeOperating income margin
0
5
10
15
Net Income and Net Income to Sales(%)(Millions of yen)
* Gray column: Excluding the results of newly consolidated IIMONO OHKOKU and FHG.
4,867
5,825 5,9956,429
3,387
1,710
7.48.0
7.17.1
4.0
1.9
0
2,000
4,000
6,000
10,000
8,000
01 02 03 04 05
Net incomeNet income to sales
0
2
4
6
10
8
Net Income per Share(Yen)
249.8
154.6
307.6279.5
80.3
0
100
200
300
400
500
01 02 03 04 05

36 ANNUAL REPORT 2005
LIABILITIES Current LiabilitiesCurrent liabilities were almost unchanged from the previ-ous fiscal year at ¥10,458 million. Although outstandingcorporate taxes increased, this was offset by a decrease innotes and accounts payable.
Non-Current Liabilities Non-current liabilities remained basically unchangedfrom the previous fiscal year at ¥2,755 million.
SHAREHOLDERS’ EQUITYTotal Shareholders’ Equity Total shareholders’ equity was ¥66,203 million, up ¥590million compared with the previous year, reflecting netincome of ¥1,710 million.
Capital Investment Capital investment during the fiscal year under reviewtotaled ¥2,257 million including investment in new storesand store refurbishment, increases in production equip-ment and software.
By business segment, capital investment in the CosmeticsBusiness and Nutritional Supplements Business totaled¥1,008 million and ¥498 million, respectively, focusing oninvestment in retail stores. In Other Businesses, ¥749 mil-lion was invested in the acquisition of productionequipment for the Germinated Brown Rice Business at theKagawa Factory (land, buildings and equipment, etc.).
No major equipment was disposed of or sold during theperiod.
CASH FLOWSCash and cash equivalents (“net cash”) at the end of theconsolidated fiscal year totaled ¥22,307 million, down by¥1,254 million year-on-year. The cash flow situations andtheir operative factors were as follows.
Cash Flows from Operating ActivitiesNet cash provided by operating activities increased to¥4,638 million, mainly broken down as ¥4,367 million inincome before income taxes and ¥2,737 million in depre-ciation and amortization, while ¥1,510 million in incometaxes paid represented a decline.
Cash Flows from Investing ActivitiesNet cash used in investing activities declined to ¥4,807million, due mainly to expenditures of ¥1,941 million forthe acquisition of new and revamped shop facilities.
Cash Flows from Financial ActivitiesNet cash used in financial activities declined to ¥1,090 mil-lion, due mainly to cash dividends paid of ¥1,064 million.
In the year ending March 31, 2006, expectations arethat cash used in investing and financial activities will beundertaken within the scope of the increase in cash flowsfrom operating activities.
Shareholders’ equity ratio (%) ...........................................Shareholders’ equity ratio on market-value basis (%) .....Debt repayment period (years) ..........................................Interest coverage ratio ........................................................
Shareholders’ equity ratio: Shareholders’ equity/Total assetsShareholders’ equity ratio on market-value basis: Total market value of stock/Total assets Debt repayment period: Interest-bearing liabilities/Cash flows from operating activities Interest coverage ratio: Cash flows from operating activities/Interest expense
Notes: 1. All indicators are calculated based on consolidated financial figures.2. Total market value of stock is calculated by multiplying the closing share price on the final day of the period by the number of shares issued and outstanding on
the final day of the period, excluding treasury stock.3. Cash flows from operating activities are as stated on the consolidated statements of cash flows. Interest-bearing liabilities include all debt stated on the consolidat-
ed balance sheets on which interest is paid. For interest expense, cash paid for interest on the consolidated statements of cash flows is used.
Years ended March 31
CASH FLOW INDICATORS
0
4
2
6
8
10
01 02 03 04 050
20,000
40,000
60,000
80,000
100,000
75,481 79,026 79,804 78,479 79,4168.5 9.7 9.8
2.6
Total Assets, Shareholders’ Equity and ROE
Total assets Shareholders’ equity ROE
(Millions of yen) (%)
59,48264,719
66,350
65,613 66,203
5.1
0
2,000
4,000
6,000
01 02 03 04 05
Capital Investment and Depreciation
2,695
3,581
4,753 4,864
2,2572,379 2,245 2,2682,556 2,463
Capital investment Depreciation
(Millions of yen)
-10,000
-5,000
0
5,000
10,000
15,000
01 02 03 04 05
Cash Flows
-1,410-2,456
-5,432-4,533
-1,090
5,8614,638
9,828
7,4266,083
-4,838-5,582-5,416
-4,117-4,807
Operating activities Investing activities Financing activities
(Millions of yen)
78.8163.5
0.51152.1
2001
83.695.7
—2,930.5
83.4110.9
——
2005 2004
83.1114.3
0.04756.0
2003
81.9113.5
0.15200.7
2002
37
PRODUCT DEVELOPMENT AND COMPETITIVEENVIRONMENTIn the FANCL Group’s product development, the productplanning and development division is responsible for for-mulating and proposing product planning documentsbased on customer needs and market research. In collabo-ration with related departments such as the CentralResearch Center, it makes final decisions on commercial-ization. At present, the Group develops cosmetics andnutritional supplements using its own technology, butthere is no guarantee that this will result in the successfuldevelopment and new products.
Further, in light of the increasing numbers of womenwith sensitive skin and greater health consciousness, thereare more new entrants into the markets of cosmetics forsensitive skin and nutritional supplements. The appear-ance of similar products could operate to reduce therelative competitiveness of the FANCL lineup and hurtour growth potential and earning capabilities.
PRODUCT MANUFACTURING AND QUALITYASSURANCEThe FANCL Group’s cosmetics, nutritional supplements,and germinated brown rice are manufactured at five direct-ly-managed domestic factories, while kale juice andundergarments production is outsourced to subsidiariesand affiliate companies.
Departments in charge of procurement manage all aspectsof raw materials purchases and, working in cooperation withmarketing departments, diversify purchases among multiplesuppliers and coordinate purchases with suppliers. Never-theless, unanticipated conditions due to external factors maymake it impossible to procure planned quantities.
A quality assurance department has been established toimprove product quality. At quality conferences, it verifiesthe quality control situation with the cognizant depart-ments, and strives to maintain quality by conductingon-site plant inspections and other activities. Nevertheless,if a quality problem arises, it could impact negatively theGroup’s operating results.
DISASTERS AND BAD WEATHERTo minimize the effects of fire and disasters on its productionsystem, the FANCL Group conducts periodic inspections andchecking on all its facilities. Diversification of its plants isintended to reduce risks. Nevertheless, there are no guaran-tees that the impact of fire and disaster can be fully prevented.
The harvest volumes of rice and kale, the raw materialsfor germinated brown rice and kale juice respectively, aresubject to the vagaries of the weather. We, therefore,strive for diversification of producing areas and raw materi-al stockpiling, but weather factors can cause shortages andhigher prices that impact adversely on the Group’s operat-ing results.
LIMITS OF INTELLECTUAL PROPERTY PROTECTIONThe Group is moving forward with securing patent andother rights to its accumulated technology and other intel-lectual property, but this is an area in which the legal basisis not fully prepared and cannot cover all business develop-ment domains. And because it takes at least a year and ahalf from patent application to publication, there is the pos-sibility that there may be development investment intechnology for which other companies have already soughtpatents. In the future, it is possible that other companiesmay publish patents for technologies which the Companyhas already commercialized and involve it in patentinfringement cases.
LEGAL RESTRICTIONSIn the Cosmetic Businesses, there is the PharmaceuticalAffairs Law necessary to assure the quality, effectivenessand safety of pharmaceuticals, over-the-counter medicines,cosmetics, and medical equipment. It is under this legisla-tion that the FANCL Group manufactures and sellscosmetics and related products.
The Nutritional Supplement Business is subject to theFood Sanitation Law, which prescribes food standards, addi-tives, sanitation surveillance, and business permission.Concerning foods for sale, the Nutrition Improvement Lawsets standards for the display of nutritional elements andcaloric values. The Company’s supplements that meet cer-tain requirements are also subject to the regulations of thehealth function food system, which enables consumers toconfidently select foods corresponding to their eating habits.
The Group is also governed by the Specified CommercialTransactions Law, whose objectives are the fair conduct ofmail-order businesses for the protection of consumers, andby the Law for Prevention of Unfair Premiums and UnfairLabeling, intended to prevent customer inducement bythose means.
The Group has established in its administrative head-quarters a department responsible for compliance andmore thoroughgoing observance of laws and regulations.Should violations occur, they may adversely affect theGroup’s operating results.
PERSONAL INFORMATIONThe Group’s use of mail-order and the Internet as its mainsales channels has resulted in the possession of personalinformation about many individuals.
The Group strictly observes the Guidelines for PersonalData Protection prescribed by the Japan Direct MarketingAssociation, has established an all-company committee toreinforce the information control system, and is movingtoward more thoroughgoing employee education. Never-theless, should a leakage of such information occur outsidethe Company, a loss of customer trust could reduce salesand subject the Company to losses from the payment ofliability damages to customers.
BUSINESS RISKS

38 ANNUAL REPORT 2005
Current assets:
Cash and cash equivalents ....................................................................................
Notes and accounts receivable – trade ................................................................
Less: Allowance for doubtful accounts ..........................................................
Inventories (Note 4) ..............................................................................................
Deferred taxes (Note 8) ........................................................................................
Prepaid expenses and other current assets .........................................................
Total current assets ...................................................................................................
Property, plant and equipment, at cost:
Land ........................................................................................................................
Buildings and structures .......................................................................................
Machinery and equipment ....................................................................................
Construction in progress ......................................................................................
Less: Accumulated depreciation ..........................................................................
Property, plant and equipment, net .........................................................................
Intangible assets:
Goodwill .................................................................................................................
Investments and other assets:
Investment securities:
Non-consolidated subsidiaries and affiliates ..................................................
Other ...................................................................................................................
Guarantee deposits ................................................................................................
Long-term loans receivable ..................................................................................
Deferred taxes (Note 8) ........................................................................................
Other assets ............................................................................................................
Less: Allowance for doubtful accounts ................................................................
Total investments and other assets ..........................................................................
Total assets .................................................................................................................
CONSOLIDATED BALANCE SHEETS
FANCL CORPORATION and Consolidated SubsidiariesAs of March 31, 2005 and 2004
¥ 23,561
7,814
(182)
7,632
5,472
683
1,888
39,236
10,848
18,463
9,700
62
39,073
(12,306)
26,767
572
762
2,710
3,472
2,503
1,007
757
4,452
(287)
11,904
¥ 78,479
¥ 22,307
8,714
(150)
8,564
5,664
485
2,060
39,080
10,917
19,419
9,532
4
39,872
(13,338)
26,534
299
898
3,609
4,507
2,527
660
593
5,668
(452)
13,503
¥ 79,416
$ 207,720
81,144
(1,397)
79,747
52,742
4,516
19,182
363,907
101,657
180,827
88,761
37
371,282
(124,201)
247,081
2,784
8,362
33,606
41,968
23,531
6,146
5,522
52,780
(4,209)
125,738
$ 739,510
Thousands ofU.S. dollars
(Note 2)Millions of yen
2004 20052005ASSETS

39
Current liabilities:
Notes and accounts payable – trade ....................................................................
Accrued income taxes (Note 8) ...........................................................................
Other current liabilities .........................................................................................
Total current liabilities ..............................................................................................
Noncurrent liabilities:
Accrued retirement benefits (Note 9) .................................................................
Other long-term liabilities ....................................................................................
Total noncurrent liabilities .......................................................................................
Contingent liabilities (Note 12)
Shareholders’ equity (Notes 6, 7 and 16):
Common stock, with no par value:
Authorized — 77,946,000 shares in 2005 and 2004
Issued — 23,392,200 shares in 2005 and 2004 ......................................
Additional paid-in capital .....................................................................................
Retained earnings ..................................................................................................
Net unrealized holding gain (loss) on other securities ......................................
Translation adjustments .......................................................................................
Less: Treasury stock ..............................................................................................
Total shareholders’ equity .........................................................................................
Total liabilities and shareholders’ equity .................................................................
See notes to consolidated financial statements.
¥ 3,172
1,105
5,745
10,022
2,406
438
2,844
10,795
11,706
50,529
54
(5)
(7,466)
65,613
¥ 78,479
¥ 3,050
1,914
5,494
10,458
2,313
442
2,755
10,795
11,706
51,173
27
(5)
(7,493)
66,203
¥ 79,416
$ 28,401
17,823
51,159
97,383
21,538
4,116
25,654
100,521
109,005
476,516
252
(47)
(69,774)
616,473
$ 739,510
Thousands ofU.S. dollars
(Note 2)Millions of yen
2004 20052005LIABILITIES AND SHAREHOLDERS’ EQUITY
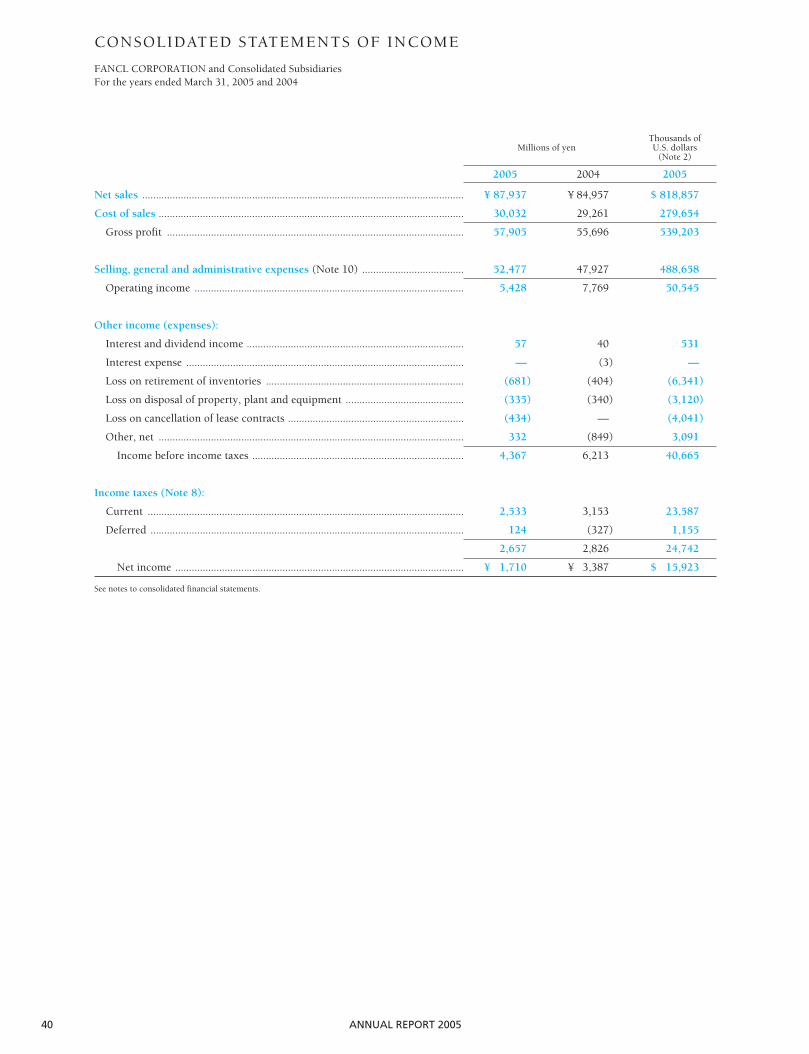
40 ANNUAL REPORT 2005
Net sales .....................................................................................................................
Cost of sales ...............................................................................................................
Gross profit ............................................................................................................
Selling, general and administrative expenses (Note 10) .....................................
Operating income ..................................................................................................
Other income (expenses):
Interest and dividend income ...............................................................................
Interest expense .....................................................................................................
Loss on retirement of inventories ........................................................................
Loss on disposal of property, plant and equipment ...........................................
Loss on cancellation of lease contracts ................................................................
Other, net ...............................................................................................................
Income before income taxes .............................................................................
Income taxes (Note 8):
Current ...................................................................................................................
Deferred ..................................................................................................................
Net income .........................................................................................................
See notes to consolidated financial statements.
CONSOLIDATED STATEMENTS OF INCOME
FANCL CORPORATION and Consolidated SubsidiariesFor the years ended March 31, 2005 and 2004
¥ 84,957
29,261
55,696
47,927
7,769
40
(3)
(404)
(340)
—
(849)
6,213
3,153
(327)
2,826
¥ 3,387
¥ 87,937
30,032
57,905
52,477
5,428
57
—
(681)
(335)
(434)
332
4,367
2,533
124
2,657
¥ 1,710
$ 818,857
279,654
539,203
488,658
50,545
531
—
(6,341)
(3,120)
(4,041)
3,091
40,665
23,587
1,155
24,742
$ 15,923
Thousands ofU.S. dollars
(Note 2)Millions of yen
2004 20052005

41
CONSOLIDATED STATEMENTS OF SHAREHOLDERS’ EQUITY
FANCL CORPORATION and Consolidated SubsidiariesFor the years ended March 31, 2005 and 2004
March 31, 2003 ..............................
Cash dividends ................................
Net income ........................................
Purchase of treasury stock ...............
Translation adjustments ...................
Net unrealized holding gain (loss)
on other securities ........................
March 31, 2004 ................................
Cash dividends ..................................
Directors’ bonuses .............................
Net income ........................................
Purchase of treasury stock ...............
Net unrealized holding gain (loss)
on other securities .........................
March 31, 2005 ................................
¥ 66,350
(885)
3,387
(3,298)
(5)
64
65,613
(1,065)
(1)
1,710
(27)
(27)
¥ 66,203
¥ 10,795
—
—
—
—
—
10,795
—
—
—
—
—
¥ 10,795
Millions of yen
Totalshareholders’
equity
¥ (4,168)
—
—
(3,298)
—
—
(7,466)
—
—
—
(27)
—
¥ (7,493)
Treasurystock
¥ (10)
—
—
—
—
64
54
—
—
—
—
(27)
¥ 27
Netunrealized
holding (loss) gainon other securities
¥ 48,027
(885)
3,387
—
—
—
50,529
(1,065)
(1)
1,710
—
—
¥ 51,173
Retained earnings(Notes 6and 16)
¥ 11,706
—
—
—
—
—
11,706
—
—
—
—
—
¥ 11,706
Additionalpaid-incapital
(Note 6)Amount
23,392
—
—
—
—
—
23,392
—
—
—
—
—
23,392
Number ofshares
Thousands
Common stock
March 31, 2004 ....................................................
Cash dividends .....................................................
Directors’ bonuses ................................................
Net income ............................................................
Purchase of treasury stock ..................................
Sale of treasury stock .........................................
Net unrealized holding gain (loss)
on other securities ............................................
March 31, 2005 ....................................................
See notes to consolidated financial statements.
$ 610,979
(9,917)
(9)
15,923
(252)
—
(251)
$ 616,473
$ 100,521
—
—
—
—
—
—
$ 100,521
Thousands of U.S. dollars (Note 2)
Totalshareholders’
equity
$ (69,522)
—
—
—
(252)
—
—
$ (69,774)
Treasurystock
$ 503
—
—
—
—
—
(251)
$ 252
Netunrealized
holding (loss) gainon other securities
¥ —
—
—
—
(5)
—
(5)
—
—
—
—
—
¥ (5)
Translationadjustments
$ (47)
—
—
—
—
—
—
$ (47)
Translationadjustments
$ 470,519
(9,917)
(9)
15,923
—
—
—
$ 476,516
Retained earnings(Notes 6and 16)
$ 109,005
—
—
—
—
—
—
$ 109,005
Additionalpaid-incapital
(Note 6)Amount
Commonstock

42 ANNUAL REPORT 2005
Cash flows from operating activities:
Income before income taxes .....................................................................................
Adjustments to reconcile income before income taxes to
net cash provided by operating activities:
Depreciation and amortization .............................................................................
Increase in allowance for doubtful accounts ......................................................
Accrued retirement benefits, net of payments ....................................................
Cash surrender value of insurance policies ........................................................
Income from investment in silent partnership ...................................................
Loss on disposal of property, plant and equipment .........................................
Changes in operating assets and liabilities:
Notes and accounts receivable — trade ..........................................................
Inventories .........................................................................................................
Other current assets ..........................................................................................
Accounts payable – trade ..................................................................................
Other current liabilities ....................................................................................
Other noncurrent liabilities ..............................................................................
Income taxes paid ..................................................................................................
Other, net ...............................................................................................................
Net cash provided by operating activities ...............................................................
Cash flows from investing activities:
Increase in fixed-term deposits ................................................................................
Purchases of property, plant and equipment ..........................................................
Purchases of software ................................................................................................
Purchases of stock of affiliates ..................................................................................
Increase in long-term loans receivable ....................................................................
Purchases of investment securities ..........................................................................
Disposition of investment securities ........................................................................
Increase in other investments and other assets ......................................................
Other, net ...................................................................................................................
Net cash used in investing activities ........................................................................
Cash flows from financing activities:
Repayment of long-term debt ...................................................................................
Purchases of treasury stock ......................................................................................
Cash dividends paid ..................................................................................................
Other ...........................................................................................................................
Net cash used in financing activities .......................................................................
Effect of foreign exchange rate changes on cash and cash equivalents ................
Net decrease in cash and cash equivalents ..............................................................
Cash and cash equivalents at beginning of year .....................................................
Cash and cash equivalents at end of year ................................................................
See notes to consolidated financial statements.
CONSOLIDATED STATEMENTS OF CASH FLOWS
FANCL CORPORATION and Consolidated SubsidiariesFor the years ended March 31, 2005 and 2004
¥ 6,213
2,828
8
916
296
(150)
325
406
(369)
(228)
(168)
811
(142)
(4,954)
(69)
5,861
—
(3,341)
(584)
(118)
48
—
2
(208)
84
(4,117)
(350)
(3,298)
(885)
—
(4,533)
(20)
(2,809)
26,370
¥ 23,561
¥ 4,367
2,737
132
(1)
439
(160)
534
(899)
(192)
(339)
(123)
(342)
(67)
(1,510)
62
4,638
(1,500)
(1,703)
(238)
(226)
(185)
(840)
115
(330)
100
(4,807)
—
(27)
(1,064)
1
(1,090)
5
(1,254)
23,561
¥ 22,307
$ 40,665
25,487
1,229
(9)
4,088
(1,490)
4,973
(8,371)
(1,788)
(3,157)
(1,145)
(3,185)
(624)
(14,061)
577
43,188
(13,968)
(15,858)
(2,216)
(2,104)
(1,723)
(7,822)
1,071
(3,073)
931
(44,762)
—
(251)
(9,908)
9
(10,150)
47
(11,677)
219,397
$ 207,720
Thousands ofU.S. dollars
(Note 2)Millions of yen
2004 20052005

43
(A) BASIS OF PREPARATION
FANCL CORPORATION (the “Company”) and its consol-
idated subsidiaries (collectively the “Group”) maintain
their books of accounts in accordance with accounting
standards generally accepted in Japan, and its foreign sub-
sidiaries maintain their books of accounts in conformity
with those of their countries of domicile. The accompany-
ing consolidated financial statements have been prepared
in accordance with accounting principles generally accept-
ed in Japan, which are different in certain respects as to the
application and disclosure requirements of International
Financial Reporting Standards, and have been compiled
from the consolidated financial statements prepared by the
Company as required by the Securities and Exchange Law
of Japan. Certain reclassifications have been made to pres-
ent the accompanying consolidated financial statements in
a format which is familiar to readers outside Japan. Cer-
tain amounts from prior years have been reclassified to
conform to the current year’s presentation.
(B) BASIS OF CONSOLIDATION
The accompanying consolidated financial statements
include the accounts of the Company and all its sub-
sidiaries over which substantial control is exerted
through either majority ownership of voting stock and/or
by other means. All significant intercompany balances
and transactions have been eliminated in consolidation.
Investments in non-consolidated subsidiaries and affiliates
(companies over which the Company has the ability to
exercise significant influence) are stated at cost because of
their immateriality.
All assets and liabilities of the subsidiaries are revalued
at their respective fair value upon acquisition, if applica-
ble, and the excess of cost over underlying net assets at
the date of acquisition is amortized over a period of five
years on a straight-line basis.
(C) FOREIGN CURRENCY TRANSLATION
All assets and liabilities denominated in foreign currencies
of the Company and the domestic consolidated sub-
sidiaries are translated at the current exchange rates in
effect at each balance sheet date when not hedged by for-
ward foreign exchange contracts, or at the contracted rates
of exchange when hedged by forward foreign exchange
contracts. The resulting foreign exchange gain or loss is
recognized as other income or expense.
Assets and liabilities of a foreign consolidated sub-
sidiary are translated at the current exchange rates in
effect at each balance sheet date and its revenue and
expense accounts are translated at the average rate of
exchange in effect during the year.
Translation adjustments are presented as a component
of shareholders’ equity in the accompanying consolidated
financial statements.
(D) CASH EQUIVALENTS
All highly liquid investments, generally with a maturity
of three months or less when purchased, which are readi-
ly convertible into known amounts of cash and which are
so near maturity that they represent only an insignificant
risk of any change in their value attributable to changes
in interest rates, are considered cash equivalents.
(E) SECURITIES
All securities owned by the Company and consolidated
subsidiaries are available for sale and classified as “other”
securities, which is one of three categories (trading, held-
to-maturity and other) defined in the accounting standard
for financial instruments.
Other securities with quoted market prices are carried at
fair market value. The difference between the acquisition
cost and the carrying value of other securities, including
unrealized holding gain or loss, is recognized as a compo-
nent of shareholders’ equity as is reflected as “Net unrealized
holding gain (loss) on other securities.” The cost of other
securities sold has been computed based on the average
method. Other securities without quoted market prices are
stated at cost based on the average method.
(F) INVENTORIES
Finished goods, merchandise, work in process and raw
materials are stated at cost by the average method. Supplies
are stated at cost by the last purchase price method.
(G) DEPRECIATION AND AMORTIZATION
Depreciation of property, plant and equipment of the
NOTES TO CONSOLIDATED FINANCIAL STATEMENTS
FANCL CORPORATION and Consolidated SubsidiariesFor the years ended March 31, 2005
1. SUMMARY OF SIGNIFICANT ACCOUNTING POLICIES

44 ANNUAL REPORT 2005
Company and consolidated subsidiaries is calculated pri-
marily by the declining-balance method based on the
estimated useful lives of the respective assets. However,
buildings (excluding structures attached to the buildings)
acquired on or after April 1, 1998 by the Company and
the consolidated subsidiaries have been depreciated by the
straight-line method. The following summarizes the esti-
mated useful lives of property, plant and equipment by
major category:
Buildings and structures 3 — 50 years
Machinery and equipment 2 — 22 years
Intangible assets are amortized by the straight-line
method. The cost of software intended for internal use is
amortized by the straight-line method over an estimated
useful life of 5 years.
(H) LEASES
Finance leases other than those which transfer the owner-
ship of the leased assets to the lessee are not capitalized,
but are accounted for by a method similar to that applica-
ble to operating leases.
( I ) RESEARCH AND DEVELOPMENT EXPENSES
Research and development expenses are charged to
income when incurred.
( J ) ALLOWANCE FOR DOUBTFUL ACCOUNTS
The allowance for doubtful accounts is provided at an
amount sufficient to cover possible losses on the collection
of receivables, and is determined based on historical write-
off experience with write-offs plus an estimated amount
for probable doubtful accounts after a review of the
collectibility of individual receivables.
(K) ALLOWANCE FOR EMPLOYEES’ BONUSES
The allowance for employees’ bonuses represents a provi-
sion for the future payment of employees’ bonuses.
(L) RETIREMENT BENEFITS
Employees with three years or more of service are generally
entitled to receive a lump-sum payment upon termination
of employment with the Company, the amount of which
is determined by reference to their basic rate of pay,
length of service and the conditions under which the ter-
mination occurs.
The Company participates in a contributory defined
benefit pension plan which entitles employees of the
Company upon retirement at age 60 or more to either a
lump-sum payment or pension annuity payments for life,
or a combination of both, based on their length of serv-
ice, salary at the time of retirement and number of years
of participation in the plan.
Accrued retirement benefits for employees have been
provided based on an estimate of the retirement benefit
obligation and the pension fund assets.
Unrecognized actuarial net loss is amortized by the
straight-line method over 5 years which fall within the
average remaining years of service of the active participants
in the plan when incurred commencing the following year.
The Company also provides an accrual for retirement
allowances for directors and statutory auditors at the full
amount which would be required to be paid if all directors
and statutory auditors retired at the balance sheet date
based on the Company’s internal regulations.
(M) STOCK ISSUANCE EXPENSES
Stock issuance expenses are charged to income when
incurred.
(N) INCOME TAXES
Deferred income taxes are recognized by the liability
method. Under the liability method, deferred tax assets
and liabilities are determined based on the difference
between financial reporting and the tax bases of the assets
and liabilities, and are measured using the enacted tax
rates and laws which will be in effect when the differences
are expected to reverse.
(O) DERIVATIVE FINANCIAL INSTRUMENTS
Derivative financial instruments are carried at fair value
with any changes in unrealized gain or loss charged or
credited to operations, except for those which meet the
criteria for deferral hedge accounting under which unreal-
ized gain or loss is deferred as an asset or a liability.
Forward foreign exchange contracts which meet certain
criteria are accounted for by the allocation method used to
hedge against risk arising from fluctuation in foreign
exchange rates.

45
The Group does not make an assessment of the effec-
tiveness of its hedging activities because the relationship
between the anticipated cash flows fixed by hedging
activities and the avoidance of market risk is so clear that
there is no need to evaluate the effectiveness of each
hedge against the respective underlying hedged item.
(P) APPROPRIATION OF RETAINED EARNINGS
Under the Commercial Code of Japan, the appropriation
of retained earnings with respect to a given financial peri-
od is made by resolution of the shareholders at a general
meeting held subsequent to the close of such financial
period. The accounts for that period do not, therefore,
reflect such appropriations. See Note 15.
For the convenience of the reader, the accompanying
financial statements with respect to the year ended March
31, 2005 have been presented in U.S. dollars by translating
all yen amounts at ¥107.39 = US$1.00, the exchange rate
prevailing on March 31, 2005. This translation should not
be construed as a representation that yen have been, could
have been, or could in the future be, converted into U.S.
dollars at the above or any other rate.
2. U.S. DOLLAR AMOUNTS
3. MARKETABLE AND INVESTMENT SECURITIES
Information regarding marketable and investment securities with quoted market prices classified as other securities at
March 31, 2005 and 2004 is summarized as follows:
Securities whose carrying value exceeds their acquisition cost:Stock .......................................................
Total ............................................................$ 419$ 419
¥ 66¥ 66
Unrealized gain(loss)
$ 1,034$ 1,034
Carrying value
$ 615$ 615
Acquisition cost
¥ 45¥ 45
Unrealized gain(loss)
¥ 111¥ 111
Carrying valueAcquisition costAt of March 31, 2005
Millions of yen Thousands of U.S. dollars
Securities whose acquisition cost exceeds their carrying value:Stock ...........................................................
Total ................................................................¥ 124¥ 124
Millions of yen
¥ 92¥ 92
Unrealized gain(loss)
¥ 216¥ 216
Carrying valueAcquisition costAt of March 31, 2004
Current assets:Money management funds ...................................................................................Free financial funds ...............................................................................................Commercial paper .................................................................................................
Noncurrent assets:Unlisted stocks (excluding securities traded over-the-counter) ...........................Unlisted foreign bonds .........................................................................................
¥ 4,726¥ 3,006
¥ 91
¥ 7,823
¥ 3,927
1,000
130800
¥ 5,857
$ 36,565
9,311
1,2157,449
$ 54,540
Thousands ofU.S. dollarsMillions of yen
2004 20052005
Other securities without quoted market prices at March 31, 2005 and 2004 are summarized as follows:
Carrying value

46 ANNUAL REPORT 2005
5. SHAREHOLDERS’ EQUITY
The Commercial Code of Japan provides that an amount
equal to at least 10% of the amounts to be disbursed as
distributions of earnings be appropriated to the legal
reserve until such reserve and additional paid-in capital
equals 25% of the common stock account. The Code also
stipulates that, to the extent that the sum of the additional
paid-in capital account and the legal reserve exceeds 25%
of the common stock account, the amount of any such
excess is available for appropriation by resolution of the
shareholders.
6. STOCK OPTION PLANS
On June 28, 1999, the shareholders approved a stock
option plan to grant warrants to purchase shares of the
Company’s common stock to the 4 directors and 42
employees of the Company in accordance with the Com-
mercial Code of Japan. Under the plan, the maximum
number of 166,920 shares were granted.
The price was set at ¥16,540 per stock option.
As outlined in the Company’s stock option plan, this
exercise price will be adjusted in accordance with a speci-
fied formula for stock splits, reverse stock splits or for
other cases.
The stock options became exercisable during the period
from June 29, 2001 through June 28, 2009.
On June 24, 2000, the shareholders approved a stock
option plan to grant warrants to purchase shares of the
Company’s common stock to 225 employees in accor-
dance with the Commercial Code of Japan. Under the
plan, a maximum of 96,720 shares were granted to the
employees of the Company.
The price was set at ¥13,667 per stock option.
As outlined in the Company’s stock option plan, this
exercise price will be adjusted in accordance with a speci-
fied formula for stock splits, reverse stock splits or for
other cases.
The stock options became exercisable during the period
from July 1, 2002 through June 30, 2005.
On June 16, 2002, the shareholders of the Company
approved a stock option plan to grant warrants to pur-
chase shares of the Company’s common stock to directors,
statutory auditors and employees of the Company and its
subsidiaries in accordance with the Commercial Code of
Japan. Under the plan, a maximum of 396,100 shares
were granted to the individuals referred to above.
The price was set at ¥4,100 per stock option.
As outlined in the Company’s stock option plan, this
exercise price will be adjusted in accordance with a speci-
fied formula for stock splits, reverse stock splits or for
other cases.
4. INVENTORIES
Inventories at March 31, 2005 and 2004 consisted of the following:
Merchandise ...............................................................................................................
Finished goods ...........................................................................................................
Raw materials .............................................................................................................
Work in process .........................................................................................................
Supplies ......................................................................................................................
¥ 478
2,051
2,168
491
284
¥ 5,472
¥ 556
1,888
2,306
662
252
¥ 5,664
$ 5,183
17,581
21,472
6,161
2,345
$ 52,742
Thousands ofU.S. dollarsMillions of yen
2004 20052005

47
7. INCOME TAXES
Income taxes applicable to the Company and consolidat-
ed subsidiaries comprise corporation tax, inhabitants’
taxes and enterprise tax which, in the aggregate, resulted
in a statutory tax rate of approximately 42% for 2005 and
2004. The effective tax rates reflected in the accompany-
ing consolidated statements of income differ from the
statutory tax rate primarily due to the effect of permanent
nondeductible expenses for tax purposes.
The significant components of deferred tax assets and
liabilities at March 31, 2005 and 2004 were as follows:
The stock options became exercisable during the period
from July 1, 2004 through June 29, 2007.
On June 19, 2004, the shareholders of the Company
approved a stock option plan to grant warrants to pur-
chase shares of the Company’s common stock to directors
and employees of the Company and its subsidiaries in
accordance with the Commercial Code of Japan. Under
the plan, a maximum of 623,800 shares were granted to
the individuals referred to above.
The price was set at ¥3,650 per stock option.
As outlined in the Company’s stock option plan, this
exercise price will be adjusted in accordance with a speci-
fied formula for stock splits, reverse stock splits or for
other cases.
The stock options will become exercisable during the
period from July 3, 2006 through June 30, 2009.
Deferred tax assets:
Accrued enterprise taxes .......................................................................................
Accrued bonuses ....................................................................................................
Allowance for doubtful accounts .........................................................................
Accrued severance benefits ...................................................................................
Depreciation ...........................................................................................................
Net loss carried forward ........................................................................................
Other .......................................................................................................................
Valuation allowance ............................................................................................
Deferred tax liabilities:
Unrealized intercompany profit on land .............................................................
Unrealized revaluation gain on land with respect to acquisition
of IIMONO OHKOKU Co., Ltd. ...........................................................................
Other .......................................................................................................................
Net deferred tax assets ..........................................................................................
¥ 109
311
139
927
52
160
343
2,041
(77)
1,964
232
165
127
524
¥ 1,440
¥ 170
318
128
915
66
593
205
2,395
(791)
1,604
232
165
129
526
¥ 1,078
$ 1,583
2,961
1,192
8,520
615
5,522
1,909
22,302
(7,366)
14,936
2,160
1,537
1,201
4,898
$ 10,038
Thousands ofU.S. dollarsMillions of yen
2004 20052005

48 ANNUAL REPORT 2005
Projected benefit obligation .................................................................................
Fair value of plan assets .......................................................................................
Funded status ......................................................................................................
Unrecognized actuarial net loss ...........................................................................
Net retirement benefit obligation ........................................................................
Prepaid pension cost .................................................................................................
Accrued retirement benefits .....................................................................................
¥ 1,566
(492)
1,074
(102)
972
224
¥ 1,196
¥ 1,451
(530)
921
0
921
274
¥ 1,195
$ 13,509
(4,934)
8,575
3
8,578
2,547
$ 11,125
Thousands ofU.S. dollarsMillions of yen
2004 20052005
Service cost – benefits earned during the year ....................................................
Interest cost on projected benefit obligation .......................................................
Expected return on plan assets ............................................................................
Amortization of unrecognized actuarial net loss .................................................
Contributions to welfare pension fund ...............................................................
Special additional retirement payment ................................................................
Retirement benefit expenses .....................................................................................
¥ 185
18
(8)
47
175
—
¥ 417
¥ 179
19
(11)
42
193
127
¥ 549
$ 1,670
176
(103)
387
1,799
1,186
$ 5,115
Thousands ofU.S. dollarsMillions of yen
2004 20052005
8. RETIREMENT BENEFITS
The Company and consolidated subsidiaries have defined
benefit pension plans and lump-sum retirement payment
plans which cover substantially all employees who termi-
nate their employment. In addition to these plans, the
Company and its consolidated subsidiaries (except for
one consolidated subsidiary) participate in the multi-
employer welfare pension fund (the “Fund”) under the
Welfare Pension Insurance Law of Japan.
The funded status of the defined benefit pension plans
for the years ended March 31, 2005 and 2004 is summa-
rized as follows:
The consolidated subsidiaries have adopted a simplified
method permitted for the calculation of the projected
benefit obligation.
Retirement allowances for directors and statutory audi-
tors in the amount of ¥1,117 million ($10,401 thousand)
and ¥1,210 million have been included in accrued retire-
ment benefits in the consolidated balance sheets at March
31, 2005 and 2004, respectively.
Retirement benefit expenses for the years ended March
31, 2005 and 2004 were composed of the following:
In the table above, retirement benefit expenses deter-
mined by a simplified method at the consolidated
subsidiaries have been included in the service cost – ben-
efits earned during each year.
The Company and consolidated subsidiaries have
accounted for the contributions to the Fund as retirement
benefit expenses. This accounting treatment is permitted
under the accounting standard for retirement benefits
because it is difficult for the Company and the consolidat-
ed subsidiaries to reasonably calculate the value of the
pension plan assets based on their contributions.
The assumptions used in the actuarial calculation other
than those stated above for the years ended March 31,
2005 and 2004 were principally as follows:
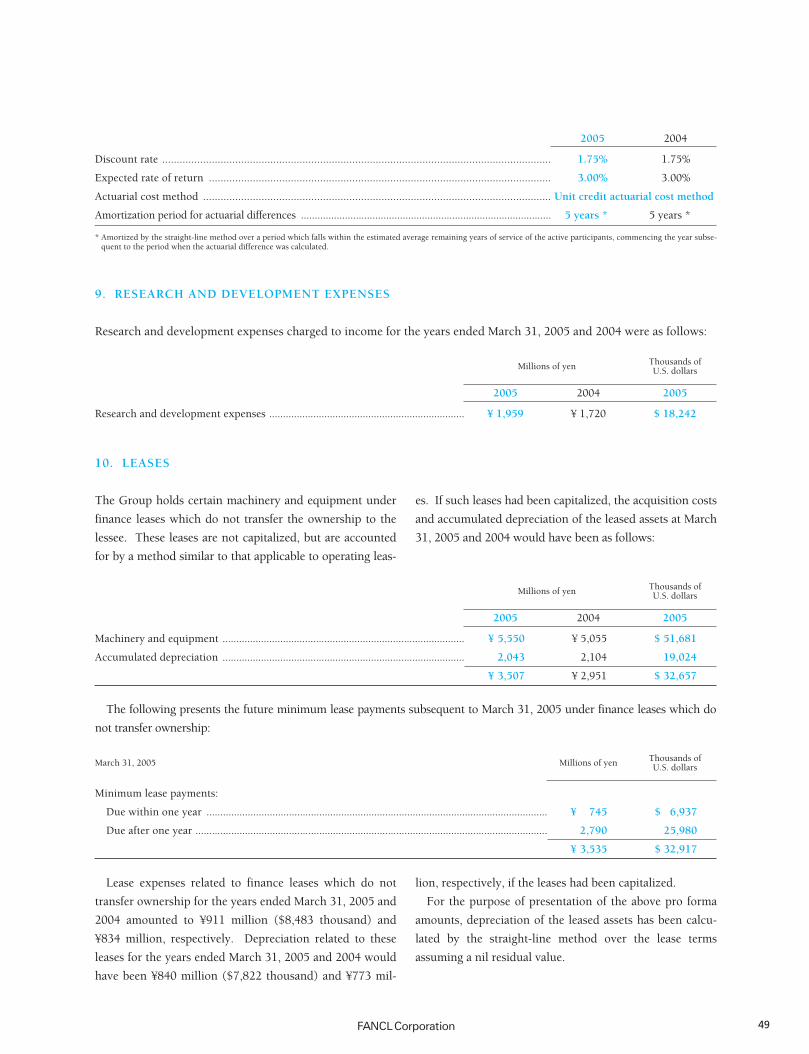
49
Discount rate .....................................................................................................................................
Expected rate of return .....................................................................................................................
Actuarial cost method .......................................................................................................................
Amortization period for actuarial differences ...........................................................................................
* Amortized by the straight-line method over a period which falls within the estimated average remaining years of service of the active participants, commencing the year subse-quent to the period when the actuarial difference was calculated.
1.75%
3.00%
5 years *
1.75%
3.00%
5 years *
20042005
Research and development expenses ....................................................................... ¥ 1,720¥ 1,959 $ 18,242
Thousands ofU.S. dollarsMillions of yen
2004 20052005
9. RESEARCH AND DEVELOPMENT EXPENSES
Research and development expenses charged to income for the years ended March 31, 2005 and 2004 were as follows:
Machinery and equipment ........................................................................................
Accumulated depreciation ........................................................................................
¥ 5,055
2,104
¥ 2,951
¥ 5,550
2,043
¥ 3,507
$ 51,681
19,024
$ 32,657
Thousands ofU.S. dollarsMillions of yen
2004 20052005
10. LEASES
The Group holds certain machinery and equipment under
finance leases which do not transfer the ownership to the
lessee. These leases are not capitalized, but are accounted
for by a method similar to that applicable to operating leas-
es. If such leases had been capitalized, the acquisition costs
and accumulated depreciation of the leased assets at March
31, 2005 and 2004 would have been as follows:
Minimum lease payments:
Due within one year ............................................................................................................................
Due after one year ................................................................................................................................
¥ 745
2,790
¥ 3,535
$ 6,937
25,980
$ 32,917
Thousands ofU.S. dollarsMillions of yenMarch 31, 2005
The following presents the future minimum lease payments subsequent to March 31, 2005 under finance leases which do
not transfer ownership:
Lease expenses related to finance leases which do not
transfer ownership for the years ended March 31, 2005 and
2004 amounted to ¥911 million ($8,483 thousand) and
¥834 million, respectively. Depreciation related to these
leases for the years ended March 31, 2005 and 2004 would
have been ¥840 million ($7,822 thousand) and ¥773 mil-
lion, respectively, if the leases had been capitalized.
For the purpose of presentation of the above pro forma
amounts, depreciation of the leased assets has been calcu-
lated by the straight-line method over the lease terms
assuming a nil residual value.
Unit credit actuarial cost method

50 ANNUAL REPORT 2005
Net income
— Basic ...................................................................................................................
— Diluted ...............................................................................................................
Net assets ....................................................................................................................
¥ 154.57
—
¥ 3,082.47
¥ 80.29
80.23
¥ 3,111.15
$ 0.75
0.75
$ 28.97
U.S. dollarsYen
2004 20052005
12. AMOUNTS PER SHARE
In accordance with a new accounting standard for earn-
ings per share which became effective April 1, 2002, basic
net income per share is computed based on the net
income available for distribution to shareholders of com-
mon stock and the weighted- average number of shares of
common stock outstanding during each year. Diluted net
income per share is computed based on the net income
available for distribution to the shareholders and the
weighted -average number of shares of common stock
outstanding during each year assuming full dilution of
common stock equivalents. Net assets per share is also
computed based on the weighted -average number of
shares of common stock outstanding during each year.
Since there were no potentially dilutive convertible bonds
or warrants outstanding as of 2004, diluted net income
per share has not been presented.
13. DERIVATIVE AND HEDGING ACTIVITIES
The Company utilizes derivative financial instruments
such as forward foreign exchange contracts for the pur-
pose of hedging its exposure to adverse fluctuations in
foreign currency exchange rates, but does not enter into
such transactions for speculative or trading purposes.
The Company may from time to time enter into forward
foreign exchange contracts in order to manage certain
risks arising from adverse fluctuations in the exchange
transactions. The Company has implemented internal
regulations under which they will so hedge any significant
exchange risks.
No specific disclosure for derivatives has been made as
the Company’s positions principally meet the criteria for
deferral hedge accounting.
11. CONTINGENT LIABILITIES
Contingent liabilities as of March 31, 2005 amounted to
¥2,481 million ($23,103 thousand) and represented guar-
antees of borrowings incurred by the nineteen industrial
corporations (including the Company) which are mem-
bers of the Nagareyama Industrial Cooperative Association
(the “Association”) for the purposes of financing their
purchases of manufacturing and other facilities located in
the Nagareyama City area and the land upon which such
facilities are situated. The Company has guaranteed such
borrowings jointly and severally with the other eighteen
members of the Association.
In addition to the guarantees stated above, the land of
¥591 million ($5,503 thousand) and the plant of ¥1,809
million ($16,845 thousand) located in the Nagareyama
area were pledged as collateral for the above borrowings.

51
I. Sales and operating income
Sales to external customers .....................
Intersegment sales or transfers ...............
Total sales .................................................
Operating expenses ..................................
Operating income (loss) ..........................
II. Total assets, depreciation and
capital expenditures
Total assets ...............................................
Depreciation .............................................
Capital expenditures ................................
¥ 87,937
—
87,937
82,509
¥ 5,428
¥ 79,416
2,463
2,257
¥ 37,098
—
37,098
32,353
¥ 4,745
¥ 26,174
1,322
1,008
Millions of yen
Consolidated
¥ —
—
—
1,988
¥ (1,988)
¥ 25,659
92
—
Eliminationsor corporate
¥ 87,937
—
87,937
80,521
¥ 7,416
¥ 53,757
2,371
2,257
Total
¥ 19,707
—
19,707
21,674
¥ (1,967)
¥ 14,199
527
750
Other businesses
¥ 31,132
—
31,132
26,494
¥ 4,638
¥ 13,384
522
499
Nutritional supplements
business
Cosmetics businessYear ended March 31, 2005
14. SEGMENT INFORMATION
The Company and consolidated subsidiaries are primari-
ly engaged in the manufacture and sales of products
mainly in Japan in three segments: a cosmetics business
in which various cosmetics are sold through wholesalers
and stores and by mail, a nutritional supplements busi-
ness in which various supplements are sold through
The business segment information of the Company and consolidated subsidiaries for the years ended March 31, 2005 and 2004 is
summarized as follows:
BUSINESS SEGMENTS
wholesalers and stores and by mail, and other business
which includes sales of miscellaneous goods, personal
ornaments, underwear, medical and health products,
housewares, germinated brown rice, kale juice and etc.
This segmentation has been adopted for internal manage-
ment purposes.
I. Sales and operating income
Sales to external customers .....................
Intersegment sales or transfers ...............
Total sales .................................................
Operating expenses ..................................
Operating income (loss) ..........................
II. Total assets, depreciation and
capital expenditures
Total assets ...............................................
Depreciation .............................................
Capital expenditures ................................
¥ 84,957
—
84,957
77,188
¥ 7,769
¥ 78,479
2,556
4,864
¥ 34,926
—
34,926
28,643
¥ 6,283
¥ 24,733
1,241
3,826
Millions of yen
Consolidated
¥ —
—
—
2,064
¥ (2,064)
¥ 28,391
109
182
Eliminationsor corporate
¥ 84,957
—
84,957
75,124
¥ 9,833
¥ 50,088
2,447
4,682
Total
¥ 20,375
—
20,375
22,196
¥ (1,821)
¥ 13,468
600
297
Other businesses
¥ 29,656
—
29,656
24,285
¥ 5,371
¥ 11,887
606
559
Nutritional supplements
business
Cosmetics businessYear ended March 31, 2004
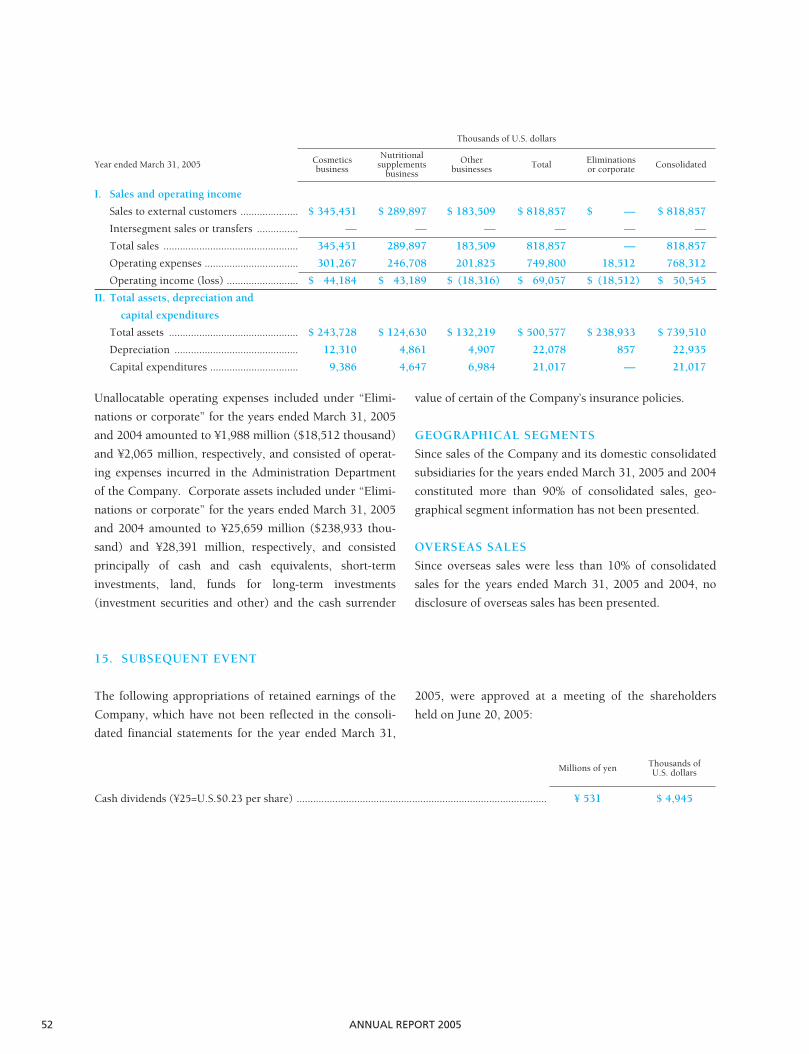
52 ANNUAL REPORT 2005
Unallocatable operating expenses included under “Elimi-
nations or corporate” for the years ended March 31, 2005
and 2004 amounted to ¥1,988 million ($18,512 thousand)
and ¥2,065 million, respectively, and consisted of operat-
ing expenses incurred in the Administration Department
of the Company. Corporate assets included under “Elimi-
nations or corporate” for the years ended March 31, 2005
and 2004 amounted to ¥25,659 million ($238,933 thou-
sand) and ¥28,391 million, respectively, and consisted
principally of cash and cash equivalents, short-term
investments, land, funds for long-term investments
(investment securities and other) and the cash surrender
value of certain of the Company’s insurance policies.
GEOGRAPHICAL SEGMENTS
Since sales of the Company and its domestic consolidated
subsidiaries for the years ended March 31, 2005 and 2004
constituted more than 90% of consolidated sales, geo-
graphical segment information has not been presented.
OVERSEAS SALES
Since overseas sales were less than 10% of consolidated
sales for the years ended March 31, 2005 and 2004, no
disclosure of overseas sales has been presented.
The following appropriations of retained earnings of the
Company, which have not been reflected in the consoli-
dated financial statements for the year ended March 31,
2005, were approved at a meeting of the shareholders
held on June 20, 2005:
15. SUBSEQUENT EVENT
Cash dividends (¥25=U.S.$0.23 per share) ........................................................................................... ¥ 531 $ 4,945
Thousands ofU.S. dollarsMillions of yen
I. Sales and operating income
Sales to external customers .....................
Intersegment sales or transfers ...............
Total sales .................................................
Operating expenses ..................................
Operating income (loss) ..........................
II. Total assets, depreciation and
capital expenditures
Total assets ...............................................
Depreciation .............................................
Capital expenditures ................................
$ 818,857
—
818,857
768,312
$ 50,545
$ 739,510
22,935
21,017
$ 345,451
—
345,451
301,267
$ 44,184
$ 243,728
12,310
9,386
Thousands of U.S. dollars
Consolidated
$ —
—
—
18,512
$ (18,512)
$ 238,933
857
—
Eliminationsor corporate
$ 818,857
—
818,857
749,800
$ 69,057
$ 500,577
22,078
21,017
Total
$ 183,509
—
183,509
201,825
$ (18,316)
$ 132,219
4,907
6,984
Other businesses
$ 289,897
—
289,897
246,708
$ 43,189
$ 124,630
4,861
4,647
Nutritional supplements
business
Cosmetics businessYear ended March 31, 2005

53
REPORT OF INDEPENDENT AUDITORS
THE BOARD OF DIRECTORS
FANCL CORPORATION
We have audited the accompanying consolidated balance sheets of FANCL CORPORATION and consolidated sub-
sidiaries as of March 31, 2005 and 2004, and the related consolidated statements of income, shareholders’ equity, and
cash flows for the years then ended, all expressed in yen. These financial statements are the responsibility of the Com-
pany’s management. Our responsibility is to express an opinion on these financial statements based on our audits.
We conducted our audits in accordance with auditing standards generally accepted in Japan. Those standards require
that we plan and perform the audit to obtain reasonable assurance about whether the financial statements are free of
material misstatement. An audit includes examining, on a test basis, evidence supporting the amounts and disclosures
in the financial statements. An audit also includes assessing the accounting principles used and significant estimates
made by management, as well as evaluating the overall financial statement presentation. We believe that our audits
provide a reasonable basis for our opinion.
In our opinion, the financial statements referred to above present fairly, in all material respects, the consolidated
financial position of FANCL CORPORATION and consolidated subsidiaries at March 31, 2005 and 2004, and the con-
solidated results of their operations and their cash flows for the years then ended in conformity with accounting
principles generally accepted in Japan.
The U.S. dollar amounts in the accompanying consolidated financial statements with respect to the year ended March
31, 2005 are presented solely for convenience. Our audit also included the translation of yen amounts into U.S. dollar
amounts and, in our opinion, such translation has been made on the basis described in Note 2.
June 20, 2005

54 ANNUAL REPORT 2005
SHAREHOLDER INFORMATION
High (¥) .......................
Low (¥) ........................
Trading volume
(Thousand shares) .....
4,450
3,980
1,236
4,100
3,870
996
4,170
3,860
824
3,970
3,670
1,000
3,950
3,600
912
4,050
3,720
1,350
4,000
3,510
1,472
3,670
3,480
1,183
3,700
3,340
930
3,710
3,500
1,094
3,800
3,270
1,202
3,880
3,470
1,339
2004 2005
Mar.Feb.Jan.Dec.Nov.Oct.Sep.Aug.Jul.Jun.MayApr.
MARKET PRICE RANGE PER SHARE OF COMMON STOCK, AND TRADING VOLUME
Monthly Stock Data
8,000
7,000
6,000
5,000
4,000
3,000
2,000
20,000
15,000
10,000
5,000
0
1,000
0
1,600
1,400
1,200
1,000
800
600
400
200
0
TOPIX close (points) Monthly stock price range (yen)
Monthly trading volume (thousand shares)
05/305/204/1204/1004/8 04/6 04/4
04/3 04/2 03/1203/1003/8 03/6 03/4
03/3 03/2 02/1202/1002/8 02/6 02/4
COMPOSITION OF SHAREHOLDERS(Percentage of ownership)
Individuals and other ....
Financial institutions .....
Foreign investors ...........
Treasury stock ................
Other domestic investors
Securities companies .....
59.2
16.5
12.9
9.0
2.0
0.4
62.4
16.3
9.5
9.0
2.1
0.7
58.2
18.0
12.5
9.0
2.0
0.3
Sep. Mar.
2005
Mar.
62.7
19.4
9.5
6.3
0.7
1.4
Sep.
61.6
21.8
10.5
4.7
0.7
0.7
Mar.
2003 2004
As of March 31, 2005
58.2%Individuals and other
18.0% Financial institutions
12.5%Foreign investors
9.0%Treasury stock
2.0%Other domestic investors
0.3%Securities companies

55
CORPORATE INFORMATION(As of March 31, 2005)
HEAD OFFICE
89-1 Yamashita-cho, Naka-ku, Yokohama,
Kanagawa-ken 231-8528, Japan
Tel: 81(45)226-1200
ESTABLISHED
August 1981
COMMON STOCK LISTING
Tokyo Stock Exchange, First Section
(Code: 4921)
COMMON STOCK
Authorized Shares: 77,946,000
Outstanding Shares: 23,392,200
PAID-IN CAPITAL
¥10,795,161,280
NUMBER OF SHAREHOLDERS
20,918
NUMBER OF FULL-TIME EMPLOYEES
642
TRANSFER AGENT AND REGISTRAR
Mizuho Trust & Banking Co., Ltd.
1-2-1 Yaesu, Chuo-ku,
Tokyo 103-8670, Japan
http://www.mizuho-tb.co.jp/daikou/
Note: The transfer agent and registrar was changed from UFJ Trust Bank Limited toMizuho Trust & Banking Co., Ltd. in June 21, 2005.
ANNUAL MEETING OF SHAREHOLDERS
Held in mid-June in Kanagawa
CONSOLIDATED SUBSIDIARIES
ATTENIR CORPORATION
NICOSTAR Co., Ltd.
IIMONO OHKOKU Co., Ltd.
FANCL Hatsuga Genmai Co., Ltd.
FANCL ASIA (PTE.,) LTD.
FANCL Biken Co., Ltd.
fancl_05_cover_下 05.7.13 3:25 PM ページ55

FANCL Corporation89-1 Yamashita-cho, Naka-kuYokohama, Kanagawa-ken 231-8528, JapanHead Office phone: 81(45)226-1200http://www.fancl.co.jp/corporate/ir/index.html
Printed in Japan on non–wood pulp paper.(07.2005)
AN
NU
AL R
EPOR
T 2005FA
NC
L Co
rpo
ration
fancl_05_cover_下 05.7.13 3:25 PM ページ1