reforming mobile sector taxation in ecuador · ecuador (9.8 subscriptions per 100 people in 2016).8...
TRANSCRIPT

1
Reforming mobile sector taxation in Ecuador: Unlocking economic and social benefits through tax reform in the mobile sector
Copyright © 2018 GSM Association

The GSMA represents the interests of mobile operators worldwide, uniting more than 750 operators with over 350 companies in the broader mobile ecosystem, including handset and device makers, software companies, equipment providers and internet companies, as well as organisations in adjacent industry sectors. The GSMA also produces industry-leading events such as Mobile World Congress, Mobile World Congress Shanghai, Mobile World Congress Americas and the Mobile 360 Series of conferences.
For more information, please visit the GSMA corporate website at www.gsma.com
Follow the GSMA on Twitter: @GSMA and @GSMAPolicy
Disclaimer
This report (Report) was prepared by Ernst & Young LLP for the GSM Association using information provided by the GSM Association and data from publicly available sources.
Ernst & Young LLP does not accept or assume any responsibility in respect of the Report to any readers of the Report (Third Parties), other than GSM Association. To the fullest extent permitted by law, Ernst & Young LLP will accept no liability in respect of the Report to any Third Parties. Should any Third Parties choose to rely on the Report, then they do so at their own risk.
Ernst & Young LLP has not been instructed by its client, GSM Association, to respond to queries or requests for information from any Third Party and Ernst & Young LLP shall not respond to such queries or requests for information. Further Ernst & Young LLP is not instructed by GSM Association to update the Report for subsequent events or additional work (if any) performed by Ernst & Young LLP. Accordingly, without prejudice to the generality of the foregoing, Ernst & Young LLP accepts no responsibility to any Third Party to update the Report for such matters.
Ernst & Young LLP reserves all rights in the Report.
EY | Assurance | Tax | Transactions | Advisory
About EYEY is a global leader in assurance, tax, transaction and advisory services. The insights and quality services we deliver help build trust and confidence in the capital markets and in economies the world over. We develop outstanding leaders who team to deliver on our promises to all of our stakeholders. In so doing, we play a critical role in building a better working world for our people, for our clients and for our communities.
EY refers to the global organization, and may refer to one or more, of the member firms of Ernst & Young Global Limited, each of which is a separate legal entity. Ernst & Young Global Limited, a UK company limited by guarantee, does not provide services to clients. For more information about our organization, please visit ey.com

REFORMING MOBILE SECTOR TAXATION IN ECUADOR
ContentsExecutive summary 5
1. The Ecuadorian economy, the role of the mobile sector and opportunities for growth 9
1.1 Country overview 9
1.2 Market overview 12
1.3 The socio-economic contribution of the mobile sector 20
2. Tax contribution of the mobile sector in Ecuador 23 2.1 Taxes on mobile consumers 23
2.2 Taxes and regulatory fees on mobile operators 24
2.3 Tax contribution of the mobile sector 26
3. Designing a more efficient tax policy framework for the mobile sector in Ecuador 31 3.1 Principles of taxation applying to the mobile sector 31
3.2 An assessment of the mobile sector taxation in Ecuador 33
3.3 Options for tax reform in the mobile sector to improve the digital inclusion in Ecuador 35
3.4 Digital opportunities in the field of taxation 37
4. Economic impacts of tax reform on the mobile sector in Ecuador 40 4.1 Options for further tax reform to increase digital inclusion
4.2 Approach to assessing the quantitative impacts of further tax reform 40
on the mobile market and the wider economy
4.3 Reduction in recurring spectrum fees 42
4.4 Reduction in market concentration fee 44
4.5 Elimination of special consumption tax on mobile services provided to companies (ICE) 46
5. Conclusion: Reforming mobile sector taxation in Ecuador 48
Appendix A Methodology 51
Appendix B Scenario estimations 61

4
REFORMING MOBILE SECTOR TAXATION IN ECUADOR

REFORMING MOBILE SECTOR TAXATION IN ECUADOR
5
Mobile telephone services are playing an increasingly important role in supporting economic growth and social inclusion across the world. Mobile penetration, and specifically 3G and 4G penetration, enhances digital connectivity by expanding internet and broadband access, which in turn facilitates the reduction of barriers for trade, commerce, communication, service delivery, and human development. Examples of these benefits are seen in the form of financial inclusion via mobile payment platforms, digitally enabled local entrepreneurship, innovative health and education delivery systems, and growing numbers of e-government initiatives.
Conducive regulatory conditions offer the mobile industry the support it needs in order to thrive and maximise the opportunities available to consumers, businesses and governments. Within this, taxation is an important factor, and there is a need to achieve the right balance between tax revenue maximisation, and incentivising investment and economic growth.
In order to assess the potential benefits of a more efficient tax structure in the mobile sector, one which focuses on facilitating investment and unlocking digital inclusion, the GSMA1 has commissioned EY to undertake a study of the economic impact of potential tax reforms on the Ecuadorian mobile sector.
This report analyses recent developments and the tax structure in Ecuador’s mobile market, sets out potential options for tax policy reform, and estimates the impacts of these policy options on: the mobile sector, the wider economy and the Government’s fiscal position.
The mobile market in Ecuador has demonstrated significant growth over the past decade and makes an important contribution to the Ecuadorian economy
In Ecuador, the mobile industry is playing a significant role in driving economic growth and digital inclusion across the country. With a population of 16.6 million,
the number of mobile subscribers has grown from 6.8 million in 2008 to 11.5 million in 2018 (growth of 69.4%), and unique subscriber penetration now stands at 68.4%.2 Mobile sector expansion in Ecuador has been driven by significant investment by mobile operators; by 2017 mobile network coverage was 91% of the population for 3G and 53% for 4G.3
Total mobile sector revenues were $2.1 billion in 20174 equivalent to 2.0% of Ecuadorian gross domestic product (GDP), while the sector contributed approximately $845 million of direct economic value to Ecuador in 2017 (0.8% of GDP).5 The sector also supports a much wider mobile ecosystem that includes mobile content developers, mobile distribution providers and retail companies.
Despite this growth, there is scope for further increase in penetration to catch-up with some more highly penetrated Latin American countries
A significant proportion of the population (around 35% of the addressable market) is not connected to the mobile network, and almost 40% of existing subscribers (more than 4.1 million individuals) are not connected to mobile broadband (MBB) services.6 Ecuador ranks 9th out of 20 Latin American countries in unique subscriber penetration. Therefore, there is considerable scope for further expansion of the mobile sector in Ecuador.
To deliver this expansion, further significant investment into the mobile sector is required. In particular, there is continued scope to expand 4G network coverage, and to increase the general quality of data services to improve the user experience, and meet the increasing demand for mobile internet in Ecuador.
Facilitating the growth of the mobile sector aligns with the Government’s broader economic and social objectives for the Ecuadorian economy, which are set out in the National Development Plan 2017-2021.7 This includes achieving sustainable economic growth,
Executive summary
1. GSMA, https://www.gsma.com/latinamerica/.2. There is an important difference between the number of mobile connections – the metric traditionally used by the industry to measure market size and penetration – and the term
'unique mobile subscribers'. The latter refers to a single individual that has subscribed to a mobile service and that person can hold multiple mobile connections (i.e. SIM cards).3. Ministry of Telecommunications and Information Society of Ecuador.4. GSMA Intelligence database.5. ibid.6. ibid. 7. National Secretariat for Planning and Development, 2017, Plan Nacional de Desarrollo 2017-2021, http://www.planificacion.gob.ec/wp-content/uploads/downloads/2017/10/PNBV-26-
OCT-FINAL_0K.compressed1.pdf.

REFORMING MOBILE SECTOR TAXATION IN ECUADOR
6
increasing private sector investment, and enhancing the role of the knowledge economy. Therefore incentivising further investment to improve the availability and quality of 3G and 4G networks, as well as improving the affordability of mobile services, should become a policy priority for the Government, particularly given the relatively low level of fixed broadband penetration in Ecuador (9.8 subscriptions per 100 people in 2016).8
Significant improvements in affordability of mobile services are required in Ecuador to make progress towards meeting the United Nations’ targets and accelerate growth in penetration and usage
As it currently stands, for the poorest 20% of the population in Ecuador a low consumption basket (500MB of data) would account for approximately 14.4% of monthly income, while a medium consumption basket (1GB of data) would cost as much as 21.9% of monthly income.9 Significant improvements in affordability are therefore required to achieve the United Nations’ (UN) current 5% affordability target10 and make progress towards achieving the UN “1 for 2” (1 GB of data costing less than 2% of monthly income) target set for 2025.11
At present, Ecuador lags behind a number of regional peers in Latin America in terms of unique subscriber penetration and download speeds. By facilitating investment in the mobile sector and improving the affordability of mobile services, the Government can help close this gap, by encouraging continued expansion in the mobile sector, and hence supporting wider economic growth in Ecuador.
The tax burden on the mobile sector is high compared to other countries in Latin America; this could limit the growth potential of the mobile sector in Ecuador
In 2017, the total tax contribution was estimated at $622 million. This represents 30% of the total market revenue.
While the mobile market revenue accounted for 2.0% of Ecuador’s GDP,12 the sector’s tax and fee payments accounted for around 4.9% of government total tax revenue.13 This means that the mobile tax contribution is 2.4 times its size in the economy.
Ecuador has the highest mobile-specific tax burden (at 14% of total mobile sector revenue) in a sample including Dominican Republic (12%), Argentina (10%),
Brazil (7%), Peru (4%), Colombia (4%), Mexico (3%), El Salvador (2%) and Guatemala (0%). This is largely driven by high regulatory and spectrum fees, which together constitute 42% of the total tax payments made by the sector. This high tax burden could limit the investment into the mobile sector, and therefore, its growth potential in Ecuador.
Through policy reform, the Government of Ecuador has the opportunity to simplify and rebalance the taxation of the mobile sector, supporting job creation and a better business climate
The Ecuadorian economy has expanded at an average rate of 4.7% per annum between 2008 and 2014. Recently, it was hit by external economic shocks, including lower prices for oil – a key commodity export for Ecuador. These economic shocks were further exacerbated by a devastating earthquake in 2016, and have led to a period of contraction, growing fiscal imbalances and external debt.
A range of economic reforms have contributed to a rebound of economic growth in 2017. The reform agenda is supported by the National Development Plan 2017-2021, which aims at increasing productivity and competitiveness for sustainable economic growth by promoting private sector investment and the knowledge economy.14
Promoting greater investment in the mobile industry and improving the affordability of mobile services align with this strategy and, due to the links between the telecoms sector and the wider economy, can be used as a vehicle to achieve the underlying objectives of modernising key economic sectors, facilitating foreign investment and improving Ecuador’s telecommunications infrastructure.
Tax reform in the sector would unlock investment in Ecuador’s mobile networks and improve affordability, promoting greater adoption of mobile services. The growth in the sector would also generate higher GDP and taxation revenue for the Government in the medium term
Three options for tax reform in Ecuador have been identified, in line with the principles of taxation, which would reduce the level of mobile-specific taxation, make the tax system more equitable and recognise positive externalities of mobile services. These reforms are forecast to lead to increased penetration, an acceleration in the rate of technology migration to smartphones and
8. World Bank databank.9. For more detail on the methodology of calculation of the total cost of mobile ownership (TCMO) please see Appendix A. Sources: GSMA, Tarifica.10. This threshold has been set by the UN Broadband Commission for Sustainable Development. According to it, mobile expenditure (based on prepaid handset-based 500MB) above 5%
of GNI per capita is considered unaffordable. Source: http://broadbandcommission.org/Documents/ITU_discussion-paper_Davos2017.pdf.11. Alliance for Affordable Internet, 2017 Affordability Report, https://a4ai.org/affordability-report/report/2017/.12. Ecuador’s GDP was of $103.06 billion in 2017. Source: Oxford Economics database.13. The total tax revenue was estimated at $12.73 billion in 2017. Source: Servicio de Rentas Internas (SRI), Ecuador. http://www.sri.gob.ec/BibliotecaPortlet/descargar/dfad944c-167d-
4dbe-89f4-12e77015bf40/ESTAD%CDSTICAS+DE+RECAUDACI%D3N_DICIEMBRE+2017.xlsx.14. National Secretariat for Planning and Development, 2017, Plan Nacional de Desarrollo 2017-2021, http://www.planificacion.gob.ec/wp-content/uploads/downloads/2017/10/PNBV-26-
OCT-FINAL_0K.compressed1.pdf.

REFORMING MOBILE SECTOR TAXATION IN ECUADOR
7
3G/4G connections, as well as supporting GDP growth and taxation revenue more widely in the medium term:15
• Reduction in recurring spectrum fees: This scenario models a reduction in recurring spectrum fees by 50%. This would represent a significant reduction in operators’ costs, with the majority of this reduction being passed through to consumers in the form of lower prices. A proportion of the tax saving would also be reinvested by operators into expanding and upgrading their respective networks. The expected impacts of this tax reform on the mobile sector and wider economy16 are as follows:
• Unique subscriber penetration would increase by 1.9% (336,000 unique subscribers) by 2023, while mobile broadband penetration (unique subscribers) would grow by 2.2%, driving the growth in mobile data usage per connection by 3.1%. Sector revenues would be $48 million higher per annum (2.3%) by 2023;17 and
• GDP would grow by $308 million (0.30%), and annual tax receipts would be $39 million higher per annum by 2023, a cumulative fiscal gain of $82 million over five years.
• Reduction in market concentration fee: This scenario models a reduction in the market concentration fee by 50%. This peculiar tax to Ecuador is currently applied to mobile operators that have a market share greater than 30%. A reform of this tax would lower costs for mobile operators (reducing prices for subscribers) and also incentivise increased investment. This reform is forecast to have the following impacts:
• Unique subscriber penetration would increase
by 0.9% (166,000 unique subscribers) by 2023, while mobile broadband penetration (unique subscribers) would grow by 1.0%, driving the growth in mobile data usage per connection by 1.2%. Sector revenues would be $26 million higher per annum (1.3%) by 2023; and
• GDP would grow by $139 million (0.14%), and annual tax receipts would be $14 million higher per annum by 2023, a cumulative fiscal gain of $19 million over five years.
• Elimination of special consumption tax on mobile services provided to companies (ICE):18 This scenario models the full removal of the special consumption tax charged at a rate of 15% on mobile services provided to companies. Elimination of this tax would reduce the operational costs of any business that purchases mobile services. The savings would be almost fully passed on to businesses in the form of lower prices, with further benefits down the supply chain and in the wider economy:
• Total penetration would increase by 1.0% (172,000 connections) by 2023, with 96% of new connections being business customers. Increase in demand for mobile services from businesses would drive the growth in mobile data usage per connection by 4.7%. Sector revenues would be $52 million higher per annum (2.5%) by 2023; and
• GDP would grow by $152 million (0.15%), and annual tax receipts would be $22 million higher per annum by 2023, a cumulative fiscal gain of $51 million over five years.
A summary of the impacts is provided in Table 1 below.
15. The forecasts provided in this report estimate the isolated impacts of tax reform on the Ecuadorian mobile industry relative to a baseline forecast for the development of the sector sourced from GSMAi. They do not capture other market developments and/or external market shocks, and as such should not been seen as comprehensive forecasts for the sector.
16. A model of the Ecuadorian mobile sector has been developed in order to calculate the changes in the mobile sector resulting from each of the tax policy scenarios, while the wider economic impacts of each scenario are assessed via a ‘Computable General Equilibrium’ (CGE) model, namely the standard version of the Global Trade Analysis Project (GTAP) model and its associated dataset.
17. The economic impacts estimated in this study refer to recurring revenue of mobile operators only. This is revenue generated from the use of the network (voice, data, messaging, value-added services), but excluding non-recurring revenue, such as handset or equipment sales.
18. Impuesto al consumo especial (ICE) del servicio móvil avanzado prestado a sociedades. 19. In this scenario, the value refers to the number of additional connections, as the market growth is driven by incremental business customers, as opposed to new unique personal
subscribers in other scenarios.
Summary of socio-economic benefits of the proposed tax reforms, by 2023
Table 1
Indicator Reduction in recurring spectrum fees
Reduction in market concentration fee
Elimination of special consumption tax on mobile services provided to
companies (ICE)
New unique subscribers +336,000 +166,000 +172,00019
Sector revenue +$48m +$26m +$52m
GDP increase +$308m +$139m +$152m
Wider investment +$171m +$78m +$85m
Annual gain in tax revenue +$39m +$14m +$22m

REFORMING MOBILE SECTOR TAXATION IN ECUADOR
8
The growth in the sector should also lead to wider societal benefits, through increased access to mobile data and broadband services, particularly among lower income communities, as around 75% of new subscribers in scenarios 1 and 2 come from low-income groups. The boost to mobile penetration should lead to growth in productivity across the economy, and hence an increase in GDP, household incomes, employment and investment. All scenarios should aid the Ecuadorian Government in meeting the goals of the National Development Plan 2017-2021 and the National Plan for Telecommunications and Information Technologies 2016-2021, due to the positive impact
that the mobile sector has on the wider economy.Moreover, the reforms are shown to be self-financing in terms of their impact on government revenues in the medium term, and should generate significant tax revenues by 2023. In addition, a more conducive tax system for the investment and development of the mobile sector should enable further modernisation of tax administration and make tax collection more efficient. This would help to broaden the tax base and raise additional revenue for the Government, thanks to innovative solutions, such as person-to-government (P2G) payments and e-government initiatives.
REFORMING MOBILE SECTOR TAXATION IN ECUADOR
9
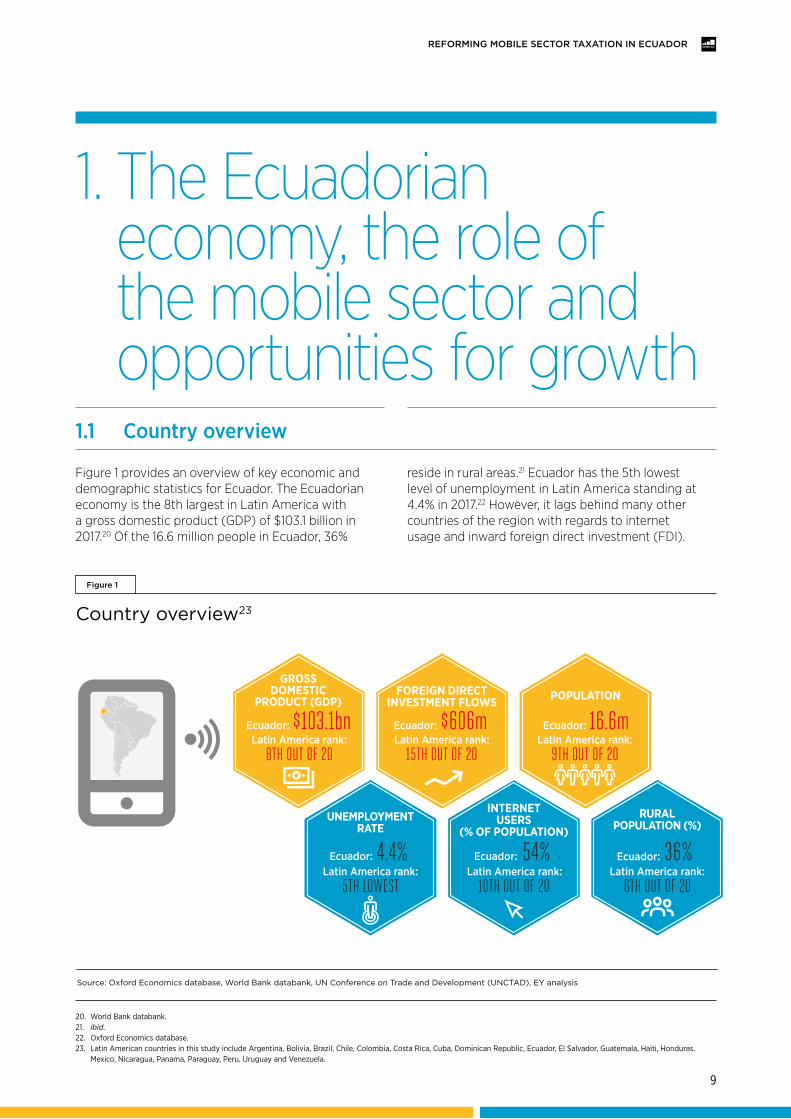
Figure 1 provides an overview of key economic and demographic statistics for Ecuador. The Ecuadorian economy is the 8th largest in Latin America with a gross domestic product (GDP) of $103.1 billion in 2017.20 Of the 16.6 million people in Ecuador, 36%
reside in rural areas.21 Ecuador has the 5th lowest level of unemployment in Latin America standing at 4.4% in 2017.22 However, it lags behind many other countries of the region with regards to internet usage and inward foreign direct investment (FDI).
1. The Ecuadorian economy, the role of the mobile sector and opportunities for growth
1.1 Country overview
20. World Bank databank.21. ibid.22. Oxford Economics database.23. Latin American countries in this study include Argentina, Bolivia, Brazil, Chile, Colombia, Costa Rica, Cuba, Dominican Republic, Ecuador, El Salvador, Guatemala, Haiti, Honduras,
Mexico, Nicaragua, Panama, Paraguay, Peru, Uruguay and Venezuela.
Source: Oxford Economics database, World Bank databank, UN Conference on Trade and Development (UNCTAD), EY analysis
Country overview23
Figure 1
GROSS DOMESTIC
PRODUCT (GDP)
Ecuador: $103.1bn $606m 16.6mLatin America rank:
8TH OUT OF 20 15TH OUT OF 20 9TH OUT OF 20
UNEMPLOYMENT RATE
RURAL POPULATION (%)
FOREIGN DIRECT
INVESTMENT FLOWS POPULATION
INTERNET USERS
(% OF POPULATION)
4.4% 54%5TH LOWEST 10TH OUT OF 20
36%6TH OUT OF 20
Ecuador: Ecuador:
Ecuador: Ecuador: Ecuador:
Latin America rank: Latin America rank:
Latin America rank: Latin America rank: Latin America rank:

REFORMING MOBILE SECTOR TAXATION IN ECUADOR
10
24. World Bank, 2018, https://datahelpdesk.worldbank.org/knowledgebase/articles/906519-world-bank-country-and-lending-groups.25. World Bank databank. 26. Oxford Economics database.27. Ecuador adopted the US dollar as its official currency in 2000.28. International Monetary Fund, 2018, IMF Staff Completes 2018 Article IV Mission to Ecuador, http://www.imf.org/en/News/Articles/2018/07/05/pr18278-imf-staff-completes-2018-article-
iv-mission-to-ecuador.29. Oxford Economics database.30. International Monetary Fund, 2018, IMF Staff Completes 2018 Article IV Mission to Ecuador, http://www.imf.org/en/News/Articles/2018/07/05/pr18278-imf-staff-completes-2018-article-
iv-mission-to-ecuador.
1.1.1 The Ecuadorian economy
The Ecuadorian economy is experiencing a period of transformation, as it seeks to reduce structural vulnerabilities and increase its resilience to external shocks
Ecuador is an upper-middle income economy, as classified by the World Bank.24 However, as Figure 2 shows, GDP per capita in Ecuador is below the average for the region, at approximately $6,200 in 2017.25
Ecuador achieved average annual growth in GDP of 4.7% between 2008 and 2014.26 However, as a consequence of falling oil prices, coinciding with limited access to international financing, the economy fell into recession in 2015, which was further exacerbated by a devastating earthquake in 2016. Ecuador, as a dollarised economy,27 was also affected by a deterioration of its external competitiveness driven by the appreciation of the US dollar.28
The economy returned to growth towards the end of 2016, and achieved growth of 3.0% in 2017.29 The recovery of the Ecuadorian economy has been supported by a range of economic reforms, including measures to strengthen fiscal institutions and increase fiscal transparency, increase labour market flexibility in several sectors, improve the legal framework for investment and facilitate trade.30
Source: Oxford Economics database
GDP per capita (nominal $) in comparator countries, 2017
Figure 2
Uruguay
Chile
Panama
Argentina
Costa Rica
Brazil
Mexico
Latin America
Dominican Republic
Peru
Colombia
Ecuador
Guatemala
Paraguay
El Salvador
Bolivia
Venezuela
Honduras
Nicaragua
Haiti
0 2,000 4,000 6,000 8,000 10,000 12,000 14,000 16,000 18,000
$17,121$15,353
$15,093$14,367
$11,839$9,810
$8,933$8,542
$7,057$6,686
$6,414$6,200
$4,508$4,395
$3,889$3,394
$3,271$2,463
$2,222$824
GDP per capita, nominal, $

REFORMING MOBILE SECTOR TAXATION IN ECUADOR
11
The need to reduce external vulnerabilities and to diversify the economy by reducing its dependence on oil exports is recognised in Ecuador’s National Development Plan 2017-2021.31 This plan sets out a range of objectives in the area of economic development, including promoting productivity and competitiveness for sustainable economic growth. In order to achieve these objectives, the National Development Plan 2017-2021 outlines a focus on promoting private sector investment, strengthening the knowledge economy and creating innovation ecosystems by favouring the use of modern technologies to drive an increase in productivity.32
The Government’s strategy in the area of Information and Communication Technologies (ICT) is set out in the National Plan for Telecommunications and Information Technologies 2016-2021.33 This sets out an ambitious vision to make Ecuador a regional leader in connectivity, access and production of ICT services by 2021.
Reforming the taxation of the mobile sector will support Ecuador’s Government in achieving its development goals as set out in the National Development Plan 2017-2021 and the National Plan for Telecommunications and Information Technologies 2016-2021. Specifically, improved affordability of mobile services and increased network investment will lead to growth in the sector that will support the development of the wider ICT sector, and consequently the diversification of the wider Ecuadorian economy.
1.1.2 Fiscal outlook
The Ecuadorian Government is targeting significant fiscal consolidation and the promotion of private sector investment
The Ecuadorian Government faces challenging fiscal imbalances. The Government’s fiscal balance moved from a surplus of 0.6% of GDP in 2008 to a deficit of 7.4% of GDP in 2016, as a consequence of the economic downturn and the 2016 earthquake. This led to an increase in borrowing, which saw external debt increase from 13.6% of GDP in 2013 to 30.8% of GDP in 2017.34
In order to reduce the fiscal imbalance, the Ecuadorian Government has implemented a number of austerity measures, including a public sector hiring freeze, a range of spending cuts and temporary tax measures. These steps, and a rebound of oil prices, helped to reduce the deficit to 4.5% of GDP in 2017.35
Continued reductions in the fiscal deficit remain high on the Ecuadorian Government’s agenda. It plans to implement a range of longer-term measures, aimed at reducing public spending and promoting private sector investment. Specifically, the Government is planning to gradually reduce public investment from about 15% of GDP to 10% of GDP by 2020.36 This is expected to reduce the budget deficit to 1% of GDP by 2020.37
Reform of the taxation applied to the mobile sector should be an integral part of the wider reform of the fiscal environment, in particular it could provide incentives for increased private sector investment, both in the sector and in the economy more widely.
31. National Secretariat for Planning and Development, 2017, Plan Nacional de Desarrollo 2017-2021, http://www.planificacion.gob.ec/wp-content/uploads/downloads/2017/10/PNBV-26-OCT-FINAL_0K.compressed1.pdf.
32. ibid.33. Ministry of Telecommunications and Information Society, 2016, Plan Nacional de Telecomunicaciones y Tecnologías de Información Del Ecuador 2016-2021, https://www.
telecomunicaciones.gob.ec/wp-content/uploads/2016/08/Plan-de-Telecomunicaciones-y-TI..pdf.34. Oxford Economics database.35. ibid.36. Financial Times, 2018, “FDI revival supports Ecuador’s change of direction”.37. TMF Group, 2017, “Reformas económicas en el Ecuador”, https://www.tmf-group.com/es-co/news-insights/articles/2017/december/economic-reforms-ecuador/.

REFORMING MOBILE SECTOR TAXATION IN ECUADOR
12
The mobile market in Ecuador has expanded rapidly over the past decade, with unique subscriber penetration increasing from 47% in 2008 to over 68% in 2018. However, as demonstrated in Figure 3, which provides an overview of the Ecuadorian mobile market, there is significant potential to further develop the sector (e.g. to increase the
level of 4G penetration and smartphone usage) and to contribute towards medium-term economic and social reforms enacted by the Ecuadorian Government in the National Development Plan 2017-2021 and the National Plan for Telecommunications and Information Technologies 2016-2021.
1.2 Market overview

REFORMING MOBILE SECTOR TAXATION IN ECUADOR
13
38. Compound annual growth rate (CAGR) is the mean annual growth rate for the period.
Source: GSMA Intelligence database, EY analysis
Ecuadorian mobile market in figures38
Figure 3
SUMMARY OF MOBILE MARKET
TECHNOLOGY ADOPTION AND CONTRACT TYPE
Ecuadorian mobile operators generated $2.1bn in revenue in 2017 (2.0% of GDP), contributing roughly $845m of direct economic value to Ecuador’s economy.
Ninth largest mobile market in Latin America by revenue.
14.0 million connections at Q1 2018Equivalent to 83.4% total connections penetration 2023 forecast: 17.0 million, at a 5 year CAGR of 3.9%.
11.5 million unique subscribers at Q1 2018Equivalent to 68.4% unique subscriber penetration 2023 forecast: 13.1 million, at a 5 year CAGR of 2.7%.
27.2% 4G penetration (connections) at Q1 2018 2023 forecast: 55.5%, 5 year CAGR of 15.3%.
48.6% smartphone penetration (connections) at Q1 20182023 forecast: 67.2%, at a 5 year CAGR of 6.7%.
71.5% prepaid connections compared to total in Q1 20182023 forecast: 70.0%, at a 5 year CAGR of -0.4%.

REFORMING MOBILE SECTOR TAXATION IN ECUADOR
14
1.2.1 Market penetration and technology migration
The mobile market is expanding in Ecuador, however there exists an opportunity to further increase market penetration and migrate more customers to 3G and 4G technologies
As shown in Figure 4, unique subscriber penetration in Ecuador increased considerably during the last 15 years. Unique subscriber penetration was 68.4% by Q1 2018 (equivalent to 83.4% penetration in total connections). More than 60% of unique subscribers had access to mobile broadband in Q1 2018. However, the rate of growth in unique subscriber penetration and mobile internet penetration has begun to slow over the last years.
Source: GSMA Intelligence database
Unique mobile subscriber penetration in Ecuador, 2008-2018
Figure 4
Total Mobile internet
0%
10%
20%
30%
40%
50%
60%
70%
80%
2018201720162015201420132012201120102009200820072006200520042003
43.8%41.9%
39.2%36.6%
33.7%30.0%
25.4%
20.2%
14.3%
68.4%67.0%65.7%64.2%62.4%60.3%
58.0%55.4%
52.8%49.9%
47.2%43.0%
36.8%
25.1%
17.3%
11.5%
Uni
que
sub
scri
ber
pen
etra
tio
n (%
)

REFORMING MOBILE SECTOR TAXATION IN ECUADOR
15
Source: GSMA Intelligence database
Mobile penetration (unique subscribers – all and with mobile internet) in selected comparator countries, 2018
Figure 5
Unique subscriber penetration Unique subscriber mobile internet penetration
Pen
etra
tio
n (%
)
90%
80%
70%
60%
50%
30%
20%
20%
10%
0%
Chi
le
Uru
gua
y
Pan
ama
Arg
enti
na
Co
sta
Ric
a
Ven
ezue
la
Per
u
Co
lom
bia
Ecu
ado
r
Bra
zil
Par
agua
y
Bo
livia
Do
min
ican
Rep
ublic
Hai
ti
Ho
ndur
as
Gua
tem
ala
Nic
arag
ua
Cub
a
Mex
ico
El S
alva
do
r
43.8%
68.4%
As shown in Figure 5, there is considerable scope to increase unique subscriber penetration, as Ecuador ranks 9th in Latin America, lagging behind not only some high-income economies of the region such as Chile, Uruguay, Panama and Argentina, but also
other upper-middle income countries, including neighbouring Peru and Colombia. Mobile internet penetration is also low in Ecuador relative to many regional peers.

REFORMING MOBILE SECTOR TAXATION IN ECUADOR
16
Given the relatively low level of fixed broadband subscriptions in Ecuador (9.8 per 100 people in 2016),39 the expansion of mobile broadband enabled (3G and 4G) technologies will be vital for increasing access to online services and supporting the growth of the digital economy. The tax policy reform agenda should
be targeted at stimulating growth in connectivity, and the use of mobile broadband in Ecuador, both of which would contribute towards achieving the Government’s goals set out in the National Development Plan 2017-2021 and the National Plan for Telecommunications and Information Technologies 2016-2021.
As shown in Figure 6, the dominant technology in the Ecuadorian mobile market is 3G, with a penetration rate (total connections) of 44.0% in Q1 2018. However,
market penetration is expanding for 4G services, with 4G penetration expected to overtake 3G in 2020.
Source: GSMA Intelligence database
Market penetration rate (total connections), by technology
Figure 6
Mar
ket
pen
etra
tio
n (%
)
120%
100%
80%
60%
40%
20%
0%
200
0
200
1
200
2
200
3
200
4
200
5
200
6
200
7
200
8
200
9
2010
2011
2012
2013
2014
2015
2016
2017
2018
2019
2020
2021
2022
2023
2024
2025
12.3%
27.2%
44.0%
2G 3G 4G
39. World Bank databank.

REFORMING MOBILE SECTOR TAXATION IN ECUADOR
17
40. Defined as Gross National Income (GNI) per capita.41. GSMA, 2016, Digital Inclusion and Mobile Sector Taxation, https://www.gsma.com/mobilefordevelopment/wp-content/uploads/2016/07/Digital-Inclusion-and-Mobile-Sector-
Taxation-2016.pdf.42. GSMA, 2015, Connected Women 2015 – Bridging the Gender Gap: Mobile Access and Usage in Low- and Middle-Income Countries, https://www.gsma.com/mobilefordevelopment/wp-
content/uploads/2016/02/GSM0001_03232015_GSMAReport_NEWGRAYS-Web.pdf. 43. For more detail on the methodology of calculation of the total cost of mobile ownership (TCMO) please see Appendix A. Sources: GSMA Intelligence database, Tarifica.
1.2.2 Affordability of smartphones and mobile services in Ecuador
Improvements to affordability of mobile services are required to promote faster development of the market and increase mobile connectivity in Ecuador
Lack of affordability can represent a significant connectivity barrier, particularly so for the low-income population. Analysis conducted by the GSMA highlights that countries with a high cost of mobile ownership (including both device and airtime/data) as a share of income per capita40 typically have lower penetration rates.41 A lack of affordability has been cited by up to 80% of people
in developing countries as the main barrier to mobile access and usage.42
A basic measure of affordability of mobile services is the proportion of monthly income which is spent on mobile services and devices. To identify the affordability challenges associated with mobile services and devices, the GSMA estimates the total cost of mobile ownership (TCMO) for a range of countries, income groups and consumption baskets.43
As Figure 7 below demonstrates, the total cost of mobile ownership represents 14.4% of monthly earnings for the bottom 20% of income distribution in Ecuador, which is one of the highest levels in Latin America.
Source: GSMA Intelligence database, Tarifica
TCMO as a proportion of monthly income for the bottom 20% of income distribution (500MB consumption package), 2017
Figure 7
Chile
Costa Rica
Peru
Dominican Republic
Venezuela
Argentina
Bolivia
Uruguay
Brazil
Mexico
Colombia
Guatemala
El Salvador
Panama
Paraguay
Ecuador
Nicaragua
% of monthly income
25%20%15%10%5%0%
Monthly TCMO for the bottom 20% of the income pyramid in Ecuador is among the highest in the region
14.4%

REFORMING MOBILE SECTOR TAXATION IN ECUADOR
18
44. This threshold has been set by the UN Broadband Commission for Sustainable Development. According to it, mobile expenditure (based on prepaid handset-based 500MB) above 5% of GNI per capita is considered unaffordable. Source: http://broadbandcommission.org/Documents/ITU_discussion-paper_Davos2017.pdf.
45. Alliance for Affordable Internet, 2017 Affordability Report, https://a4ai.org/affordability-report/report/2017/.
Figure 8 shows the TCMO as a proportion of monthly income for the two lowest income quintiles in Ecuador, compared to the entire population. Mobile broadband intensive packages are significantly less affordable for the poorest 20% and 40% of the population in Ecuador, who spend 21.9% and 15.1% of their monthly earnings for a medium consumption basket (1GB of data).
At present, basic packages represent an affordability challenge for Ecuador’s lowest income groups, with TCMO being significantly higher than 5% of income, which is the current UN affordability threshold.44 More effort is needed to make mobile services in Ecuador more affordable and make progress toward achieving the “1 for 2” UN target (1 GB of data costing less than 2% of monthly income) set for 2025.45
Low affordability of mobile services, especially for the bottom income groups of the population, represents a significant barrier for expansion of the knowledge economy. Improved affordability and connectivity
would allow Ecuadorians to enjoy many benefits of the mobile economy and support the Government in achieving its development objectives.
TCMO as a proportion of monthly income in Ecuador, 2017
Figure 8
Source: GSMA Intelligence database, Tarifica
TCMO – % of monthly income
United Nations 2025 "1 for 2" affordability target
United Nations 5% affordability target
Low = 500MB of data onlyMedium = 1,000MB of data + SMS + calls
TCM
O (
% o
f m
ont
hly
inco
me)
25%
20%
15%
10%
0%
Bottom 20% income group
Bottom 40% income group All population
Low LowMedium MediumLow Medium
3.3%5.0%
15.1%
9.9%
21.9%
14.4%
5%
REFORMING MOBILE SECTOR TAXATION IN ECUADOR
19
46. Ministry of Telecommunications and Information Society of Ecuador.47. GSMA Intelligence database.
Continued significant investment in mobile networks is required to make further progress in expanding 4G coverage and improving the quality of mobile broadband services, especially as the mobile sector faces a growing demand for mobile data traffic and
fixed broadband penetration is low. Government’s reform agenda should take these investment needs into account and support the sector when defining its tax policy priorities.
1.2.3 Investment environment and opportunities for development
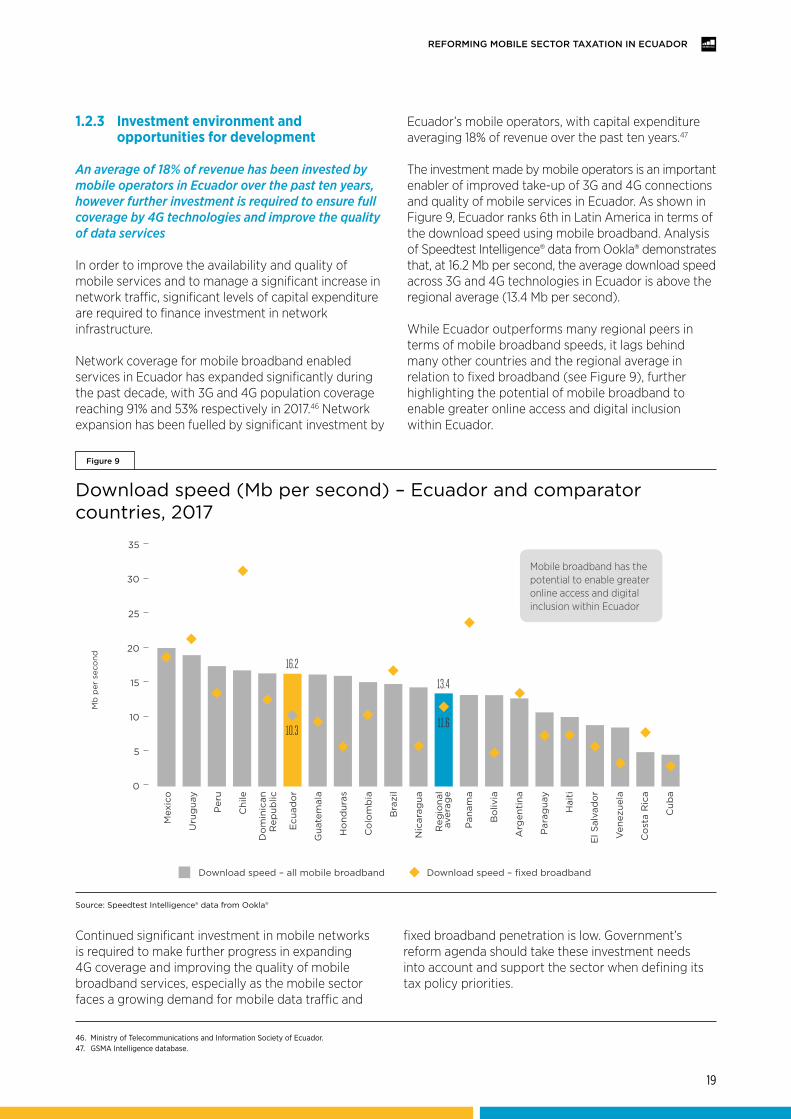
An average of 18% of revenue has been invested by mobile operators in Ecuador over the past ten years, however further investment is required to ensure full coverage by 4G technologies and improve the quality of data services
In order to improve the availability and quality of mobile services and to manage a significant increase in network traffic, significant levels of capital expenditure are required to finance investment in network infrastructure.
Network coverage for mobile broadband enabled services in Ecuador has expanded significantly during the past decade, with 3G and 4G population coverage reaching 91% and 53% respectively in 2017.46 Network expansion has been fuelled by significant investment by
Ecuador’s mobile operators, with capital expenditure averaging 18% of revenue over the past ten years.47
The investment made by mobile operators is an important enabler of improved take-up of 3G and 4G connections and quality of mobile services in Ecuador. As shown in Figure 9, Ecuador ranks 6th in Latin America in terms of the download speed using mobile broadband. Analysis of Speedtest Intelligence® data from Ookla® demonstrates that, at 16.2 Mb per second, the average download speed across 3G and 4G technologies in Ecuador is above the regional average (13.4 Mb per second).
While Ecuador outperforms many regional peers in terms of mobile broadband speeds, it lags behind many other countries and the regional average in relation to fixed broadband (see Figure 9), further highlighting the potential of mobile broadband to enable greater online access and digital inclusion within Ecuador.
Mb
per
sec
ond
35
30
25
20
15
10
5
0
Mex
ico
Uru
gua
y
Per
u
Chi
le
Do
min
ican
R
epub
lic
Gua
tem
ala
Ecu
ado
r
Ho
ndur
as
Co
lom
bia
Bra
zil
Nic
arag
ua
Reg
iona
l av
erag
e
Pan
ama
Par
agua
y
Hai
ti
El S
alva
do
r
Ven
ezue
la
Co
sta
Ric
a
Cub
a
Bo
livia
Arg
enti
na
Download speed – all mobile broadband Download speed – fixed broadband
Download speed (Mb per second) – Ecuador and comparator countries, 2017
Figure 9
Source: Speedtest Intelligence® data from Ookla®
Mobile broadband has the potential to enable greater online access and digital inclusion within Ecuador
16.2
13.4
11.610.3

REFORMING MOBILE SECTOR TAXATION IN ECUADOR
20
Mobile operators directly contributed $845 million in direct value added to the economy in 2017
Total mobile sector revenues were $2.1 billion in 2017,48 equivalent to 2.0% of Ecuadorian GDP. Mobile operators contributed approximately $845 million of direct economic value to Ecuador in 2017 (0.8% of GDP),49 while also supporting a much wider mobile ecosystem, including mobile distribution providers and retail companies. These companies create further economic activity in Ecuador by buying products and services from firms in their supply chain (indirect effects) and by generating employee income which leads to increased consumer spending, generating demand in consumer goods markets (induced effects).
Mobile connectivity promotes productivity improvements in the economy
Greater access to mobile services has transformed economies, accelerating economic growth and development in countries worldwide. The effects of mobile connectivity on an economy are largely delivered through its impact on productivity. Improvements in mobile connectivity can improve communication and trade within an economy, while also making a country more attractive for foreign investment. Improved connectivity can also boost tourism, and allow firms to access a broader pool of labour.50 The benefits of mobile connectivity – and how it translates to the wider economy – have been widely studied. For example, a literature review by the International Telecommunication Union (ITU) finds that a 10% increase in mobile broadband penetration leads to a 0.25% to 1.38% increase in GDP.51 Further, a number of studies have shown a strong relationship between mobile penetration and productivity; these show that a 10% increase in mobile penetration increases productivity by between 1.0% and 1.3%.52
Mobile networks promote digital inclusion and can bridge the digital divide
Where fixed broadband coverage is low (as is the case in Ecuador, where there are 9.8 fixed broadband
subscriptions per 100 people),53 mobile networks are central to promoting digital inclusion, due to the lower cost of network roll-out. This is particularly true for Ecuador’s large rural population, which represents 36% of the total population, as it will need to rely on mobile services to gain improved access to the knowledge and digital economy.
Mobile technology also removes other barriers to access broadband services including the affordability of ownership of a PC or laptop, and access to a bank account. As of 2016, only about half of Ecuadorian individuals were internet users (fixed and mobile internet), and hence increased roll-out of mobile broadband services will be key to addressing relatively low levels of access to internet services.
1.3 The socio-economic contribution of the mobile sector
CASE STUDY We Care Ecuador54
As an initiative aimed at achieving the UN Sustainable Development Goals, the mobile operators in Ecuador – Claro, CNT, and Movistar – are combining efforts to increase awareness, tackle handset theft, and reinforce best practice in response to natural disasters, through the use of mobile technology.
Ecuador is located in an area considered to be at high risk of natural disasters,55 increasing the importance of adequate preparedness and response plans. In the past these involved sending out mobile chargers and technicians to affected homes, along with satellite phones, water, and internet service. In some of the worst affected locations power generators were brought in, and residents were given free calls and texts.
48. GSMA Intelligence database.49. In this study, the direct economic value is measured using an estimate of the gross value added (GVA), which is defined as the value of revenue (output) less the value of intermediate
consumption. Sources: GSMA Intelligence database, Oxford Economics database.50. Oxford Economics, 2013, The Economic Value of International Connectivity.51. ITU, 2012, The Impact of Broadband on the Economy: Research to Date and Policy Issues, https://www.itu.int/ITU-D/treg/broadband/ITU-BB-Reports_Impact-of-Broadband-on-the-
Economy.pdf.52. ITU, 2012, The Impact of Broadband on the Economy: Research to Date and Policy Issues, https://www.itu.int/ITU-D/treg/broadband/ITU-BB-Reports_Impact-of-Broadband-on-the-
Economy.pdf and LECG, 2009, Economic Impact of Broadband: An Empirical Study, http://www.itu.int/net/wsis/stocktaking/docs/activities/1286203195/Report_BroadbandStudy_LECG_March6%5B1%5D.pdf.
53. World Bank databank.54. GSMA, 2017, “We Care Ecuador: mobile operators join forces to work on natural disaster response and tackle handset theft”, https://www.gsma.com/latinamerica/gsma-care-ecuador.55. UK Government, Foreign and Commonwealth Office. Source: https://www.gov.uk/foreign-travel-advice/ecuador/natural-disasters.
REFORMING MOBILE SECTOR TAXATION IN ECUADOR
21
56. World Bank, Global Findex Database.57. ibid.58. ibid.59. Better than Cash Alliance, 2016, Person-to-Government Payments: Lessons from Tanzania’s Digitization Efforts.60. GSMA, 2017, Person-to-Government (P2G) Payment Digitisation: Lessons from Kenya.61. GSMA, 2018, P2G Payments via Mobile Money: Unlocking Opportunity for Consumers, Governments and Providers. 62. University of Cambridge, 2011, Mobile Communications for Medical Care, http://www.csap.cam.ac.uk/media/uploads/files/1/mobile-communications-for-medical-care.pdf.63. N. McKee et al., 2004, “Strategic Communication in the HIV/AIDS Epidemic”.64. T. A. Gurman et al., 2012, “Effectiveness of mHealth Behavior Change Communication Interventions in Developing Countries: A Systematic Review of the Literature”.65. J.G. Khan et al., 2010, “'Mobile' Health Needs and Opportunities in Developing Countries”. 66. GSMA, 2015, Connected Women 2015 – Bridging the Gender Gap: Mobile Access and Usage in Low- and Middle-Income Countries, https://www.gsma.com/mobilefordevelopment/wp-
content/uploads/2016/02/GSM0001_03232015_GSMAReport_NEWGRAYS-Web.pdf.67. United Nations Development Programme, Gender Inequality Index, http://hdr.undp.org/en/composite/GII.68. UN Women – Americas and the Caribbean, http://lac.unwomen.org/en/donde-estamos/ecuador.
Mobile money can expand access to financial services, providing low-income citizens with a secure, accessible and convenient method to manage their finances
Mobile money services have the power to transform financial systems and promote a move away from cash based economies. They provide affordable financial services to low-income subscribers and enable safety, security and convenience for financial transactions for those who do not have access to traditional financial services.
There are several advantages to electronic payments when compared to cash payments, including contributing to higher transparency of transactions. Cash transactions are often unregistered which allows for the development of a shadow economy, and the evasion of tax payments.
The degree of inclusion of people into the formal financial system in Ecuador is relatively low. While the proportion of people aged 15+ having an account with a financial institution increased from 37% in 2011 to 51% in 2017, 28% of adults only owned a debit bank card.56 In Ecuador, a significant proportion of transactions is performed using cash. For example, 81% of utility bills in Ecuador are paid using cash only.57
However the use of mobile money remains limited in Ecuador with 2.9% of adults only having a mobile money account. The poorest 40% of people and those living in rural areas have even less access to mobile money payments, as only 0.2% and 2.1% have mobile money accounts respectively.58 There exists therefore a significant potential to increase the role of electronic payments in the economy, by further promoting the mobile payment platforms.
Furthermore, the digitalisation of person-to-government (P2G) and business-to-government (B2G) payments can generate significant efficiencies, while encouraging greater financial inclusion within the economy. Research from Tanzania has shown that shifting to digital P2G and B2G payments in certain cash-heavy industries can reduce leakage by up to 40%, and increase annual tax revenue in the country by $477 million per annum.59 In Kenya, public sector
digitalisation saved the Government an estimated $290 million over four years, as P2G payments improved the efficiency of public services.60 Similarly, it has been estimated that a successful digitalisation of P2G payments in Ghana has the potential to increase non-tax revenues of the Government by about 40%, equivalent to $630 million.61
Mobile health
Mobile health (m-Health) applications can improve health systems through reducing the cost of service delivery, providing distribution channels for public health information, streamlining health administration and data management, and even aiding real-time supply chain management.62
Mobile connectivity can form part of the solution for improving Ecuador’s healthcare sector. M-Health can be used in education, disease prevention, disease treatment, health care, and health support applications. Furthermore, mobile services can be used to overcome traditional barriers63 to accessing essential information and services, such as geographic isolation, gender disparities64 and social stigmas.65
Gender equality
Mobile technologies can empower women in developing countries, making them more connected, safer and better able to access information. Mobile connectivity also provides women with access to services and life-enhancing opportunities, such as health information and guidance, financial services and employment opportunities.66
In 2015, Ecuador ranked 88th out of 188 countries in the Gender inequality index by the United Nations Development Programme (UNDP).67 The UN specifies the need to further enhance economic and political empowerment of women in Ecuador.68 Greater accessibility and improved affordability of mobile services would contribute towards achieving greater gender equality and empowerment of women in Ecuador.

REFORMING MOBILE SECTOR TAXATION IN ECUADOR
22
CASE STUDY Capacitate Claro70
Since 2015, Claro has promoted the free mobile learning platform “Capacitate para el empleo”, to enable Ecuadorians to develop new skills to improve their employment prospects. Existing courses range from food handling to mobile phone repair, with the most popular relating to business accounting and computer skills.
There is no restriction on taking these courses, they can be accessed for free without any prior study requirements. The user only needs a mobile device, tablet or computer with an internet connection. These courses can also be accessed in more than 800 community info centres of the Ministry of Telecommunications and Information Society, located mostly in rural areas in Ecuador. More than 5,700 users of these community info centres completed training programs using this mobile platform between May and July 2018.
Mobile learning
Mobile learning (m-Learning) has the ability to reduce inequalities in educational systems by widening access to learning materials, improving literacy and reducing drop-out rates.
CASE STUDY Mobile Digital Classroom69
From 2017, Movistar, through the Fundación Telefónica, has been promoting the Mobile Digital Classroom project alongside the Ecuadorian Ministry of Education. The project is part of the Digital Agenda to encourage the development of key digital competencies of children.
It has involved technological kits being distributed throughout the country, benefiting over 12,000 children. Teachers are being trained to use the technology to incorporate more innovative teaching methods into their classes. The offering is currently designed to support general education, but the next phase of the project is aimed at developing more specific tools and methods to improve the quality of education in all areas of the country.
69. Telefonica Movistar. Source: http://fundaciontelefonica.com.ec/2018/01/16/70-unidades-educativas-se-suman-a-la-innovacion-tecnologica-con-la-entrega-del-equipamiento-de-aula-digital-movil/#.
70. Capacitate Claro. Source: https://capacitateparaelempleo.org/.
IMAGE

REFORMING MOBILE SECTOR TAXATION IN ECUADOR
23
As set out in Section 1, the mobile sector plays a key role in the Ecuadorian economy. In addition to its socio-economic impact, the mobile sector makes an important contribution to the public finances of Ecuador through tax payments. This section covers the tax regime applicable to the mobile sector and its contribution to the tax revenue of Ecuador.
Table 2 below outlines the different taxes on mobile whose incidence falls on consumers.
2. Tax contribution of the mobile sector in Ecuador
2.1 Taxes on mobile consumers
Key taxes paid by mobile consumers, 2018
Table 2
Value added tax (VAT) 12%
Customs duty on handsets 15%71
Special consumption tax on mobile services provided to companies (ICE) 15%
Source: EY 2018 Worldwide VAT, GST and Sales Tax Guide and Ecuador’s legislation
71. The tariff is reduced depending on the percentage of local content incorporated to the handset (PEI), according to table of Annex I of Resolution No. 64 of COMEX. A minimum tariff of 1% applies.
• Special consumption tax on mobile services provided to companies (impuesto al consumo especial del servicio móvil avanzado prestado a sociedades, ICE). This special tax applies only to mobile services (voice, data and SMS) provided to companies. It does not apply to mobile services
provided to private individuals. A rate of 15% is charged on the value of mobile services (the price of mobile plans and additional top-ups), excluding administrative charges, VAT and the ICE itself.

REFORMING MOBILE SECTOR TAXATION IN ECUADOR
24
• Corporate income tax (impuesto sobre la renta de las sociedades). Companies incorporated in Ecuador are subject to tax on their worldwide income. Foreign companies are subject to tax on income derived from activities within Ecuador. The standard rate of corporate income tax is 25%.
• Personal income tax on wages (impuesto sobre la renta sobre salarios). Individuals are subject to income tax on their worldwide income. Taxable income includes employment income from services rendered under a verbal or written contract of employment, regardless of whether the income is received in cash, in services or in kind. The income tax is progressive, with increasing tax rates for each band of income. The top rate of tax is 35%.
• Social security contributions (aportaciones patronales al IESS).72 Employers are required to pay social security contributions based on the
total remuneration paid to their employees. The rate of tax is 11.15%, and the contributions are deductible for income tax.
• Employees profit sharing (pago de la participación de utilidades). Employers are required by law to distribute 15% of their annual profits among their employees.
• Remittance tax (impuesto a la salida de divisas). A remittance tax is levied on the amount of any remittance made to another country through the financial system, cash or in any other way. The tax is levied at the rate of 5% on the amount remitted abroad.
• Credit transactions tax (contribución destinada al financiamiento de la atención integral del cáncer). This tax is imposed on credit transactions with financial institutions at the rate of 0.5%. The
2.2 Taxes and regulatory fees on mobile operators
Table 3 below outlines the different taxes paid by mobile operators.
Key taxes paid by mobile operators, 2018
Table 3
Corporate income tax 25%
Personal income tax 35%
Social security contributions 11.15%
Employees profit sharing 15%
Remittance tax 5%
Urban land tax 5%
Credit transactions tax 0.5%
Local licence tax 2%
Business net worth tax 0.15%
Superintendence contribution 0.09%
Custom duty on ancillary network equipment 5%-20%
Source: EY 2018 Worldwide Corporate Tax Guide, EY analysis, IBFD
72. IESS stands for Instituto Ecuatoriano de Seguridad Social.

REFORMING MOBILE SECTOR TAXATION IN ECUADOR
25
Source: Local legislation and operator data
Key regulatory fees paid by mobile operators, 2018
Table 4
Initial licence fees Different fees set by the regulator at the time of obtaining the licence.
Variable licence fees A percentage set by the regulator at the time of obtaining the licence.
Recurring spectrum fees Monthly fee based on a formula set by the regulator.
Universal service fund 1%
Local fee for radio bases installation Different fees depending on the municipality.
Market concentration fee 0.5%-9%
• Initial licence fees (pago inicial de la concesión). Operators pay an initial fee for the concession. The rate is set out in each licence agreement.
• Variable licence fees (pago variable de la concesión). Operators pay an annual licence fee for the provision of mobile services (derecho de concesión anual). The rate is set out in each licence agreement (usually 2.93% on invoiced revenues).
• Recurring spectrum fees (pago mensual por el uso del espectro). Operators pay a monthly fee for the use of the spectrum. The rate is set applying a formula set by the regulator based on the number of radio base stations and mobile subscribers.
• Universal service fund (fondo para el desarrollo de las telecomunicaciones, FODETEL). Mobile operators pay a contribution to the fund of 1% on invoiced revenues.
• Local fee for radio base installations (pago por implantación de radiobases). Operators pay a local licence fee for the installation of radio bases. The rate is set by each municipality.
• Market concentration fee (pago por concentración de mercado). This is a telecommunication sector-specific fee, with the precise rate based on the operator’s market share (see table 5 for applicable rates). It is paid on invoiced revenues for mobile services.
In addition to the taxes applying to mobile operators, there are also a number of different licences and fees required in order to be able to
supply telecommunication services. The details of these licences and the applicable fees can be seen in Table 4 below.
tax is based on the amount of the transaction and is withheld by the financial institution.
• Local licence tax (patente municipal). Companies carrying out commercial activities must obtain an annual business licence from the local municipality. The tax is calculated at progressive tax rates from 1% to 2% on net worth (i.e. total assets less total liabilities), subject to a maximum of $25,000.
• Urban property tax (impuesto a los predios urbanos). The urban property tax is an annual municipal tax on owners of urban property. The tax is progressive and may be up to 5% of the commercial value of the property. The tax is deductible for income tax purposes.
• Business net worth tax (impuesto sobre activos totales, ISAT). This is a municipal tax on businesses levied annually at the flat rate of 0.15% of total assets less current and contingent liabilities. The tax is deductible for income tax purposes.
• Superintendence contribution (contribución anual a la Superintendencia de Compañías). Companies are required to make an annual contribution to the Supervisor of Companies and Securities. The tax is based on the value of the company’s fixed assets, with the rate ranging from 0.70% to 0.93%.
• Custom duties. Imports of ancillary network equipment (such as laptops, cables, routers) are levied at different rates on the customs value of the products (between 5% and 20%).

REFORMING MOBILE SECTOR TAXATION IN ECUADOR
26
Tax and economic contribution of the mobile sector in Ecuador in 2017
Figure 10
2.3 Tax contribution of the mobile sector
In 2017, the total tax contribution was estimated at $622 million.73 This represents 30% of the total market revenue
The mobile sector makes a large contribution in taxes and fees relative to its economic footprint. While
the mobile market revenue accounted for 2.0% of Ecuador’s GDP,74 the sector’s tax and fee payments accounted for around 4.9% of government total tax revenue.75 This means that the mobile tax contribution is 2.4 times its size in the economy.
73. If tax re-assessments made in 2017 were taken into account, this tax burden could increase by an additional 34%. Source: operator data.74. Ecuador’s GDP was of $103.06 billion in 2017. Source: Oxford Economics database.75. The total tax revenue was estimated at $12.73 billion in 2017. Source: Servicio de Rentas Internas (SRI) Ecuador, http://www.sri.gob.ec/BibliotecaPortlet/descargar/dfad944c-167d-
4dbe-89f4-12e77015bf40/ESTAD%CDSTICAS+DE+RECAUDACI%D3N_DICIEMBRE+2017.xlsx.
Current schedule for the market concentration fee
Table 5
Market concentration Rate
30% - 34.99% 0.5%
35% - 44.99% 1%
45% - 54.99% 3%
55% - 64.99% 5%
65% - 74.99% 7%
Above 75% 9%
TAX CONTRIBUTION OF THE MOBILE SECTOR IN ECUADOR
In 2017, the mobile market revenue is estimated at $2.1bn. This accounted for 2.0% of Ecuador’s GDP.
This means that the mobile tax contribution is 2.4 times its size in the economy.
The sector’s total tax contribution is estimated at $622m. This is equivalent to 4.9% of Ecuador’s tax revenue.
Source: GSMA Intelligence database, EY analysis and operator data
Source: Local legislation

REFORMING MOBILE SECTOR TAXATION IN ECUADOR
27
As shown in Figure 11, in Ecuador, the three largest sources of tax revenue raise identical amounts of revenue: VAT, regulatory fees, and spectrum fees
(each one represents 21% of the total tax payments made by the industry).
Different taxes as a percentage of overall tax revenues in the mobile sector in Ecuador
Figure 11
Source: GSMA Intelligence database, EY analysis and operator data
1% Personal income tax
2% Social security contributions
1% Remittance tax
0.1% Credit transactions tax
0.4% Superintendence contribution
7% Employees profit sharing
0.1% Local licence tax
0.01% Urban land tax
0.4% Business net worth tax
14% Corporate income tax
6% Customs duties (all)
21% Recurring spectrum fees
0.2% Local fee for radio bases installation
8% Variable licence fees
3% Universal service fund
10% Market concentration fee
21% Net VAT
5% Special consumption tax on mobile services provided to companies (ICE)
1% 2% 1%
0.1%
0.1%
0.01%
0.4%
0.4%
0.2%
8%
7%
21%
3%
14%
6%
10%
21%
5%
Other taxes – 12%
Regulatory fees – 21%

REFORMING MOBILE SECTOR TAXATION IN ECUADOR
28
76. Variable licence fees are approximately equal to 2.0% of the total market revenue. Source: operator data. 77. Other taxes include personal income tax, social security contributions, remittance tax, credit transactions tax, superintendence contribution, employees profit sharing, local licence tax,
urban land tax, and business net worth tax.78. This does not include the initial licence fees. These are approximately 4% of the total market revenue (estimated on an annual basis). Therefore, the total sum of licence fees (recurring
and initial) plus recurring spectrum fees is approximately 12% of the total market revenue.79. While the annual industry revenue was estimated at MXN 169,972m, the recurring spectrum fees is estimated at MXN 21,794m. This is approximately 6% of the total market revenue.
Source: Coleago Consulting, 24 June 2017, Supporting Mexican digitisation. Effective mobile spectrum management and pricing.
As Figure 12 shows, Ecuador has one of the highest proportions of regulatory fees (21%) in the sample of regional countries, behind only Peru (32%). The regulatory fees burden is made up of four different fees: variable licence fees, market concentration fee, payments to the universal service fund, and local fees for radio base installations. Of these, the greatest tax burden is imposed by the market concentration fee
(48%) and variable licence fees (37%)76, which together represent 85% of the total regulatory fees burden. In addition, Ecuador also has the highest recurring spectrum fees in the region. These represent 21% of the total tax payments made in 2017 by the mobile operators. The recurring spectrum fees in Ecuador are also the highest in the sample as a share of the total market revenue.
In Ecuador, spectrum fees constitute 6% of the total market revenue78 (only Mexico sees a similar level of spectrum fees79). This is almost triple the burden in Argentina and Colombia at 2%.
As shown in Figure 13, the tax burden of Ecuador is the
third highest in the sample. Consumers pay 31% of the total taxes, while operators pay the remaining 69%. Ecuador has the third largest proportion of operator’s payments in the sample (21% of the total market revenue). This high tax burden disincentives further investments in the sector.
Source: GSMA Intelligence database, EY analysis and operator data
Spectrum feesVAT Regulatory
fees Corporation income tax Mobile-specific consumer taxes (excise) OtherImport duties
Different taxes as a percentage of overall tax revenues in the mobile sector in Latin America77
Figure 12
100%
0%
10%
20%
30%
40%
50%
60%
70%
80%
90%
Ecu
ado
r
Arg
enti
na
Bra
zil
Co
lom
bia
Do
min
ican
Rep
ublic
El S
alva
do
r
Gua
tem
ala
Mex
ico
Per
u
12%
21%
4%
16%
12%7% 32%
21%
5%6%
14%
21%
% o
f ta
x re
venu
es

REFORMING MOBILE SECTOR TAXATION IN ECUADOR
29
General taxes are equivalent to around 16% of total mobile sector revenue in Ecuador. As shown in Figure 14, this is broadly comparable to the average in the region. However, Ecuador’s mobile-specific taxes, which are equivalent to 14% of total mobile sector
revenue, are significantly larger as a proportion of revenue than all other countries in the region. In other words, the mobile sector in Ecuador has the highest mobile-specific tax burden in the region.
Source: GSMA Intelligence database, EY analysis and operator data
Operator vs consumer taxes (as percentage of mobile sector revenue)
Figure 13
Operator taxes and fees Consumer taxes and fees
22%
23%
45%42%
30%26%
19% 17% 16% 14% 12% 11%
14%
9%
16%
16% 8% 6% 7% 3%9% 6%
5%8%9% 10%10%
3%
28%21%
50%
45%
40%
35%
15%
20%
25%
30%
10%
5%
0%
Bra
zil
Arg
enti
na
Ecu
ado
r
Do
min
ican
R
epub
lic
Mex
ico
Uru
gua
y
Co
lom
bia
El S
alva
do
r
Per
u
Gua
tem
ala
Source: GSMA Intelligence database, EY analysis and operator data
General taxes and fees vs mobile sector-specific taxes and fees (as percentage of mobile sector revenue)
Figure 14
General taxes and fees Specific taxes and fees
50%
45%
40%
35%
15%
20%
25%
30%
10%
5%
0%
38%
7% 10%
14%12% 3%
4%4% 0%
2%34%
16% 14% 16% 16%
1%
12% 12% 8% 11%
45% 44%
30%26%
19% 17% 16% 14% 12% 11%
Bra
zil
Arg
enti
na
Ecu
ado
r
Do
min
ican
R
epub
lic
Mex
ico
Uru
gua
y
Co
lom
bia
El S
alva
do
r
Per
u
Gua
tem
ala
% o
f m
ob
ile r
even
ue%
of
mo
bile
rev
enue
In Ecuador, the mobile sector-specific tax burden represents 14% of the total market revenue.

REFORMING MOBILE SECTOR TAXATION IN ECUADOR
30

REFORMING MOBILE SECTOR TAXATION IN ECUADOR
31
Governments raise tax revenues to fund the provision of public goods and services. However, if the tax system is not designed properly, this can lead to unintended consequences for both the government and the taxpayers in terms of the incidence of the tax burden, distributional effects, efficiency and costs of collection.
In order to prevent such unintended consequences, it is important to follow certain principles of tax policy
design which have been consistently developed by international organisations such as the International Monetary Fund (IMF), the Organisation for Economic Cooperation and Development (OECD), the United Nations (UN) and the World Bank (WB).80
By applying these principles, this section identifies three policy options that could enhance the tax environment in Ecuador.
3. Designing a more efficient tax policy framework for the mobile sector in Ecuador
80. IMF, OECD, UN and WB, 2011, Supporting the Development of More Effective Tax Systems. A Report to the G-20 Development Working Group by the IMF, OECD, UN, and World Bank, https://www.oecd.org/ctp/48993634.pdf.
As laid out in Figure 15 below, the tax system on the mobile sector is likely to have wider impacts in terms of prices, tax revenue and productivity. Indirectly, the taxation of the mobile sector will also impact
information flows, access to markets, business processes and innovation. This will ultimately affect the economic growth and development of a country.
3.1 Principles of taxation applying to the mobile sector

REFORMING MOBILE SECTOR TAXATION IN ECUADOR
32
Factors shaping tax policy choices
Figure 15
Tax considerations
Distributional effects Incidence Efficiency Cost of collection
Indirect impacts Speed and quality of
information flows Access to markets New business processes Innovation
Direct impacts
Price GDP Tax revenue

REFORMING MOBILE SECTOR TAXATION IN ECUADOR
33
• Taxes should not discourage investment. A stable and transparent tax system in line with international standards is a strategy that would deliver sustained investment.81
• Taxation should be as broad based as possible. Broad-based taxes with single and low rates should be favoured over specific-taxes. This should allow the maximisation of revenue with minimal distortions to the consumption and provision of mobile services.
• Specific taxes should be limited and be based on a clear rationale of externalities. Specific taxes should be narrowly targeting a few goods mainly on the grounds that their consumption entails negative externalities on society. Given positive externalities, mobile phones and services would not generally be included in a list of goods and services singled out for exceptionally harsh tax treatment.82
• The tax system should be equitable. Mobile operators and consumers should be treated
equally to others in equal circumstances (“horizontal equity”).83 In addition, the tax system should also preserve “vertical equity” by avoiding the imposition of regressive taxes which has a larger impact on consumers of mobile services in the lower income groups.84
• Taxes should not undermine the affordability of mobile services, as excessive taxation can increase the cost of handsets and mobile services.85
• The tax system should be simple. Tax rules should be clear and no more complex than necessary to achieve the policy aim, facilitating mobile businesses and consumers to make optimal decisions and respond to intended policy incentives.86
• Taxes should be easy to collect. The collection of taxes should be as efficient as possible, i.e. low tax administration costs and minimisation of evasion and avoidance costs.87
81. ibid.82. ITU, 2013, Taxing Telecommunication/ICT services: an overview. https://www.itu.int/en/ITU-D/Regulatory-Market/Documents/Taxation%20Study-final-en.pdf. 83. ibid.84. R.M. Bird and E.M. Zolt, 2003, Introduction to Tax Policy Design and Development, https://www.internationalbudget.org/wp-content/uploads/Introduction-to-Tax-Policy-Design-and-
Development.pdf. 85. V. Tanzi and H. Zee, 2001, Tax Policy for Developing Countries, https://www.imf.org/external/pubs/ft/issues/issues27/. 86. IMF, OECD, UN, and WBG, 2016, Enhancing the Effectiveness of External Support in Building Tax Capacity in Developing Countries. Prepared for Submission to G20 Finance Ministers,
http://www.oecd.org/ctp/enhancing-the-effectiveness-of-external-support-in-building-tax-capacity-in-developing-countries.pdf.87. IMF, 2011, Revenue Mobilization in Developing Countries, https://www.imf.org/external/np/pp/eng/2011/030811.pdf.
In order to make sure these impacts are positive, the principles of taxation identified below should be appropriately balanced.
Principles of taxation applying to the mobile sector
An assessment of the current mobile tax regime in Ecuador against the principles identified in Section 3.1, identifies the following characteristics:
• The tax system of Ecuador is broad-based, but some mobile-specific taxes remain in place. Although there is still scope for improvement, Ecuador has a broad-based tax system. However, there are still a number of mobile-specific taxes. Mobile consumers are subject to customs duty on the purchase of handsets, and on scratch / recharge cards. They pay excise duty on the cost of data,
SMS messaging and phone calls. Mobile operators are also subject to different mobile-specific fees and taxes: spectrum fees, licence fees, the market concentration fee, the universal service fund, and local fees for radio base installations. The use of specific taxes should be limited, as excessive levels of taxation could impact the development of the sector and lower income groups in particular.
• The current tax system has a high incidence on the mobile sector. As shown in Section 2.3, the tax burden is high in Ecuador at 30% of the
3.2 An assessment of the mobile sector taxation in Ecuador

REFORMING MOBILE SECTOR TAXATION IN ECUADOR
34
Ecuador tax index, 2018
Table 6
Indicator Ecuador Latin America & Caribbean
OECD high income
Overall best performer
Tax payments (number per year) 10 28 10.93 (Hong Kong SAR,
China)
Time (hours per year) 666 332.1 160.7 50 (Estonia)
Total tax and contribution (% of profit) 32.5 46.6 40.118.47
(32 economies)
Post filing index (0-100) 49.54 47.50 83.45 99.38 (Estonia)
Source: World Bank, Doing Business 201891
88. Ministry of Telecommunications and Information Society, Planes Nacionales emitidos por el Ministerio de Telecomunicaciones y de la Sociedad de la Información, https://www.telecomunicaciones.gob.ec/wp-content/uploads/2018/09/Planes-Nacionales.pdf.
89. IMF and OECD. Update on tax certainty. Report for the G20 Finance Ministers and Central Bank Governors, July 2018, http://www.oecd.org/ctp/tax-policy/tax-certainty-update-oecd-imf-report-g20-finance-ministers-july-2018.pdf.
90. If tax re-assessments made in 2017 were taken into account, the estimated tax burden of mobile operators in 2017 could increase by an additional 34%. Source: operator data.91. Doing Business presents quantitative indicators on business regulations and the protection of property rights that can be compared across 190 economies and over time. Source:
World Bank, Doing Business 2018: Reforming to Create Jobs, http://www.doingbusiness.org/en/reports/global-reports/doing-business-2018.
total market revenue. Consumers pay 31% of this tax burden, primarily in the form of VAT, but also through customs and excise duties. Operators pay the remaining 69% of the total tax burden; the spectrum fees and the various regulatory fees are the most significant taxes borne by the operators. This high tax burden can undermine the affordability of mobile services and make the Ecuadorian system less conducive to investment.
• The high tax burden limits the positive externalities generated by the industry. The mobile sector is pivotal for the growth of the wider economy. A simpler and more equitable tax system should encourage the expansion of the sector and the digital inclusion of the most disadvantaged people. This would also support the Ecuadorian Government in achieving the objectives set out in the National Development Plan 2017-2021 and the National Plan for Telecommunications and Information Technologies 2016-202188 to close the digital divide.
• Although the number of tax payments and the total tax and contribution rate are better than the regional average, there is scope to improve the tax system. Under the category measuring the ease of paying taxes, the World Bank Doing Business 2018 report places Ecuador 145 out of 190 countries. The number of tax payments and the total tax and contribution rate is favourable for taxpayers compared to the Latin America and Caribbean region, and also compared to OECD high income countries.
However, as shown in Table 6 below, the time it takes to prepare, file and pay taxes in Ecuador is more than twice the average in the Latin America and Caribbean region, and more than four times the average for OECD high income countries. Paying taxes takes 13 times more time than in Estonia, the best performer globally. This suggests that Ecuador's tax system places a significantly higher administrative burden on taxpayers in comparison to other countries. Looking at this positively, it also indicates that there is a significant opportunity for improvements to the tax system, and a reduction in the administrative burden for taxpayers.
• Mobile operators currently face a high level of uncertainty given the numerous tax reassessments that often leads to an increase in the tax burden. As the OECD has acknowledged, tax uncertainty has a higher impact on investment decisions in Latin America and the Caribbean than in the OECD. Tax uncertainty can be observed in different forms; protracted audit periods and large variations in the results of audits can give rise to considerable unpredictability.89
In Ecuador, the tax burden of mobile operators is often increased as a result of tax reassessments concerning previous tax years.90 This makes it difficult for mobile operators to plan properly in the short and long term, since the outcome of tax reassessments may impact their profits, revenues and business decisions. More tax certainty should improve the ease of paying taxes, and act as an incentive to future investment.

REFORMING MOBILE SECTOR TAXATION IN ECUADOR
35
3.3 Options for tax reform in the mobile sector to improve the digital inclusion in Ecuador
Based on the preceding assessment, this report identifies three options to reform and improve the current tax system:
• Option 1 – Reduction in recurring spectrum fees;
• Option 2 – Reduction in market concentration fee; and
• Option 3 – Elimination of special consumption tax on mobile services provided to companies (ICE).
These reforms should help alleviate the tax burden and complexity on the mobile sector. This should lead to an increased tax collection in the medium term. Furthermore, the increasing use of mobile technologies, favoured by a more conducive tax system, can also help to modernise the tax administration in the long term and reduce the digital divide.
These reforms should also help Ecuador attain a number of the goals and objectives set out in the National Development Plan 2017-202192 and the National Plan for Telecommunications and Information Technologies 2016-2021.93 These include:
• Complete and encourage the deployment of telecommunications infrastructure;
• Increase the penetration of ICT services in the population;
• Ensure the use of ICT for economic and social development; and
• Set out the foundations for the long-term development of the IT industry.
3.3.1 Reduction in recurring spectrum fees94
Ecuador imposes a high tax burden on telecommunications operators; this is largely driven by recurring spectrum fees. As mentioned in Section 2.2 above, operators pay a monthly fee for the use of the spectrum. In order to incentivise operators to expand the network and increase coverage, one option for reform would be to reduce the monthly spectrum fees by 50%.
The rationale for change
• A reduction in recurring spectrum fees would help to move Ecuador closer towards other countries in the region.
• Recurring spectrum fees in Ecuador are the highest in the sample as a share of overall tax revenue. In Ecuador, recurring spectrum fees are 21% of overall tax payments made by the mobile industry in a year. This almost doubles the next highest country in our sample (Colombia at 11%, followed by 8% in Argentina, 5% in Mexico, and 2% in El Salvador).
• Recurring spectrum fees in Ecuador are also the highest in the sample as a share of the total market revenue. In Ecuador, recurring spectrum fees constitute 6% of the total market revenue in a year (only Mexico sees a similar level of spectrum fees).95 This is almost triple the next highest countries in our sample (Argentina and Colombia at 2%).
• The objective of recurring spectrum fees should be sufficient to cover the costs of spectrum management in order to maximise the long term benefit to society. Therefore, excessive recurring spectrum fees should not be used as a means of raising additional revenue.
• Reducing the level of recurring spectrum fees would allow operators to invest additional revenue into the expansion of the network. This would ultimately translate into increased coverage, better quality and more affordable services for the consumer.
• Furthermore, the expansion of mobile broadband enabled (3G and 4G) technologies would stimulate growth in connectivity. This would also support the Ecuadorian Government in achieving the objectives set out in the National Development Plan 2017-2021 and the National Plan for Telecommunications and Information Technologies 2016-2021 to close the digital divide.
92. National Secretariat for Planning and Development, 2017, Plan Nacional de Desarrollo 2017-2021, http://www.planificacion.gob.ec/wp-content/uploads/downloads/2017/10/PNBV-26-OCT-FINAL_0K.compressed1.pdf.
93. Ministry of Telecommunications and Information Society, 2016, Plan Nacional de Telecomunicaciones y Tecnologías de Información Del Ecuador 2016-2021, https://www.telecomunicaciones.gob.ec/wp-content/uploads/2016/08/Plan-de-Telecomunicaciones-y-TI..pdf.
94. For the avoidance of doubt, this option only covers a reduction in recurring spectrum fees paid on a monthly basis (pago mensual por el uso del espectro). It does not include up-front spectrum fees.
95. While the annual industry revenue was estimated at MXN 169,972m, the recurring spectrum fees is estimated at MXN 21,794m. This is approximately 6% of the total market revenue. Source: Coleago Consulting, 24 June 2017, Supporting Mexican digitisation. Effective mobile spectrum management and pricing.

REFORMING MOBILE SECTOR TAXATION IN ECUADOR
36
96. Government-owned companies are exempt from the fee.
3.3.2 Reduction in market concentration fee
The market concentration fee is a unique burden on the mobile-sector in Ecuador. It was introduced as a temporary measure and it currently applies only on the revenue of companies in the telecommunication sector with a market share of over 30%.96 As the market share of the company increases, so does the rate of the fee payable.
This fee is an additional cost for companies, reducing the resources for futher investement into the sector. One option for reform would be to reduce the rates paid for the market concentration fee by 50%, as follows:
The rationale for change
• A reduction in the market concentration fee would help to alleviate the high regulatory tax burden of the mobile sector on those within the scope. As mentioned in Section 2.3, Ecuador has one of the highest proportions of regulatory fees (21% of the total tax payments made by the industry) in our sample of regional countries, only behind Peru (32%). Of these, the greatest tax burden is imposed by the market concentration fee (48% of the total regulatory fees). This can reduce the ability of companies to invest in improving mobile services and infrastructure.
• As a fee applied on the total turnover from mobile services, in contrast to taxes on profit, operators are not able to deduct expenses for the purposes of this fee, including capital expenditure. The impact of this type of tax is particularly acute for
mobile operators since they incur high capital investments to make a return in the long term.
• A reduction in the fee can also be expected to benefit mobile consumers. Reducing the fee should enable mobile companies to make greater investments in infrastructure to increase the coverage in zones which are currently disconnected. This would translate into wider benefits for their customers in the form of lower prices and better services. This would also support the Ecuadorian Government in achieving the objectives set out in the National Development Plan 2017-2021 and the National Plan for Telecommunications and Information Technologies 2016-2021 to increase the digital inclusion in Ecuador.
Proposed schedule for the market concentration fee
Table 7
Market concentration Current fee Proposed fee
30% - 34.99% 0.5% 0.25%
35% - 44.99% 1% 0.5%
45% - 54.99% 3% 1.5%
55% - 64.99% 5% 2.5%
65% - 74.99% 7% 3.5%
Above 75% 9% 4.5%

REFORMING MOBILE SECTOR TAXATION IN ECUADOR
37
The three options for reform identified above would be self-sustaining in the medium term for Ecuador and would lead to revenue gains for the government. Section 4 will present detailed economic modelling to show the impacts delivered by these three options.
In addition, a more conducive tax system for the investment and development of the mobile sector enable further modernisation of tax administration and make tax collection more efficient. This would help to broaden the tax base and raise additional revenue for the government, offsetting any potential loss of revenue in the short-term, thanks to innovative solutions, such as person-to-government (P2G) payments and e-government initiatives.
As the OECD notes in its latest interim report on tax digitalisation, the increasing use of digital or platforms facilitates the integration into the formal economy. Previously unreported transactions are now carried out
through those platforms, delivering an enhanced electronic audit trail and greater reporting of income.
In this way, digital platforms can drive growth and increase revenues, by providing new opportunities for economic activity and encouraging movement into the formal economy. This information can be integrated into data matching analysis to enhance tax compliance.97
Technology is expanding the capabilities of tax administrations in a wide range of ways, to enhance the effectiveness of compliance activities, improve taxpayer services and reduce compliance burdens.98 Some examples of experiences on how digitalisation and the use of technology could open up further opportunities for the tax administration are identified below:
3.4 Digital opportunities in the field of taxation
97. OECD, 2018, Tax Challenges Arising from Digitalisation – Interim Report 2018. Inclusive Framework on BEPS, https://doi.org/10.1787/9789264293083-en. 98. ibid.
3.3.3 Elimination of special consumption tax on mobile services provided to companies (ICE)
Excise duty currently applies at a rate of 15% to consumers of mobile services. This duty applies to the provision of voice, data and text (SMS) to companies and businesses. In order to increase the affordability of mobile services and improve the business environment of Ecuador, one option for reform would be to eliminate this excise duty.
The rationale for change
• Given their positive externalities, mobile services would not normally be taxed similarly to goods with negative externalities. By removing this excise duty, Ecuador could improve the affordability of mobile services, thereby encouraging the access and adoption of communication services in line with its policy objectives.
• Excise duties can negatively impact on investment and market development. A reduction in excise duties should help businesses to maximise the
potential of mobile services to improve efficiency and customer service. This should lead to an increased productivity across the economy leading to GDP growth.
• The elimination of these charges will help to improve Ecuador’s business environment, as Ecuador currently ranks 188th out of 190 countries in the Doing Business index of the World Bank. For businesses trading with Ecuador, the cost of communication will be reduced, which may also improve the attractiveness of Ecuador as a destination for foreign direct investment.
• A greater penetration and usage of mobile services should in turn have further economic and socio-economic benefits for Ecuador. There should be increased digital inclusion and more companies in Ecuador will have access to a wider range of digital services.

REFORMING MOBILE SECTOR TAXATION IN ECUADOR
38
Some of the successful experiences identified above could be replicated in Ecuador. In addition to the positive impact in terms of tax collection, they would also be consistent with the objectives of Plan Nacional de Gobierno Electrónico 2018-2021.107 In particular, these reforms could assist with the objectives of:
• The increased usage of electronic means for the development of public policy, improving
government services, and promoting transparency, in order to increase participation and collaboration between citizens; and
• Increasing the efficient use of resources by the Government for the delivery of electronic services to citizens.
• In Hungary, the introduction of electronic cash registers saw an increase of VAT revenue by 15% in the targeted sectors, exceeding the costs of introducing the new system.99
• In Rwanda, in the two years since the introduction of electronic cash registers in March 2013, VAT collected on sales increased by 20%.100
• In Mexico, an additional 4.2 million micro-businesses were brought into the formal economy after Mexico introduced mandatory electronic invoicing.101
• Peru’s tax administration (SUNAT) launched its first mobile app in February 2015. This provides constant access, through tablet and mobile phone, to a range of services, including tax registration, invoices, a virtual tax guide and the ability to report tax evaders.102
• The Australian Tax Office has incorporated a tool in its mobile app allowing taxpayers to record tax deductions on the go. Using the camera on their device, taxpayers can capture receipts and use location services to record work-related car trips for vehicle deductions, eliminating the need for paper records.103
• Countries including Brazil, Côte d’Ivoire, Guinea, Kenya, Mauritius, Pakistan, Rwanda, Tanzania, and Uganda have done well in driving digital P2G payments. Of these, Kenya stands out in
terms of the number of P2G use cases. The central e-government platform (eCitizen) reports that over 90% of digital payments are made via mobile money, while 85% of Nairobi City County payment wallet re-loads (eJijiPay) are made via mobile money.104
• Ghana has an existing e-Government portal that offers services by government ministries, departments and agencies (MDAs) and an e-Payments portal that accepts digital payments through payment processing partners such as mobile money (through MTN, Vodafone and Airtel-Tigo), card payments (via Visa and MasterCard), payment switch (eTranzact) and bank transfers (through banks such as Zenith Bank and Ghana Commercial Bank).105
• In Côte d’Ivoire 99% secondary school students (1.5 million) pay their annual school registration fee payment via mobile money which has resulted in driving cost efficiencies, increased operational efficiency, and transparency for all the beneficiaries – students and their parents, secondary schools, and the government (Ministry of National and Technical Education – MENET). Prior to this initiative, schools and local government departments reported that a significant proportion of school fee payments were lost, and that armed robberies at payment locations were commonplace. Mobile money has helped to reduce both cash handling costs and the associated risks.106
99. ibid.100. ibid.101. ibid.102. ibid.103. ibid.104. GSMA, 2017, Person-to-government (P2G) payment digitisation: Lessons from Kenya. https://www.gsma.com/mobilefordevelopment/wp-content/uploads/2017/09/P2G_Report_Final.pdf.105. GSMA, 2018, The opportunity for mobile money person-to-government payments in Ghana. https://www.gsma.com/mobilefordevelopment/tag/p2g-payments/. 106. GSMA, 2015, Paying school fees with mobile money in Côte d’Ivoire: A public-private partnership to achieve greater efficiency. https://www.gsma.com/mobilefordevelopment/wp-
content/uploads/2015/10/2015_GSMA_Paying-school-fees-with-mobile-money-in-Cote-dIvoire.pdf. 107. Ministry of Telecommunications and Information Society, 2018, Plan Nacional de Gobierno Electrónico 2018-2021, https://www.telecomunicaciones.gob.ec/wp-content/
uploads/2018/08/PNGE_2018_2021sv2.pdf.
Successful experiences in the field of digital tax administration

39
REFORMING MOBILE SECTOR TAXATION IN ECUADOR

REFORMING MOBILE SECTOR TAXATION IN ECUADOR
40
Based on the framework and analysis outlined in the previous section, the following three options for further tax reform have been assessed quantitatively by modelling their impacts on the mobile sector and the wider economy:
• A 50% reduction in recurring spectrum fees. This would represent a significant reduction in operators’ costs, with the majority of this reduction being passed through to consumers in the form of lower prices. A proportion of the tax saving would also be reinvested by operators into expanding and upgrading their respective networks;
• A 50% reduction in market concentration fee. This reform would improve the attractiveness of the mobile market for investment and would incentivise mobile operators to increase their network investments, and reduce prices for subscribers; and
• Elimination of special consumption tax on mobile services provided to companies (ICE). This scenario models the full removal of the special consumption tax charged at a rate of 15% on mobile services provided to companies. Elimination of this tax would reduce the operational costs of any business that purchases mobile services. The savings would be fully passed on to businesses in the form of lower prices, with further benefits down the supply chain and in the wider economy.
These options for tax reform have been modelled separately in order to isolate the effects of each option on the mobile sector and the wider economy. While the implications of these specific further tax reforms have been modelled, alternative scenarios and combinations of these reforms are also possible.108
4. Economic impacts of tax reform on the mobile sector in Ecuador
4.1 Options for further tax reform to increase digital inclusion
108. The economic impacts of each option for tax reform have been modelled separately, and therefore cannot be simply aggregated to determine the benefits of combined reductions in various taxes.
The potential quantitative impacts of each of the tax options have been analysed using a set of modelling tools representing both the Ecuadorian mobile sector and the Ecuadorian economy as a whole. While a combination of these tax reforms would be likely to lead to beneficial economic impacts for Ecuador, the assessment considers the options as separate ‘scenarios’, where each tax is
reformed and compared to a status quo scenario with no change in taxation (the baseline scenario).
A model of the Ecuadorian mobile sector has been created to calculate the impact on the sector from each of the tax policy scenarios. This includes the change in subscribers, usage, technology, revenues, profits, reinvestment and increased network capacity in the sector.
4.2 Approach to assessing the quantitative impacts of further tax reform on the mobile market and the wider economy

REFORMING MOBILE SECTOR TAXATION IN ECUADOR
41
109. Global Trade Analysis Project, https://www.gtap.agecon.purdue.edu/.110. GTAP Consortium, https://www.gtap.agecon.purdue.edu/about/consortium.asp.111. Please see Appendix A for more detail on the methodology approach used in this study to construct the scenario forecasts.
The wider economic impacts of each tax policy scenario are assessed via a ‘Computable General Equilibrium’ (CGE) model, namely the standard version of the Global Trade Analysis Project (GTAP) model and its associated dataset.109 The GTAP model is contributed to, and widely used, by government agencies, international institutions, the private sector and academia to model policy changes within countries and cross-border effects of trade
policies. Some examples include the World Bank, the World Trade Organization (WTO), the Directorate General for Trade of the European Commission, the Asian Development Bank and the Organisation for Economic Co-operation and Development (OECD).110
A schematic of the modelling approach used in this study is shown in Figure 16 below.111
Overview of the modelling approach
Figure 16
Source: EY analysis
Prices of mobile services or devices
Consumption of mobile services and devices
Profitability
Investment
Technology migration
Market revenue
Network upgrade Penetration Sector tax
receipts
Mobile sector
impacts
Firms GovernmentHouseholds Rest of the World
Product markets Capital MarketsFactor marketsCGE
modelling
Real GDP Tax receipts EmploymentHousehold income and expenditure
Wider economy investment
Tax change
Pass-through rate
Price elasticity Reinvestment rate
Retention rate
Outputs

REFORMING MOBILE SECTOR TAXATION IN ECUADOR
42
As shown in Section 2, the effective rate paid by operators in Ecuador for use of the mobile spectrum is higher than the rates in other countries in Latin America. Therefore, in this scenario, the proposal is to reduce the recurring spectrum fees paid by operators by 50%.
The reduction in spectrum fees in Ecuador will lead to a decrease in costs for mobile operators. This tax saving would be partially passed on to subscribers in the form of a reduction in the effective price of services by 2.7%. The remainder of the tax saving would be either reinvested into the network through the building of new mobile sites and the upgrading of existing sites or retained as increased profits.
This tax scenario is forecast to have the following impacts compared to the baseline scenario: 112
• Mobile market revenue:113 total mobile sector revenue would increase by $48 million (2.3%) by 2023. This would be driven by additional revenues from an increased number of connections, and higher overall usage, which offset the reduction in pricing from the tax reform;
• Investment by operators: as a result of the tax saving, Ecuadorian mobile operators would increase investment by a total of around $3 million per annum. This will enable them to further expand their networks and will support the migration to modern technologies by upgrading the existing network infrastructure;
• New connections: there would be an additional 336,000 unique subscribers, or 435,000 mobile connections by 2023. This is equivalent to an increase of around 1.9% in unique subscriber penetration (2.4% in total connections). Of these new connections, 76% would be classified as low-income. As a result of network investment and lower effective prices, unique mobile broadband penetration would increase by 2.2%;
• Usage: the reduction in the effective price of mobile services would lead to a 3.1% increase in average data usage per connection compared to the baseline;
• Productivity gain: the increase in unique subscriber penetration of 1.9% would lead to a 0.24 % gain in productivity across the economy, leading in turn to further increases in output, incomes and expenditure;
• GDP increase: total GDP would increase by $308 million (0.30%) compared to the baseline, as the price and productivity effects lead to a chain reaction of expansion across the economy;
• Employment increase: as a result of the increased economic activity, employment would increase by approximately 4,600 jobs;
• Wider investment in the economy: as a result of lower prices for mobile services and increased productivity, additional resources are made available for investment across the economy. By 2023, this scenario would lead to an annual gain in investment of $171 million (0.68%); and
• Tax revenue impact: this scenario would have an initial net cost to the Ecuadorian Government of $35 million in 2019. However, the subsequent expansion of the mobile sector, and significant growth in the wider economy, mean that, by 2020, the annual impact becomes positive. The gain in tax revenue is potentially about $39 million per annum by 2023.
The summary of the sector-specific and economic impacts in 2023 is shown in Figure 17.114
4.3 Reduction in recurring spectrum fees
112. Please see Appendix A for more detail on the modelling assumptions used in this study and see Appendix B for detailed estimated impacts.113. The economic impacts estimated in this study refer to recurring revenue of mobile operators only. This is revenue generated from the use of the network (voice, data, messaging,
value-added services), but excluding non-recurring revenue, such as handset or equipment sales.114. All figures represent the annual variance between the baseline scenario and the tax reform scenario at 2023. These results are not cumulative.

REFORMING MOBILE SECTOR TAXATION IN ECUADOR
43
Source: EY analysis
Reduction in recurring spectrum fees
Figure 17
-2.7% effective price of services
+1.9%unique subscriber penetration
+3.1%data usage per connection
+$3minvestment by operators
+2.2%mobile broadband penetration
+$48msector revenue
+0.24%productivity gain
+4,600new jobs
-$35mnet loss in tax revenue in 2019
+$308mGDP increase
+$171mtotal investment
+$39mannual gain in tax revenue by 2023
Mobile sector impacts Wider economic impacts
Reduction in recurring spectrum fees

REFORMING MOBILE SECTOR TAXATION IN ECUADOR
44
4.4 Reduction in market concentration fee
Mobile network operators in Ecuador are subject to a tax known as the market concentration fee. The level of this tax depends on the market share of the operator. This peculiar tax to Ecuador represents an additional cost for mobile operators who have a market share of over 30% and is a barrier to further investment. This scenario models a reduction in market concentration fee by 50%. Reducing the level of the market concentration fee would allow the mobile operators to reduce prices for subscribers and increase their investment into networks, resulting in greater penetration and further benefits to the wider economy.
As shown in Section 1, further investment is required to increase mobile network coverage in Ecuador. By enabling additional private sector investment into the mobile sector, the reduction in the market concentration fee would support the Ecuadorian Government in achieving the objectives set out in the National Development Plan 2017-2021 and the National Plan for Telecommunications and Information Technologies 2016-2021.
This tax scenario is forecast to have the following impacts compared to a “baseline” scenario of no change in current levels of taxation:
• Mobile market revenue: total mobile sector revenue would increase by $26 million (1.3%) by 2023. This would be driven by incremental mobile penetration and usage levels generated from reduced prices;
• Investment by operators: as a result of the tax saving, Ecuadorian mobile operators would increase investment by a total of $7 million per annum by 2023. This will enable them to further extend and improve the network infrastructure;
• New connections: an additional 166,000 unique subscribers, or 215,000 mobile connections by 2023. This is equivalent to an increase of around 0.9% in unique subscriber penetration (1.2% in total connections). Of these new connections, 79% would be classified as low-income. As a result of network investment and lower effective prices, unique mobile broadband penetration would increase by 1.0%;
• Productivity gain: the increase in unique subscriber penetration of 0.9% would lead to a 0.11% gain in productivity across the economy, leading in turn to further increases in output, incomes and expenditure;
• GDP increase: total GDP would increase by $139 million (0.14%) by 2023 as the price and productivity effects lead to a chain reaction of expansion across the economy;
• Employment increase: as a result of the increased economic activity, employment would increase by approximately 1,950 jobs by 2023;
• Wider investment in the economy: as a result of expansion in the mobile sector and increased productivity, additional resources are made available for investment across the economy. By 2023, this scenario would lead to an annual gain in investment of $78 million (0.31%); and
• Tax revenue impact: this scenario would have an initial net cost to the Ecuadorian Government of $20 million in 2019. However, the subsequent expansion of the mobile sector, and significant growth in the wider economy, mean that, by year 2, the annual impact is positive, while the cumulative tax impact gets positive in year 4. The gain in tax revenue is potentially approximately $14 million per annum by 2023.
The summary of the sector-specific and economic impacts in 2023 is shown in Figure 18.

REFORMING MOBILE SECTOR TAXATION IN ECUADOR
45
115. Please see Appendix B for further detail on the results of this analysis, including annual impacts between 2019 and 2023.
Source: EY analysis
Annual impacts of a reduction in market concentration fee, 2023115
Figure 18
-0.9% effective price of services
+0.9%unique subscriber penetration
+1.2%data usage per connection
+$7minvestment by operators
+1.0%mobile broadband penetration
+$26msector revenue
+0.11%productivity gain
+1,950new jobs
-$20mnet loss in tax revenue in 2019
+$139mGDP increase
+$78mtotal investment
+$14mannual gain in tax revenue by 2023
Mobile sector impacts Wider economic impacts
Reduction in market concentration fee
REFORMING MOBILE SECTOR TAXATION IN ECUADOR
46
There is currently a tax, levied at a rate of 15%, on the provision of mobile services to businesses in Ecuador. This reform proposes that this tax is eliminated. This would remove distortions to the supply and use of mobile services in the normal course of business. The elimination of this tax would lead to a price reduction in the services provided at this stage in the supply chain, and this would flow through to the market for domestic consumption in each industry.
This tax reform would have a positive impact on the Ecuadorian mobile market and the overall economy, driven by an increase in the number of business subscribers (likely to be high users), higher usage of mobile services per connection, and productivity gains across all sectors of the economy.
This tax scenario is forecast to have the following impacts compared to a “baseline” scenario of no change in current levels of taxation:
• Mobile market revenue: total mobile sector revenue would increase by $52 million (2.5%) by 2023. This would be driven by additional revenues from new business subscribers and higher usage per connection;
• New connections: an additional 172,000 connections, of which 164,000 would be business connections, by 2023116, 117. This is equivalent to an increase of around 1.0% in total connections penetration. As most business connections are assumed to be high usage mobile broadband enabled connections, total mobile broadband penetration would increase by 0.9%;
• Usage: lower data prices and an increase in the share of high usage business customers on the Ecuadorian mobile market would lead to a 4.7% increase in average data usage per connection compared to the baseline;
• Productivity gain: the increase in the number of business subscribers (equivalent to an increase in total connections penetration of 1.0%) would lead to a 0.12% gain in productivity across the economy, leading in turn to further increases in output, incomes and expenditure;
• GDP increase: total GDP would increase by $152 million (0.15%) by 2023 as the price and productivity effects lead to a chain reaction of expansion across the economy;
• Employment increase: as a result of the increased economic activity, employment would increase by approximately 2,100 jobs by 2023;
• Wider investment in the economy: as a result of expansion in the mobile sector and increased productivity, additional resources are made available for investment across the economy. By 2023, this scenario would lead to an annual gain in investment of $85 million (0.34%); and
• Tax revenue impact: this scenario would have an initial net cost to the Ecuadorian Government of $15 million in 2019. However, the subsequent expansion of the mobile sector, and significant growth in the wider economy, mean that, by year 2, the annual impact is positive, while the cumulative impact becomes positive by year 3. The gain in tax revenue is potentially approximately $22 million per annum by 2023.
The summary of the sector-specific and economic impacts in 2023 is shown in Figure 19.
4.5 Elimination of special consumption tax on mobile services provided to companies (ICE)
116. The remaining new connections are personal SIMs. This impact is driven by further network roll-out, enabled by additional reinvestment into building new mobile sites.117. As it is assumed that new business subscribers already own a personal mobile SIM, an increase in the number of business connections has no impact on the number of unique
subscribers.

REFORMING MOBILE SECTOR TAXATION IN ECUADOR
47
118. Please see Appendix B for further detail on the results of this analysis, including annual impacts between 2019 and 2023.
Annual impacts of eliminating special consumption tax on mobile services provided to companies (ICE), 2023118
Figure 19
Source: EY analysis
-14.5%price of services (for business)
+1.5%average revenue per user (total)
+4.7%data usage per connection (total)
+1.0%new connections (total)
+0.9%mobile broadband penetration (total)
+$52msector revenue (total)
+0.12%productivity gain
+2,100new jobs
-$15mnet loss in tax revenue in 2019
+$152mGDP increase
+$85mtotal investment
+$22mannual gain in tax revenue by 2023
Mobile sector impacts Wider economic impacts
Elimination of special consumption tax on mobile services provided to companies (ICE)

REFORMING MOBILE SECTOR TAXATION IN ECUADOR
48
The mobile industry has the potential to play an increasingly important role in achieving Ecuador’s objectives set out in the National Development Plan 2017-2021, specifically by modernising the network infrastructure, improving access to modern technologies by households and businesses, encouraging FDI and driving productivity improvements across the economy. The mobile market in Ecuador has expanded rapidly over the past decade, with unique subscriber penetration increasing from 47% in 2008 to over 68% in 2018. The sector now generates approximately $2.1 billion in revenue, equivalent to 2.0% of GDP.
There is still significant scope to further develop the sector, specifically through increased penetration and incentivising customer migration to 3G and 4G technologies. Accelerating progress in these areas requires improvements in the affordability of mobile services for lower income segments of the population, as well as
further investment by operators to increase network coverage and network quality.
By promoting investment, reducing the cost of mobile services and incentivising usage, the tax reforms outlined in this report would help to connect individuals to mobile services. Effective tax policy in the mobile sector, as well as robust spectrum management, will incentivise further investment into networks and growth of the mobile ecosystem, which is particularly important in the context of investment decisions mobile operators across the world are making in relation to the development and deployment of new technologies such as 5G.
A more balanced and efficient taxation structure, which addresses some of the most distortive taxes in the mobile economy in Ecuador would generate considerable socio-economic benefits in the country. A summary of the impacts is provided in Table 8.
5. Conclusion: Reforming mobile sector taxation in Ecuador
119. In this scenario, the value refers to the number of additional connections, as the market growth is driven by incremental business subscribers, as opposed to new unique personal connections in other scenarios.
Summary of socio-economic benefits of the proposed tax reforms, by 2023
Table 8
Indicator Reduction in recurring spectrum fees
Reduction in market concentration fee
Elimination of special consumption tax on
mobile services provided to companies (ICE)
New unique subscribers +336,000 +166,000 +172,000119
Sector revenue +$48m +$26m +$52m
GDP increase +$308m +$139m +$152m
Wider investment +$171m +$78m +$85m
Annual gain in tax revenue +$39m +$14m +$22m

REFORMING MOBILE SECTOR TAXATION IN ECUADOR
49
The policy options for reform outlined in this report would contribute to achieving a number of key objectives for the mobile sector and wider Ecuadorian economy. This includes supporting the National Development Plan 2017-2021 objectives of achieving sustainable economic growth, diversifying Ecuadorian economy and increasing productivity. Furthermore, these tax reforms will be aligned with the principles of taxation which have been developed by the IMF, World Bank, OECD and UN, by:
• Reducing the level of specific taxation;
• Favouring the use of broad-based forms of taxation, such as VAT; and
• Making the tax system more equitable, recognising the positive externalities of mobile services.
These reforms would be self-sustainable in terms of revenue, and, at the same time, will make the tax regime more attractive for investment in the mobile sector.

REFORMING MOBILE SECTOR TAXATION IN ECUADOR
50

REFORMING MOBILE SECTOR TAXATION IN ECUADOR
• A model of the Ecuadorian mobile sector, the ‘telecoms market model’ has been created to calculate changes in the mobile sector resulting from each of the tax policy scenarios. This includes the change in subscribers, usage, technology, revenues, profits, reinvestment and expanded capacity in the sector; and
• The wider economic impacts of each tax policy scenario are assessed via a Computable General Equilibrium (CGE) model, namely the standard version of the Global Trade Analysis Project (GTAP) model and its associated dataset.
Appendix A MethodologyThis Appendix sets out the methodology applied in this study to calculate the potential economic impacts of tax policy scenarios. As described in Section 4, the economic modelling is undertaken in two stages, using two models:
51

REFORMING MOBILE SECTOR TAXATION IN ECUADOR
52
Mobile sector modellingDesign of the telecoms market model
The telecoms market model covers the period 2017–2023, and uses data from local mobile operators and the GSMA Intelligence database. For modelling the scenarios, it has been assumed that the first phase of tax changes becomes
effective in 2019. The telecoms market model then calculates separate forecasts for each tax policy scenario. The difference between the scenario forecasts and the baseline is effectively the additional impact resulting from the tax policy reform.120
A schematic of this model is presented in Figure 20 below.
120. The baseline forecast is the counterfactual scenario for which results are compared against. It is based on market forecasts by operators and GSMAi over the period 2018-2023.
Figure 20
Source: EY analysis
Overview of mobile sector modelling approach
Tax / free change
Pass-through rateSource: Macro model and previous tax studies
Revenue going to customers Revenue going to operators
Change in price of services or handsets
Price elasticities of demand
Source: Literature review
Additional technology migration
Reinvestment rateSource: Literature review
Additional reinvestment Increased profits
Increased coverage
Building new sites Upgrading 2G sites to 3G / 4G
Change in usage per connection
Change in number of connections
Additional technology migration
Change in ARPUs
Change in market revenue The connections
are split by usage profile, payment type and technologyChange in tax
revenue
Ass
umpt
ions
and
cal
cula
tions
Out
puts
Quality and network improvements

REFORMING MOBILE SECTOR TAXATION IN ECUADOR
53
As illustrated in Figure 19, the telecoms market model captures the impact on consumer demand and operators’ profits and investment as a consequence of a mobile taxation reform. The model allows for the estimation of the additional connections, technology migration and mobile penetration generated across different usage profiles (categorised by low, medium and high-income groups), and across 2G, 3G and 4G services.
Mobile market impacts
For consumers, a reduction in the tax rate leads to a decrease in the effective price of mobile services or handsets. The relationship between the size of the tax reduction and the related decrease in prices is dependent on the level of “pass-through”.121 The resulting reduction in the effective price of mobile services is modelled to have the following impacts:
• An increase in usage per connection, as lower prices lead to increased demand for services;
• An increase in the number of connections, as lower prices reduce the relative cost of mobile ownership which attracts new subscribers; and
• Additional technology migration, as lower prices for smartphones and / or cheaper data services accelerates the migration of existing subscribers from 2G services to 3G / 4G services.
For operators the proportion of the tax reduction that is not passed through in the form of lower prices would either be retained as increased profit or reinvested. The decision between these two options depends on an assumption made on the reinvestment rate.122 The following effects of additional investment are estimated using the telecoms market model:
• An increase in the number of subscribers, as the investment enables the building of new mobile sites and, hence, increased network coverage;
• Additional technology migration, as the investment enables upgrade of 2G sites to 3G / 4G and, therefore, existing subscribers have the opportunity to upgrade from 2G to 3G / 4G services; and
• A decrease in the effective price of data driven by investment made by operators to improve the capacity of existing mobile sites. As this improves the quality and speed of mobile broadband connections, subscribers are be able to download more content. This further incentivises 2G customers to migrate to 3G and 4G technologies.
Key outputs
The key outputs of the telecoms market model include changes to the baseline forecast in respect of:
• the number of connections;
• the number of unique subscribers;
• mobile market penetration;
• total market revenue; and • sector taxation receipts.
For connections and subscribers the model specifies market segments by usage profile (high, medium and low), technology (2G, 3G and 4G) and payment type (prepay and postpay). Therefore the telecoms market model is run for a total of 18 categories of subscribers.
Macro-economic modellingMacro-economic modelling approach
The macro-economic model builds upon the mobile sector analysis to estimate how lower taxes and prices feed through to the wider economy. This takes into account forward and backward linkages in the supply chain (i.e. supply chain for mobile service providers, and where mobile services are used in other sectors of the economy), the interaction between expanding businesses and a rise in household incomes and employment, and an assumed productivity gain across the economy as mobile penetration rises. This model gives an estimate of the dynamic impact on total tax receipts, allowing for all these indirect effects to work through the economy.
The macro-economic impacts are modelled in two stages:
• The impact of the tax change on the sector itself and the interaction with the wider economy; and
• A boost to economy-wide productivity resulting from the increase in penetration.
The impact of the mobile sector on the wider economy starts from its supply chain linkages. In particular, telecommunications is an important input to businesses right across the Ecuadorian economy. As lower taxes and consequent lower prices are passed on, many businesses will benefit and be able to expand their own outputs. Businesses that supply the mobile sector will also benefit from its expansion (see Figure 21).
121. The percentage of the tax / fee change which is passed through to subscribers in the form of lower prices. This is calculated based on the relative slope of the supply and demand curves for mobile services.
122. The percentage of the tax / fee change not passed through to subscribers which is reinvested by operators.

REFORMING MOBILE SECTOR TAXATION IN ECUADOR
54
The wider interactions in the economy lead to a virtuous circle of economic expansion:
• The forward and backward linkages from the mobile sector lead to expansion in a number of related sectors, and this in turn creates more expenditure circulating in the economy;
• The mobile communications sector will see increased investment, as it is now relatively more profitable than in the baseline;
• Overall household incomes will expand, leading to more spending in the wider economy and an increase in aggregate savings to fund investment;
• Higher real wages attract more people into the workforce, expanding employment and in turn further boosting spending in the economy;
• A larger economy requires more investment to complement the expansion in employment and to support the larger capital stock, which will see growth in construction and in sectors making investment goods; and
• The economy is modelled to be constrained by available resources (workers, capital), so some sectors must contract to make way for the expanding sectors.
These linkage and interaction effects will be reinforced by an increase in productivity in the Ecuador economy, due to the rise in penetration of the mobile sector. This in turn leads to a further expansion in output, incomes and expenditure in the economy.
Supply chain linkages
Figure 21
Source: EY analysis
Other sectors supply to communications
Communication sectorOther sectors buy from
communications
These sectors will expand to provide enough inputs to the communications sector
Main winners are business services and energy
The sector expands following the reduction in taxes / fees
Prices reduce depending on pass-through rates
These sectors benefit from lower costs and are able to expand as well
Main winners are manufacturing and financial services

REFORMING MOBILE SECTOR TAXATION IN ECUADOR
55
The CGE model
CGE models reproduce the structure of the whole economy by mapping all existing economic transactions among diverse economic agents (e.g. households, firms). They are large-scale numerical models that simulate the core economic interactions in the economy, and replicate the circular flow of the economy (see Figure 22). They are based on the economic theory of general equilibrium; i.e. that
supply and demand for goods, services and factors of production in the economy must be balanced. Economic relationships in CGE models are based on theory and empirical evidence from the academic literature. The prices of goods, services and factors of production adjust until all markets clear, that is, until they are simultaneously in equilibrium.
Central in CGE modelling is the choice of closure rules. This relates to the specification of endogenous (those determined by the model) and exogenous (those determined externally) variables. In the standard GTAP model prices, quantities of all non-endowment commodities (e.g. produced and
traded commodities) and regional incomes are endogenous variables, while policy variables, technical change variables and population are exogenous to the model.123 This standard closure is amendable with a wide range of alternative options available depending on modelling assumptions adopted.
123. T.W. Hertel, 1997, Global Trade Analysis: Modelling and Applications.
Circular flow of the economy
Figure 22
Source: Adapted from M. Burfisher, 2011, Introduction to Computable General Equilibrium Models
Government
Goods & Services
ExportsImports
Factors of Production
FirmsHouseholds
Pay taxes Pay taxes
Receive transfers
Receive subsidies
Sale of goods and services
Employ & purchase factors of production
Supply factors of
production
Purchase goods & services Purchase intermediate
goods & services
Receive income from factors of
production

REFORMING MOBILE SECTOR TAXATION IN ECUADOR
56
124. All taxes affecting the production and consumption of mobile services and mobile phones in Ecuador (e.g. turnover, excise, VAT) are combined to estimate the effective (compound) tax rates on final and intermediate consumption of goods and services.
Scenario modelling
The CGE model is used to conduct a number of tax policy simulations and hence assess the impacts of detailed policy scenarios on the wider economy. The approach is as follows:
• First, the effective tax on Communication Services (which includes mobile services) is calculated;124
• Second, GTAP model parameters (e.g. own-price and cross-price elasticities) and closure rules (e.g. related to employment assumptions) are adjusted to ensure better alignment with the mobile telecoms market and broader characteristics of Ecuador;
• Third, simulation scenarios are run that account for the direct effect of taxes and tariffs on prices and a productivity improvement from any increase in mobile penetration (see Figure 23); and
• Finally, simulations are performed estimating the new equilibrium following the policy shocks introduced.
Overview of macro-economic modelling approach
Figure 23
Source: EY analysis
Elasticities
Source: Telecoms market model
Closure rules: Adjusted standard GTAP model closure allowing for unemployment
Source: GTAP best practice, EY analysis
Step
2
GTAP modelling specification including parameter adjustment and closure rules
Simple price effects
Source: EY analysis
Productivity gain
Source: Lit review and telecoms market model
Step
3
Simulation scenario specification
The GTAP model transfers tax policy changes through communication services and electronics products sectors to the wider economy in a number of ways:
Step
4
Macro-economic transmission mechanism
Tax / fee change on mobile phones and apparatus
Source: EY analysis
Proportion of mobile phones in electronics
Source: National statistical offices & GTAP
Tax / fee change on mobile telecoms
Source: EY analysis
Proportion of mobile telecoms in communications
Source: National statistical offices & GTAP
Step
1
Tax / fee rate change calculation
Alignment to GTAP classification
Effective tax calculation projected to GTAP target sectors Effective tax on communication services
Source: EY analysis
Effective tax on mobile phones
Source: EY analysis
Backward and forward linkages from communications and electronics sectors
Interaction of product markets (cheaper mobile), factor markets (earned income and spending) and capital markets (savings and investment)
Productivity growth across the wider economy as mobile penetration increases

REFORMING MOBILE SECTOR TAXATION IN ECUADOR
57
The impact of changes in tax policy on pricing
Mobile taxation policy changes may be fully or partially passed through to consumer prices for mobile goods and services. The extent of pass-through depends on specific market factors (e.g. the extent of competition in the
specific market) and is likely to vary by sector and country.
Table 9 provides the pass-through rates used in macro-economic modelling for each scenario.
GTAP modelling of scenarios 1 and 2 using default assumptions results in a full pass-through rate, which is higher than the rate of pass-through in other countries in relation to similar tax reforms. Therefore, the modelling has applied pass-through rates drawn on the basis of benchmarks from previous GSMA studies on similar taxation reforms, and discussions with the Ecuadorian mobile operators.125
In scenario 1, it is assumed that 90% of the tax saving resulting from the tax reform would be passed on to subscribers in the form of lower prices. As spectrum fees represent a tax on production, this tax reform would reduce the cost of production of mobile services in Ecuador and would allow the mobile operators to optimise their cost structures, reduce their effective prices and reinvest into the network.
In scenario 2, the assumed pass-through rate for the reduction in market concentration fee is 60%. A lower pass-through rate is assumed in this scenario compared to the other scenarios to reflect the nature of this tax. The market concentration fee is only charged on mobile operators that have a share of the
total market exceeding 30%. Therefore larger operators have a disproportionately high tax burden and have to use their profit to pay extra taxes. Following reform, mobile operators are able to retain a higher share of the tax saving, which is then channelled into increased investment, or retained as higher profits.
The pass-through rate for scenario 3 for the elimination of special consumption tax on mobile services provided to companies (ICE) is derived from GTAP and stands at 96%, being in line with generally high levels of pass-through rates for consumption tax reforms in other GSMA studies. This calculation is based on relationships derived for Ecuador that are incorporated in the GTAP model, and which are based on input-output tables from national statistics and other empirical data on the Ecuadorian economy. Almost the full tax saving from the elimination of this tax would be passed on to businesses using mobile services as their input. This is driven by competitive market dynamics in Ecuador and the consumption nature of the tax, which makes it more “visible” to business subscribers, and hence more likely to be passed on.
125. Although the level of pass-through rate in GTAP is driven by the complex general equilibrium dynamics and cannot be chosen parametrically, the level of the price elasticity of demand has been adjusted in GTAP to match the impact on the demand for communication services with the results of the telecoms market model for scenarios 1 and 2.
Pass-through rates derived for each scenario
Table 9
Indicator Reduction in recurring spectrum fees
Reduction in market concentration fee
Elimination of special consumption tax
on mobile services provided to companies
(ICE)
Pass-through rate 90% 60% 96%
REFORMING MOBILE SECTOR TAXATION IN ECUADOR
58
126. GSMA, 2017, Taxing mobile connectivity in Sub-Saharan Africa: a review of mobile sector taxation and its impact on digital inclusion, https://www.gsma.com/mobilefordevelopment/wp-content/uploads/2017/07/Taxing-mobile-connectivity-in-Sub-Saharan-Africa_July-2017.pdf.
127. World Bank, https://datahelpdesk.worldbank.org/knowledgebase/articles/906519-world-bank-country-and-lending-groups.
Calculation of the total cost of mobile ownership (TCMO)The concept of TCMO refers to the total cost of owning and using a mobile phone by a subscriber. The TCMO is calculated by the GSMA on the monthly basis using data from GSMA Intelligence and Tarifica, and includes the following three components:126
• Handset cost, the calculation of which is based on the price of the cheapest handset with internet browsing capability offered by local mobile operators. The one-off cost of the handset is spread over its assumed lifetime. For developing countries, the average lifetime of a mobile handset is assumed to be 36 months;
• Connection charges, including the activation charge or any other fee to connect to the mobile network, where applicable. These usually take the form of a fee for the activation of a SIM card or a mobile phone number. They are also spread over 36 months in a similar manner to handsets; and
• Usage costs, including voice, data and messages services. Usage costs are based on the cheapest available mobile plan for each consumption basket across all operators in the market, which is selected to represent regular usage and consumption patterns.
In order to account for different usage profiles, the TCMO is presented in this report for the following consumption baskets:
• Low basket: includes 500MB of data; and
• Medium basket: includes 1,000 MB of data, 250 voice minutes and 100 SMS.
In order to reflect differences in income levels in various countries, the TCMO is expressed as a proportion of monthly income per capita across different income quintiles. Income data is taken from the World Bank databank.
Key assumptions for EcuadorThe assumptions underlying the mobile sector and macro-economic modelling for this study are based on an extensive literature review and are presented in more detail below.
Price elasticity of demand
The impact of price changes on the consumption of mobile services is captured via estimates of the price elasticity of demand (PED), which measures the change in quantity demanded following a change in price.
A literature review has been conducted (covering 30 studies), as a basis for establishing a set of assumptions on the PED.
For purposes of this study, we define three sets of PEDs:
• Mobile usage elasticities which relate to the change in usage per connection following a change in price;
• Mobile ownership elasticities which relate to the change in the number of connections following a change in the price of services and handsets; and
• Technology migration elasticities which relate to the migration from 2G to 3G / 4G services following a change in the price of data, and a change in the price of handsets.
All elasticities in this study are further varied by income groups of subscribers (low, middle and high).
To establish relevant price elasticities for Ecuador, we have used a set of studies pertaining to middle income countries (Ecuador is defined as an upper-middle income economy by the World Bank).127
The following price elasticities of demand have been assumed in this study:
• Usage elasticities: from -0.62 to -0.79 for voice and from -0.98 to -1.25 for data;
• Ownership elasticities: from -0.68 to -0.87 for mobile services; and
• Technology migration elasticities: from -0.22 to -0.28 for data.

REFORMING MOBILE SECTOR TAXATION IN ECUADOR
59
In scenario 3, modelling the elimination of special consumption tax on mobile services provided to companies (ICE), it is assumed that business connections belong to the high usage postpay group. Therefore a set of PEDs for high income subscribers is used, which are at the lower bound of the ranges presented above and reflect a lower sensitivity of business subscribers to price changes.
Reinvestment rate
The exact reinvestment rate depends on a range of factors, including the cash flow of a specific company. In the modelling, it is assumed that operators re-invest 60% of the portion of the tax reduction that they retain (i.e. the proportion that is not passed onto subscribers). The remaining 40% is retained as increased profit. This assumption is based on a review of previous studies of the economic impacts of mobile taxation reforms.128
The data from the Ministry of Telecommunications and Information Society suggests that 3G covers 91% and 4G – 53% of the Ecuadorian population. Further investment is therefore required to both extend the 3G and 4G networks and upgrade the existing sites. The modelling assumes that the reinvestment is allocated between building the new 3G sites and upgrading the existing 3G sites to 4G level in equal proportions.
Total factor productivity impact
The benefits of mobile connectivity – and how they translate to the macro economy – have been widely studied in the literature. The effects of mobile connectivity on the economy are largely delivered through their impact on productivity, one of the main measures being total factor productivity (TFP).129
It has been assumed that a 1% increase in unique subscriber penetration leads to a 0.13% increase in total factor productivity.130 This value is based on a review of the literature, and with reference to previous studies conducted by the GSMA.131
In this study, the shock to TFP is modelled as a change in the productivity of all primary factors (of equal proportions) in the Ecuadorian economy. This productivity change enters as a variable into the constant elasticity of substitution (CES) value-added production function.132 The TFP shock works in the Ecuador model as the sum of two effects:
• by reducing production costs which are passed on to consumers through lower prices, which in turn leads to higher demand and production levels (the output effect); and
• by reducing the demand for primary factors, for a given output level (productivity effect).
128. See, for example, S. Gilchrist and C. Himmelberg, 1995, “Evidence on the role of cash flow for investment” and R. Katz, 2012, “Assessment of the economic impact of taxation on communications investment in the United States”.
129. TFP is a measure for how efficiently an economy uses inputs during its production process.130. Given a lack of evidence from the literature, which would differentiate the TFP impact between personal and business subscribers, this study used the same productivity impact
parameter for increases in personal and business subscriber penetration.131 This calculation is based on previous GSMA analysis which outlines the relationship between mobile penetration rates, infrastructure and productivity.132. The factor substitution effect is zero, as the productivity of all factors changes in the same proportions.

REFORMING MOBILE SECTOR TAXATION IN ECUADOR
60
Source: EY analysis
Time path for the transition to the new equilibrium
Figure 24
0%
20%
40%
60%
80%
100%
120%
2019 2020 2021 2022 2023
83%95% 100%
% o
f ch
ang
e 67%
Timing of macro-economic impacts
The standard GTAP model seeks to calculate differences in key economic variables between different possible states of the economy – a baseline case and a policy scenario – at a fixed point in time. This means that the standard model is a comparative static model and does not model year-by-year changes to the new equilibrium.
The CGE literature on the dynamic impacts of tax policy on a country’s GDP suggests that the transition to a new equilibrium takes on average 5-10 years with the annual impact on GDP increasing at a diminishing rate.133
Using this evidence from the literature, we have formed assumptions on the transition path between the baseline case and the policy change. We assumed that 67% of the steady state impact is felt in 2020 (the next year following the policy is implemented), 83% in 2021, 95% in 2022 and 100% in 2023 (five years after the policy implementation). The productivity effects are assumed to come into effect from 2020. The assumed path is illustrated in Figure 24 below.
Closure rules in the macro-economic model
In order to account for specific labour market conditions in Ecuador, a specific closure rule has been applied in GTAP in relation to employment and wages. The standard approach in CGE models is to assume that the supply of labour is fixed, and hence an increase in the demand for labour results in an increase in wages and prices, rather than employment. However, data from International Labour Organization demonstrates that the highest rate of unemployment is among people with an intermediate to advanced skill set.
Therefore, the modelling approach allows for employment to increase in the “Technicians / associate professionals” category. This means that an expansion of demand leads to both an increase in employment and an increase in wages in the economy.
133. See, for example, HMRC, 2014, The Dynamic Effects of Fuel Duty Reductions; HMRC, 2013, The Dynamic Effects of Corporation Tax; and J. Giesecke and N. Nhi, 2009, “Modelling Value-Added Tax in the Presence of Multiproduction and Differentiated Exemptions”.

REFORMING MOBILE SECTOR TAXATION IN ECUADOR
Appendix B Scenario estimations
61

REFORMING MOBILE SECTOR TAXATION IN ECUADOR
62
134. The reported change in price refers to an effective price as opposed to a headline price. Therefore, any bonus airtime is treated as a decrease in effective price.135. This is the initial direct cost to the Exchequer, before behavioural change in the sector and the economy; overstates the true cost.136. For some of the variables included below, the impact has been calculated as at 2023.137. The productivity impact of the tax reform is assumed to take place in year 2 onwards, resulting in an increase in government tax receipts.
This Appendix sets out the detailed estimated mobile market and economic impacts of each of the tax scenarios, compared to a baseline case of no tax reform.
Scenario 1: Reduction in recurring spectrum fees
This scenario models a 50% reduction in the level of recurring spectrum fees.
Annual impact of reducing recurring spectrum fees on selected variables
Table 10
Indicator 2019 2020 2021 2022 2023
MOBILE SECTOR IMPACTS
Change in effective price of services134 vs baseline -2.7%
Incremental connections (total) 172,000 368,000 391,000 413,000 435,000
Incremental unique subscribers (total) 139,000 292,000 306,000 321,000 336,000
Incremental connections (3G and 4G) 199,000 426,000 452,000 479,000 506,000
of which technology migration 47,000 98,000 98,000 98,000 98,000
Incremental connections by low-income subscribers 126,000 272,000 291,000 310,000 329,000
ARPU (total) vs baseline -1.5% -0.2% -0.2% -0.2% -0.2%
Increase in mobile penetration (connections) 1.0% 2.1% 2.2% 2.3% 2.4%
Increase in mobile penetration (unique subscribers) 0.8% 1.7% 1.7% 1.8% 1.9%
Increase in mobile penetration (unique MBB subscribers) 0.9% 1.9% 2.0% 2.1% 2.2%
Data usage vs baseline 2.7% 5.5% 5.6% 5.6% 5.7%
Data usage per connection vs baseline 1.5% 3.1% 3.1% 3.1% 3.1%
Increase in market revenue (total) -$ 6m $ 40m $ 42m $ 45m $ 48m
Increase in market revenue (total) vs baseline -0.3% 2.2% 2.2% 2.3% 2.3%
Additional investment $ 3m $ 3m $ 3m $ 3m $ 3m
Static tax impact135 -$ 55m -$ 55m -$ 55m -$ 55m -$ 55m
Impact on mobile sector taxation -$ 57m -$ 46m -$ 45m -$ 45m -$ 44m
WIDER ECONOMIC IMPACTS136
Full impact on communications sector taxation137 -$ 42m -$ 40m -$ 40m -$ 39m -$ 39m
Receipts from all other sectors $ 7m $ 55m $ 67m $ 75m $ 79m
Total tax receipts -$ 35m $ 15m $ 27m $ 36m $ 39m
Cumulative total receipts -$ 35m -$ 20m $ 7m $ 43m $ 82m
Real GDP $ 23m $ 207m $ 256m $ 293m $ 308m (0.30%)
Employment Impact estimated for 2023 only 4,596 (0.06%)
Household income Impact estimated for 2023 only $ 253m (0.36%)
Household expenditure Impact estimated for 2023 only $ 232m (0.37%)
Investment Impact estimated for 2023 only $ 171m (0.68%)

REFORMING MOBILE SECTOR TAXATION IN ECUADOR
63
138. This figure demonstrates the factors driving the change in mobile market revenue compared to the baseline case on no reform.
Source: EY analysis
Connections and penetration impacts of reducing recurring spectrum fees
Figure 25
Penetration – connections (right axis)
Penetration – unique subscribers (right axis)
Connections Unique subscribers
20202017 202120192018 2022 2023
1.9%1.8%1.7%1.7%
2.4%2.3%2.2%
2.1%
0.8%
1.0%
0
50
200
150
100
250
300
400
350
450
500
0.0%
0.5%
1.0%
1.5%
2.0%
2.5%
3.0%
tho
usan
d
% o
f p
op
ulat
ion
Source: EY analysis
Main drivers of the market revenue change following a reduction in recurring spectrum fees
Figure 26138
51
0
40
60
80
100
20
120
(58)55
Change in connections
Change in usage per connection
Change in effective price (services)
Total
$ m
48

REFORMING MOBILE SECTOR TAXATION IN ECUADOR
64
Source: EY analysis
Reduction in recurring spectrum fees – annual impacts on tax receipts, $ m
Figure 27
Other sectorsCommunications sector Total
20
20
40
40
0
60
80
100
60 202120202019 2022 2023
$ 7m$ m
-$ 42m -$ 40m -$ 40m -$ 39m -$ 39m
-$ 35m
$ 55m$ 67m
$ 75m $ 79m
$ 15m$ 27m
$ 36m $ 39m

REFORMING MOBILE SECTOR TAXATION IN ECUADOR
65
Scenario 2: Reduction in market concentration fee
This scenario would reduce all of the rates paid for the market concentration fee by 50%.
Annual impact of reducing the market concentration fee on selected variables
Table 11
Indicator 2019 2020 2021 2022 2023
MOBILE SECTOR IMPACTS
Change in effective price of services vs baseline -0.9%
Incremental connections (total) 63,000 142,000 165,000 189,000 215,000
Incremental unique subscribers (total) 51,000 112,000 129,000 147,000 166,000
Incremental connections (3G and 4G) 71,000 156,000 178,000 202,000 228,000
of which technology migration 15,000 32,000 32,000 32,000 32,000
Incremental connections by low-income users 47,000 107,000 127,000 148,000 169,000
ARPU (total) vs baseline -0.5% 0.0% 0.0% 0.0% 0.0%
Increase in mobile penetration (connections) 0.4% 0.8% 0.9% 1.1% 1.2%
Increase in mobile penetration (unique subscribers) 0.3% 0.6% 0.7% 0.8% 0.9%
Increase in mobile penetration (unique MBB subscribers) 0.3% 0.7% 0.8% 0.9% 1.0%
Data usage vs baseline 1.0% 2.0% 2.2% 2.4% 2.5%
Data usage per connection vs baseline 0.5% 1.1% 1.2% 1.2% 1.2%
Increase in market revenue (total) -$ 1m $ 17m $ 20m $ 23m $ 26m
Increase in market revenue (total) vs baseline 0.0% 0.9% 1.0% 1.1% 1.3%
Additional investment $ 6m $ 7m $ 7m $ 7m $ 7m
Static tax impact -$ 27m -$ 27m -$ 28m -$ 29m -$ 31m
Impact on mobile sector taxation -$ 27m -$ 24m -$ 24m -$ 24m -$ 25m
WIDER ECONOMIC IMPACTS
Full impact on communications sector taxation -$ 24m -$ 23m -$ 23m -$ 23m -$ 23m
Receipts from all other sectors $ 4m $ 26m $ 32m $ 36m $ 37m
Total tax receipts -$ 20m $ 3m $ 9m $ 13m $ 14m
Cumulative total receipts -$ 20m -$ 17m -$ 8m $ 4m $ 19m
Real GDP $ 8m $ 93m $ 116m $ 132m $ 139m (0.14%)
Employment Impact estimated for 2023 only 1,957 (0.03%)
Household income Impact estimated for 2023 only $ 114m (0.16%)
Household expenditure Impact estimated for 2023 only $ 105m (0.17%)
Investment Impact estimated for 2023 only $ 78m (0.31%)

REFORMING MOBILE SECTOR TAXATION IN ECUADOR
66
Source: EY analysis
Connections and penetration impacts of reducing the market concentration fee
Figure 28
Source: EY analysis
Main drivers of the market revenue change following a reduction in market concentration fee
Figure 29
26
(18)19
Change in connections
Change in usage per connection
Change in effective price (services)
Total
$ m
26
0
10
15
20
30
40
25
35
45
5
50
Penetration – connections (right axis)
Penetration – unique subscribers (right axis)
Connections Unique subscribers
20202017 202120192018 2022 2023
0.9%0.8%
0.7%0.6%
1.2%1.1%
0.9%0.8%
0.3%
0.4%
0
50
100
150
200
250
0.0%
0.2%
0.4%
0.6%
0.8%
1.0%
1.2%
1.4%
tho
usan
d
% o
f p
op
ulat
ion

REFORMING MOBILE SECTOR TAXATION IN ECUADOR
67
Source: EY analysis
Reduction in market concentration fee – annual impacts on tax receipts, $ m
Figure 30
Other sectorsCommunications sector Total
10
0
-10
-20
30
40
50
202120202019 2022 2023
$ 4m$ m
-$ 24m -$ 23m -$ 23m -$ 23m -$ 23m
-$ 20m
$ 26m$ 32m
$ 36m $ 37m
$ 3m $ 9m$ 13m $ 14m
-30
20

REFORMING MOBILE SECTOR TAXATION IN ECUADOR
68
Scenario 3: Elimination of special consumption tax on mobile services provided to companies (ICE)
This scenario models the impact of eliminating the existing special consumption tax on the services mobile operators provide to other domestic sectors.
Annual impact of eliminating the special consumption tax on mobile services provided to companies (ICE) on selected variables
Table 12
Indicator 2019 2020 2021 2022 2023
MOBILE SECTOR IMPACTS
Change in effective price of services vs baseline (for business subscribers) -14.5%
Incremental connections (total) 71,000 151,000 158,000 165,000 172,000
of which business connections 70,000 148,000 154,000 159,000 164,000
Incremental unique subscribers (total)139 1,000 2,000 3,000 5,000 6,000
Incremental connections (3G and 4G) 64,000 137,000 146,000 155,000 164,000
of which technology migration 1,000 2,000 2,000 2,000 2,000
Incremental connections by low-income users 1,000 2,000 3,000 5,000 7,000
ARPU (total) vs baseline 0.0% 1.4% 1.4% 1.5% 1.5%
Increase in mobile penetration (connections) 0.4% 0.9% 0.9% 0.9% 1.0%
Increase in mobile penetration (unique subscribers) 0.0% 0.0% 0.0% 0.0% 0.0%
Increase in mobile penetration (unique MBB subscribers) 0.0% 0.1% 0.1% 0.1% 0.1%
Increase in mobile penetration (total MBB connections) 0.4% 0.8% 0.8% 0.9% 0.9%
Data usage vs baseline 2.8% 5.8% 5.8% 5.8% 5.8%
Data usage per connection vs baseline 2.3% 4.7% 4.7% 4.7% 4.7%
Increase in market revenue (total) $ 8m $ 45m $ 47m $ 50m $ 52m
Increase in market revenue (total) vs baseline 0.4% 2.4% 2.4% 2.5% 2.5%
Additional investment $ 0.6m $ 0.6m $ 0.6m $ 0.6m $ 0.6m
Static tax impact -$ 27m -$ 27m -$ 28m -$ 29m -$ 30m
Impact on mobile sector taxation -$ 24m -$ 17m -$ 17m -$ 18m -$ 18m
WIDER ECONOMIC IMPACTS
Full impact on communications sector taxation -$ 22m -$ 21m -$ 21m -$ 21m -$ 21m
Receipts from all other sectors $ 7m $ 31m $ 37m $ 41m $ 43m
Total tax receipts -$ 15m $ 10m $ 15m $ 20m $ 22m
Cumulative total receipts -$ 15m -$ 6m $ 10m $ 30m $ 51m
Real GDP $ 9m $ 102m $ 126m $ 144m $ 152m (0.15%)
Employment Impact estimated for 2023 only 2,107 (0.03%)
Household income Impact estimated for 2023 only $ 124m (0.18%)
Household expenditure Impact estimated for 2023 only $ 112m (0.18%)
Investment Impact estimated for 2023 only $ 85m (0.34%)
139. It is assumed that new business connections, generated as a result of the tax reform, already own a personal SIM. Therefore unique subscriber impacts in this scenario are limited to the effects of additional investment.

REFORMING MOBILE SECTOR TAXATION IN ECUADOR
69
Source: EY analysis
Connections and penetration impacts of eliminating the special consumption tax on mobile services provided to companies (ICE)
Figure 31
Penetration – connections (right axis)
Penetration - MBB connections (right axis)
Connections Incremental connections (3G and 4G)
20202017 202120192018 2022 2023
0.9%0.9%0.8%0.8%
1.0%0.9%0.9%
0.9%
0.4%
0.4%
0
20
40
60
80
100
120
140
160
180
200
tho
usan
d
0.0%
0.2%
0.4%
0.6%
0.8%
1.0%
% o
f p
op
ulat
ion
1.2%
Source: EY analysis
Main drivers of the market revenue change following the elimination of special consumption tax on mobile services provided to companies (ICE)
Figure 32
Change in connections
Change in usage per connection
Change in effective price (services)
Total
$ m
52
0
20
30
40
50
70
80
60
10
90
20
64
(32)

REFORMING MOBILE SECTOR TAXATION IN ECUADOR
70
Source: EY analysis
Elimination of special consumption tax on mobile services provided to companies (ICE) – annual impacts on tax receipts, $ m
Figure 33
Other sectorsCommunications sector Total
10
0
-10
-20
-30
30
40
50
202120202019 2022 2023
$ 7m$ m
-$ 22m -$ 21m -$ 21m -$ 21m -$ 21m
-$ 15m
$ 31m$ 37m
$ 41m $ 43m
$ 10m$ 15m
$ 20m$ 22m20

REFORMING MOBILE SECTOR TAXATION IN ECUADOR
71

GSMA HEAD OFFICEFloor 2The Walbrook Building25 WalbrookLondon EC4N 8AF United KingdomTel: +44 (0)20 7356 0600Fax: +44 (0)20 7356 0601
For full report please visit the GSMA website at www.gsma.com