reflection model as applied for the analysis of enhancements of solar cosmic rays at different...
TRANSCRIPT

0010-9525/04/4203- © 2004
MAIK “Nauka
/Interperiodica”0219
Cosmic Research, Vol. 42, No. 3, 2004, pp. 219–227. Translated from Kosmicheskie Issledovaniya, Vol. 42, No. 3, 2004, pp. 228–237.Original Russian Text Copyright © 2004 by Grigorenko, Lyubimov.
1. INTRODUCTION
The 22nd cycle of solar activity (SA) was very richin solar proton events and geomagnetic disturbancesaccompanying them. This cycle of SA began in October1986 and reached its maximum in July 1989. The mainpart of the powerful proton events took place in theperiod from March 1989 to May 1990. It seemed that adecrease of SA began at the end of 1990, but in theperiod from March to June 1991 its new jump tookplace, which was marked by, perhaps, the most interest-ing Sun–Earth events of the entire 22nd cycle.
Extremely high activity was observed in this periodon the Sun. As many as 38 solar flares of optical impor-tance
≥
2B
took place from March to June 1991, and29 flares accompanied by soft X-rays with the fluxvalue
≥
1X
. Strong solar flares are often accompaniedby fast and massive ejections of the coronal plasma(CME) with formation of shock waves in the interplan-etary space. The arrival of the shock wave to the Earthcan generate powerful geomagnetic disturbances (SC).In this period of time 18 SC recorded by 3 and moreground-based stations were observed [5], which indi-cated to the arrival to Earth of extremely strong distur-bances in the period from March to June 1991.
During powerful geomagnetic disturbances, theForbush-effect is frequently observed in the time pro-files of the intensity of galactic cosmic rays (GCR)measured by ground-based neutron monitors, i.e., arapid drop of intensity due to the passage of an inter-
planetary disturbance past the Earth. Such drops ofintensity of GCR can last for several days. The lowestvalue of intensity of GCR in relation to all precedingsolar cycles beginning from 1953 was detected in theperiod from March to June [7]. This is one more signif-icant fact demonstrating the presence of extreme condi-tions in the interplanetary space in this period, whichprevented GCR from propagating to the Earth throughthe heliosphere.
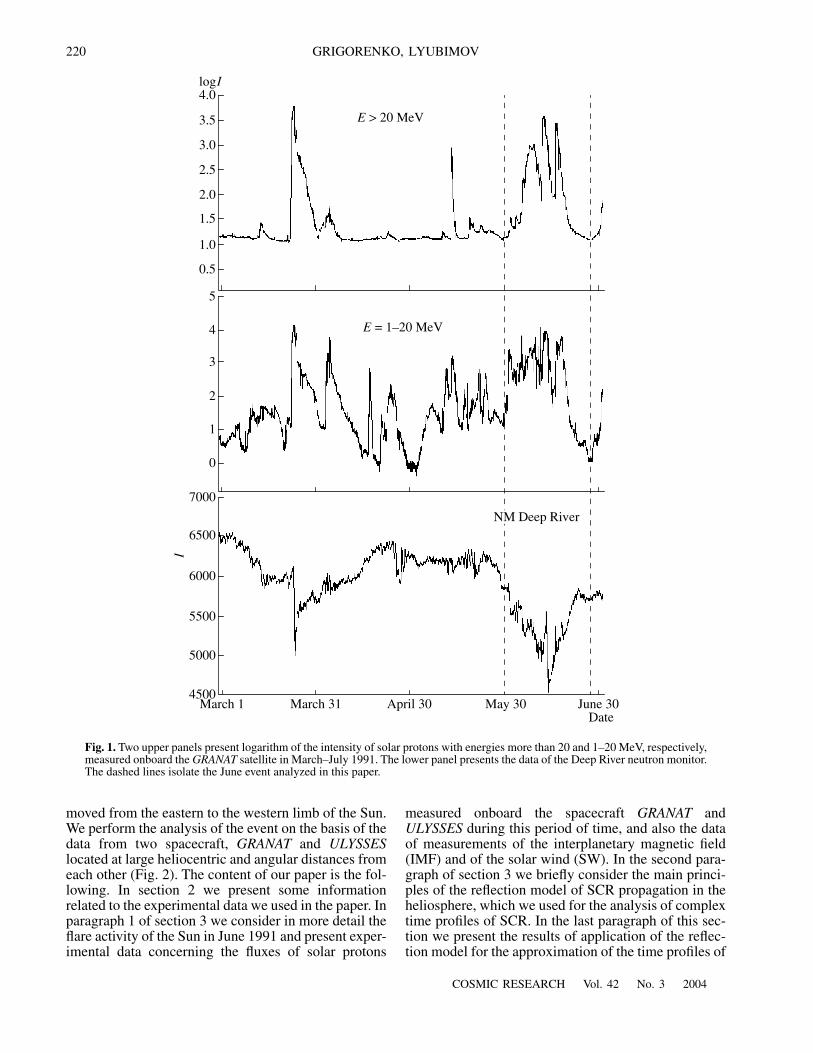
Many of the flares that happened from March toJune 1991 were accompanied by generation of ener-getic charged particles, solar cosmic rays (SCR). Pro-tons are one of the main components of SCR. Figure 1presents the time profiles of the fluxes of solar protonswith energies of 1–20 MeV and more than 20 MeVmeasured onboard the
GRANAT
satellite during theperiod from March to June and also the hourly data ofthe Deep River neutron monitor. It is clearly seen in thefigure that during the specified period of time threelarge-scale proton events took place in the interplane-tary space, whose duration is comparable with the timeof the solar rotation (
~28
days). These events wereaccompanied by Forbush-decreases of the intensity ofGCR, the absolute minimum of which was reached inJune. In this paper we consider precisely the June eventin SCR (marked by dashed lines in Fig. 1). In real fact,it consists of a whole series of sufficiently strongenhancements of the SCR flux. This event is of specialinterest because it was caused by a series of the flaresoccurred in one and the same active region (AR) as it
Reflection Model as Applied for the Analysis of Enhancements of Solar Cosmic Rays at Different Heliocentric Distances:
An Example of the Event Observed in June 1991 onboard
GRANAT
and
ULYSSES
Spacecraft
E. E. Grigorenko and G. P. Lyubimov
Skobeltsyn Institute of Nuclear Physics, Moscow State University
Received October 9, 2002
Abstract
—In this paper we consider a large-scale enhancement of the intensity of solar protons (
E
= 1–20 MeV) observed in June 1991 for 26 days at different points of interplanetary space, onboard
ULYSSES
(inthe time period under consideration it was located at a heliocentric distance of 3 AU, at an angular distance of
~70°
to the East of the Sun–Earth line and 3
°
to the South of the ecliptic plane) and
GRANAT
(which was orbit-ing around the Earth spending most of its flight time outside the Earth’s magnetosphere). An approximation ismade of the complex time profile of the enhancement of the solar cosmic ray (SCR) intensity on the basis ofthe reflection model of their propagation in the heliosphere. It has been established that, in this event, the trans-port of SCR particles in the interplanetary space was mainly carried out in the traps made up by the fronts ofradially moving flare disturbances. The parameters of these fronts obtained when modeling this enhancementof SCR allow one to estimate the characteristic dimensions of the regions of effective capture of SCR. Compar-ison of the results of approximations obtained for the data from
GRANAT
and
ULYSSES
spacecraft demon-strated an increase in the regions of capture of SCR when the radial distance from the Sun increases.
220
COSMIC RESEARCH
Vol. 42
No. 3
2004
GRIGORENKO, LYUBIMOV
moved from the eastern to the western limb of the Sun.We perform the analysis of the event on the basis of thedata from two spacecraft,
GRANAT
and
ULYSSES
located at large heliocentric and angular distances fromeach other (Fig. 2). The content of our paper is the fol-lowing. In section 2 we present some informationrelated to the experimental data we used in the paper. Inparagraph 1 of section 3 we consider in more detail theflare activity of the Sun in June 1991 and present exper-imental data concerning the fluxes of solar protons
measured onboard the spacecraft
GRANAT
and
ULYSSES
during this period of time, and also the dataof measurements of the interplanetary magnetic field(IMF) and of the solar wind (SW). In the second para-graph of section 3 we briefly consider the main princi-ples of the reflection model of SCR propagation in theheliosphere, which we used for the analysis of complextime profiles of SCR. In the last paragraph of this sec-tion we present the results of application of the reflec-tion model for the approximation of the time profiles of
5000
March 1 March 31 April 30 May 30 June 30
4500
5500
6000
6500
7000
NM Deep River
Date
0
1
2
4
5
E
= 1–20 MeV
3
0.5
1.5
3.0
4.0log
I
E
> 20 MeV
2.5
3.5
2.0
1.0
I
Fig. 1.
Two upper panels present logarithm of the intensity of solar protons with energies more than 20 and 1–20 MeV, respectively,measured onboard the
GRANAT
satellite in March–July 1991. The lower panel presents the data of the Deep River neutron monitor.The dashed lines isolate the June event analyzed in this paper.

COSMIC RESEARCH
Vol. 42
No. 3
2004
REFLECTION MODEL AS APPLIED FOR THE ANALYSIS 221
low energies SCR measured at different radial distancesfrom the Sun and at different angular distances withrespect to the central meridian.
2. EXPERIMENTAL DATA
In this paper we have used two series of data relatedto the hourly-averaged time profiles of the intensity ofsolar protons on the
GRANAT
satellite (energies 1–20 MeV) and on the
ULYSSES
spacecraft (energies0.9–19 MeV).
The
GRANAT
launched in December 1989 was a high-apogee satellite with an initial apogee of 200000 km, itsorbit inclination was
51°
, and the period of orbit revo-lution was equal to 4 days. Such parameters of the orbitallowed the satellite to reside in the interplanetaryspace outside the Earth’s magnetosphere for approxi-mately 90% of the flight time.
For the analysis of the SCR event made in this paperwe have used the data of the KS-18M monitor instru-ment consisting of two identical blocks mounted on thesolar and antisolar sides of the satellite. Each blockconsisted of two single semiconductor detectors, a tele-scope, and two gas-discharge counters. The fluxes ofprotons with energies in the range 1–100 MeV/nucleon,of
α
-particles with energies 4–90 MeV/nucleon, and ofelectrons with energies more than 0.1 MeV [4] weredetected.
The
ULYSSES
spacecraft, launched on October 6,1990, was the first vehicle launched for investigation ofthe interplanetary space at large angular distances fromthe ecliptic plane. The trajectory of its flight to the Sunconsisted of two sections: the flight to Jupiter (this sec-tion of the trajectory practically lay in the plane ofecliptic) and maneuver in the gravitational field of Jupi-ter with subsequent passing to the near-Sun orbit. In thefollowing, the orbit of
ULYSSES
practically went abovethe solar poles, its period was equal to 6 years.
The experiment aimed at measuring the fluxes ofSCR onboard
ULYSSES
consisted in the measurementof energetic nuclei and electrons of different energies,from 0.5 to 600 MeV/nucleon for nuclei from H to Ni,and from 4 to several hundreds of MeV for electrons.In this paper, we have used the data obtained fromthe LET instrument, the telescope designed for mea-surements of the fluxes of low energy particles(http://cdaweb.gsfc.nasa.gov/cgi-bin/cdaweb/eval2.cgi).This instrument allows one to make spectral measure-ments and to determine the chemical composition in thecharge range
Z
= 1–26 with the lower energy threshold0.9 MeV for protons and ~3.0 MeV/nucleon for the par-ticles with
Z
> 5.
3. DISCUSSION
3.1. Experimental Observations of the SCR Fluxesin June 1991 According to the Data of GRANAT
and ULYSSES
An extremely high flare activity was detected in theAR no. 6659 in June 1991. Although in this period sev-eral ARs were observed on the visible disk of the Sun,the flare activity in AR no. 6659 obviously dominatedover others. According to the estimates by the index ofX-ray emission [7], this AR was the most powerful ofall intersecting the solar disc from August 1972 toDecember 1994 [6].
Table 1 presents the flares that took place in ARno. 6659 since the instant of its emergency on the east-ern limb of the Sun (June 1, 1991). It is evident fromFig. 1 that such a high flare activity of the Sun in thefirst half of June was accompanied by a practicallymonotone decrease of GCR intensity, the absolute min-imum of which was reached on June 13, and by multi-ple SCs [5]. The most part of the flares which took placein AR no. 6659 had optical importance
≥
2B
and wereaccompanied by radio-emission of II and IV types indi-cating the ejection of the flare plasma with generationof a shock wave and accelerated particles, SCR. As aconsequence of this, a large-scale increase of the flux ofsolar protons occurred. It had a large amplitude (at1 AU the intensity of SCR with energies 1–20 MeVwas larger than the level of the background by 4.5orders of magnitude) and very complex time profileobserved simultaneously onboard two spacecraft(
GRANAT
and
ULYSSES
). The distance between thesespacecraft in this period of time was 2 AU in radialdirection and
~70°
in meridional direction (
ULYSSES
was located approximately
70°
to the East of the Sun–Earth line) (Fig. 2). In this paper we analyze the flux ofsolar protons with energies 1–20 MeV (data of
ULYSSES
.
May 29–June 26, 1991
The Sun
The Earth
GRANAT
Fig. 2.
Mutual location of
GRANAT
and
ULYSSES
inJune 1991 in the projection onto the ecliptic plane.

222
COSMIC RESEARCH
Vol. 42
No. 3
2004
GRIGORENKO, LYUBIMOV
GRANAT
) and with energies 0.9–19 MeV (data of
ULYSSES
). The total duration of the event for this rangeof energies was 26 days according to the data of
GRANAT
and 24 days according to the data of
ULYSSES
.
The onset of the event was observed on May 30simultaneously onboard both spacecraft, althoughonboard
GRANAT
a sharp increase of the intensity ofSCR was detected, which increased by almost2.5 orders of magnitude in approximately 11 h andreached the first local maximum. This maximum isprobably associated with the arrival of the front of theflare disturbance from flares nos. 1, 2 to the Earth(Table 1), which is testified by a sharp increase of theIMF magnitude measured at the Earth’s orbit by the
IMP-8
satellite (Fig. 3). At this time a slow and insig-nificant increase of the SCR flux was observed onboardthe
ULYSSES
, which can be associated with penetrationof a small fraction of SCR through the trap created bythe flare front. A sharp increase of the SCR intensityonboard
ULYSSES
and its first local maximum weredetected only on June 3 and 4, i.e., ~5 days after itsdetection onboard
GRANAT
.
After the first increase a whole series of increases ofintensity was observed in the time profile of the flux ofSCR detected onboard
GRANAT
(up to June 11). Theseincreases had specific triangular profiles of variousamplitudes. The peaks of intensity observed on June 4and 10 are the most pronounced of them. In [2, 3] it wasdemonstrated that such a form of the time profile ofSCR intensity can be caused by the redistribution of theparticles in dynamical traps created by the three frontsof the flare ejections taking place in one and the sameAR sequentially and moving one after another. Due todifferent velocities of motion of these ejections, thedimensions of the traps can vary, which results in thevariation of density of the particles trapped in them.Taking into account only this factor, namely, the varia-tion of the density of particles in the trap, in [2] we havesucceeded in obtaining a model profile of the flux of
SCR identical to the experimental one, although we donot rule out a possibility of additional acceleration ofparticles in such dynamical traps. The existence ofnumerous irregularities in the interplanetary space nearthe orbit of the Earth, which can be the traps for SCR ofthe considered energies is confirmed by the data onIMF and the solar wind (SW) (Fig. 3): during the entireevent the magnitude of the IMF vector had strong vari-ations, the amplitude of which reached 45 nT at theorbit of the Earth (Fig. 3). Unfortunately, no continuousdata on IMF and SW are available during the period ofJune 8–12, but from the fragmentary data presented inFig. 3 one may conclude that in this period the inter-planetary medium near the Earth was also disturbedrather strongly. This is confirmed by the monotonedecrease of the intensity of GCR, the absolute mini-mum of which was reached only on June 13.
The second increase of the intensity of SCR onboard
ULYSSES
began only on June 6, but it also had a suffi-ciently complicated time profile: against the back-ground of a plateau-shaped growth with a duration of~4.5 days several local maxima of intensity wereobserved. The data on IMF and SW measured onboard
ULYSSES
testify the existence of irregularities in theinterplanetary space, which were observed synchro-nously with the SCR enhancements, although theamplitude of variations in the magnitude of the IMFvector is not so large as at 1 AU, and the time behaviorof the SW velocity is smoother (Fig. 3), which is asso-ciated with a larger distance of
ULYSSES
from the Sunin relation to the
GRANAT
satellite.
Thus, according to the data of both spacecraft, thefirst half of the event in SCR (before June 11) had arather complex (not diffusion-like) time profile of the flux.This is associated with the fact that the frequency of suc-cession of the solar flares in AR no. 6659 (Table 1) in thefirst half of June was very high: the mean intervalbetween the adjacent flares was 1.5 days, which is lessthan the time of propagation of the flare front from thisflare to the Earth. Thus, during this period of time, in
Table 1.
The main parameters of the solar flares related to the enhancements of the SCR flux in the June 1991 event
No. of the flare Date, 1991 UT
max
, h:min Importance Location No. of AR Type of radio emission
1 May 29 23:43 2B/X1.0 05
°
N 38
°
E 6654
2 May 30 09:49 1B/M8.2 07
°
N 38
°
E 6654
3 June 1 15:03 1F/X12 25
°
N 90
°
E 6659 2/4
4 June 2 14:12 2B/M2.8 08
°
S 19
°
W 6652 2/4
5 June 4 03:57 3B/X12 34
°
N 65
°
E 6659 2/4
6 June 6 01:08 4B/X12 32
°
N 44
°
E 6659 2/4
7 June 7 00:38 3B/X4.2 29
°
N 24
°
E 6659 4
8 June 9 01:43 3B/X10 30
°
N 06
°
E 6659 2/4
9 June 11 01:56 3B/X12 32
°
N 19
°
W 6659 2/4
10 June 15 08:21 3B/X12 33
°
N 69
°
W 6659 2/4

COSMIC RESEARCH
Vol. 42
No. 3
2004
REFLECTION MODEL AS APPLIED FOR THE ANALYSIS 223
the interplanetary space between the Sun and the Earth(the more so between the Sun and
ULYSSES
), severalfronts of the flare disturbances were simultaneouslylocated, which detained direct propagation of the SCRflux from the flare to detector and strongly modulatedits profile.
Closer to the middle of June the repetition rate of thesolar flares appreciably lowered, and AR no. 6659passed to the western hemisphere of the Sun. As aresult, the disturbance of the interplanetary spacebecame somewhat less, which was testified by thebeginning of a smooth recovery of the level of GCR(Fig. 1). Because of this, well pronounced enhance-ments of SCR (June 11 and 15) from the flares nos. 9and 10 (Table 1) are recorded in the time dependence of
the intensity of SCR observed onboard
GRANAT
,although time-smeared and strongly modulated maxi-mums of intensity (with duration of ~1.5–2 days) are seenin these enhancements. These peculiarities of the timedependence of SCR flux are also related to the exist-ence of irregularities of the interplanetary space (how-ever, not so strong as to cause a Forbush-decrease ofGCR) (Figs. 1 and 3).
The last enhancement of the intensity of SCRobserved onboard
ULYSSES
began on June 14 and wasrelated to flare no. 8 (Table 1). It had already consider-ably smaller amplitude than preceding increases.Unfortunately, there is a gap in the data correspondingto the beginning of this increase, but it is possible thatsimultaneously with the growth of SCR an increase of
600
May 30May 25 June 4 June 9 June 14 June 19 June 24 June 29
800
400
2030
10
123
4
500
700
900
1020
30
40
1
2
3
4 E = 1–20 MeV
38° E90° 65° 44°–34° 6° 19° W 69° W
GRANAT
IMP-8
ULYSSES
ULYSSES
Date
log
I|B
|, nT
|Vsw
|, km
/s|B
|, nT
|Vsw
|, km
/slo
gI
Fig. 3. From top to bottom: the time profile of the logarithm of SCR intensity with energies 1–20 MeV according to the data of theGRANAT satellite; time behavior of the IMF vector; time behavior of the magnitude of the solar wind velocity measured at 1 AU(the data of IMP-8); time profile of the logarithm of intensity of SCR with energies 0.9–19 MeV according to the data of ULYSSES;time behavior of the magnitude of the IMF vector and of the magnitude of the SW velocity according to the data of ULYSSES. Ver-tical dashes on the upper panel represent the instants of the solar flares, which caused this event in the SCR with indication of thelongitudes of ARs.

224
COSMIC RESEARCH Vol. 42 No. 3 2004
GRIGORENKO, LYUBIMOV
the magnitude of the IMF vector (Fig. 3) also tookplace. It is remarkable that flares nos. 9 and 10 (Table 1)did not contribute to the flux of SCR observed onboardULYSSES, in spite of the fact that AR no. 6659 at thattime was located relatively close to the line of conjunc-tion of ULYSSES with the Sun. The boundaries of thesectors of the solar magnetic field, which at that timewere located between AR and the point of conjunctionof ULYSSES with the Sun (Fig. 4), could be the causeof this. These boundaries of the sectors could serve as“barriers” for propagation of SCR from the flares to thedetector.
3.2. Reflection Model of SCR Propagationin the Interplanetary Space
The reflection model was developed in 1988 on thebasis of experimental data, and it was based on the ideaof a partial capture of the SCR particles in the traps cre-ated by magnetic irregularities, and the confinement inthem due to reflections from the “magnetic mirrors”[1]. The model also takes into account the possibility ofthe coronal propagation of SCR along the connectedarch structures of the coronal magnetic field from theplace of their generation in AR to considerable angulardistances from it. By this means, the secondary sourcesof SCR are formed in the corona. Further on, the parti-cles of SCR, particularly of low energies, could betrapped to the associated loop structures of the coronalmagnetic field ejected from AR into the interplanetaryspace to considerable heliocentric distances by thestreams of the flare plasma. Such quasi-stationary (theycan exist during several solar rotations) loop structures
of the IMF rotating with the Sun can provide one of thepossible ways of propagation of SCR in the heliosphere(Fig. 5a). The heliolongitude distribution of SCR can bewell approximated by the exponential law Nf =Pfexp(-|Df (t)/F0 |), where Pf is the coefficient specifyingthe efficiency of SCR capture in such a quasi-stationarytrap, Df is the longitudinal distance between AR (or sec-ondary source of SCR in the corona) and the projectionof the detector onto the Sun depending on time, and F0is the constant of the exponent.
The fronts of the flare plasma ejected from the Sunand moving away along the radius are another type ofthe interplanetary traps for SCR considered in thereflection model. In the general case, the shock wave inthe reflection model consists of three fronts movingalong the radius, the leading edge, the “piston” (theflare plasma stream moving along the radius), and thetrailing edge (or the reverse shock wave) (Fig. 5b). Each ofthese fronts may constitute a trap for SCR, especially oflow energies. The increase of the flux of SCR observedwhen the front approaches the detector is specified by theexponential law Nr = Prexp(–|Dr(t)/|R0|), where Pr is thecoefficient specifying the efficiency of SCR captureinto a trap moving along the radius, Dr is the radial dis-tance between the detector and the trap depending ontime, and R0 is the constant of the exponent. A similarlaw determines the decrease of the SCR flux when thefront passes through the detector.
A number of parameters are used in the reflectionmodel, a part of which is experimentally observable,and another part is calculated in the model (Table 2).The most significant parameters calculated in themodel are the initial flux of SCR generated in the flare,the initial velocity of motion of the shock wave, thecharacteristic time constants corresponding to thegrowth/decay of the flux by a factor of e. In the casewhen we have the data on measurements of the velocityof propagation of the flare disturbances in the interplan-etary space one can estimate the dimension of theregion of effective capture of SCR using the character-istic time constants of the flux growth/decay obtainedin the model.
3.3. The Results of Approximation of the Time Profile of the SCR Flux Observed onboard GRANAT
and ULYSSES by the Reflection Model
Figure 6 presents the results of approximation, madeby using the reflection model, of time profiles of theintensity of SCR measured onboard ULYSSES (upperpanel) and GRANAT (lower panel). As was alreadymentioned above, the event was caused by a series of10 solar flares (Table 1), seven of which took place inone and the same AR (AR no. 6659). When approxi-mating the GRANAT data the parameters of the modelwere varied from one flare to another, but, in general thedifferences in them did not exceed 20–30%. For thedata of ULYSSES the approximation was carried out
AR no. 6659
GRANAT
ULYSSES
0°
N
S
Fig. 4. A fragment of the synoptic chart of the coronalmagnetic field of the Sun that was observed in the periodof June 11–15, 1991 [5]. Black circles mark the locationsof the points of conjunction of GRANAT and ULYSSES, thecross marks the location of AR no. 6659.

COSMIC RESEARCH Vol. 42 No. 3 2004
REFLECTION MODEL AS APPLIED FOR THE ANALYSIS 225
with common parameters of the flare fronts for all10 flares. The variation of parameters of the flare frontsfrom a flare to flare obtained for GRANAT and absenceof such variation for ULYSSES can be explained by the
fact that at 1 AU the disturbances in the interplanetaryspace are rather strong (which is easily seen in the dataon IMF and SW (Fig. 3)), and the traps for SCR createdby the flare fronts conserve their “individuality”, while
* *
*
N
S
(‡)
(b)
The Sun
The Sun
NE
SF
DetectorEcliptic
SF1
FS1PD1
RS1SF2
PD2FS2RS2
RS1
PD1FS1The orbit
of the Earth
Detector
1 2 3
Fig. 5. Schematic view of the two types of interplanetary traps for SCR considered in the reflection model [1]. (a) The loop structureof the interplanetary magnetic field related to AR and rotating with the Sun; (b) Radially moving fronts of the flare ejections. Thisscheme represents an example of motion of two such traps generated by the flares following one after another that taking place inone and the same AR. Here FS1, PD1, and FR1 are the fronts of the leading shock wave, the piston, and the reverse shock wavefrom the first flare (SF1); FS2, PD2, and RS2 are similar fronts from the second flare (SF2).
Table 2. Basic parameters used in the reflection model
Observable parameters Unobservable parameters calculated in the model
Coordinates of the flare Rotating traps (loop structures of the IMF)Coordinates of detector Initial flux of SCR generated in the flare
Coordinates of the point of conjunction of the detector with the Sun Dimension of the loop structure (the length of the loop)
Angular distances to the secondary sources of SCR in the corona The reflection coefficient in the trapTypical dimension of the trap (transverse)
Angular distances between the flare and the sector boundariesof the coronal magnetic field
Radially moving traps (the fronts of flare disturbances)
Velocity of rotation of the Sun Initial flux of SCR generated in the flare
Mean velocity of motion of the shock wave Initial velocity of motion of the flare disturbance
Velocity of the solar wind Typical dimensions of the traps
The reflection coefficients in the traps

226
COSMIC RESEARCH Vol. 42 No. 3 2004
GRIGORENKO, LYUBIMOV
at 3 AU the disturbances are damped (Fig. 3), the trapscreated by these fronts become more transparent forSCR particles, which are redistributed between thefronts.
Nevertheless, we have tried to approximate the dataof GRANAT using the values of the parameters of theflare fronts averaged over all flares (these figures are notpresented in this paper) and to approximate the data ofULYSSES using the mean (over all flares) values of theinitial flux of SCR and initial velocity of motion of theshock waves (as we already mentioned, the values ofparameters of the fronts for ULYSSES did not differfrom one flare to another). This was done in order todetermine the parameters whose averaging deterioratesthe result of approximation, i.e., to determine whichparameters of the model are the most critical for thedescription (or prediction) of the time profile of theSCR flux. In order to estimate the quality of approxima-tion we have used the quantity specifying the meandeviation of the model profile from the experimental
one: σ = ( – )/n, where and are the experimental and model values of SCR intensityfor the ith instant of time, respectively, and n is the totalnumber of measurements in the considered interval of
|Niexp∑ Ni
mod| Niexp
Nimod
time. Table 3 presents the mean (over 10 flares) valuesof the model parameters obtained when approximatingthe data of GRANAT (middle column), ULYSSES (rightcolumn), and corresponding values of σ in percent (pre-sented in brackets). The upper line of the table presentsthe values of σ obtained approximating the time pro-files of SCR observed onboard GRANAT and ULYSSESwithout averaging the model parameters (the bestapproximation). The left column of the table gives theparameters of the model which were averaged:⟨ ⟩ is the mean value of logarithm of the initialflux of SCR generated in the flare; ⟨u0⟩ is the meanvalue of the initial velocity of motion of the shockwave; ⟨rff⟩ and ⟨rfr⟩ are, respectively, the mean valuesof the characteristic time of growth and decay of theflux of SCR at the front of the leading shock wave; ⟨rcf ⟩and ⟨rcr⟩ are, respectively, the mean values of the char-acteristic time of growth and decay of the flux of SCRat the front of the piston; and ⟨rrf ⟩ and ⟨rrr⟩ are themean values of the characteristic time of growth anddecay of SCR at the front of the inverse shock wave,respectively. It is evident from the data presented in thetable that the majority of averaged parameters specify-ing the rate of growth and decay of the flux of SCR atthe fronts of the flare disturbances make no big differ-
n0( )log
0.5
May 30May 25 June 4 June 9 June 14 June 19 June 24 June 290
1.0
1.5
2.0
2.5
3.0
3.5
4.04.5
0.50
1.0
1.5
2.0
2.5
3.0
3.5
4.0
4.5
F1, 2 3 4 5 6 7 8 9 10
Date
logI
Fig. 6. The results of approximation of the time profile of logarithm of the SCR intensity for the data of ULYSSES (the upper panel)and GRANAT (lower panel). Thin black line represents the experimental profile, thick line is the profile obtained with the help ofthe reflection model. The vertical dashes in the upper panel represent the instants of the solar flares with numbers corresponding tothe numbers in Table 1.

COSMIC RESEARCH Vol. 42 No. 3 2004
REFLECTION MODEL AS APPLIED FOR THE ANALYSIS 227
ence between the experimental data (those ofGRANAT) and the model time profiles of SCR. The dif-ference turned out to be less than 25% (i.e., the approx-imation obtained with the employment of the mean val-ues of these parameters is close to the best one). Theonly exception is the parameter specifying the decay ofthe flux of SCR at the front of the leading shock wave:its averaging stronger deteriorated the result of approx-imation of the data of GRANAT (σ = 32.2%). The initialvelocity of motion of the flare ejection is the most sig-nificant for approximation (with the use of the reflec-tion model) of the time profiles of SCR measured atboth 1 and 3 AU. Its averaging over all flares moststrongly deteriorated the result of approximation forboth GRANAT (σ = 46.9%) and ULYSSES (σ = 39.7%).The model description of the time profiles of SCR alsoturned out to be very sensitive to averaging the initialflux of SCR (σ = 31.4% and 34.3% for GRANAT andULYSSES, respectively).
CONCLUSIONS
Using the reflection model of the SCR propagationit became possible to describe nicely the complex non-diffusion profiles of the flux of SCR of low energiesobserved in June 1991 at different heliocentric dis-tances.
It has been established that the main role in thetransport of particles of SCR in this event was playedby the fronts of the shock waves.
The mean values of parameters for the initial flux ofSCR and for the initial velocities of motion of the shockwaves determined in the model are correspondingly106.4 and 0.05 AU/h for GRANAT, and 106.3 and0.05 AU/h for ULYSSES (the disagreement of theseparameters does not exceed 25%).
The values of the characteristic time for growth anddecay of the SCR flux at the fronts of the shock wavesvary from flare to flare for GRANAT (±20%) and areidentical for all flares in case of ULYSSES, i.e., whenthe heliocentric distance increases, the distribution ofparticles in the traps created by the fronts of flare dis-turbances becomes more homogeneous.
The dimension of the region of effective capture ofSCR for 1 AU is ~0.008 AU on the average, and for3 AU it is ~0.01 AU. Thus, when the heliocentric dis-tance increases, the dimension of the region of effectivecapture of SCR increases.
REFERENCES1. Lyubimov, G.P., Reflection Model of SCR Motion in
Loop Traps, Astron. Tsirk., Akad. Nauk SSSR, 1988,no. 1531, p. 19.
2. Lyubimov, G.P., Grigorenko, E.E., and Chuchkov, E.A.,An Analysis of the SCR Event in June 1991 Using theData of the GRANAT Satellite, Preprint of SkobeltsynInst. of Nucl. Phys., Moscow State Univ., Moscow, 1998,no. 98-9/510.
3. Lyubimov, G.P. and Grigorenko, E.E., An Analysis of theSCR Event in June 1991 Using the Data of the GRANATSatellite, Vestn. Mos. Gos. Univ., Ser. 3: Fiz., Astron.,1998, no. 2.
4. Chuchkov, E.A., Ermakov, S.I., Kadobnov, V.B., et al.,First Results of Measuring the Fluxes of Charged Parti-cles onboard GRANAT Spacecraft, Pis’ma Astron. Zh.,1991, vol. 17, no. 2, p. 135.
5. Solar Geophysical Data, Part I, no. 561-564, NationalGeophysical Data Center, Boulder, Colorado, 1991.
6. McIntosh, P.S., Coronal Holes and Solar Predictions, inSolar–Terrestrial Predictions Workshop-IV, 2, Hruska J.et al., Eds., NOAA, ERL, Boulder, Colorado, 1993,p. 20.
7. Shea, M.A., Smart, D.F., Swinson, D.B., and Wil-son, M.D., Overview of Solar Activity, Cosmic RayModulation, and Geomagnetic Disturbances betweenMarch and June, 1991, Proc. of the Second SOLTIP Sym-posium, 1994, Japan, pp. 1–7.
Table 3. The averaged (over 10 flares) parameters of ap-proximation (accentuated in boldface) obtained for the timeprofile of the SCR intensity measured onboard GRANAT(middle column) and onboard ULYSSES (right column), andcorresponding values of σ in percent (indicated in brackets).The upper line of the table presents the values of σ obtainedwithout averaging the parameters of the model (with the bestapproximation)
GRANAT ULYSSES
σ 21.8% 29.1%
⟨n0⟩ 6.4 (31.4%) 6.3 (34.3%)
⟨u0⟩ (a.u./h) 0.05 (46.9%) 0.05 (39.7%)
⟨rff⟩ 0.3 (24.1%) 0.3 (29.1%)
⟨rfr⟩ 0.25 (32.2%) 0.5 (29.1%)
⟨rcf⟩ 0.4 (24.1%) 0.5 (29.1%)
⟨rcr⟩ 0.3 (24.8%) 0.4 (29.1%)
⟨rrf⟩ 0.1 (24.3%) 0.2 (29.1%)
⟨rrr⟩ 0.1 (23.6%) 0.2 (29.1%)