refinement and further evaluation of the massachusetts
TRANSCRIPT

Refinement and further evaluation of the Massachusetts Firm-Yield-Estimator model version 2.0
U.S. Department of the Interior
U.S. Geological Survey
April, 12, 2012
In cooperation with
Mass DEP

Firm Yield Estimator development history
1996 Mass DEP guidance document detailing procedures for estimating the firm yield of
reservoirs in MA
2000 Firm Yield Estimator (FYE) version 1.0 software and documentation released
2006 Two USGS reports* published which investigate sensitivity of the FYE to various basin
characteristics and develop methodology for estimating groundwater contributions to the firm yield
2011 Firm Yield Estimator version 2.0 software includes several significant model
refinements and new simulation options and user interface
USGS Scientific Investigations Report 2011-5125 applied the FYE v 2.0 at 71
reservoirs in MA, tested several management scenarios, completed model uncertainty analysis, and model validation
*Waldron, M.C., and Archfield, S.A., 2006, Factors affecting firm yield and the estimation of firm yield for selected streamflow-dominated drinking-water supply reservoirs in Massachusetts: U.S. Geological Survey Scientific Investigations Report 2006-5044, 39.p
*Archfield, S.A., and Carlson, C.S., 2006, Ground-water contributions to reservoir storage and the effect on estimates of firm yield for reservoirs in Massachusetts: U.S. Geological Survey Scientific Investigations Report 2006-5045, 27.p

� Improved calculation of ground-water contribution to reservoir storage in the FYE
model.
� Model runs at a daily time step
Project ObjectivesProject Objectives
Refinements to the model
Additional Analyses
� New features: user-defined demand management scenarios and reliability criteria
� Evaluate the effects of controlled releases, reservoir reliability, and demand
management on firm-yield estimates
� Evaluate the effect of drought severity on the calculation of firm yield.
� Uncertainty analysis of model predictions
� Expand the study area to include 25 additional reservoirs in MA
� Model validation with observed data

Firm Yield Estimator v 2.0
� Firm yield is calculated by iteratively
solving the water balance each day
over the entire period of record.
� With each iteration, withdrawals are
increased until the reservoir fails.
� The firm yield is the highest withdrawal
rate that can be used without causing a
reservoir failure during the simulation.
Processes accounted for in the water balance include precipitation, evaporation, inflowing streamflow, groundwater flows, withdrawals, controlled releases and uncontrolled releases.

� FYE 2.0 runs at a daily time step in order to more accurately represent the range
and variability of daily streamflow and climate inputs.
� Daily streamflow is estimated using newly available Sustainable Yield Estimator*
Refinements to the modelRefinements to the model
� Monthly time step used in the FYE 1.0 can lead to over-estimation of firm yield due
to reduced variability in monthly streamflow and climate inputs.
100
Monthly and daily input streamflow for Belmont Reservoir used in
the FYE 1.0 and FYE 2.0, respectively
*Archfield, S. A., Vogel, R.M., Steeves, P.A., Brandt, S.L., Weiskel, P.K., and Garabedian, S.P., 2010, The Massachusetts Sustainable-Yield Estimator: A decision-support tool to assess water availability at ungaged stream locations in Massachusetts: U.S. Geological Survey Scientific Investigations Report 2009-5227, 41 p.
0.01
0.1
1
10
Nov-75 Dec-75 Jan-76 Feb-76 Mar-76 Apr-76 May-76
cu
bic
feet
per
seco
nd
Daily streamflow
Mean monthly streamflow

Management Scenarios
� Controlled releases� User-defined controlled releases for each month
� Reliability� Default setting defines the firm yield using 100% reliability (no-fail). Towns with
alternative or emergency water sources may wish to operate at a lower reliability.alternative or emergency water sources may wish to operate at a lower reliability.
� Demand Management� Water-use restrictions during drought periods may be set by the user. These
scenarios reduce the yield during periods when the reservoir storage falls below a
user-specified threshold.

Controlled releases
� Two hypothetical controlled release
scenarios examined
� Scenario A: daily controlled releases
equal to the 10th percentile monthly
streamflow
� Scenario B: daily controlled releases
equal to the 25th percentile monthly equal to the 25th percentile monthly
streamflow
� Reservoirs with low storage capacity
relative to their average streamflow had
greater decreases in firm yield when
controlled releases were imposed.
Scenario A Scenario B

Reservoir reliability
� Some towns may wish to operate at a
higher failure rate if they have alternative
or emergency sources they can use during
extreme droughts
� Users may specify the number of
allowable failure days in the simulation. allowable failure days in the simulation.
The firm yield will then be calculated as
the highest yield possible without
exceeding the allowable failure rate.
� 99% reliability scenario (1% failure rate)
increased reservoir yields by 10 – 25%

Demand Management
Demand management hypothetical scenario
Percent Reduction in Demand
15%
25%
35%
Reservoir storage depletionthreshold
40% depleted
60% depleted
80% depleted35% 80% depleted
Firm yields for most reservoirs increased between 5-
10% under this scenario

Complex management scenarios
� Trade-offs between different management scenarios can be examined by
simulating a reservoir system using different combinations of management
scenarios.

Effect of drought severity on firm yield
� Firm yields are based on the 1960’s drought which was the longest and most
severe drought on record
� Droughts in the 1980’s and 2002 were shorter in duration and had less
severe water shortages in most places compared to the 1960’s drought
� Estimating firm yields based on droughts other than the 1960s drought
increased firm yield estimates by 20 – 60%
Drought severity of 1960’s,
1980’s and 2002 droughts
Drought duration of 1960’s,
1980’s and 2002 droughts
Percent change in Firm Yield based
on 1980’s and 2002 droughts

Model Uncertainty
� Streamflow inputs
� Firm Yields increased by 2-10% in after accounting for errors in streamflow
time series. Reservoirs with low storage ratios are more sensitive to errors in
streamflow.
� Climate inputs� Because precipitation and evaporation are generally small volumes compared to
streamflow, errors in these data are not expected to affect firm yield estimates greatly.
� Bathymetric maps� Bathymetric maps are used to estimate reservoir storage capacity and stage-storage
tables. Maps created from too few survey points cause an underestimation of reservoir capacity and firm yield. Analysis in the report suggests these errors are minor (1-5%) for most reservoirs in the study.

Model Uncertainty
� Groundwater parameters� Aquifer characteristics are estimated from existing maps which are not very precise.
This would affect ~30% of reservoirs in the study that receive groundwater flows. Groundwater flows are generally small compared to streamflow inputs, so the effect of errors in these calculations should be minor in most caes.
� Reservoir operations� Reservoir operations� Many multi-reservoir systems have complex daily operations that cannot be adequately
modeled using this approach
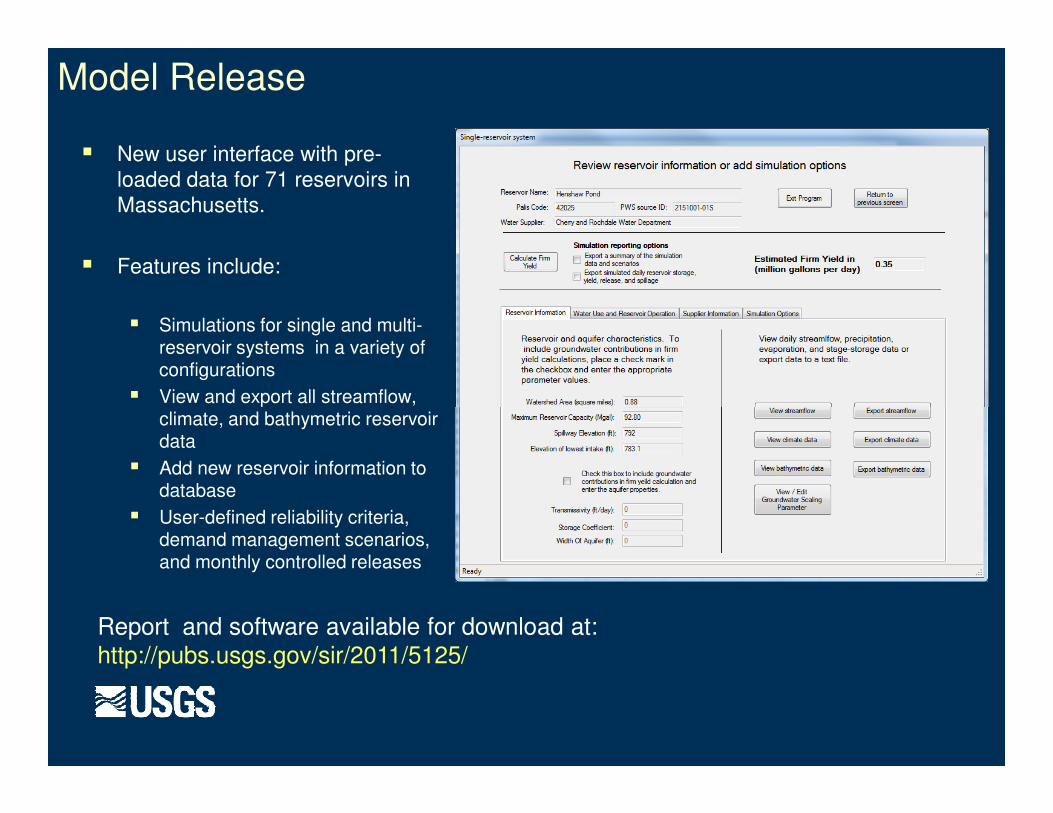
Model Release
� New user interface with pre-
loaded data for 71 reservoirs in
Massachusetts.
� Features include:
� Simulations for single and multi-reservoir systems in a variety of configurations
� View and export all streamflow, �
climate, and bathymetric reservoir data
� Add new reservoir information to database
� User-defined reliability criteria, demand management scenarios, and monthly controlled releases
Report and software available for download at:
http://pubs.usgs.gov/sir/2011/5125/

Model uncertainty
Effect of bathymetric survey accuracy on FirmYield
� Bathymetric maps from original depth
profile data were resampled using
several different transect widths and
configurations
� New bathymetric profiles were created
from the hypothetical transect depths
� Storage capacity and firm yield
recalculated from new depth profiles.

Model uncertainty
� Widely spaced transect patterns resulted in an
underestimation of storage capacity and a
lower estimated firm yield.
� Actual bathymetric surveys for reservoirs in the
FYE report generally had gridded transects
between 30-60 meters wide and included a
perimeter transect.
-45%
-35%
-25%
-15%
-5%
0 20 40 60 80 100 120 140
Perc
en
t ch
an
ge in
fir
m y
ield
Transect width in meters
Cohasse Reservoir
Gridded Transects
Horizontal transects
Gridded transects with perimeter
perimeter transect.
� Uncertainty in bathymetries of reservoirs used
in this study are a minor source of error in
resulting firm yields.
-45%
-35%
-25%
-15%
-5%
0 20 40 60 80 100 120 140
Perc
en
t ch
an
ge in
fir
m y
ield
Transect wudth in meaters
South Reservoir
Gridded Transects
Horizontal transects
Gridded transects with perimeter

Model uncertainty
� Sensitivity of FYE to errors in streamflow was examined using Monte Carlo
simulations.
� For each Monte Carlo simulation, daily streamflows were altered by a
random error that was structured to match the uncertainty in the Sustainable
Yield Estimator (SYE).
� Errors in streamflow estimation using the SYE were estimated by the
difference between estimated and observed flows at 18 USGS gaged sites.difference between estimated and observed flows at 18 USGS gaged sites.

Model uncertainty
� Underestimation of low flows
by the SYE may cause firm
yields to be underestimated by
1-10%
� Reservoirs with low storage
ratios were more sensitive to ratios were more sensitive to
errors in streamflow inputs.
Percent change in firm yield of selected reservoirs after accounting
for potential errors in daily streamflow in 500 Monte Carlo
simulations.
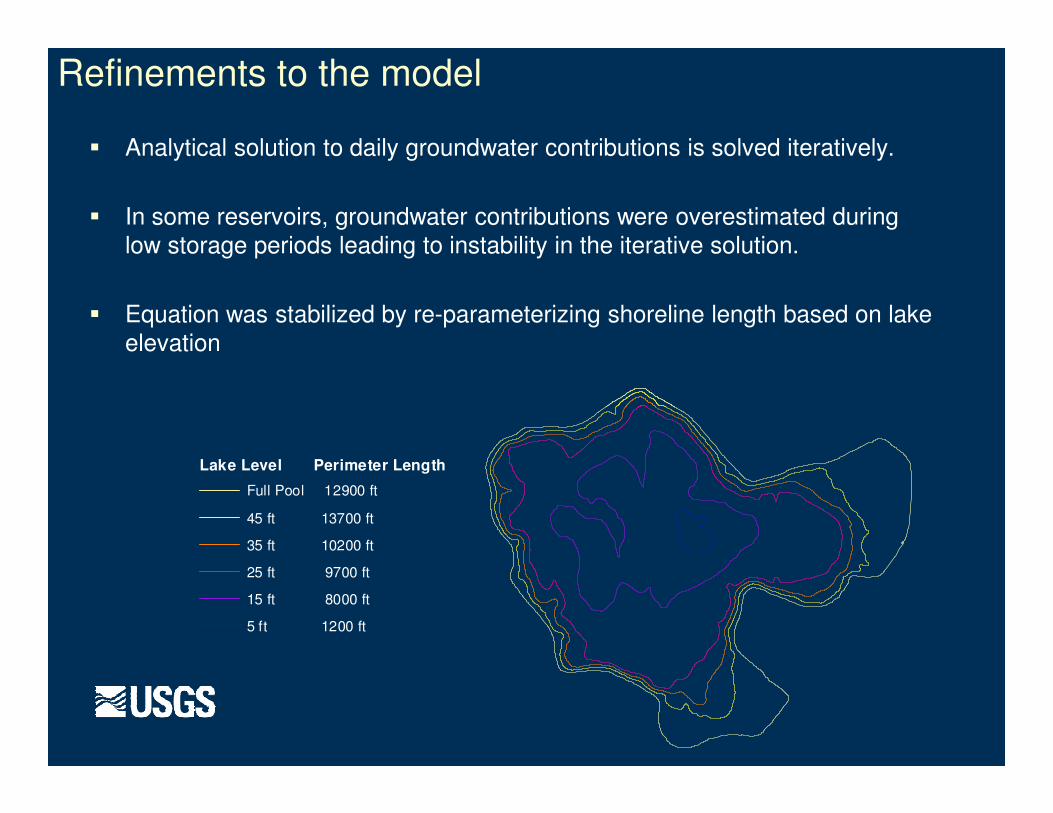
Refinements to the model
� Analytical solution to daily groundwater contributions is solved iteratively.
� In some reservoirs, groundwater contributions were overestimated during
low storage periods leading to instability in the iterative solution.
� Equation was stabilized by re-parameterizing shoreline length based on lake
elevation
Lake Level Perimeter Length
Full Pool 12900 ft
45 ft 13700 ft
35 ft 10200 ft
25 ft 9700 ft
15 ft 8000 ft
5 ft 1200 ft