reference: volgeo 5522 - digital.csicdigital.csic.es/bitstream/10261/125549/6/geyer journal...
TRANSCRIPT

�������� ����� ��
Natural equivalents of thermal gradient experiments
Carmen Rodrıguez, Adelina Geyer, Antonio Castro, Antonio Villasenor
PII: S0377-0273(15)00097-9DOI: doi: 10.1016/j.jvolgeores.2015.03.021Reference: VOLGEO 5522
To appear in: Journal of Volcanology and Geothermal Research
Received date: 14 September 2014Accepted date: 16 March 2015
Please cite this article as: Rodrıguez, Carmen, Geyer, Adelina, Castro, Antonio, Vil-lasenor, Antonio, Natural equivalents of thermal gradient experiments, Journal of Vol-canology and Geothermal Research (2015), doi: 10.1016/j.jvolgeores.2015.03.021
This is a PDF file of an unedited manuscript that has been accepted for publication.As a service to our customers we are providing this early version of the manuscript.The manuscript will undergo copyediting, typesetting, and review of the resulting proofbefore it is published in its final form. Please note that during the production processerrors may be discovered which could affect the content, and all legal disclaimers thatapply to the journal pertain.

ACC
EPTE
D M
ANU
SCR
IPT
ACCEPTED MANUSCRIPT
Natural equivalents of thermal gradient
experiments
Carmen Rodríguez1*
, Adelina Geyer2, Antonio Castro
1 and Antonio Villaseñor
2
1Unidad asociada de petrología experimental, CSIC-Universidad de Huelva, Campus El Carmen, 21071 Huelva, Spain
2 Institute of Earth Sciences Jaume Almera, ICTJA-CSIC, Lluis Sole i Sabaris s/n, 08028 Barcelona, Spain
*Corresponding author. E-mail: [email protected]
Keywords: experimental thermal gradient; magmatic differentiation; numerical modelling
ABSTRACT
Crystallization experiments using the intrinsic thermal gradient in 10 mm length
capsules loaded in piston-cylinder assemblies were used to investigate silicic magma
crystallization. The application of experimental results to natural environments requires
the scaling of physical parameters of petrological interest. Therefore, we propose here a
comparative study between thermal gradients and numerical simulations of natural
magma chambers. We use the Finite Element Method to calculate thermal profiles
across a cooling silicic magma chamber. These numerical profiles are compared with
the intrinsic thermal structure of half-inch, piston-cylinder assemblies at 500 MPa. It is
concluded that a set of varied magma chamber geometries and/or distinct stages of their
cooling history can approach the intrinsic thermal structure of laboratory experiments.
Once the thermal properties for magma and its host rock are fixed, the experimental-
numerical approach is mostly dependent on the volume and aspect ratio of the magma
chamber. Our results indicate, for instance, that a 10 mm length capsule with a thermal
gradient of 40 ºC/mm (from 1100 to 700 ºC) may represent a 150-1100 m wide portion
of a cooling magma chamber of 10-20 km diameter and 2-10 km height, emplaced at a
depth of 18 km. Additional possible scenarios are represented by larger magma

ACC
EPTE
D M
ANU
SCR
IPT
ACCEPTED MANUSCRIPT
chambers, up to 30 km diameter, in which the experimental thermal gradient can
represent a 150-3700 m-thin-section of the large igneous bodies.
1. Introduction
Experimental petrology apparatus, like the piston-cylinder (Boyd and England, 1960),
were designed to simulate natural conditions in small capsules in which temperature
(and pressure) is constant over their entire volume; a requirement to reproduce phase
compositions in laboratory through the control of intensive variables. However, outside
a restricted area (hotspot) of about 5 mm diameter, strong thermal (intrinsic) gradients
develop in piston-cylinder assemblies (Lundstrom et al., 2005; Huang et al. 2009;
Watson et al., 2002). The thermal gradient is controlled by a number of factors such as
capsule length, assembly design, pressure transmitting solid media, and the pressure and
temperature used (Schilling and Wunder, 2004).
Thermal gradient measurements in piston-cylinder are firstly affected by the large
conductivity of the metal capsule that buffers the thermal difference across the
assembly. Thus, the thermal structure of a piston-cylinder will also depend on the
length, diameter and the metal composition of the capsule. The use of different
materials in the solid pressure transmitting media can affect thermal gradient depending
on its thermal conductivity. Moreover, temperature and pressure conditions can affect
the thermal conductivity of solid pressure media. Previous experimental works
(Pickering et al., 1998; Watson et al., 2002) and numerical modelling (Schilling and
Wunder, 2004) were performed to constrain thermal profiles in experimental assemblies
with marked differences with respect to our design. Hence, new experiments are
ACC
EPTE
D M
ANU
SCR
IPT
ACCEPTED MANUSCRIPT
required to better constrain the thermal gradient in half-inch assemblies loaded with the
longer capsules.
The point of interest is that in using long capsules (>5 mm length), it is possible to take
advantage of the intrinsic thermal gradient in order to simulate the crystallization of
shallow magma chambers, which cool from their walls to the innermost part (Huang et
al., 2009, Masotta et al., 2012, Mollo and Masotta, 2014). Preliminary results are of
great value to gain intuition on processes in magma chambers; however the transfer of
experimental results to km-sized magma bodies is not a straightforward process. Here
we present the scale of application to km-sized magma bodies in nature. With this
purpose, we have compared intrinsic thermal gradients in piston-cylinder experiments
and magma chamber gradients inferred by means of thermomechanic numerical
modelling.
Experimental thermal profiles are compared with those resulting from numerical
simulations reproducing natural magma chambers at different stages of their cooling
history. In both capsules and selected magma chambers, the whole temperature range
that encompasses liquidus to solidus conditions (Fig. 1) of intermediate andesitic
systems (SiO2 ≈ 60 wt%) has been reproduced. The relevant issue for the scaling is to
infer what the conditions are in terms of magma chamber geometry, size and
evolutionary stage, for which the experimental-natural comparison is relevant. The
geometry of the gradient curve from liquidus to solidus depends on magma chamber
parameters such as the diameter, depth of emplacement and cooling time period. Our
results indicate that intrinsic experimental gradients can fit only a limited set of natural
conditions. Hence, caution must be exercised for the application of thermal gradient
experiments to settings outside those recommended here.
ACC
EPTE
D M
ANU
SCR
IPT
ACCEPTED MANUSCRIPT
2. Rationale
It is known from experiments and thermal modelling of piston-cylinder assemblies
(Huang et al., 2009; Masotta et al., 2012; Pickering et al., 1998; Schilling and Wunder,
2004; Watson et al., 2002) that large thermal gradients occur inside the graphite
furnace. Temperature is constant over a short distance of about 5 mm from the centre of
the furnace and drops suddenly to much lower values towards the bottom and the top.
Interestingly, the liquidus-solidus interval can be covered by this intrinsic thermal
gradient, opening new possibilities to study magma differentiation processes.
The scaling of this intrinsic experimental thermal gradient may be performed by direct
comparison of the thermal structure within the graphite furnace with that of a km-sized
magma chamber.
To do so, we present a new approach to scale thermal gradient
experiments to natural systems. On the one hand, the intrinsic thermal gradient is
directly measured by using special assemblies equipped with double thermocouples. On
the other hand, natural gradients of km-sized magma chambers are calculated by means
of numerical modelling. The latter consists of a time-dependent thermal model that
simulates the cooling process of a closed magmatic system embedded in a colder and
homogeneous host rock. To achieve this comparison, we extrapolate the entire capsule
length to natural cases (Fig. 1).

ACC
EPTE
D M
ANU
SCR
IPT
ACCEPTED MANUSCRIPT
We use as an example of application the experimental thermal profile in which the
hotspot is constrained to the liquidus of a given standard andesitic composition. In any
case, this process can be repeated for different magma compositions or experimental
thermal set-ups. It must be noted that it is not possible to explore all possible
combinations of the mentioned parameters in the current paper and that it may be
addressed in future works.
The intrinsic thermal gradient is directly measured by using special assemblies equipped
with double thermocouples. The natural gradients of km-sized magma chambers are
calculated by means of numerical modelling. Shedding some light on the natural
equivalence of the experimental thermal gradient allows a better understanding of the
experimental results as pertaining to magma chambers of different sizes and
evolutionary stages, and/or to different portions of magma chambers. It is worth noting
that the thermal gradient can be correlated either to the initial cooling representative of a
small fraction (Fig. 1a) of the chamber near the wall rocks, or to more advanced stages
of cooling associated to higher degrees of crystallization (Fig. 1b). The results obtained
here indicate that the thermal gradient, imposed over the entire capsule length, allows us
to simulate various evolutionary stages of the same magma chamber and/or different
magma chambers within a wide range of sizes and geometries.
3. Calibration experiments of thermal gradients in piston-cylinder apparatus
3.1. Experimental techniques
The experiments were designed to calibrate the thermal gradient operating in the
capsule. Runs were carried out using a double thermocouple set up in order to measure
the temperature gradient. The thermocouples measured temperatures from 900 to 1200

ACC
EPTE
D M
ANU
SCR
IPT
ACCEPTED MANUSCRIPT
°C over a constant pressure of 500 MPa. Calibration experiments were performed in a
Boyd-England type piston-cylinder apparatus installed at the University of Huelva
(Spain). The two thermocouples are positioned in a "special periclase assembly". This
assembly is made up of a 12.5 mm (half inch) diameter, talc-pyrex-periclase cell, Au-Pd
capsule and drilled periclase. Gold-Palladium (Au70Pd30) capsules of 3 mm diameter, 10
mm length, and 0.15 mm wall were filled with drilled periclase that serves (1) to
simulate the sample effects on the gradient and (2) to ensure that the thermocouple is at
the desired position with respect to the centre of the furnace (Fig. 2). Then, the capsules
were introduced into MgO pressure containers.
The temperature was measured and controlled with two Pt100-Pt87Rh13 thermocouples
connected to Eurotherm 808 controllers, with estimated uncertainties of ±1 ºC. The first
thermocouple is positioned at the centre (hotspot) of the furnace (hereinafter called
control position; CP in Fig. 2). The second thermocouple (hereinafter called measure
position) is located at two different distances from the centre of the furnace (6.6 and 10
mm corresponding to MP1 and MP2 in Fig. 2). In this way, the temperature at these
measure positions was calibrated by two different experiments (CG1 and CG2). A dwell
time of 20 minutes was needed to reach thermal equilibrium within the assembly in
order to make temperature oscillations negligible. Temperature and power supply data
were recorded automatically within 1-min time intervals.
The oil pressure was measured with electronic DRUCK PTX 1400 pressure
transmitters, connected to OMRON E5CK controllers. The value of pressure was
manually corrected and maintained within a narrow range of ±5 bar oil pressure,
equivalent to ±250 bar on the sample. Pressure was maintained at 500 MPa in all the
experimental runs. The initial temperature was fixed at 1200 ºC for two hours to ensure
the stability of the thermocouple measurement and then, different cooling ramps were

ACC
EPTE
D M
ANU
SCR
IPT
ACCEPTED MANUSCRIPT
applied to test the response of the thermal gradient to cooling. The final temperature
was set at 1130 ºC and 800 ºC for the CG1 and CG2 runs, respectively. A complete list
of experimental conditions is given in Table 1.
The small deformation and compaction of our well-packed assemblies did not modify
significantly the initial distance of the control thermocouple to the centre of the furnace
(hotspot). After extraction of the assembly, we checked the following points for each
run: (1) the control thermocouple is placed within the hotspot (Fig. 2, CP); (2) the
measure thermocouple is in the desired position along the thermal gradient (MP1 and
MP2 in Fig. 2); (3) the distance between both thermocouples, control and measure, is
coincident with that of the initial setup (Fig. 2); (4) the distance between the bottom of
the furnace and the measure thermocouple coincides with that of the initial setup (MP1
and MP2 in Fig. 2).
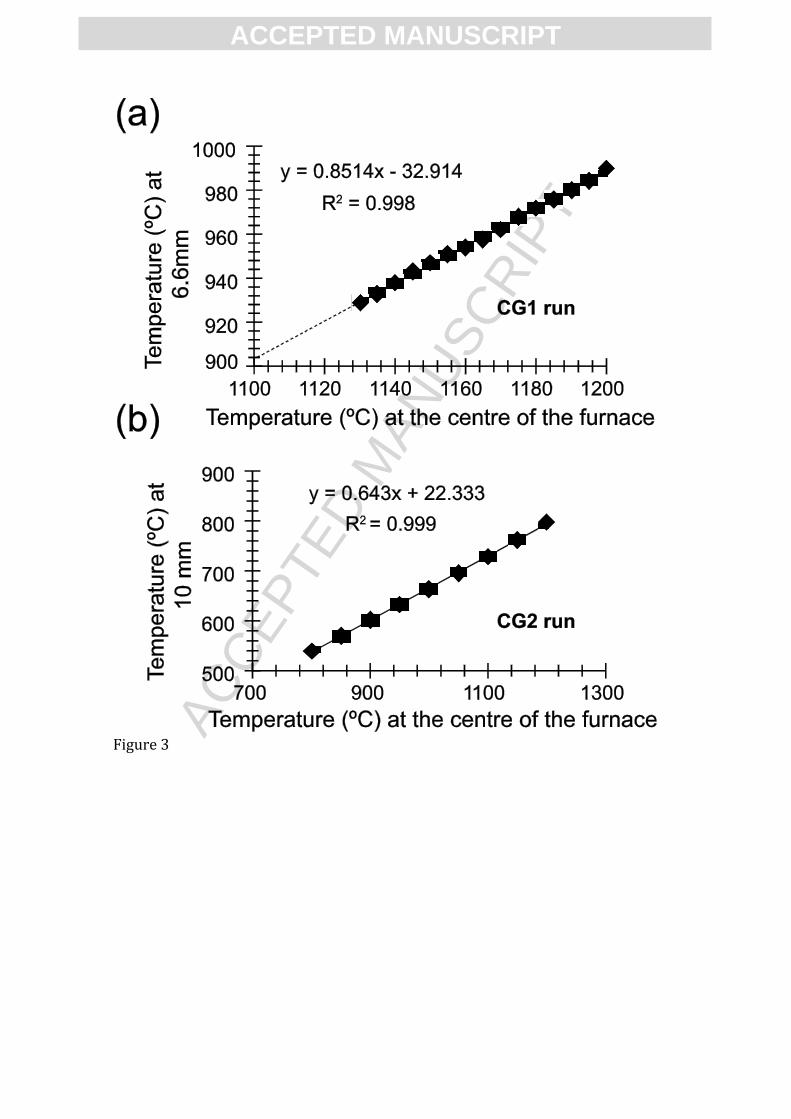
3.2. Calibration experiment results
Thermal gradient calibrations define the whole thermal distribution along the piston-
cylinder assembly. The output temperature values were acquired with a continuous data
acquisition system wired to both thermocouples. The systematic variation according to
the programmed temperature decrease, at both thermocouple measure positions (Fig. 3)
shows a stable thermal structure for the experimental assembly.
The temperature at the hotspot is established according to the liquidus temperature of
the selected magma composition for the numerical modelling. The thermal gradient
experiment with the hotspot set at 1106 °C (i.e. the liquidus temperature of AGV-2, see
Physical and thermal properties of the magma and its country rock for further
explanations on the selected composition) is compared with the numerical models. The
temperatures measured at 6.6 and 10 mm from the 1106 °C hotspot are calculated using

ACC
EPTE
D M
ANU
SCR
IPT
ACCEPTED MANUSCRIPT
the linear regression equation showed in Fig. 3a and b, respectively. The derived values
define the experimental thermal gradient that is later compared with the numerical
thermal profiles (Table 2).
4. Numerical simulation of natural magma chambers
4.1. Theory and equations
Mathematical modelling techniques have proved by far their applicability to the study
of processes driving magma chamber evolution (Annen, 2009; Bachmann, 2004;
Bachmann, 2006; Bea, 2010; Gelman et al., 2013; Gutiérrez and Parada, 2010; Huber et
al., 2009; Huber et al., 2012; Koyaguchi, 2001). Here, the internal temperature
distribution of the magma chamber is calculated using the Finite Element (FE) method,
by solving the heat transfer equation, assuming as negligible the effect of viscous
heating and pressure-volume work:
(1)
where the equation parameters refer to density (), specific heat capacity at constant
pressure (Cp), temperature (T), time (t), the velocity vector (u), thermal conductivity
(k) and Q contains heat sources other than viscous heating (see Table 3 for more details
concerning thermal and physical parameters). Since we are dealing here with pure
conductive heat transfer (i.e. u=0), Equation (1) can be rearranged as follows:
(2)
As in previous published works (e.g. Gelman et al. 2013), the present models do not
consider heat transfer by convection within the magma chamber. It has been reported
that slow convection cells are limited to the liquid core of a cooling pluton (Bea, 2010),
not affecting the partially crystallized zone of the solidification front where we apply
ACC
EPTE
D M
ANU
SCR
IPT
ACCEPTED MANUSCRIPT
our study. In the case of cooling silicic magma chambers, the convective effect has been
attributed to initial short melting stages after basalt replenishment during which the
temperature at the solid-liquid boundary exceeds the effective fusion temperature
(Koyaguchi & Kaneko 2000). Basalt replenishment has not been taken into account for
the objectives of this study. On the basis of the above considerations and for the sake of
simplicity, convection has been omitted in the equations and the results here presented
only apply to this set of conditions. Boundary layer processes as thermal or
compositional changes that can influence the cooling of magma chambers (Lundstrom
et al. 2005) are considered as negligible for the purpose of the comparison between
experimental and natural processes.
The geometric modelling, mesh discretization and numerical computations were carried
out with COMSOL Multiphysics v4.4 software package (http://www.comsol.com). To
simulate the solidifying magma, we use the heat transfer with phase change module.
The latter allows solving the heat equation after setting the properties of a phase-change
material (from liquid to solid) according to the Apparent Heat Capacity formulation
(AHC) (Canot et al., 2009; Hu and Argyropoulos, 1996; Voller et al., 1990). By
convention, COMSOL Multiphysics v4.4 considers magma to be in phase 1 when it is
completely solid and in phase 2, when fully liquid. The phase-change interval (T) is
then defined as the temperature range where phase 1 and 2 co-exist. In our case, it
covers then from the liquidus ( to solidus ( ) temperatures, i.e. T
= (Fig. 4a).
The AHC method is the best for naturally occurring wide phase-change temperature
interval, as is the case of magma cooling where T may be up to 500ºC. The latent heat
of crystallization is accounted for by increasing the heat capacity of the material within
the temperature range of the phase change (Canot et al., 2009; Hu and Argyropoulos,

ACC
EPTE
D M
ANU
SCR
IPT
ACCEPTED MANUSCRIPT
1996; Voller et al., 1990). Thus, rather than to introduce the latent heat L into the energy
balance equation, when the material reaches its phase change temperature Tpc, it is
assumed that the transformation occurs in a temperature interval between Tpc-T/2 and
Tpc+T/2 (Fig. 4a). In this interval, the solidifying magmatic system is modelled as a
function of and , where , representing the fraction of phase 1 and 2 (i.e.
solid and liquid) during the phase change interval, respectively. According to the
formulation, is equal to 0 before Tpc-T/2 and to 1 after Tpc+T/2. In the present
models:
(3)
(4)
(5)
The enthalpy H of the system is:
(6)
where Hsolid and Hmelt are the enthalpies when the material is solid or liquid,
respectively. Differentiating with respect to temperature, we obtain the following
expression for the specific heat capacity at constant pressure:
(7)
which can be rewritten as:
(8)
where we have substituted the smoothing functions and imposed by default in
COMSOL with the temperature dependent melt () and solid ) fractions of the
crystallizing magma (Table S1, Supplementary material).

ACC
EPTE
D M
ANU
SCR
IPT
ACCEPTED MANUSCRIPT
Thus, according to Equation 8, the specific heat capacity is the sum of an equivalent
heat capacity (first two terms on the right) and the distribution of latent heat (third term
on the right). The latent heat distribution CL is approximated by:
(9)
Consequently, the total heat per unit mass released during the phase transformation
coincides with the latent heat:
(10)
The performed FE models are axisymmetric and are constructed over a cylindrical
coordinate system with positive z values related to altitudes above sea level (Fig. 4b).
Thus, the modelled magma chamber is cylindrical in shape with height h and radius
w/2. To avoid possible border effects around the reservoir perimeter, we have applied a
fillet to the sharp-edged corners (Fig. 4b). The computational domain corresponds to a
40 km (radius) wide section of the crust stretching to a depth of 40 km under the sea
level (Fig. 4b). The FE mesh consists of around 110,000 linear triangular elements, with
up to 500-metre-size at the host rock and 50 m around the magma chamber – host rock
contact (Fig. 4c).
4.2. Physical and thermal properties of the magma and its country rock
The used starting material for the present experiments is the AGV-2 standard andesite
(Flanagan, 1967). The andesitic composition (Table 4) is similar to that of the
cordilleran batholiths (Castro et al., 2013; Castro, 2014) and, for this reason,
experimental results can be applied to magmas involved in crustal processes. The AGV-
2 standard composition has been previously chosen as starting material in thermal
gradient experiments (Huang et al., 2009).

ACC
EPTE
D M
ANU
SCR
IPT
ACCEPTED MANUSCRIPT
Taking into account that the possible rapid stages of segregation, ascent and
emplacement (Petford et al. 2000) are far beyond the scope of this study, and in order to
simplify the model, we assume that magma chamber is instantly filled before the onset
of the solidification process. It is considered that the magma is emplaced as totally
liquid (Gelman et al., 2013) in a single shot of magma input without further
replenishment (Gutierrez & Parada, 2010).
The melt () and solid (ϕ) fractions of the andesitic crystallizing magma are determined
by simulations conducted with the Rhyolite-MELTS code (Gualda et al., 2012). Results
are reported in the Supplementary Material (Table S1 and S2) and are used as input data
in COMSOL. We simulate an isobaric cooling at 500 MPa pressure, and redox
conditions one log unite above the quartz-fayalite-magnetite oxygen buffer.
We do not take into account the presence of volatiles, to avoid volume changes and
ensure that energy and mass are conserved in phase change models, we consider magma
density magma as constant with a value of 2600 kg/m3
assuming a negligible effect of
temperature (Gelman et al., 2013). We have tested that the chosen value for magma does
not affect substantially the obtained results (Fig. S1; Supplementary Material). For the
crust density crust, we assume an average density of 2800 kg/m3 as a good approach for
the average composition of a standard continental crust (Turcotte and Schubert, 2002).
According to this density value, the centre of the simulated magma chambers
reproducing the pressure of the experiments (500 MPa) has to be located between 18.3
and 18.6 km below the surface.
The thermal conductivity of magma kmagma and crust kcrust is calculated as follows:
(11)
(12)

ACC
EPTE
D M
ANU
SCR
IPT
ACCEPTED MANUSCRIPT
With the appropriate subscript, , and Cp, corresponding to thermal diffusivity,
density and specific heat capacity, respectively. For the magmatic and crustal thermal
diffusivity we use the model of Whittington et al. (2009).
To determine the specific heat capacity of the crust, we apply the method of
Robinson & Haas (1983) as further modified by Bea (2010):
(13)
where here T* refers to the temperature of the crust.
The latent heat L, for silicate phases is estimated to be 400 kJ/kg K. Anyway, the effect
of different latent heat value was found to be negligible as demonstrated by some tests
where L ranges from 300 to 500 kJ/kgK (Fig. S2; Supplementary Material).
The geothermal gradient of the crust (thermal_grad) is fixed at 20 ºC/km (Christiensen,
1979; Petford et al., 2000; Tarney and Windley, 1977).
4.3. Boundary conditions
The initial temperature profile for the country rock is defined according to the
geothermal gradient and assuming thermal conditions similar to those of Bea (2010).
Heat flux is zero through the lateral walls of the country rock (i.e. insulated walls). The
heat flow Qmantle = 0.03 W/m2 and the surface heat flow Qsurface = 0.07 W/m
2 are
assigned to the bottom and top limits of the computational domain (Fig. 4b) (Table 3).
For the magma chamber, we assume an initial temperature (T0_magma) equivalent to the
liquidus temperature provided by Rhyolite-MELTS (1106 ºC with 1.2 wt% H2O).
An example of the performed models is reported as Supplementary Material (COMSOL
MULTIPHYSICS commercial software V4.4 or greater is required).
4.4. Numerical modelling results

ACC
EPTE
D M
ANU
SCR
IPT
ACCEPTED MANUSCRIPT
We have performed simulations considering magma chambers with different sizes and
geometries (Table 5). Further geometries were considered, however the results were
unsuccessful in establishing a comparison with the experimental data (Table S3). Width
(w) and height (h) of the magma bodies have been assigned according to the dimensions
of magma chambers in the continental crust (Cruden, 1998; Lipman, 1997; Petford et
al., 2000). During cooling, we have extracted, for each time step, the magma
temperature along the A-A’ profile (Fig. 4b) until the temperature in the innermost
portion of the chamber decreases 1 ºC (the estimated error from the temperature
measure by thermocouples) from the AGV-2 liquidus (i.e. 1106 ºC) to 1105 °C. At this
temperature, we consider the interior of the magma chamber to be just below
T_liquidus. Time steps for the different models vary from 0.08 to 1.6 ka depending on
the size of the simulated magma chamber, the larger steps corresponding to the larger
reservoirs.
On the whole, we observe that the cooling time, evolution and shape of the thermal
profiles at different time steps depend mainly on the magma chamber volume and
aspect ratio (Fig. 5). Thus, for approximately the same reservoir volume (e.g. case
studies 12 and 17), the cooling process will be more efficient as the aspect ratio
decreases. Similarly, the thermal gradient from the walls to the centre of the magma
chamber will be steeper according to lower magma chamber aspect ratio (e) (i.e. sill-
like reservoirs) (Fig. 5).
5. Comparison between experimental and numerical results
5.1. Methodology

ACC
EPTE
D M
ANU
SCR
IPT
ACCEPTED MANUSCRIPT
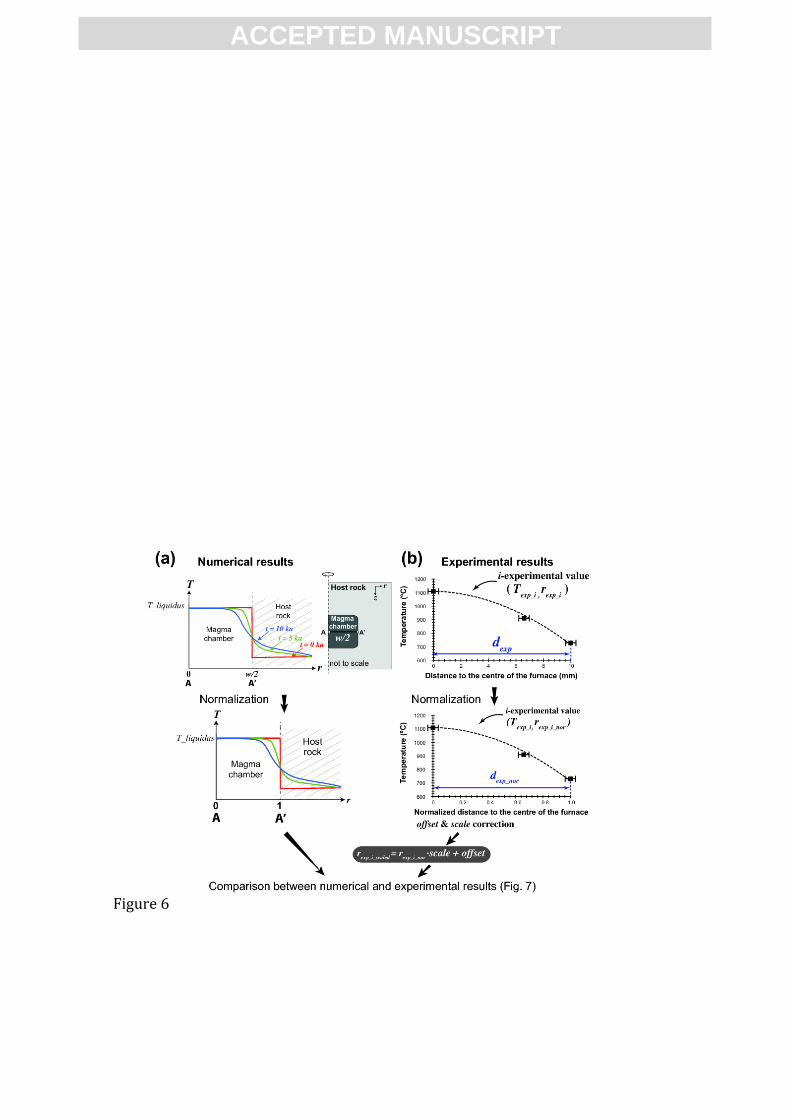
In order to compare the results obtained between numerical and experimental results, it
is required to normalize the distances across both thermal profiles. On one hand, we
have normalized the distance along the A-A’ profile by w/2 (Fig. 6a) for the numerical
runs. On the other hand, for experimental (double thermocouple) results, we have
normalized the distance of the measure position (rexp_i) for each experimental
temperature measurement (Texp_i) with respect to the standard length (dexp=10 mm) of
the entire capsule (Fig. 6b). Therefore, the positions along the thermal gradients from
numerical profiles, after normalization, can be compared with those from experimental
data. The positions along the experimental thermal profile and the central axis of the
magma chamber were calculated according to the entire capsule length and to the
magma chamber radius. The best-correlated examples have been selected for the
comparison.
Although in thermal gradient experiments the temperature ranges from liquidus to
solidus, it is not known what portion and/or evolutionary stage of a given magma
chamber is reproduced by the experimental thermal gradient (Fig. 7a). For example, the
normalized capsule length (dexp_nor) may correspond to the half width of a magma
chamber (w/2), consequently, the temperature values of our experiments (Texp) cover the
entire A-A’ thermal profile (see the first diagram in Fig. 7b). Thus, the values of Texp
located at rexp_i_nor = 0 will be at position A —the centre of the magma chamber— and
the values of Texp at rexp_i_nor = 1 at A’, the magma chamber-host rock interface (Fig. 7b).
Alternatively, dexp_nor may match only a portion of the A-A’ profile. In this case, the
maximum and minimum temperatures will be shifted from the centre or walls of the
magma chamber by a given magnitude (offset). In order to describe the latter situation,
we define the position (rexp_i_nor) of the experimental temperature values along the A-A’
profile as follows (Fig. 7a):

ACC
EPTE
D M
ANU
SCR
IPT
ACCEPTED MANUSCRIPT
(14)
where the variable scale is a scale factor (ranging from 0 to 1) for the total distance
(dexp_nor) between the centre of the furnace and the most distant measure position
corresponding to the lowest temperature. The offset indicates the position in which the
experimental points are located along the A-A’ profile with respect to the centre of the
chamber. This parameter is a consequence of the fact that scale is lower than 1; i.e. the
experimental points do not cover the entire thermal profile of the magma chamber, but
only a limited portion. Thus, for scale < 1, the experimental data set does not start from
the centre of the magma chamber but at a certain distance from it. This distance is
defined as offset (Fig. 7a):
offset ≤ 1- dexp_nor · scale (15)
A limiting factor is that the farthest experimental point has to be inside the magma
chamber or in contact with the host rock (Fig. 7a and b).
A priori we do not know the scale and offset values that will lead to a better fit of the
experimental measurements with the numerical thermal profiles. Thus, for each A-A’
thermal profile obtained with the numerical runs, we have compared the experimental
values using different scale and offset values from 0 to 1 and from 0 to 1- dexp_nor· scale,
respectively. Then, for each experimental data we have calculated the error percentage
between the temperatures predicted by the model and those observed as follows:
err =
(16)
We consider that the best fits between the experimental values and the numerical data
are those scale and offset pairs that accomplish the following points:
1) The error for the first experimental point is less than 1% (err1<1%) (i.e. the
temperature difference between the experimental value and the numerical
ACC
EPTE
D M
ANU
SCR
IPT
ACCEPTED MANUSCRIPT
one, is <11 ºC). In this way we ensure that the modelled magma
in the numerical models is still almost fully liquid as occurs within the
experimental capsule.
2) The error in the second experimental point is below 5% (err2<1%) (i.e.
< 45.5ºC). The fit between Texp_i and Tnum_i is heavily dependent on the
position along the A-A’ profile because of the steep slope of the thermal
gradients implying that small differences in involve large
temperature changes. For this reason, a higher err value is allowed in the second
experimental point.
3) The estimated err in the experimental point closer to the country rock contact is
below 10% (err3<10%) (i.e. < 73.2 ºC). Since the modelled
temperature close to the country rock contact may be influenced by a number of
parameters (e.g., the thermal gradient of the host rock), we consider that the
error cannot be easily reduced, due to we have a wide range of options in nature
that cannot be addressed in full in this study.
Thus, we consider as best fitting models those where it is possible to find scale and
offset pairs that fulfil the points imposed above. The second best fitting group of models
are those where the scale-offset pairs calculated lead to err1<1%, err2<7.5% and
err3<12.5%. Above these error values we consider that the numerical models fail to
reproduce the thermal gradient obtained in the experiments and that there is no
significant equivalence between them.
We estimate the final deviation between experimental and numerical data (Δ)
using Root-Mean-Square Error (RMSE) as follows:
(17)

ACC
EPTE
D M
ANU
SCR
IPT
ACCEPTED MANUSCRIPT
where n is the total number of the experimental points, in this case n=3 , and Tnum_i is
the temperature predicted by the numerical simulation at the position . The
RMSE is a common measure of the difference between values predicted by a model and
those observed. Taking into consideration the restrictions mentioned above regarding
the values allowed for err, the best fitting models will have a RMSE < 50.15ºC and the
second group < 66.4ºC.
5.2. Comparison results for an andesitic magma at 500 MPa
Our results are illustrated in Figs. 5 and 8, and the best scale and offset values are listed
in Table 6. The minimum final deviation (RMSE) for each case study is illustrated in the
Supplementary Material (Fig. S3). It is clear from the results that the temperature
difference increases as the aspect ratio decreases (Fig. S3). The best fitting models are
those with larger aspect ratio (e.g. Case studies 13, 14, 15).
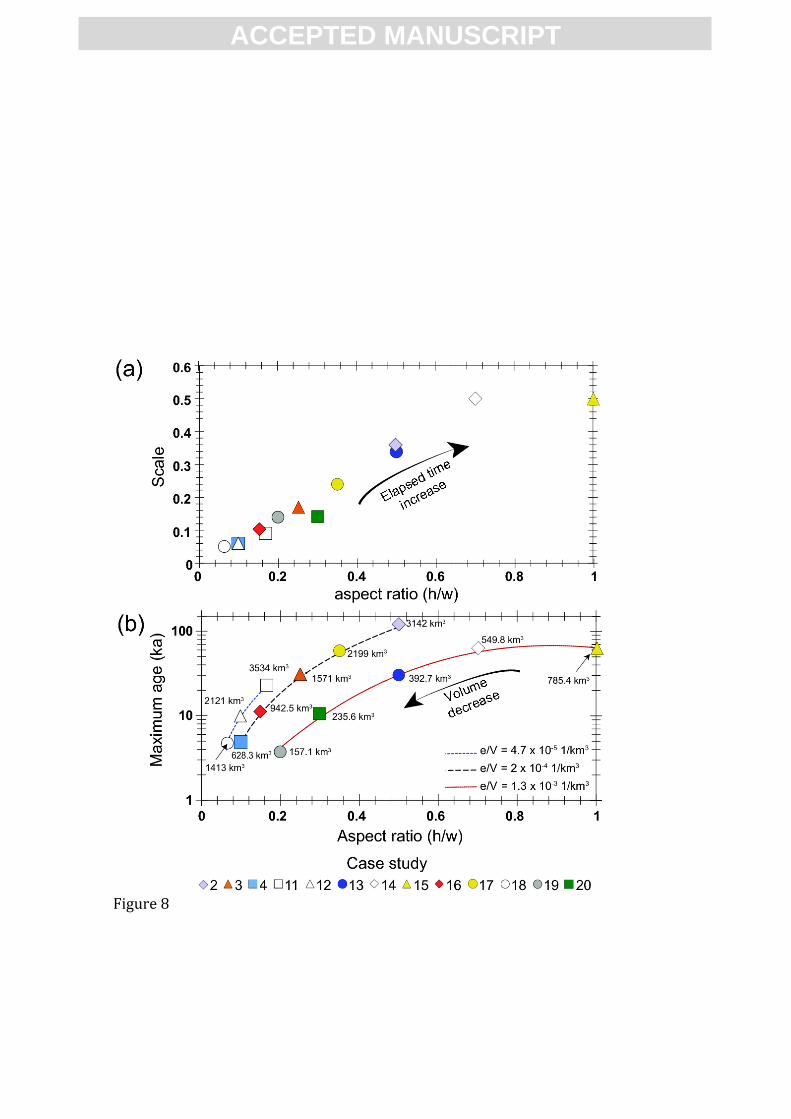
An important result from this study is that as the aspect ratio of the magma chamber
increases, a greater scale value is required to obtain the best correspondence between
the experimental and numerical results (Fig. 8a). These case studies have long time
intervals, reaching 100 ka (Fig. 8b).
In other words, the time interval, within which the experimental points (Texp) fit their
equivalent in the numerical thermal profiles, increases proportionally with scale and
aspect ratio.
This observation indicates that in the case of sill-like reservoirs, the experimental
thermal gradient corresponds to a small fraction of the magma chamber, i.e. small-scale
values. Additionally, for reservoirs with low aspect ratios, the experimental profiles
correspond to short time windows (Fig. 8b) and the final temperature deviation reaches
greater values (Fig. S3). Examples with extremely low values of aspect ratio do not

ACC
EPTE
D M
ANU
SCR
IPT
ACCEPTED MANUSCRIPT
reach adequate fits for the experimental measurements (e. g. case study 4 and 18,
labelled in black in Fig.5).
On the other hand, when the height is > 5 km (2, 14, 15 and 17), the predicted time
interval is high, ranging from 60 to 120 ka (Fig. 5). A larger fraction of the cooling
magmatic body will be represented by the experimental points for magma bodies with h
≈ w (i.e. e close to 1) (Fig. 5).
In most cases, the offset value is close to 1- dexp_nor · scale (Table 6). This indicates that
temperature data (Texp) fit quite well with the numerical results that encompass the
contact between the magma chamber and its host rock when rexp-scale = 1.
The time frame is the time interval for which experiments and numerical simulations
match with each other. We observe three distinct trends that correspond to the different
e/V ratios of the simulated reservoir (Fig. 8b), where V is the volume of the modelled
magma chamber assuming a cylindrical shape of radius w/2, and e is the aspect ratio
(h/w). This e/V relation indirectly illustrates the heat loss efficiency, being higher in sill-
like intrusions (low e) compared to spherical ones (e=1). The selected combinations of
h and w yield three different e/V categories or cases (Fig. 8b). For those cases sharing
e/V ratio, the time window of good match increases with the aspect ratio (Fig. 8b). Thus,
small sill-like magma reservoirs (e.g. case study 13, V = 392.7 km3; e/V ratio = 1.3 x 10
-
3 km
-3) will be related to the same time window than large magma volumes with e
values close to 1 (e.g. case study 11, V = 3534 km3; e/V ratio = 4.7 x 10
-5 km
-3). For the
same e≈1 value, large reservoirs will lead to experimental values fitting in a time
window wider than that of small magma chambers. Thus, the time window in which the
experimental values fit the numerical results will be lower than a few thousand years
(e.g. 19) or over 120 ka (e.g. case study 2) spreading over two orders of magnitude,
depending on each case study.

ACC
EPTE
D M
ANU
SCR
IPT
ACCEPTED MANUSCRIPT
In summary, keeping constant other variables such as depth or magma/crust thermal
properties, the geometry and size of the magma chamber appear to be the most
important parameters controlling the evolution of cooling. The higher deviation values
arise when comparing the temperature at the contact with the host rock and the
minimum temperature measured within the experimental runs. The temperature at the
contact with the host rock exceeds the minimum temperature of the experimental
measurements (732 ºC). The AGV-2 solidus is around 680 ºC (Table S2) but the
temperature is higher than this value due to the imposed geothermal gradient (20 ºC/km)
and the influence of the latent heat (Fig. S2). Consequently, high deviation values come
from this initial temperature difference.
6. Discussion and conclusions
Results obtained in this study show how thermal gradient experiments can reproduce
the natural systems over the effects of a short time scale and limited dimensions.
The scaling factor provides the portion of magma chamber represented by the
experimental thermal gradient (Fig. 8). In all cases, the represented fraction is found
next to the contact with the host rock. During early stages corresponding to the
beginning of magma chamber cooling, the temperature change is constrained to a
reduced space next to the host rock. Due to the fact that the thermal profile used for the
comparison was chosen as a function of the liquidus temperature of the starting melt
composition, the outputs from the scaling correspond to these initial stages, for which
the thermal gradient is very steep and is constrained to the area near to the host rock
contact. In fact, the most of the decoupling between experimental and numerical data (Δ
ACC
EPTE
D M
ANU
SCR
IPT
ACCEPTED MANUSCRIPT
in Fig. S3) are reached at the contact. This is because the dwell time is not enough to
solidify completely the magma at the contact with the host.
The thermal gradient experiments mostly reproduce the sill-like magma chambers for
short periods of time or thicker magma chambers for longer periods of time (Fig. 5).
Thin magma bodies with low aspect ratio will experience fast cooling, due to heat loss
in their roof and footwall. Magmatic systems, with vertical dimensions smaller than
5km, are not able to reduce the sharp temperature change, imposed by the thermal
contrast with the host rock. Therefore, the maximum temperature of the magma (1106
ºC, AGV liquidus) decreases rapidly at the initial stage of cooling. As a consequence,
the experimental measurements (fixed at the AGV liquidus) cannot be compared with
the modelling results obtained at the final stage of magma chamber evolution for
periods of time > 20 ka.
By contrast, it can be argued that thick magma chambers can maintain the liquidus in
the innermost parts for a long time (Fig. 5). Thereby, the experimental thermal profiles
are comparable to the numerical modelling during longer time intervals, with a
maximum duration of 120 ka (Fig. 8).
In summary, the portion of the thermal profile represented by the experimental capsule
may range from 0.1 to 0.5 of the radius of the magma chamber depending on volume
and aspect ratio.
For those examples using a low aspect ratio up to 0.1, we found it matched the
experimental modelling (Fig. 5). However, the represented portion varies only from 0.1
to 0.2 (Fig. 8a), since the space between the liquidus and solidus is small. For these
examples, the melt fraction is high and the thermal gradient exhibits a steep behavior
with respect to the other case studies. When the thermal gradient diminishes in magma

ACC
EPTE
D M
ANU
SCR
IPT
ACCEPTED MANUSCRIPT
chambers with these geometries, the temperature at the core is low than the AGV
liquidus and therefore, the comparison is not possible.
The scaling factors can be used for experiments with similar temperatures at the hotspot
zone that, in turn, control the thermal profile in the assembly of the piston-cylinder.
Since the experimental thermal profiles show a similar pattern for temperatures
measured next to the hotspot, the scaling factor can be applied to thermal-gradient
experiments at 500 MPa and over temperature range between 1200 and 1000 ºC.
Experimental thermal gradients for different pressure and temperature conditions,
simulate distance and cooling stages that can be calculated through our approach. In
both cases, the thermal gradients become smoother as the cooling proceeds.
6.1. Implications
Processes occurring in deep-seated magma chambers are partly responsible for the style
of explosive or effusive eruptions and their understanding is essential in volcanology.
An important implication of our comparative study is the establishment of the range of
magma chamber geometries and volumes for which thermal gradient experiments can
be represented, within the limits imposed using the scaling factors proposed in this
study. Thermal gradient experiments are able to reproduce the solidification front
(Marsh, 2002) including the whole temperature range from liquidus to solidus.
Magma chambers volumes represented by thermal gradient experiments range from 150
to 3500 km3 (Fig. 8b). The contexts of application for these crystallization experiments
at 500 MPa are representative of typical dimensions of batholith-like, large silicic
magma bodies (Lipman, 2007; Scandone and Acocella, 2007; Petford et al., 2000) and
small silicic plutons.
ACC
EPTE
D M
ANU
SCR
IPT
ACCEPTED MANUSCRIPT
Furthermore, batholiths are typically characterized by tabular geometries with thickness
not exceeding 5 to 10 km (Elo and Korja, 1993; Petford et al., 2000). These low-aspect
ratio bodies are the geometries most suitable for the comparison between modelled
thermal gradients and experiments. According to Cruden (1998), tabular granites can be
quickly emplaced despite the geometry changes in thickness during emplacement.
Structural and geophysical surveys support low aspect ratio and sill-like geometries
with depth feeder zones (Ameglio et al., 1997; Ameglio and Vigneresse, 1999). The
incremental growth of magma reservoir during various steps over protracted periods has
been also recorded (Annen et al., 2006).
On a different note, the time frame during which the experimental-numerical
comparison is possible (Fig. 8b) corresponds to time scales for differentiation to high-
silica magmas (Hawkesworth et al., 2000; Hawkesworth et al., 2004).
It is widely accepted that large magma chambers have low aspect ratios. Results from
thermal modelling simulating magma chambers with a small height and great width
closely match with thermal profiles obtained in laboratory. This means that thermal
gradient experiments can be successfully applied to batholiths, small silicic plutons and
super volcanoes magma chambers (Fig. 5).
Our results are related to this specific case study for andesitic compositions; however,
the methodology can be applied to other compositions and additional experimental
results.
Figure captions
Figure 1. Sketch illustrating thermal gradient experiments that may represent varied
evolutionary stages of the same magma chamber. (a) The experimental thermal gradient

ACC
EPTE
D M
ANU
SCR
IPT
ACCEPTED MANUSCRIPT
may correspond to early stages of cooling, representing just a distance of 2 km from the
boundary with the host rock. (b) In a more evolved magmatic system, the thermal
gradient imposed to the experiments can be equivalent to a distance of 5 km from the
walls of the magma chamber (red zone).
Figure 2. Design of the experimental assembly showing the desired measure
thermocouple positions (MP1 and MP2) in both CG1 and CG2 runs. The control
position called CP marks the thermocouple located into the hotspot.
Figure 3. Temperature measurements at 6.6 mm (a) and 10 mm (b) from the centre of
the furnace (hotspot) showing the response to temperature changes at the control
position (hotspot). Regression curves are also represented.
Figure 4. (a) Example of a thermal profile. (b) Sketch of the numerical models set-up
also showing the used boundary conditions. (c) Example of the Finite Element mesh
used for the modelling.
Figure 5. Magma chamber temperatures along the A-A’ profile obtained by numerical
modelling. For illustrative purposes, a sketch of the modelled magma reservoir is also
included. Black diamonds and yellow squares represent the experimental values
considering the maximum and minimum scale, respectively. Errors of temperature are
less than the vertical length of the symbols. Errors of the offset and scale values are
represented for each experimental point (black bars). Best and second best fitting
models are indicated with green and yellow colour, respectively. ns: Drawings of
magma chambers are not scaled, only aimed to illustrate the aspect ratio.

ACC
EPTE
D M
ANU
SCR
IPT
ACCEPTED MANUSCRIPT
Figure 6. Procedure developed to compare experimental and numerical results. (a)
Normalization of the positions along the numerical thermal profile (A-A’) relative to
magma chamber radius (w/2). (b) Normalization of measured (experimental) positions
(rexp_i) according to the standard capsule length (10 mm).
Figure 7. (a) Comparison between numerical and experimental thermal profiles, after
normalization and the processing of the experimental data through the use of scale and
offset parameters. (b) Example of situations after data processing by applying scale and
offset parameters.
Figure 8. Diagrams of the scaling results from the comparison between numerical
modelling and experimental data. (a) Aspect ratio (e = height/width) vs. scale
(simulated distance/radius of the magma chamber) plot reveals the influence of
geometry on the distance simulated by the experimental thermal profiles (b) Aspect
ratio vs. maximum age diagram showing the simulated time frame of the magma
chambers for each case study. Magma volume is indicated (black lettering) and the
black arrow marks the volume increase. Dashed lines mark magma chamber groups
with equal e/V ratio (blue dashed line for 4.7x10⁻⁵
km-3
, black dashed line for 2x10⁻⁴
km-3
, red dashed line for 1.3x10⁻³
km-3
.
Figure S1. Diagram showing the influence of the magma density on the thermal profile
along the central axis of the magma chamber (A-A’ profile). The time and magma
chamber geometry selected for these thermal profiles are taken arbitrarily.

ACC
EPTE
D M
ANU
SCR
IPT
ACCEPTED MANUSCRIPT
Figure S2. Plot of normalized distance vs. magma temperature displaying the influence
of the latent heat on the thermal profiles along the central axis of the magmatic system
(A-A’ profile).
Figure S3. Aspect ratio vs. deviation diagram showing the dependence of the
decoupling between numerical and experimental results according to the geometry of
the magma chamber.
Acknowledgements
This work is supported by PLUVOLC MINECO grant CGL2010-22022-C02-01 and
grant EEBB-I-13-07070 for the stay of C. R. at the Jaume Almera Institute (ICTJA-
CSIC, Barcelona). AG is grateful for her Juan de la Cierva post-doctoral grant (JCI-
2010-06092) and her Ramón y Cajal contract (RYC-2012-11024). We thank Silvio
Mollo, Bruno Scaillet and Malcom J. Rutherford for their very constructive reviews that
improved the manuscript significantly.

ACC
EPTE
D M
ANU
SCR
IPT
ACCEPTED MANUSCRIPT
REFERENCES
Ameglio, L., Vigneresse, J.L. and Bouchez, J.L., 1997. Granite pluton geometry and
emplacement mode inferred from combined fabric and gravity data. In: J.L.
Bouchez, W.E. Stephens and D.H.W. Hutton (Editors), Granite: from
Segregation of Melt to Emplacement Fabrics. Kluwer Academic Publishers,
Dordrecht, pp. 200-214.
Ameglio, L. and Vigneresse, J.L., 1999. In: Understanding Granites: Integrating New
and Classical Techniques (eds. Castro, A., Fernández, C., & Vigneresse, J.L.),
(Geological Society of London Publication 158: 39-54).
Annen, C., Blundy, J.D. and Sparks, R.S.J., 2006. The genesis of intermediate and
silicic magmas in deep crustal hot zones. Journal of Petrology, 47(3): 505-539.
Annen, C., 2009. From plutons to magma chambers: Thermal constraints on the
accumulation of eruptible silicic magma in the upper crust. Earth and Planetary
Science Letters, 284(3-4): 409-416.
Bachmann, O. and Bergantz, G. W., 2004. On the origin of crysytal-poor rhyolites:
extracted from batholitic crystal mushes. Journal of Petrology, 45: 1565-1582.
Bachmann, O. and Bergantz G.W., 2006. Gas percolation in upper-crustal silicic crystal
mushes as a mechanism for upward heat advection and rejuvenation if near-
solidus magma bodies. Journal of Volcanology and Geothermal Research, 149:
85-102.
Bea, F., 2010. Crystallization dynamics of granite magma chambers in the absence of
regional stress: Multiphysics modeling with natural examples. Journal of
Petrology, 51: 1541-1569.
Boyd, F.R. and England, J.L., 1960. Apparatus for phase-equilibrium measurements at
pressures up to 50 kilobars and temperatures to 1750 ºC. Jornal of Geophysical
Research, 65: 741-748.
Canot, E., March, E. and Muhieddine, M., 2009. Various Approaches for Solving
Problems in Heat Conduction with Phase Change. International Journal on Finite
Volumes, 6(1): 1-20.
Castro, A., Vogt, K. and Gerya, T., 2013. Generation of new continental crust by sublithospheric silicic-magma relamination in arcs: A test of Taylor's andesite model. Gondwana Research, 23(4): 1554-1566.
Castro, A., 2014. The off-crust origin of granite batholiths. Geoscience Frontiers, 5: 63-
75.
Christiensen, N.I., 1979. Compressional Wave Velocities in. Rocks at High
Temperatures and Pressures, Critical Thermal Gradients, and Crustal Low-
Velocity Zones. Journal of Geophysical Research, 84(B12): 6849-6857.

ACC
EPTE
D M
ANU
SCR
IPT
ACCEPTED MANUSCRIPT
Cruden, A.R., 1998. On the emplacement of tabular granites. Journal of Geological
Society, 155: 853-862.
Elo, S. and Korja, A., 1993. Geophysycal interpretation of the crustal and upper mantle
structure in the Wiborg rapakivi granite area, southeastern Finland. Precambrian
Research, 64: 273-288.
Flanagan, F.J., 1967. U.S. Geological Survey silicate rock standards. Geochimica et
Cosmochimica Acta, 31: 289-308.
Gelman, S.E., Gutierrez, F.J. and Bachmann, O., 2013. On the longevity of large upper
crustal silicic magma chambers. Geology, 41(7): 759-762.
Gualda, G.A.R., Ghiorso, M., Lemons, R.V. and Carley, T.L., 2012. Rhyolite-MELTS:
a Modified Calibration of MELTS Optimized for Silica-rich, Fluid-bearing
Magmatic Systems. Journal of Petrology., 53(5): 875-890.
Gutiérrez, F. and Parada, M.A., 2010. Numerical Modeling of Time-dependent Fluid
Dynamics and Differentiation of a Shallow Basaltic Magma Chamber. Journal
of Petrology, 51: 731-762.
Hawkesworth, C., George, R., Turner, S. and Zellmer, G., 2004. Time scales of
magmatic processes. Earth and Planetary Science Letters, 218: 1-16.
Hawkesworth, C.J., Blake, S., Evans, P., Hughes, R., MacDonald, R., Thomas, L.E.,
Turner, S.P. and Zellmer, G., 2000. Time scales of crystal fractionation in
magma chambers-Integrating physical, isotopic and geochemical perspectives.
Journal of Petrology, 41(7): 991-106.
Hu, H. and Argyropoulos, S.A., 1996. Mathematical modelling of solidification and
melting: a review. Modelling and Simulation in Materials Science and
Engineering, 4(4): 371.
Huang, F., Lundstrom, C.C., Glessner, J., Ianno, A., Boudreau, A., Li, J., Ferré, E.C.,
Marshak, S. and DeFrates, J., 2009. Chemical and isotopic fractionation of wet
andesite in a temperature gradient: Experiments and models suggesting a new
mechanism of magma differentiation. Geochimica et Cosmochimica Acta,
73(3): 729-749.
Huber, C., Bachmann, O. and Manga, M., 2009. Homogenization processes in silicic
magma chambers by stirring and mushification (latent heat buffering). Earth and
planetary science letters, 283: 38-47.
Huber, C., Bachmann, O., Vigneresse, J.L., Dufek, J. and Parmigiani, A., 2012. A
physical model for metal extraction and transport in shallow magmatic systems.
Geochemistry, Geophysics, Geosystems, 13(8).

ACC
EPTE
D M
ANU
SCR
IPT
ACCEPTED MANUSCRIPT
Koyaguchi, T. and Kaneko K., 2000. Thermal evolution of silicic magma chambers
after basalt replenishment. Trans. R. Soc. Edimburgh, 91: 47-60.
Lipman, P.W., 1997. Subsidence of ash-flow claderas: relation to caldera size and
magma-chmaber geometry. Bulletin of Volcanology, 59: 198-218.
Lipman, P.W., 2007. Incremental assembly and prolonged consolidation of Cordilleran
magma chambers: Evidence from the Southern Rocky Mountain volcanic field.
Geosphere, 3 42-70.
Lundstrom, C., Boudreau, A. and Petermann, M., 2005. Diffusion-reaction in a thermal
gradient: Implications for the genesis of anothitic plagioclase, high alumina
basalt and igneous mineral layering. Earth and Planetary Science Letters, 237:
829-854.
Marsh, B.D., 2002. On bimodal differentiation by solidification front instability in
basaltic magmas, part 1: Basic mechanics. Geochimica et Cosmochimica Acta,
66: 2211-2229.
Masotta, M., Freda, C. and Gaeta, M., 2012. Origin of crystal-poor, differentiated
magmas: Insights from thermal gradient experiments. Contributions to
Mineralogy and Petrology, 163(49-65).
Mollo, S. and Masotta, M., 2014. Optimizing pre-eruptive temperature estimates in
thermally and chemically zoned magma chambers. Chemical Geology, 368: 97-
103.
Petford, N., Cruden, A.R., McCaffrey, K.J.W. and Vigneresse, J.L., 2000. Granite
magma formation, transport and emplacement in the Earth´s crust. Nature, 408:
669-673.
Pickering, J.M., Schwab, B.E. and Jonhston, A.D., 1998. Off-center hot spots: Double
thermocouple determination of the thermal gradient in a 1.27 cm (1/2 in.) CaF2
piston-cylinder furnace assembly. American Mineralogist, 83: 228-235.
Scandone, R. and Acocella, V., 2007. Control of the aspect ratio of the chamber roof on
caldera formation during silicic eruptions. Geophysical Research Letters, 34: 4.
Schilling, F. and Wunder, B., 2004. Temperature distrbution in piston-cyliner
assemblies: Numerical simulations and laboratory experiments. European
Journal of Mineralogy, 16: 7-14.
Tarney, J. and Windley, B.F., 1977. Chemistry, thermal gradients and evolution of the
lower continental crust. Journal of Geological Society, 134: 153-172.
Turcotte, D.L. and Schubert, G., 2002. Geodynamics. Cambridge University Press,
Cambridge, 456 pp. pp.

ACC
EPTE
D M
ANU
SCR
IPT
ACCEPTED MANUSCRIPT
Voller, V.R., Swaminathan, C.R. and Thomas, B.G., 1990. Fixed grid techniques for
phase change problems: A review. International Journal for Numerical Methods
in Engineering, 30(4): 875-898.
Watson, E.B., Wark, D.A., Price, J.D. and Van Orman, J.A., 2002. Mapping the thermal
structure of solid-media pressure assemblies. Contributions to Mineralogy and
Petrology, 142: 640-652.
Whittington, A.G., Hofmeister, A.M. and Nabelek, P.I., 2009. Temperature-dependent
thermal diffusivity of the Earth’s crust and implications for magmatism. Nature,
458: 319-321.

ACC
EPTE
D M
ANU
SCR
IPT
ACCEPTED MANUSCRIPT
Figure 1

ACC
EPTE
D M
ANU
SCR
IPT
ACCEPTED MANUSCRIPT
Figure 2
ACC
EPTE
D M
ANU
SCR
IPT
ACCEPTED MANUSCRIPT
Figure 3

ACC
EPTE
D M
ANU
SCR
IPT
ACCEPTED MANUSCRIPT
Figure 4

ACC
EPTE
D M
ANU
SCR
IPT
ACCEPTED MANUSCRIPT
Figure 5
ACC
EPTE
D M
ANU
SCR
IPT
ACCEPTED MANUSCRIPT
Figure 6

ACC
EPTE
D M
ANU
SCR
IPT
ACCEPTED MANUSCRIPT
Figure 7
ACC
EPTE
D M
ANU
SCR
IPT
ACCEPTED MANUSCRIPT
Figure 8

ACC
EPTE
D M
ANU
SCR
IPT
ACCEPTED MANUSCRIPT
Table 1
Experimental conditions
Run CG1 CG2
Location of the measure thermocouple
(mm)* 6.6 10
Initial temperature (ºC) 1200 1200
Final temperature (ºC) 950 800
P (MPa) 500 500
Cooling ramp (ºC/hour) 10 10/0.6 * Distance from the centre of the furnace (hotspot)
Table 2
Temperature values at different distances
Run nº (reference) CG1/CG2 CG1 CG2
Distance from the centre of the furnace (mm) (rexp_i) 0 6.60 10.00
Normalized distance (position/ total length) (rexp_i_nor) 0 0.66 1.00
Temperature (ºC) 1106 909.1 732.3
Table 3
Physical and thermal parameters
Symbol Value Variable SI Unit
Phase change smoothed function -
Cp Specific heat capacity at constant pressure J/kgºC
Cpcrust
Eq. 10 Specific heat capacity of crust1 J/kgºC
Cpmelt Supp. Mat. Table S2 Specific heat capacity of magma (melt phase) J/kgºC
Cpsolid Supp. Mat. Table S2 Specific heat capacity of magma (solid phase) J/kgºC
d 18.3-18.6 Magma chamber depth km
e 0.1-1 Magma chamber aspect ratio -
h 2-10 Magma chamber height km
magma f(T) Magma thermal diffusivity2 m
2/s
crust f(T) Crust thermal diffusivity2 m
2/s
k Thermal conductivity W/mºC
kmagma Eq. 8 Magma thermal conductivity 2 W/mºC
kcrust Eq. 9 Crust thermal conductivity2 W/mºC
L 400 Latent heat of crystallization1 kJ/kg
Supp. Mat. Table S1 Melt fraction3 -
Qcrust Eq. 11 Heat production crust1 -

ACC
EPTE
D M
ANU
SCR
IPT
ACCEPTED MANUSCRIPT
Qmantle 0.03 Subcrustal heat flow1 W/m
2
Qsurface 0.07 Surface heat flow1 W/m
2
crust 2800 Crust density kg/m3
magm 2600 Magma density kg/m3
ϕ 1- Solid fraction3 -
thermal_grad 20 Crustal thermal gradient ºC/km
T_liquidus 1106 Magma liquidus temperature3 ºC
T_solidus 676.4 Magma solidus temperature3 ºC
T_surface 20 Surface temperature ºC
T0_magma 1106 Initial magma temperature ºC
T0_crust Initial crustal temperature ºC
P 500 Magma chamber internal pressure at h/2 MPa
w 10-30 Magma chamber width km
1, Bea (2010); 2, Whittington et al. (2009); 3, use Rhyolite MELTS code by Gualda et al. (2012)
Table 4
Composition of the starting material
used for the simulation
Major elements (wt%) AGV-2
SiO2 59.30
TiO2 1.05
Al2O3 16.91
FeO 6.08
MgO 1.79
MnO 0.00
CaO 5.20
Na2O 4.19
K2O 2.88
P2O5 0.48
Table 5
Case studies used for the numerical modelling of magma chambers
Case study 2 3 4 11 12 13 14 15 16 17 18 19 20
Width w (km) 20 20 20 30 30 10 10 10 20 20 30 10 10
Heigth h (km) 10 5 2 5 3 5 7 10 3 7 2 2 3
Volume V (km3)
* 3142 1571 628.3 3534 2121 392.7 549.8 785.4 942.5 2199 1413 157.1 235.6
Aspect ratio e (h/w) 0.50 0.25 0.10 0.17 0.10 0.50 0.70 1.00 0.15 0.35 0.07 0.20 0.30 *Volume calculated assuming cylindrical shapes

ACC
EPTE
D M
ANU
SCR
IPT
ACCEPTED MANUSCRIPT
Table 6
Results from numerical runs for the time frame, scale and offset values
Case study Time frame (ka) scale scale × w/2 (km) offset offset × w/2 (km)
2 0.07-120.5 0.015-0.36 0.15-3.60 0.638-0.985 6.375-9.85
3 0.07-31.10 0.015-0.17 0.15-1.70 0.838-0.985 8.375-9.85
4 0.07-4.80 0.015-0.06 0.15-0.60 0.948-0.985 9.475-9.85
11 0.07-22.80 0.013-0.09 0.20-1.35 0.908-0.987 13.625-14.80
12 0.07-9.90 0.013-0.06 0.20-0.90 0.938-0.987 14.075-14.80
13 0.07-30.10 0.03-0.34 0.15-1.70 0.660-0.97 3.30-4.85
14 0.13-63.42 0.04-0.50 0.20-2.50 0.50-0.96 2.50-4.8
15 0.07-63.10 0.03-0.50 0.15-2.50 0.50-0.97 2.50-4.85
16 0.07-11.30 0.015-0.10 0.15-1.00 0.898-0.985 8.975-9.85
17 0.07-59.98 0.015-0.24 0.15-2.40 0.758-0.985 7.575-9.85
18 0.07-4.80 0.013-0.05 0.15-0.75 0.948-0.99 14.22-14.85
19 0.00-3.8 0.02-0.14 0.10-0.70 0.86-0.98 4.30-4.90
20 0.00-10.62 0.03-0.14 0.15-0.70 0.86-0.97 4.30-4.85

ACC
EPTE
D M
ANU
SCR
IPT
ACCEPTED MANUSCRIPT
Graphical abstract
Highlights
Experimental thermal gradients simulate transient stages of cooling magma chambers.
Numerical modeling approaches the scaling of crystallization experiments.
Experimental thermal gradients are comparable to sill-like magma chambers.