reference 1 emergency measures based on the ... - npa.go.jp
TRANSCRIPT

- 1 -
Crime Situation in 2020
1 Situation
Number of Penal Code Offenses Known to the Police
Among the indicators for measuring the crime situation in our country, the total
number of known cases of penal code offenses has decreased consistently since
2003. In 2020, the number was 614,231, the smallest since the end of the Second
World War, following the previous year. In 2020, the rate of decrease was 17.9% over
the previous year, which was greater than that of the previous year. (In 2019, the rate of
decrease was 8.4% over the previous year.)
Looking at the breakdown of the decline in the number of known cases, the number
of street crimes and invasion crimes, which account for a large proportion of the total
number, has consistently decreased since 2003. Against the backdrop of a unified
promotion of comprehensive anticrime measures by police and civilians, the
dissemination of crime prevention equipment, and various other changes in the social
situation continued. (It was down 87.3% from 2002, when the number of known cases
of penal code crimes reached the highest level after the Second World War.) Last year,
the decrease in the number of known cases of street crimes was particularly
high. Although many different factors can cause an increase or decrease in the number
of crimes, one factor in the decrease is believed to be the decrease in the number of
people out of doors due to those self-restraints on going out to prevent infection from
the spread of COVID-19.
On the other hand, COVID-19-related crimes such as the burglary of closed stores
and fraudulent collection of subsidies associated with measures to counter the spread
of the coronavirus, are also occurring in response to the confusion caused by the
spread of the infection.
Effects from the change in social modes accompanying the spread of coronavirus
may continue to appear.
Reference 1 Emergency measures based on the Act on Special Measures against Novel Influenza,
etc. were implemented from April 7 through May 25 2020. Since April of the same year,
there has been a significant decrease in the number of reported street crimes over the
previous year. (April-December 2019 was down 11.8% year-on-year, and April-December
2020 was down 32.2% year-on-year.)
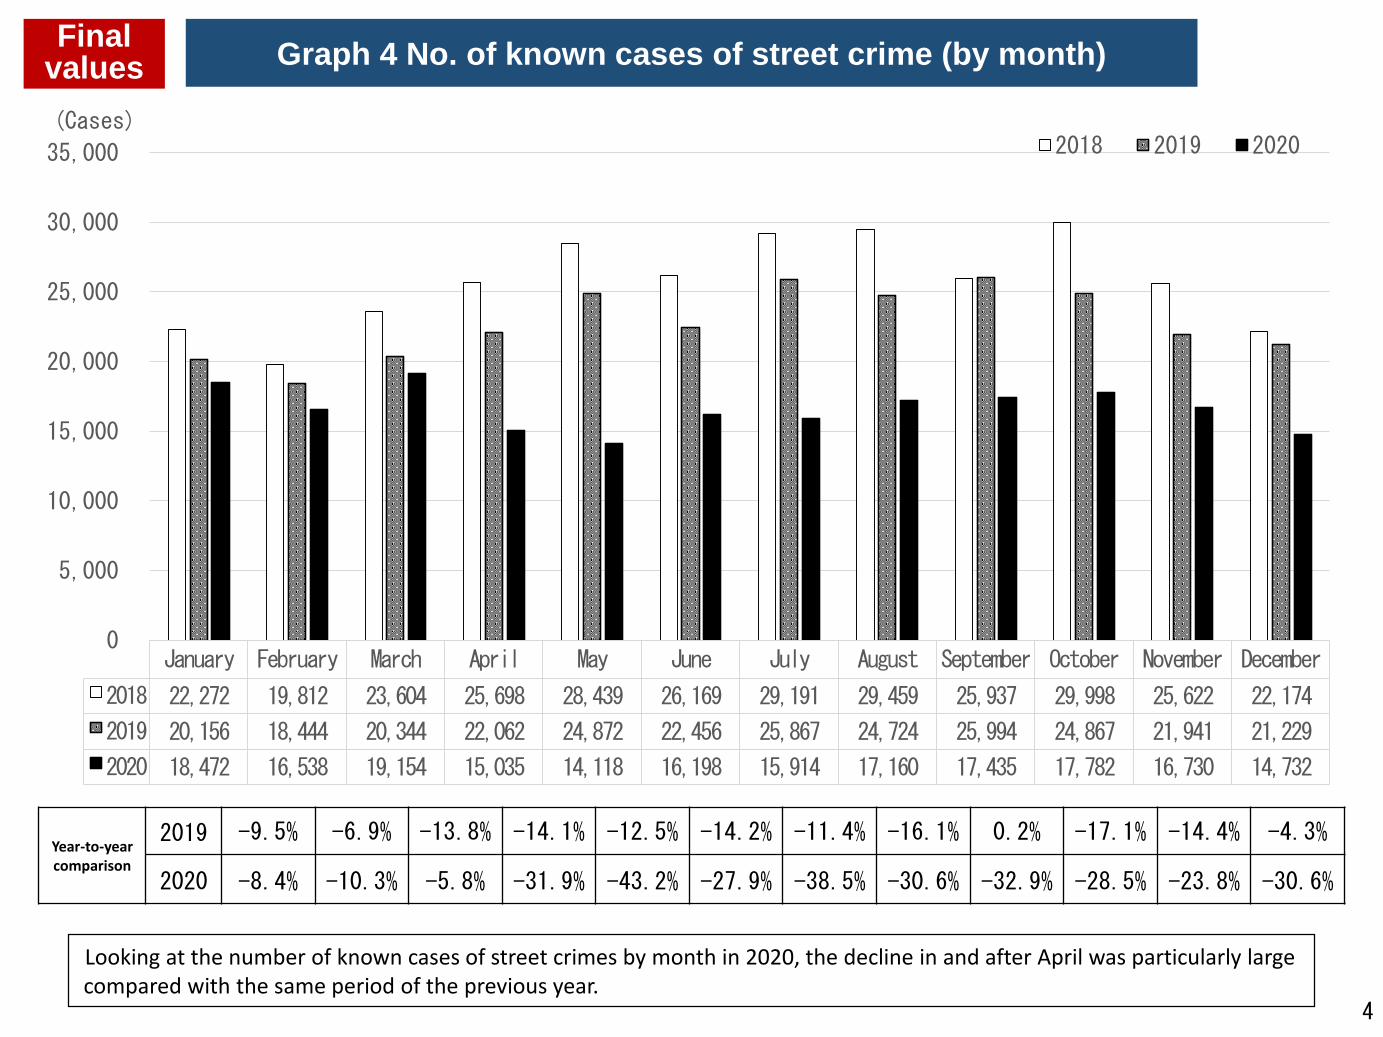
Special Fraud
The number of known cases of special fraud in 2020 was 13,550, the lowest in the
last five years, as a result of promoting a number of different measures. For example,
we worked together with prominent “influencers” who have power to affect public
opinion in public awareness campaigns based on the “Plan for Countermeasures
against “It’s Me” Fraud” determined at the Ministerial Conference on Countermeasures
against Crime in June 2019. However, while the total number of penal code offenses
known to the police has consistently decreased since 2003, the number of known
special fraud cases has remained at a high level: 2.0 times that in 2010, which was the
lowest since statistics have been compiled. Members and affiliates of organized crime
groups are seen involved in special fraud in leadership positions (the percentage of
- 2 -
members and affiliates of organized crime groups to total central suspects cleared was
45.0%).
Since 2018, there have also been many ways to target ATM cards such as ATM card
fraud and misappropriation, and the manner of crime is becoming more diverse and
sophisticated. Furthermore, a more stringent situation ongoing since 2019 involves
cases of seniors who incur damage from theft after being questioned over the phone
about their assets.
Reference 2 According to a questionnaire conducted by the NPA in September 2020 (a survey of
10,000 males and females aged 15 or older nationwide, conducted over the internet so that the
ratio of respondents by age, gender, and prefecture is based on 2015 census results), the
percentage of respondents indicating they experienced vulnerability to special fraud in the past
year was 11.0% (1,098 persons), and the percentage of respondents indicating they had
experienced special fraud in the past year was 1.3% (126 persons).
Threats in Cyberspace
Looking at indicators other than the number of known cases of penal code offenses,
the number of cleared cybercrime cases continues to increase, and the number of
unexpected connection attempts the NPA detects in cyberspace as apparent scanning
activities is also trending higher. The upward trend in the number of unexpected
connection attempts is believed to be due to factors such as an increased number of
targets available for attack due to the popularization of IoT devices and the constant
appearance of new malware. Also, the number of cases and amounts of damage in
relation to online banking fraud, which had been trending lower since 2016 due to
enhanced security measures at financial institutions, increased dramatically in
2019. Although both decreased from the previous year in 2020, the number of incidents
remains high. The number of child victims of crimes arising from social networking
services had also been trending higher since 2013 but decreased from the previous
year. However, the trend stayed at a high level due to cases of people who fell victim to
crime when they became acquainted with others in cyberspace and so forth.
Although it is difficult to use these indicators to accurately understand the state of
incidents, the threat in cyberspace continues to be a serious situation, given the wide
variety of cybercrime and cyber-attacks occurring both within and outside Japan in
recent years.
Reference 3 In the survey above, the percentage of people who responded that they had experienced
the risk of cybercrime damage in the past year was 21.8% (2,175 persons), and the
percentage of those who responded that they had been victimized by cybercrime in the past
year was 9.5% (949 persons).

- 3 -
Stalking, Domestic Violence, and Child Abuse
Despite a decrease in the number of consultations about stalking from the previous
year, the number of cases cleared has increased. Although the number of cleared
cases for domestic violence has decreased from the previous year, the number of
consultations has increased, and both indicators continue to remain at a high
level. Regarding child abuse, both the number of notifications of abuse cases and the
number of arrest cases have been on an increasing trend.
Although it is difficult to use these indicators to accurately understand the state of
incidents, the situation of stalking, domestic violence, and child abuse should continue
to be closely monitored.
Reference 4 In the survey above, 2.0% of respondents (203 persons) answered that they had
suffered damages from shadowing or stalking in the past year and 0.8% of respondents
(80 persons) answered that they had suffered damage due to domestic violence in the past
year.
Summarization
As described above, the total number of penal code offenses known to the police,
against the backdrop of various changes in the social situation, has been continuously
decreasing in recent years, primarily for the types of offenses and modus operandi that
make up a large percentage of the total. In 2020, the number of penal code offenses
known to the police drastically decreased compared to the previous year as a result of
the spread of COVID-19, etc. However, the crime situation is still difficult, given that it is
not necessarily understood from changes in the number of known cases and impacts
from changed social conditions resulting from the spread of COVID-19.
Reference 5 In the above survey, the percentage of people who are concerned about damage caused
by crimes, such as cybercrime is still large (for example, 75.3% (7,531 people) responded
that they “Am concerned” or “feel somewhat uneasy” about the danger of cybercrime), and
the percentage of people who answered “it’s not improving” or “it’s not really improving”
about the recent security situation is 56.2% (5,620 people), larger than the 34.4%
(3,435 people) who answered “it’s improving” or “it’s somewhat improving.”

- 4 -
2 Future Actions
In response to countermeasures, the modus operandi of crimes that are highly
anonymous and involve offenses by a perpetrator without face-to-face contact with
victims, such as the special fraud and cybercrimes continuing to produce high levels of
damage in recent years, are constantly changing. It’s also possible to repeat offenses in
a way that makes it difficult for traces of the crime to remain and increases the risk of
spreading damage.
Moreover, it is necessary to take measures against crimes such as stalking, domestic
violence, and child abuse that frequently occur in family and other private relationships,
considering that the nature of such crime creates a tendency to suppress them.
In addition, new lifestyle approaches established to prevent infection, the impact of
the spread of infection on the economy, and other changes in the social situation
associated with the spread of COVID-19 will continue to affect the crime situation.
Considering these criminal trends and social conditions, the police should not only
promote accurate investigations of incidents that occur, but also foster close
cooperation by sharing information on the occurrence of harm and criminal tactics with
relevant organizations and businesses and implement measures against criminal
tools. It is also necessary for the police to implement thorough measures such as
effectively raising public awareness to prevent damage before it occurs, including by
promptly warning people and quickly responding to consultations while keeping in mind
the possibility that damage may be concealed.
Moreover, in order to continue effective and efficient measures against crime in a
constantly changing modern society, the police must continue to accurately grasp
changes in social conditions from multiple indicators and improve analysis of the crime
situation, and to develop and use effective measures tailored to the subject and based
on such analysis.
Reference 6 For example, in the survey described above, more than 60% responded that they spent
less time on weekdays “Going out to restaurants, shopping, entertainment facilities, etc.” and
that they spent more time “At home”. Also, more than 30% responded that they did “Make
more use of the internet to buy items and settle payments”, and “Opportunities to use cash
decreased, while the use of cashless services increased”. This illustrates a situation in which
many were actually aware of self-restraints in order to prevent COVID-19 infection.

285.4
99.6
91.5
81.7
74.9
61.4
34 33 31 29 28
0
50
100
150
200
250
300
(units of 10,000 cases)
(Year)
No. of known cases (units of 10,000)
No. of cases cleared (units of 10,000)
Graph 1 No. of Penal Code Offenses Known to the Police
The number of known cases of penal code offenses in 2020 was 614,231, which was even lower than in
2019, the lowest in the post-war period. The number of cases cleared for penal code offenses
was 279,185, which was lower than in 2019.
Final values
1

22.4
10.39.5
8.67.8
7.26.5
5.94.9
0
5
10
15
20
25(Cases)
(Year)
Graph 2 No. of Penal Code Offenses Known to the Police per Thousand Population
The number of known penal code offenses per thousand population in 2020 was 4.9, falling further below
2019 (5.9 cases), the lowest in the post-war period.
* The population is the total population as of October 1 each yearin accordance with the population estimate of the Ministry ofInternal Affairs and Communications.
2
Final values

0
50
100
150
200
250
300
(units of 10,000 cases)
(Year)
No. of known cases excluding street crimes and
invasion crimes (units of 10,000)
No. of invasion crimes cases known (units of
10,000)
No. of street crimes cases known (units of
10,000)
The rate of decrease in the number of known cases of street crimes and invasion crimes since 2002, when the number of penal code offenses known to the police reached its highest since the end of World War II, was 87.3%. (The rate of decrease since 2002 for cases excluding the number of known cases of these crimes was 57.6%.) The number of known cases of street crimes was 199,268 in 2020, down 27.0% from 272,956 in 2019. The number of known cases of invasion crimes was 55,515, down 21.9% from 71,122 in 2019.
84.937.5
163.1
40.47.1
27.3
35.95.6
19.9
3
Final values Graph 3 No. of known cases of street crimes and invasion crimes
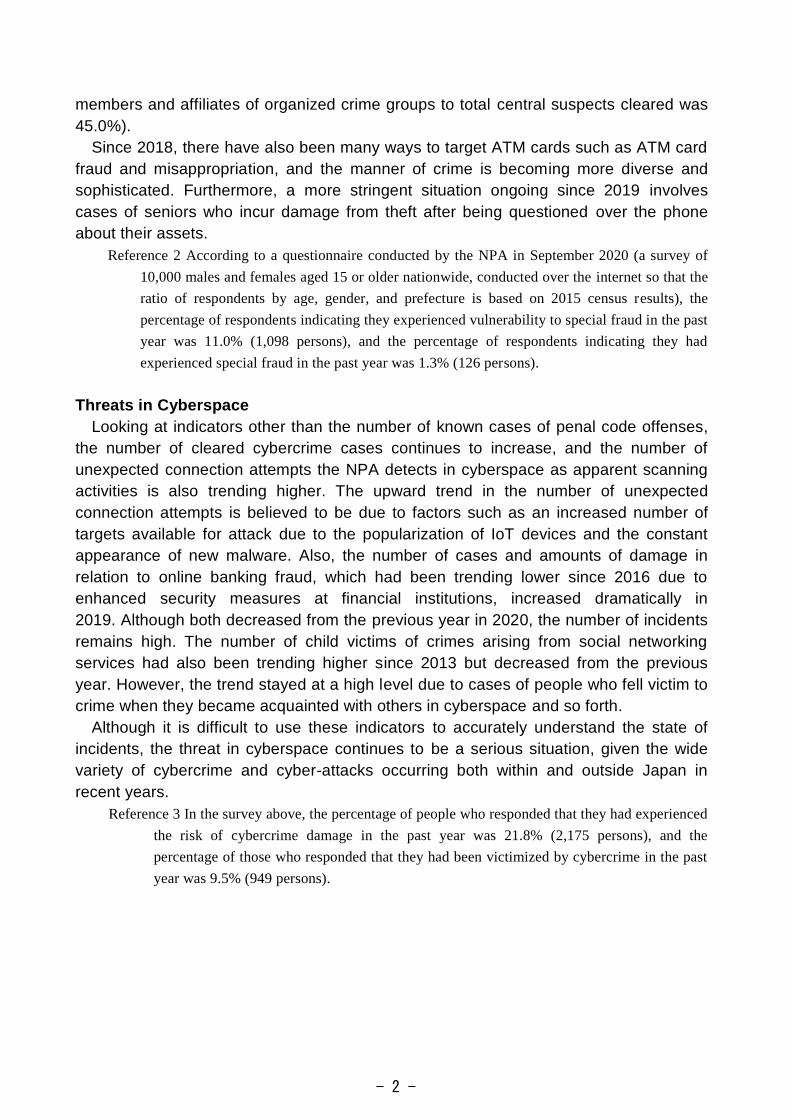
Graph 4 No. of known cases of street crime (by month)Final
values
Looking at the number of known cases of street crimes by month in 2020, the decline in and after April was particularly largecompared with the same period of the previous year.
Year-to-yearcomparison
2019 -9.5% -6.9% -13.8% -14.1% -12.5% -14.2% -11.4% -16.1% 0.2% -17.1% -14.4% -4.3%
2020 -8.4% -10.3% -5.8% -31.9% -43.2% -27.9% -38.5% -30.6% -32.9% -28.5% -23.8% -30.6%
4
January February March April May June July August September October November December
2018 22,272 19,812 23,604 25,698 28,439 26,169 29,191 29,459 25,937 29,998 25,622 22,174
2019 20,156 18,444 20,344 22,062 24,872 22,456 25,867 24,724 25,994 24,867 21,941 21,229
2020 18,472 16,538 19,154 15,035 14,118 16,198 15,914 17,160 17,435 17,782 16,730 14,732
0
5,000
10,000
15,000
20,000
25,000
30,000
35,000
(Cases)2018 2019 2020
Graph 5 No. of known cases of special fraud
The number of known cases of special fraud in 2020 was down 19.6% from the previous year to 13,550.
This figure is 2.0 times that of 2010, which was the lowest since statistics began to be collected in 2004,
and remains at a high level.
Final values
5
6,888 7,216
8,693
11,998
13,392 13,824
14,154
18,212 17,844
16,851
13,550
0
2,000
4,000
6,000
8,000
10,000
12,000
14,000
16,000
18,000
20,000
2010 2011 2012 2013 2014 2015 2016 2017 2018 2019 2020
(Cases)
(Year)

Graph 6 No. of cybercrime cases clearedFinal
values
The number of cybercrime cases cleared began to increase in 2012. It reached 9,875 in 2020,
up 3.7% from the previous year, and has increased 18.6% in the past five years since 2016.
6
6,933
5,741
7,334
8,113 7,905 8,096 8,324
9,014 9,0409,519
9,875
0
2,000
4,000
6,000
8,000
10,000
12,000
2010 2011 2012 2013 2014 2015 2016 2017 2018 2019 2020
(Cases)
Year

Graph 7 No. of unexpected connection attempts detected at the sensors as apparent scanning activities in cyberspace
The number of unexpected connection attempts detected at the sensors as apparent scanning activities in
cyberspace is trending higher since 2013. In 2020, the number of suspicious connection attempts detected at
the sensors per IP address per day is 6,506.4, an increase of 55.2% over the previous year.
Final values
310.1491.6
729.3
1,692.01,893.0
2,752.8
4,192.0
6,506.4
0
1,000
2,000
3,000
4,000
5,000
6,000
7,000
2013 2014 2015 2016 2017 2018 2019 2020(Year)
7
(Count / day/ IP address)

With regard to unexpected connection attempts detected at the sensors as apparent scanning activities in cyberspace, the
amount of increase is remarkable for ports used for IoT devices, etc. (numbered 1024 and above) compared to ports widely
used for sending and receiving emails or accessing websites, etc. (numbered 1023 and below). The number of suspicious
connection attempts to the ports numbered 1024 and above per sensor per day in 2020 was 4,931.1, which has increased
8.1 times the number in the past five years since 2016.
Final values
119.7 239.1 356.3
1,075.5 1,054.9 1,034.01,325.9
1,527.7
180.5 242.1 362.3
606.4826.9
1,702.8
2,844.8
4,931.1
0
1,000
2,000
3,000
4,000
5,000
6,000
2013 2014 2015 2016 2017 2018 2019 2020(Year)
~1023 1024~
8
(Count / day/ IP address)
Graph 8 No. of unexpected connection attempts detected at the sensors as apparent scanning activities in cyberspace (by destination port)

Graph 9 Online banking fraud
The number of cases of online banking fraud increased to 1,872 in 2019, an increase of 5.8 times the
previous year, with the amount of damages increased from about 5.5 times from the previous year to
about 2,521 million yen. In 2020, damages amounted to about 1,133 million yen, a decrease of about
55.1% from the previous year, but incidents numbered 1,734, remaining at a high level in spite of a
decrease of 7.4% from the previous year.
Final values
9
1,406
2,910 3,073
1,687
1,081
461
2,521
1,133
1,315
1,876
1,495
1,291
425
322
1,872
1,734
0
200
400
600
800
1,000
1,200
1,400
1,600
1,800
2,000
0
500
1,000
1,500
2,000
2,500
3,000
3,500
2013 2014 2015 2016 2017 2018 2019 2020
(Cases)(Million yen)
(Year)
被害額(百万円)
発生件数(件)
Amount of damage (Million yen)
No. of cases

Graph 10 No. of child victims of crimes arising from social networking services
Although the number of child victims arising from social networking services was 1,819 in 2020, a decrease
by 12.6% from the previous year, the number trended higher starting in 2013, and has increased by 4.8% in
the past five years since 2016.
Final values
* The term "child" means a person under 18 years of age. The same applies hereafter.
10
1,239
1,085 1,076
1,293
1,421
1,652 1,736
1,813 1,811
2,082
1,819
0
500
1,000
1,500
2,000
2,500
2010 2011 2012 2013 2014 2015 2016 2017 2018 2019 2020
(Persons)
(Year)
Graph 11 No. of consultations on stalking
Although the number of consultations on stalking decreased by 3.5% over the previous year, it has
remained at a high level, exceeding 20,000 cases since 2013.
Final values
16,176 14,618
19,920 21,089
22,823 21,968
22,737 23,079
21,556 20,912
20,189
0
5,000
10,000
15,000
20,000
25,000
2010 2011 2012 2013 2014 2015 2016 2017 2018 2019 2020
(Cases)
(Year)
11

Graph 12 No. of stalking cases cleared
The number of cases cleared for violation of the Anti-Stalking Act was 985 in 2020, a 14.0%
increase over the previous year and has increased 28.1% in the past five years since 2016. The number of
cases of penal code offenses and other law offenses was 1,518 in 2020, which increased 1.8% over the
previous year and 73.1% over 2010 and has remained at a high level.
Final values
877 786
1,504 1,574
1,917 1,872 1,919
1,699 1,594
1,491 1,518
229 205
351402
613677
769
926870 864
985
0
500
1,000
1,500
2,000
2,500
2010 2011 2012 2013 2014 2015 2016 2017 2018 2019 2020
(Cases)
(Year)
Penal code offenses and other law offenses
Violations of the Anti-Stalking Act
12

Graph 13 No. of consultations on spousal violence
The number of consultations on spousal violence cases has increased consistently since 2010 to become
82,643 in 2020, up 0.5% from the previous year, and has increased 18.2% in the past five years since 2016.
Final values
13
33,852 34,329
43,950
49,533
59,07263,141
69,90872,455
77,482
82,207 82,643
0
10,000
20,000
30,000
40,000
50,000
60,000
70,000
80,000
90,000
2010 2011 2012 2013 2014 2015 2016 2017 2018 2019 2020
(Cases)
(Year)
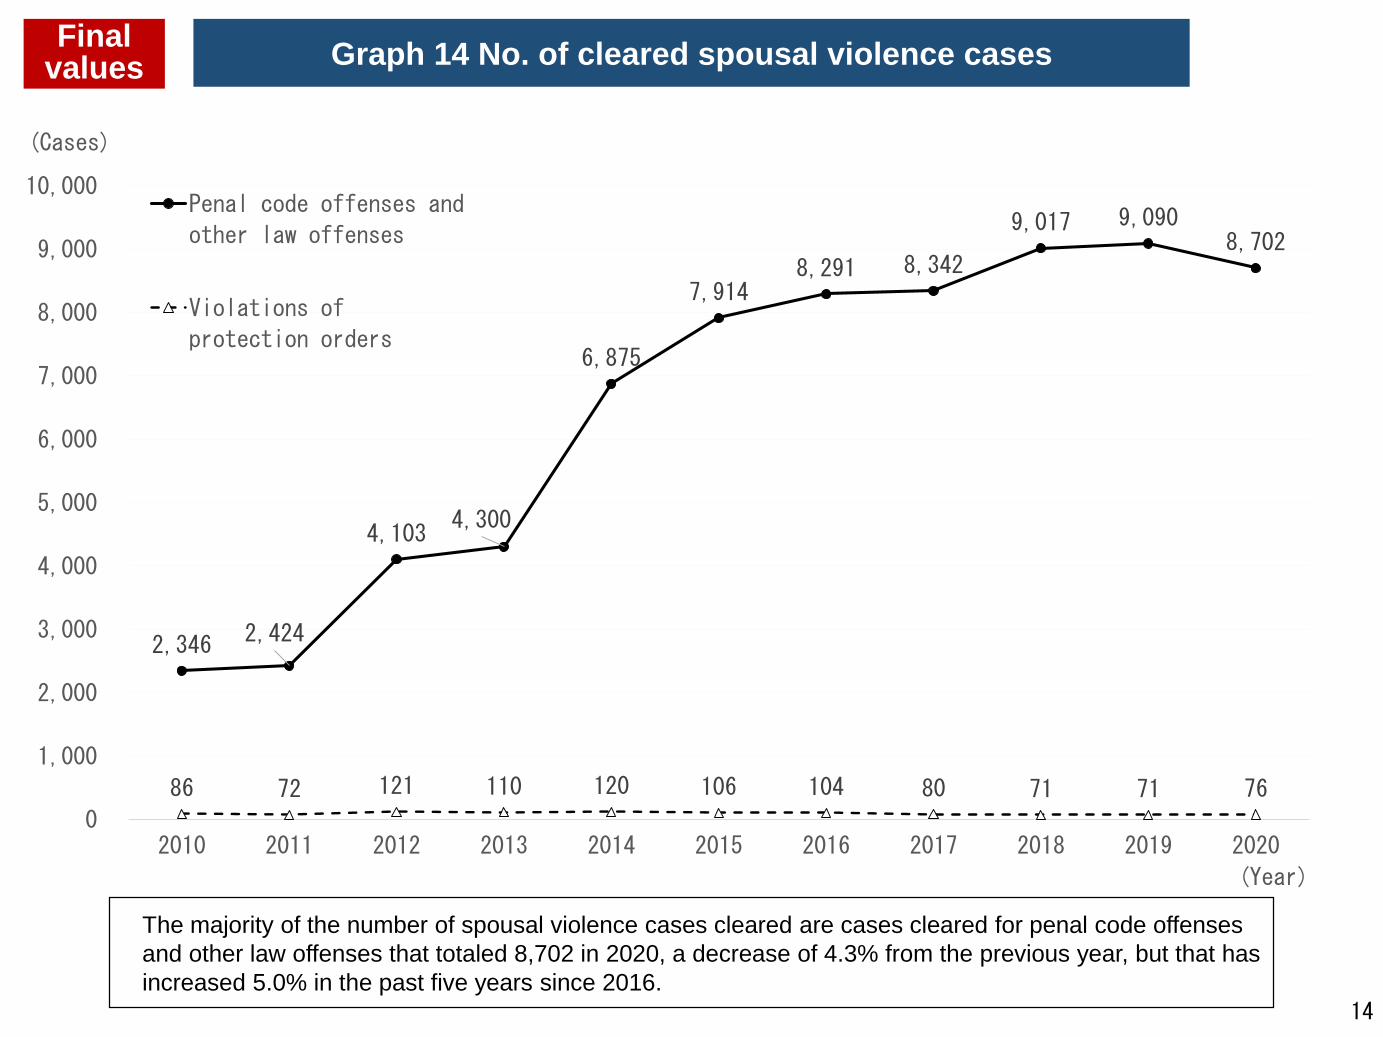
Graph 14 No. of cleared spousal violence cases
The majority of the number of spousal violence cases cleared are cases cleared for penal code offenses
and other law offenses that totaled 8,702 in 2020, a decrease of 4.3% from the previous year, but that has
increased 5.0% in the past five years since 2016.
Final values
14
2,346 2,424
4,103 4,300
6,875
7,914 8,291 8,342
9,017 9,090 8,702
86 72 121 110 120 106 104 80 71 71 76
0
1,000
2,000
3,000
4,000
5,000
6,000
7,000
8,000
9,000
10,000
2010 2011 2012 2013 2014 2015 2016 2017 2018 2019 2020
(Cases)
(Year)
Penal code offenses and
other law offenses
Violations of
protection orders

9,038 11,53616,387
21,603
28,923
37,020
54,227
65,431
80,252
98,222
106,991
0
20,000
40,000
60,000
80,000
100,000
120,000
2010 2011 2012 2013 2014 2015 2016 2017 2018 2019 2020
(Persons)
Physical abuse Sexual abuse
Neglect Emotional abuse
Graph 15 No. of children notified to child guidance centers by the police in child abuse cases
The number of children notified to child guidance centers for child abuse cases has consistently increased
since 2010, reaching 106,991 in 2020, an increase of 8.9% over the previous year. The statistic has
increased by 2.0 times in the past five years since 2016.
Final values
70,7218,958
26418,279
78,3858,859
29519,452
15
(Year)

387 421521
514
740
822
1,0811,138
1,380
1,972
2,133
0
500
1,000
1,500
2,000
2,500
2010 2011 2012 2013 2014 2015 2016 2017 2018 2019 2020
(Cases)
(Year)
Physical abuse Sexual abuse
Neglect Emotional abuse
Graph 16 No. of child abuse cases cleared
The number of child abuse cases cleared trends towards increase, with 2,133 cases in 2020, an
increase of 8.2% over the previous year. The statistic has increased by 2.0 times in the past five years since
2016.
Final values
5035
2461,641
4632
2991,756
16

Questionnaire Results
0% 10% 20% 30% 40% 50% 60% 70% 80% 90% 100%
1. “It’s me” fraud and other such fraud
2. Cybercrime
3. Stalking
4. Domestic violence
5. Theft and larceny
6. Assault and injury
7. Sex crimes
8. Murder and robbery
Level of concern about suffering damage from crime
Feel no anxiety Do not feel much anxiety Feel somewhat uneasy Am concerned I don't know
17

Questionnaire Results
0% 10% 20% 30% 40% 50% 60% 70% 80% 90% 100%
Do you think that Japan's security is improving
(becoming safer and more secure)?
It’s improving It’s somewhat improving
It’s not really improving It’s not improving
I don't know
18

Questionnaire Results
0% 10% 20% 30% 40% 50% 60% 70% 80% 90% 100%
Home
Means of transportation such as railway and bus
Work and school destinations
Restaurants, shopping facilities, recreational
facilities, and other destinations
How much more or less time per day (Monday-Friday) did you spend in each
location during the spread of COVID-19 compared to before the outbreak?
Substantially increased (50% or more) More (20% or more but less than 50%)
Slightly more (5% or more but less than 20%) There was almost no change (less than 5%)
Slightly less (5% or more but less than 20%) Less (20% or more but less than 50%)
Much less (50% or more)
19

Questionnaire Results
12.5
19.5
13.3
33.2
38.0
48.1
40.4
65.1
72.9
0.0 10.0 20.0 30.0 40.0 50.0 60.0 70.0 80.0 90.0 100.0
Became interested in investments and side businesses
My income decreased
Started to see a lot of public relations campaigns that warned of fraudand the like
Opportunities to use cash decreased and to use cash services increased
Use of the internet to buy and settle payments increased
Spent more time accessing the internet from home
Spent more time in the same space as my family members
Went out for shorter periods of time (stayed home for longer periods)
There were fewer opportunities to meet and have contact with people
Activities that you believe changed in your life due to the spread of COVID-19(Multiple responses)
%
20