referee analytics: bias in major college football officiating
TRANSCRIPT

Referee Analytics: Bias in Major College Football Officiating
Rhett Brymer & Tim R. Holcomb Ryan M. Rodenberg Miami University Florida State University Oxford, Ohio, USA 45056 Tallahassee, Florida, USA 32306
[email protected] [email protected] [email protected]
Abstract
Conferences entrust college football referees to impartially officiate games. However, a growing body of research documents officiating biases in sports. We focus on bias among major college football referees. Following a natural experiment approach, we contrast in-conference games with a quasi-control group consisting of games involving teams from different conferences. Specifically, we find a significant relationship between the betting line, a proxy for relative team strengths within each contest, and penalties among ACC and former Big East officials that suggests bias towards the underdog team within in-conference games. Additionally, we find home field bias in the ACC and Big XII and bias of game pace in the Big XII and former Big East. We also do a preliminary examination of the biases’ roots. Some biases we pinpoint are, counterintuitively, revenue-inhibiting for certain conferences. Our results show the potential impact on-field referees have on games and the underlying revenue streams for the conferences. They also highlight oft-discussed, but rarely researched, officiating biases at the intersection of game integrity and the commercial goals of the competing programs and the conferences they represent. To lessen such friction, we advocate for centralization of the management and oversight of college football referees. 1 Introduction For decades, college football fans have speculated about favoritism in college football officiating. Much of the speculation has centered on biases of conference officiating: college football is the only major National Collegiate Athletic Association (NCAA) sport in which conferences have primary managerial responsibility for officials. Yet, despite the cacophony of campus rumors, booster clamoring, and message board fodder about officiating bias, there has been virtually no empirical examination of the existence of conference-driven biases among referees. The financial stakes in college football have never been higher. Conferences are driving unprecedented revenue with multi-billion-dollar television contracts and a new playoff system, making conference realignment and membership in the “Power Five,” with its newly acquired autonomy [1], a critical component of revenue for individual collegiate athletic programs [2]. Because of these forces, conference affiliation remains a strategic priority among universities and the collegiate athletic programs they represent. For instance, former Texas A&M President R. Bowen Loftin noted that A&M’s move to the Southeastern Conference (SEC) in 2012 was a “hundred-year decision”, underlining the long term significance of the move for the entire univeristy [3]. If there is variation in officiating between conferences, as many suspect, a university’s conference affiliation is likely to influence the outcomes of games. This, in turn, directly impacts revenues for member institutions. Since greater success on the field drives ticket sales, booster donations, and merchandise sales [4], differential officiating treatment between conferences can lend (dis)advantages to particular teams. Additionally, member-institutions typically share and often equally split conference revenues. Conference members, in aggregate, gain more revenue if a few elite teams from that conference are among the nation’s top teams [5]. Playing in the Bowl Championship Series (BCS) bowls (now the New Year’s Six bowls), gaining a berth to the newly formed playoff, and winning a national championship; each increase the conference’s overall direct revenue by tens of millions of dollars. They also are likely important to other revenue sources, such as television contracts and preferred bowl invitations over the longer term. Exclusions from these top national games represent opportunity costs for member-institutions of conferences without a presence in these contests, as well as a loss of status and leverage for conference leaders (i.e., the conference commissioners and leaders of the member institutions). For instance, former Big East commissioner Mike Tranghese noted the ultimate demise of the Big East was due to constituents not “understand[ing] how big and important football was,” coupled with the lack of nationally competitive football teams [6]. With so much riding on the collective success of conference members, and with the unique circumstances of conference-managed
2015 Research Paper Competition Presented by:

officiating crews, officiating may be a key component in the success of certain conferences and, perhaps, for particular teams within those conferences. This issue has been prominent in the last few months with Iowa State University athletic director Jamie Pollard accusing Big XII officials of bias against the teams less likely to compete nationally [7] and former National Football League (NFL) referee Mike Pereira accusing the SEC of nefarious game-rigging for its top performing teams [8]. We quantitatively determine whether officiating bias exists at the conference level and whether team/institutional factors might drive bias among teams within each of the major conferences. College football provides us with a natural experiment, as conference referees always officiate in-conference games but are of varied affiliations for out-of-conference games. Comparing how referees differentially officiate teams enables us to identify evidence of bias. Conference referees who call significantly more (or less) penalties for in-conference games (while holding game- and team-effects constant) compared to the referent out-of-conference games demonstrates biased treatment. We highlight such instances. Using game data for teams in the six BCS automatically qualifying conferences (ACC, Big East, Big Ten, Big XII, PAC, SEC) from 2005-2012, we find clear evidence of officiating bias, most notably in the ACC and former Big East and, to a lesser degree, in the Big Ten and Big XII. Interestingly, evidence of bias varies between conferences. For instance, we found evidence that ACC officiating favors underdog teams, home teams, high prestige football programs, and long-time founding members of the conference. We found no evidence of this type or level of officiating bias in other conferences. We believe these findings help substantiate claims of bias from around the nation and provide a compelling case for considering centralized governance of officiating in college football to alleviate concerns surrounding gambling and game integrity. 2 Conferences and Officiating Business alliances, such as major college conferences, provide an assortment of potential benefits to its member organizations. Increasingly, college football athletic conferences are strategic business alliances that offer lucrative television contracts, branding, revenue distribution, and post-season positioning to their members. For instance, the SEC won seven of the eight national championships during our sample timeframe (2005-2012), prompting one of the longest and most lucrative contracts in television history via the launch of its own cable network, and securing the highest guaranteed bowl revenue of any major conference [9]. High stakes for athletics (particularly football and men’s basketball) within universities have resulted in numerous NCAA violations: university personnel have acted unethically to protect the competitive success of their teams, from University of North Carolina’s widespread academic fraud benefiting athletes [10], to University of Miami’s laundry list of impermissible benefits [11], to Ohio State University’s cover-up of athlete compensation [12]. Conference stakes are even higher than that of individual universities, making the potential for unethical behavior, such as conference referee favoritism towards particular teams, a reasonable possibility. College football referees, after all, are hired, evaluated, reprimanded, compensated, and terminated by their conferences. College football is unique among major U.S. sports because conferences govern how games are officiated, calling into greater question the oversight of in-house referees. Indeed, several studies suggest that unethical behavior is more likely with workers if their unethical actions further the goals of their organization [13, 14]. Recently, Business Week’s Bryan Gruley observed about conference referees, “But however pure their motives, however hard they work to keep bias out of their flag-tossing, these people are human…they know what the stakes are and where their bread is buttered” [15]. A recent example of this situation involved teams in the top six of the College Football Playoff ranking going into the final regular-season weekend of games the first weekend of December, 2014. In each case, conference referees presided over an in-conference game involving a team that could make the playoff if it won versus a team with little (or no) chance of making the playoff. Each of these conferences stood to potentially lose $6M if the higher ranked team did not win that game, providing a possible incentive to make favorable calls to the potential playoff team, thus furthering the(ir) conference’s overall success [16, 17]. There were no upsets that weekend for those six teams, and every conference had at least one team competing for a playoff spot. In-conference games are governed and officiated by internal conference employees. Out-of-conference games could be officiated by conference officials from either of the two competitors’ conference or, in the case of bowl games, or third-party conference referees. While not entirely a control condition, these out-of-conference games provide a reference point for comparing officiating differences, both between conferences and within each conference. These multiple ways of comparing conference officiating across college football allow for rich investigations and inquiry into potential biases and favoritism. Figure 1 shows how referees penalize in-conference games over the sample period.
2015 Research Paper Competition Presented by:

Like their peers in other sports, college football referees work in a heavily monitored environment where they make near-instantaneous decisions in vast numbers that people transparently observe. The resulting textured data lends itself to analytical tests of potential bias among referees, umpires, and judges in highly competitive and commercialized sports. Such bias may be volitional or “unintentional and outside of the discriminator’s awareness” [18]. Our multi-pronged analysis, with its focus on college football referees, is novel. However, a large number of studies outside the college football context test for a variety of biases among sports’ on-field rule-enforcers. In football, research found that NFL referees called 20% more penalties for offensive holding after the league experimented with the positioning of the referees on the field [19]. After an investigation found that an NBA referee was involved in a 2007 gambling scandal [20, 21], basketball-specific studies have analyzed bias on the basis of personal animosity [22, 23], height [24], age [25], play-off manipulation [26], fairness [27], home court advantage [28], race [29], and so-called make-up calls [30, 31]. Analytical studies of bias among referees, officials, umpires, and judges have also included ice hockey [32], baseball [33, 34], boxing [35], gymnastics [36], ice skating [37], and soccer [38, 39, 40]. Our inquiry adds to the literature by studying college football referees and pinpointing a number of previously unreported biases presumably derived by conference-specific influences. 3 Methods Our methods include multi-level linear modeling (using XTMIXED in Stata), appropriate to handle nested, multilevel data. We first model game-level data to understand specific variables key in predicting the number of penalty yards for a focal team. In this model, we estimate program effects (i.e. football team effects) as second-level intercepts to account for the nested nature of multiple games played by teams. We then model second-level intercepts that represent team-level effects across the conferences to understand what drives biases within conferences using simple regression. All reported results below reflect multivariate modeling, i.e., modeling all variables simultaneously per level analyzed. We describe modeling techniques in more detail in Appendix A. Across each of the two levels of analysis (game-level and team-level), we compare in-conference coefficient estimates to their out-of-conference equivalents. The first-stage dependent variable is penalty yards per game (number of penalties per game yielded roughly equivalent results). Penalty yards are one of the few recorded, observable variables for referee involvement across games. Because it is difficult to distinguish between subjective infractions (e.g. holding and pass interference) and objective rule violations (e.g. delay of game, too many players on the field), we contend that our dependent variable of penalty yards is a conservative test of bias at the crew-level. Since subjective calls tend to result in more yards per penalty than do objective calls, penalty yards is a more accurate measurement of referee discretion. This represents a conservative test of officiating bias because referees can show favoritism in a number of other ways, including ball spots, possession calls, time clock (mis)management, etc. Further, the models do not take into account the timeliness of calls or the uncertainty of the game outcomes (i.e., the closeness of the games) when officials called the penalties. We use game data from 2005 to 2012 (n = 6598) that we accumulated from College Football Statistics (cfbstats.com). At the game level, our independent/control variables include the betting line as a proxy for relative team strengths; a home-team dummy variable to account for home field advantage effects; total plays, a proxy measure for the style of play
2015 Research Paper Competition Presented by:

for the team and the length of the game; opponent penalty yards to account for zeal of officials and the intensity of the game; and year dummy variables to account for any changes in the rules. At the team-level analysis, we include all-time prestige of a school’s football program by a formative factor score that reflects total program wins, conference championships, bowl game appearances, and national championships; all-time prestige of a school’s men’s basketball program, as a proxy of more broad athletic department prestige, by a formative factor score reflecting total program wins, regular season conference championships, conference tournament championships, NCAA tournament berths, and national championships; number of years in conference to distinguish between the founding members of a conference and those that have been subsequently added; and the standardized academic reputation score of the institution from U.S. News and World Reports Best Colleges issue for each year. As status of various types drives implicit biases in favor of particular organizations [41], we hypothesize that football and basketball prestige, academic reputation, and longevity within the conference correlate with biases in officiating across teams and potentially differing between conferences. 4 Results Model 1 describes game-level variables and the effect of these variables on penalty yards per game for each focal team. Evidence of bias is indicated by a discrepancy between in-conference and out-of-conference coefficient estimates, particularly where there is a significant effect in-conference but no (or opposite) effect when the same teams play out-of-conference. We outline in bold these discrepancies for certain cells that suggest in-conference officiating bias. See also Appendix B.
Model 1: Total penalty yards per game as dependent variable, 2005-2012, all teams in BCS conferences
Conference In
Conference Game?
Betting Line
Home Team
Dummy
Total Plays
Opponent Pen. Yds. n χ2
p-value
All BCS Yes -0.119** -3.84*** 0.131*** 0.093*** 4239 .0000 No ns ns 0.166*** 0.148*** 2359 .0000
ACC Yes -0.307*** -6.27** 0.137* ns 784 .0000 No ns ns 0.336*** ns 433 .0003
Big Ten Yes ns ns 0.142* ns 724 .0205 No 0.206* ns 0.074† 0.182*** 411 .0004
Big East Yes -0.270* ns 0.204* 0.098* 434 .0000 No ns ns ns 0.188*** 355 .0002
Big XII Yes ns -4.36* 0.149* 0.079* 742 .0000 No ns ns ns 0.226*** 400 .0001
PAC Yes -0.152* ns ns ns 753 .0002 No -0.234* -5.81† ns ns 315 .0868
SEC Yes ns -3.63* 0.159* ns 802 .0421 No ns -6.28* -0.166* 0.099† 445 .0522
Coefficient estimates listed for middle four columns. Negative betting lines reflect a favored focal team. Each observation is a team-game. Team-level effects were controlled for using Stata’s xtmixed modeling for all 66 BCS teams. *** p<0.001, ** p<0.01, * p<0.05, † p<0.10, ns=non-significant (p>0.10) Contrary to profit-maximizing expectations of bias, none of the biases evident in the conferences in our study promoted favored teams. The ACC, and to a lesser extent the former Big East, actually show evidence of the opposite bias: more favored teams are penalized to a greater degree (see Figure 2). A three touchdown favorite could expect 6.45 and 5.68 marginal increase of penalty yards in the ACC and Big East, respectively, when they played in-conference games but no change in penalty yards when playing out-of-conference as a favorite. This discrepancy points to a bias against the top teams in the leagues. Such a finding would likely lead to more parity in those leagues, as the greater number of penalty yards could occasionally result in losses for the leagues’ stronger teams against their weaker teams. Interestingly, the Big Ten demonstrates equal treatment for teams competing in in-conference games, but Big Ten teams are penalized significantly less when they play out-of-conference games as favorites.
2015 Research Paper Competition Presented by:
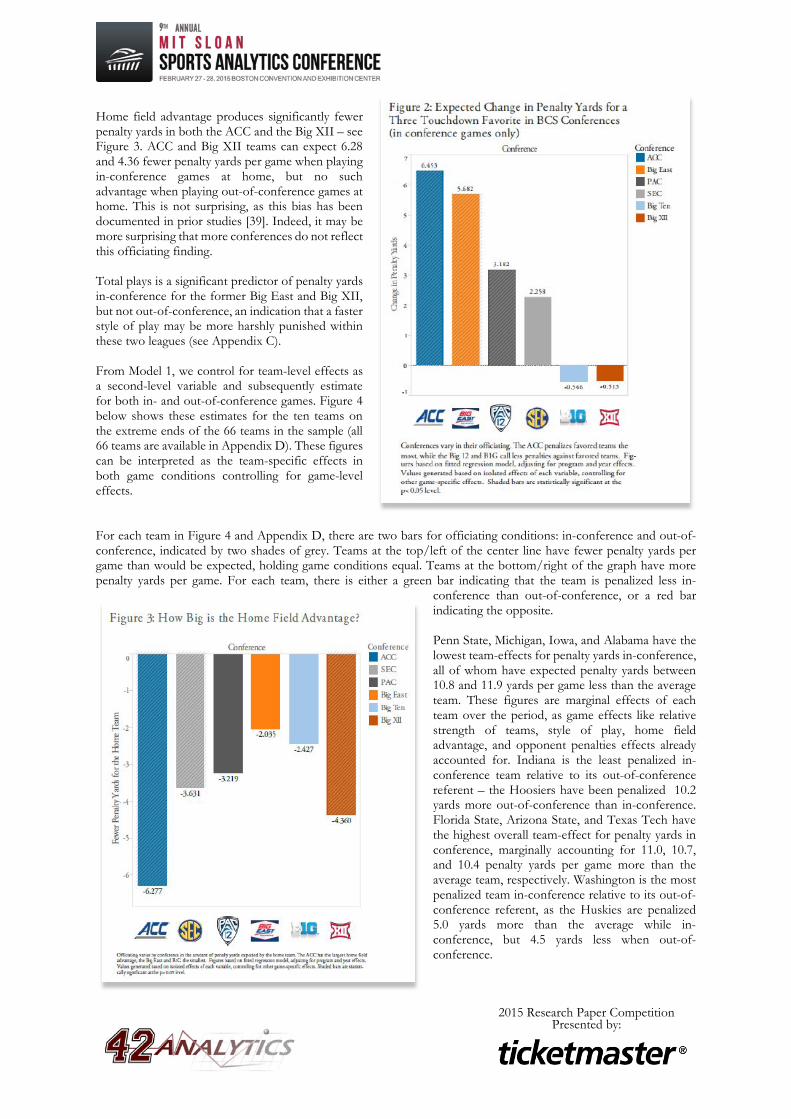
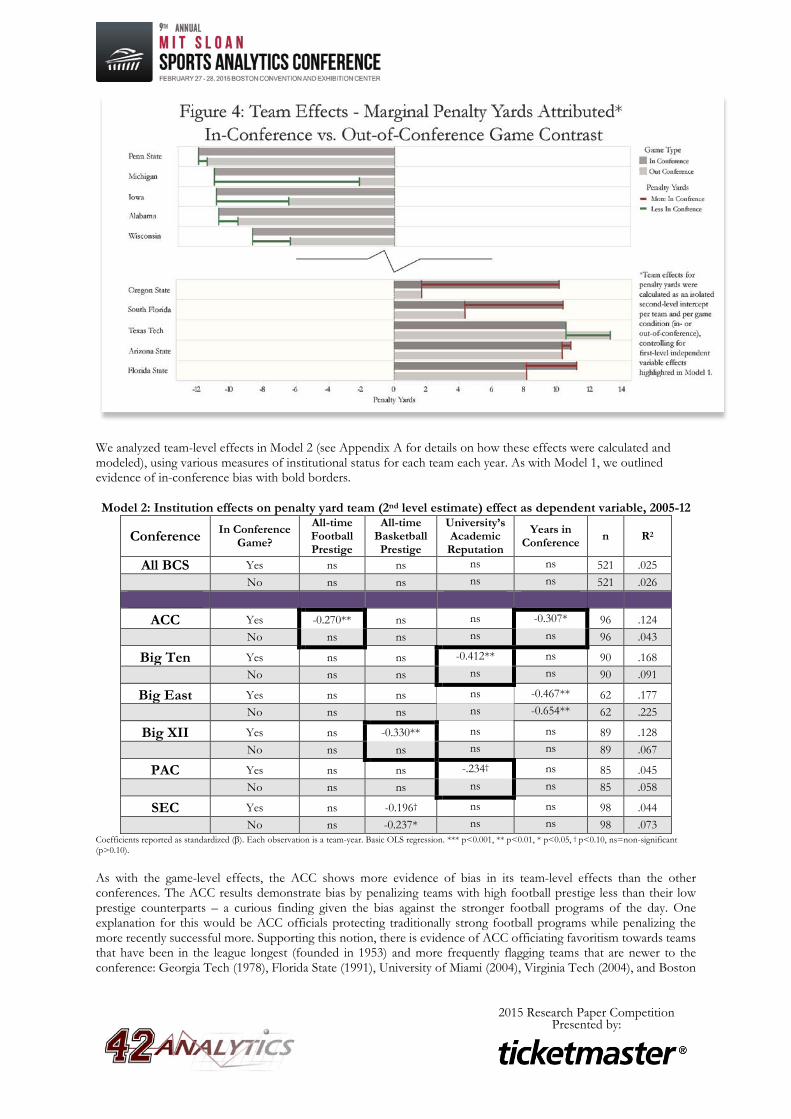
Home field advantage produces significantly fewer penalty yards in both the ACC and the Big XII – see Figure 3. ACC and Big XII teams can expect 6.28 and 4.36 fewer penalty yards per game when playing in-conference games at home, but no such advantage when playing out-of-conference games at home. This is not surprising, as this bias has been documented in prior studies [39]. Indeed, it may be more surprising that more conferences do not reflect this officiating finding. Total plays is a significant predictor of penalty yards in-conference for the former Big East and Big XII, but not out-of-conference, an indication that a faster style of play may be more harshly punished within these two leagues (see Appendix C). From Model 1, we control for team-level effects as a second-level variable and subsequently estimate for both in- and out-of-conference games. Figure 4 below shows these estimates for the ten teams on the extreme ends of the 66 teams in the sample (all 66 teams are available in Appendix D). These figures can be interpreted as the team-specific effects in both game conditions controlling for game-level effects. For each team in Figure 4 and Appendix D, there are two bars for officiating conditions: in-conference and out-of-conference, indicated by two shades of grey. Teams at the top/left of the center line have fewer penalty yards per game than would be expected, holding game conditions equal. Teams at the bottom/right of the graph have more penalty yards per game. For each team, there is either a green bar indicating that the team is penalized less in-
conference than out-of-conference, or a red bar indicating the opposite. Penn State, Michigan, Iowa, and Alabama have the lowest team-effects for penalty yards in-conference, all of whom have expected penalty yards between 10.8 and 11.9 yards per game less than the average team. These figures are marginal effects of each team over the period, as game effects like relative strength of teams, style of play, home field advantage, and opponent penalties effects already accounted for. Indiana is the least penalized in-conference team relative to its out-of-conference referent – the Hoosiers have been penalized 10.2 yards more out-of-conference than in-conference. Florida State, Arizona State, and Texas Tech have the highest overall team-effect for penalty yards in conference, marginally accounting for 11.0, 10.7, and 10.4 penalty yards per game more than the average team, respectively. Washington is the most penalized team in-conference relative to its out-of-conference referent, as the Huskies are penalized 5.0 yards more than the average while in-conference, but 4.5 yards less when out-of-conference.
2015 Research Paper Competition Presented by:
We analyzed team-level effects in Model 2 (see Appendix A for details on how these effects were calculated and modeled), using various measures of institutional status for each team each year. As with Model 1, we outlined evidence of in-conference bias with bold borders. Model 2: Institution effects on penalty yard team (2nd level estimate) effect as dependent variable, 2005-12
Conference In Conference Game?
All-time Football Prestige
All-time Basketball Prestige
University’s Academic
Reputation
Years in Conference n R2
All BCS Yes ns ns ns ns 521 .025 No ns ns ns ns 521 .026
ACC Yes -0.270** ns ns -0.307* 96 .124 No ns ns ns ns 96 .043
Big Ten Yes ns ns -0.412** ns 90 .168 No ns ns ns ns 90 .091
Big East Yes ns ns ns -0.467** 62 .177 No ns ns ns -0.654** 62 .225
Big XII Yes ns -0.330** ns ns 89 .128 No ns ns ns ns 89 .067
PAC Yes ns ns -.234† ns 85 .045 No ns ns ns ns 85 .058
SEC Yes ns -0.196† ns ns 98 .044 No ns -0.237* ns ns 98 .073
Coefficients reported as standardized (β). Each observation is a team-year. Basic OLS regression. *** p<0.001, ** p<0.01, * p<0.05, † p<0.10, ns=non-significant (p>0.10). As with the game-level effects, the ACC shows more evidence of bias in its team-level effects than the other conferences. The ACC results demonstrate bias by penalizing teams with high football prestige less than their low prestige counterparts – a curious finding given the bias against the stronger football programs of the day. One explanation for this would be ACC officials protecting traditionally strong football programs while penalizing the more recently successful more. Supporting this notion, there is evidence of ACC officiating favoritism towards teams that have been in the league longest (founded in 1953) and more frequently flagging teams that are newer to the conference: Georgia Tech (1978), Florida State (1991), University of Miami (2004), Virginia Tech (2004), and Boston
2015 Research Paper Competition Presented by:

College (2005). Current ACC members Pittsburgh, Syracuse, and Louisville were all added after the sample period ended in 2012. Evidence of bias in other leagues includes the Big XII showing officiating favoritism in football to teams with high basketball prestige. The Big Ten and PAC show officiating bias in favor of teams with higher academic reputations. Given that these measures of status have little (or nothing) to do with the football programs, it is enticing to ponder the reasons that referees may have biases based on these peripheral institutional qualities in the various conferences. 5 Discussion This study demonstrates distinct differences between the officiating in the major college football conferences. We expected to find evidence of profit-maximizing bias – a higher frequency of penalty yards for weaker teams than for stronger teams. In our sample we do not find evidence of top team promotion through any biased bestowing of penalty yards to those teams or their competitors. Our results, however, do suggest that officiating bias (or lack thereof) may drive competitiveness of the leagues. The SEC, devoid of any officiating bias evidence in this analysis, won seven of eight national championships in this period. While our findings do not rule out the possibility of SEC (and PAC, Big XII, and Big Ten) officials preferentially treating its top teams in other ways (ball spots, possession calls, time clock management, etc.) to promote their leagues, we do not find bias in the number of penalty yards doled out to their members playing in conference games. By contrast, the ACC and the Big East, with the most evidence of biases in this analysis, both had very unremarkable football years during this period – neither conference competed for a BCS national championship, and in only one instance was there a non-requisite invitation for teams these leagues for the other high paying BCS bowls. Our findings support the inference that referees from the ACC in particular officiate in-conference games differently than referees in other major conference alliances. Table 1 shows an analysis of the Noll-Scully measure of parity [42], with the ACC showing the greatest parity in five of the eight sample years. Particularly given the betting line bias of the ACC in-conference, there is reason to believe that the ACC handicaps its stronger teams despite the financial incentives to do the opposite. Why does the ACC engage in this behavior and have these biases among officials? One possible explanation is the reputation of the ACC as a basketball conference with its four founding member North Carolina institutions (Duke, UNC, Wake Forest, and NC State) yielding the most political influence; internal ACC power may be threatened by non-founding schools with strong football that drive much of its revenue. The demise of the Big East, a league better known for their powerful basketball programs more so than their football programs, serves as a cautionary tale.
Table 1: Noll-Scully Measure of Comparative Parity within each Conference 2005 2006 2007 2008 2009 2010 2011 2012 8-year average
ACC 0.3693 0.4174 0.3989 0.2303 0.3794 0.4352 0.3794 0.3892 0.3749
Big XII 0.4082 0.3589 0.4264 0.4846 0.4352 0.3892 0.5092 0.4894 0.4376
Big East 0.5714 0.5151 0.3499 0.5345 0.5533 0.4041 0.4518 0.4518 0.4790
Big Ten 0.4862 0.5394 0.4156 0.4472 0.4369 0.4573 0.4264 0.4924 0.4627
PAC 0.5375 0.3881 0.3752 0.5556 0.4894 0.5188 0.4224 0.4606 0.4668
SEC 0.4606 0.4523 0.3693 0.4264 0.4523 0.4352 0.5505 0.4972 0.4555
Noll-Scully is a relative measure. Lower scores indicate greater league parity; conference with greatest parity highlighted. Other biases found among the conferences, such as one reflecting home field advantage, likely drive consumer demand by keeping ticket-buying home fans satisfied and general fan interest high. In contrast, certain biases, specifically those against favored teams, likely have the opposite effect, inhibiting revenue-generating opportunities. For corrective action in light of various biases, research indicates that simple awareness can reduce or eliminate subconscious biases among sports officials [43]. More pointedly, the dispositive role of football officials in wagering outcomes has placed increased emphasis on referee analytics in a profitable betting strategy [44]. It remains an open question whether the decision-makers in sports, including executives, coaches, players, and gamblers, can use referee analytics as a competitive advantage for their leagues [45]. At the very least, analytics such as this study can demonstrate where there may be issues with the integrity of the game and the fairness with which competing teams are treated. 2015 Research Paper Competition Presented by:

6 Conclusion The analysis highlights several biases in a workplace where workers face considerable scrutiny in connection with their duty to be impartial evaluators of others. Such biases, whether volitional or subconscious, speak to the increased need in the sports industry for transparent referee monitoring systems as a tool to preserve the credibility of the underlying sporting competition against match-fixing and gambling manipulation. To the extent these systems are currently in place, they appear to be ineffectual. Instead, conferences manage their own officials in idiosyncratic ways, potentially breeding the types of biases uncovered in this study. With the considerable variance of officiating across conferences and the increased incentives of bias in the face of ever-increasing stakes, our findings also suggest that a movement towards a nationally governed officiating body should be considered to replace the current conference-governed circumstance [15]. While centralized officiating is not devoid of partiality, one large uneven playing field is likely preferable to many uneven fields. Centralization of officiating, particularly among the Power Five conferences, may be a critical step in solidifying the integrity of the game as the stakes continue to rise for conference success in the landscape of major college football.
2015 Research Paper Competition Presented by:

7 Acknowledgements The authors would like to thank Mark Howard and Brandon Brunner, particularly, for hand collecting so much data and providing other support in the beginning of this study. We are remiss for not including them as authors on the initial proposal to this conference for this work. Support was given in many ways by the Farmer School of Business, Charles Newcomer, Pam Perrewé, Bryan Gruley, Kyle Scheine, Jeremy Simms, Yan Yu, John Futch, Levi Kitchen, Glenn Lebowski, Jeff Harris, Thelma Horn, and Kathleen Veslany. We owe thanks to Kristy Stamper and Macie Farmer for their work to transform data into elegant visualizations. In addition, we would also like to thank Rogers Redding, Mike Hitt, Noel Yetter, Aaron Williams, Paul McCullough, Jackson Beatty, David Hedlund, Josh McGee, Brian Swider, Curtis Wesley, T. Brad Harris, Andy Hinrichs, John Williamson, Neal Ternes, and John Holden for comments and insights as this project has developed. 8 References [1] B. Bennett, “NCAA Board Votes to Allow Autonomy,” ESPN, August 8, 2014. [2] J. Scott-Clayton, “Do Big-Time Sports Mean Big-Time Support for Universities?” The New York Times, January 26, 2012. [3] R.B. Loftin, The 100-Year Decision: Texas A&M and the SEC, Indianapolis, IN: Dog Ear Publishing. [4] V. Luckerson, “How the SEC Became the Richest Conference in College Sports,” Time, January 7, 2013. [5] J. Solomon, “NCAA Audit: Every Football Conference Made Money on 2012-2013 Bowls,” AL.com, December 11, 2013. [6] W.C. Rowen, “The Big East Is Still Paying for a Fumble,” The New York Times, March 4, 2012. [7] D. Wolken, “College Football Officiating Increasingly in Crosshairs,” USA Today, October 9, 2014. [8] M. Pereira, “SEC Has Lost Almost All Credibility and Integrity in Officiating,” Fox Sports, October 26, 2014. [9] R. Sandomir, “SEC Will Start Network in 2014,” The New York Times, May 2, 2013. [10] S. Ganim and D. Sayers, “UNC Report Finds 18 Years of Academic Fraud to Keep Athletes Playing,” CNN, October 25, 2014. [11] C. Robinson, “Renegade Miami Football Booster Spells Out Illicit Benefits to Players,” Yahoo Sports, August 16, 2011. [12] B. Bender, “Ohio State’s Scandal: A Timeline,” Sporting News, July 8, 2011. [13] E. Umphress, et al., “Unethical Behavior in the Name of the Company: The Moderating Effect of Organizational Identification and Positive Reciprocity Beliefs on Unethical Pro-Organizational Behavior.” Journal of Applied Psychology, 95(4), 769-780, 2010. [14] E. Umphress and J. Bingham, “When Employees do Bad Things for Good Reasons: Examining Unethical Pro-Organizational Behaviors.” Organization Science, 22(3), 621-640, 2011. [15] B. Gruley, “Better Referees: Why College Football Needs to Herd its own Zebras,” Business Week, October 24, 2014. [16] G. Schroeder, “Power Five's College Football Playoff Revenues Will Double What BCS Paid,” USA Today, July 14, 2014. [17] J. Price, et al., “Sub-Perfect Game: Profitable Biases of NBA Referees,” Journal of Economics and Management Strategy, 21(1), 271-300, 2012. [18] M. Bertrand, et al., “Implicit Discrimination,” American Economic Review, 95, 94-98, 2005. [19] C. Kitchens, “Identifying Changes in the Spatial Distribution of Crime: Evidence from a Referee Experiment in the National Football League,” Economic Inquiry, 52(1), 259-268, 2014. [20] S. Griffin, Gaming the Game: The Story Behind the NBA Betting Scandal and the Gambler Who Made It Happen. Fort Lee, NJ: Barricade Books, 2011. [21] L. Pedowitz, “Report to the Board of Governors of the National Basketball Association,” NBA.com, 2008. [22] W. Winston, Mathletics: How Gamblers, Managers, and Sports Enthusiasts Use Mathematics in Baseball, Basketball, and Football. Princeton, NJ: Princeton University Press, 2009. [23] R. Rodenberg, “Perception ≠ Reality: Analyzing Specific Allegations of NBA Referee Bias,” Journal of Quantitative Analysis of Sports, 7(2), Article 8, 2011. [24] P. Gift and R. Rodenberg, “Napoleon Complex: Height Bias among National Basketball Association Referees,” Journal of Sports Economics, 15(5) 541-558, 2014. [25] C. Herring, “Why the Refs Hate the Knicks,” Wall Street Journal, Nov. 26, 2012. [26] T. Zimmer and T. Kuethe, “Testing for Bias and Manipulation in the NBA Playoffs,” Journal of Quantitative Analysis of Sports, 5(3), Article 4, 2009. [27] K. Anderson and D. Pierce, “Officiating Bias: The Effect of Foul Differential on Foul Calls in NCAA Basketball,” Journal of Sports Sciences, 27(7), 687-694, 2009.
2015 Research Paper Competition Presented by:

[28] T. Moskowitz and L. Wertheim, Scorecasting: The Hidden Influences Behind How Sports are Played and Games are Won. New York, NY: Crown, 2011. [29] J. Price and J. Wolfers, “Racial Discrimination among NBA Referees,” Quarterly Journal of Economics, 125(4), 1859-1887, 2010. [30] P. Gift, “Sequential Judgment Effects in NBA Officiating: An Analysis of Referee Bias in Make-Up Call Situations,” Economic Inquiry, forthcoming, 2015. [31] Z. Lowe, “In Search of the Elusive Makeup Call,” Grantland, October 24, 2014. [32] M. Lopez and K. Snyder, “Biased Impartiality among National Hockey League Referees,” International Journal of Sport Finance, 8(3), 208-223, 2014. [33] B. Mills, “Social Pressure at the Plate: Inequality Aversion, Status, and Mere Exposure,” Managerial and Decision Economics, 35(6), 387-403, 2014. [34] C. Parsons, et al., “Strike Three: Discrimination, Incentives, and Evaluation,” American Economic Review, 101(4), 1410-1435, 2011. [35] N. Balmer, et al., “Do Judges Enhance Home Advantage in European Championship Boxing?” Journal of Sports Sciences, 23(4), 409-416, 2005. [36] H. Morgan and K. Rotthoff, “The Harder the Task, the Higher the Score: Findings of a Difficulty Bias,” Economic Inquiry, 52(3), 1014-1026, 2014. [37] E. Zitzewitz, “Nationalism in Winter Sports Judging and its Lessons for Organizational Decision Making,” Journal of Economics and Management Strategy, 15, 67-99, 2006. [38] E. Gallo, et al., “Punishing the Foreigner: Implicit Discrimination in the Premier League Based on Oppositional Identity,” Oxford Bulletin of Economics and Statistics, 75(1), 136-156, 2013. [39] M. Sutter and M. Kocher, “Favoritism of Agents: The Case of Referees’ Home Bias,” Journal of Economic Psychology, 25, 461-469, 2004. [40] T. Dohmen, “The Influence of Social Forces: Evidence from the Behavior of Football Referees,” Economic Inquiry, 46(3), 411-424, 2008. [41] M. Washington and E. Zajac, “Status Evolution and Competition: Theory and Evidence,” Academy of Management Journal, 2005. [42] R. Fort and J. Maxcy, “Competition Balance in Sports Leagues: An Introduction,” Journal of Sports Economics, 4(2), 154-160, 2003. [43] D. Pope, et al., “Awareness Reduces Racial Bias,” working paper, 2014. [44] D. Bartoo, “The Stats on CFB Refs Against the Lines,” CFBMatrix.com, last visited December 5, 2014. [45] P. Keating, “Game Changer,” ESPN The Magazine, June 9, 2014.
2015 Research Paper Competition Presented by:

Appendix A – Notes on Methods We estimated Model 1 using Stata’s XTMIXED function. The 66 teams in our sample were second-level variables, modeled as random intercept terms. This team-level approach allowed a consistently modeled one intercept for every team, and all models to converge. The Model 1 estimation syntax is below:
by Game_Type: xtmixed FPY Line Home Plays OPY 2006-2012 | Team where Game_Type divides the sample into in- and out-of-conference games, FPY is the focal teams total penalty yards in a given game (dependent variable), Line is the betting line for the focal team (negative number indicates the team is favored), Home is a home team dummy variable with 1 indicating a home game for the focal team, Plays is the total number of plays in the football game, OPY is the opponent team total penalty yards that game, 2006-2012 are year dummy variables (2005 is the referent), and Team is the second-level grouping variable for the 66 teams in our sample. We used this model for each set of conference data individually (ACC, Big XII, Big East, Big Ten, PAC, and SEC). We used the number of penalties called as the dependent variable for a robustness check of Model 1. Though small differences existed, likely due to the types of penalties more often called on particular teams, the primary findings were substantively similar. To describe the variance in team-level effects over time and by game type, we modeled team-years as random intercepts for both in-conference and out-of-conference games to allow for comparison. Additionally, this allowed us to construct a sample of sufficient size to conduct conference-by-conference models and comparisons. We used team-year random intercepts by conference as the dependent variable for Model 2. Due to non-existent data in the US News and World Reports Best Colleges issue for a number of schools and incomplete data for the Big East status variables, the sample is well representative of the population but not complete. With roughly 81.6% of the population of team-years represented in the 431 current sample size, we do not expect results to differ substantively. The Model 2 estimation syntax is below:
regress PYRI FP BBP AR YrConf, beta where PYRI is the random intercept variable calculated by team-year for both in- and out-of conference games (regressions run separately for contrast), FP is the formative factor score for football prestige, BBP is the formative factor score for basketball prestige, AR is the standardized academic reputation score for the university, and YrConf is the number of years the team had been in the focal conference. The beta command standardizes the variables so one can easily compare the effect sizes across the independent variables.
2015 Research Paper Competition Presented by:

Appendix B – Overall In-Conference vs. Out-of-Conference Differences
2015 Research Paper Competition Presented by:

Appendix C – Total Plays: Proxy for Game Pace and Offensive Style
2015 Research Paper Competition Presented by:

Appendix D – Marginal Team-Effects on Penalty Yards per Game
2015 Research Paper Competition Presented by:
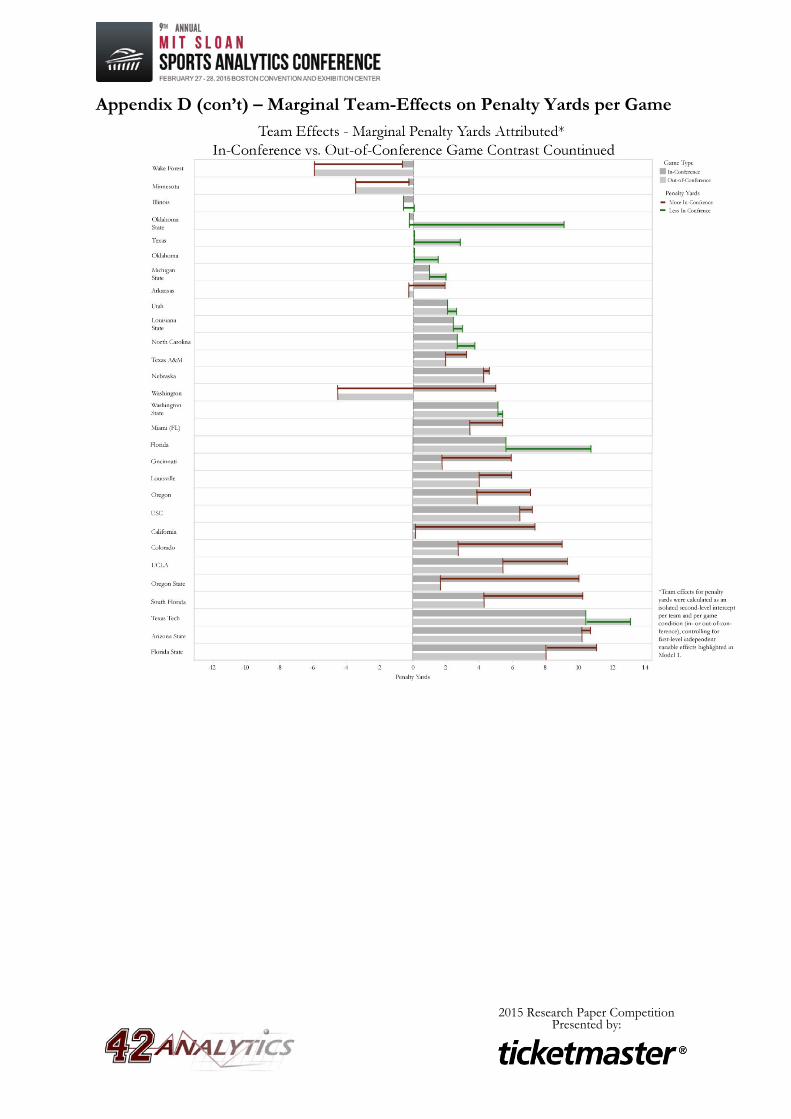
Appendix D (con’t) – Marginal Team-Effects on Penalty Yards per Game
2015 Research Paper Competition Presented by: