reed resources ltd for personal use only - asx with our joint venture partners kingsrose mining ltd...
TRANSCRIPT

Reed Resources Ltd
ANNUAL REPORT
2009For
per
sona
l use
onl
y

DirectorsDavid Reed (Executive Chairman) Christopher Reed (Managing Director) Peter Collins (Non-executive Director) Ian Junk (Non-executive Director) Steven Cole (Non-executive Director)
Company SecretariesJason Carone Christopher Reed
Registered Office97 Outram St West Perth 6005
Contact DetailsTelephone (+618) 9322 1182 Facsimile (+618) 9321 0556 www.reedresources.com - [email protected]
Stock Exchannge ListingReed Resources Ltd are listed on the Australian Stock Exchange (Home Branch - Perth) ASX Code: RDR
ACN & ABN NumbersACN 099 116 631 ABN 89 099 116 631
AuditorsDeloitte Touche Tohmatsu Level 14, Woodside Plaza 240 St. Georges Terrace Perth WA 6000
BankersNational Bank Australia Bank of Queensland
SolicitorsAllens Arthur Robinson Level 37, QV1 250 St Georges Terrace Perth WA 6000
Hunt and Humphry Hyatt Centre Level 2 20 Terrace Road East Perth WA 6004
Freehills 250 St Georges Terrace Perth WA 6000
CORPORATE DIRECTORY
AccountantsLawrence Business Management 1133 Albany Hwy Bentley WA
Flavel Tierney 8/295 Rokeby Road Subiaco WA
Share RegistryComputershare Investor Services Pty Ltd Level 2, Reserve Bank Building 42 St. Georges Terrace Perth WA 6000
Annual General MeetingThursday, 26 November 2009 at 3:00pm Western Standard Time First floor, 104 Marine Parade, Cottesloe Western Australia
For
per
sona
l use
onl
y
i
FIN
ANC
IAL
REP
OR
T
Corporate governance statement 19
1128293132333435387273
Directors’ report
Review of operations
Auditors’ independence declaration
Directors’ declaration
Independent audit report
Income statement
Balance sheet
Statement of changes in equity
Cash flow statement
Notes to the financial statements
Additional stock exchange information
Substantial holders
Chairman’s letter i
For
per
sona
l use
onl
y

CHAIRMAN’S LETTER
Dear Shareholders,
Despite the difficult Global Financial Crisis in the last twelve months, I believe that our company is in a much stronger position financially and with respect to the value of our resource assets.
Vanadium
We completed the definitive feasibility study at a cost of over $20m, which is no small achievement for a company of our size. We carried out over 55,000 meters of drilling and now have the highest grade vanadium deposit in Australia, containing 65.2 million tonnes at 0.82% vandium pentoxide.
Gold
Although our Gold JV has not achieved projected production rates, the operation has been profitable for us. We are looking at options for increased production having recently purchased the Nimbus Treatment Plant near Kalgoorlie and completed an agreement with our Joint Venture partners Kingsrose Mining Ltd to retain the total mining assets from 1 June 2010.
Nickel
We have an ongoing Joint Venture with Western Areas at Mt Finnerty and we recently finalised an option over some very prospective ground adjoining our Mt Finnerty leases with an unlisted company Barranco. This 60% earn-in will be funded and explored by Reed within the next few months.
Iron Ore
Our 20% interest in the JV with Cliffs is maturing, and we expect some resource estimates prior to the end of the calendar year. A number of new targets are being explored on the tenements and Reed is funding its 20% interest.
Base Metals
We have recently finalized an option with Anglo American for state of the art electromagnetic exploration over the Bell Rock Range. Nickel and copper prospect of 471 square kilometres. Anglo are currently flying the area with the proprietary “Spectrum” EM system in their DC-3 modified aircraft.
Lithium
This is probably the most exciting project we have, after entering an option purchase agreement with a local prospector over the high-grade Mt Marion Lithium deposits, near Kambalda, WA.
The previous work was undertaken by Western Mining in the early 1960s and mid 1970s which included extensive drilling and evaluation of the deposit. We have scheduled a drilling program to commence in December, targeting four to five million tonnes of spodumene at a grade of 1.5% to 2%. Different options to operate and fast-track the production of lithium concentrate are under consideration. The deposit is adjacent to power and a haul road which could connect to our Nimbus Plant site. Our engineer, Bill Crossley, who completed an excellent effort on our vanadium project has been appointed to manage the lithium feasibility study.
In summary, notwithstanding market conditions and the volatility of our share price, I believe it has been a rewarding year in advancing our prospects. We are now capitalized at a time of writing at approximately $80m, have liquid funds of $15 million and no debt.
i
For
per
sona
l use
onl
y

iii
With all our commodities, a case can be made for increased demand and subsequent prices in the next few years. Gold, which has been one of my pet interests for over 40 years, has never looked stronger. With the increased physical demand and an alternate storage of wealth against a falling US Dollar, falling world production and limited exploration success, I feel we will be surprised by the upward potential in prices.
Vanadium is a major component in strengthening steel and nickel is also associated with stainless steel and we expect to see increased demand from China and the rest of the world strengthening the markets for these commodities.
Lithium is the mineral of the moment, being a major component in storage batteries for electric cars and this should ensure solid demand and increased prices as electric cars replace the conventional fossil fuel powered vehicles.
In closing, I would like to take the opportunity to thank my Board for their continued dedicated work. I would also like to thank our managing director Christopher Reed, company secretary Jason Carone and all our staff and contractors for an excellent effort in a very busy period in our company’s development.
Yours sincerely,
David Reed
EXECUTIVE CHAIRMAN
23 October 2009
ii
For
per
sona
l use
onl
y

CORPORATE GOVERNANCE STATEMENT
The Board of directors of Reed Resources Ltd (the “Company”) is responsible for the corporate governance of the Company, for setting corporate direction, defining policies and monitoring the business of the Company, to ensure it is conducted appropriately and in the best interests of the Company and its shareholders.
This corporate governance statement outlines the key principles and practices of the Company which together with adopted policies and company charter define the Company’s system of governance.
The Company is committed to implementing sound standards of corporate governance. In determining what those standards should involve, the Company has had regard to the ASX Corporate Governance Council’s Corporate Governance Principles and Recommendations 2nd Edition 2007 (“Recommendations”).
A copy of the Recommendations and the Company’s Corporate Governance Charter (“Charter”) has been placed on the Company’s website in the corporate governance section www.reedresources.com/corporate.php
PRINCIPLE 1: LAY SOLID FOUNDATIONS FOR MANAGEMENT AND OVERSIGHT
Recommendation 1.1 – Establish and disclose the functions reserved to the board and those delegated to senior executives.
The functions and responsibilities of the Board compared with those delegated to management are reflective of the Recommendations.
The Board is responsible for guiding and monitoring the Company on behalf of shareholders by whom they are elected and to whom they are accountable. The Board’s primary responsibility is to oversee the development of strategies for the Company, setting and reviewing the Company’s strategic objectives and monitoring the performance of the Company against those objectives.
The overall goals of the corporate governance process are to:• deliver corporate and operational performance against objectives set;• drive shareholder value;• assure a prudential and ethical base to the Company’s conduct and activities; and• ensure compliance with the Company’s legal and regulatory obligations.
Consistent with these goals, the Board assumes the following responsibilities:• developing initiatives for profit and asset growth;• reviewing the corporate, commercial and financial performance of the Company on a regular basis;• acting on behalf of, and being accountable to, the Company’s shareholders;• identifying business risks and implementing actions to manage those risks; and• developing and effecting management and corporate systems to assure quality sound corporate performance.
The Board has delegated authority for the operations and administration of the Company to the Chief Executive Officer. He is responsible for overseeing the overall efficient and effective operation of the exploration and mining related activities of the company, and for bringing material and other relevant matters to the attention of the Board in an accurate and timely manner.
Recommendation 1.2 – Disclose the process for evaluating the performance of senior executives.
The Nominations and Remuneration Committee is charged in the terms of the Charter with periodic review of the job description and performance of the CEO according to agreed performance parameters.
A combined performance and remuneration review for 2008/09 concerning the CEO took place in August 2009 via the Nominations and Remuneration Committee.
1
For
per
sona
l use
onl
y
2
Other senior executives were the subject of informal evaluations against both individual performance and overall business measures. These evaluations were undertaken by the CEO progressively and periodically, in consultation with the Board.
Outcomes arising from these evaluations included identifying skill improvement needs, re-description of positions of employment, remuneration reviews and in some cases remedial action.
The Charter contains a section formally setting out the Company’s Board and Management Performance Enhancement Policy.
Recommendation 1.3 – Provide the information in the guide to reporting on Recommendations.
The Company is not aware of any departure from Recommendations 1.1 or 1.2. Performance evaluations for senior executives have taken place in the reporting period in accordance with the process disclosed.
PRINCIPLE 2: STRUCTURE THE BOARD TO ADD VALUE
Recommendation 2.1 – A majority of the Board should be independent directors.
The Board respects independence of thought and decision making as critical to effective governance, and is satisfied that its Board composition meets these requirements. However, against the Recommendations technical indicia of “independence” the Company does not strictly comply with this Recommendation.
From 1 July 2008 to 23 July 2008 the Board comprised:• 2 non-executive independent directors (Peter Collins and Ian Junk);• 2 executive directors (David John Reed and Chris Reed).
From 24 July 2008 Steven Cole (non-executive independent) joined the Board resulting in 3 non-executive independent directors and 2 executive directors.
Recommendation 2.2 – The chairperson should be an independent director.
The chairperson (David John Reed) is an executive director and substantial shareholder of the company and as such does not pass the criteria of independence as outlined in the Recommendations.
Recommendation 2.3 –The roles of chairperson and chief executive officer should not be exercised by the same individual.
The roles of the Chairperson and the Chief Executive Officer were not exercised by the same individual.
Recommendation 2.4 – The Board should establish a nomination committee.
The Board did establish a Nomination and Remuneration Committee.
Recommendation 2.5 – Disclose the process for evaluating the performance of the Board, its committees and individual directors.
The Nominations and Remuneration Committee is charged in the terms of the Charter with Board and Board Committee membership, succession planning and performance evaluation, as well as Board member induction, education and development.
The Company has adopted policies and procedures in the Charter concerning the evaluation and development of its directors, executives and Board committee. Procedures include an induction protocol and a performance management system for the Board and its directors. Each Board committee also formally reports to the Board annually on its operations in the context of its remit.
The Company’s Board and Management Performance Enhancement Policy also is incorporated in the Charter.
For
per
sona
l use
onl
y

Recommendation 2.6 – Provide the information indicated in Guide to reporting on Principle 2.
Contained in the Directors’ Report section of this Annual Report are details of:
• the skills, experience and expertise relevant to the position of director held by each Director in office at the date of this Annual Report;
• the term of office held by each Director in office at the date of this Annual Report.
The terms of office, and their status as executive/non-executive/independent, for each director for the year ending 30 June 2009 were as follows (with all directors noted as continuing as at 30 June 2009 still being in office at the date of this annual report):
David John Reed Executive Chairman - 1 July 2008 to 30 June 2009 (cont)
Steven Cole non-executive/independent – 24 July 2008 to 30 June 2009 (cont)
Peter Lionel Fleury Collins non-executive/independent - 1 July 2008 to 30 June 2009 (cont)
Ian Courtney Junk non-executive/independent – 1 July 2008 to 30 June 2009 (cont)
Christopher John Reed executive - 1 July 2008 to 30 June 2009 (cont)
The Company has accepted the definition of “independence” in the Recommendations in the above analysis.
The Company’s Corporate Governance Charter empowers a director to take independent professional advice at the expense of the Company.
Members of the Board’s Nominations and Remuneration Committee, and their attendance at meetings of that committee, were as follows (a total of 2 meetings were held):
Director Number of Mtgs Eligible to Attend Number of Mtgs Attended
Steven Cole (Chairman) 2 2
Peter Lionel Fleury Collins 2 2
Ian Courtney Junk 2 2
In accordance with the process for Board, Board Committee and director evaluation as described in the Charter such an evaluation has been considered and tentatively scheduled for fourth quarter 2009 rather than in the relevant period itself.
The Company departed from the Recommendations in that:
(a) for the period 1 July 2008 to 23 July 2008 only, the Board did not comprise a majority of independent directors;
(b) the chairperson is not an independent director.
In explanation of the reasons for these departures the Company advises:
• it is satisfied with the level of independence of thought and decision making being contributed by its non-executive and executive directors;
• the current size of the Company’s business operations does not warrant an expanded Board merely to satisfy the independence Recommendations;
• through the appointment of Steven Cole, an independent non-executive director with recognised corporate governance skills, as Deputy Chairman, extra governance oversight is brought to bear to Board proceedings notwithstanding the Chairman being executive.
CORPORATE GOVERNANCE STATEMENT CONTINUED
3
For
per
sona
l use
onl
y

4
PRINCIPLE 3: PROMOTE ETHICAL AND RESPONSIBLE DECISION MAKING
Recommendation 3.1: Establish a code of conduct and disclose the code, or a summary as to:
3.1.1 the practices necessary to maintain confidence in the company’s integrity;
3.1.2 the practices necessary to take into account legal obligations and reasonable expectations of stakeholders;
3.1.3 the responsibility and accountability of individuals for reporting and investigating reports of unethical practices.
The Company has established a formal code of conduct in the Charter to guide the Directors, the CEO, the CFO (or equivalent) and other key executives with respect to the practices necessary to maintain confidence in the Company’s integrity, the practices necessary to take into account legal obligations and reasonable expectations of stakeholders, and the responsibility and accountability of individuals for reporting and investigating reports of unethical practices.
Recommendation 3.2 : Establish and disclose the Policy Concerning Trading in Company Securities by directors, officers and employees.
The Company’s policy concerning trading in Company securities by Directors, officers and employees is set out in the Charter which has been placed on the Company’s website.
Recommendation 3.3: Provide the Information Indicated in Guide to Reporting on Principle 3.
The Company is not aware of any departures from Recommendations 3.1, 3.2 or 3.3.
Copies of the Company’s current Board Members Code of Conduct and Group Code of Conduct/Values and the Company’s Share Trading Policy is publicly available on the Company’s website.
PRINCIPLE 4: SAFEGUARD INTEGRITY IN FINANCIAL REPORTING
Recommendation 4.1: The Board should establish an Audit Committee.
The Board established a combined Audit and Risk Management Committee as from 26 September 2008. Prior to then the Board as a whole fulfilled such functions.
Recommendation 4.2: Structure the Audit Committee so that it consists of:
• only non-executive directors• a majority of independent directors• an independent Chairperson, who is not chairperson of the Board;• at least three members.
The Company’s Audit and Risk Management Committee has 3 members all being non-executive directors (Steven Cole, Peter Collins and Ian Junk), all of whom, including the Chairman (Steven Cole), are independent.
Recommendation 4.3: The Audit Committee should have a formal charter.
The Company’s Audit and Risk Management Committee has a formal charter as set out in the Charter.For
per
sona
l use
onl
y

Recommendation 4.4: Provide the information indicated in Guide to reporting on Principle 4.
Members of the Board’s Audit and Risk Management Committee, and their attendance at meetings of that Committee were as follows (a total of 3 meetings were held):
Director Number of Mtgs Eligible to Attend Number of Mtgs Attended
Steven Cole 3 3
Peter Lionel Fleury Collins 3 3
Ian Courtney Junk 3 3
The qualifications of the Directors on the Audit and Risk Management Committee appear in the Directors’ Report section of this Annual Report.
The Company is not aware of any departures from the Recommendations under Principle 4 except that prior to 26 September 2008 the Company did not have a separately constituted audit committee.
In explanation of the reasons for this departure prior to 26 September 2008, the Company advises that the costs to the Company of alternate technically compliant arrangements were not warranted having regard to the then size and scale of business operations of the Company.
The Company’s Audit and Risk Management Committee charter and information on procedures for the selection and appointment of the external auditor, and for the rotation of external audit engagement partners, are all set out in the Charter which is publicly available on the Company’s website.
PRINCIPLE 5: MAKE TIMELY AND BALANCED DISCLOSURE
Recommendation 5.1: Establish written policies designed to ensure compliance with ASX Listing Rule disclosure requirements and to ensure accountability at a senior executive level for that compliance and disclose those policies or a summary of them.
The Company has established written policies and procedures designed to ensure compliance with ASX Listing Rule disclosure requirements and to ensure accountability at senior executive level for the compliance.
Recommendation 5.2: Provide the information indicated in Guide to reporting on Principle 5.
The Company is not aware of any departure from Recommendations 5.1 or 5.2.
The Company’s current written policies and procedures on ASX Listing Rule disclosure requirements are all set out under the heading “Release of Price Sensitive Information Policy” in the Charter which is publicly available on the Company’s website.
PRINCIPLE 6: RESPECT THE RIGHTS OF SHAREHOLDERS
Recommendation 6.1: Design and disclose a communications policy for promoting effective communication with shareholders and encouraging their participation at general meetings.
The Charter contains a section formally setting out the Company’s communications strategy with its stakeholders including the effective use of electronic communications.
Recommendation 6.2: Provide the information indicated in Guide to reporting on Principle 6.
Details of how the Company will communicate with its shareholders publicly is set out under the heading “Communications with Stakeholders” which is publicly available on the Company’s website.
The Company is not aware of any departure from Recommendations 6.1 or 6.2.
CORPORATE GOVERNANCE STATEMENT CONTINUED
5
For
per
sona
l use
onl
y
6
PRINCIPLE 7 : RECOGNISE AND MANAGE RISK
Recommendation 7.1: Companies should establish policies for the oversight and management of material business risks and disclose a summary of those policies.
The Charter includes a formal policy on risk oversight and management. The Board also has established the Audit and Risk Management Committee of the Board.
In addition, the Board has resolved, and the executive is in the process of developing a more robust system for identifying, assessing, monitoring and managing material risk throughout the organisation, including internal compliance and control systems, and procedures based on AS/NZ4360. A recent Board resolution to engage external professional consultants to facilitate and assist in this exercise is expected to assure completion of this project by the end of 2009.
Details of the Company’s policy on these matters is set out under the heading “Risk Management Policy” in the Charter which is publicly available on the Company’s website.
Recommendation 7.2: The Board to require management to design and implement the risk management and internal control system to manage the Company’s material business risks, and report to it on whether those risks are being managed effectively. Board to disclose that management has reported to it as to the effectiveness of the Company’s management of its material business risks.
An Audit and Risk Management Committee has been established as set out in the Charter with preliminary responsibility for establishment and maintaining effective risk management and internal control systems.
The Board, including through the Audit and Risk Management Committee has required management to progress matters and report to it in the terms of this Recommendation.
Further, the Board discloses that management has preliminarily reported to it as to the effectiveness of the Company’s management of its material business risks, although the Board has requested a more comprehensive report from management upon completion of the more robust risk management system currently being developed (as referred to in the response to Recommendation 7.1 above) based on AS/NZ 4360.
Recommendation 7.3: Board to disclose whether it has received assurance from the CEO (or equivalent) and the CFO (or equivalent) that the declaration provided in accordance with S.295A of the Corporations Act is founded on a sound system of risk management and internal control and that the system is operating effectively in all material respects in relation to financial reporting risks.
The Company’s CEO and CFO (or equivalent) provided the Board assurance in compliance with this Recommendation that the declaration provided in accordance with S.295A of the Corporations Act was founded on a sound system of risk management and internal control and that system was operating effectively in all material respects in relation to financial reporting risks.
Recommendation 7.4: Provide the information indicated in Guide to reporting on Principle 7.
The Company is not aware of any departure from Recommendations 7.1, 7.2 or 7.3 although notes it is continuing to develop and refine its risk management and internal control processes and procedures into more robust systems and procedures based on AS/ANZ4360.
A summary of the Company’s policies on risk oversight and management of material business risks is publicly available under the heading “Risk Management Policy” in the Charter on the Company’s website.F
or p
erso
nal u
se o
nly
PRINCIPLE 8: REMUNERATE FAIRLY AND RESPONSIBLY
Recommendation 8.1: The Board should establish a remuneration committee.
The Board has established a combined Nomination and Remuneration Committee. Refer reporting on Recommendation 2.6 above.
The remit and responsibilities of the Nominations and Remuneration Committee in respect of remuneration are set out in the Charter.
Recommendation 8.2: Clearly distinguish the structure of non-executive directors’ remuneration from that of executive directors and senior executives.
The structure of non-executive remuneration is clearly distinguishable from that of executive directors and senior executives.
The Board’s policy for determining the nature and amount of remuneration for Board members and senior executives of the economic entity was as follows:
• Executives were to receive a base salary (based on factors such as skills, experience, value to the Company and length of service), superannuation and, as appropriate, performance incentives, including by way of longer term share options and shorter term cash bonus entitlements (as appropriate). The Nomination and Remuneration Committee (on reference from, and in consultation with, the CEO) reviews executive packages from time to time by reference to the economic entity’s performance, executive performance and comparable information from industry standards.
• The maximum remuneration of non-executive directors is the subject of Shareholder resolution in accordance with the Company’s Constitution, the Corporations Act and the ASX Listing rules, as applicable. The apportionment of non-executive director remuneration within that maximum is made by the Board having regard to the inputs and value to the Company of the respective contributions by each non-executive director. The Board may also award additional remuneration to non-executive directors called upon to perform extra services or make special exertions on behalf of the Company. Some longer term share options were also awarded to non-executive directors in consideration of maintaining relatively modest non-executive director fee structures and expectations of extra demand for non-executive time inputs for the company’s benefit. Details of these are set out in the Remuneration Report within the Directors’ Report.
• Greater details of the remuneration arrangements for Directors, Officers and senior executives are contained in the Remuneration Report comprised in the Directors’ Report forming part of this Annual Report.
Recommendation 8.3: Provide the information indicated in Guide to reporting on Principle 8
Remuneration Committee (names of members and attendance at meetings)
Refer to the response to Recommendation 2.6 above concerning the Company’s Nomination and Remuneration Committee.
Non Executive Director Retirement Benefits
Non-executive directors are entitled to statutory superannuation. There are no other schemes for retirement benefits for non-executive directors.
Departure from Recommendations
Although the Company believes it has complied with Recommendation 8, it notes that the issue of options to the non-executive directors as referred to above is not consistent with the statement in item 2 of Box 8.2 of the Recommendations.
In explanation thereof:• the level of remuneration paid by the Company to its non-executive directors is perceived to be modest,
especially having regard to the additional service and contributions expected to be made by them at this stage of the Company’s evolution;
• the issue of options to the non-executive directors is a “non cash” means by which they can receive some modest recompense for such additional service and contributions.
CORPORATE GOVERNANCE STATEMENT CONTINUED
7
For
per
sona
l use
onl
y

8
Information Publicly Available
The Charter contains a section formally setting out the charter of the Company’s Nominations and Remuneration Committee. Details are publicly available on the Company’s website.
Executive Summary Of Compliance With Recommendations
Recommendation # Compliant Non-Compliant If not, why not?
1 ü - N/A
2 - Partial Refer response to Recommendation 2.6 above.
3 ü - N/A
4 - Partial Refer response to Recommendation 4.4 above.
5 ü - N/A
6 ü - N/A
7 ü -However refer to the qualified statement in the response to Recommendation 7.4 above.
8 ü -However refer to the qualified statement in the response to Recommendation 8.3 above.
For
per
sona
l use
onl
y
The directors of Reed Resources Ltd submit herewith the annual financial report of the company for the financial year ended 30 June 2009. In order to comply with the provisions of the Corporations Act 2001, the directors report as follows:
The names and particulars of the directors of the company during or since the end of the financial year are:
Name Particulars
David John Reed Executive Chairman
FCPA OAM
Term of Office: Appointed 20 December 2001
Current External Directorships: None
Skills, Experience and Expertise: Mr David Reed is a Fellow member of CPA Australia, and graduated in accountancy in 1965. He has 40 years experience in stockbroking including 22 years based in Kalgoorlie. In 1985 he became chairman of stock-broking firm Eyres Reed Ltd in Perth until its sale to CIBC World Markets in 1997. He has extensive public company experience having sat as chairman of several listed exploration companies. He has a long history in the gold mining industry, including chairman of Fund Raising for the Australian Prospectors and Miners Hall of Fame. He is also a Founder and Session Chairman of the Diggers and Dealers Forum in Kalgoorlie, and a past Secretary of the amalgamated Prospectors and Leaseholders Association.
Christopher John Reed Managing Director/Chief Executive Officer/Company Secretary
BComm, GradCertMinEcon, ASA, MAusIMM
Term of Office: Appointed 20 December 2001
Current External Directorships: None
Skills, Experience and Expertise: Mr Chris Reed graduated with a Bachelor of Commerce from the University of Notre Dame. He holds a Graduate Certificate in Mineral Economics from the WA School of Mines, is a Member of the Australasian Institute of Mining and Metallurgy and is an Associate Member of CPA Australia. He has 15 years experience in the mineral exploration and mining industry.
Peter Lionel Fleury Collins Non-executive Director
Term of Office: Appointed 20 December 2001
Company Board Committee Membership: Nomination and Remuneration Committee and Audit and Risk Management Committee
Current External Directorships: None
Skills, Experience and Expertise: Dr Peter Collins graduated with a Bachelor of Science with honours from the University of Tasmania, where he also gained his Doctor of Philosophy. He has 25 years experience as a geologist in Tasmania and Western Australia. He has been an economic geologist and tin-tungsten commodity specialist with the Tasmanian Geological Survey. He has lectured in geology at Curtin University of Technology since 1987 and has been widely active in the investigation of mineral deposits in WA. Dr Collins was responsible for the planning and management of the exploration programme that discovered the Sand George deposit at Comet Vale.
DIRECTORS’ REPORT
9
For
per
sona
l use
onl
y

10
Ian Courtney Junk Non-executive Director
Term of Office: Appointed 1 December 2003
Company Board Committee Membership: Nomination and Remuneration Committee and Audit and Risk Management Committee
Current External Directorships: CBR-TSX, BMC-TSX, Committee Bay Resources, Brilliant Mining Corp
Skills, Experience and Expertise: Mr Ian Junk graduated with a Bachelor of Engineering with honours from the WA School of Mines and holds a First Class Mine Managers Certificate. Ian is a highly respected mining engineer with considerable experience in narrow vein underground mining and project development. Ian and his brother Leigh were chosen as national finalists in the 2003 Ernst & Young – Young Entrepreneur of the Year for their successful implementation of innovative mining methods at the Miitel nickel mine. Ian is a Member of the Australasian Institute of Mining and Metallurgy.
Steven Cole Non-executive Director
Term of Office: Appointed 24 July 2008
Company Board Committee Membership: Nomination and Remuneration Committee and Audit and Risk Management Committee
Current External Directorships: Emerson Stewart Group Limited, Solco Limited, 2 Australian subsidiaries of Sanmina-SCI Systems Holdings Inc (USA), 2 Investment Trusts managing approximately $20M, 2 Government Boards and 2 Professional and Charitable boards.
Skills, Experience and Expertise: Steven has 35 years of professional, corporate and business experience through senior legal consultancy, as well as a range of executive management and non executive appointments. His extensive boardroom and board sub-committee experience includes ASX listed, statutory, and proprietary and NFP organisations covering the industrial, financial, educational, professional services, health and resources sectors.
Further information on the directors is contained in the corporate governance statement on page 1.
For
per
sona
l use
onl
y

PRINCIPAL ACTIVITIES
The consolidated entity’s principal activities during the period consisted of exploration for gold and other minerals, the evaluation of the Barrambie vanadium project and the ongoing gold mining operation at Comet Vale.
REVIEW OF OPERATIONS
The consolidated loss after income tax for the year attributable to members of Reed Resources Ltd was $2,468,834. The company has invested $9,336,052 in capitalised exploration expenditure and development costs in the year ended 30 June 2009.
BARRAMBIE VANADIUM PROJECT
(100% Reed)
During the year the Company completed the Definitive Feasibility Study (“DFS”) to produce 6,300t of vanadium per annum, as ferrovanadium. The study has been the main undertaking of management for the past two years and cost some A$20 million, including 55,000 metres of drilling. The project is both technically feasible and economically viable.
This study indicated that, based on the existing mineralisation, the Barrambie vanadium processing plant and associated infrastructure will target a through put of 3.2 million tonnes per annum of vanadium bearing magnetite mineralisation at a grade of 0.82% V2O5 and produce either approximately 11,200 tonnes of vanadium pentoxide (V2O5) or 7,700 tonnes of ferro vanadium (FeV80) per annum, for a minimum 12 year period.
DIRECTORS’ REPORT CONTINUED
11
For
per
sona
l use
onl
y
12
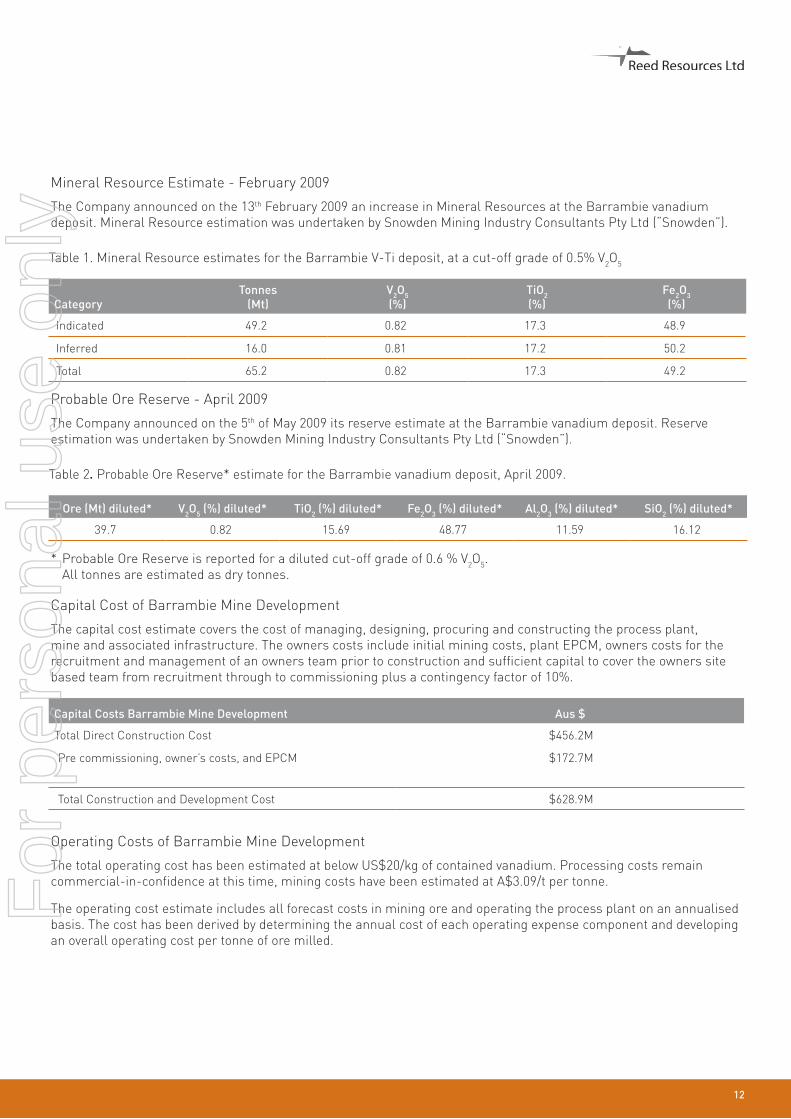
Mineral Resource Estimate - February 2009
The Company announced on the 13th February 2009 an increase in Mineral Resources at the Barrambie vanadium deposit. Mineral Resource estimation was undertaken by Snowden Mining Industry Consultants Pty Ltd (“Snowden”).
Table 1. Mineral Resource estimates for the Barrambie V-Ti deposit, at a cut-off grade of 0.5% V2O5
CategoryTonnes
(Mt)V2O5(%)
TiO2(%)
Fe2O3(%)
Indicated 49.2 0.82 17.3 48.9
Inferred 16.0 0.81 17.2 50.2
Total 65.2 0.82 17.3 49.2
Probable Ore Reserve - April 2009
The Company announced on the 5th of May 2009 its reserve estimate at the Barrambie vanadium deposit. Reserve estimation was undertaken by Snowden Mining Industry Consultants Pty Ltd (“Snowden”).
Table 2. Probable Ore Reserve* estimate for the Barrambie vanadium deposit, April 2009.
Ore (Mt) diluted* V2O5 (%) diluted* TiO2 (%) diluted* Fe2O3 (%) diluted* Al2O3 (%) diluted* SiO2 (%) diluted*
39.7 0.82 15.69 48.77 11.59 16.12
* Probable Ore Reserve is reported for a diluted cut-off grade of 0.6 % V2O5. All tonnes are estimated as dry tonnes.
Capital Cost of Barrambie Mine Development
The capital cost estimate covers the cost of managing, designing, procuring and constructing the process plant, mine and associated infrastructure. The owners costs include initial mining costs, plant EPCM, owners costs for the recruitment and management of an owners team prior to construction and sufficient capital to cover the owners site based team from recruitment through to commissioning plus a contingency factor of 10%.
Capital Costs Barrambie Mine Development Aus $
Total Direct Construction Cost $456.2M
Pre commissioning, owner’s costs, and EPCM $172.7M
Total Construction and Development Cost $628.9M
Operating Costs of Barrambie Mine Development
The total operating cost has been estimated at below US$20/kg of contained vanadium. Processing costs remain commercial-in-confidence at this time, mining costs have been estimated at A$3.09/t per tonne.
The operating cost estimate includes all forecast costs in mining ore and operating the process plant on an annualised basis. The cost has been derived by determining the annual cost of each operating expense component and developing an overall operating cost per tonne of ore milled.
For
per
sona
l use
onl
y

Development Strategy
The Company is currenly progressing with the approvals process, it had been assessed as requiring a Public Environmental Review (PER). Comments by the relevant decision making authorities on the draft PER document have been received and a final version for release to the public is being prepared. Once approved for release, the Company plans to commence a strategic partner selection process for the development of the project. The market price for vanadium has improved from a financial crisis low of US$18/kg to US$34/kg.
The Company expended $5,406,266 on direct costs for exploration and evaluation of the Barrambie Vanadium Project during the year.
DIRECTORS’ REPORT CONTINUED
13
For
per
sona
l use
onl
y
14
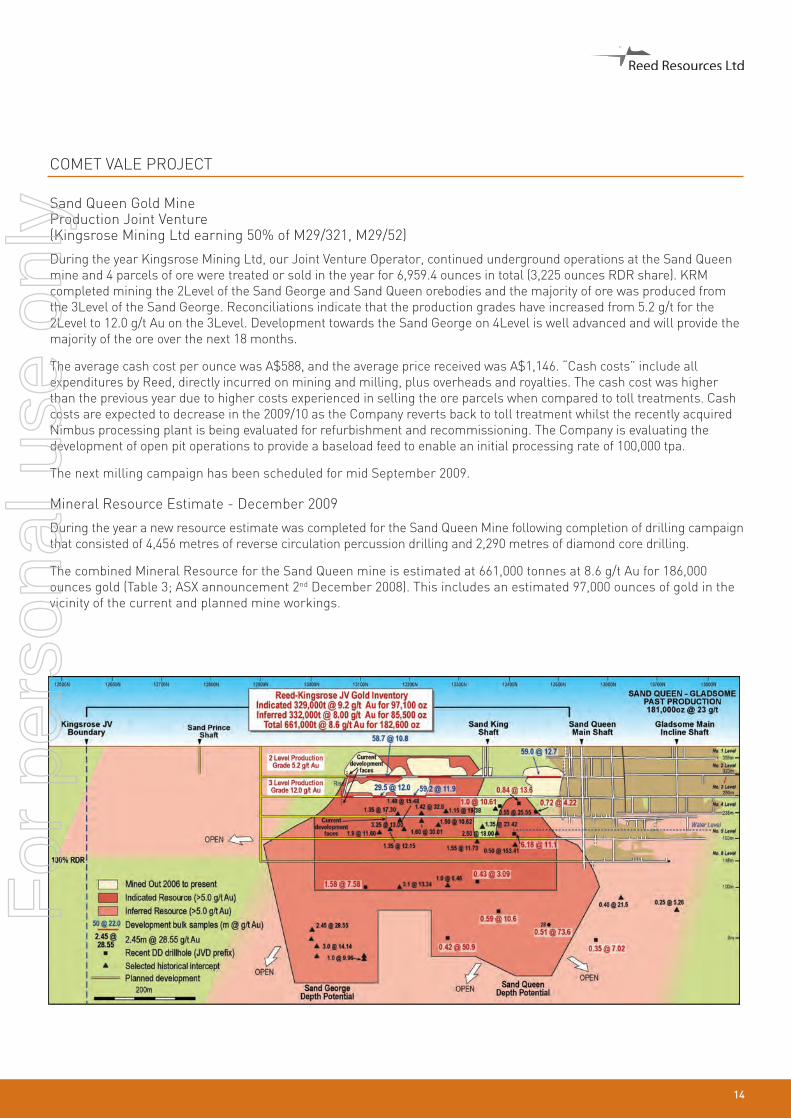
COMET VALE PROJECT
Sand Queen Gold MineProduction Joint Venture (Kingsrose Mining Ltd earning 50% of M29/321, M29/52)
During the year Kingsrose Mining Ltd, our Joint Venture Operator, continued underground operations at the Sand Queen mine and 4 parcels of ore were treated or sold in the year for 6,959.4 ounces in total (3,225 ounces RDR share). KRM completed mining the 2Level of the Sand George and Sand Queen orebodies and the majority of ore was produced from the 3Level of the Sand George. Reconciliations indicate that the production grades have increased from 5.2 g/t for the 2Level to 12.0 g/t Au on the 3Level. Development towards the Sand George on 4Level is well advanced and will provide the majority of the ore over the next 18 months.
The average cash cost per ounce was A$588, and the average price received was A$1,146. “Cash costs” include all expenditures by Reed, directly incurred on mining and milling, plus overheads and royalties. The cash cost was higher than the previous year due to higher costs experienced in selling the ore parcels when compared to toll treatments. Cash costs are expected to decrease in the 2009/10 as the Company reverts back to toll treatment whilst the recently acquired Nimbus processing plant is being evaluated for refurbishment and recommissioning. The Company is evaluating the development of open pit operations to provide a baseload feed to enable an initial processing rate of 100,000 tpa.
The next milling campaign has been scheduled for mid September 2009.
Mineral Resource Estimate - December 2009
During the year a new resource estimate was completed for the Sand Queen Mine following completion of drilling campaign that consisted of 4,456 metres of reverse circulation percussion drilling and 2,290 metres of diamond core drilling.
The combined Mineral Resource for the Sand Queen mine is estimated at 661,000 tonnes at 8.6 g/t Au for 186,000 ounces gold (Table 3; ASX announcement 2nd December 2008). This includes an estimated 97,000 ounces of gold in the vicinity of the current and planned mine workings.
For
per
sona
l use
onl
y

Table 3. Mineral Resource estimate for the Sand Queen Gold Mine, at a cut-off grade of 5 g/t Au
CategoryVolume(bcm)
Tonnes(t)
Grade(Au g/t)
Au(Ounces)
Indicated 122,000 329,000 9.2 97,100
Inferred 123,000 322,000 8.0 85,500
Total 245,000 661,000 8.6 182,600
For the year the Company expended $999,520 on direct costs for exploration and evaluation of the Comet Vale Project.
MOUNT FINNERTY PROJECT
(100% Reed)Mount Finnerty Iron Ore Joint Venture Cliffs Asia Pacific Iron Ore Pty Ltd (formerly Portman) 80% Fe rights
Iron ore exploration is undertaken by Cliffs Natural Resources (“Cliffs”) in joint venture with Reed Resources Ltd. The principal aim of this exploration is to locate sufficient iron mineralisation within trucking distance of Cliffs’ Koolyanobbing Iron Ore operation, which is about 65km to the west. Previous exploration has identified two key exploration targets: banded iron formation (BIF) hosted iron enrichment (BID) deposits (e.g. FIN1 to FIN11 prospects) and channel iron deposits (CID) within broad palaeochannels that have been identified from geophysical interpretation of satellite imagery and aeromagnetic and ground magnetic survey data.
During the June 2009 quarter, Cliffs completed 29 RC drill holes (for 3,907 m) at the FIN9 prospect (drilling completed) and at FIN10 (drilling continuing). A total of 3,617 RC drill samples were submitted for assay (results pending). The aim of this latest phase of drilling is to define resources at the FIN9 and FIN10 prospects and to test extensions to known iron mineralisation at the FIN10 and FIN11 targets. This will require some 62 reverse circulation (RC) drill holes. The field component of the current drilling program was completed in August. It is anticipated that laboratory analyses for each prospect will be released as they become available. Drill results will then be used to undertake mineral resource estimations, which are expected to be completed in November 2009.
The drilling program will be complimented by further detailed geological mapping and surface sampling during the next 2-3 months from which it is hoped to define additional areas of iron enrichment within the BIF units to be targeted for drill testing. Responsibility for iron ore exploration of the Mount Finnerty area has changed from Cliffs Asia Pacific Iron Ore Pty Ltd to Cliffs Natural Resources’ new Global Exploration Group. This is seen by Reed Resources as a positive move as exploration will be conducted under a dedicated exploration team.
Nickel Exploration Western Areas earning 65% Ni rights
Exploration by Western Areas during the year consisted of primarily RAB drilling programs testing the prospective basal contact of the Western Ultramafic unit (WUM) and other potentially favourable lithologies. A RAB drilling program (WMFRB127-351 for 5,248 metres) at Johnnies Dam and Yalenberine Creek defined moderately high Mg ultramafic rocks at Johnnies Dam. Uncalibrated Niton results show nickel values up to 1.4% Ni in WMFR294 in the Johnnies Dam area that are probably related to shallow saprolite concentration.
Western Areas completed a five drill hole RC drilling program (total 330 metres) in the June Quarter. This drilling tested the prospective basal contact of the Western Ultramafic Unit (WUM) at Richies Reward. Drill hole MFRC06 intersected 1m @ 0.9 g/t Au and 0.5 % Cu at 48-49m associated with sulphides and quartz veining, up dip from a target IP anomaly. Further drilling is planned for May 2009 following a review of targets after all data has been received.
Compilation and review of previous exploration is continuing to identify new targets.
DIRECTORS’ REPORT CONTINUED
15
For
per
sona
l use
onl
y

16
Gold and Other Minerals Exploration
Significant Mineralisation reports have been prepared for the Flinders, Tasman and Giles-Forrest gold prospects in preparation for lodgement of Mining Lease applications.
For the year the Company expended $384,665 on direct costs for exploration and evaluation of the Mount Finnerty Project, including contributions to the Cliffs JV.
For
per
sona
l use
onl
y

DIRECTORS’ REPORT CONTINUED
17
For
per
sona
l use
onl
y

18
BELL ROCK RANGE PROJECT
(100% Reed)
The Bell Rock Range project within the western part of the Proterozoic Musgrave Province in central Australia is highly prospective for several commodities, particularly Ni-Cu sulphide and PGE mineralisation in area that is underexplored.
During the year the Company has conducted anthropological research and held discussions with local aboriginal communities to obtain agreements for access within the exploration licence. In the latter part of the year the Company commenced discussions with parties interested in farming into the project.
The Company expended $24,347 on exploration of the Bell Rock Range Project.
CORPORATE
Placements
During the year the Company issued 2 million ordinary shares in the Company to Prime Minerals Limited as part consideration for a strategic land acquisition around its Barrambie Vanadium deposit.
Further information
Further, more detailed information on the Company’s activities during the year is available in the Company’s quarterly reports to the Australian Stock Exchange.
For
per
sona
l use
onl
y

Changes in state of affairs
There was no significant change in the state of affairs of the consolidated entity during the financial year.
Subsequent events
On 15 July 2009, the Company issued 500,000 ordinary shares in the Company to Breakaway Resources Limited pursuant to the terms of a sale agreement of the same date for the sale and purchase of a joint venture interest located in close proximity to the Company’s Mount Finnerty project tenements. In addition, on this date the Company issued 400,000 ordinary shares in the Company to a consultant to the Company pursuant to the terms of the consulting agreement entered into.
On 11 August 2009, the Company requested that the ASX put an immediate halt on the trading of the Company’s shares pending the announcement of an asset acquisition. Following this, the Company announced on 13 August 2009 that it had secured an option to acquire a goldfields lithium project at a cost of $200,000.
On 21 August 2009, the Company requested that the ASX put an immediate halt on the trading of the Company’s shares pending an announcement of a capital raising. The Company announced to the market on 25 August 2009 the details of a $10.9M capital raising through a $6.4M placement (“Placement”) to institutional and qualified investors and a $4.5M share purchase plan. The lead manager and underwriter of the capital raising was Patersons Securities Ltd. The funds raised will be applied to advance the Mount Marion Lithium and Barrambie vanadium projects.
On 31 August 2009, the Company also exercised its option to acquire the Nimbus plant using funds raised in the Placement and the transaction was completed on 4 September 2009 with the payment of the purchase price of $2.25M.
On 7 September 2009, 1,600,000 options were issued to three employees and one consultant of the Company pursuant to the Company’s employee share option plan. The exercise price of the options is $0.80 and the expiry date for the exercise of the options is 31 December 2013.
Future developments
Disclosure of information regarding likely developments in the operations of the consolidated entity in future financial years and the expected results of those operations is likely to result in unreasonable prejudice to the consolidated entity. Accordingly, this information has not been disclosed in this report.
Environmental regulations
The Company is aware of its environmental obligations with regards to its exploration, development and production activities and ensures that it complies with all regulations when carrying out such work.
Dividends
In respect of the financial year ended 30 June 2009, the company has not paid an interim dividend and no final dividend is recommended. In respect of the financial year ended 2008, the company did not pay an interim dividend and no final dividend was recommended.
Share options
Share options granted to directors and executives
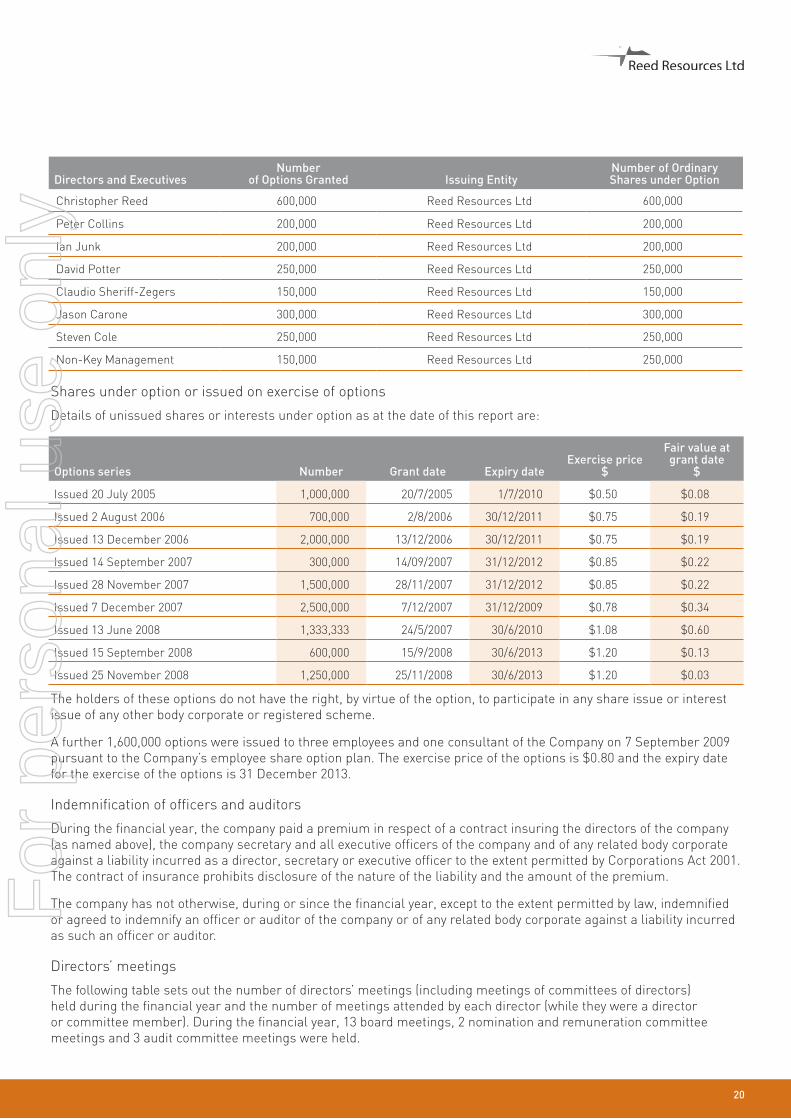
During and since the end of the financial year an aggregate 2,100,000 share options were granted to the following directors and executives of the company and the consolidated entity as part of their remuneration:
DIRECTORS’ REPORT CONTINUED
19
For
per
sona
l use
onl
y
20
Directors and ExecutivesNumber
of Options Granted Issuing EntityNumber of Ordinary Shares under Option
Christopher Reed 600,000 Reed Resources Ltd 600,000
Peter Collins 200,000 Reed Resources Ltd 200,000
Ian Junk 200,000 Reed Resources Ltd 200,000
David Potter 250,000 Reed Resources Ltd 250,000
Claudio Sheriff-Zegers 150,000 Reed Resources Ltd 150,000
Jason Carone 300,000 Reed Resources Ltd 300,000
Steven Cole 250,000 Reed Resources Ltd 250,000
Non-Key Management 150,000 Reed Resources Ltd 250,000
Shares under option or issued on exercise of options
Details of unissued shares or interests under option as at the date of this report are:
Options series Number Grant date Expiry dateExercise price
$
Fair value at grant date
$
Issued 20 July 2005 1,000,000 20/7/2005 1/7/2010 $0.50 $0.08
Issued 2 August 2006 700,000 2/8/2006 30/12/2011 $0.75 $0.19
Issued 13 December 2006 2,000,000 13/12/2006 30/12/2011 $0.75 $0.19
Issued 14 September 2007 300,000 14/09/2007 31/12/2012 $0.85 $0.22
Issued 28 November 2007 1,500,000 28/11/2007 31/12/2012 $0.85 $0.22
Issued 7 December 2007 2,500,000 7/12/2007 31/12/2009 $0.78 $0.34
Issued 13 June 2008 1,333,333 24/5/2007 30/6/2010 $1.08 $0.60
Issued 15 September 2008 600,000 15/9/2008 30/6/2013 $1.20 $0.13
Issued 25 November 2008 1,250,000 25/11/2008 30/6/2013 $1.20 $0.03
The holders of these options do not have the right, by virtue of the option, to participate in any share issue or interest issue of any other body corporate or registered scheme.
A further 1,600,000 options were issued to three employees and one consultant of the Company on 7 September 2009 pursuant to the Company’s employee share option plan. The exercise price of the options is $0.80 and the expiry date for the exercise of the options is 31 December 2013.
Indemnification of officers and auditors
During the financial year, the company paid a premium in respect of a contract insuring the directors of the company (as named above), the company secretary and all executive officers of the company and of any related body corporate against a liability incurred as a director, secretary or executive officer to the extent permitted by Corporations Act 2001. The contract of insurance prohibits disclosure of the nature of the liability and the amount of the premium.
The company has not otherwise, during or since the financial year, except to the extent permitted by law, indemnified or agreed to indemnify an officer or auditor of the company or of any related body corporate against a liability incurred as such an officer or auditor.
Directors’ meetings
The following table sets out the number of directors’ meetings (including meetings of committees of directors) held during the financial year and the number of meetings attended by each director (while they were a director or committee member). During the financial year, 13 board meetings, 2 nomination and remuneration committee meetings and 3 audit committee meetings were held.
For
per
sona
l use
onl
y
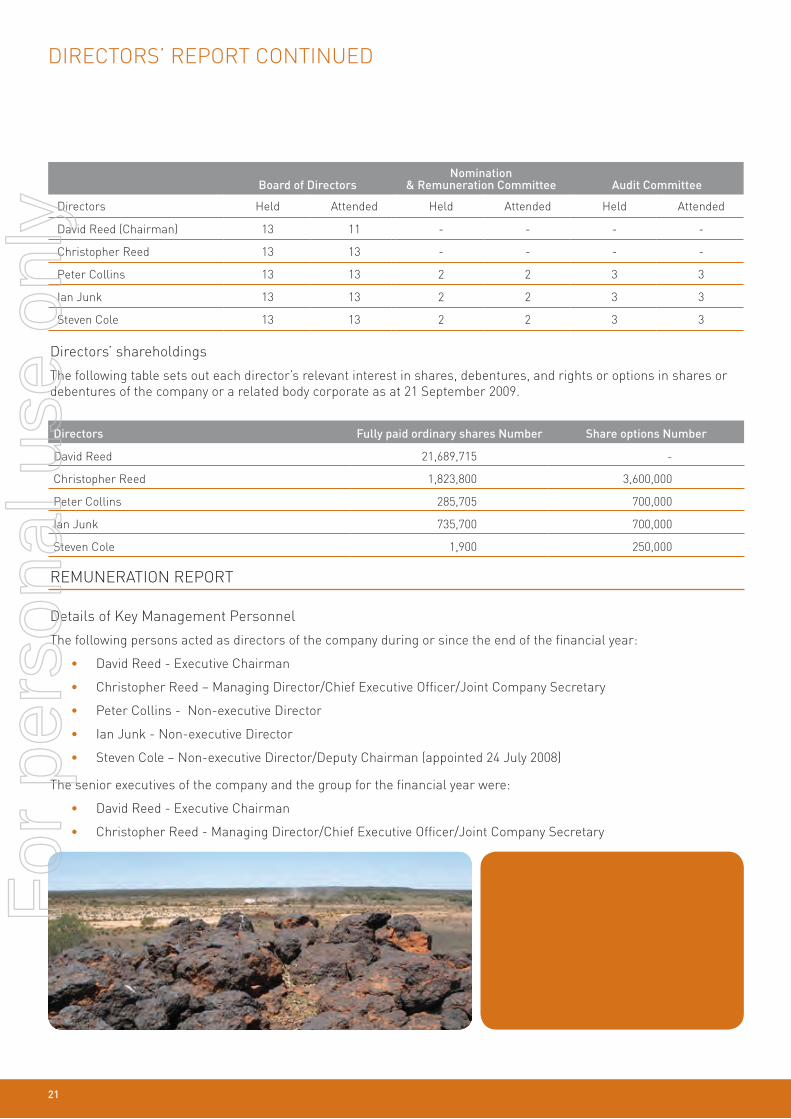
Board of DirectorsNomination
& Remuneration Committee Audit Committee
Directors Held Attended Held Attended Held Attended
David Reed (Chairman) 13 11 - - - -
Christopher Reed 13 13 - - - -
Peter Collins 13 13 2 2 3 3
Ian Junk 13 13 2 2 3 3
Steven Cole 13 13 2 2 3 3
Directors’ shareholdings
The following table sets out each director’s relevant interest in shares, debentures, and rights or options in shares or debentures of the company or a related body corporate as at 21 September 2009.
Directors Fully paid ordinary shares Number Share options Number
David Reed 21,689,715 -
Christopher Reed 1,823,800 3,600,000
Peter Collins 285,705 700,000
Ian Junk 735,700 700,000
Steven Cole 1,900 250,000
REMUNERATION REPORT
Details of Key Management Personnel
The following persons acted as directors of the company during or since the end of the financial year:
• David Reed - Executive Chairman
• Christopher Reed – Managing Director/Chief Executive Officer/Joint Company Secretary
• Peter Collins - Non-executive Director
• Ian Junk - Non-executive Director
• Steven Cole – Non-executive Director/Deputy Chairman (appointed 24 July 2008)
The senior executives of the company and the group for the financial year were:
• David Reed - Executive Chairman
• Christopher Reed - Managing Director/Chief Executive Officer/Joint Company Secretary
DIRECTORS’ REPORT CONTINUED
21
For
per
sona
l use
onl
y

22
• William John Crossley - Project Manager Barrambie
• Jason Carone - Financial Controller and Joint Company Secretary (appointed 4 March 2009)
• David Potter - Manager – Chief Geologist (cessation 17 April 2009)
• Claudio Sheriff - Zegers – Geologist (cessation 31 December 2008)
Unless otherwise disclosed, the Key Management Personnel held their position from 1 July 2008 until the date of this report.
Remuneration policy for directors and executives
The Group’s remuneration policy is to provide a fixed remuneration component and a performance based component. The Board believes that this remuneration policy is appropriate given the stage of development of the Company and the activities which it undertakes and is appropriate in aligning Key Management Personnel objectives with shareholder and business objectives.
The remuneration policy in regard to setting the terms and conditions for the Group’s executives (including the Managing Director) has been developed by the Board taking into account market conditions and comparable salary levels for companies of a similar size and operating in similar sectors.
The Company is a developing listed company with most of its funds allocated to specific exploration and new business development activities. As a result, the Board has chosen to issue incentive options to executives as a key component of the incentive portion of their remuneration, in order to retain the services of the executives and to provide an incentive linked to the performance of the Company. The Board considers that each executive’s experience in the resources industry will greatly assist the Company in progressing its projects to the next stage of development and the identification of new projects. As such, the Board believes that the number of incentive options granted to executives is commensurate to their value to the Company.
Other than service-based vesting conditions, there are no additional performance criteria on the incentive options granted to executives as, given the speculative nature of the Company’s activities and the small management team responsible for its running, it is considered the performance of the executives and the performance and value of the Company are closely related. The Board has a policy of granting options to key management personnel with exercise prices above the respective share price at the time that the options were agreed to be granted. As such, incentive options granted to executives will generally only be of benefit if the executives perform to the level whereby the value of the Company increases sufficiently to warrant exercising the incentive options granted. Given the stage of development of the Company and the high risk nature its activities, the Board considers that the prospects of the Company and resulting impact on shareholder wealth are largely linked to the success of this approach, rather than by referring to current or prior year earnings. All incentive options are performance based and the percentage of total remuneration are disclosed in the table below.
All remuneration paid to Key Management Personnel is valued at cost to the company and expensed. Incentive options are valued using the Black Scholes valuation methodology. The value of these incentive options is expensed as they vest.
The executive directors of the Company are employed under Service Agreements which have been in existence since July and August 2006. The Service Agreements are similar in their contents and only differ in hours of service and remuneration levels. The service contracts have a duration of three years and renew automatically unless terminated by either the Company by giving twelve months notice to the individual; or by the individual by giving six months notice to the Company. In August 2009 the executive directors agreed to extend their contracts for a further 3 years. The level of compensation is not dependent on the satisfaction of any performance condition.
The Board policy is to remunerate Non-Executive Directors at market rates for comparable companies for time, commitment and responsibilities. Given the current size, nature and risks of the Company, incentive options have been used to attract and retain Non-Executive Directors. The Nomination and Remuneration committee on behalf of the Board determines payments to the Non-Executive Directors and reviews their remuneration annually, based on market practice, duties and accountability. Independent external advice is sought when required. The maximum aggregate amount of fees that can be paid to Non-Executive Directors is subject to approval by shareholders at a General Meeting. Fees for Non-Executive Directors are not linked to the performance of the economic entity.
For
per
sona
l use
onl
y

However, to align Directors’ interests with shareholder interests, the Directors are encouraged to hold shares in the Company and Non-Executive Directors have received options in order to secure their services.
To date the Company has been undertaking exploration activities, and does not expect to be undertaking profitable operations until after the successful commercialisation, production and sales of commodities from one or more of its projects. Accordingly, the Board does not consider current or prior year earning when assessing remuneration of Key Management Personnel.
As a result of the Company’s exploration and business development activities, the Board anticipates that it will retain future earnings (if any) and other cash resources for the operation and development of its business. Accordingly, the Company does not currently have a policy with respect to the payment of dividends, and as a result the remuneration policy does not take into account the level of dividends or other distribution to shareholders (e.g. return of capital). In addition, the Board does not directly base remuneration levels on the Company’s share price or movement in the share price over time. However, as noted above a number of Key Management Personnel have received incentive options which will generally only be of benefit if the Key Management Personnel perform to the level whereby the share price of the Company increases sufficiently to warrant exercising the options granted.
Remuneration packages contain the following key elements:
a) Short-term benefits – salary, superannuation and non-monetary benefits including the provision of a motor vehicle;
b) Share based payments – share options granted under the executive share option plan as disclosed in note 7 to the financial statements.
The committee’s remuneration policies are designed to align executive’s remuneration with shareholders’ interest and to retain appropriately qualified executive talent for the benefit of the Company. The main principles of the policies are that:
• shareholder interests and employee interests are aligned;
• the Company is able to attract, develop and retain superior talent; and
• the integrity of the Company’s reward program is maintained.
There is currently no Board policy in relation to the person granted the option limiting his or her exposure to risk in relation to the securities as the options are issued in addition to their separate remuneration package. The Nomination and Remuneration committee intends to review whether such a policy would likely to be of benefit during the coming financial year.
Relationship between the remuneration policy and company performance
The tables below set out summary information about the consolidated entity’s earnings and movements in shareholder wealth for the five years to June 2009:
30 June 2009
$
30 June 2008
$
30 June 2007
$
30 June 2006
$
30 June 2005
$
Revenue 3,593,481 1,972,498 402,864 257,348 -
Net loss before tax (3,629,760) (4,439,216) (3,005,087) (1,530,129) (167,263)
Net loss after tax (2,468,834) (3,179,303) (2,423,092) (986,182) (655,900)
Share price at start of year 1.03 0.46 0.52 0.22 0.24
Share price at end of year 0.24 1.03 0.46 0.52 0.22
Market capitalisation at year end (undiluted) 33,036,000 139,513,500 45,112,750 42,052,500 15,400,000
Basic loss per share (1.80) (2.83) (2.93) (1.33) (1.06)
Diluted loss per share (1.80) (2.83) (2.93) (1.33) (1.06)
Dividends Paid Nil Nil Nil Nil Nil
DIRECTORS’ REPORT CONTINUED
23
For
per
sona
l use
onl
y

24
Director and executive remuneration
The directors and the three identified company executives and group executives received the following amounts as compensation for their services as directors and executives of the company and/or the Group during the year:
Short-term employee benefits
Post- employ-
ment benefits
Termination benefits
Share-based
payment
Total
% consisting of options
Salary& fees Bonus
Non- monetary Other
Super-annuation
Options & rights
2009 $ $ $ $ $ $ $ $ $
Directors:
David Reed 100,000 - - - 9,000 - - 109,000 -
Christopher Reed 250,000 - - - 22,500 - 18,240 290,740 6.27
Peter Collins 40,000 - - - 3,600 - 6,080 49,680 12.24
Steven Cole 45,833 - - - 4,125 7,600 57,558 13.20
Ian Junk 40,000 - - - 3,600 - 6,080 49,680 12.24
Executives:
William J Crossley 270,343 - - - 100,000 - - 370,343 -
Jason Carone 109,236 - 13,514 - 11,100 38,130 171,980 22.17
David Potter 125,000 - - - 11,250 59,152 31,775 227,177 13.99
Claudio Sheriff-Zegers 42,500 - - - 3,825 33,170 19,065 98,560 19.34
Total 1,022,912 - 13,514 - 169,000 92,322 126,970 1,424,718 8.91
Short-term employee benefits
Post- employ-
ment benefits
Termination benefits
Share-based
payment
Total
% Consisting of Options
Salary& fees Bonus
Non-monetary Other
Super-annua-tion
Options & rights
2008 $ $ $ $ $ $ $ $ $
Directors:
David Reed 100,000 - - - 9,000 - - 109,000 -
Christopher Reed 208,256 - 11,233 - 16,201 - 220,000 455,690 48.28
Peter Collins 40,000 - - 24,987 3,600 - - 68,587 -
Ian Junk 40,000 - - - 3,600 - - 43,600 -
Executives:
William J Crossley 138,909 - - - 58,333 - 110,000 307,242 35.80
David Potter 137,500 - - - 12,375 - 88,000 237,875 37.00
Claudio Sheriff-Zegers 82,500 - - - 7,425 - 66,000 155,925 42.33
Total 747,165 - 11,233 24,987 110,534 - 484,000 1,377,919 35.13
For
per
sona
l use
onl
y
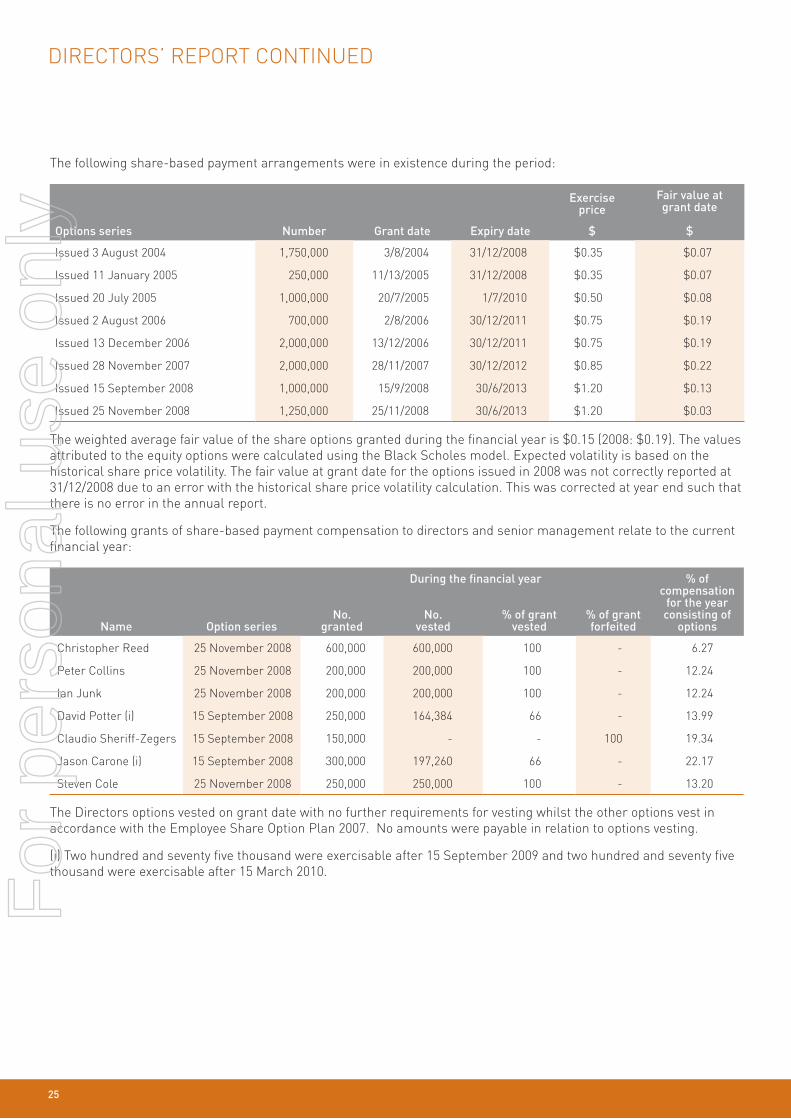
The following share-based payment arrangements were in existence during the period:
Options series Number Grant date Expiry date
Exercise price
$
Fair value at grant date
$
Issued 3 August 2004 1,750,000 3/8/2004 31/12/2008 $0.35 $0.07
Issued 11 January 2005 250,000 11/13/2005 31/12/2008 $0.35 $0.07
Issued 20 July 2005 1,000,000 20/7/2005 1/7/2010 $0.50 $0.08
Issued 2 August 2006 700,000 2/8/2006 30/12/2011 $0.75 $0.19
Issued 13 December 2006 2,000,000 13/12/2006 30/12/2011 $0.75 $0.19
Issued 28 November 2007 2,000,000 28/11/2007 30/12/2012 $0.85 $0.22
Issued 15 September 2008 1,000,000 15/9/2008 30/6/2013 $1.20 $0.13
Issued 25 November 2008 1,250,000 25/11/2008 30/6/2013 $1.20 $0.03
The weighted average fair value of the share options granted during the financial year is $0.15 (2008: $0.19). The values attributed to the equity options were calculated using the Black Scholes model. Expected volatility is based on the historical share price volatility. The fair value at grant date for the options issued in 2008 was not correctly reported at 31/12/2008 due to an error with the historical share price volatility calculation. This was corrected at year end such that there is no error in the annual report.
The following grants of share-based payment compensation to directors and senior management relate to the current financial year:
During the financial year % of compensation
for the year consisting of
optionsName Option seriesNo.
grantedNo.
vested% of grant
vested% of grant forfeited
Christopher Reed 25 November 2008 600,000 600,000 100 - 6.27
Peter Collins 25 November 2008 200,000 200,000 100 - 12.24
Ian Junk 25 November 2008 200,000 200,000 100 - 12.24
David Potter (i) 15 September 2008 250,000 164,384 66 - 13.99
Claudio Sheriff-Zegers 15 September 2008 150,000 - - 100 19.34
Jason Carone (i) 15 September 2008 300,000 197,260 66 - 22.17
Steven Cole 25 November 2008 250,000 250,000 100 - 13.20
The Directors options vested on grant date with no further requirements for vesting whilst the other options vest in accordance with the Employee Share Option Plan 2007. No amounts were payable in relation to options vesting.
(i) Two hundred and seventy five thousand were exercisable after 15 September 2009 and two hundred and seventy five thousand were exercisable after 15 March 2010.
DIRECTORS’ REPORT CONTINUED
25
For
per
sona
l use
onl
y

26
Value of options issued to directors and senior management
The following table summarises the value of options granted, exercised or lapsed during the annual reporting period to the identified directors and senior management:
Value of options granted
at the grant date (i)
Value of options exercised
at the exercise date (ii)
Value of options lapsed/cancelled
at the date of lapse Total
$ $ $ $
Directors:
David Reed - - - -
Christopher Reed 18,240 - - 18,240
Peter Collins 6,080 - - 6,080
Ian Junk 6,080 - - 6,080
Steven Cole 7,600 - - 7,600
Executives:
Jason Carone 38,130 - - 38,130
David Potter 31,775 - - 31,775
Claudio Sheriff - Zegers 19,065 - (19,065) -
(i) The value of options granted during the period is recognised in compensation over the vesting period of the grant, in accordance with Australian accounting standards. (ii) Only options granted in previous financial years were exercised during the financial year.(ii) Options were issued during the financial year ended 30 June 2009 to directors and executives had an exercise price of $1.20 exercisable at any time on or before 30 June 2013.
Proceedings on behalf of the company
No person has applied for leave of Court to bring proceedings on behalf of the Company or intervene in any proceedings to which the Company is a party for the purpose of taking responsibility on behalf of the Company for all or part of those proceedings. The Company was not a party to any such proceedings during the year.
Non-audit services
The directors are satisfied that the provision of non-audit services, during the year, by the auditor (or by another person or firm on the auditor’s behalf) is compatible with the general standard of independence for auditors imposed by the Corporations Act 2001.
The directors’ are satisfied that the non-audit services provided did not compromise the external auditor’s independence for the following reasons:
• all non-audit services are reviewed and approved by the directors’ prior to commencement to ensure they do not adversely affect the integrity and objectivity of the auditor; and
• the nature of the services provided do not compromise the general principles relating to auditor independence as set out in the Institute of Chartered Accountants in Australia and CPA Australia’s Professional Statement F1: Professional Independence.
Details of amounts paid or payable to the auditor for non-audit services provided during the year by the auditor are outlined in note 8 to the financial statements.
For
per
sona
l use
onl
y

Auditor’s independence declaration
The auditor’s independence declaration is included on page 28 of the annual report.
Signed in accordance with a resolution of directors made pursuant to s.298(2) of the Corporations Act 2001.
On behalf of the Directors
Christopher ReedDirectorWest Perth, WA, 21 September 2009
27
For
per
sona
l use
onl
y

28
Liability limited by a scheme approved under Professional Standards Legislation. 28
Deloitte Touche Tohmatsu A.B.N. 74 490 121 060
Woodside Plaza 240 St Georges Terrace Perth WA 6000 GPO Box A46 Perth WA Australia
Tel: +61 (0) 8 9365 7000 Fax: +61 (0) 8 9365 7001 www.deloitte.com.au
21 September 2009
Dear Board Members
AUDITOR’S INDEPENDENCE DECLARATION TO REED RESOURCES LTD
In accordance with section 307C of the Corporations Act 2001, I am pleased to provide the following declaration of independence to the directors of Reed Resources Ltd.
As lead audit partner for the audit of the financial statements of Reed Resources Ltd for the financial year ended 30 June 2009, I declare that to the best of my knowledge and belief, there have been no contraventions of:
(i) the auditor independence requirements of the Corporations Act 2001 in relation to the audit; and
(ii) any applicable code of professional conduct in relation to the audit.
Yours sincerely
DELOITTE TOUCHE TOHMATSU
Mark Gover PartnerChartered Accountants
The Board of Directors Reed Resources Ltd 97 Outram Street, West Perth WA 6005
For
per
sona
l use
onl
y
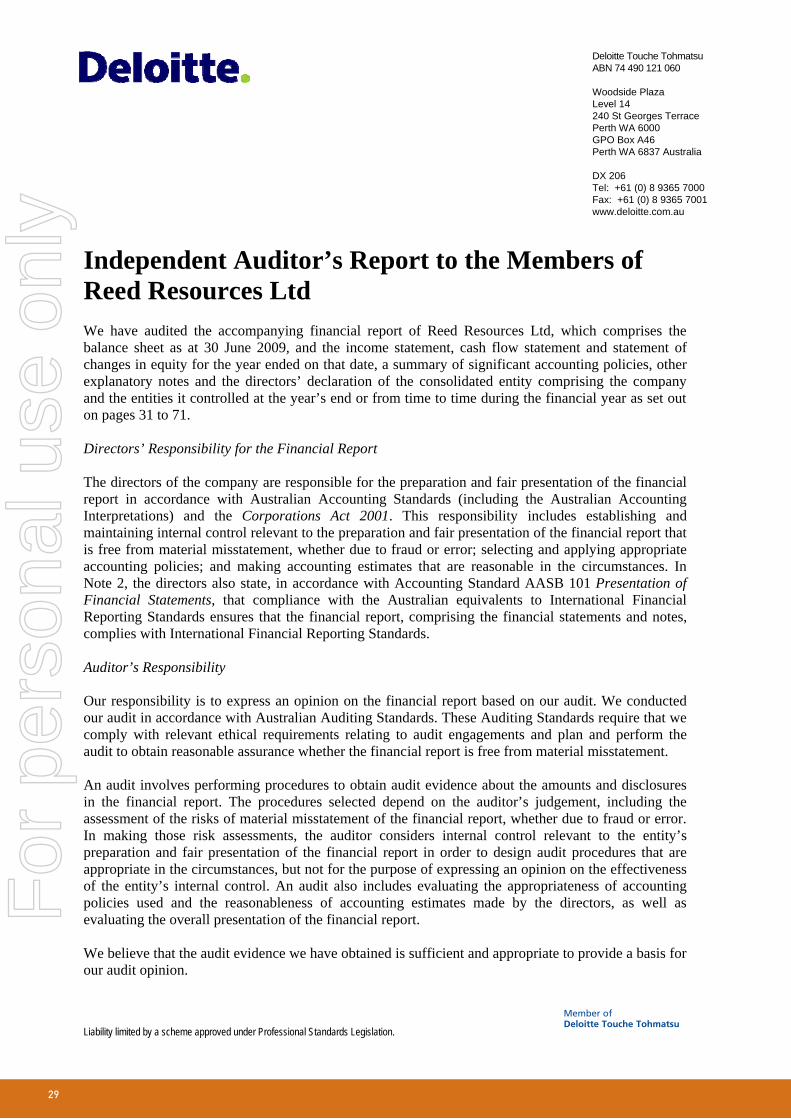
Liability limited by a scheme approved under Professional Standards Legislation. 29
Independent Auditor’s Report to the Members of Reed Resources Ltd We have audited the accompanying financial report of Reed Resources Ltd, which comprises the balance sheet as at 30 June 2009, and the income statement, cash flow statement and statement of changes in equity for the year ended on that date, a summary of significant accounting policies, other explanatory notes and the directors’ declaration of the consolidated entity comprising the company and the entities it controlled at the year’s end or from time to time during the financial year as set out on pages 31 to 71.
Directors’ Responsibility for the Financial Report
The directors of the company are responsible for the preparation and fair presentation of the financial report in accordance with Australian Accounting Standards (including the Australian Accounting Interpretations) and the Corporations Act 2001. This responsibility includes establishing and maintaining internal control relevant to the preparation and fair presentation of the financial report that is free from material misstatement, whether due to fraud or error; selecting and applying appropriate accounting policies; and making accounting estimates that are reasonable in the circumstances. In Note 2, the directors also state, in accordance with Accounting Standard AASB 101 Presentation of Financial Statements, that compliance with the Australian equivalents to International Financial Reporting Standards ensures that the financial report, comprising the financial statements and notes, complies with International Financial Reporting Standards.
Auditor’s Responsibility
Our responsibility is to express an opinion on the financial report based on our audit. We conducted our audit in accordance with Australian Auditing Standards. These Auditing Standards require that we comply with relevant ethical requirements relating to audit engagements and plan and perform the audit to obtain reasonable assurance whether the financial report is free from material misstatement.
An audit involves performing procedures to obtain audit evidence about the amounts and disclosures in the financial report. The procedures selected depend on the auditor’s judgement, including the assessment of the risks of material misstatement of the financial report, whether due to fraud or error. In making those risk assessments, the auditor considers internal control relevant to the entity’s preparation and fair presentation of the financial report in order to design audit procedures that are appropriate in the circumstances, but not for the purpose of expressing an opinion on the effectiveness of the entity’s internal control. An audit also includes evaluating the appropriateness of accounting policies used and the reasonableness of accounting estimates made by the directors, as well as evaluating the overall presentation of the financial report.
We believe that the audit evidence we have obtained is sufficient and appropriate to provide a basis for our audit opinion.
Deloitte Touche Tohmatsu ABN 74 490 121 060
Woodside Plaza Level 14 240 St Georges Terrace Perth WA 6000 GPO Box A46 Perth WA 6837 Australia
DX 206 Tel: +61 (0) 8 9365 7000 Fax: +61 (0) 8 9365 7001 www.deloitte.com.au
29
For
per
sona
l use
onl
y

3030
Auditor’s Independence Declaration
In conducting our audit, we have complied with the independence requirements of the Corporations Act 2001.
Auditor’s Opinion
In our opinion:
(a) the financial report of Reed Resources Ltd is in accordance with the Corporations Act 2001,including: (i) giving a true and fair view of the company’s and consolidated entity’s financial position as at
30 June 2009 and of their performance for the year ended on that date; and (ii) complying with Australian Accounting Standards (including the Australian Accounting
Interpretations) and the Corporations Regulations 2001; and
(b) the financial report also complies with International Financial Reporting Standards as disclosed in Note 2.
Report on the Remuneration Report
We have audited the Remuneration Report included in pages 21 to 27 of the directors’ report for the year ended 30 June 2009. The directors of the company are responsible for the preparation and presentation of the Remuneration Report in accordance with section 300A of the Corporations Act 2001. Our responsibility is to express an opinion on the Remuneration Report, based on our audit conducted in accordance with Australian Auditing Standards.
Auditor’s Opinion
In our opinion the Remuneration Report of Reed Resources Ltd for the year ended 30 June 2009, complies with section 300A of the Corporations Act 2001.
DELOITTE TOUCHE TOHMATSU
Mark Gover PartnerChartered Accountants Perth, 21 September 2009
For
per
sona
l use
onl
y

Directors’ declarationThe directors declare that:
(a) in the directors’ opinion, there are reasonable grounds to believe that the company will be able to pay its debts as and when they become due and payable;
(b) inthedirectors’opinion,theattachedfinancialstatementsandnotestheretoareinaccordancewiththeCorporationsAct2001,includingcompliancewithaccountingstandardsandgivingatrueandfairviewofthefinancialpositionandperformanceofthecompany and the consolidated entity; and
(c) the directors have been given the declarations required by s.295A of the Corporations Act 2001.
Signed in accordance with a resolution of the directors made pursuant to s.295(5) of the Corporations Act 2001.
On behalf of the Directors
Christopher ReedDirectorWest Perth, WA, 21 September 2009
31
For
per
sona
l use
onl
y
32
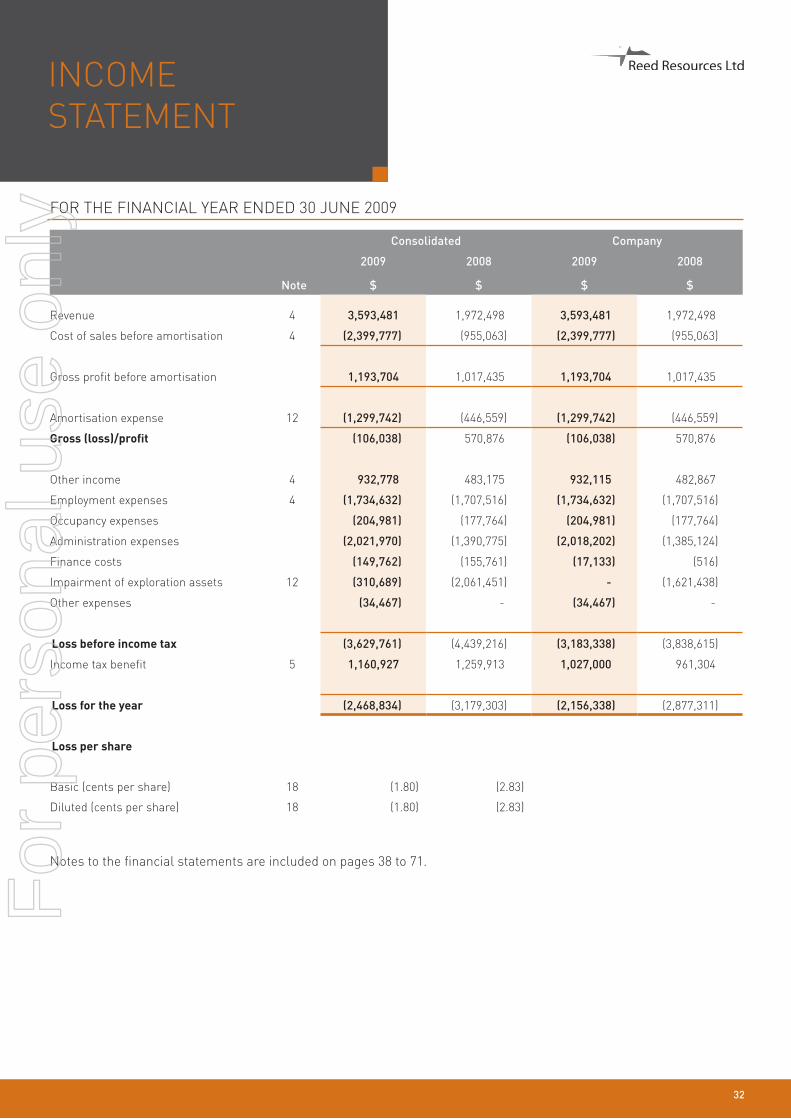
INCOME STATEMENT
FOR THE FINANCIAL YEAR ENDED 30 JUNE 2009
Consolidated Company
Note
2009
$
2008
$
2009
$
2008
$
Revenue 4 3,593,481 1,972,498 3,593,481 1,972,498
Cost of sales before amortisation 4 (2,399,777) (955,063) (2,399,777) (955,063)
Gross profit before amortisation 1,193,704 1,017,435 1,193,704 1,017,435
Amortisation expense 12 (1,299,742) (446,559) (1,299,742) (446,559)
Gross (loss)/profit (106,038) 570,876 (106,038) 570,876
Other income 4 932,778 483,175 932,115 482,867
Employment expenses 4 (1,734,632) (1,707,516) (1,734,632) (1,707,516)
Occupancy expenses (204,981) (177,764) (204,981) (177,764)
Administration expenses (2,021,970) (1,390,775) (2,018,202) (1,385,124)
Finance costs (149,762) (155,761) (17,133) (516)
Impairment of exploration assets 12 (310,689) (2,061,451) - (1,621,438)
Other expenses (34,467) - (34,467) -
Loss before income tax (3,629,761) (4,439,216) (3,183,338) (3,838,615)
Income tax benefit 5 1,160,927 1,259,913 1,027,000 961,304
Loss for the year (2,468,834) (3,179,303) (2,156,338) (2,877,311)
Loss per share
Basic (cents per share) 18 (1.80) (2.83)
Diluted (cents per share) 18 (1.80) (2.83)
Notes to the financial statements are included on pages 38 to 71.
For
per
sona
l use
onl
y

BALANCE SHEET
AS AT 30 JUNE 2009
Consolidated Company
Note
2009
$
2008
$
2009
$
2008
$
Current assets
Cash and cash equivalents 28 9,287,755 19,973,009 9,255,945 19,890,909
Trade and other receivables 9 288,695 487,504 159,525 487,363
Current tax assets 5 412,348 323,535 412,348 323,535
Total current assets 9,988,798 20,784,048 9,827,818 20,701,807
Non-current assets
Exploration & development expenditure 12 28,121,379 20,445,485 24,643,203 19,498,550
Other intangible assets 10 50,000 - 2,961,680 621,579
Property, plant and equipment 11 237,897 323,799 237,897 323,799
Trade and other receivables 9 - - 2,190,712 1,434,255
Deferred tax assets 5 4,766,787 4,018,207 4,309,153 3,694,500
Total non-current assets 33,176,063 24,787,491 34,342,645 25,572,683
Total assets 43,164,861 45,571,539 44,170,463 46,274,490
Current liabilities
Trade and other payables 13 318,934 1,984,559 249,544 1,925,014
Borrowings 22 - 16,964 - 16,964
Total current liabilities 318,934 2,001,523 249,544 1,941,978
Non-current liabilities
Provisions 14 192,665 - 192,665 -
Borrowings 22 - 9,020 - 9,020
Total non-current liabilities 192,665 9,020 192,665 9,020
Total liabilities 511,599 2,010,543 442,209 1,950,998
Net assets 42,653,262 43,560,996 43,728,254 44,323,492
Equity
Issued capital 15 50,277,004 48,881,004 50,277,004 48,881,004
Accumulated losses 17 (10,694,342) (8,225,508) (9,619,350) (7,463,012)
Reserves 16 3,070,600 2,905,500 3,070,600 2,905,500
Total equity 42,653,262 43,560,996 43,728,254 44,323,492
Notes to the financial statements are included on pages 38 to 71.
33
For
per
sona
l use
onl
y

34
FOR THE FINANCIAL YEAR ENDED 30 JUNE 2009
Consolidated Issued capitalShare based
payments reserveAccumulated
losses
Total attributable to equity holders
of the entity
$ $ $ $
Balance at 1/7/07 22,728,236 743,000 (5,046,205) 18,425,031
Loss for the period - - (3,179,303) (3,179,303)
Total recognised income and expense - - (3,179,303) (3,179,303)
Recognition of share-based payments - 2,162,500 - 2,162,500
Issue of share capital 28,250,000 - - 28,250,000
Issue of shares under share option plan 35,000 - - 35,000
Share issue costs (3,366,440) - - (3,366,440)
Income tax on items taken directly to equity 1,234,208 - - 1,234,208
Balance at 30/6/08 48,881,004 2,905,500 (8,225,508) 43,560,996
Balance at 1/7/08 48,881,004 2,905,500 (8,225,508) 43,560,996
Loss for the period - - (2,468,834) (2,468,834)
Total recognised income and expense - - (2,468,834) (2,468,834)
Recognition of share-based payments - 165,100 - 165,100
Issue of share capital 1,396,000 - - 1,396,000
Balance at 30/6/09 50,277,004 3,070,600 (10,694,342) 42,653,262
Company Issued capitalShare based
payments reserveAccumulated
losses
Total attributable to equity holders
of the entity
$ $ $ $
Balance at 1/7/07 22,728,236 743,000 (4,585,701) 18,885,535
Loss for the period - - (2,877,311) (2,877,311)
Total recognised income and expense - - (2,877,311) (2,877,311)
Recognition of share-based payments - 2,162,500 - 2,162,500
Issue of share capital 28,250,000 - - 28,250,000
Issue of shares under share option plan 35,000 - - 35,000
Share issue costs (3,366,440) - - (3,366,440)
Income tax on items taken directly to equity 1,234,208 - - 1,234,208
Balance at 30/6/08 48,881,004 2,905,500 (7,463,012) 44,323,492
Balance at 1/7/08 48,881,004 2,905,500 (7,463,012) 44,323,492
Loss for the period - - (2,156,338) (2,156,338)
Total recognised income and expense - - (2,156,338) (2,156,338)
Recognition of share-based payments - 165,100 - 165,100
Issue of share capital 1,396,000 - - 1,396,000
Balance at 30/6/09 50,277,004 3,070,600 (9,619,350) 43,728,254
Notes to the financial statements are included on pages 38 to 71.
STATEMENT OF CHANGES IN EQUITY
For
per
sona
l use
onl
y

AS AT 30 JUNE 2009
Consolidated Company
Note
2009
$
2008
$
2009
$
2008
$
Cash flows from operating activities
Receipts from customers 3,883,330 1,936,482 3,883,330 1,936,482
Payments to suppliers and employees (6,055,756) (3,524,768) (6,052,131) (3,423,416)
Interest received 906,887 446,595 906,224 446,287
Interest and other finance costs paid (133,804) - (1,175) -
Income tax refund 323,535 87,490 323,535 87,490
Net cash used in operating activities 28 (1,075,808) (1,054,201) (940,217) (953,157)
Cash flows from investing activities
Exploration and development costs paid (9,561,679) (9,811,854) (7,940,422) (9,755,243)
Amounts advanced to related parties - - (756,457) (239,755)
Payment for interest in controlled subsidiary - - (1,000,101) -
Payment for other financial assets (50,000) - - -
Proceeds from sale of property, plant & equipment 46,341 - 46,341 -
Payment for property, plant & equipment (17,696) (85,921) (17,696) (85,921)
Net cash used in investing activities (9,583,034) (9,897,775) (9,668,335) (10,080,919)
Cash flows from financing activities
Proceeds from issues of shares - 28,285,000 - 28,285,000
Payment for share issue costs - (1,738,941) - (1,738,941)
Repayment of borrowings (26,412) - (26,412) -
Net cash (used in)/provided by financing activities (26,412) 26,546,059 (26,412) 26,546,059
Net (decrease)/increase in cash and cash equivalents (10,685,254) 15,594,083 (10,634,964) 15,511,983
Cash and cash equivalents at the beginning of the financial year 19,973,009 4,378,926 19,890,909 4,378,926
Cash and cash equivalents at the end of the financial year 28 9,287,755 19,973,009 9,255,945 19,890,909
Notes to the financial statements are included on pages 38 to 71.
CASH FLOW STATEMENT
35
For
per
sona
l use
onl
y

36
NOTES TO THE FINANCIALSTATEMENTS
For
per
sona
l use
onl
y

FOR THE FINANCIAL YEAR ENDED 30 JUNE 2009
Note Contents
1 General information 38
2 Significant accounting policies 38
3 Critical accounting judgements and key sources of estimation uncertainty 47
4 Loss from the year 48
5 Income taxes 49
6 Key management personnel compensation 52
7 Share based payments 54
8 Remuneration of auditors 56
9 Trade and other receivables 56
10 Other non-current financial assets 57
11 Property, plant and equipment 57
12 Exploration and development expenditure 58
13 Current trade and other payables 60
14 Provisions 60
15 Issued capital 60
16 Reserves 61
17 Accumulated losses 61
18 Loss per share 61
19 Commitments for expenditure 62
20 Contingent liabilities 63
21 Leases 63
22 Borrowings 64
23 Jointly controlled operations and assets 64
24 Subsidiaries 64
25 Segment information 65
26 Related party disclosures 65
27 Subsequent events 67
28 Notes to the cash flow statement 68
29 Financial instruments 69
37
For
per
sona
l use
onl
y
38
1. GENERAL INFORMATION
Reed Resources Ltd is a listed public company, incorporated in Australia and operating in West Perth.
Reed Resources Ltd’s registered office and its principal place of business are as follows:
Registered office Principal place of business97 Outram St, West Perth, WA, 6005 97 Outram St, West Perth, WA, 6005
2. SIGNIFICANT ACCOUNTING POLICIES
Statement of compliance
The financial report is a general purpose financial report which has been prepared in accordance with the Corporations Act 2001, Accounting Standards and Interpretations, and complies with other requirements of the law. The financial report includes the separate financial statements of the company and the consolidated financial statements of the Group.
Accounting Standards include Australian equivalents to International Financial Reporting Standards (‘A-IFRS’). Compliance with A-IFRS ensures that the financial statements and notes of the company and the Group comply with International Financial Reporting Standards (‘IFRS’).
The financial statements were authorised for issue by the directors on 21 September 2009.
Basis of preparation
The financial report has been prepared on the basis of historical cost except for the revaluation of certain non financial assets and financial instruments. Cost is based on the fair values of the consideration given in exchange for assets. All amounts are presented in Australian dollars, unless otherwise noted.
Critical accounting judgements and key sources of estimation uncertainty
In the application of the Group’s accounting policies, management is required to make judgments, estimates and assumptions about carrying values of assets and liabilities that are not readily apparent from other sources. The estimates and associated assumptions are based on historical experience and other factors that are considered to be relevant. Actual results may differ from these estimates.
The estimates and underlying assumptions are reviewed on an ongoing basis. Revisions to accounting estimates are recognised in the period in which the estimate is revised if the revision affects only that period, or in the period of the revision and future periods if the revision affects both current and future periods. Refer to note 3 for a discussion of critical judgements in applying the entity’s accounting policies, and key sources of estimation uncertainty.
Standards and Interpretations issued not yet effective
At the date of authorisation of the financial report, the Standards and Interpretations listed below were in issue but not yet effective.
NOTES TO THE FINANCIAL STATEMENTS
For
per
sona
l use
onl
y

Initial application of the following Standards will not affect any of the amounts recognised in the financial report, but will change the disclosures presently made in relation to the Group and the Company’s financial report:
Standard
Effective for annual reporting
periods beginning on or after
Expected to be initially
applied in the financial
year ending
• AASB 101 ‘Presentation of Financial Statements’ (revised September 2007), AASB 2007-8 ‘Amendments to Australian Accounting Standards arising from AASB 101’, AASB 2007-10 ‘Further Amendments to Australian Accounting Standards arising from AASB 101’
1 January 2009 30 June 2010
• AASB 8 ‘Operating Segments’, AASB 2007-3 ‘Amendments to Australian Accounting Standards arising from AASB 8’
1 January 2009 30 June 2010
• AASB 2009-2 ‘Amendments to Australian Accounting Standards – Improving Disclosures about Financial Instruments’
1 January 2009 (and that ends on or after
30 April 2009)
30 June 2010
Initial application of the following Standards/Interpretations is not expected to have any material impact on the financial report of the Group and the Company:
Standard/Interpretation
• AASB 123 ‘Borrowing Costs’ (revised), AASB 2007-6 ‘Amendments to Australian Accounting Standards arising from AASB 123’
1 January 2009 30 June 2010
• AASB 3 ‘Business Combinations’ (revised), AASB 127 ‘Consolidated and Separate Financial Statements’ (revised) and AASB 2008-3 ‘Amendments to Australian Accounting Standards arising from AASB 3 and AASB 127’
Business combinations occurring after the beginning of annual
reporting periods beginning 1 July 2009
30 June 2010
• AASB 2008-1 ‘Amendments to Australian Accounting Standard - Share-based Payments: Vesting Conditions and Cancellations’
1 January 2009 30 June 2010
• AASB 2008-2 ‘Amendments to Australian Accounting Standards - Puttable Financial Instruments and Obligations arising on Liquidation’
1 January 2009 30 June 2010
• AASB 2008-5 ‘Amendments to Australian Accounting Standards arising from the Annual Improvements Project’
1 January 2009 30 June 2010
• AASB 2008-6 ‘Further Amendments to Australian Accounting Standards arising from the Annual Improvements Project’
1 July 2009 30 June 2010
• AASB 2008-7 ‘Amendments to Australian Accounting Standards – Cost of an Investment in a Subsidiary, Jointly Controlled Entity or Associate
1 January 2009 30 June 2010
• AASB 2008-8 ‘Amendments to Australian Accounting Standards – Eligible Hedged Items’
1 July 2009 30 June 2010
• AASB 2009-4 ‘Amendments to Australian Accounting Standards arising from the Annual Improvements Process’
1 July 2009 30 June 2010
• AASB 2009-5 ‘Further Amendments to Australian Accounting Standards arising from the Annual Improvements Process’
1 January 2010 30 June 2011
2. SIGNIFICANT ACCOUNTING POLICIES CONT.
NOTES TO THE FINANCIAL STATEMENTS CONTINUED
39
For
per
sona
l use
onl
y
40
Standard/Interpretation
• AASB 2009-6 “Amendments to Australian Accounting Standards” 1 January 2009 30 June 2010
• AASB 2009-7 “Amendments to Australian Accounting Standards” 1 July 2009 30 June 2010
• AASB 1 ‘First-time Adoption of Australian Accounting Standards’ 1 July 2009 30 June 2010
• AASB Interpretation 15 ‘Agreements for the Construction of Real Estate’ 1 January 2009 30 June 2010
• AASB Interpretation 16 ‘Hedges of a Net Investment in a Foreign Operation’ 1 October 2008 30 June 2010
• AASB Interpretation 17 ‘Distributions of Non-cash Assets to Owners’, AASB 2008-13 ‘Amendments to Australian Accounting Standards arising from AASB Interpretation 17 – Distributions of Non-cash Assets to Owners’
1 July 2009 30 June 2010
• AASB Interpretation 18 ‘Transfers of Assets from Customers’ 1 July 2009 30 June 2010
The following significant accounting policies have been adopted in the preparation and presentation of the financial report:
a) Cash and cash equivalents
Cash comprises cash on hand and demand deposits. Cash equivalents are short-term, highly liquid investments that are readily convertible to known amounts of cash and which are subject to an insignificant risk of changes in value.
b) Employee benefits
A liability is recognised for benefits accruing to employees in respect of wages and salaries, annual leave, long service leave, and sick leave when it is probable that settlement will be required and they are capable of being measured reliably.
Liabilities recognised in respect of employee benefits expected to be settled within 12 months, are measured at their nominal values using the remuneration rate expected to apply at the time of settlement.
Liabilities recognised in respect of employee benefits which are not expected to be settled within 12 months are measured as the present value of the estimated future cash outflows to be made by the consolidated entity in respect of services provided by employees up to reporting date.
Contributions to defined contribution superannuation plans are expensed when incurred.
c) Financial instruments issued by the company
Debt and equity instruments
Debt and equity instruments are classified as either liabilities or as equity in accordance with the substance of the contractual arrangement.
Financial liabilities
Financial liabilities are classified as either financial liabilities ‘at fair value through profit or loss’ or other financial liabilities.
Financial liabilities at fair value through profit or loss
Financial liabilities are classified as at fair value through profit or loss where the financial liability is either held for trading or it is designated as at fair value through profit or loss.
2. SIGNIFICANT ACCOUNTING POLICIES CONT.
For
per
sona
l use
onl
y

A financial liability is held for trading if:• it has been incurred principally for the purpose of repurchasing in the near future; or• it is a part of an identified portfolio of financial instruments that the Group manages together and has a recent
actual pattern of short-term profit-taking; or• it is a derivative that is not designated and effective as a hedging instrument.
A financial liability other than a financial liability held for trading is designated as at fair value through profit or loss upon initial recognition if:• such designation eliminates or significantly reduces a measurement or recognition inconsistency that would
otherwise arise; or• the financial liability forms part of a group of financial assets or financial liabilities or both, which is managed
and its performance evaluated on a fair value basis, in accordance with the Group’s documented risk management or investment strategy, and information about the grouping is provided internally on that basis; or
• it forms part of a contract containing one or more embedded derivatives, and AASB 139 ‘Financial Instruments: Recognition and Measurement’ permits the entire combined contract (asset or liability) to be designated as at fair value through profit or loss.
Financial liabilities at fair value through profit or loss are stated at fair value, with any resultant gain or loss recognised in profit or loss. The net gain or loss recognised in profit or loss incorporates any interest paid on the financial liability. Fair value is determined in the manner described in note 2 (n).
Other financial liabilities
Other financial liabilities, including borrowings, are initially measured at fair value, net of transaction costs.
Other financial liabilities are subsequently measured at amortised cost using the effective interest method, with interest expense recognised on an effective yield basis.
The effective interest method is a method of calculating the amortised cost of a financial liability and of allocating interest expense over the relevant period. The effective interest rate is the rate that exactly discounts estimated future cash payments through the expected life of the financial liability, or, where appropriate, a shorter period.
Transaction costs on the issue of equity instruments
Transaction costs arising on the issue of equity instruments are recognised directly in equity as a reduction of the proceeds of the equity instruments to which the costs relate. Transaction costs are the costs that are incurred directly in connection with the issue of those equity instruments and which would not have been incurred had those instruments not been issued.
Interest and dividends
Interest and dividends are classified as expenses or as distributions of profit consistent with the balance sheet classification of the related debt or equity instruments or component parts of compound instruments.
d) Goods and services tax
Revenues, expenses and assets are recognised net of the amount of goods and services tax (GST), except:
i. where the amount of GST incurred is not recoverable from the taxation authority, it is recognised as part of the cost of acquisition of an asset or as part of an item of expense; or
ii. for receivables and payables which are recognised inclusive of GST.
The net amount of GST recoverable from, or payable to, the taxation authority is included as part of receivables or payables.
Cash flows are included in the cash flow statement on a gross basis. The GST component of cash flows arising from investing and financing activities which is recoverable from, or payable to, the taxation authority is classified as operating cash flows.
2. SIGNIFICANT ACCOUNTING POLICIES CONT.
NOTES TO THE FINANCIAL STATEMENTS CONTINUED
41
For
per
sona
l use
onl
y

42
e) Impairment of assetsAt each reporting date, the consolidated entity reviews the carrying amounts of its tangible and intangible assets to determine whether there is any indication that those assets have suffered an impairment loss. If any such indication exists, the recoverable amount of the asset is estimated in order to determine the extent of the impairment loss (if any). Where the asset does not generate cash flows that are independent from other assets, the consolidated entity estimates the recoverable amount of the cash-generating unit to which the asset belongs.
Recoverable amount is the higher of fair value less costs to sell and value in use. In assessing value in use, the estimated future cash flows are discounted to their present value using a pre-tax discount rate that reflects current market assessments of the time value of money and the risks specific to the asset for which the estimates of future cash flows have not been adjusted.
If the recoverable amount of an asset (or cash-generating unit) is estimated to be less than its carrying amount, the carrying amount of the asset (cash-generating unit) is reduced to its recoverable amount. An impairment loss is recognised in profit or loss immediately.
Where an impairment loss subsequently reverses, the carrying amount of the asset (cash-generating unit) is increased to the revised estimate of its recoverable amount, but only to the extent that the increased carrying amount does not exceed the carrying amount that would have been determined had no impairment loss been recognised for the asset (cash-generating unit) in prior years. A reversal of an impairment loss is recognised in profit or loss immediately.
f) Income taxCurrent taxCurrent tax is calculated by reference to the amount of income taxes payable or recoverable in respect of the taxable profit or tax loss for the period. It is calculated using tax rates and tax laws that have been enacted or substantively enacted by reporting date. Current tax for current and prior periods is recognised as a liability (or asset) to the extent that it is unpaid (or refundable).
Deferred taxDeferred tax is accounted for using the comprehensive balance sheet liability method in respect of temporary differences arising from differences between the carrying amount of assets and liabilities in the financial statements and the corresponding tax base of those items.
In principle, deferred tax liabilities are recognised for all taxable temporary differences. Deferred tax assets are recognised to the extent that it is probable that sufficient taxable amounts will be available against which deductible temporary differences or unused tax losses and tax offsets can be utilised. However, deferred tax assets and liabilities are not recognised if the temporary differences giving rise to them arise from the initial recognition of assets and liabilities (other than as a result of a business combination) which affects neither taxable income nor accounting profit. Furthermore, a deferred tax liability is not recognised in relation to taxable temporary differences arising from goodwill.
Deferred tax liabilities are recognised for taxable temporary differences arising on investments in subsidiaries, branches, associates and joint ventures except where the consolidated entity is able to control the reversal of the temporary differences and it is probable that the temporary differences will not reverse in the foreseeable future. Deferred tax assets arising from deductible temporary differences associated with these investments and interests are only recognised to the extent that it is probable that there will be sufficient taxable profits against which to utilise the benefits of the temporary differences and they are expected to reverse in the foreseeable future.
Deferred tax assets and liabilities are measured at the tax rates that are expected to apply to the period(s) when the asset and liability giving rise to them are realised or settled, based on tax rates (and tax laws) that have been enacted or substantively enacted by reporting date. The measurement of deferred tax liabilities and assets reflects the tax consequences that would follow from the manner in which the consolidated entity expects, at the reporting date, to recover or settle the carrying amount of its assets and liabilities.
Deferred tax assets and liabilities are offset when they relate to income taxes levied by the same taxation authority and the company/consolidated entity intends to settle its current tax assets and liabilities on a net basis.
2. SIGNIFICANT ACCOUNTING POLICIES CONT.
For
per
sona
l use
onl
y

Current and deferred tax for the period
Current and deferred tax is recognised as an expense or income in the income statement, except when it relates to items credited or debited directly to equity, in which case the deferred tax is also recognised directly in equity, or where it arises from the initial accounting for a business combination, in which case it is taken into account in the determination of goodwill or excess.
Tax consolidation
The company and all its wholly-owned Australian resident entities are part of a tax-consolidated group under Australian taxation law. Reed Resources Ltd is the head entity in the tax-consolidated group. Income tax expense/benefit, deferred tax liabilities and deferred tax assets arising from temporary differences of the members of the tax consolidated group are recognised in the separate financial statements of the members of the tax consolidated group using a ‘group allocation’ approach based on the allocation specified in the tax funding arrangement.
The tax funding arrangement requires a notional current and deferred tax calculation for each entity as if it were a taxpayer in its own right, except that unrealised profits, distributions made and received and capital gains and losses and similar items arising on transactions within the tax consolidated group are treated as having no consequence. Current tax liabilities and assets and deferred tax assets arising from unused tax losses and tax credits of the members of the tax consolidated group are recognised by the Company (as head entity in the tax consolidated group).
Due to the existence of a tax funding arrangement between the entities in the tax consolidated group, amounts are recognised as payable to or receivable by the Company and each member of the group in relation to the tax contribution amounts paid or payable between the parent and the other members of the tax consolidated group in accordance with the arrangement.
Where the tax contribution amount recognised by each member of the tax consolidated group for a particular period is different to the aggregate of the current tax liability or asset and any deferred tax asset arising from the unused tax losses and tax credits in respect of that period, the difference is recognised as a contribution from) or distribution to) equity participants.
g) Exploration and evaluation expenditure
Exploration and evaluation expenditures in relation to separate areas of interest are capitalised in the year in which they are incurred and are carried at cost less accumulated impairment losses where the following conditions are satisfied:
i) the rights to tenure of the area of interest are current; and
ii) at least one of the following conditions is also met:- the exploration and evaluation expenditures are expected to be recouped through successful development and exploration of the area of interest, or alternatively, by its sale: or- exploration and evaluation activities in the area of interest have not at the reporting date reached a stage which permits a reasonable assessment of the existence or otherwise of economically recoverable reserves, and active and significant operations in, or in relation to, the area of interest are continuing.
Capitalised exploration costs for each area of interest (considered to be the cash generating unit) are reviewed each reporting date to test whether an indication of impairment exists. If any such indication exists, the recoverable amount of the capitalised exploration costs is estimated to determine the extent of the impairment loss (if any). Where an impairment loss subsequently reverses, the carrying amount of the asset is increased to the revised estimate of its recoverable amount, but only to the extent that the increased carrying amount does not exceed the carrying amount that would have been determined had no impairment loss been recognised for the asset in previous years.
Where a decision is made to proceed with development, accumulated expenditure is tested for impairment and transferred to capitalised development and then amortised over the life of the reserves associated with the area of interest once mining operations have commenced.
2. SIGNIFICANT ACCOUNTING POLICIES CONT.
NOTES TO THE FINANCIAL STATEMENTS CONTINUED
43
For
per
sona
l use
onl
y
44
Development expenditure
Development expenditure is recognised at cost less any impairment losses. Where commercial production in an area of interest has commenced, the associated costs are amortised over the life of the reserves associated with the area of interest. Changes in factors such as estimates of proved and probable reserves that affect unit-of-production calculations are dealt with on a prospective basis.
Provision for restoration and rehabilitation
A provision for restoration and rehabilitation is recognised when there is a present obligation as a result of development, production, transportation or storage activities undertaken, it is probable that an outflow of economic benefits will be required to settle the obligation, and the amount of the provision can be measured reliably. The estimated future obligations include the costs of restoring the affected areas.
The provision for future restoration costs is the best estimate of the present value of the expenditure required to settle the restoration obligation at the reporting date. Future restoration costs are reviewed annually and any changes in the estimate are reflected in the present value of the restoration provision at each reporting date.
The initial estimate of the restoration and rehabilitation provision relating to development is capitalised into the cost of the related asset and depreciated over the estimated remaining life of the asset on a straight line basis. Changes in the estimate of the provision for restoration and rehabilitation are treated in the same manner, except that the unwinding of the effect of discounting on the provision is recognised as a finance cost rather than being capitalised into the cost of the related asset.
h) Payables
Trade payables and other accounts payable are recognised when the consolidated entity becomes obliged to make future payments resulting from the purchase of goods and services.
i) Principles of consolidation
The consolidated financial statements are prepared by combining the financial statements of all the entities that comprise the consolidated entity, being the company (the parent entity) and its subsidiaries as defined in Accounting Standard AASB 127 ‘Consolidated and Separate Financial Statements’. A list of subsidiaries appears in note 24 to the financial statements. Consistent accounting policies are employed in the preparation and presentation of the consolidated financial statements.
On acquisition, the assets, liabilities and contingent liabilities of a subsidiary are measured at their fair values at the date of acquisition. Any excess of the cost of acquisition over the fair values of the identifiable net assets acquired is recognised as goodwill. If, after reassessment, the fair values of the identifiable net assets acquired exceeds the cost of acquisition, the excess is credited to profit and loss in the period of acquisition.
The consolidated financial statements include the information and results of each subsidiary from the date on which the company obtains control and until such time as the company ceases to control such entity.
In preparing the consolidated financial statements, all inter-company balances and transactions, and unrealised profits arising within the consolidated entity are eliminated in full.
j) Property, plant and equipment
Plant and equipment is stated at cost less accumulated depreciation and impairment. Cost includes expenditure that is directly attributable to the acquisition of the item. In the event that settlement of all or part of the purchase consideration is deferred, cost is determined by discounting the amounts payable in the future to their present value as at the date of acquisition.
Depreciation is calculated on a straight line basis so as to write off the net cost or other re-valued amount of each asset over its expected useful life to its estimated residual value. The estimated useful lives, residual values and depreciation method is reviewed at the end of each annual reporting period with the effect of any changes recognised on a prospective basis.
2. SIGNIFICANT ACCOUNTING POLICIES CONT.
For
per
sona
l use
onl
y
The following estimated useful lives are used in the calculation of depreciation:• Furniture & Fittings 5-20 years • Plant and equipment 2-10 years • Buildings 10-20 years
k) Provisions
Provisions are recognised when the consolidated entity has a present obligation, the future sacrifice of economic benefits is probable, and the amount of the provision can be measured reliably.
The amount recognised as a provision is the best estimate of the consideration required to settle the present obligation at reporting date, taking into account the risks and uncertainties surrounding the obligation. Where a provision is measured using the cashflows estimated to settle the present obligation, its carrying amount is the present value of those cashflows.
When some or all of the economic benefits required to settle a provision are expected to be recovered from a third party, the receivable is recognised as an asset if it is virtually certain that recovery will be received and the amount of the receivable can be measured reliably.
l) Revenue recognition
Revenue is measured at the fair value of the consideration received or receivable.
Sale of goods
Revenue from the sale of goods is recognised when the consolidated entity has transferred to the buyer the significant risks and rewards of ownership of the goods.
Dividend and interest revenue
Dividend revenue from investments is recognised when the shareholder’s right to receive the payment has been established. Interest revenue is recognised on a time proportionate basis that takes into account the effective yield on the financial asset.
m) Joint ventures
Jointly controlled assets and operations
Interests in jointly controlled assets and operations are reported in the financial statements by including the consolidated entity’s share of assets employed in the joint ventures, the share of liabilities incurred in relation to the joint ventures and the share of any expenses incurred in relation to the joint ventures in their respective classification categories.
n) Share-based payments
Equity-settled share-based payments granted after 7 November 2002 that vest on or after 1 January 2005, are measured at fair value at the date of grant. Fair value is measured by use of Black Scholes model.
The fair value determined at the grant date of the equity-settled share-based payments is expensed on a straight-line basis over the vesting period, based on the consolidated entity’s estimate of shares that will eventually vest.
o) Financial assets
Subsequent to initial recognition, investments in subsidiaries are measured at cost in the company financial statements.
Other financial assets are classified into the following specified categories: financial assets ‘at fair value through profit or loss’, ‘held-to-maturity investments’, ‘available-for-sale’ financial assets, and ‘loans and receivables’. The classification depends on the nature and purpose of the financial assets and is determined at the time of initial recognition. All of the company/s and group financial assets are classified as Loans and receivables.
2. SIGNIFICANT ACCOUNTING POLICIES CONT.
NOTES TO THE FINANCIAL STATEMENTS CONTINUED
45
For
per
sona
l use
onl
y
46
2. SIGNIFICANT ACCOUNTING POLICIES CONT.
Loans and receivables
Trade receivables, loans, and other receivables that have fixed or determinable payments that are not quoted in an active market are classified as ‘loans and receivables’. Loans and receivables are measured at amortised cost using the effective interest method less impairment.
Interest is recognised by applying the effective interest rate.
Impairment of financial assets
Financial assets, other than those at fair value through profit or loss, are assessed for indicators of impairment at each balance sheet date. Financial assets are impaired where there is objective evidence that as a result of one or more events that occurred after the initial recognition of the financial asset the estimated future cash flows of the investment have been impacted. For financial assets carried at amortised cost, the amount of the impairment is the difference between the asset’s carrying amount and the present value of estimated future cash flows, discounted at the original effective interest rate.
The carrying amount of the financial asset is reduced by the impairment loss directly for all financial assets with the exception of trade receivables where the carrying amount is reduced through the use of an allowance account. When a trade receivable is uncollectible, it is written off against the allowance account. Subsequent recoveries of amounts previously written off are credited against the allowance account. Changes in the carrying amount of the allowance account are recognised in profit or loss.
With the exception of available-for-sale equity instruments, if, in a subsequent period, the amount of the impairment loss decreases and the decrease can be related objectively to an event occurring after the impairment was recognised, the previously recognised impairment loss is reversed through profit or loss to the extent the carrying amount of the investment at the date the impairment is reversed does not exceed what the amortised cost would have been had the impairment not been recognised.
p) Leased assets
Leases are classified as finance leases when the terms of the lease transfer substantially all the risks and rewards incidental to ownership of the leased asset to the lessee. All other leases are classified as operating leases.
Group as lessee
Assets held under finance leases are initially recognised at their fair value or, if lower, at amounts equal to the present value of the minimum lease payments, each determined at the inception of the lease. The corresponding liability to the lessor is included in the balance sheet as a finance lease obligation.
Lease payments are apportioned between finance charges and reduction of the lease obligation so as to achieve a constant rate of interest on the remaining balance of the liability. Finance charges are charged directly against income, unless they are directly attributable to qualifying assets, in which case they are capitalised in accordance with the Group’s general policy on borrowing costs.
Contingent rentals are recognised as expenses in the periods in which they are incurred.
Finance leased assets are amortised on a straight line basis over the estimated useful life of the asset.
Operating lease payments are recognised as an expense on a straight-line basis over the lease term, except where another systematic basis is more representative of the time pattern in which economic benefits from the leased asset are consumed. Contingent rentals arising under operating leases are recognised as an expense in the period in which they are incurred.
For
per
sona
l use
onl
y

3. CRITICAL ACCOUNTING JUDGEMENTS AND KEY SOURCES OF ESTIMATION UNCERTAINTY
In the application of the Group’s accounting policies, which are described in note 2, management is required to make judgments, estimates and assumptions about carrying values of assets and liabilities that are not readily apparent from other sources. The estimates and associated assumptions are based on historical experience and various other factors that are believed to be reasonable under the circumstance, the results of which form the basis of making the judgments. Actual results may differ from these estimates.
The estimates and underlying assumptions are reviewed on an ongoing basis. Revisions to accounting estimates are recognised in the period in which the estimate is revised if the revision affects only that period, or in the period of the revision and future periods if the revision affects both current and future periods.
Critical Judgements in Applying the Entity’s Accounting Policies
The following are the critical judgements that management has made in the process of applying the Group’s accounting policies and that have the most significant effect on the amounts recognised in the financial statements:
a) Impairment of Intercompany Loans
The Company made loans and advances to its subsidiaries as detailed in Note 9 to the financial statements. These loans and advances were established to fund exploration and resource development in the subsidiary. The recovery of these loans and advances is entirely dependent upon returns from the successful development of mining operations or from surpluses from the sale of either the subsidiary companies or their projects.
b) Recovery of Capitalised Exploration Evaluation and Development Expenditure
The Group capitalises exploration, evaluation and development expenditure incurred on ongoing projects. The recoverability of this capitalised exploration expenditure is entirely dependent upon returns from the successful development of mining operations or from surpluses from the sale of the projects or the subsidiary companies that control the projects. At the point that it is determined that any capitalised exploration expenditure is definitely not recoverable, it is written off.
Key areas of estimation uncertainty
The following are key assumptions concerning the future, or other key sources of estimation uncertainty at the balance sheet date, that have a significant risk of causing a material adjustment to the carrying amounts of assets and liabilities within the next financial year.
Capitalised Development and Evaluation Assets
Certain assumptions are required to be made in order to assess the recoverability of long-lived assets. Key assumptions include the future price of gold, future cash flows, an estimated discount rate and estimates of recoverable gold ounces. In addition, cash flows are projected over the life of mine, which is based on indicated ore resources. Estimates of ore are dependent on various assumptions, in addition to those described above, a cut-off grade of 5g/t Au. Changes in these estimates could materially impact on ore reserves, and could therefore affect estimates of future cash flows used in the assessment of recoverable amount.
The Company estimates its mineral resources based on information compiled by Competent Persons (as defined in the JORC code). In estimating the remaining life of the mine for the purpose of amortisation and depreciation calculations, due regard is given, not only to the amount of remaining recoverable gold ounces, but also to limitations which could arise from the potential for changes in technology, demand, and other issues which are inherently difficult to estimate over a lengthy time frame.
Where a change in estimated recoverable gold ounces contained in indicated resources is made, depreciation and amortisation is accounted for prospectively.
The determination of indicated resources and remaining mine life affects the carrying of value of a number of the Consolidated Entity’s assets and liabilities including deferred mining costs and the provision for rehabilitation.
The exploration costs capitalised in relation to the Barrambie project total $5,406,252 and is expected to be recovered in full.
NOTES TO THE FINANCIAL STATEMENTS CONTINUED
47
For
per
sona
l use
onl
y

48
4. LOSS FOR THE YEAR
Consolidated Company
2009$
2008$
2009$
2008$
(a) Revenue
Revenue from operations consisted of the following items:
Revenue from the sale of goods 3,593,481 1,972,498 3,593,481 1,972,498
Interest revenue 885,072 482,971 884,409 482,663
Other 47,706 204 47,706 204
4,526,259 2,455,673 4,525,596 2,455,365
(b) Loss before income tax
Loss before income tax has been arrived at after charging the following expenses:
Finance costs:
Borrowing costs (133,805) (155,761) (1,176) (516)
Provision for rehabilitation (15,957) - (15,957) -
(149,762) (155,761) (17,133) (516)
Cost of goods sold (3,699,519) (1,401,622) (3,699,519) (1,401,622)
Depreciation of non-current assets (102,514) (61,202) (102,514) (61,202)
Employee benefit expense
Share-based payments:
Equity settled share-based payments (146,035) (506,000) (146,035) (506,000)
Defined contribution plans (185,061) (131,426) (185,061) (131,426)
Other employee benefits (1,403,536) (1,070,090) (1,403,536) (1,070,090)
(1,734,632) (1,707,516) (1,734,632) (1,707,516)
For
per
sona
l use
onl
y
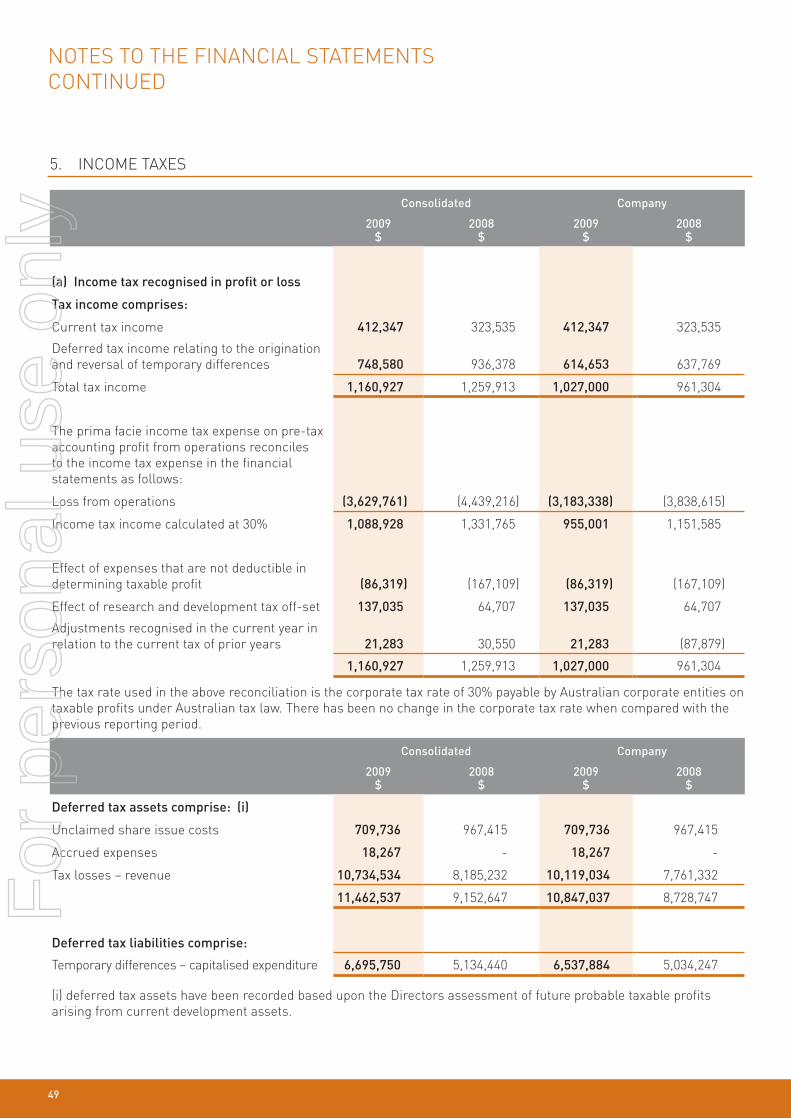
5. INCOME TAXES
Consolidated Company
2009$
2008$
2009$
2008$
(a) Income tax recognised in profit or loss
Tax income comprises:
Current tax income 412,347 323,535 412,347 323,535
Deferred tax income relating to the origination and reversal of temporary differences 748,580 936,378 614,653 637,769
Total tax income 1,160,927 1,259,913 1,027,000 961,304
The prima facie income tax expense on pre-tax accounting profit from operations reconciles to the income tax expense in the financial statements as follows:
Loss from operations (3,629,761) (4,439,216) (3,183,338) (3,838,615)
Income tax income calculated at 30% 1,088,928 1,331,765 955,001 1,151,585
Effect of expenses that are not deductible in determining taxable profit (86,319) (167,109) (86,319) (167,109)
Effect of research and development tax off-set 137,035 64,707 137,035 64,707
Adjustments recognised in the current year in relation to the current tax of prior years 21,283 30,550 21,283 (87,879)
1,160,927 1,259,913 1,027,000 961,304
The tax rate used in the above reconciliation is the corporate tax rate of 30% payable by Australian corporate entities on taxable profits under Australian tax law. There has been no change in the corporate tax rate when compared with the previous reporting period.
Consolidated Company
2009$
2008$
2009$
2008$
Deferred tax assets comprise: (i)
Unclaimed share issue costs 709,736 967,415 709,736 967,415
Accrued expenses 18,267 - 18,267 -
Tax losses – revenue 10,734,534 8,185,232 10,119,034 7,761,332
11,462,537 9,152,647 10,847,037 8,728,747
Deferred tax liabilities comprise:
Temporary differences – capitalised expenditure 6,695,750 5,134,440 6,537,884 5,034,247
(i) deferred tax assets have been recorded based upon the Directors assessment of future probable taxable profits arising from current development assets.
NOTES TO THE FINANCIAL STATEMENTS CONTINUED
49
For
per
sona
l use
onl
y

50
Consolidated Company
2009$
2008$
2009$
2008$
(c) Current tax balances
Current tax assets comprise:
Tax refund receivable 412,348 323,535 412,348 323,535
412,348 323,535 412,348 323,535
Taxable and deductible temporary differences arise from the following:
2009
Consolidated
Opening balance Charged to equity Charged to income Closing balance
$ $ $ $
Gross deferred tax liabilities:
Capitalised expenditure 5,134,440 - 1,561,308 6,695,748
Gross deferred tax assets:
Unclaimed share issue costs 967,415 - (257,680) 709,735
Accrued expenses - - 18,267 18,267
Tax losses - revenue 8,185,232 - 2,549,301 10,734,533
4,018,207 - 748,580 4,766,787
2008
Company
Opening balance Charged to equity Charged to income Closing balance
$ $ $ $
Gross deferred tax liabilities:
Capitalised expenditure 2,927,866 - 2,206,574 5,134,440
Gross deferred tax assets:
Unclaimed share issue costs - 1,234,208 (266,793) 967,415
Tax losses - revenue 4,687,608 - 3,497,624 8,185,232
1,759,742 1,234,208 1,024,257 4,018,207
5. INCOME TAXES CONTINUED
For
per
sona
l use
onl
y
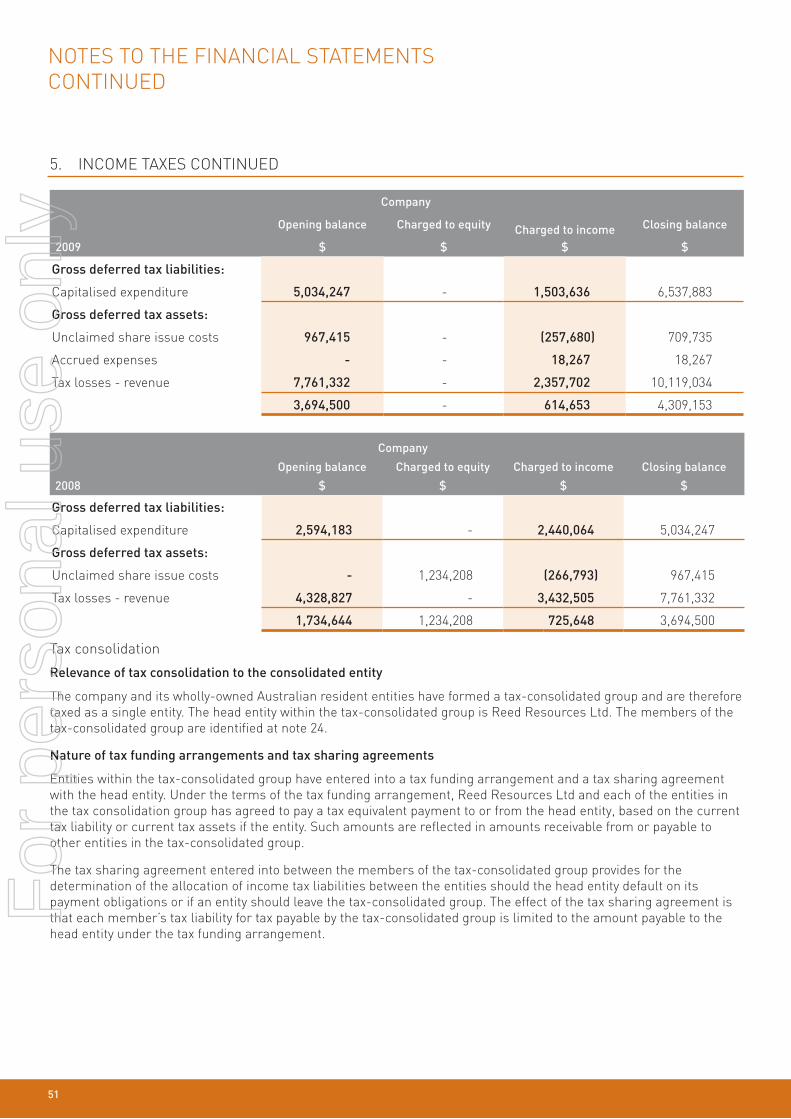
5. INCOME TAXES CONTINUED
2009
Company
Opening balance Charged to equity Charged to income Closing balance
$ $ $ $
Gross deferred tax liabilities:
Capitalised expenditure 5,034,247 - 1,503,636 6,537,883
Gross deferred tax assets:
Unclaimed share issue costs 967,415 - (257,680) 709,735
Accrued expenses - - 18,267 18,267
Tax losses - revenue 7,761,332 - 2,357,702 10,119,034
3,694,500 - 614,653 4,309,153
2008
Company
Opening balance Charged to equity Charged to income Closing balance
$ $ $ $
Gross deferred tax liabilities:
Capitalised expenditure 2,594,183 - 2,440,064 5,034,247
Gross deferred tax assets:
Unclaimed share issue costs - 1,234,208 (266,793) 967,415
Tax losses - revenue 4,328,827 - 3,432,505 7,761,332
1,734,644 1,234,208 725,648 3,694,500
Tax consolidation
Relevance of tax consolidation to the consolidated entity
The company and its wholly-owned Australian resident entities have formed a tax-consolidated group and are therefore taxed as a single entity. The head entity within the tax-consolidated group is Reed Resources Ltd. The members of the tax-consolidated group are identified at note 24.
Nature of tax funding arrangements and tax sharing agreements
Entities within the tax-consolidated group have entered into a tax funding arrangement and a tax sharing agreement with the head entity. Under the terms of the tax funding arrangement, Reed Resources Ltd and each of the entities in the tax consolidation group has agreed to pay a tax equivalent payment to or from the head entity, based on the current tax liability or current tax assets if the entity. Such amounts are reflected in amounts receivable from or payable to other entities in the tax-consolidated group.
The tax sharing agreement entered into between the members of the tax-consolidated group provides for the determination of the allocation of income tax liabilities between the entities should the head entity default on its payment obligations or if an entity should leave the tax-consolidated group. The effect of the tax sharing agreement is that each member’s tax liability for tax payable by the tax-consolidated group is limited to the amount payable to the head entity under the tax funding arrangement.
NOTES TO THE FINANCIAL STATEMENTS CONTINUED
51
For
per
sona
l use
onl
y
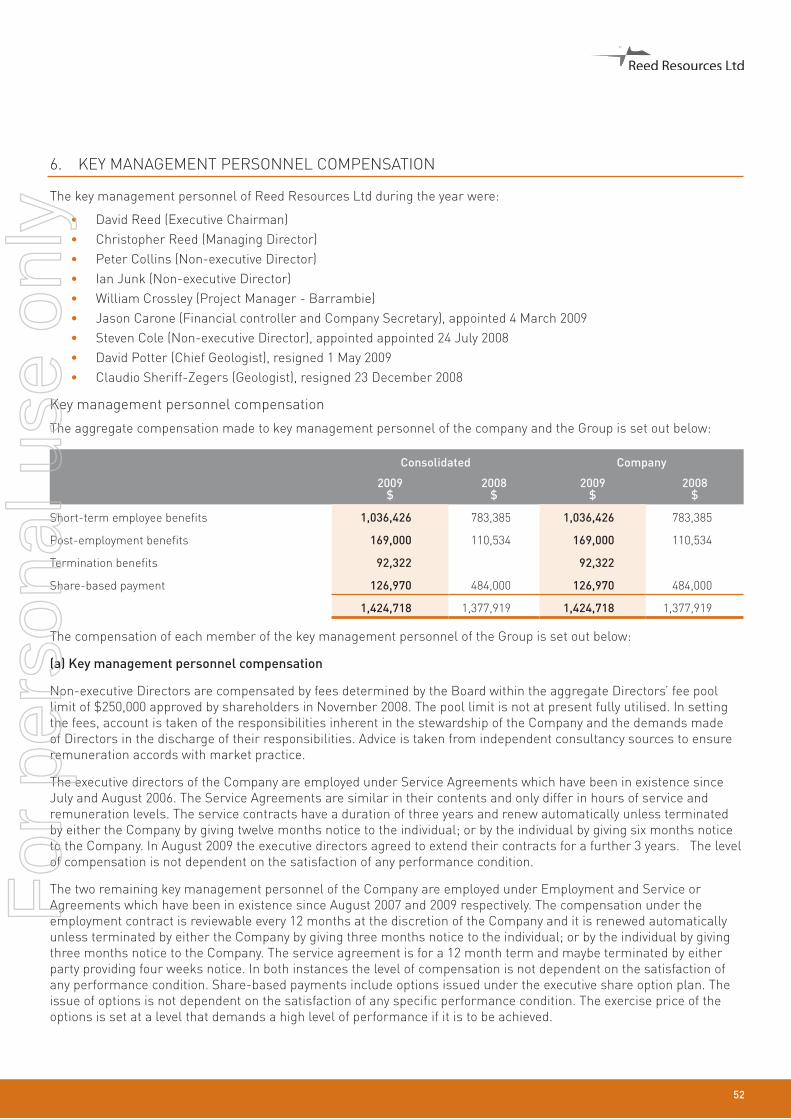
52
6. KEY MANAGEMENT PERSONNEL COMPENSATION
The key management personnel of Reed Resources Ltd during the year were:
• David Reed (Executive Chairman) • Christopher Reed (Managing Director) • Peter Collins (Non-executive Director) • Ian Junk (Non-executive Director)• William Crossley (Project Manager - Barrambie)• Jason Carone (Financial controller and Company Secretary), appointed 4 March 2009• Steven Cole (Non-executive Director), appointed appointed 24 July 2008• David Potter (Chief Geologist), resigned 1 May 2009• Claudio Sheriff-Zegers (Geologist), resigned 23 December 2008
Key management personnel compensation
The aggregate compensation made to key management personnel of the company and the Group is set out below:
Consolidated Company
2009$
2008$
2009$
2008$
Short-term employee benefits 1,036,426 783,385 1,036,426 783,385
Post-employment benefits 169,000 110,534 169,000 110,534
Termination benefits 92,322 92,322
Share-based payment 126,970 484,000 126,970 484,000
1,424,718 1,377,919 1,424,718 1,377,919
The compensation of each member of the key management personnel of the Group is set out below:
(a) Key management personnel compensation
Non-executive Directors are compensated by fees determined by the Board within the aggregate Directors’ fee pool limit of $250,000 approved by shareholders in November 2008. The pool limit is not at present fully utilised. In setting the fees, account is taken of the responsibilities inherent in the stewardship of the Company and the demands made of Directors in the discharge of their responsibilities. Advice is taken from independent consultancy sources to ensure remuneration accords with market practice.
The executive directors of the Company are employed under Service Agreements which have been in existence since July and August 2006. The Service Agreements are similar in their contents and only differ in hours of service and remuneration levels. The service contracts have a duration of three years and renew automatically unless terminated by either the Company by giving twelve months notice to the individual; or by the individual by giving six months notice to the Company. In August 2009 the executive directors agreed to extend their contracts for a further 3 years. The level of compensation is not dependent on the satisfaction of any performance condition.
The two remaining key management personnel of the Company are employed under Employment and Service or Agreements which have been in existence since August 2007 and 2009 respectively. The compensation under the employment contract is reviewable every 12 months at the discretion of the Company and it is renewed automatically unless terminated by either the Company by giving three months notice to the individual; or by the individual by giving three months notice to the Company. The service agreement is for a 12 month term and maybe terminated by either party providing four weeks notice. In both instances the level of compensation is not dependent on the satisfaction of any performance condition. Share-based payments include options issued under the executive share option plan. The issue of options is not dependent on the satisfaction of any specific performance condition. The exercise price of the options is set at a level that demands a high level of performance if it is to be achieved.
For
per
sona
l use
onl
y
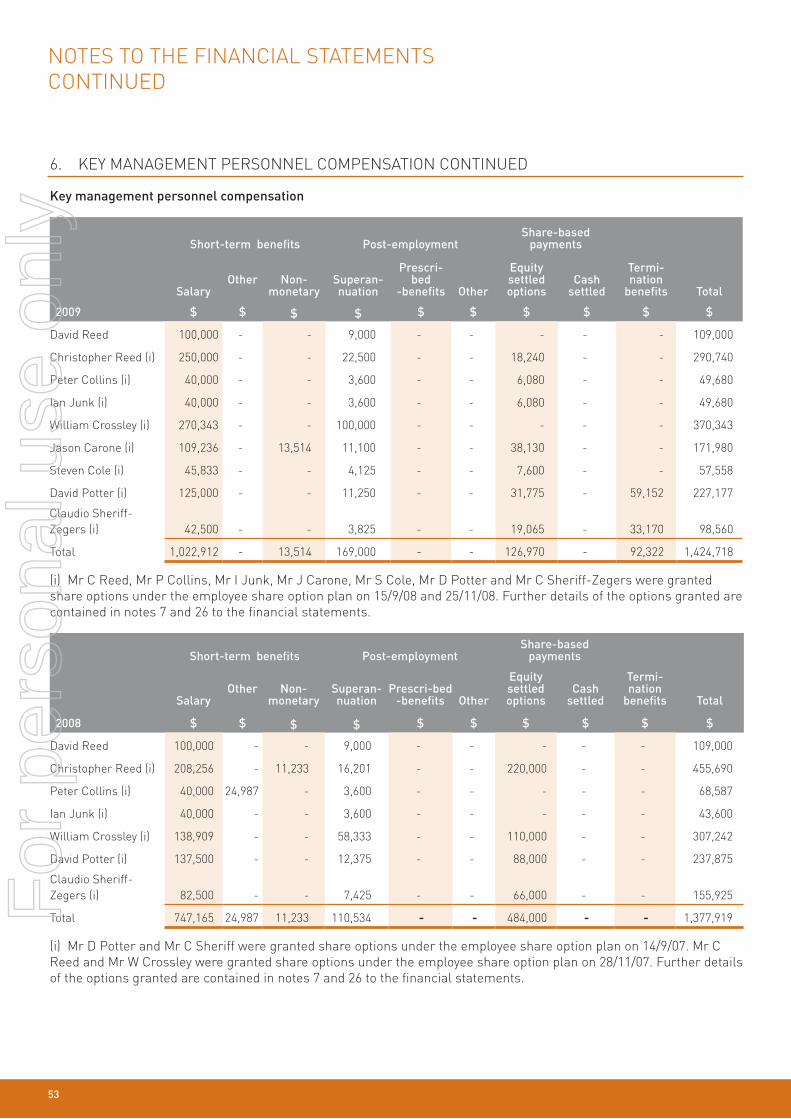
6. KEY MANAGEMENT PERSONNEL COMPENSATION CONTINUED
Key management personnel compensation
2009
Short-term benefits Post-employmentShare-based
payments
Termi-nation
benefits TotalSalary Other Non-
monetarySuperan-nuation
Prescri-bed
-benefits Other
Equity settledoptions
Cash settled
$ $ $ $ $ $ $ $ $ $
David Reed 100,000 - - 9,000 - - - - - 109,000
Christopher Reed (i) 250,000 - - 22,500 - - 18,240 - - 290,740
Peter Collins (i) 40,000 - - 3,600 - - 6,080 - - 49,680
Ian Junk (i) 40,000 - - 3,600 - - 6,080 - - 49,680
William Crossley (i) 270,343 - - 100,000 - - - - - 370,343
Jason Carone (i) 109,236 - 13,514 11,100 - - 38,130 - - 171,980
Steven Cole (i) 45,833 - - 4,125 - - 7,600 - - 57,558
David Potter (i) 125,000 - - 11,250 - - 31,775 - 59,152 227,177
Claudio Sheriff-Zegers (i) 42,500 - - 3,825 - - 19,065 - 33,170 98,560
Total 1,022,912 - 13,514 169,000 - - 126,970 - 92,322 1,424,718
(i) Mr C Reed, Mr P Collins, Mr I Junk, Mr J Carone, Mr S Cole, Mr D Potter and Mr C Sheriff-Zegers were granted share options under the employee share option plan on 15/9/08 and 25/11/08. Further details of the options granted are contained in notes 7 and 26 to the financial statements.
2008
Short-term benefits Post-employmentShare-based
payments
Termi-nation
benefits TotalSalary Other Non-
monetarySuperan-nuation
Prescri-bed -benefits Other
Equity settledoptions
Cash settled
$ $ $ $ $ $ $ $ $ $
David Reed 100,000 - - 9,000 - - - - - 109,000
Christopher Reed (i) 208,256 - 11,233 16,201 - - 220,000 - - 455,690
Peter Collins (i) 40,000 24,987 - 3,600 - - - - - 68,587
Ian Junk (i) 40,000 - - 3,600 - - - - - 43,600
William Crossley (i) 138,909 - - 58,333 - - 110,000 - - 307,242
David Potter (i) 137,500 - - 12,375 - - 88,000 - - 237,875
Claudio Sheriff-Zegers (i) 82,500 - - 7,425 - - 66,000 - - 155,925
Total 747,165 24,987 11,233 110,534 - - 484,000 - - 1,377,919
(i) Mr D Potter and Mr C Sheriff were granted share options under the employee share option plan on 14/9/07. Mr C Reed and Mr W Crossley were granted share options under the employee share option plan on 28/11/07. Further details of the options granted are contained in notes 7 and 26 to the financial statements.
NOTES TO THE FINANCIAL STATEMENTS CONTINUED
53
For
per
sona
l use
onl
y

54
7. SHARE BASED PAYMENTS
Employee and Executive share option plan
Reed Resources Ltd has an ownership based remuneration scheme for executives and employees (including executive directors). In accordance with the provisions of the scheme, as approved by shareholders at an extraordinary general meeting, options were issued during the financial year ended 30 June 2009 to executives and employees with an exercise price of $1.20. One million two hundred and fifty thousand were exercisable at any time on or before 30 June 2013. The number of options granted was calculated by the board after considering the experience of grantee, the current market price and current market practice. Directors’ options vest at the date of their issue and employees’ options vest according to the employee share option plan 2007.
As at 30 June 2009 the Company had issued 7,650,000 share options (30 June 2008: 8,000,000). Share options carry no rights to dividends and no voting rights.
The following share-based payment arrangements were in existence during the period:
Options series Number Grant date Expiry date Exercise price $
Fair value at grant date
$
Issued 3 August 2004 1,750,000 3/8/2004 31/12/2008 $0.35 $0.07
Issued 11 January 2005 250,000 11/1/2005 31/12/2008 $0.35 $0.07
Issued 20 July 2005 1,000,000 20/7/2005 1/7/2010 $0.50 $0.08
Issued 2 August 2006 700,000 2/8/2006 30/12/2011 $0.75 $0.19
Issued 13 December 2006 2,000,000 13/12/2006 30/12/2011 $0.75 $0.19
Issued 28 November 2007 2,000,000 28/11/2007 30/12/2012 $0.85 $0.22
Issued 15 September 2008 1,000,000 15/9/2008 30/6/2013 $1.20 $0.13
Issued 25 November 2008 1,250,000 25/11/2008 30/6/2013 $1.20 $0.03
The weighted average fair value of the share options granted during the financial year is $0.15 (2007: $0.19). The values attributed to the equity options were calculated using the Black Scholes model based on the following input. Expected volatility is based on the historical share price volatility.
Inputs into the model
Option series
20 Jul 2005 2 Aug 2006 13 Dec 200614 Sep 200728 Nov 2007
15 Sep 200825 Nov 2008
Grant date share price $0.27 $0.50 $0.52 $0.61 $0.57, $0.28
Exercise price $0.50 $0.75 $0.75 $0.85 $1.20
Expected volatility 74% 77% 77% 63% 64%, 69%
Option life 5 years 5 years 5 years 5 years 5 Years
Dividend yield - - - - -
Risk-free interest rate 5.34% 5.68% 5.68% 6.27% 6.53%For
per
sona
l use
onl
y

7. SHARE BASED PAYMENTS CONTINUED
The following reconciles the outstanding share options granted under the executive and employee share option plan at the beginning and end of the financial year:
2009 2008
Number of options
Weighted average
exercise price$
Number of optionsWeighted average
exercise price$
Balance at beginning of the financial year 8,000,000 $0.65 5,700,000 $0.57
Granted during the financial year as compensation 2,100,000 $1.20 2,300,000 $0.85
Lapsed during the financial year (i) (2,450,000) - - -
Balance at end of the financial year (ii) 7,650,000 $0.86 8,000,000 $0.65
(i) Lapsed during the financial year There were 2,450,000 share options that lapsed during the financial year (2008: nil).(ii) Balance at end of the financial year The share options outstanding at the end of the financial year had a weighted average exercise price of $0.86 (2008: $0.65), and a weighted average remaining contractual life of 1,137 days (2008: 980 days).
Share based payments
During the year Reed Resources Ltd made share based payments to suppliers for the provision of services. Options were issued during the financial year ended 30 June 2009 to Bryan Smith Geosciences Pty Ltd for services received. The options vest at the date of their issue.
As at 30 June 2009 the Company had issued 6,383,333 share options (30 June 2008: 6,233,333). Share options carry no rights to dividends and no voting rights.
The following share-based payment arrangements were in existence during the period:
Options series Number Grant date Expiry date Exercise priceFair value at grant date
$ $
Issued 3 August 2004 200,000 3/8/2004 31/12/2008 $0.35 $0.07
Issued 24 May 2007 2,000,000 24/5/2007 31/5/2009 $0.60 $0.075
Issued 14 September 2007 200,000 14/9/2007 31/12/2012 $0.85 $0.22
Issued 7 December 2007 2,500,000 7/12/2007 31/12/2009 $0.78 $0.34
Issued 13 June 2008 1,333,333 24/5/2007 30/6/2010 $1.08 $0.60
Issued 15 September 2008 150,000 15/9/2008 30/6/2013 $1.20 $0.13
Inputs into the model Option Series
14 Sep 07 7 Dec 07 13 June 08 15 Sep 08
Grant date share price $0.61 $0.96 $0.90 $0.57
Exercise price $0.85 $0.78 $1.08 $1.20
Expected volatility 63% 63% 199% 64%
Option life 5 Years 2 years 2 years 5 Years
Dividend yield - - - -
Risk-free interest rate 6.27% 6.27% 7.32% 6.53%
NOTES TO THE FINANCIAL STATEMENTS CONTINUED
55
For
per
sona
l use
onl
y

56
7. SHARE BASED PAYMENTS CONTINUED
The following reconciles the outstanding share options granted to suppliers for the provision of services at the beginning and end of the financial year:
2009 2008
Number of options
Weighted average
exercise priceNumber of
options
Weighted average
exercise price
$ $
Balance at beginning of the financial year 6,233,333 $0.79 2,000,000 $0.60
Granted during the financial year as compensation 150,000 $1.20 4,233,333 $0.80
Lapsed during the financial year (2,200,000) $0.60 - -
Balance at end of the financial year 4,183,333 $0.89 6,233,333 $0.79
8. REMUNERATION OF AUDITORS
Consolidated Company
2009$
2008$
2009$
2008$
Auditor of the parent entity(Deloitte Touche Tohmatsu)
Audit or review of the financial report 63,830 64,100 63,830 64,100
Other advice - corporate 9,800 3,675 9,800 3,675
73,630 67,775 73,630 67,775
9. TRADE AND OTHER RECEIVABLES
Consolidated Company
2009$
2008$
2009$
2008$
Current trade and other receivables
Trade receivables 132,281 17,693 3,111 17,693
Other receivables 42,155 69,479 42,155 69,479
Goods and services tax (GST) recoverable 114,259 400,332 114,259 400,191
288,695 487,504 159,525 487,363
Non current trade and other receivables
Amounts receivable from wholly owned subsidiaries - - 2,190,712 1,434,255
The current trade and other receivables relate to monies due from Cliffs and Western Areas in relation to the Mount Finnerty joint venture project. The average credit period is 45 days. These amounts are not past due or impaired. These receivables are not interest bearing. There is no credit risk associated with the receivables as the amounts owing if not received may be offset against future contributions to the joint ventures when requested of the Company. All amounts above are financial assets accounted for at amortised cost.
For
per
sona
l use
onl
y
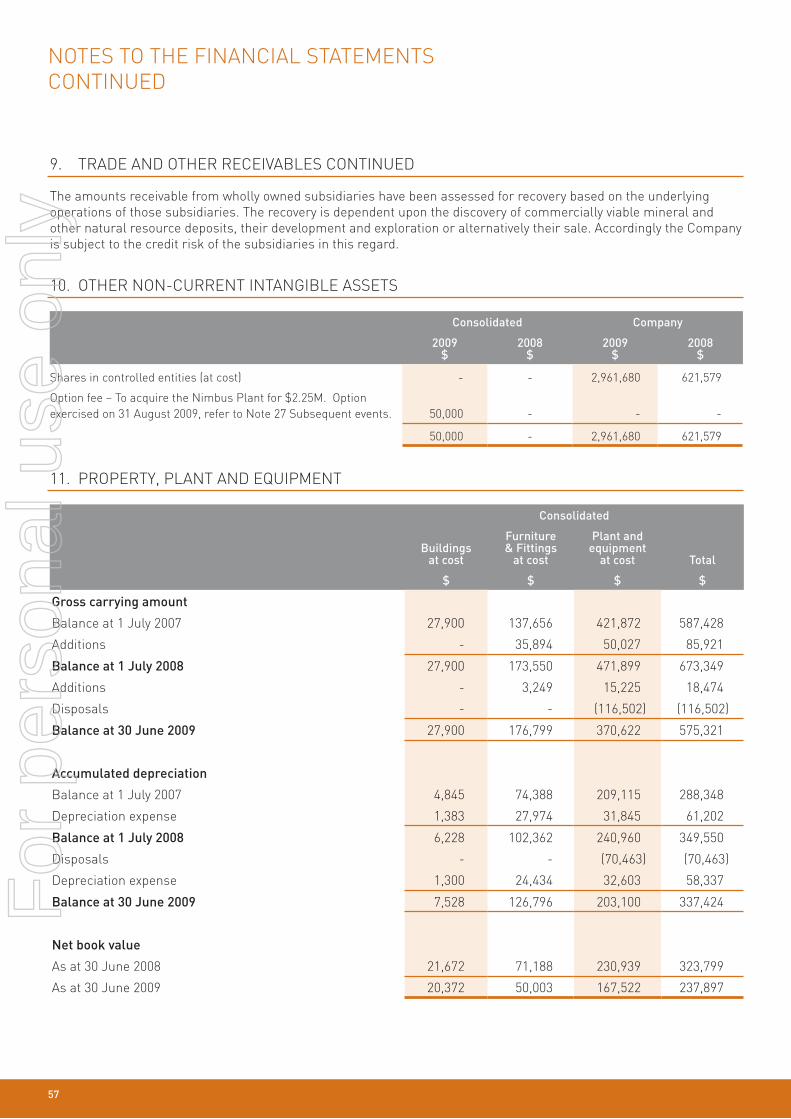
9. TRADE AND OTHER RECEIVABLES CONTINUED
The amounts receivable from wholly owned subsidiaries have been assessed for recovery based on the underlying operations of those subsidiaries. The recovery is dependent upon the discovery of commercially viable mineral and other natural resource deposits, their development and exploration or alternatively their sale. Accordingly the Company is subject to the credit risk of the subsidiaries in this regard.
10. OTHER NON-CURRENT INTANGIBLE ASSETS
Consolidated Company
2009$
2008$
2009$
2008$
Shares in controlled entities (at cost) - - 2,961,680 621,579
Option fee – To acquire the Nimbus Plant for $2.25M. Option exercised on 31 August 2009, refer to Note 27 Subsequent events. 50,000 - - -
50,000 - 2,961,680 621,579
11. PROPERTY, PLANT AND EQUIPMENT
Consolidated
Buildings at cost
Furniture & Fittings
at cost
Plant and equipment
at cost Total
$ $ $ $
Gross carrying amount
Balance at 1 July 2007 27,900 137,656 421,872 587,428
Additions - 35,894 50,027 85,921
Balance at 1 July 2008 27,900 173,550 471,899 673,349
Additions - 3,249 15,225 18,474
Disposals - - (116,502) (116,502)
Balance at 30 June 2009 27,900 176,799 370,622 575,321
Accumulated depreciation
Balance at 1 July 2007 4,845 74,388 209,115 288,348
Depreciation expense 1,383 27,974 31,845 61,202
Balance at 1 July 2008 6,228 102,362 240,960 349,550
Disposals - - (70,463) (70,463)
Depreciation expense 1,300 24,434 32,603 58,337
Balance at 30 June 2009 7,528 126,796 203,100 337,424
Net book value
As at 30 June 2008 21,672 71,188 230,939 323,799
As at 30 June 2009 20,372 50,003 167,522 237,897
NOTES TO THE FINANCIAL STATEMENTS CONTINUED
57
For
per
sona
l use
onl
y
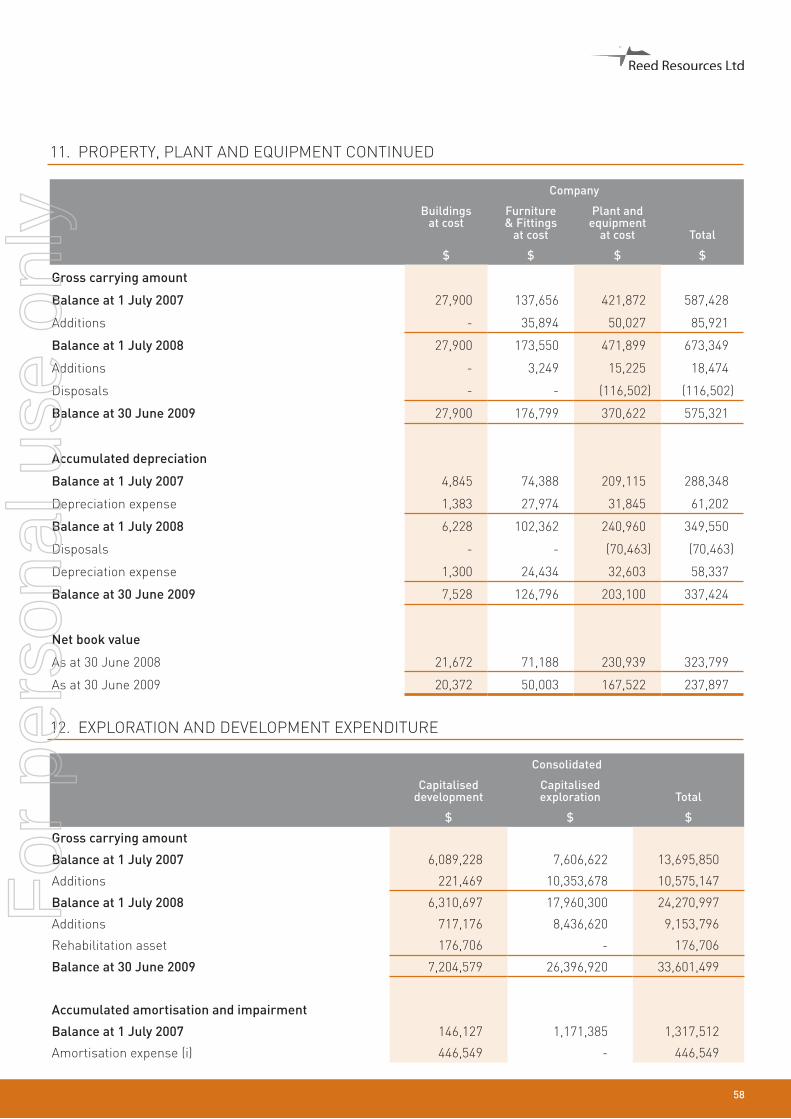
58
Company
Buildings at cost
Furniture & Fittings
at cost
Plant and equipment
at cost Total
$ $ $ $
Gross carrying amount
Balance at 1 July 2007 27,900 137,656 421,872 587,428
Additions - 35,894 50,027 85,921
Balance at 1 July 2008 27,900 173,550 471,899 673,349
Additions - 3,249 15,225 18,474
Disposals - - (116,502) (116,502)
Balance at 30 June 2009 27,900 176,799 370,622 575,321
Accumulated depreciation
Balance at 1 July 2007 4,845 74,388 209,115 288,348
Depreciation expense 1,383 27,974 31,845 61,202
Balance at 1 July 2008 6,228 102,362 240,960 349,550
Disposals - - (70,463) (70,463)
Depreciation expense 1,300 24,434 32,603 58,337
Balance at 30 June 2009 7,528 126,796 203,100 337,424
Net book value
As at 30 June 2008 21,672 71,188 230,939 323,799
As at 30 June 2009 20,372 50,003 167,522 237,897
12. EXPLORATION AND DEVELOPMENT EXPENDITURE
Consolidated
Capitalised development
Capitalised exploration Total
$ $ $
Gross carrying amount
Balance at 1 July 2007 6,089,228 7,606,622 13,695,850
Additions 221,469 10,353,678 10,575,147
Balance at 1 July 2008 6,310,697 17,960,300 24,270,997
Additions 717,176 8,436,620 9,153,796
Rehabilitation asset 176,706 - 176,706
Balance at 30 June 2009 7,204,579 26,396,920 33,601,499
Accumulated amortisation and impairment
Balance at 1 July 2007 146,127 1,171,385 1,317,512
Amortisation expense (i) 446,549 - 446,549
11. PROPERTY, PLANT AND EQUIPMENT CONTINUED
For
per
sona
l use
onl
y

Consolidated
Capitalised development
Capitalised exploration Total
$ $ $
Impairment losses charged to profit (ii) 494,051 1,567,400 2,061,451
Balance at 1 July 2008 1,086,727 2,738,785 3,825,512
Amortisation expense (i) 1,299,742 - 1,299,742
Impairment losses charged to profit (ii) - 310,689 310,689
Depreciation of rehabilitation asset (iii) 44,177 - 44,177
Balance at 30 June 2009 2,430,646 3,049,474 5,480,120
Net book value
As at 30 June 2008 5,223,970 15,221,515 20,445,485
As at 30 June 2009 4,773,933 23,347,446 28,121,379
Company
Capitalised development
Capitalised exploration Total
$ $ $
Gross carrying amount
Balance at 1 July 2007 6,083,678 5,826,124 11,909,802
Additions 221,468 10,297,207 10,518,675
Balance at 1 July 2008 6,305,146 16,123,331 22,428,477
Additions 722,725 5,589,141 6,311,866
Rehabilitation asset 176,706 - 176,706
Balance at 30 June 2009 7,204,577 21,712,472 28,917,049
Accumulated amortisation and impairment
Balance at 1 July 2007 146,127 715,813 861,940
Amortisation expense (i) 446,549 - 446,549
Impairment losses charged to profit (ii) 494,051 1,127,387 1,621,438
Balance at 1 July 2008 1,086,727 1,843,200 2,929,927
Amortisation expense (i) 1,299,742 - 1,299,742
Impairment losses charged to profit (ii) - - -
Depreciation of rehabilitation asset (iii) 44,177 - 44,177
Balance at 30 June 2009 2,430,646 1,843,200 4,273,846
Net book value
As at 30 June 2008 5,218,420 14,280,131 19,498,550
As at 30 June 2009 4,773,931 19,869,272 24,643,203
The recovery of exploration expenditure carried forward is dependent upon the discovery of commercially viable mineral and other natural resource deposits, their development and exploration, or alternatively their sale.(i) Amortisation expense is included in the assessment of ‘cost of sales’. (ii) A detailed review of each tenement within each area of interest has been performed in accordance with the accounting policy detailed in note 1(g). All costs in relation to tenements that are considered to be impaired, including those abandoned or those where operations are not continuing, have been written off.(iii) Depreciation of the rehabilitation asset is included in note 4 under depreciation of non current assets.
12. EXPLORATION AND DEVELOPMENT EXPENDITURE CONTINUED
NOTES TO THE FINANCIAL STATEMENTS CONTINUED
59
For
per
sona
l use
onl
y

60
13 CURRENT TRADE AND OTHER PAYABLES
2009$
2008$
2009$
2008$
Trade and other payables 318,934 1,984,559 249,544 1,925,014
The average credit period on purchases is 2 months. No interest is charged on the trade payables. The Group has financial risk management policies in place to ensure that all payables are paid within the credit timeframe.
14. PROVISIONS
2009$
2008$
2009$
2008$
Provision for rehabilitation 192,665 - 192,665 -
15 ISSUED CAPITAL
Consolidated Company
2009$
2008$
2009$
2008$
137,650,000 fully paid ordinary shares (2008: 135,450,000) 50,277,004 48,881,004 50,277,004 48,881,004
Changes to the then Corporations Law abolished the authorised capital and par value concept in relation to share capital from 1 July 1998. Therefore, the company does not have a limited amount of authorised capital and issued shares do not have a par value.
2009 2008
No. $ No. $
Fully paid ordinary shares
Balance at beginning of financial year 135,450,000 48,881,004 97,016,667 22,728,236
Issue of shares for cash - 38,333,333 28,250,000
Share issue costs - - (3,366,440)
Income tax on items taken directly to equity - - 1,234,208
Issue of shares as part payment for acquisition of private Company 2,000,000 1,340,000 - -
Issue of share as donation 200,000 56,000 - -
Issue of shares under option plan - - 100,000 35,000
Balance at end of financial year 137,650,000 50,277,004 135,450,000 48,881,004
Fully paid ordinary shares carry one vote per share and carry the right to dividends. Share optionsIn accordance with the provisions of the executive share option plan, at 30 June 2008, executives had options over 8,000,000 ordinary shares (all of which were vested) in aggregate, with 2,000,000 of those options expiring on 31/12/2008, 1,000,000 expiring 1/7/2010, 2,700,000 expiring 30/12/2011 and the remainder expiring on 31/12/2012. As at 30 June 2009, executives had options over 7,650,000 ordinary shares (7,311,644 of which are vested) in aggregate, with 1,000,000 of those options expiring 1/7/2010, 2,700,000 expiring 30/12/2011, 2,000,000 expiring 30/12/2012 and the remainder expiring on 30/6/2013. During the year 150,000 options were issued to non-employees as payment for services rendered. As at 30 June 2009 4,183,333 (2008: 6,233,333) options were held by non-employees.
Share options carry no rights to dividends and no voting rights. Further details of the executive share option plan are contained in note 7 to the financial statements.
For
per
sona
l use
onl
y
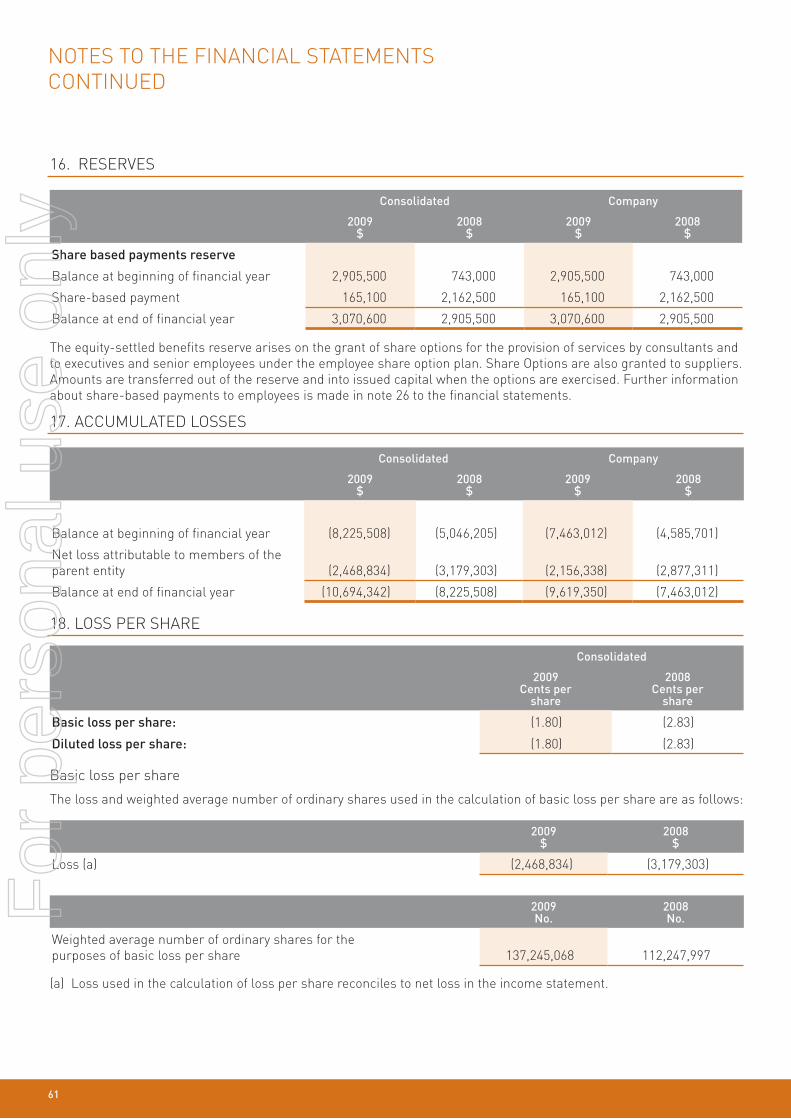
16. RESERVES
Consolidated Company
2009$
2008$
2009$
2008$
Share based payments reserve
Balance at beginning of financial year 2,905,500 743,000 2,905,500 743,000
Share-based payment 165,100 2,162,500 165,100 2,162,500
Balance at end of financial year 3,070,600 2,905,500 3,070,600 2,905,500
The equity-settled benefits reserve arises on the grant of share options for the provision of services by consultants and to executives and senior employees under the employee share option plan. Share Options are also granted to suppliers. Amounts are transferred out of the reserve and into issued capital when the options are exercised. Further information about share-based payments to employees is made in note 26 to the financial statements.
17. ACCUMULATED LOSSES
Consolidated Company
2009$
2008$
2009$
2008$
Balance at beginning of financial year (8,225,508) (5,046,205) (7,463,012) (4,585,701)
Net loss attributable to members of the parent entity (2,468,834) (3,179,303) (2,156,338) (2,877,311)
Balance at end of financial year (10,694,342) (8,225,508) (9,619,350) (7,463,012)
18. LOSS PER SHARE
Consolidated
2009Cents per
share
2008Cents per
share
Basic loss per share: (1.80) (2.83)
Diluted loss per share: (1.80) (2.83)
Basic loss per share
The loss and weighted average number of ordinary shares used in the calculation of basic loss per share are as follows:
2009 $
2008 $
Loss (a) (2,468,834) (3,179,303)
2009 No.
2008 No.
Weighted average number of ordinary shares for the purposes of basic loss per share 137,245,068 112,247,997
(a) Loss used in the calculation of loss per share reconciles to net loss in the income statement.
NOTES TO THE FINANCIAL STATEMENTS CONTINUED
61
For
per
sona
l use
onl
y

62
18. LOSS PER SHARE CONTINUED
Diluted loss per share
The loss and weighted average number of ordinary shares used in the calculation of diluted loss per share are as follows:
2009 $
2008 $
Loss (a) (2,468,834) (3,179,303)
2009 No.
2008 No.
Weighted average number of ordinary shares for the purposes of diluted loss per share (b), (c) 137,245,068 112,247,997
(a) Loss used in the calculation of diluted loss per share reconciles to net loss in the income statement as follows:
2009 $
2008 $
Net loss (2,468,834) (3,179,303)
Loss used in the calculation of diluted EPS (2,468,834) (3,179,303)
(b) The weighted average number of ordinary shares for the purposes of diluted loss per share reconciles to the weighted average number of ordinary shares used in the calculation of basic loss per share as follows:
Consolidated
2009 No.
2008 No.
Weighted average number of ordinary shares used in the calculation of basic EPS 137,245,068 112,247,997
All potential ordinary shares are not dilutive and are therefore excluded in the weighted average number of ordinary shares for the purposes of diluted loss per share.
19. COMMITMENTS FOR EXPENDITURE
(a) Capital expenditure commitments
Barrambie Gas Pty Ltd, a wholly owned subsidiary of the Company, previously entered into a gas transmission agreement with DBNGP (WA) Transmission Pty Ltd for the Barrambie project. As part of the agreement the Company was required to procure a bank guarantee in the amount of $8.7 million from its bankers, which represents the present value of the Company’s commitment under the agreement. The gas transmission and the Company’s commitment does not commence until 1 July 2010.
The Company has approved Portman Iron Ore Limited’s exploration programs for Mt Finnerty for the 2009 calendar year. Accordingly, the Company is committed to exploration expenditure totalling $156,200 in the ensuing six months.
(b) Lease commitments
Finance lease liabilities and non-cancellable operating lease commitments are disclosed in note 21 to the financial statements.
For
per
sona
l use
onl
y

20 CONTINGENT LIABILITIES
Consolidated Company
2009$
2008$
2009$
2008$
Contingent liabilities incurred by the Group arising from interests in joint ventures (i) 80,000 - - -
(i) In consideration of Cliffs agreeing to provide performance bonds totaling $80,000 for the benefit of the Company to the Department of Mines and Petroleum in relation to four Mount Finnerty Project tenements, the Company agrees to unconditionally indemnify Cliffs in respect of any claims made against Cliffs in respect of the performance bonds where such claims arise out of the Company’s activities on those four tenements that are outside the scope of the joint venture and irrespective of whether such activities are undertaken by the Company alone or by a third party with the Company’s consent.
21. LEASES
Finance leases
Leasing arrangements
The finance lease relates to a motor vehicle with a lease term of three years. The consolidated entity has an option to purchase the motor vehicle at the conclusion of the lease agreement.
Finance lease liabilities
Minimum future lease payments Present value of minimum future lease payments
Consolidated Company Consolidated Company
2009 2008 2009 2008 2009 2008 2009 2008
$ $ $ $
No later than 1 year - 18,476 - 18,476 - 16,964 - 16,964
Later than 1 year and not later than 5 years - 9,238 - 9,238 - 9,020 - 9,020
Minimum lease payments* - 27,714 - 27,714 - 25,984 - 25,984
Less future finance charges - 1,730 - 1,730 - - - -
Present value of minimum lease payments - 25,984 - 25,984 - 25,984 - 25,984
* Minimum future lease payments include the aggregate of all lease payments and any guaranteed residual.
Operating leases
Leasing arrangements
2 operating leases relate to commercial premises with lease terms of two years commencing 1 January 2009 with options to extend for a further two years. A further 2 operating leases relate to commercial premises with lease terms of 12 months commencing 1 August 2009 with no options to extend. These operating lease contracts contain annual market value review clauses. The consolidated entity does not have an option to purchase the leased assets at the expiry of the leases.
Consolidated Company
2009$
2008$
2009$
2008$
Non-cancellable operating lease payments
Not longer than 1 year 196,260 104,912 196,260 104,912
Longer than 1 year and not longer than 5 years 84,565 45,202 84,565 45,202
280,825 150,114 280,825 150,114
NOTES TO THE FINANCIAL STATEMENTS CONTINUED
63
For
per
sona
l use
onl
y
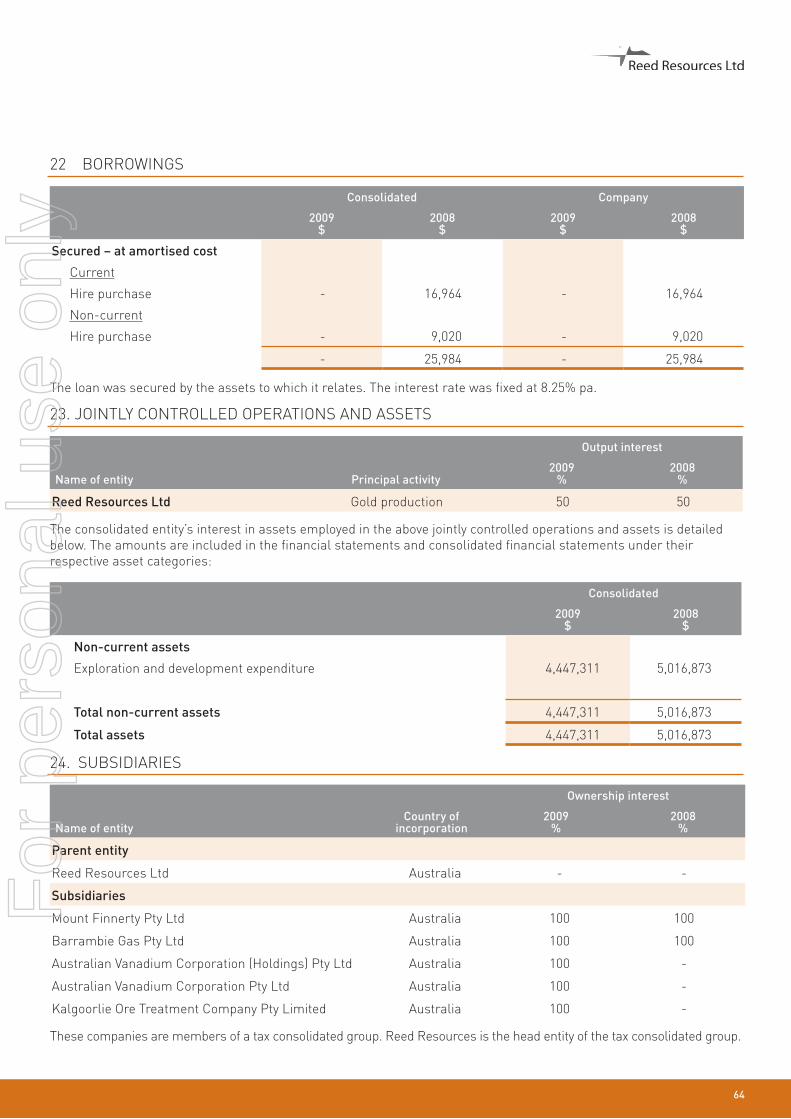
64
22 BORROWINGS
Consolidated Company
2009$
2008$
2009$
2008$
Secured – at amortised cost
Current
Hire purchase - 16,964 - 16,964
Non-current
Hire purchase - 9,020 - 9,020
- 25,984 - 25,984
The loan was secured by the assets to which it relates. The interest rate was fixed at 8.25% pa.
23. JOINTLY CONTROLLED OPERATIONS AND ASSETS
Name of entity Principal activity
Output interest
2009 %
2008 %
Reed Resources Ltd Gold production 50 50
The consolidated entity’s interest in assets employed in the above jointly controlled operations and assets is detailed below. The amounts are included in the financial statements and consolidated financial statements under their respective asset categories:
Consolidated
2009$
2008$
Non-current assets
Exploration and development expenditure 4,447,311 5,016,873
Total non-current assets 4,447,311 5,016,873
Total assets 4,447,311 5,016,873
24. SUBSIDIARIES
Name of entityCountry of
incorporation
Ownership interest
2009 %
2008 %
Parent entity
Reed Resources Ltd Australia - -
Subsidiaries
Mount Finnerty Pty Ltd Australia 100 100
Barrambie Gas Pty Ltd Australia 100 100
Australian Vanadium Corporation (Holdings) Pty Ltd Australia 100 -
Australian Vanadium Corporation Pty Ltd Australia 100 -
Kalgoorlie Ore Treatment Company Pty Limited Australia 100 -
These companies are members of a tax consolidated group. Reed Resources is the head entity of the tax consolidated group.
For
per
sona
l use
onl
y

25. SEGMENT INFORMATION
The consolidated entity operates in one business and one geographical segment, being mineral resource exploration, development and production carried out in Western Australia.
26. RELATED PARTY DISCLOSURES
(a) Equity interests in related parties
Equity interests in subsidiaries
Details of the percentage of ordinary shares held in subsidiaries are disclosed in note 24 to the financial statements.
(b) Key management personnel remuneration
Details of key management personnel remuneration are disclosed in note 6 to the financial statements.
(c) Key management personnel equity holdings
Fully paid ordinary shares of Reed Resources Ltd
2009
Balance@ 1/7/08
Balance on appointment
Received on exercise of
optionsNet other
changeBalance@ 30/6/09
Balance held nominally
No. No. No. No. No. No.
David Reed 20,239,715 - - 1,450,000 21,689,715 -
Christopher Reed 1,823,800 - - 40,000 1,863,800 -
Peter Collins 285,705 - - - 285,705 -
Ian Junk 735,700 - - - 735,700 -
Steven Cole - 1,900 - - 1,900 -
Jason Carone - 10,000 - 128,500 138,500 -
David Potter 76,358 - - (22,222) 54,136 -
Claudio Sheriff-Zegers 12,200 - - - 12,200 -
23,173,478 11,900 - 1,596,278 24,781,656 -
2008
Balance@ 1/7/07
Balance on appointment
Received on exercise of
optionsNet other
changeBalance@ 30/6/08
Balance held nominally
No. No. No. No. No. No.
David Reed 22,939,715 - - (2,700,000) 20,239,715 -
Christopher Reed 1,823,800 - - - 1,823,800 -
Peter Collins 285,705 - - - 285,705 -
Ian Junk 1,035,700 - - (300,000) 735,700 -
David Potter 109,700 - - (33,342) 76,358 -
Claudio Sheriff-Zegers 12,200 - - - 12,200 -
26,206,820 - - (3,033,342) 23,173,478 -
NOTES TO THE FINANCIAL STATEMENTS CONTINUED
65
For
per
sona
l use
onl
y

66
26. RELATED PARTY DISCLOSURES CONTINUEDExecutive share options of Reed Resources Ltd
Bal @ 1/7/08
Granted as remu-neration
Exercised / (lapsed)
Bal @ 30/6/09
Bal vested @ 30/6/09
Vested but not
exercis-able
Vested and
exercis-able
Options vested during
year
2009 No. No. No. No. No. No. No. No.
Christopher Reed 4,000,000 600,000 (1,000,000) 3,600,000 3,600,000 - 3,600,000 600,000
Peter Collins 1,000,000 200,000 (500,000) 700,000 700,000 - 700,000 200,000
Ian Junk 750,000 200,000 (250,000) 700,000 700,000 - 700,000 200,000
David Potter 1,150,000 250,000 (250,000) 1,150,000 1,150,000 164,384 900,000 -
Claudio Sheriff-Zegers 500,000 150,000 (450,000) 200,000 200,000 - 200,000 150,000
Jason Carone - 300,000 - 300,000 197,260 197,260 - -
Steven Cole - 250,000 - 250,000 250,000 - 250,000 250,000
William Crossley 500,000 - - 500,000 500,000 - 500,000 -
Non key management personnel 100,000 150,000 - 250,000 250,000 98,630 100,000 -
8,000,000 2,100,000 (2,450,000) 7,650,000 7,650,000 700,000 6,950,000 1,400,000
Bal @ 1/7/07
Granted as remuneration
Exercised / (lapsed)
Bal @ 30/6/08
Bal vested @ 30/6/08
Vested but not
exercisableVested and exercisable
Options vested
during year
2008 No. No. No. No. No. No. No. No.
Christopher Reed 3,000,000 1,000,000 4,000,000 4,000,000 - 4,000,000 1,000,000
Peter Collins 1,000,000 - 1,000,000 1,000,000 - 1,000,000 -
Ian Junk 750,000 - 750,000 750,000 - 750,000 -
David Potter 750,000 400,000 1,150,000 1,150,000 400,000 750,000 -
Claudio Sheriff-Zegers 200,000 300,000 500,000 500,000 200,000 200,000 -
William Crossley - 500,000 500,000 500,000 - 500,000 500,000
Non key management personnel - 100,000 100,000 100,000 - 100,000 100,000
5,700,000 2,300,000 8,000,000 8,000,000 600,000 7,400,000 1,600,000
All share options issued during the financial year were made in accordance with the provisions of the executive share option plan.
Further details of the executive share option plan and of share options granted during the financial year is contained in notes 6 and 7 to the financial statements.
Consolidated
2008$
2007$
(d) Other transactions with key management personnel The profit from operations includes the following items of revenue and expense that resulted from transactions other than compensation, loans or equity holdings, with key management personnel or their related parties:
Service fees 46,160 46,360
Rent 159,250 137,700
Sale of assets 15,000 -
Consulting fees 31,848 24,987
Royalties 124,404 39,086
Total recognised as expenses 376,662 248,133
For
per
sona
l use
onl
y

26. RELATED PARTY DISCLOSURES CONTINUED
(e) Transactions with other related parties
Other related parties include:• the parent entity;• associates• joint ventures in which the entity is a venturer;• subsidiaries• key management personnel of Reed Resources Ltd• former key management personnel; and• other related parties.
Transactions involving the parent entityThe directors elected for wholly-owned Australian entities within the group to be taxed as a single entity from 1 July 2003.
The parent entity has loaned funds to subsidiaries. The loans totaled $2,190,712 at 30 June 2009 ($1,434,255 at 30 June 2008). These loans are repayable on demand and interest free.
There were no other transactions that occurred during the financial year between entities in the wholly owned group.
Transactions involving other related parties
Reed Resources Ltd has entered into arrangements with Trucking Nominees Pty Ltd, a company associated with Mr. D Reed, for the provision of offices and office equipment in West Perth and Kalgoorlie at cost plus 5%. The total amount for the year was $205,410 (2008: $184,060), being rent and service fees.
Mr. P Collins provides geological consulting services to the Company. The total amount for the year was $31,848 (2008: $24,987).
One vehicle was sold to a director and one to an employee of the Company at market value.
Reed Resources Ltd has a royalty agreement with MTAB Pty Ltd which is a company controlled by David Reed.
The above amounts were made for services rendered in the ordinary course of business and on normal commercial terms and conditions.
(f) Controlling entities
The parent entity in the group is Reed Resources Ltd a company incorporated in Australia.
27. SUBSEQUENT EVENTS
On 15 July 2009, the Company issued 500,000 ordinary shares in the Company to Breakaway Resources Limited pursuant to the terms of a sale agreement of the same date for the sale and purchase of a joint venture interest located in close proximity to the Company’s Mount Finnerty project tenements. In addition, on this date the Company issued 400,000 ordinary shares in the Company to a consultant to the Company pursuant to the terms of the consulting agreement entered into.
On 11 August 2009, the Company requested that the ASX put an immediate halt on the trading of the Company’s shares pending the announcement of an asset acquisition. Following this, the Company announced on 13 August 2009 that it had secured an option to acquire a goldfields lithium project at a cost of $200,000. On 21 August 2009, the Company requested that the ASX put an immediate halt on the trading of the Company’s shares pending an announcement of a capital raising. The Company announced to the market on 25 August 2009 the details of a $10.9M capital raising through a $6.4M placement (“Placement”) to institutional and qualified investors and a $4.5M share purchase plan. The lead manager and underwriter of the capital raising was Patersons Securities Ltd. The funds raised will be applied to advance the Mount Marion Lithium and Barrambie vanadium projects.
NOTES TO THE FINANCIAL STATEMENTS CONTINUED
67
For
per
sona
l use
onl
y

68
27. SUBSEQUENT EVENTS CONTINUED
On 31 August 2009, the Company also exercised its option to acquire the Nimbus plant using funds raised in the Placement and the transaction was completed on 4 September 2009 with the payment of the purchase price of $2.25M. On 7 September 2009, 1,600,000 options were issued to three employees and one consultant of the Company pursuant to the Company’s employee share option plan. The exercise price of the options is $0.80 and the expiry date for the exercise of the options is 31 December 2013.
28. NOTES TO THE CASH FLOW STATEMENT
Consolidated Company
2009$
2008$
2009$
2008$
(a) Reconciliation of cash and cash equivalents
For the purposes of the cash flow statement, cash and cash equivalents includes cash on hand and in banks and investments in money market instruments, net of outstanding bank overdrafts. Cash and cash equivalents at the end of the financial year as shown in the cash flow statement is reconciled to the related items in the balance sheet as follows:
Cash and cash equivalents 9,287,755 19,973,009 9,255,945 19,890,909
(b) Cash balances not available for use
Cash restrictions exist on $8,765,000 of the cash balance as at 30 June 2009. The cash restrictions relates to unconditional performance bonds issued by National Australia Bank in favour of the Minister of State Development and DBNGP (WA) Transmission Pty Ltd. Two separate term deposits of $65,000 and $8,700,000 respectively have been restricted in their use to ensure they serve as guarantees for the bonds.
Consolidated Company
2009$
2008$
2009$
2008$
(c) Reconciliation of loss for the period to net cash flows from operating activities
Loss for the period (2,468,834) (3,179,303) (2,156,338) (2,877,311)
(Gain)/loss on sale of or disposal of non-current assets (302) - (302) -
Depreciation of non-current assets 102,514 61,202 102,514 61,202
Amortisation of non-current assets 1,299,742 446,549 1,299,742 446,549
Equity settled share-based payment 221,100 506,000 221,100 506,000
Impairment of non-current assets 310,689 2,061,451 - 1,621,438
(Increase) / decrease in current tax asset (88,813) 87,490 (88,813) 87,490
(Increase) / decrease in deferred tax asset (748,500) (936,378) (614,653) (637,769)
Decrease / (Increase) in assets:
Current receivables 310,315 (215,432) 310,172 (215,432)
For
per
sona
l use
onl
y

Consolidated Company
2009$
2008$
2009$
2008$
Decrease / (Increase) in liabilities:
Current payables (36,015) 114,219 (36,015) 54,675
Other non-cash expenses 22,375 - 22,375 -
Net cash from operating activities (1,075,808) (1,054,201) (940,217) (953,157)
(d) Non cash financing and investing activities
On 1 September 2008, the Company issued 2,000,000 fully paid ordinary shares at $0.67 per share, as part consideration for the purchase of Shares in Australian Vanadium Corporation Pty Ltd.
29. FINANCIAL INSTRUMENTS
Cash restrictions exist on $8,765,000 of the cash balance as at 30 June 2009. The cash restrictions relates to unconditional performance bonds issued by National Australia Bank in favour of the Minister of State Development and DBNGP (WA) Transmission Pty Ltd. Two separate term deposits of $65,000 and $8,700,000 respectively have been restricted in their use to ensure they serve as guarantees for the bonds.
(a) Financial risk management objectives
The consolidated entity does not enter into or trade financial instruments, including derivative financial instruments, for speculative purposes.
(b) Significant accounting policies
Details of the significant accounting policies and methods adopted, including the criteria for recognition, the basis of measurement and the basis on which income and expenses are recognised, in respect of each class of financial asset, financial liability and equity instrument are disclosed in note 2 to the financial statements.
Maturity profile of financial instruments
The Company’s interest rate exposure is limited to the restricted term deposit in the amount of $8.7 million. For every 1% change in interest rates, interest income may increase or decrease by $87,000 per annum. To maximise exposure to increases in interest rates the deposit has been placed on a monthly rolling term deposit.
The following tables detail the exposure to interest rate risk:
Consolidated
2009
Weighted average effective interest
rate
Variable interest
rate
Maturity dates
Non interest bearing Total
Less than 1 year 1-5 years
More than 5 years
% $ $ $ $ $ $
Financial assets:
Cash and cash equivalents 3.2 - 9,286,650 - - 1,105 9,287,755
Trade and other receivables - - - - - 288,695 288,695
Financial liabilities:
Trade payables - - - - - 318,934 318,934
28. NOTES TO THE CASH FLOW STATEMENT CONTINUED
NOTES TO THE FINANCIAL STATEMENTS CONTINUED
69
For
per
sona
l use
onl
y

70
29. FINANCIAL INSTRUMENTS CONTINUED
Consolidated
2008
Weighted average effective interest
rate
Variable interest
rate
Maturity dates
Non interest bearing Total
Less than 1 year 1-5 years
More than 5 years
% $ $ $ $ $ $
Financial assets:
Cash and cash equivalents 7.3 - 19,973,005 - - 4 19,973,009
Trade and other receivables - - - - - 487,504 487,504
Financial liabilities:
Trade payables - - - - - 1,984,559 1,984,559
Borrowings - - - - - 16,964 16,964
Company
2009
Weighted average effective interest
rate
Variable interest
rate
Maturity dates
Non interest bearing Total
Less than 1 year 1-5 years
More than 5 years
% $ $ $ $ $ $
Financial assets:
Cash and cash equivalents 3.2 - 9,255,943 - - 2 9,255,945
Trade and other receivables - - - - - 2,350,237 2,350,237
Financial liabilities:
Trade payables - - - - - 249,544 249,544
Company
2008
Weighted average effective interest
rate
Variable interest
rate
Maturity dates
Non interest bearing Total
Less than 1 year 1-5 years
More than 5 years
% $ $ $ $ $ $
Financial assets:
Cash and cash equivalents 7.3 - 19,890,907 - - 2 19,890,909
Trade and other receivables - - - - - 1,921,618 1,921,618
Financial liabilities:
Trade payables - - - - - 1,925,014 1,925,014
For
per
sona
l use
onl
y

29. FINANCIAL INSTRUMENTS CONTINUED
(c) Credit risk management
Credit risk refers to the risk that a counterparty will default on its contractual obligations resulting in financial loss to the consolidated entity. The consolidated entity has adopted a policy of only dealing with creditworthy counterparties and obtaining sufficient collateral where appropriate, as a means of mitigating the risk of financial loss from defaults. The consolidated entity exposure and the credit ratings of its counterparties are continuously monitored and the aggregate value of transactions concluded are spread amongst approved counterparties.
The consolidated entity does not have any significant credit risk exposure to any single counterparty or any group of counterparties having similar characteristics. The credit risk on liquid funds is limited because the counterparties are banks with high credit-ratings assigned by international credit-rating agencies.
(d) Liquidity risk management
Ultimate responsibility for liquidity risk management rests with the board of directors, who has built an appropriate liquidity risk management framework for the management of the Group’s short, medium and long-term funding and liquidity management requirements. The Group manages liquidity risk by maintaining adequate reserves, banking facilities and reserve borrowing facilities by continuously monitoring forecast and actual cash flows and matching the maturity profiles of financial assets and liabilities.
(e) Fair value
The carrying amount of financial assets and financial liabilities recorded in the financial statements approximates their respective net fair values, other than intercompany loans from the company to its subsidiaries determined in accordance with the accounting policies disclosed in Note 2 to the financial statements.
(f) Commodity Price Risk
The Group is exposed to gold and other commodity price risk. These commodity prices can be volatile and are influenced by factors beyond the Group’s control. No hedging or derivative transactions have been used to manage commodity price risk.
(g) Capital Management
The Board’s policy is to maintain a strong capital base so as to maintain investor, creditor and market confidence and to sustain future development of the business. Given the stage of development of the Group, the Board’s objective is to minimise debt and to raise funds as required through the issue of new shares. There were no changes in the Group’s approach to capital management during the year. The Group is not subject to externally imposed capital requirements.
NOTES TO THE FINANCIAL STATEMENTS CONTINUED
71
For
per
sona
l use
onl
y
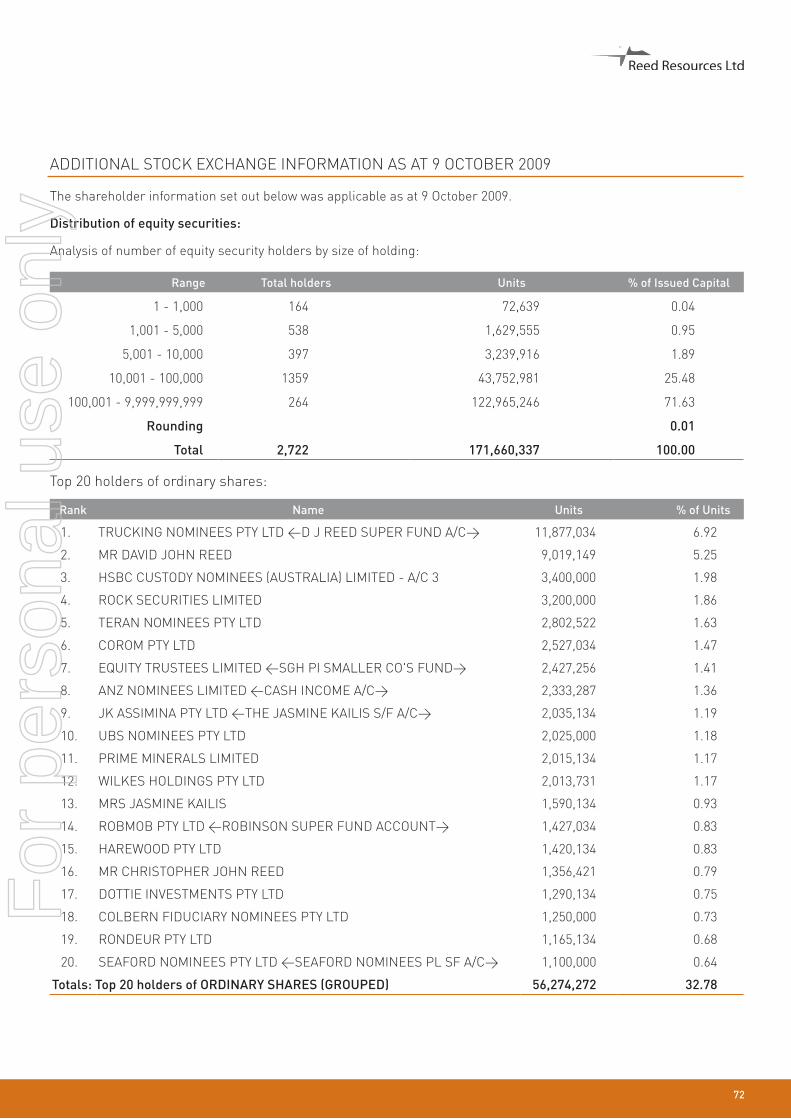
72
ADDITIONAL STOCK EXCHANGE INFORMATION AS AT 9 OCTOBER 2009
The shareholder information set out below was applicable as at 9 October 2009.
Distribution of equity securities:
Analysis of number of equity security holders by size of holding:
Range Total holders Units % of Issued Capital
1 - 1,000 164 72,639 0.04
1,001 - 5,000 538 1,629,555 0.95
5,001 - 10,000 397 3,239,916 1.89
10,001 - 100,000 1359 43,752,981 25.48
100,001 - 9,999,999,999 264 122,965,246 71.63
Rounding 0.01
Total 2,722 171,660,337 100.00
Top 20 holders of ordinary shares:
Rank Name Units % of Units
1. TRUCKING NOMINEES PTY LTD <D J REED SUPER FUND A/C> 11,877,034 6.92
2. MR DAVID JOHN REED 9,019,149 5.25
3. HSBC CUSTODY NOMINEES (AUSTRALIA) LIMITED - A/C 3 3,400,000 1.98
4. ROCK SECURITIES LIMITED 3,200,000 1.86
5. TERAN NOMINEES PTY LTD 2,802,522 1.63
6. COROM PTY LTD 2,527,034 1.47
7. EQUITY TRUSTEES LIMITED <SGH PI SMALLER CO'S FUND> 2,427,256 1.41
8. ANZ NOMINEES LIMITED <CASH INCOME A/C> 2,333,287 1.36
9. JK ASSIMINA PTY LTD <THE JASMINE KAILIS S/F A/C> 2,035,134 1.19
10. UBS NOMINEES PTY LTD 2,025,000 1.18
11. PRIME MINERALS LIMITED 2,015,134 1.17
12. WILKES HOLDINGS PTY LTD 2,013,731 1.17
13. MRS JASMINE KAILIS 1,590,134 0.93
14. ROBMOB PTY LTD <ROBINSON SUPER FUND ACCOUNT> 1,427,034 0.83
15. HAREWOOD PTY LTD 1,420,134 0.83
16. MR CHRISTOPHER JOHN REED 1,356,421 0.79
17. DOTTIE INVESTMENTS PTY LTD 1,290,134 0.75
18. COLBERN FIDUCIARY NOMINEES PTY LTD 1,250,000 0.73
19. RONDEUR PTY LTD 1,165,134 0.68
20. SEAFORD NOMINEES PTY LTD <SEAFORD NOMINEES PL SF A/C> 1,100,000 0.64
Totals: Top 20 holders of ORDINARY SHARES (GROUPED) 56,274,272 32.78
For
per
sona
l use
onl
y

SUBSTANTIAL HOLDERS
Substantial holders in the company are set out below:
Ordinary Shares Number Held Percentage
D J REED 21,750,251 12.67%
Voting Rights
The voting rights attaching to ordinary shares are set out below:
On a show of hands every member present at a meeting in person or by proxy shall have one vote and upon a poll each share shall have one vote.
Other
The name of the company’s joint company secretaries are Mr Christopher Reed and Mr Jason Carone.
The address of the principal registered office in Australia is:
97 Outram Street, West Perth, Western Australia 6005.
Telephone: (08) 9322 1182,
Facsimile (08) 9321 0556,
Website www.reedresources.com
Registers of securities are held at the following addresses
97 Outram Street, West Perth, Western Australia 6005
Quotation has been granted for all ordinary shares of the company on all Member Exchanges of the Australian Stock Exchange Limited.
73
For
per
sona
l use
onl
y

Reed Resources Ltd
For
per
sona
l use
onl
y

ANNUAL REPORT 2008www.reedresources.com
Reed Resources Ltd
Registered office:97 Outram St West Perth WA 6005
T: +61 8 9322 1182 F: +61 8 9321 0556
Kalgoorlie office:69 Hannan St Kalgoorlie WA 6430
T: +61 8 9022 2626 F: +61 8 9021 1011
www.reedresources.com
For
per
sona
l use
onl
y