reduction of fluorescence interference in raman ...mccreery/rlm publication pdfs/mccreery113.… ·...
TRANSCRIPT

Anal. Chem. 1994,66, 4159-4165
Reduction of Fluorescence Interference in Raman Spectroscopy via Analyte Adsorption on Graphitic Carbon
Mark R. Kagan and Richard L. McCreery*
Depatfment of Chemistry, The Ohio State University, 120 West 18th Avenue, Columbus, Ohio 43210
Raman spectra of normally fluorescent materials were obtained by quenching the fluorescence through adsorp- tion on carbon surfaces. Energy transfer from the excited state to the carbon surface greatly reduced the fluores- cence of rhodamine 6G and the near-IR laser dye IR125, and Raman spectra with high S/N were obtained from the adsorbed molecules. Strong resonance enhancement of Raman scattering was observed, and monolayer films of R6G were observed. R6G exhibited hgmuirian adsorp- tion behavior, with saturation coverage occuring at -0.5 mM in methanol. The technique was also successfully applied to bis(methylstyry1)benne (BMB) and fluoran- thene, which are less fluorescent but also much weaker scatterers. Since the laser wavelengths yielding resonance enhancement are in the same range as those producing fluorescence, adsorption to carbon permits elimination of fluorescence without loss of resonance enhancement. The porous graphite substrate has the added advantage of high microscopic surface area, low elastic background, and propensity to adsorb a wide range of organic materi- als. With care, it was possible to observe Raman features from monolayers of materials having cross sections com- parable to that of benzene, such as the 1205 cm-' peak of BMB.
Raman spectroscopy has several attractive features as an analytical technique: high information content and molecular speciiicity, compatibility with common optical materials, including optical fibers, linearity of signal with concentration, and the ability to selectively monitor resonance-enhanced scatterer^.'-^ In cases involving surface and resonance enhancement, Raman spectra can be obtained on very small amounts of analyte, often at nanomolar levels in solution6 or submonolayers on surface^.^-'^ However, Raman scattering has not been used widely as an analytical technique for several fundamental and practical reasons. The
(1) Campion, A,; Perry, S. Laser Focus World 1990 (August), 113-123. (2) Packard, R T.; McCreery, R L. Anal. Chem. 1989, 61, 775A-789A. (3) Grasselli. T. G.; Bulkin, B. J. Analytical Raman Spectroscopy; Wiley: New
(4) Campion, A,; Woodruff, W. H. Anal. Chem. 1987 59, 1299A-1308A. (5) McCreery, R L. CCD Array Detectors for Multichannel Raman Spectroscopy.
In Charge Transfer Devices in Spectroscopy; Sweedler, J., Ratzlaff, K, Denton, M. Eds.; VCH: New York, 1994; pp 227-279.
York, 1991.
(6) Schwab, S. D.; McCreery, R. L. Appl. Spectrosc. 1987, 41, 126-130. (7) Van Duyne, R. P. In Chemical and Biological Applications oflasen; Moore,
(8) Campion, A; Brown, J.; Grizzle, W. H. Surf: Sci. 1982, 115, L153-Ll58. (9) Dierker, S. B.; Murray, C. A.; LeGrange, J. D.; Schlotter, N. E. Chem. Phys.
L. B., Ed.; Academic: NewYork, 1979; Vol. 4, Chapter 4.
Lett. 1987 137, 453-457. (10) Bryant, M.; Pemberton, J.J Am. Chem. SOC. 1991, 113, 3629-3637.
0003-2700/94/0366-4159$04.50/0 0 1994 American Chemical Society
generally low cross sections for Raman scattering lead to very weak signals for most samples. Until the devlopment of CCD detectors and efficient Raman spectrometers, Raman instrumenta- tion was expensive and difficult to use compared to W-visible or FT-IR spectrometers. Even when the instrumental difficulties and small cross sections are accommodated, fluorescence interfer- ence is often a severe problem. Even weak fluoresence from the analyte or impurities in the sample is often much stronger than the Raman scattering, resulting in a large background. Once the shot noise on the fluorescence background becomes large relative to the Raman signal, the fluorescence can no longer be subtracted effectively. The combination of weak scattering, instrumental complexity, and fluorescence interference has prevented Raman spectroscopy from being applied routinely for qualitative or quantitative analysis.
Several approaches for reducing fluorescence have been described, including UV excitation,ll time-resolved dete~tion, '~, '~ quenching with added reagents, and photolytic destruction of fluorescent imp~rit ies. '~ Of particular relevance here are surface quenching and near-IR excitation. When an analyte is deposited on a metal, the fluorescence is quenched by energy transfer from the excited state to the net tal.*^-'^ If the metal surface is rough, the Raman intensity can be surface enhanced,I8 although rough- ened metals can also lead to enhanced f l ~ o r e s e n c e . ~ ~ ~ ~ ~ ~ ~ ~ A different approach is excitation with near-infrared (780-1064 nm) lasers. FT-Raman with 1064 nm excitation has proven very useful, mainly because the longer laser wavelength excites fluorescence in many fewer sample^.^'-^^ This broader applicability has stimulated the development of commercial FT-Raman systems by at least five manufacturers. Operation in the 780-830 nm range also results in reduction of fluorescence, while also permitting lower detection limits through the use of silicon-based CCD detector^.^^-^^
(11) Asher. S. Anal. Chem. 1993, 65, 59A-66A. (12) Gustafson, T. L.; Lytle, F. E. Anal. Chem. 1982, 54, 634-637. (13) Burgess, S.; Shepherd, I. W. J. Phys. E 1977, 10, 617. (14) Strommen, D.; Nakamoto, K. Laboratory Raman Spectroscopy; Wiley: New
(15) Chance, R R.; Prock, A.; Silbey, R. Ado. Chem. Phys., 1978, 37, 1-65. (16) Ritchie, G.; Burstein, E. Phys. Rev. B 1981, 24, 4843-4846. (17) Tanimura, K; Kawal, T.; Sakata, T. J. Phys. Chem. 1980, 84, 751-756. (18) Chang, R IC; Furtak, T. E. Surface Enhanced Raman Spectroscopy; Plenum:
(19) Aussenegg, F. R; Leitner, A; Lippitsch, M. E.; Reinisch, H.; Riegler, M.
(20) Garoff, S.; Stephens, R B.; Hanson, C. D.; Sorenson, G. K 0pt.Commun.
(21) Chase, D. B. J. Am. Chem. SOC. 1986, 108, 7485-7488. (22) Chase, D. B. Anal. Chem. 1987, 59, 881A-889A. (23) Schrader, B.; Hoffman, A; Simon, A,; Sawatzki, J. Kb. Spectrosc. 1991, 1,
York, 1984; pp 94-95.
New York, 1982.
Surf: Sci. 1987, I89/190, 935-945.
1982, 41 (4), 257-262.
239-250.
Analytical Chemistry, Vol. 66, No. 23, December 1, 1994 4159
Avoidance of fluorescence by long-wavelength excitation is not without a cost in sensitivity, however. Normal Raman scattering intensity decreases with l/A4, leading to a factor of 18 less scattering at 1064 nm than at 514.5 nm. Silicon CCD detectors have a lower quantum efficiency in the 800- 1000 nm region than in the visible and cannot detect light above 1.1 pm at all. The available detectors for FT-Raman have good quantum efficiency (-0.7), but high dark signal and accompanying noise. Finally, resonance Raman enhancement depends on the same electronic transitions as fluorescence, so avoiding fluorescence by using a longer excitation wavelength will generally negate resonance enhancement.
The present experiments were undertaken in an attempt to maintain the relatively high sensitivity of visible excitation and CCD detectors while at the same time suppressing fluorescence. An sp2-hybridized carbon rod was used to adsorb several analytes from solution, some of which were highly fluorescent. Not only does the carbon substrate quench fluorescence, but it also should preconcentrate the analyte when strong adsorption occurs. The advantages of the technique for routine Raman analysis are discussed.
EXPERIMENTAL SECTION Sample Preparation. Spectroscopic graphite rods (type U-5,
Carbone of America, Ultra Carbon Division, Bay City, MI) were dry polished first with 180 grit and then 600 grit silicon carbide grinding paper (Buehler). After sonication to remove any polish- ing debris followed by 10 min of heating in a Bunsen burner flame (sample placed in a covered crucible to prevent contamination by flame gases), the carbon rod was submerged in the analyte solution for a measured amount of time. For all cases except fluoranthene, the rod was gently rinsed with solvent after removal from the analyte solution in order to minimize multilayer adsorp tion. The R6G (Lambda Physik), IR125 (Exciton), fluoranthene (Aldrich) , and 1,4-bis (2-methylstyryl) benzene (BMB, Aldrich) , were used without additional purification. The solvents used in these studies were reagent grade acetone, anhydrous methanol, and carbon tetrachloride. The analyte solutions in which the carbon rods were dipped ranged in concentration from lo-* to
Figure lA shows the apparatus used for 514.5 nm excitation. A 25 cm focal length, single-stage spectrometer with f/4 optics (Chromex, Albuquerque, NM) was coupled to a CCD detector (TEK CB/AR with 512 x 512 pixels, 13 mm x 13 mm active area, Photometrics CH260 camera head (Tucson, AZ)). The detector was operated at - 110 "C, and all spectra were collected by binning the CCD in the vertical direction, yielding 512 spectral resolution elements. A 1200 lines/" grating (optimized at 750 nm) or an 1800 lines/" grating (optimized at 500 nm) was used, yielding a spectral resolution of 2-4 cm-l. The typical slit width employed was 50 pm while the laser power was 10-20 mW at the sample. The argon ion laser was a Coherent 70-4 "Innova". Since the Chromex Raman One spectrograph comes with lenses L3 and L4 permanently mounted, the samples could have been placed at the position where the CdS band reject filter is shown in Figure lA, eliminating the need for lenses L1 and L2. The more complex optical arrangement containing the additional lenses, L1 and L2,
M, as noted for each experiment.
(24) Wang, Y.; McCreery, R Anal. Chem. 1989, 62, 2647-2651. (25) Hams, T. D.; Schnoes, M. L; Seibles, L. Anal. Chem. 1989,61,994-998. (26) Newman, C. D.; Bret, G. G.; McCreery, R L. Appl. Spectrosc. 1992, 46,
262-265.
514.5 nm A
1 1 7 . 4 L3 I SPECTROGRAPH/CCD ml .. ...* .... ....
L2
B r Y g ; PPECTROGRAPH/CCD
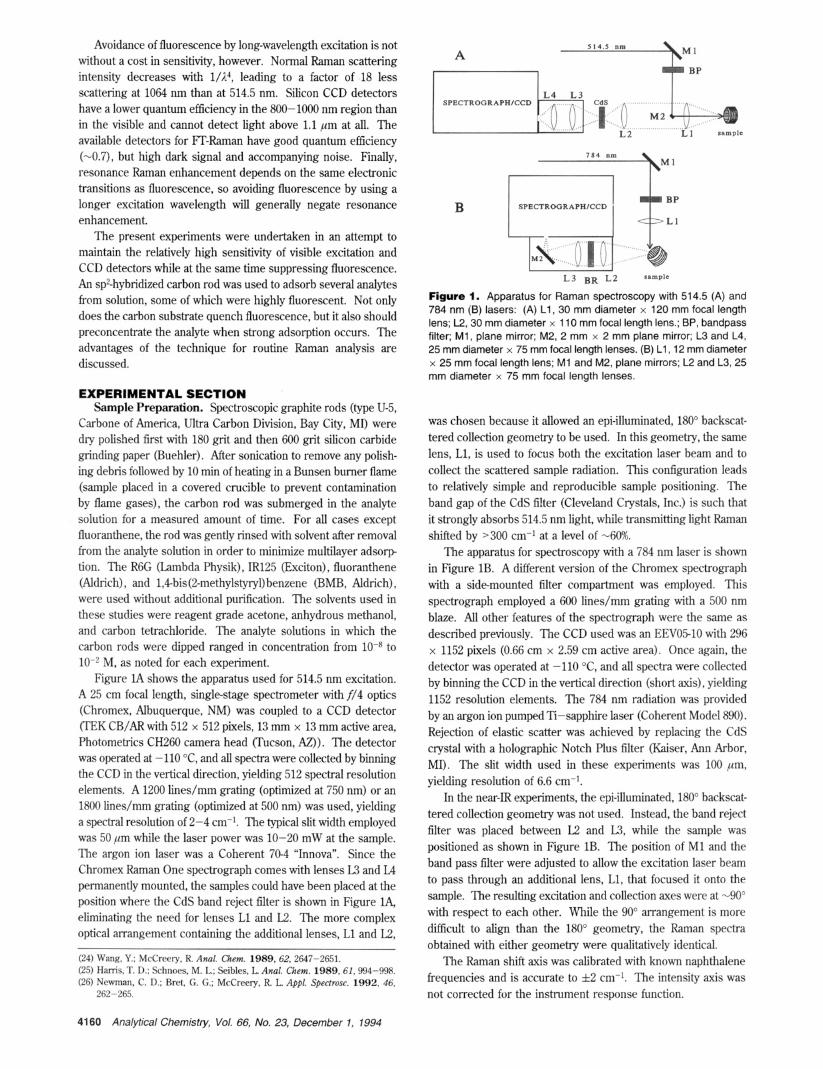
Figure 1. Apparatus for Raman spectroscopy with 514.5 (A) and 784 nm (B) lasers: (A) L1, 30 mm diameter x 120 mm focal length lens; L2,30 mm diameter x 11 0 mm focal length lens.; BP, bandpass filter; M1, plane mirror; M2, 2 mm x 2 mm plane mirror; L3 and L4, 25 mm diameter x 75 mm focal length lenses. (B) L1, 12 mm diameter x 25 mm focal length lens; M1 and M2, plane mirrors; L2 and L3, 25 mm diameter x 75 mm focal length lenses.
was chosen because it allowed an epi-illuminated, 180" backscat- tered collection geometry to be used. In this geometry, the same lens, L1, is used to focus both the excitation laser beam and to collect the scattered sample radiation. This configuration leads to relatively simple and reproducible sample positioning. The band gap of the CdS filter (Cleveland Crystals, Inc.) is such that it strongly absorbs 514.5 nm light, while transmitting light Raman shifted by '300 cm-1 at a level of -60%.
The apparatus for spectroscopy with a 784 nm laser is shown in Figure 1B. A different version of the Chromex spectrograph with a side-mounted filter compartment was employed. This spectrograph employed a 600 lines/" grating with a 500 nm blaze. All other features of the spectrograph were the same as described previously. The CCD used was an EEV05-10 with 296 x 1152 pixels (0.66 cm x 2.59 cm active area). Once again, the detector was operated at -110 "C, and all spectra were collected by binning the CCD in the vertical direction (short axis), yielding 1152 resolution elements. The 784 nm radiation was provided by an argon ion pumped Ti-sapphire laser (Coherent Model 890). Rejection of elastic scatter was achieved by replacing the CdS crystal with a holographic Notch Plus filter (Kaiser, Ann Arbor, MI). The slit width used in these experiments was 100 pm, yielding resolution of 6.6 cm-l.
In the near-IR experiments, the epi-illuminated, 180" backscat- tered collection geometry was not used. Instead, the band reject filter was placed between L2 and L3, while the sample was positioned as shown in Figure 1B. The position of M1 and the band pass filter were adjusted to allow the excitation laser beam to pass through an additional lens, L1, that focused it onto the sample. The resulting excitation and collection axes were at -90" with respect to each other. While the 90" arrangement is more difEcult to align than the 180" geometry, the Raman spectra obtained with either geometry were qualitatively identical.
The Raman shift axis was calibrated with known naphthalene frequencies and is accurate to f 2 cm-l. The intensity axis was not corrected for the instrument response function.
41 60 Analytical Chemistry, Vol. 66, No. 23, December 1, 1994
A
B
C 2 9 e-/sec 1 A
I
J I I I I
h D
7 0 0 9 0 0 1100 1 3 0 0 1500 1 7 0 0
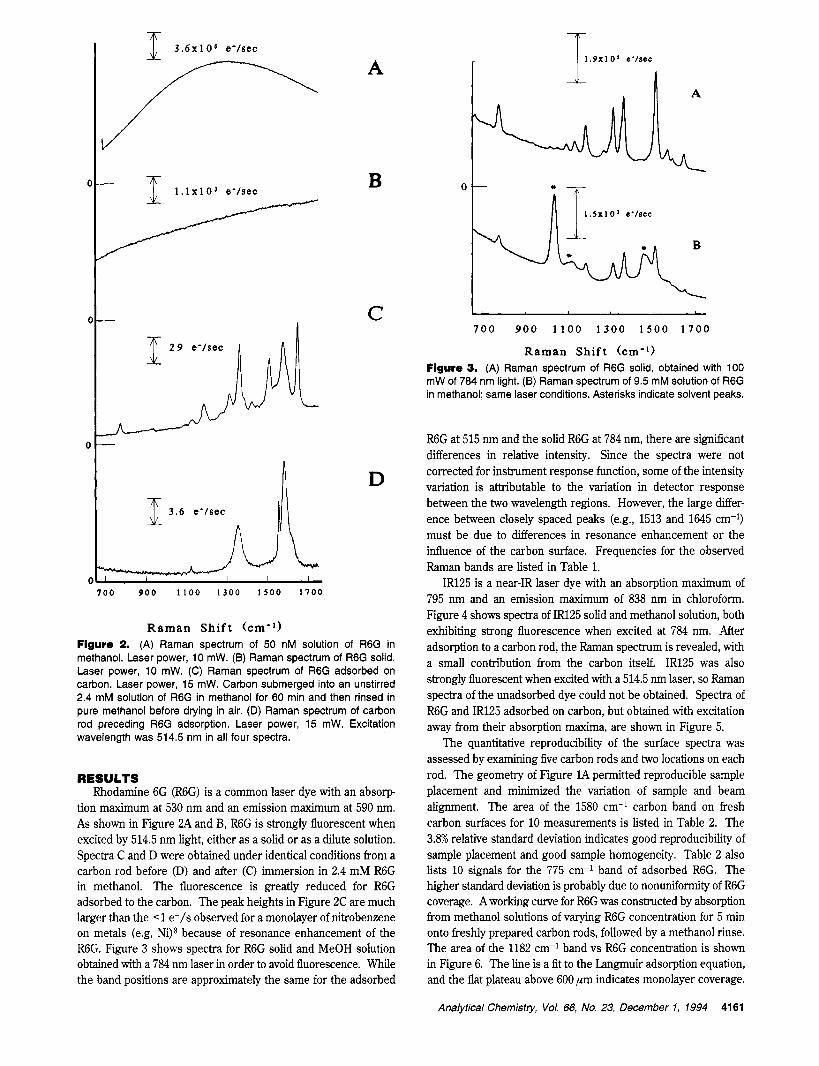
Raman Shift (cm- ' ) Figure 2. (A) Raman spectrum of 50 nM solution of R6G in methanol. Laser power, 10 mW. (B) Raman spectrum of R6G solid. Laser power, 10 mW. (C) Raman spectrum of R6G adsorbed on carbon. Laser power, 15 mW. Carbon submerged into an unstirred 2.4 mM solution of R6G in methanol for 60 min and then rinsed in pure methanol before drying in air. (D) Raman spectrum of carbon rod preceding R6G adsorption. Laser power, 15 mW. Excitation Wavelength was 514.5 nm in all four spectra.
RESULTS Rhodamine 6G (R6G) is a common laser dye with an absorp
tion maximum at 530 nm and an emission maximum at 590 nm. As shown in Figure 2A and B, R6G is strongly fluorescent when excited by 514.5 nm light, either as a solid or as a dilute solution. Spectra C and D were obtained under identical conditions from a carbon rod before @) and after (C) immersion in 2.4 mM R6G in methanol. The fluorescence is greatly reduced for R6G adsorbed to the carbon. The peak heights in Figure 2C are much larger than the < 1 e-/s observed for a monolayer of nitrobenzene on metals (e.g, Ni)* because of resonance enhancement of the R6G. Figure 3 shows spectra for R6G solid and MeOH solution obtained with a 784 nm laser in order to avoid fluorescence. While the band positions are approximately the same for the adsorbed
0
1.9x10 ' e-/sec
700 900 1 1 0 0 1 3 0 0 1 5 0 0 1700
Raman Shift ( c m - l ) Figure 3. (A) Raman spectrum of R6G solid, obtained with 100 mW of 784 nm light. (B) Raman spectrum of 9.5 mM solution of R6G in methanol; same laser conditions. Asterisks indicate solvent peaks.
R6G at 515 nm and the solid R6G at 784 nm, there are significant differences in relative intensity. Since the spectra were not corrected for instrument response function, some of the intensity variation is attributable to the variation in detector response between the two wavelength regions. However, the large differ- ence between closely spaced peaks (e.g., 1513 and 1645 cm-') must be due to differences in resonance enhancement or the influence of the carbon surface. Frequencies for the observed Raman bands are listed in Table 1.
IR125 is a near-IR laser dye with an absorption maximum of 795 nm and an emission maximum of 838 nm in chloroform. Figure 4 shows spectra of IRE5 solid and methanol solution, both exhibiting strong fluorescence when excited at 784 nm. M e r adsorption to a carbon rod, the Raman spectrum is revealed, with a small contribution from the carbon itself. IR125 was also strongly fluorescent when excited with a 514.5 nm laser, so Raman spectra of the unadsorbed dye could not be obtained. Spectra of R6G and IR125 adsorbed on carbon, but obtained with excitation away from their absorption maxima, are shown in Figure 5.
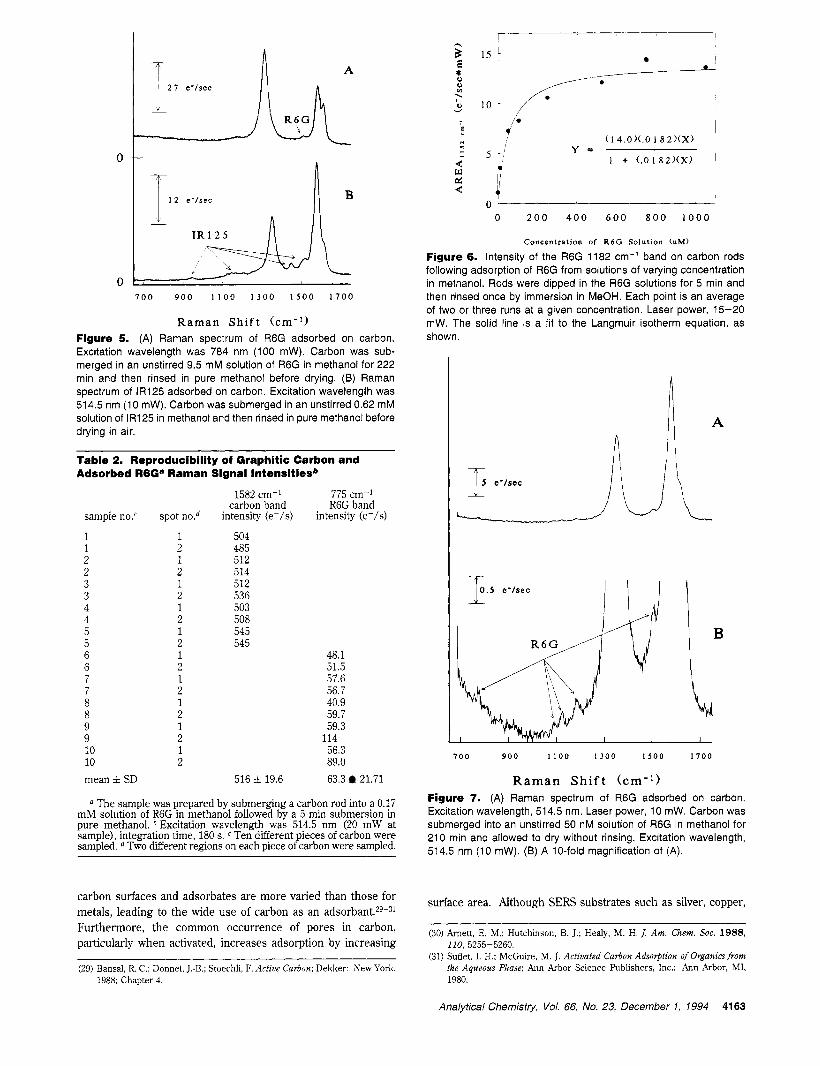
The quantitative reproducibility of the surface spectra was assessed by examining five carbon rods and two locations on each rod. The geometry of Figure 1A permitted reproducible sample placement and minimized the variation of sample and beam alignment. The area of the 1580 cm-' carbon band on fresh carbon surfaces for 10 measurements is listed in Table 2. The 3.8% relative standard deviation indicates good reproducibility of sample placement and good sample homogeneity. Table 2 also lists 10 signals for the 775 cm-I band of adsorbed R6G. The higher standard deviation is probably due to nonunifodty of R6G coverage. A working curve for R6G was constructed by absorption from methanol solutions of varying R6G concentration for 5 min onto freshly prepared carbon rods, followed by a methanol rinse. The area of the 1182 cm-I band vs R6G concentration is shown in Figure 6. The line is a fit to the Langmuir adsorption equation, and the flat plateau above 600 ,um indicates monolayer coverage.
Analytical Chemistry, Vol. 66, No. 23, December 1, 1994 4161
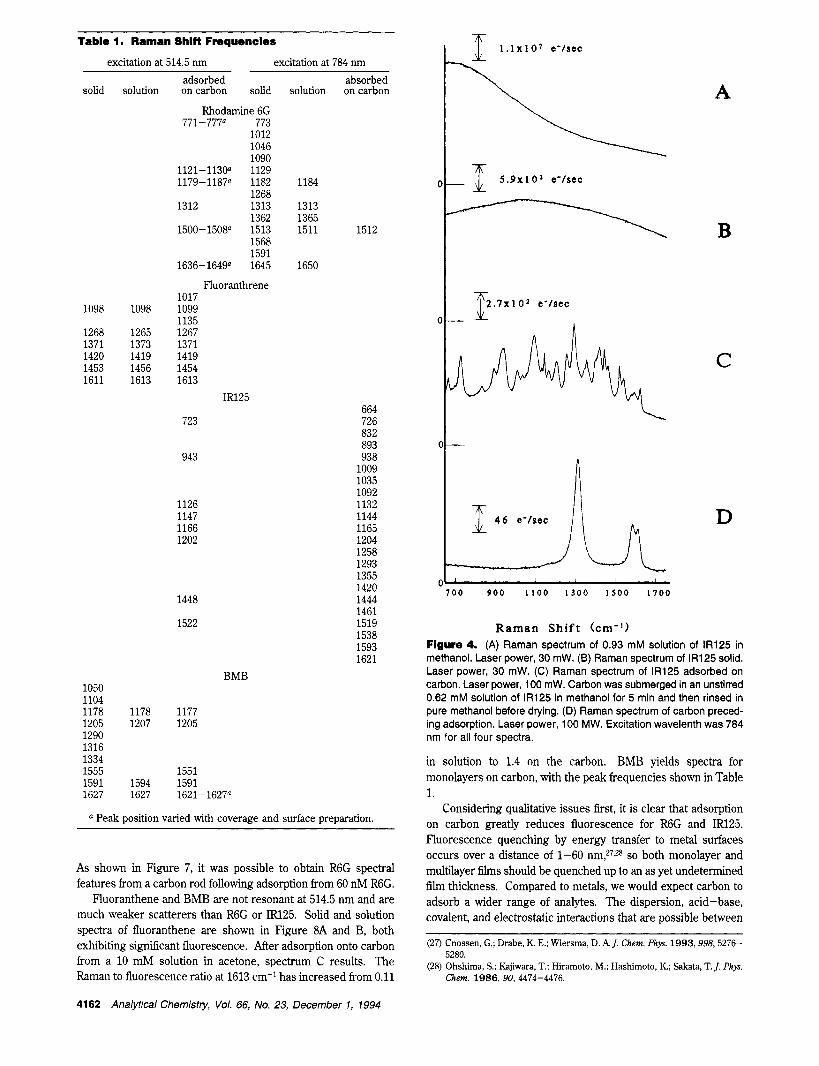
Table 1. Reman Shift Frequencies
excitation at 514.5 nm excitation at 784 nm adsorbed
solid solution oncarbon solid Rhodamine 6G
771-777' 773 1012 1046 1090
1121-113W 1129 1179-1187' 1182
1268 1312 1313
1362 1500-1508" 1513
1568 1591
Fluoranthrene 1636-1649" 1645
1017 1098 1098 1099
1135 1268 1265 1267 1371 1373 1371 1420 1419 1419 1453 1456 1454 1611 1613 1613
IR125
723
943
1126 1147 1166 1202
1448
1522
absorbed solution on carbon
1184
1313 1365 1511 1512
1650
664 726 832 893 938
1009 1035 1092 1132 1144 1165 1204 1258 1293 1355 1420 1444 1461 1519 1538 1593 1621
BMB 1050 1104 1178 1178 1177 1205 1207 1205 1290 1316 1334 1555 1551 1591 1594 1591 1627 1627 1621-1627'
" Peak position varied with coverage and surface preparation.
As shown in Figure 7, it was possible to obtain R6G spectral features from a carbon rod following adsorption from 60 nM R6G.
Fluoranthene and BMB are not resonant at 514.5 nm and are much weaker scatterers than R6G or IR125. Solid and solution spectra of fluoranthene are shown in Figure 8A and B, both exhibiting signscant fluorescence. After adsorption onto carbon from a 10 mM solution in acetone, spectrum C results. The Raman to fluorescence ratio at 1613 cm-1 has increased from 0.11
A
-
C
D
~~ ~~
0 0 9 0 0 1 1 0 0 1 3 0 0 IS00 1 7 0 0
Raman Shift (cm-') Figure 4. (A) Raman spectrum of 0.93 mM solution of IR125 in methanol. Laser power, 30 mW. (B) Raman spectrum of IR125 solid. Laser power, 30 mW. (C) Raman spectrum of IR125 adsorbed on carbon. Laser power, 100 mW. Carbon was submerged in an unstirred 0.62 mM solution of IR125 in methanol for 5 min and then rinsed in pure methanol before drying. (D) Raman spectrum of carbon preced- ing adsorption. Laser power, 100 MW. Excitation wavelenth was 784 nm for all four spectra.
in solution to 1.4 on the carbon. BMB yields spectra for monolayers on carbon, with the peak frequencies shown in Table 1.
Considering qualitative issues first, it is clear that adsorption on carbon greatly reduces fluorescence for R6G and IR125. Fluorescence quenching by energy transfer to metal surfaces occurs over a distance of 1-60 nm,27328 so both monolayer and multilayer films should be quenched up to an as yet undetermined film thickness. Compared to metals, we would expect carbon to adsorb a wider range of analytes. The dispersion, acid-base, covalent, and electrostatic interactions that are possible between
(27) Cnossen, G.; Drabe, IC E.; Wiersma, D. AJ. Chem. Phys. 1993,998,5276-
(28) Ohshima, S.; Kajiwara, T.; Hiramoto, M.; Hashimoto, IC; Sakata, T. J. Phys. 5280.
Chem. 1986, 90,4474-4476.
4162 Analytical Chemistry, Vol. 66, No. 23, December 1, 1994
0
0 700 900 1 1 0 0 1300 1 5 0 0 1 7 0 0
Raman Sh i f t ( c m - ' ) Figure 5. (A) Raman spectrum of R6G adsorbed on carbon. Excitation wavelength was 784 nm (100 mW). Carbon was sub- merged in an unstirred 9.5 mM solution of R6G in methanol for 222 min and then rinsed in pure methanol before drying. (B) Raman spectrum of IR125 adsorbed on carbon. Excitation wavelength was 514.5 nm (10 mW). Carbon was submerged in an unstirred 0.62 mM solution of IR125 in methanol and then rinsed in pure methanol before drying in air.
Table 2. Reproducibility of Graphitic Carbon and Adsorbed R6Ga Raman Signal Intensitiesb
1582 cm-' 775 cm-1 carbon band R6G band
sample n0.c spot n0.d intensity (e-/s) intensity (e-/$ 1 1 2 2 3 3 4 4 5 5 6 6 7 7 8 8 9 9 10 10 mean i SD
1 2
504 485 512 514 512 536 503 508 545 545
1 2
1 2 1 2
516 ?c 19.6
48.1 51.5 57.6 56.7 40.9 59.7 59.3
56.3 89.0 63.3 21.71
114
@ The sample was prepared by submerging a carbon rod into a 0.17 mM solution of R6G in methanol followed by a 5 min submersion in pure methanol. Excitation wavelength was 514.5 nm (20 mW at sample), integration time, 180 s. Ten different pieces of carbon were sampled. Two different regions on each piece of carbon were sampled.
15 t I
1. I
( 1 4 0 ) ( 0 1 8 2 ) ( X ) Y Y =
1 + (.O 1 8 2 ) ( X ) ' 5 / 0 I I
0 2 0 0 4 0 0 6 0 0 8 0 0 1 0 0 0
Concentration of R6G Solution (uM)
Figure 6. Intensity of the R6G 1182 cm-I band on carbon rods following adsorption of R6G from solutions of varying concentration in methanol. Rods were dipped in the R6G solutions for 5 min and then rinsed once by immersion in MeOH. Each point is an average of two or three runs at a given concentration. Laser power, 15-20 mW. The solid line is a fit to the Langmuir isotherm equation, as shown.
A
J B
7 0 0 9 0 0 1 1 0 0 1300 I500 1 7 0 0
Raman Shi f t (cm-') Figure 7. (A) Raman spectrum of R6G adsorbed on carbon. Excitation wavelength, 514.5 nm. Laser power, 10 mW. Carbon was submerged into an unstirred 50 nM solution of R6G in methanol for 210 min and allowed to dry without rinsing. Excitation wavelength, 514.5 nm (10 mW). (B) A 10-fold magnification of (A).
surfaces and adsorbates are more varied than those for metals, leading to the wide use of carbon as an a d s ~ r b a n t . ~ ~ - ~ I
surface area. Although SERS substrates such as silver, copper,
the ''"On Occurrence Of pores in carbon' (30) Amett, E. M.: Hutchinson, B. J.; Healy, M. H. 1. Am. Chem. SOC. 1988, particularly when activated, increases adsorption by increasing 210, 5255-5260.
(31) Suffet, I. H.; McGuire, M. J. Activated Carbon Adsorption of Organics from the Aqueous Phase; Ann Arbor Science Publishers, Inc.: Ann Arbor, MI, (29) Bansal, R. C.: Donnet, J.-B.; Stoechli, F. Active Carbon; Dekker: New York,
1988; Chapter 4. 1980.
Analytical Chemistty, Vol. 66, No. 23, December 1, 1994 4163

4 0 0 0 0 0
200000
0
2000
1 0 0 0
0
L
0 1 0 0 0 I200 1 4 0 0 1 6 0 0 I800
Raman S h i f t (cm-') Figure 8. Spectra of fluoranthene as a solid (A), a 10 mM solution in CCI4 (B), and adsorbed on carbon (C). Adsorption occurred from 10 mM solution in acetone. Laser power was 10 mW at 514.5 nm, and CC14 and carbon background spectra were subtracted in spectra B and C, respectively. The signal strength of the 1613 cm-' peak is high for an unenhanced monolayer and implies either a preresonant condition or a multilayer film.
and gold yield major sensitivity enhancement^,^^^^^^^^ they do not adsorb as wide a range of materials as carbon and are therefore not as general. Furthermore, minor impurity levels can reduce or prevent adsorption to SERS active surface and drastically affect SERS intensity.
The shapes of the R6G working curve in Figure 6 and a similar curve obtained for BMB provide strong evidence that the R6G and BMB spectra (at least) were obtained from monolayers. There are several cases of frequency shifts upon adsorption, relative to the bulk or solution values. For example, the 1513 cm-l band observed in the bulk R6G spectrum obtained at 784 nm has also been observed by CAKS at 1517 cm-1,34 but for the adsorbed R6G excited at 514.5 nm, the peak shifts to as low as 1500 cm-'. These peak shifts are evidence for monlayer adsorp tion. In addition, the adsorption of R6G and IR125 from dilute solution followed by a solvent wash is unlikely to yield multilayers. For either the mono- or multilayers considered here, it is clear that the fluorescence is quenched.
(32) Moody, R L.; Vo-Dinh, T.; Fletcher, W. H. Appl. Spectrosc. 1 9 8 7 , 4 1 , 966-
(33) Mullen, K.; Carron, K T. A d . Chem. 1991, 63, 2196-2199. (34) Matsubara, S.; Takahashi, H. Chem. Phys. Lett. 1984, 108, 475.
969.
The expected Raman scattering from an absorbate has been considered by several authors, but a useful form is given by eq 1
for a flat ~u r face ,~ where S is the signal measured at CCD (electrons) integrated over Raman line, PD is the laser power density (photons cm-2), psis the cross section of a molecule on a surface (cm2 molecule-* sr-l), D, is the number density of analyte on a surface (molecules cm-2), 51 is the collection angle of spectrometer, measured at the sample (sr), AD is the sample area monitored by spectrograph (cm2), T is the spectrometer transmission (unitless), Q is the detector quantum efficiency (photoelectrons photon-'), and t is the measurement time, (s).
For a flat surface and monolayer coverage of benzene (8 = 2.0 x cm2 molecule-' sr-I), eq 1 predicts a signal of -0.1 e-/s for the conditions employed. As noted earlier, the much larger signal observed in Figure 2C is due to resonant enhance- ment.
An estimate of the resonance enhancement of can be made by comparing Figures 2C and 5A, in which adsorbed R6G is observed at 514.5 and 784 nm. Ignoring the small change in sampling depth of the carbon between 514.5 and 784 nm, the carbon Raman scattering intensity will track the carbon cross section as the laser wavelength is varied. Thus the carbon band at 1580 cm-I can be used as an internal standard, and eq 2 applies
if all instrumental parameters are constant. The superscript 1 refers to a given laser wavelength and the subscripts S and C refer to the adsorbate and carbon substrate, respectively. Equa- tion 2 can be evaluated at two laser wavelengths and ratioed, with
(3)
D: = @ yielding eq 3. Thus, if the same sample is examined at both wavelengths, the sample Raman intensity relative to the carbon band is a function of the relative adsorbate and carbon cross sections and number densities. Equation 3 assumes only that the sampling depth is the same for both wavelengths. The cross section of graphite has not been determined rigorously as a function of wavelength, but some results are available. By comparing the graphite scattering intensity to the scattering from Na2S04 in a graphite/NazSOd pellet, Wang et al. estimated that the glassy carbon cross section deviated from v4 behavior by less than a factor of 3 between 409 and 782 nm.36 Thus, we estimate the pc2/pc1 term in eq 3 to equal (515/78414 or 0.19.
Figures 4C and 5B compare the spectra of IR125 at 784 and 515 nm, respectively. Application of eq 3 with Dt = DE indicates that the IR125 cross section is 79 times larger at 784 nm than at
(35) Fryling, M.; Frank, C. J.; McCreery, R. L. Appl. Spectrosc. 1993,47 ,1965-
(36) Wang, Y.; Alsmeyer, D.; McCreety, R L. Chem. Mater. 1990,2, 557-563. 1974.
4164 Analytical Chemistry, Vol. 66, No. 23, December I , 1994
515 nm for the 944 cm-I band, 81 times larger for the 729 cm-1 band, and 86 times larger for the 1208 cm-’ band. Thus there is clearly a significant increase in resonance enhancement at the longer laser wavelength. Figure 5A was obtained with a relatively thick R6G film in order to yield sufficient signal. As a result, eq 3 yields a lower limit for pi/& if DB is assumed to equal DE. Comparison of Figures 2C and 5A, combined with eq 3 leads to the semiquantitative estimate that the adsorbed R6G (1515 cm-l band) cross section at 514.5 nm is at least 630 times that at 784 nm. This factor represents the minimum gain in sensitivity due to resonance enhancement from using 514.5 nm excitation rather than 785 nm. Speaking more generally, resonance enhancement necessarily involves excited electronic states which can also lead to fluorescence. By shifting the laser toward the red, one can diminish fluorescence but also decrease resonance enhancement. By quenching the fluorescence on the carbon surface, resonance enhancement and accompanying sensitivity can be maintained.
The generality of the use of carbon surfaces as supports for Raman samples depends on two major factors: the range of molecules that adsorb and their Raman cross sections and number densities. As noted earlier, a wide range of materials adsorb to carbon, particularly organics. The observation of adsorbed R6G after carbon immersion in a 50 nM solution raises the possibility of using adsorbate Raman for trace analysis. At monolayer coverage, the 1205 cm-I band of BMB yields a detectable signal with an intensity of approximately 0.1 e-/s-mW. This is within a factor of 10 of that predicted for a monolayer of benzene observed at 992 cm-1.37 Thus, strongly resonant adsorbates such as R6G at 514.5 nm were easily detected at monolayer levels, while much
(37) Fryling, M. A, private communication.
weaker scatterers yield easily observed Raman features. The suitability of the approach for a wider range of adsorbates is currently being assessed.
CONCLUSIONS The ability of a graphitic carbon surface to provide high-quality
Raman spectra of adsorbed molecules that exhibited only fluo- rescence when sampled as bulk solids or in solution was demonstrated. Laser dyes probed with excitation wavelengths close to their absorption maxima were used in this study to produce a “worst case” scenario of fluorescence interference. Although it has previously been shown that metals such as silver and aluminum also possess the ability to quench fluorescence efficiently, carbon offers several potentially signscant advantages. First among these advantages is carbon’s superior affinity for organic absorbates. This could be crucial for solution phase trace analyses where the surface coverage of a particular analyte will increase for a higher adsorption equilibrium constant. A second advantage of graphitic carbon over metals is its availability in very high surface area “activated” forms. This should increase the number of adsorption sites and reduce saturation and competitive adsorption effects. The results also indicate that features with Raman cross sections comparable to that of benzene, such as the 1205 cm-’ band of BMB, can be observed at monolayer levels on carbon surfaces.
ACKNOWLEDGMENT
Surface Chemistry of the National Science Foundation. This work was supported by the Division of Analytical and
Received for review May 20, 1994. Accepted September 18, 1994.@
@Abstract published in Adoance ACS Abstracts, October 15, 1994.
Analytical Chemistry, Vol. 66, No. 23, December 1, 1994 4165