reduction of benzenoid synthesis in petunia flowers ... · either the b-oxidative pathway or...
TRANSCRIPT
Reduction of Benzenoid Synthesis in Petunia Flowers RevealsMultiple Pathways to Benzoic Acid and Enhancementin Auxin Transport W
Irina Orlova,a,1 Amy Marshall-Colon,a,1 Jennifer Schnepp,a Barbara Wood,a Marina Varbanova,b
Eyal Fridman,b Joshua J. Blakeslee,a Wendy Ann Peer,a Angus S. Murphy,a David Rhodes,a
Eran Pichersky,b and Natalia Dudarevaa,2
a Department of Horticulture and Landscape Architecture, Purdue University, West Lafayette, Indiana 47907b Department of Molecular, Cellular, and Developmental Biology, University of Michigan, Ann Arbor, Michigan 48109
In plants, benzoic acid (BA) is believed to be synthesized from Phe through shortening of the propyl side chain by two
carbons. It is hypothesized that this chain shortening occurs via either a b-oxidative or non-b-oxidative pathway. Previous in
vivo isotope labeling and metabolic flux analysis of the benzenoid network in petunia (Petunia hybrida) flowers revealed that
both pathways yield benzenoid compounds and that benzylbenzoate is an intermediate between L-Phe and BA. To test this
hypothesis, we generated transgenic petunia plants in which the expression of BPBT, the gene encoding the enzyme that
uses benzoyl-CoA and benzyl alcohol to make benzylbenzoate, was reduced or eliminated. Elimination of benzylbenzoate
formation decreased the endogenous pool of BA and methylbenzoate emission but increased emission of benzyl alcohol
and benzylaldehyde, confirming the contribution of benzylbenzoate to BA formation. Labeling experiments with 2H5-Phe
revealed a dilution of isotopic abundance in most measured compounds in the dark, suggesting an alternative pathway from
a precursor other than Phe, possibly phenylpyruvate. Suppression of BPBT activity also affected the overall morphology of
petunia plants, resulting in larger flowers and leaves, thicker stems, and longer internodes, which was consistent with the
increased auxin transport in transgenic plants. This suggests that BPBT is involved in metabolic processes in vegetative
tissues as well.
INTRODUCTION
Benzenoid and phenylpropanoid volatile compounds, primarily
derived from Phe, contribute to the aromas/scents of many plant
species and play important roles in plant communication with
surrounding environments (Dudareva and Pichersky, 2006;
Knudsen and Gershenzon, 2006; Pichersky et al., 2006). Several
enzymes that catalyze the final steps in the biosynthesis of these
compounds have been isolated and characterized. However, the
early steps leading to the formation of the benzenoid backbone
still remain unclear (Beuerle and Pichersky, 2002; Schnepp and
Dudareva, 2006; Wildermuth, 2006). In general, the biosynthesis
of benzenoids from Phe requires the shortening of the carbon
skeleton side chain by a C2 unit, which can potentially occur via
either the b-oxidative pathway or nonoxidatively (Figure 1).
Experiments with stable isotope-labeled precursors in tobacco
(Nicotiana tabacum) leaves (Ribnicky et al., 1998) suggested that
benzoic acid (BA) is produced from Phe-derived cinnamic acid
(CA) via the b-oxidative pathway, yielding benzoyl-CoA first,
which can then be hydrolyzed by a thioesterase to free BA. By
contrast, labeling experiments along with initial enzyme charac-
terization in Hypericum androsaemum cell cultures (Ahmed et al.,
2002) supported the existence of the nonoxidative conversion of
CA to benzaldehyde with subsequent formation of BA, which can
be further converted to benzoyl-CoA (Beuerle and Pichersky,
2002; Figure 1). However, none of the genes or enzymes involved
in any chain-shortening steps in BA biosynthesis have been iden-
tified or characterized in plants.
Petunia (Petunia hybrida) flowers emit a diverse blend of floral
scent phenylpropanoid and benzenoid compounds that are syn-
thesized predominantly in the corolla with emission level peaking
during the night (Kolosova et al., 2001; Verdonk et al., 2003;
Boatright et al., 2004). These volatiles include benzyl alcohol,
benzaldehyde, methylbenzoate and benzylbenzoate, as well as
phenylacetaldehyde, 2-phenylethanol, phenylethylacetate, iso-
eugenol, and eugenol. Using petunia as a model system, we have
recently identified enzymes responsible for the formation of
some of these volatile compounds, including phenylacetalde-
hyde synthase (PAAS), which is responsible for the synthesis of
phenylacetaldehyde from Phe (Kaminaga et al., 2006); benzoic
acid/salicylic acid carboxyl methyltransferase, which is re-
sponsible for the synthesis of methylbenzoate from BA and
S-adenosylmethionine (Negre et al., 2003); isoeugenol synthase
(IGS1), which is responsible for the synthesis of isoeugenol from
coniferyl acetate (Koeduka et al., 2006); and benzoyl-CoA:benzyl
1 These authors contributed equally to this work.2 To whom correspondence should be addressed. E-mail [email protected]; fax 765-494-0391.The author responsible for distribution of materials integral to thefindings presented in this article in accordance with the policy describedin the Instructions for Authors (www.plantcell.org) is: Natalia Dudareva([email protected]).W Online version contains Web-only data.www.plantcell.org/cgi/doi/10.1105/tpc.106.046227
The Plant Cell, Vol. 18, 3458–3475, December 2006, www.plantcell.org ª 2006 American Society of Plant Biologists
alcohol/phenylethanol benzoyltransferase (BPBT), which is re-
sponsible for the synthesis of benzylbenzoate and phenyl-
ethylbenzoate from benzoyl-CoA and benzyl alcohol or
2-phenylethanol, respectively (Boatright et al., 2004) (Figure 1).
Recently, we have also performed computer-assisted meta-
bolic flux analysis of data obtained from in vivo stable isotope
labeling of petunia petals to investigate the early steps of
benzenoid biosynthesis (Boatright et al., 2004). This analysis
revealed that both the b-oxidative and non-b-oxidative path-
ways contribute to the formation of benzenoid compounds in
petunia flowers. The flux through the non-b-oxidative pathway
with benzaldehyde as a key intermediate was estimated to be
twofold higher than the flux through the b-oxidative pathway,
which relies on the formation of CoA esters. Furthermore, the
modeling of stable isotope labeling data uncovered the unex-
pected result that, in addition to benzaldehyde, benzylbenzoate
is an alternative intermediate between L-Phe and BA.
To determine the role of benzylbenzoate within the benzenoid
network in planta, we generated transgenic petunia plants in
which this system was perturbed by suppression of BPBT gene
expression via RNA interference–based (RNAi) technology. Anal-
ysis of transgenic plants not only confirmed that benzylbenzoate
is indeed an intermediate in BA synthesis but also showed that a
suppression of the flux to benzylbenzoate enhances the contri-
bution of the non-b-oxidative route to some benzenoid com-
pounds in the light. Moreover, the unexpected morphological
and anatomical phenotypes of the transgenic plants indicated
that BPBT plays a role in vegetative tissues as well.
RESULTS
Effect of RNAi-Mediated Repression of BPBT Expression
on Volatile Benzenoid Production
To investigate the specific role of benzylbenzoate within the
benzenoid network, the expression of BPBT was downregulated
in P. hybrida cv Mitchell using an RNAi strategy. An RNAi con-
struct was generated using a 350-bp fragment within the 59 end
of the BPBT coding region and expressed under the control of
the petal-specific LIS promoter (Cseke et al., 1998). Thirty in-
dependently transformed individuals were obtained, and RNA
gel blot analysis showed that BPBT expression in petals was
altered from complete elimination of transcripts (;50% of trans-
formants) to only slight (2%) reduction compared with untrans-
formed control plants (Figures 2A and 2B). Quantitative analysis
of the volatiles emitted from 2-d-old (2 d after fully opening)
petunia flowers revealed that complete elimination (i.e., knock-
out) of BPBT expression eliminated benzylbenzoate emission,
while a partial reduction (i.e., knockdown) in BPBT transcript
levels resulted in a corresponding reduction of benzylbenzoate
formation from 10 to 91% of that in control plants (Figures 2B,
2C, and 3), confirming that BPBT is responsible for benzylben-
zoate formation in vivo. Consistent with expression data, BPBT
activity was undetectable in transgenic flowers with eliminated
BPBT expression, while in flowers with reduced BPBT expres-
sion (50%), BPBT activity was ;50% of that in control flowers.
Similar results were obtained for phenylethylbenzoate emission,
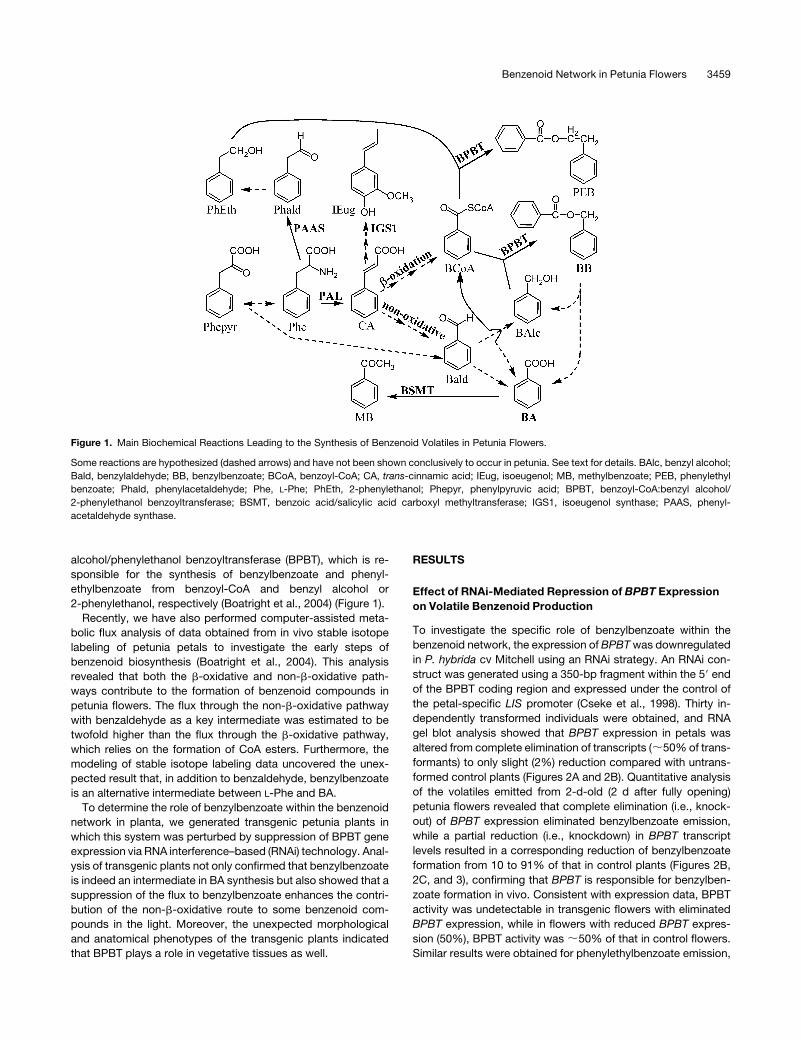
Figure 1. Main Biochemical Reactions Leading to the Synthesis of Benzenoid Volatiles in Petunia Flowers.
Some reactions are hypothesized (dashed arrows) and have not been shown conclusively to occur in petunia. See text for details. BAlc, benzyl alcohol;
Bald, benzylaldehyde; BB, benzylbenzoate; BCoA, benzoyl-CoA; CA, trans-cinnamic acid; IEug, isoeugenol; MB, methylbenzoate; PEB, phenylethyl
benzoate; Phald, phenylacetaldehyde; Phe, L-Phe; PhEth, 2-phenylethanol; Phepyr, phenylpyruvic acid; BPBT, benzoyl-CoA:benzyl alcohol/
2-phenylethanol benzoyltransferase; BSMT, benzoic acid/salicylic acid carboxyl methyltransferase; IGS1, isoeugenol synthase; PAAS, phenyl-
acetaldehyde synthase.
Benzenoid Network in Petunia Flowers 3459
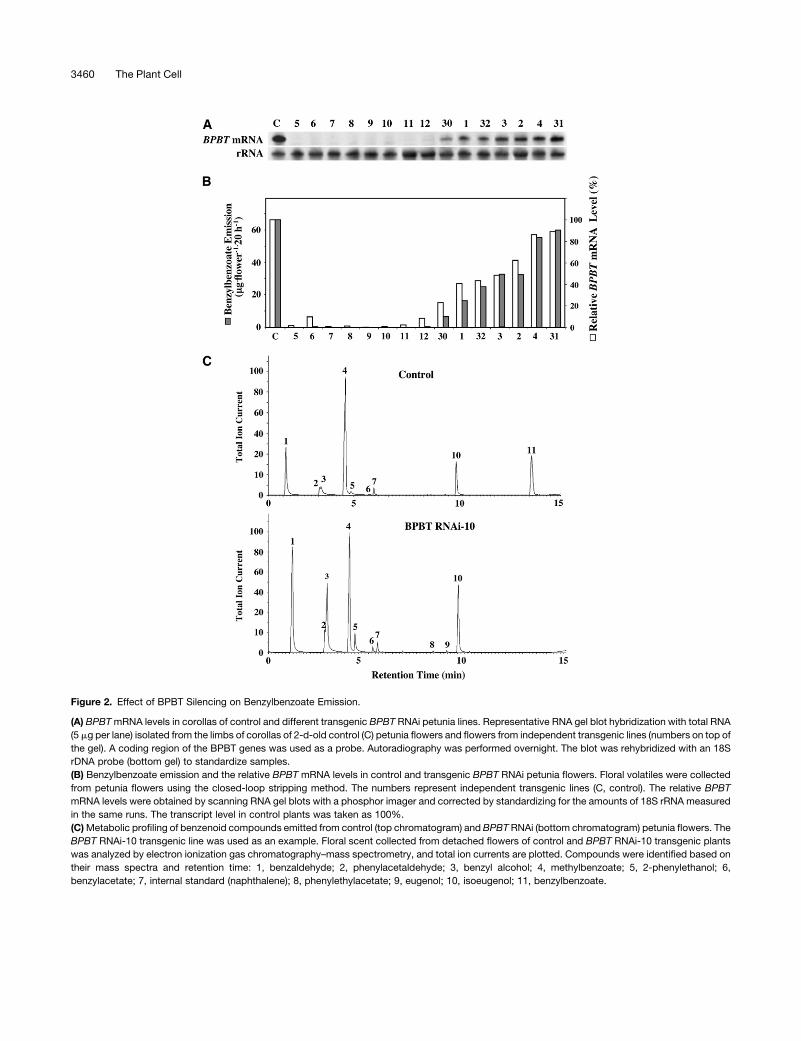
Figure 2. Effect of BPBT Silencing on Benzylbenzoate Emission.
(A) BPBT mRNA levels in corollas of control and different transgenic BPBT RNAi petunia lines. Representative RNA gel blot hybridization with total RNA
(5 mg per lane) isolated from the limbs of corollas of 2-d-old control (C) petunia flowers and flowers from independent transgenic lines (numbers on top of
the gel). A coding region of the BPBT genes was used as a probe. Autoradiography was performed overnight. The blot was rehybridized with an 18S
rDNA probe (bottom gel) to standardize samples.
(B) Benzylbenzoate emission and the relative BPBT mRNA levels in control and transgenic BPBT RNAi petunia flowers. Floral volatiles were collected
from petunia flowers using the closed-loop stripping method. The numbers represent independent transgenic lines (C, control). The relative BPBT
mRNA levels were obtained by scanning RNA gel blots with a phosphor imager and corrected by standardizing for the amounts of 18S rRNA measured
in the same runs. The transcript level in control plants was taken as 100%.
(C) Metabolic profiling of benzenoid compounds emitted from control (top chromatogram) and BPBT RNAi (bottom chromatogram) petunia flowers. The
BPBT RNAi-10 transgenic line was used as an example. Floral scent collected from detached flowers of control and BPBT RNAi-10 transgenic plants
was analyzed by electron ionization gas chromatography–mass spectrometry, and total ion currents are plotted. Compounds were identified based on
their mass spectra and retention time: 1, benzaldehyde; 2, phenylacetaldehyde; 3, benzyl alcohol; 4, methylbenzoate; 5, 2-phenylethanol; 6,
benzylacetate; 7, internal standard (naphthalene); 8, phenylethylacetate; 9, eugenol; 10, isoeugenol; 11, benzylbenzoate.
3460 The Plant Cell
indicating that BPBT is also responsible for its formation in vivo
(Figure 3).
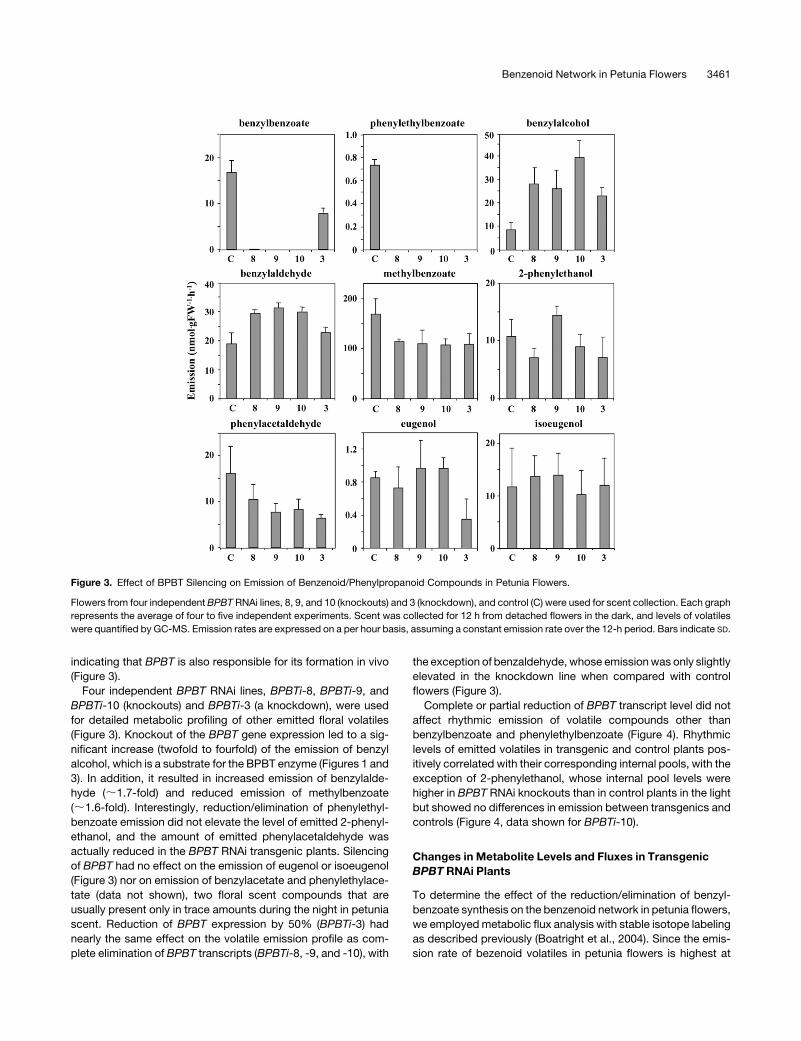
Four independent BPBT RNAi lines, BPBTi-8, BPBTi-9, and
BPBTi-10 (knockouts) and BPBTi-3 (a knockdown), were used
for detailed metabolic profiling of other emitted floral volatiles
(Figure 3). Knockout of the BPBT gene expression led to a sig-
nificant increase (twofold to fourfold) of the emission of benzyl
alcohol, which is a substrate for the BPBT enzyme (Figures 1 and
3). In addition, it resulted in increased emission of benzylalde-
hyde (;1.7-fold) and reduced emission of methylbenzoate
(;1.6-fold). Interestingly, reduction/elimination of phenylethyl-
benzoate emission did not elevate the level of emitted 2-phenyl-
ethanol, and the amount of emitted phenylacetaldehyde was
actually reduced in the BPBT RNAi transgenic plants. Silencing
of BPBT had no effect on the emission of eugenol or isoeugenol
(Figure 3) nor on emission of benzylacetate and phenylethylace-
tate (data not shown), two floral scent compounds that are
usually present only in trace amounts during the night in petunia
scent. Reduction of BPBT expression by 50% (BPBTi-3) had
nearly the same effect on the volatile emission profile as com-
plete elimination of BPBT transcripts (BPBTi-8, -9, and -10), with
the exception of benzaldehyde, whose emission was only slightly
elevated in the knockdown line when compared with control
flowers (Figure 3).
Complete or partial reduction of BPBT transcript level did not
affect rhythmic emission of volatile compounds other than
benzylbenzoate and phenylethylbenzoate (Figure 4). Rhythmic
levels of emitted volatiles in transgenic and control plants pos-
itively correlated with their corresponding internal pools, with the
exception of 2-phenylethanol, whose internal pool levels were
higher in BPBT RNAi knockouts than in control plants in the light
but showed no differences in emission between transgenics and
controls (Figure 4, data shown for BPBTi-10).
Changes in Metabolite Levels and Fluxes in Transgenic
BPBT RNAi Plants
To determine the effect of the reduction/elimination of benzyl-
benzoate synthesis on the benzenoid network in petunia flowers,
we employed metabolic flux analysis with stable isotope labeling
as described previously (Boatright et al., 2004). Since the emis-
sion rate of bezenoid volatiles in petunia flowers is highest at
Figure 3. Effect of BPBT Silencing on Emission of Benzenoid/Phenylpropanoid Compounds in Petunia Flowers.
Flowers from four independent BPBT RNAi lines, 8, 9, and 10 (knockouts) and 3 (knockdown), and control (C) were used for scent collection. Each graph
represents the average of four to five independent experiments. Scent was collected for 12 h from detached flowers in the dark, and levels of volatiles
were quantified by GC-MS. Emission rates are expressed on a per hour basis, assuming a constant emission rate over the 12-h period. Bars indicate SD.
Benzenoid Network in Petunia Flowers 3461
night (Kolosova et al., 2001; Verdonk et al., 2003), this analysis
was initially conducted under dark (inverted photoperiod) con-
ditions only (Boatright et al., 2004). Here, we examined the
pathway under both natural dark and light conditions. Deuterium
ring-labeled Phe (2H5-Phe) was supplied to excised petunia
corolla limbs of both control and BPBT knockout (BPBTi-10)
plants, and floral volatiles were collected at 30, 60, 120, and
240 min and analyzed by gas chromatography–mass spectrom-
etry (GC-MS) for pool sizes and isotope abundances. The dif-
ferences in scent profiles of control and transgenic plants during
the 2H5-Phe feeding experiments were consistent with those
found in scent collection from intact flowers. After scent collec-
tions, petal tissues were extracted with either methanol, to de-
termine the labeling and pool sizes of endogenous nonvolatile
metabolites, including organic acids, or with dichloromethane, to
determine pool sizes and isotope abundances of endogenous
intermediates and end products, including phenylacetaldehyde,
2-phenylethanol, phenylethylbenzoate, eugenol, isoeugenol,
benzaldehyde, benzyl alcohol, benzylbenzoate, and methylben-
zoate. Detection of additional endogenous compounds, includ-
ing some organic acids, extended the previously described
metabolic model for the benzenoid network in control flowers
(Boatright et al., 2004) from 38 to 66 fluxes (Figure 5, Table 1). In
addition, the rhythmicity in emission of volatile compounds from
petunia flowers required the development of models showing the
changes in flux between light and dark conditions. The fluxes
generated by modeling these data from three independent label-
ing experiments are presented in Table 1.
Benzenoid Network in Light Conditions
In the light, both the b-oxidative and non-b-oxidative pathways
contributed to the formation of benzenoid compounds in petunia
flowers (Figure 5A). The flux to BA through the b-oxidative path-
way contributed twice as much as the non-b-oxidative pathway
(v13 versus v20) (Table 1). BPBT RNAi silencing eliminated the
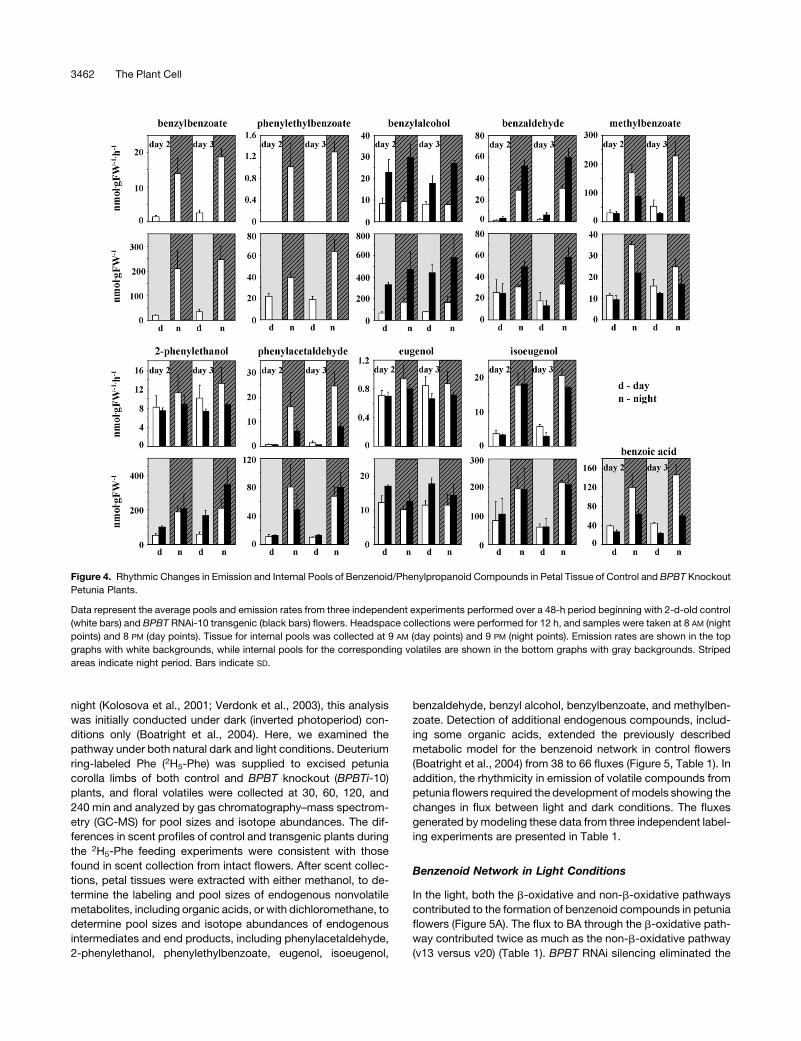
Figure 4. Rhythmic Changes in Emission and Internal Pools of Benzenoid/Phenylpropanoid Compounds in Petal Tissue of Control and BPBT Knockout
Petunia Plants.
Data represent the average pools and emission rates from three independent experiments performed over a 48-h period beginning with 2-d-old control
(white bars) and BPBT RNAi-10 transgenic (black bars) flowers. Headspace collections were performed for 12 h, and samples were taken at 8 AM (night
points) and 8 PM (day points). Tissue for internal pools was collected at 9 AM (day points) and 9 PM (night points). Emission rates are shown in the top
graphs with white backgrounds, while internal pools for the corresponding volatiles are shown in the bottom graphs with gray backgrounds. Striped
areas indicate night period. Bars indicate SD.
3462 The Plant Cell
contribution of benzylbenzoate and phenylethylbenzoate to BA
biosynthesis and simultaneously increased the flux via the non-
b-oxidative pathway (v18 ¼ 10.08 and 6.6 nmol min�1 gFW�1 in
transgenic and control plants, respectively) (Figures 5A and 5B,
Table 1). Although flux to benzaldehyde (v18) increased by 1.5-
fold and its subsequent flux to BA (v20) increased approximately
twofold, the total flux to BA (a sum of v13, v20, v22, v24, and v34)
in transgenic plants decreased 1.75-fold, resulting in a lower flux
to methylbenzoate (v27 ¼ 2.08 and 3.8 nmol min�1 gFW�1 in
transgenic and control plants, respectively) and its subsequent
emission (v30¼ 2.0 and 3.8 nmol min�1 gFW�1 in transgenic and
control plants, respectively) (Figures 5A and 5B, Table 1). Inhi-
bition of benzylbenzoate formation also led to the expansion of
the benzyl alcohol internal pool and doubled its emission (see
Supplemental Figure 1B online).
Benzenoid Network in Dark Conditions
Similar to the situation in the light, both the b-oxidative and
non-b-oxidative pathways contributed to the formation of ben-
zenoid compounds in control petunia flowers. Despite the higher
rate of benzylbenzoate biosynthesis at night, its actual contribu-
tion to BA formation (v13) decreased due to a greater emission
flux (v58 and v59). Thus, the relative input of the b-oxidative
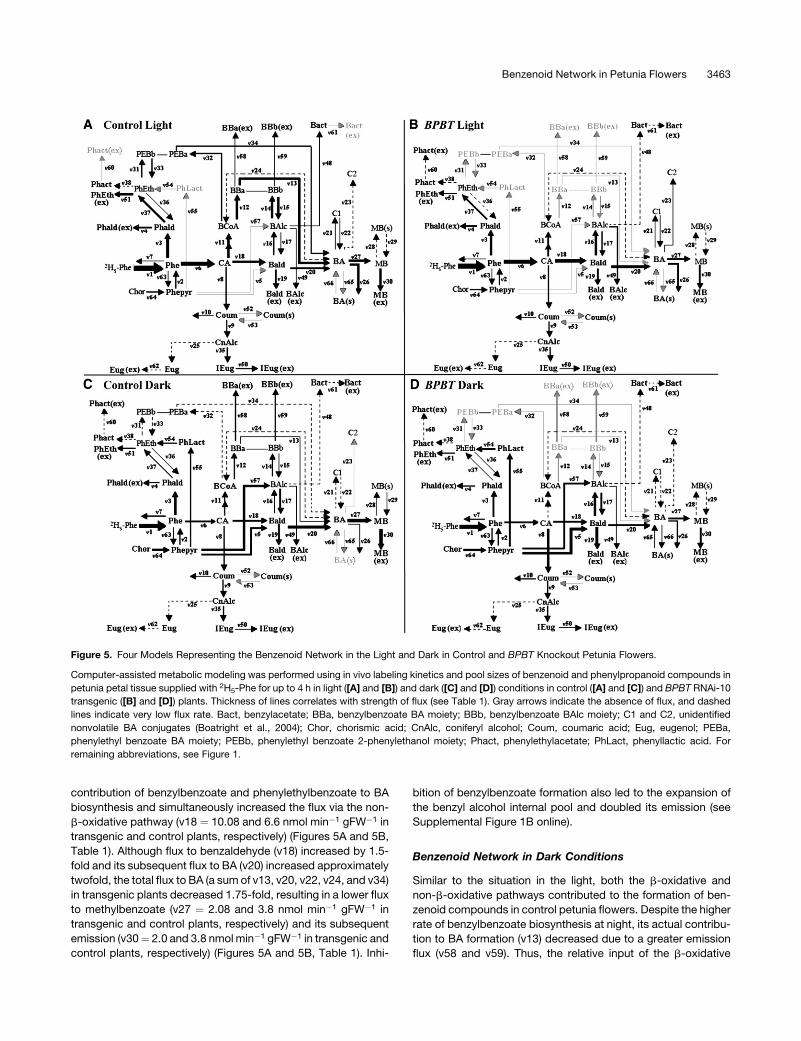
Figure 5. Four Models Representing the Benzenoid Network in the Light and Dark in Control and BPBT Knockout Petunia Flowers.
Computer-assisted metabolic modeling was performed using in vivo labeling kinetics and pool sizes of benzenoid and phenylpropanoid compounds in
petunia petal tissue supplied with 2H5-Phe for up to 4 h in light ([A] and [B]) and dark ([C] and [D]) conditions in control ([A] and [C]) and BPBT RNAi-10
transgenic ([B] and [D]) plants. Thickness of lines correlates with strength of flux (see Table 1). Gray arrows indicate the absence of flux, and dashed
lines indicate very low flux rate. Bact, benzylacetate; BBa, benzylbenzoate BA moiety; BBb, benzylbenzoate BAlc moiety; C1 and C2, unidentified
nonvolatile BA conjugates (Boatright et al., 2004); Chor, chorismic acid; CnAlc, coniferyl alcohol; Coum, coumaric acid; Eug, eugenol; PEBa,
phenylethyl benzoate BA moiety; PEBb, phenylethyl benzoate 2-phenylethanol moiety; Phact, phenylethylacetate; PhLact, phenyllactic acid. For
remaining abbreviations, see Figure 1.
Benzenoid Network in Petunia Flowers 3463

pathway in the dark was diminished when compared with its
contribution in the light (ratio v13/v20 ¼ 2.26 versus 0.03 in the
light and dark, respectively) (Figures 5A and 5C, Table 1). The flux
from phenylethylbenzoate to BA also decreased in the dark.
Based on labeling kinetics, it can be assumed that phenylace-
taldehyde is the major precursor of 2-phenylethanol in the light
(Figure 5A), which was consistent with our recent report that an
RNAi suppression of PAAS gene expression resulted in elimina-
tion of both phenylacetaldehyde and 2-phenylethanol emission
in petunia flowers (Kaminaga et al., 2006). In the dark (Figure 5C),
labeling of both phenylacetaldehyde and 2-phenylethanol was
diluted, possibly due to a contribution from phenyllactic acid, as
was recently hypothesized in rose (Rosa damascena) (Watanabe
et al., 2002).
Analysis of the labeling patterns of internal pools and emitted
volatiles revealed a dilution of isotopic abundance in most mea-
sured compounds in the dark versus light (Figure 6; see Supple-
mental Figures 1A and 1B online). While CA had similar labeling in
the light and dark over a 4-h period (83 and 94% in the light and
dark, respectively), endogenous benzaldehyde over the same time
period was labeled to only 43% in the dark compared with 92% in
the light (see Supplemental Figure 1 online). To simultaneously
account for the divergent labeling patterns of CA and benzalde-
hyde in the dark, it was necessary to invoke an alternate biosyn-
thetic pathway for benzaldehyde from a precursor other than Phe.
Several reports have shown that phenylpyruvic acid can be
nonenzymatically converted to benzaldehyde in vivo in the pres-
ence of oxygen and metal cofactors (Nierop-Groot and De Bont,
1998; Rijnen et al., 2000). Thus, we investigated whether the ex-
perimentally obtained pool sizes and labeling pattern (see below)
of phenylpyruvic acid over a 4-h period could account for the
reduced labeling of compounds downstream of trans-cinnamic
acid, including benzaldehyde, benzyl alcohol, BA, and their im-
mediate products (Figure 6; see Supplemental Figure 1 online).
Indeed, incorporation of these data in the model(s) suggested
that phenylpyruvate is a possible candidate for the observed
dilution of isotopic abundance. Unfortunately, the unavailability
of labeled phenylpyruvate and its observed instability in solution
Table 1. Computer-Simulated Metabolic Fluxes of the Benzenoid
Network in Control and BPBT RNAi-10 Petunia Flowers
Flux Description
Wild Type
Dark
Trans
Dark
Wild Type
Light
Trans
Light
v1 Uptake rate of d5-Phe 79.810 257.435 373.394 371.530
v2 Phepyr / Phe 1.000 1.000 1.000 1.000
v3 Phe / Phald 3.000 1.700 8.300 6.000
v4 Phald / Phald (ex) 1.000 0.600 1.500 1.500
v5 Phepyr / Bald 4.200 5.700 0.000 0.000
v6 Phe / CA 4.810 4.735 14.794 15.230
v7 Phe / other 1.000 1.000 1.000 1.000
v8 CA / coum 0.780 1.735 0.745 0.750
v9 Coum / Cnalc 0.650 0.735 0.635 0.550
v10 Coum / other 0.100 1.000 0.100 0.200
v11 CA / BCoA 1.130 0.100 7.450 4.400
v12 BCoA / BBa 0.700 0.000 6.500 0.000
v13 BBa / BA 0.200 0.000 6.000 0.000
v14 BAlc / BBb 0.700 0.000 6.500 0.000
v15 BBb / BAlc (m) 0.200 0.000 6.000 0.000
v16 Bald / BAlc 0.430 4.000 1.549 4.100
v17 BAlc / Bald 4.000 4.000 0.100 1.500
v18 CA / Bald 2.900 2.900 6.599 10.080
v19 Bald / Bald (ex) 3.800 5.200 2.500 2.300
v20 Bald / BA 6.870 3.400 2.650 5.180
v21 BA / C1 0.100 0.100 0.600 0.600
v22 C1 / BA 0.100 0.100 0.600 0.600
v23 BA / C2 0.000 0.100 0.060 0.100
v24 BCoA / BA 0.050 0.050 0.050 0.050
v25 Cnalc / Eug 0.050 0.035 0.035 0.050
v26 BA / other 0.100 1.000 5.600 3.000
v27 BA / MB (m) 6.000 2.200 3.800 2.080
v28 MB (m) / MB (s) 0.200 0.008 0.000 0.010
v29 MB (s) / MB (m) 0.200 0.008 0.000 0.010
v30 MB (m) / MB (ex) 6.000 2.200 3.800 2.000
v31 PhEth / PEBb 0.030 0.000 0.900 0.000
v32 BCoA / PEBa 0.030 0.000 0.900 0.000
v33 PEBb / PhEth 0.030 0.000 0.900 0.000
v34 PEBa / BA 0.030 0.000 0.900 0.000
v35 Cnalc / Ieug 0.600 0.700 0.600 0.500
v36 PhEth / Phald 0.100 0.100 0.100 0.010
v37 Phald / PhEth 0.600 0.400 4.190 2.500
v38 Pheth / Phact 0.020 0.020 0.010 0.020
v39 MB (m) expansion flux 0.000 0.000 0.000 0.080
v40 BA expansion flux 1.000 0.100 0.090 0.000
v41 Coum expansion flux 0.030 0.000 0.010 0.000
v42 Phe expansion flux 70.000 250.000 350.000 350.000
v43 Phald expansion flux 1.380 0.800 2.710 2.010
v44 PEB expansion flux 0.010 0.000 0.000 0.010
v45 BB expansion flux 0.000 0.000 0.250 0.000
v46 BCoA expansion flux 0.400 0.100 0.050 4.400
v47 PhEth expansion flux 0.500 0.580 2.280 2.270
v48 BAlc / Bact 0.030 0.045 0.100 0.045
v49 BAlc / Balc (ex) 0.500 0.700 0.500 1.000
v50 IEug / IEug (ex) 0.350 0.200 0.550 0.250
v51 PhEth / PhEth (ex) 0.600 0.400 1.800 0.200
v52 Coum (m) / coum (s) 0.000 0.000 0.000 0.000
v53 Coum (s) / coum (m) 0.000 0.000 0.000 0.000
v54 Phelact / PhEth 0.700 0.700 0.000 0.000
v55 Phepyr / Phelact 0.700 0.700 0.000 0.000
v56 BAlc expansion flux 0.400 0.955 0.349 1.555
(Continued)
Table 1. (continued)
Flux Description
Wild Type
Dark
Trans
Dark
Wild Type
Light
Trans
Light
v57 Phepyr / BAlc 5.000 1.700 0.000 0.000
v58 BBa / BBa (ex) 0.500 0.000 0.250 0.000
v59 BBb / BBb (ex) 0.500 0.000 0.250 0.000
v60 Phact / Phact (ex) 0.020 0.020 0.000 0.020
v61 Bact / Bact (ex) 0.030 0.045 0.000 0.045
v62 Eug / Eug (ex) 0.040 0.035 0.035 0.040
v63 Phe / Phepyr 2.000 1.000 0.300 0.300
v64 Chor / Phepyr 8.900 8.100 0.700 0.700
v65 BA (m) / BA (s) 0.000 0.300 0.000 0.000
v66 BA (s) / BA (m) 0.000 0.300 0.000 0.000
For abbreviations, see Figures 1 and 6. Vn refers to the fluxes shown in
Figure 5. Values given are nmol min�1 gFW�1. Numbers in boldface
show fluxes in the dark. m, metabolically active pool; s, storage pool; ex,
exogenous compound; wild type, control, nontransgenic petunia flowers;
Trans, BPBT RNAi-10 petunia flowers.
3464 The Plant Cell
caused by pH-dependent conversion to benzaldehyde and
benzyl alcohol (data not shown) did not allow us to perform
feeding experiments and test our hypothesis experimentally.
It is well established that in many species phenylpyruvate is
synthesized directly from chorismate, although this reaction has
not been conclusively demonstrated in plants (Jung et al., 1986;
Warpeha et al., 2006). In our labeling experiments, phenylpyr-
uvate was labeled up to 25% over a 4-h period when 2H5-Phe
was supplied, suggesting that Phe can be converted back to
phenylpyruvate in petunia petals, presumably by transamination.
Although biosynthesis of phenylpyruvate from Phe is a one-step
conversion, like formation of CA from Phe, labeling of phenyl-
pyruvate was 70% less than labeling of CA, indicating that Phe is
not likely the primary source of phenylpyruvate in petunia petals.
BPBT RNAi silencing did not affect the flux from Phe to CA to
benzaldehyde (see fluxes v6 and v18) but slightly increased the
relative contribution of the hypothesized alternative pathway
from phenylpyruvate to benzaldehyde (v5 ¼ 5.7 versus 4.2 nmol
min�1 gFW�1 in transgenic and control plants, respectively) and
simultaneously decreased its contribution to benzyl alcohol
biosynthesis (v57¼ 1.7 versus 5 nmol min�1 gFW�1 in transgenic
and control plants, respectively) (Figures 5C and 5D, Table 1).
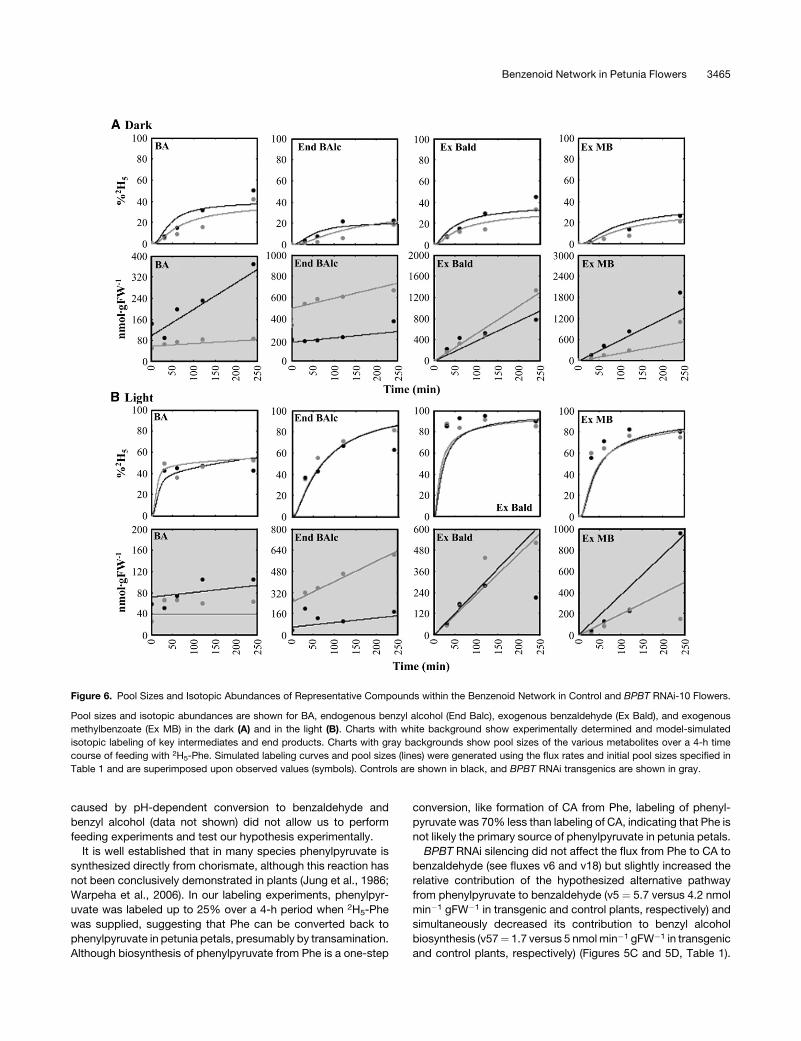
Figure 6. Pool Sizes and Isotopic Abundances of Representative Compounds within the Benzenoid Network in Control and BPBT RNAi-10 Flowers.
Pool sizes and isotopic abundances are shown for BA, endogenous benzyl alcohol (End Balc), exogenous benzaldehyde (Ex Bald), and exogenous
methylbenzoate (Ex MB) in the dark (A) and in the light (B). Charts with white background show experimentally determined and model-simulated
isotopic labeling of key intermediates and end products. Charts with gray backgrounds show pool sizes of the various metabolites over a 4-h time
course of feeding with 2H5-Phe. Simulated labeling curves and pool sizes (lines) were generated using the flux rates and initial pool sizes specified in
Table 1 and are superimposed upon observed values (symbols). Controls are shown in black, and BPBT RNAi transgenics are shown in gray.
Benzenoid Network in Petunia Flowers 3465
This change in flux led to a twofold expansion of the endogenous
benzaldehyde pool (see Supplemental Figure 1 online) as well as
a 1.7-fold increase in its emission over the 4-h labeling period
(Figure 6A). Similar to benzaldehyde, the endogenous benzyl
alcohol pool (Figure 6A) and its emission rate (see Supplemental
Figure 1 online) were increased in transgenics. This was achieved
due to (1) elimination of flux to benzylbenzoate, for which benzyl
alcohol is an immediate precursor, and (2) redirection of the flux
from phenylpyruvate to benzyl alcohol via benzaldehyde.
The elimination of benzylbenzoate flux to free BA in transgenic
plants also led to a twofold decrease in the flux from benzalde-
hyde to BA (v20 ¼ 3.4 versus 6.87 nmol min�1 gFW�1 in
transgenic and control plants, respectively) (Figures 5C and 5D,
Table 1). As a result, the endogenous pool of BA and methyl-
benzoate emission were decreased approximately threefold and
twofold, respectively (Figure 6A). Elimination of phenylethylben-
zoate in BPBT RNAi plants resulted in only slight expansion of the
endogenous 2-phenylethanol pool, which did not lead to an
increase in its emission. The lack of expansion was a result of a
reduction in flux from phenylacetaldehyde to 2-phenylethanol in
transgenics (v37 ¼ 0.4 versus 0.6 nmol min�1 gFW�1 in trans-
genic and control plants, respectively). There was also a de-
creased level of phenylacetaldehyde in BPBT RNAi plants as a
result of the direct reduction in flux from Phe (Table 1, v3).
Elimination of BPBT transcripts also caused an increase in the
flux from CA to coumaric acid (v8¼ 1.74 versus 0.78 nmol min�1
gFW�1 in transgenic and control plants, respectively) but did not
change the flux downstream toward eugenol and isoeugenol
(Figures 5C and 5D). Rather, modeling suggested the possibility
that knockout of BPBT may increase flux to flavonoids (v10¼ 1.0
versus 0.1 nmol min�1 gFW�1 in transgenic and control plants,
respectively), consistent with the accumulation of 39,49 flavon-
diols and flavonols in the transgenic plants (see below).
Effect of BPBT Gene Silencing on Morphology
of Petunia Plants
Complete elimination of BPBT transcripts resulted in phenotypic
changes in growth and development when compared with
control nontransgenic plants and plants with reduced BPBT
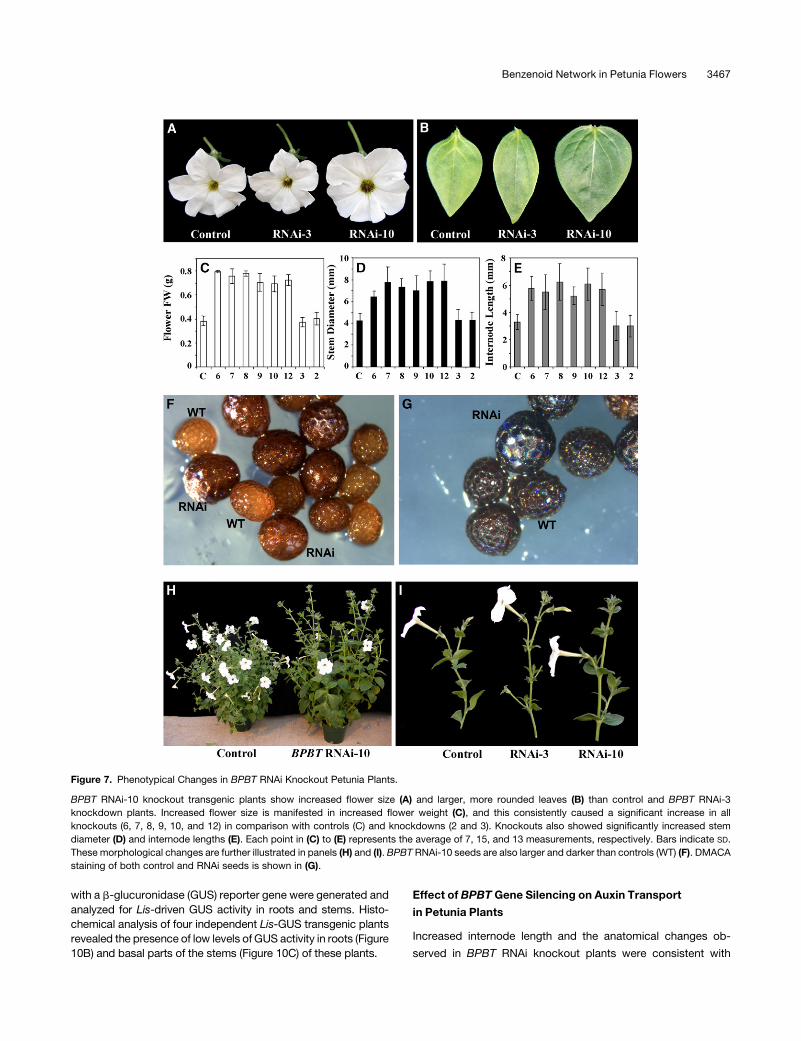
expression (Figure 7). Flowers from BPBT knockouts were two-
fold larger based on fresh weight (Figures 7A and 7C) and
bloomed at least 1 week later than flowers of control and BPBT
knockdown plants. Flowers of BPBT knockouts also had larger
anthers, which displayed a delay in pollen release. In addition,
seeds of BPBT knockout plants were larger and darker than
seeds from controls (Figure 7F). Staining of these seeds with
p-dimethylaminocinnamaldehyde (DMACA), which changes to a
dark color after binding to 39,49 flavon diols, proanthocyanindins,
and its precursors, revealed that silencing of the BPBT gene
resulted in qualitatively more 39,49 flavon diols, flavonols, and
soluble flavonoids than in control seeds (Figure 7G). Levels of
other flavonoids (primarily quercetin and kaempferol rhamno-
pyranosides and diglycosides) were slightly increased. However,
levels of aglycone flavonols, which function as auxin transport
and kinase/phosphatase inhibitors, were not different from non-
transformed plants. These phenotypes were heritable and cor-
related with BPBT suppression in the T1 generation.
Comparisons of 6-week-old control and transgenic plants
revealed that BPBT knockout plants exhibited longer internodes,
thicker stems, and larger, more rounded leaves, while transgenic
plants with reduced BPBT expression were not different from
untransformed control plants (Figures 7B, 7D, 7E, 7H, and 7I).
The average internode length and stem diameter were both
1.75-fold greater in BPBT knockouts than in control or BPBTi-2
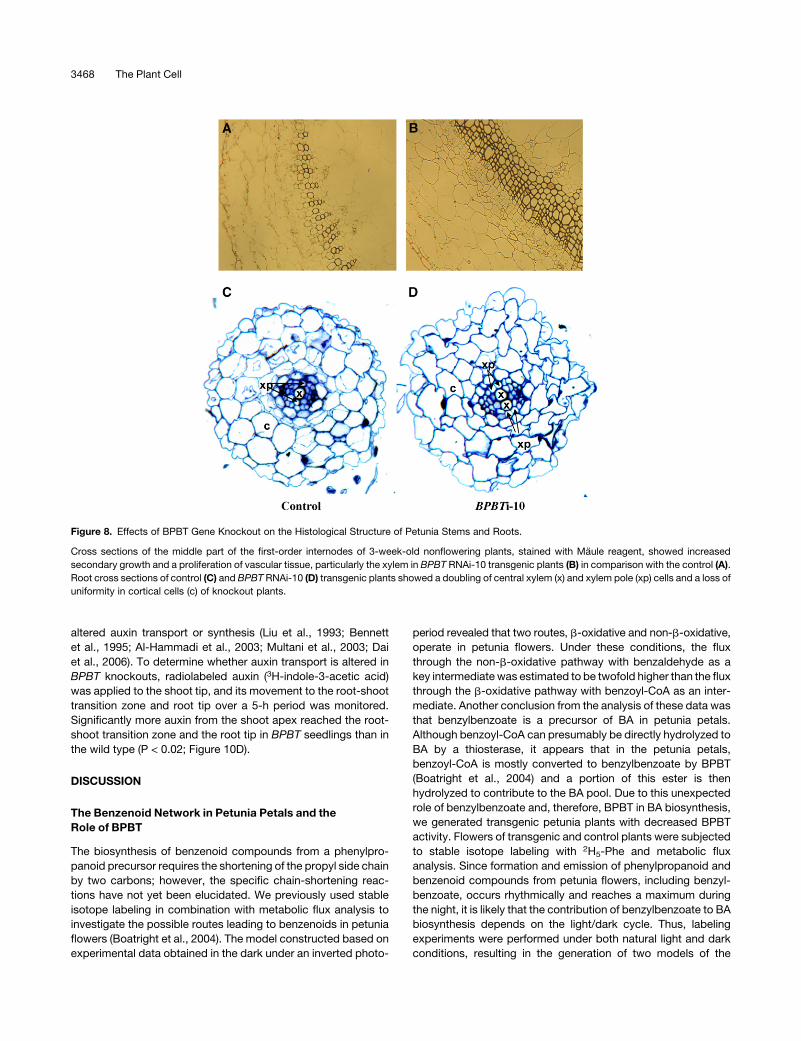
and -3 plants (Figures 7D and 7E). Histochemical analysis of
cross sections of the middle part of the first-order internodes of
3-week-old nonflowering BPBTi-10 plants stained with the
Maule reagent revealed that the increased thickness of knock-
outs’ stems was due to larger cell sizes, increased secondary
growth, and a proliferation of the vascular tissue, particularly the
xylem (Figures 8A and 8B). Cross sections of the root revealed a
doubling of central xylem and xylem pole cells and a loss of
uniformity in cortical cells of knockout plants (Figures 8C and 8D).
BPBT knockout plants also exhibited altered vegetative growth
and development. Under greenhouse conditions, BPBT knock-
outs produced fewer first-order lateral branches (on average
three to four) in contrast with the control plants of the same age
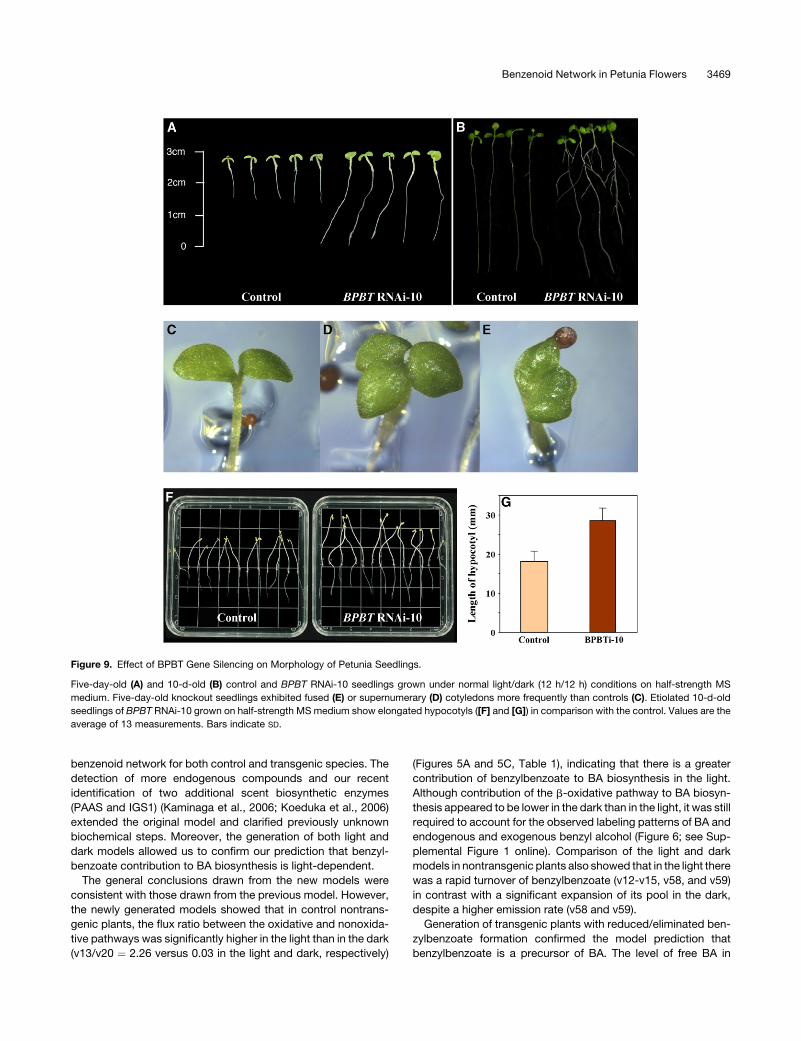
with seven to eight branches. Transgenic 5-d-old seedlings
grown under normal light/dark (12 h/12 h) conditions on half-
strength Murashige and Skoog (MS) medium had longer primary
roots (Figure 9A), and 10-d-old seedlings had on average ap-
proximately three lateral roots per seedling, while controls had
one or none (2.8 6 0.97 and 0.5 6 0.62, P < 0.001, respectively;
Figure 9B). BPBT knockout seedlings exhibited epinastic coty-
ledons, and ;25% of BPBT knockout seedlings exhibited fused
or supernumerary cotyledons (Figures 9C to 9E). Moreover,
hypocotyl length in etiolated BPBT knockout seedlings was
1.6-fold greater than in controls (Figures 9F and 9G).
As altered flavonoid production was observed in seeds of BPBT
knockoutsand increasedphenylpropanoid intermediatesobserved
in BPBT flowers, total flavonols in methanolic extracts from seedl-
ing shoot tissues were analyzed as described previously (Murphy
et al., 2000; Peer et al., 2001). Flavonol levels in seedling shoot
tissues of BPBT knockouts were not different from the wild type.
Tissue-Specific Activity of Native BPBT and Lis Promoters
Differences in growth and development between BPBT RNAi
knockouts and control plants were unexpected for at least two
reasons. First, it was previously shown that BPBT has petal-
specific expression, and second, the petal-specific (in Clarkia
breweri) Lis promoter was used to silence the BPBT gene.
However, expression of neither gene, BPBT or LIS, was previ-
ously analyzed in root or stem tissues (Dudareva et al., 1996;
Boatright et al., 2004). To examine whether BPBT is expressed in
these tissues, RNA gel blot analysis was performed with mRNA
isolated from petunia roots, stems, and leaves as well as corolla
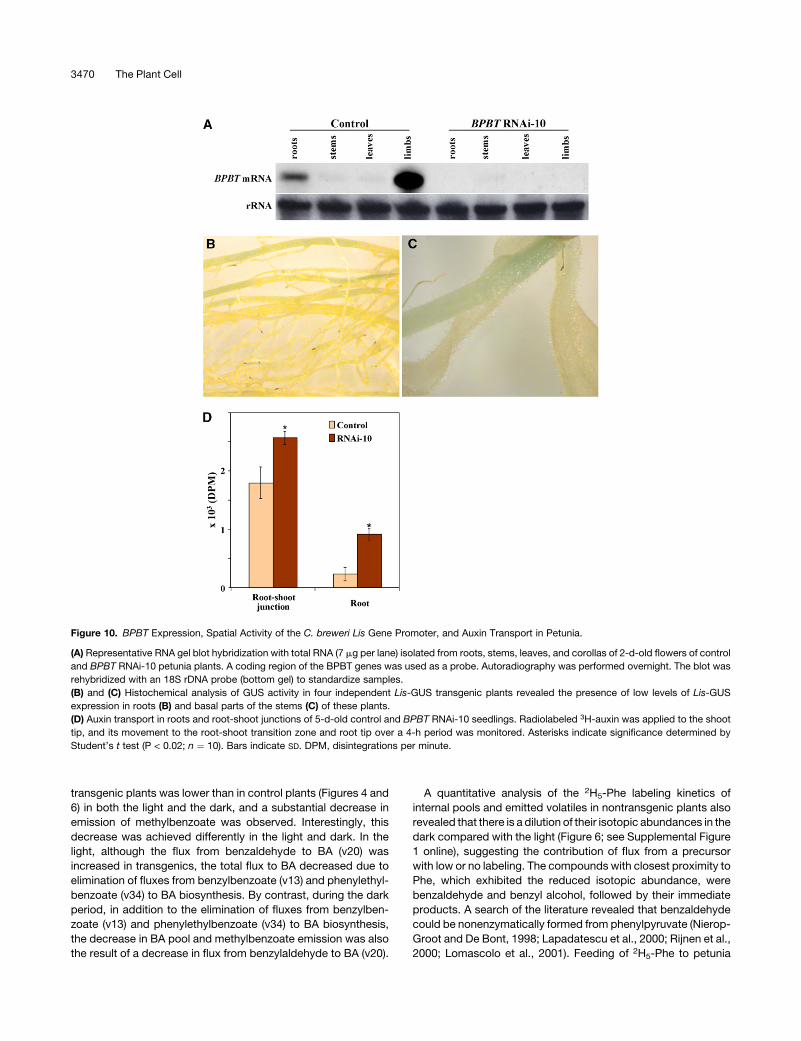
limbs for comparison. Hybridization with a BPBT probe revealed
that in addition to strong expression in corolla limbs, as previ-
ously reported (Boatright et al., 2004), BPBT was also expressed
in roots but at a relatively low level (Figure 10A). The absence of
BPBT expression in roots of BPBT RNAi knockouts (Figure 10A)
suggested that the Lis promoter might be active in petunia roots.
To analyze the spatial activity of the C. breweri Lis gene promoter,
transgenic petunia plants containing the Lis promoter fused
3466 The Plant Cell
with a b-glucuronidase (GUS) reporter gene were generated and
analyzed for Lis-driven GUS activity in roots and stems. Histo-
chemical analysis of four independent Lis-GUS transgenic plants
revealed the presence of low levels of GUS activity in roots (Figure
10B) and basal parts of the stems (Figure 10C) of these plants.
Effect of BPBT Gene Silencing on Auxin Transport
in Petunia Plants
Increased internode length and the anatomical changes ob-
served in BPBT RNAi knockout plants were consistent with
Figure 7. Phenotypical Changes in BPBT RNAi Knockout Petunia Plants.
BPBT RNAi-10 knockout transgenic plants show increased flower size (A) and larger, more rounded leaves (B) than control and BPBT RNAi-3
knockdown plants. Increased flower size is manifested in increased flower weight (C), and this consistently caused a significant increase in all
knockouts (6, 7, 8, 9, 10, and 12) in comparison with controls (C) and knockdowns (2 and 3). Knockouts also showed significantly increased stem
diameter (D) and internode lengths (E). Each point in (C) to (E) represents the average of 7, 15, and 13 measurements, respectively. Bars indicate SD.
These morphological changes are further illustrated in panels (H) and (I). BPBT RNAi-10 seeds are also larger and darker than controls (WT) (F). DMACA
staining of both control and RNAi seeds is shown in (G).
Benzenoid Network in Petunia Flowers 3467
altered auxin transport or synthesis (Liu et al., 1993; Bennett
et al., 1995; Al-Hammadi et al., 2003; Multani et al., 2003; Dai
et al., 2006). To determine whether auxin transport is altered in
BPBT knockouts, radiolabeled auxin (3H-indole-3-acetic acid)
was applied to the shoot tip, and its movement to the root-shoot
transition zone and root tip over a 5-h period was monitored.
Significantly more auxin from the shoot apex reached the root-
shoot transition zone and the root tip in BPBT seedlings than in
the wild type (P < 0.02; Figure 10D).
DISCUSSION
The Benzenoid Network in Petunia Petals and the
Role of BPBT
The biosynthesis of benzenoid compounds from a phenylpro-
panoid precursor requires the shortening of the propyl side chain
by two carbons; however, the specific chain-shortening reac-
tions have not yet been elucidated. We previously used stable
isotope labeling in combination with metabolic flux analysis to
investigate the possible routes leading to benzenoids in petunia
flowers (Boatright et al., 2004). The model constructed based on
experimental data obtained in the dark under an inverted photo-
period revealed that two routes, b-oxidative and non-b-oxidative,
operate in petunia flowers. Under these conditions, the flux
through the non-b-oxidative pathway with benzaldehyde as a
key intermediate was estimated to be twofold higher than the flux
through the b-oxidative pathway with benzoyl-CoA as an inter-
mediate. Another conclusion from the analysis of these data was
that benzylbenzoate is a precursor of BA in petunia petals.
Although benzoyl-CoA can presumably be directly hydrolyzed to
BA by a thiosterase, it appears that in the petunia petals,
benzoyl-CoA is mostly converted to benzylbenzoate by BPBT
(Boatright et al., 2004) and a portion of this ester is then
hydrolyzed to contribute to the BA pool. Due to this unexpected
role of benzylbenzoate and, therefore, BPBT in BA biosynthesis,
we generated transgenic petunia plants with decreased BPBT
activity. Flowers of transgenic and control plants were subjected
to stable isotope labeling with 2H5-Phe and metabolic flux
analysis. Since formation and emission of phenylpropanoid and
benzenoid compounds from petunia flowers, including benzyl-
benzoate, occurs rhythmically and reaches a maximum during
the night, it is likely that the contribution of benzylbenzoate to BA
biosynthesis depends on the light/dark cycle. Thus, labeling
experiments were performed under both natural light and dark
conditions, resulting in the generation of two models of the
Figure 8. Effects of BPBT Gene Knockout on the Histological Structure of Petunia Stems and Roots.
Cross sections of the middle part of the first-order internodes of 3-week-old nonflowering plants, stained with Maule reagent, showed increased
secondary growth and a proliferation of vascular tissue, particularly the xylem in BPBT RNAi-10 transgenic plants (B) in comparison with the control (A).
Root cross sections of control (C) and BPBT RNAi-10 (D) transgenic plants showed a doubling of central xylem (x) and xylem pole (xp) cells and a loss of
uniformity in cortical cells (c) of knockout plants.
3468 The Plant Cell
benzenoid network for both control and transgenic species. The
detection of more endogenous compounds and our recent
identification of two additional scent biosynthetic enzymes
(PAAS and IGS1) (Kaminaga et al., 2006; Koeduka et al., 2006)
extended the original model and clarified previously unknown
biochemical steps. Moreover, the generation of both light and
dark models allowed us to confirm our prediction that benzyl-
benzoate contribution to BA biosynthesis is light-dependent.
The general conclusions drawn from the new models were
consistent with those drawn from the previous model. However,
the newly generated models showed that in control nontrans-
genic plants, the flux ratio between the oxidative and nonoxida-
tive pathways was significantly higher in the light than in the dark
(v13/v20 ¼ 2.26 versus 0.03 in the light and dark, respectively)
(Figures 5A and 5C, Table 1), indicating that there is a greater
contribution of benzylbenzoate to BA biosynthesis in the light.
Although contribution of the b-oxidative pathway to BA biosyn-
thesis appeared to be lower in the dark than in the light, it was still
required to account for the observed labeling patterns of BA and
endogenous and exogenous benzyl alcohol (Figure 6; see Sup-
plemental Figure 1 online). Comparison of the light and dark
models in nontransgenic plants also showed that in the light there
was a rapid turnover of benzylbenzoate (v12-v15, v58, and v59)
in contrast with a significant expansion of its pool in the dark,
despite a higher emission rate (v58 and v59).
Generation of transgenic plants with reduced/eliminated ben-
zylbenzoate formation confirmed the model prediction that
benzylbenzoate is a precursor of BA. The level of free BA in
Figure 9. Effect of BPBT Gene Silencing on Morphology of Petunia Seedlings.
Five-day-old (A) and 10-d-old (B) control and BPBT RNAi-10 seedlings grown under normal light/dark (12 h/12 h) conditions on half-strength MS
medium. Five-day-old knockout seedlings exhibited fused (E) or supernumerary (D) cotyledons more frequently than controls (C). Etiolated 10-d-old
seedlings of BPBT RNAi-10 grown on half-strength MS medium show elongated hypocotyls ([F] and [G]) in comparison with the control. Values are the
average of 13 measurements. Bars indicate SD.
Benzenoid Network in Petunia Flowers 3469
transgenic plants was lower than in control plants (Figures 4 and
6) in both the light and the dark, and a substantial decrease in
emission of methylbenzoate was observed. Interestingly, this
decrease was achieved differently in the light and dark. In the
light, although the flux from benzaldehyde to BA (v20) was
increased in transgenics, the total flux to BA decreased due to
elimination of fluxes from benzylbenzoate (v13) and phenylethyl-
benzoate (v34) to BA biosynthesis. By contrast, during the dark
period, in addition to the elimination of fluxes from benzylben-
zoate (v13) and phenylethylbenzoate (v34) to BA biosynthesis,
the decrease in BA pool and methylbenzoate emission was also
the result of a decrease in flux from benzylaldehyde to BA (v20).
A quantitative analysis of the 2H5-Phe labeling kinetics of
internal pools and emitted volatiles in nontransgenic plants also
revealed that there is a dilution of their isotopic abundances in the
dark compared with the light (Figure 6; see Supplemental Figure
1 online), suggesting the contribution of flux from a precursor
with low or no labeling. The compounds with closest proximity to
Phe, which exhibited the reduced isotopic abundance, were
benzaldehyde and benzyl alcohol, followed by their immediate
products. A search of the literature revealed that benzaldehyde
could be nonenzymatically formed from phenylpyruvate (Nierop-
Groot and De Bont, 1998; Lapadatescu et al., 2000; Rijnen et al.,
2000; Lomascolo et al., 2001). Feeding of 2H5-Phe to petunia
Figure 10. BPBT Expression, Spatial Activity of the C. breweri Lis Gene Promoter, and Auxin Transport in Petunia.
(A) Representative RNA gel blot hybridization with total RNA (7 mg per lane) isolated from roots, stems, leaves, and corollas of 2-d-old flowers of control
and BPBT RNAi-10 petunia plants. A coding region of the BPBT genes was used as a probe. Autoradiography was performed overnight. The blot was
rehybridized with an 18S rDNA probe (bottom gel) to standardize samples.
(B) and (C) Histochemical analysis of GUS activity in four independent Lis-GUS transgenic plants revealed the presence of low levels of Lis-GUS
expression in roots (B) and basal parts of the stems (C) of these plants.
(D) Auxin transport in roots and root-shoot junctions of 5-d-old control and BPBT RNAi-10 seedlings. Radiolabeled 3H-auxin was applied to the shoot
tip, and its movement to the root-shoot transition zone and root tip over a 4-h period was monitored. Asterisks indicate significance determined by
Student’s t test (P < 0.02; n ¼ 10). Bars indicate SD. DPM, disintegrations per minute.
3470 The Plant Cell
petals led to a 25% labeling of phenylpyruvate over a 4-h period,
indicating that Phe can be converted to phenylpyruvate, as was
recently demonstrated in etiolated Arabidopsis thaliana seed-
lings (Warpeha et al., 2006). Incorporation of flux from phenyl-
pyruvic acid to benzaldehyde and benzyl alcohol in the model
accounted for the reduced labeling of these two compounds as
well as that of downstream compounds in the dark.
Knockout of BPBT expression led to the redistribution of flux
from the non-Phe source, presumably phenylpyruvic acid, to
benzaldehyde and benzyl alcohol in the dark (Figures 5C and 5D),
causing an expansion of their endogenous pools and an increase
in their emission (Figure 6; see Supplemental Figure 1 online).
This redistribution in flux could be the result of possible feedback
regulation of benzyl alcohol biosynthesis from phenylpyruvate by
benzyl alcohol, whose internal pool was expanded due to the
elimination of flux to benzylbenzoate. The reason for the contri-
bution of phenylpyruvic acid only in the dark remains unknown;
however, we do not exclude the possibility of the involvement of
pH and oxygen in influencing benzaldehyde synthesis from
phenylpyruvate, as has been demonstrated in Lactococcus
lactis (Rijnen et al., 2000), nor can we exclude the possibility of
the existence of alternative pathways independent of Phe and
phenylpyruvate. A similar dilution of 2-phenylethanol labeling
occurred in the dark, possibly due to the contribution of flux from
phenylpyruvic acid via phenyllactic acid (Watanabe et al., 2002)
leading to a subsequent dilution of phenylacetaldehyde, which
was more rapidly labeled in the light (see Supplemental Figure 1
online).
It should be noted that in these feeding experiments, we are
likely measuring maximum velocities, which may not correspond
to fluxes in vivo. A comparison of emission rate on a plant with that
in feeding experiments with an exogenous precursor can provide
useful information about potential rate-limiting steps. Indeed, the
overall level of volatile emission was higher in Phe-fed, excised
corollas, especially in the light, indicating that the levelof Phe in the
cell plays a crucial role in the regulation of the formation of
benzenoid compounds in petunia flowers (data not shown).
The analyses presented here and earlier (Boatright et al., 2004)
illustrate the concept of an integrative cycle of metabolic flux
analysis followed by metabolic engineering, which together can
lead to increased understanding of the complexity of metabolic
networks. Additional genetic perturbations based on the data
presented here are likely to reveal new information that will in turn
lead to further refinements in the flux models.
The Role of BPBT in Vegetative Tissues
The altered growth phenotypes observed in multiple indepen-
dent BPBT knockout lines were consistent and more pro-
nounced than in knockdown lines, which suggests that BPBT is
involved in metabolic processes in vegetative and floral tissues.
Elongated internodes (Figures 7E, 7H, and 7I) and increased
lateral root number (Figure 9B) found in knockout lines both
correlate with increased auxin transport (Noh et al., 2001; Li et al.,
2005) and are consistent with the observed increase in auxin
transport capacity of BPBT knockout plants (Figure 10D). Altered
vascular tissue structure and increased cell proliferation seen in
BPBT knockouts (Figure 8) were similar to what is seen in the br2/
pgp1 mutant in maize (Zea mays) (Multani et al., 2003). Moreover,
similar morphological changes have been found to correlate
with accumulation of auxin in localized regions in br2 tissues
(A. Knoeller, J.J. Blakeslee, and A.S. Murphy, unpublished data).
Epinastic, fused, and supernumerary cotyledons similar to
those seen in BPBT knockouts (Figures 9C to 9E) are often
associated with defects in auxin transport. Epinastic cotyledons
observed in the pgp19 auxin transport mutant of Arabidopsis
result from increased auxin accumulation in cotyledons and can
be phenocopied by application of exogenous auxin (Noh et al.,
2001; W.A. Peer and A.S. Murphy, unpublished data). Fused and
supernumerary cotyledons have been associated with auxin
accumulation resulting from localized increases or decreases in
auxin transport as is seen in multiple Arabidopsis mutants
(Bennett et al., 1995; Swarup et al., 2004; Dai et al., 2006;
Kuroha et al., 2006) and the polycotyledon mutant of tomato
(Solanum lycopersicum) (Al-Hammadi et al., 2003). Alterations in
filament length and anther size seen in BPBT knockouts are also
seen in auxin transport mutants (Noh et al., 2001; Al-Hammadi
et al., 2003). Loss of BPBT function might be expected to
modulate auxin-dependent growth by altering accumulations
of phenylpropanoid compounds, which are shown to inhibit
transport protein activity, interfere with auxin action, enhance
apoplastic acidification, and/or contribute to cell wall structure.
Suppression of BPBT activity increases phenylpropanoid in-
termediate levels in flowers and results in high flavonoid content
in the BPBT transgenic testa (Figure 7G), which could be suffi-
cient to alter auxin-dependent development in the embryonic
cotyledons (Kakiuchi et al., 2006). However, BPBT suppression
did not affect the concentration or distribution of flavonols in
seedlings, except in the root-shoot transition zone (see Supple-
mental Figure 2 online), where changes in flavonol levels do not
appear to alter polar auxin transport (Peer et al., 2004).
While trans-cinnamic acid has no apparent auxin-like activity
(Thimann, 1938), it has been shown to competitively interfere
with auxin signaling at low micromolar concentrations (van
Overbeek et al., 1951). We found an ;1.4-fold increase in
trans-cinnamic acid levels in flowers of BPBT knockout plants
under both light and dark conditions (see Supplemental Figure
1 online). However, we were unable to detect differences in CA
levels between embryos of knockout and control plants. As such,
more detailed studies will be needed to determine whether trans-
cinnamic acid accumulations directly regulate development and
auxin transport in BPBT knockouts.
Another possibility for increased auxin transport in BPBT
knockouts is apoplastic acidification by increased organic acid
production. According to chemiosmotic models, auxin transport
depends on the pH gradient across the plasma membrane
(Goldsmith and Goldsmith, 1977; Li et al., 2005). Analysis of apo-
plastic root pH using bromocresol purple dye suggested that there
was no obvious increase in root apoplastic pH (data not shown).
Altered auxin transport has been seen in Arabidopsis mutants
exhibiting aberrant vascular structure (Zhong and Ye, 2001;
Surpin et al., 2003; Blakeslee et al., 2005). BPBT knockout
shoots and roots showed increased size and number of auxin-
conducting vascular parenchyma cells as well as altered cortical
cell shape (Figure 8). Staining of BPBT knockout roots with
Toluidine Blue O did not reveal any obvious differences in the
Benzenoid Network in Petunia Flowers 3471

distribution of lignin or pectin, but BPBT knockout roots were
more permeable to bromocresol purple dye than controls (data
not shown), suggesting altered cell wall composition or structure.
Cinnamic and p-coumaric acids have been shown to affect
membrane permeability and fluidity (Castelli et al., 1999). Both
characteristics would affect rates of indole-3-acetic acid parti-
tioning into membranes and interactions with PGP and PIN
transporters that are thought to bind their substrates within the
inner membrane leaflet (Blakeslee et al., 2005). Thus, the devel-
opmental phenotypes and increased auxin transport observed in
BPBT knockouts are more likely a consequence of vascular
tissue expansion resulting from modified cell wall structure than
a direct modulation of cellular auxin transport processes by loss
of BPBT. However, it is possible that altered metabolic fluxes in
BPBT knockouts could result in increased auxin production and
consequent developmental changes. We also cannot exclude
the possibility that BPBT RNAi silencing affects another acyl-
transferase, which may in some unknown way impact auxin
metabolism. Further analysis of BPBT activity in vegetative
phenylpropanoid metabolism is required to determine its exact
function in these tissues.
METHODS
Plant Material and Transformation
Petunia hybrida cv Mitchell (Ball Seed) and the transgenic petunia plants
were grown under normal greenhouse conditions and in vitro to provide
material of the same age and physiological conditions for experiments.
Transgenic petunias were obtained via Agrobacterium tumefaciens
(strain GV3101 carrying plasmid pEF1.LIS-BEBTi) leaf disk transforma-
tion using the standard leaf disk transformation method (Horsch et al.,
1985). Rooted plants were screened for the presence of the LIS promoter
by PCR with the specific primers LIS-F (59-GGCACCCACTTCTTAAT-
GATC-39) and LIS-R (59-CTGGGATATGATAGGATGTGG-39) and for the
hygromycin resistance ntpII gene with the primers Hyg-F (59-AAGCCT-
GAACTCACCGCGAC-39) and Hyg-R (59-TCCACTATCGGCGAGTA-
CTTC-39). PCR-positive plants were transferred to the greenhouse. T0
ant T1 transformants were self-pollinated manually, and obtained seeds
were analyzed for segregation by germinating on MS medium supple-
ment with hygromicin (20 mg/L).
Generation of RNAi Silencing Construct
A modified pRNA69 was first constructed in which the 35S promoter was
replaced with the LIS promoter (a SacI-XhoI fragment). Next, the RNAi
construct for BPBT was generated by first splicing a BPBT fragment from
nucleotide 159 to nucleotide 509 of the coding region in direct orientation
into the polylinker site downstream of the intron in the pRNA69 vector.
Next, the same BPBT fragment was spliced in the inverted orientation into
the polylinker site upstream of the intron in this vector. Finally, the section
of this constructed plasmid that contained the LIS promoter and the two
BPBT fragments in opposite orientation separated by the intron was cut
out using SacI-PstI and spliced into a modified pCAMBIA 1303 that had
previously been digested with PmlI and HindIII, treated with Klenow, and
self-ligated.
Morphological Analysis of Transgenic Plants
To estimate the phenotypic differences between the BPBT knockouts
and control petunia plants, 6-week-old plants were measured to calculate
average length of the internodes, stem diameters, and fresh weight of
flowers. To measure the number and length of the lateral roots, the steri-
lized seeds were germinated on solid half-strength MS medium, pH 5.2,
without antibiotics for 10 d. Three repetitions of 30 seedlings of each
variant were analyzed, plates were scanned, and images were analyzed
with Scion Image for Windows (http://www.scioncorp.com) to measure
length of lateral roots.
Sampling Volatiles
Floral volatiles were collected from control and BPBT RNAi flowers, using
a closed-loop stripping method (Donath and Boland, 1995; Dudareva
et al., 2005) under growth chamber conditions (218C, 50% relative
humidity, 150 mmol�m�2.s�1 light intensity, and 12-h photoperiod). To
determine the internal pools of volatiles, 1 g of 2-d-old corolla tissue was
collected from each transgenic and control plant at the same time of day
to minimize the effect of rhythmicity. Volatiles were extracted with 10 mL
of dichloromethane, concentrated to 160 mL, and analyzed by GC-MS
(Boatright et al., 2004).
BPBT Enzyme Assays
Crude protein extracts were prepared from corollas of 2-d-old control and
transgenic petunia flowers and analyzed for BPBT activity as described
previously (Boatright et al., 2004).
Labeling Experiment and Metabolic Flux Analysis
Feeding experiments were performed as described previously (Boatright
et al., 2004). Corollas from 2-d-old control and BPBT knockout flowers
were placed on moist filter paper supplied with deuterium-labeled Phe
(L-Phe-ring-2H5; Cambridge Isotope Laboratories) (total of 10 corollas per
each experiment), and emitted volatiles and internal pools were collected
after 30, 60, 120, and 240 min. Labeling experiments under light condi-
tions always started at 9 AM and under dark conditions at 11 PM. Com-
puter modeling of labeling data was performed as described by Boatright
et al. (2004).
Organic and Amino Acid Analyses
For internal pool, organic acid, and amino acid analyses, flower petal
tissue was collected after each feeding, frozen in liquid nitrogen and
stored at �808C. For organic and amino acids, 0.5 g of frozen tissue was
extracted overnight with 10 mL of 100% methanol. Then, 5 mL of chlo-
roform and 6 mL of deionized water were added to each vial, as well as
25 mL of each internal standard (10 mM Hyp for amino acid fraction and
10 mM 4-chlorobenzoic acid for organic acid fraction). After shaking, vials
were stored at 48C overnight to allow separation of layers. The aqueous
layer was removed, dried, and then redissolved in 4 mL of deionized
water. Three milliliters were used for organic acid analysis and 1 mL for
amino acid analysis. For organic acid analysis, 20 mL of 1 N HCl and 3 mL
of ethyl acetate were added, and the sample was vortexed for 1 min and
centrifuged for 2 min at 2000 rpm. The ethyl acetate fraction was
transferred to a clean vial and the above extraction was repeated. The
ethyl acetate fraction was then dried, redissolved in 400 mL of 100%
methanol, and dried again. For derivatization, 20 mL of pyridine and
250 mL of BSTFA were added to the sample and incubated at 758C for 2 h.
Samples were then analyzed by GC-MS.
For the amino acid analysis, the 1 mL of remaining extract underwent
ion exchange chromatography using a Dowex 50-Hþ 3 8, 200 mesh
column. Amino acids were eluted from the Dowex column with 6 mL of 6 M
NH4OH, dried, dissolved in 0.4 mL of 60% methanol, and dried again. For
derivatization, 100 mL of methylene chloride was added to a sample,
which was then dried. After adding 0.2 mL of a 5:1 (v/v) isobutanol:acetyl
3472 The Plant Cell
chloride mixture, samples were heated for 20 min at 1208C and then dried
again. An aliquot of 100 mL of heptafluorobutyric anhydride was added,
and samples were incubated at 1208C for 10 min. Samples were then
cooled to room temperature and brought to incipient dryness to minimize
loss of the more volatile amino acid derivatives. Finally, 200 mL of a 1:1
(v/v) ethyl acetate:acetic anhydride mixture was added, and samples
were analyzed by GC-MS as described previously (Boatright et al., 2004).
RNA Isolation and Analysis
Total RNA was isolated from petal limbs, leaves, stems, and roots of
P. hybrida cv Mitchell and BPBT RNAi transgenics and analyzed as
previously described (Boatright et al., 2004). A 1.9-kb EcoRI fragment
containing the coding region of the BPBT gene was used as a probe in
RNA gel blot analysis. Seven micrograms of total RNA were loaded in
each lane. The blots were rehybridized with 18S rDNA for loading control.
Light Microscopy
Stem cross sections (10-mm thick) were prepared from paraffin-embedded
samples. The sections were first deparaffinized followed by staining in
0.05% (w/v) aqueous solution of Toluidine Blue O or Maule reagent
(Chapple et al., 1992), rinsed, and examined using bright-field micros-
copy. Images were recorded using an Olympus Vanox-S AH-2 microscope
equipped with a digital imaging system. Root samples from 10-d-old
etiolated seedlings were fixed in formaldehyde (10% [v/v]) in phosphate
buffer, pH 7.0 (Ricca Chemical Company), washed with 0.1 M potassium
phosphate buffer, pH 6.8, dehydrated, and embedded in Spurr’s resin
using a low viscosity embedding kit (Electron Microscopy Sciences). Root
cross sections (1-mm thick) were stained with TBO.
Auxin Transport Analysis
Plants were grown as previously described (Murphy and Taiz, 1995).
Auxin transport assays were conducted as described by Geisler et al.
(2005).
pH Determination
As previously described by Massoneau et al. (2001), the root systems of
the different plants were spread between two layers of 1% agar gel
containing bromocresol purple 0.01% (w/v) as a pH indicator. The pH of
the gel was adjusted between 6 and 6.5 to visualize change of color:
yellow for the acidification and purple of the alkalinization. Vacuolar pH
was examined as by Li et al. (2005).
Flavonoid Staining
Diphenylboric acid 2-aminoethyl ester staining was performed as previ-
ously described (Murphy et al., 2000; Peer et al., 2001). DMACA staining
was performed as described by Baxter et al. (2005). HPLC analysis of
flavonoids in methanolic extracts was performed as described by Peer
et al. (2001).
Statistical Analysis
Student’s t test and analysis of variance followed by Newman-Keuls post-
hoc analysis were preformed using SigmaStat (Jandel Scientific).
GUS Analysis
Transgenic petunia plants containing the Lis-GUS construct were gen-
erated via Agrobacterium (strain GV3101) transformation using the stan-
dard leaf disk transformation protocol (Horsch et al., 1985). GUS staining
for morphogenic callus, primary regenerants, stems, leaves, roots, and
flowers was performed as described by Jefferson et al. (1987).
Accession Numbers
Sequence data for BPBT cDNA and the LIS promoter from this article can
be found in the GenBank nucleotide database under the accession
numbers AY611496 and AF067601.
Supplemental Data
The following materials are available in the online version of this article.
Supplemental Figure 1. Metabolic Modeling of in Vivo Labeling Ki-
netics and Pool Sizes of Benzenoid and Phenylpropanoid Compounds
in Petal Tissues of Control and BPBT RNAi-10 Petunia Flowers Sup-
plied with 2H5-Phe for up to 4 h in the Dark and in the Light.
Supplemental Figure 2. Flavonoid Fluorescence in 5-d-Old Control
and BPBT RNAi-10 Petunia Seedlings Stained with Diphenylboric
Acid 2-Aminoethyl Ester.
ACKNOWLEDGMENTS
We thank Yasuhisa Kaminaga for help with detection of enzyme activ-
ities. This work was supported by the National Science Foundation/
USDA–National Research Initiative Interagency Metabolic Engineering
Program, Grants MCB 0331333 (N.D.) and MCB 0331353 (E.P.), and by
a grant from the Fred Gloeckner Foundation to N.D. This article is con-
tribution No. 17981 from the Purdue University Agricultural Experiment
Station.
Received July 25, 2006; revised November 8, 2006; accepted December
1, 2006; published December 28, 2006.
REFERENCES
Ahmed, M.A., El-Mawla, A., and Beerhues, L. (2002). Benzoic acid
biosynthesis in cell cultures of Hypericum androsaemum. Planta 214,
727–733.
Al-Hammadi, A.S., Sreelakshmi, Y., Negi, S., Siddiqi, I., and Sharma,
R. (2003). The polycotyledon mutant of tomato shows enhanced polar
auxin transport. Plant Physiol. 133, 113–125.
Baxter, I.R., Young, J.C., Armstrong, G., Foster, N., Bogenschutz,
N., Cordova, T., Peer, W.A., Hazen, S.P., Murphy, A.S., and Harper,
J.F. (2005). A plasma membrane Hþ-ATPase is required for the
formation of proanthocyanidins in the seed coat endothelium of
Arabidopsis thaliana. Proc. Natl. Acad. Sci. USA 102, 2649–2654.
Bennett, S.R.M., Alvarez, J., Bossinger, G., and Smyth, D.R. (1995).
Morphogenesis in pinoid mutants of Arabidopsis thaliana. Plant J. 8,
505–520.
Beuerle, T., and Pichersky, E. (2002). Purification and characterization
of benzoate:coenzyme A ligase from Clarkia breweri. Arch. Biochem.
Biophys. 400, 258–264.
Blakeslee, J.J., Peer, W.A., and Murphy, A.S. (2005). Auxin transport.
Curr. Opin. Plant Biol. 8, 494–500.
Boatright, J., Negre, F., Chen, X., Kish, C.M., Wood, B., Peel, G.,
Orlova, I., Gang, D., Rhodes, D., and Dudareva, N. (2004). Under-
standing in vivo benzenoid metabolism in petunia petal tissue. Plant
Physiol. 135, 1993–2011.
Benzenoid Network in Petunia Flowers 3473
Castelli, F., Uccella, N., Trombetta, D., and Saija, A. (1999). Differ-
ences between coumaric and cinnamic acids in membrane permea-
tion as evidenced by time-dependent calorimetry. J. Agric. Food
Chem. 47, 991–995.
Chapple, C.C.S., Vogt, T., Ellis, B.E., and Somerville, C.R. (1992). An
Arabidopsis mutant defective in the general phenylpropanoid path-
way. Plant Cell 4, 1413–1424.
Cseke, L., Dudareva, N., and Pichersky, E. (1998). Structure and
evolution of linalool synthase. Mol. Biol. Evol. 15, 1491–1498.
Dai, Y., Wang, H., Li, B., Huang, J., Liu, X., Zhou, Y., Mou, Z., and Li,
J. (2006). Increased expression of MAP KINASE KINASE7 causes
deficiency in polar auxin transport and leads to plant architectural
abnormality in Arabidopsis. Plant Cell 18, 308–320.
Donath, J., and Boland, W. (1995). Biosynthesis of acyclic homoter-
penes: Enzyme selectivity and absolute configuration of the nerolidol
precursor. Phytochemistry 39, 785–790.
Dudareva, N., Andersson, S., Orlova, I., Gatto, N., Reichelt, M.,
Rhodes, D., Boland, W., and Gershenzon, J. (2005). The non-
mevalonate pathway supports both monoterpene and sesquiterpene
formation in snapdragon flowers. Proc. Natl. Acad. Sci. USA 102,
933–938.
Dudareva, N., Cseke, L., Blanc, V.M., and Pichersky, E. (1996).
Evolution of floral scent in Clarkia: Novel patterns of S-linalool syn-
thase gene expression in the C. breweri flower. Plant Cell 8,
1137–1148.
Dudareva, N., and Pichersky, E. (2006). Floral scent metabolic path-
ways: Their regulation and evolution. In Biology of Floral Scent,
N. Dudareva and E. Pichersky, eds (Boca Raton, FL: CRC Press), pp.
55–78.
Geisler, M., et al. (2005). Cellular efflux of auxin catalyzed by the
Arabidopsis MDR/PGP transporter AtPGP1. Plant J. 44, 179–194.
Goldsmith, M.H.M., and Goldsmith, T.H. (1977). Chemiosmotic model
for polar transport of auxin through plant tissue. Biophys. J. 17, A260.
Horsch, R.B., Fry, J.E., Hofman, N.L., Elichholz, D., Rogers, S.G.,
and Fraley, R.T. (1985). A simple and general method for transferring
genes into plants. Science 227, 1229–1231.
Jefferson, R.A., Kavanagh, T.A., and Bevan, M. (1987). GUS fusions:
b-Glucuronidase as a sensitive and versatile gene fusion marker in
higher plants. EMBO J. 6, 3901–3907.
Jung, E., Zamir, L.O., and Jensen, R.A. (1986). Chloroplasts of higher
plants synthesize L-phenylalanine via L-arogenate. Proc. Natl. Acad.
Sci. USA 83, 7231–7235.
Kakiuchi, Y., Galis, I., Tamogami, S., and Wabiko, H. (2006). Reduc-
tion of polar auxin transport in tobacco by the tumorigenic Agro-
bacterium tumefaciens AK-6b gene. Planta 223, 237–247.
Kaminaga, Y., et al. (2006). Plant phenylacetaldehyde synthase is a
bifunctional homotetrameric enzyme that catalyzes phenylalanine
decarboxylation and oxidation. J. Biol. Chem. 281, 23357–23366.
Knudsen, J.T., and Gershenzon, J. ( 2006). The chemical diversity of
floral scent. In Biology of Floral Scent, N. Dudareva and E. Pichersky,
eds (Boca Raton, FL: CRC Press), pp. 27–52.
Koeduka, T., et al. (2006). Eugenol and isoeugenol, characteristic
aromatic constituents of spices, are biosynthesized via reduction of a
coniferyl alcohol ester. Proc. Natl. Acad. Sci. USA 103, 10128–10133.
Kolosova, N., Gorenstein, N., Kish, C.M., and Dudareva, N. (2001).
Regulation of circadian methylbenzoate emission in diurnally and
nocturnally emitting plants. Plant Cell 13, 2333–2347.
Kuroha, T., Ueguchi, C., Sakakibara, H., and Satoh, S. (2006).
Cytokinin receptors are required for normal development of auxin-
transporting vascular tissues in the hypocotyl but not in adventitious
roots. Plant Cell Physiol. 47, 234–243.
Lapadatescu, C., Ginies, C., Le Quere, J.-L., and Bonnarme, P.
(2000). Novel scheme for biosynthesis of aryl metabolites from
L-phenylalanine in the fungus Bjerkandera adusta. Appl. Environ.
Microbiol. 66, 1517–1522.
Li, J., et al. (2005). Arabidopsis Hþ-PPase AVP1 regulates auxin
mediated organ development. Science 310, 121–125.
Liu, C.M., Xu, Z.H., and Chua, N.-H. (1993). Auxin polar transport is
essential for the establishment of bilateral symmetry during early plant
embryogenesis. Plant Cell 5, 621–630.
Lomascolo, A., Asther, M., Navarro, D., Antona, C., Delattre, M., and
Lesage-Meessen, L. (2001). Shifting the biotransformation pathways
of L-phenylalanine into benzaldehyde by Trametes suaveolens CBS
334.85 using HP20 resin. Lett. Appl. Microbiol. 32, 262–267.
Massonneau, A., Langlade, N., Leon, S., Smutny, J., Vogt, E.,
Neumann, G., and Martinoia, E. (2001). Metabolic changes associ-
ated with cluster root development in white lupin (Lupinus albus L.):
Relationship between organic acid excretion, sucrose metabolism
and energy status. Planta 213, 534–542.
Multani, D.S., Briggs, S., Chamberlin, M.A., Blakeslee, J.J., Murphy,
A.S., and Johal, G. (2003). Loss of an MDR transporter in compact
stalks of maize br2 and sorghum dw3 mutants. Science 302, 81–84.
Murphy, A., and Taiz, L. (1995). A new vertical mesh transfer technique
for metal-tolerance studies in Arabidopsis (ecotypic variation and
copper-sensitive mutants). Plant Physiol. 108, 29–38.
Murphy, A.S., Peer, W.A., and Taiz, L. (2000). Regulation of auxin
transport by aminopeptidases and endogenous flavonoids. Planta
211, 315–324.
Negre, F., Kish, C.M., Boatright, J., Underwood, B., Shibuya, K.,
Wagner, C., Clark, D.G., and Dudareva, N. (2003). Regulation of
methylbenzoate emission after pollination in snapdragon and petunia
flowers. Plant Cell 15, 2992–3006.
Nierop-Groot, M.N., and De Bont, J.A.M. (1998). Conversion of
phenylalanine to benzaldehyde initiated by an aminotransferase in
Lactobacillus plantarum. Appl. Environ. Microbiol. 64, 3009–3013.
Noh, B., Murphy, A.S., and Spalding, E.P. (2001). Multidrug resis-
tance-like genes of Arabidopsis required for auxin transport and
auxin-mediated development. Plant Cell 13, 2441–2454.
Peer, W.A., Bandyopadhyay, A., Blakeslee, J.J., Makam, S.N., Chen,
R.J., Masson, P.H., and Murphy, A.S. (2004). Variation in expression
and protein localization of the PIN family of auxin efflux facilitator
proteins in flavonoid mutants with altered auxin transport in Arabi-
dopsis thaliana. Plant Cell 16, 1898–1911.
Peer, W.A., Brown, D.E., Tague, B.W., Muday, G.K., Taiz, L., and
Murphy, A.S. (2001). Flavonoid accumulation patterns of transparent
testa mutants of Arabidopsis. Plant Physiol. 126, 536–548.
Pichersky, E., Noel, J.P., and Dudareva, N. (2006). Biosynthesis
of plant volatiles: Nature’s diversity and ingenuity. Science 311,
808–811.
Ribnicky, D.M., Shulaev, V., and Raskin, I. (1998). Intermediates of
salicylic acid biosynthesis in tobacco. Plant Physiol. 118, 565–572.
Rijnen, L., Courtin, P., Gripon, J.-C., and Yvon, M. (2000). Expression
of a heterologous glutamate dehydrogenase gene in Lactococcus
lactis highly improves the conversion of amino acids to aroma
compounds. Appl. Environ. Microbiol. 66, 1354–1359.
Schnepp, J., and Dudareva, N. (2006). Floral scent: Biosynthesis,
regulation, and genetic modifications. In Flowering and Its Manip-
ulation, C. Ainsworth, ed (Oxford, UK: Blackwell Publishing), pp.
240–257.
Surpin, M., Zheng, H., Morita, M.T., Saito, C., Avila-Teeguarden, E.,
Blakeslee, J.J., Bandyopadhyay, A., Kovaleva, V., Carter, D.,
Murphy, A.S., Tasaka, M., and Raikhel, N. (2003). The VTI family
of SNARE proteins is necessary for plant viability and mediates
different protein transport pathways. Plant Cell 15, 2885–2899.
Swarup, R., et al. (2004). Structure-function analysis of the presumptive
Arabidopsis auxin permease AUX1. Plant Cell 16, 3069–3083.
3474 The Plant Cell
Thimann, K.V. (1938). Hormones and the analysis of growth. (Inaugural
Steven Hales address December 28, 1937). Plant Physiol. 13,
437–449.
van Overbeek, J., Blondeau, R., and Horne, V. (1951). Trans-cinnamic
acid as an anti-auxin. Am. J. Bot. 38, 589–595.
Verdonk, J.C., Ric de Vos, C.H., Verhoeven, H.A., Haring, M.A., van
Tunen, A.J., and Schuurink, R.C. (2003). Regulation of floral scent
production in petunia revealed by targeted metabolomics. Phyto-
chemistry 62, 997–1008.
Warpeha, K.M., Lateef, S.S., Lapik, Y., Anderson, M., Lee, B.-S., and
Kaufman, L.S. (2006). G-protein-coupled receptor 1, G-protein
Ga-subunit 1, and prephenate dehydratase 1 are required for blue
light-induced production of phenylalanine in etiolated Arabidopsis.
Plant Physiol. 140, 844–855.
Watanabe, S., Hayashi, K., Yagi, K., Asai, T., MacTavish, H., Picone,
J., Turnbull, C., and Watanabe, N. (2002). Biogenesis of 2-2-phenyl-
ethanol in rose flowers: Incorporation of [2H8] L-phenylalanine into
2-2-phenylethanol and its b-D-glucopyranoside during the flower
opening of Rosa ‘Hoh-Jun’ and Rosa damascena Mill. Biosci. Bio-
technol. Biochem. 66, 943–947.
Wildermuth, M.C. (2006). Variations on a theme: Synthesis and mod-
ification of plant benzoic acids. Curr. Opin. Plant Biol. 9, 288–296.
Zhong, R., and Ye, Z.H. (2001). Alteration of auxin polar transport in the
Arabidopsis ifl1 mutants. Plant Physiol. 126, 549–563.
Benzenoid Network in Petunia Flowers 3475

DOI 10.1105/tpc.106.046227; originally published online December 28, 2006; 2006;18;3458-3475Plant Cell
DudarevaJoshua J. Blakeslee, Wendy Ann Peer, Angus S. Murphy, David Rhodes, Eran Pichersky and Natalia
Irina Orlova, Amy Marshall-Colón, Jennifer Schnepp, Barbara Wood, Marina Varbanova, Eyal Fridman,and Enhancement in Auxin Transport
Reduction of Benzenoid Synthesis in Petunia Flowers Reveals Multiple Pathways to Benzoic Acid
This information is current as of December 27, 2019
Supplemental Data /content/suppl/2006/12/28/tpc.106.046227.DC1.html
References /content/18/12/3458.full.html#ref-list-1
This article cites 49 articles, 30 of which can be accessed free at:
Permissions https://www.copyright.com/ccc/openurl.do?sid=pd_hw1532298X&issn=1532298X&WT.mc_id=pd_hw1532298X
eTOCs http://www.plantcell.org/cgi/alerts/ctmain
Sign up for eTOCs at:
CiteTrack Alerts http://www.plantcell.org/cgi/alerts/ctmain
Sign up for CiteTrack Alerts at:
Subscription Information http://www.aspb.org/publications/subscriptions.cfm
is available at:Plant Physiology and The Plant CellSubscription Information for
ADVANCING THE SCIENCE OF PLANT BIOLOGY © American Society of Plant Biologists