reducing false positives in anomaly detectors through fuzzy alert aggregation
TRANSCRIPT

Information Fusion 10 (2009) 300–311
Contents lists available at ScienceDirect
Information Fusion
journal homepage: www.elsevier .com/ locate / inf fus
Reducing false positives in anomaly detectors through fuzzy alert aggregation
Federico Maggi, Matteo Matteucci, Stefano Zanero *
Dipartimento di Elettronica e Informazione, Politecnico di Milano Technical University, via Ponzio 34/5, 20133 Milano, Italy
a r t i c l e i n f o
Article history:Received 14 December 2006Received in revised form 1 May 2008Accepted 23 January 2009Available online 6 February 2009
Keywords:Intrusion detectionAnomaly detectionFuzzy measuresFuzzy setsAggregationMultisensor fusion
1566-2535/$ - see front matter � 2009 Elsevier B.V. Adoi:10.1016/j.inffus.2009.01.004
* Corresponding author.E-mail address: [email protected] (S. Zanero).
a b s t r a c t
In this paper we focus on the aggregation of IDS alerts, an important component of the alert fusion pro-cess. We exploit fuzzy measures and fuzzy sets to design simple and robust alert aggregation algorithms.Exploiting fuzzy sets, we are able to robustly state whether or not two alerts are ‘‘close in time”, dealingwith noisy and delayed detections. A performance metric for the evaluation of fusion systems is also pro-posed. Finally, we evaluate the fusion method with alert streams from anomaly-based IDS.
� 2009 Elsevier B.V. All rights reserved.
1. Introduction
In the modern, ever-changing scenario of computer security, thetraditionally effective misuse-based approach to Intrusion Detec-tion (ID) is dramatically showing its limits, being based on theexhaustive enumeration of each possible attack signature. As amatter of fact, misuse-based Intrusion Detection Systems (IDSes)turn out to be effective only against commonly known attack tools,for which a signature is already available. Their inability to detectunknown attacks (the so-called ‘‘zero-days” [1]) or new ways toexploit an old vulnerability is severely limiting. Evasion techniques[2,3] are another well-known example of weakness in misuse-based systems. A possible solution is to use an anomaly detectionapproach, modelling what is normal rather than what is anomalous.This is how an intrusion detection system was originally conceivedto work [4,5]. Such systems do not need an up to date database of‘‘known” attacks, and therefore can detect unknown techniquesand insider abuses as well.
The problem of intrusion detection becomes even more chal-lenging in todays’ complex networks. In fact, it is common to havemore than one IDS deployed, monitoring different segments anddifferent aspects of the whole infrastructure (e.g., hosts, applica-tions, network, etc.). The amount of alerts fired by a network ofIDSes running in a complex computer infrastructure is larger, byseveral orders of magnitude, than what was common in the smal-ler networks monitored years ago. In such a context, networkadministrators are loaded by several alerts and long security re-
ll rights reserved.
ports often containing a non-negligible amount of false positives.Thus, the creation of a clean, compact, and unified view of the secu-rity status of the network is needed. This process is commonlyknown as alert fusion (or alert correlation) [6] and it is currentlyone of the most difficult challenges of this research field.
Skipping the trivial alert format conversion phase, the coresteps of an alert fusion process are called aggregation and correla-tion; the first one has the goal of grouping alerts sharing commonfeatures (for instance, those close in time); and the next phase,called alert correlation. It has to do with the recognition of logicallylinked alerts; note that the term ‘‘correlation” does not imply ‘‘sta-tistical correlation” (even if statistical correlation based methodsare sometimes used to reveal such relationships). Alert correlationusually works on already aggregated alert streams and, as shownin Fig. 1, the process is usually performed after the aggregation.
The focus of this paper is on alert aggregation, which is morecomplex when taking into account anomaly detection systems, be-cause no information on the type or classification of the observedattack is available to any of the fusion algorithms. Beside the afore-mentioned drawbacks, misuse detectors are reliable, and give veryprecise and detailed information upon which a reaction can beplanned; on the other hand, they cannot recognize new attacks.Anomaly detectors are symmetrically able to detect new attacks,but are generally prone to false positives and give less informationto the user. Most of the algorithms proposed in the current litera-ture on correlation make use of the information regarding thematching attack provided by misuse detectors; therefore, suchmethods are inapplicable to purely anomaly based intrusion detec-tion systems. However, since failures and strengths of anomaly andmisuse detection are symmetric, it is reasonable and noteworthy to

Normalization Prioritization Aggregation
Correlation for scenario reconstruction
VerificationAlert visualization andmanagement
.
.
.
A1
An-1
An
Fig. 1. The alert fusion model used in this work: a slightly modified version of the generic, comprehensive framework proposed in [6].
F. Maggi et al. / Information Fusion 10 (2009) 300–311 301
try to integrate different approaches through an alert fusionprocess.
Toward such goal, we explore the use of fuzzy measures [7] andfuzzy sets [8] to design simple, but robust aggregation algorithms.In particular, we contribute to one of the key issues, that is how tostate whether or not two alerts are ‘‘close in time”. In addition,uncertainties on both timestamp measurements and threshold set-ting make this process even more difficult; the use of fuzzy sets al-lows us to precisely define a time-distance criterion which‘‘embeds” unavoidable errors (e.g., delayed detections).
The remainder of the paper is organized as follows: in Section 2the problem of alert aggregation and correlation is defined; we willalso overview selected papers. Section 3 investigates our idea ofexploiting fuzzy models for robust alert aggregation. Section 4 de-tails our experimental setup, the anomaly detection prototypeused and outlines the performances of our proposal; in this section,we also sketch the motivations, the main requirements and aframework for the evaluation of alert fusion systems. Finally, inSection 6 we will draw our conclusions and outline some futurework.
2. Problem statement and state of the art
The desired output of an alert fusion process is a compact, high-level view of what is happening into the network as a whole. In thesecurity field, such a process is also known as security informationmonitoring and has historically been a labor-intensive, error-prone,manual task. Effective algorithms for automatic alert fusion areneeded to handle real world applications. In this work we willmake use of a slightly modified version of the generic, comprehen-sive framework of alert fusion proposed in [6]. Fig. 1 summarizesthe overall process flow: alerts streams are collected from distrib-uted IDSes, normalized (i.e., translated into a common format),aggregated, and finally, logically linked events in the streams arecorrelated. In [6] the aggregation phase is called fusion; in orderto avoid misunderstandings we call it ‘‘aggregation” reserving theword ‘‘fusion” to indicate the whole process. We will not investi-gate the prioritization phase and the verification process: the firstdeals with alert ranking and subsequent discarding, according topredefined priorities and heuristics; alert verification is instead fo-cused on collecting required context information in order to verifywhether the attack reported by an alert has succeeded or not.
In this work we will mainly focus on the aggregation phase.Aggregation should group together alerts which share commonfeatures, such as the same source or destination address port orthe same attack name (if known). As a secondary effect, this phaseshould solve alert granularity issues due to how attacks are re-ported from an IDS. For instance, an IDS could fire an alert when-ever a malicious network packet is detected, while another onemight report the same alert at the end of the TCP connectionregarding the same attack packet. Thus, the main issue of thisphase is how to state that two alerts refer to the same attack, espe-cially if they are reported with slightly different timestamps.
The correlation phase is even more challenging: it implementsthe core algorithms for recognizing related events. An effective cor-relation algorithm should be able to reconstruct unknown attackscenarios. To give an example, a simple attack scenario is theexploitation of a system and subsequently its use to penetrate an-other machine; obviously, the violation of both different hosts andthe connecting network would cause different (types of) IDSes tofire alerts, all referring to the same scenario.
Alert fusion algorithms commonly need a priori knowledge; forinstance, precise information about attacks names, division of at-tacks into classes, and alert priorities. Such a need is limiting foranomaly detectors, because the lack of attack names and classesdo not allow grouping along these dimensions. In order to be usefulalso with anomaly detectors, a generic alert fusion system shouldnot rely only on a priori knowledge, except for obviously requiredworking hypothesis (i.e., alert format, network protocols, etc.) andsystem configuration settings (i.e., algorithm tuning, etc.).
2.1. Correlation and aggregation approaches
Due to space limitations, we do not attempt to review all theprevious literature on intrusion detection, focusing instead onthe latest alert fusion techniques. We refer the reader to [9] for amore comprehensive and taxonomic review of IDS literature.
According to an early definition, the alert fusion problem wasformalized through state-transition analysis; in [10] this approachhas been proven to be an effective technique for representing at-tack scenarios. In this type of matching engines, observed eventsare defined as transitions in finite state machine representing sig-natures of scenarios. When a machine reaches the acceptancestate, the described scenario is detected. This approach allows forthe modelling of complex intrusion scenarios (mixing networkand host-based detection) and it is capable of detecting slow ordistributed attacks, but it relies on a priori generated scenariossignatures.
In a similar fashion, cause-effect analysis has been applied. JIG-SAW [11] is a formal language to specify attacks (called ‘‘facts”) bymeans of their pre- and post-conditions (called ‘‘requirements”and ‘‘providings”, respectively). It enables the description of com-plex scenario and the definition of signatures through the specifi-cation of the context needed for an attack to occur. A similarapproach that uses a different formalism is proposed in [12]. Thesame idea is also implemented in TIAA [13], an alert fusion toolthat exploits both pre- and post-condition matching and time-dis-tance criteria for aggregation and correlation. As with previoustechniques, the major shortcoming of these approaches is the needfor a priori knowledge (i.e., scenario pre- and post-conditions).
Statistical techniques have been also proposed. The current ver-sion of EMERALD [14] implements a ‘‘probabilistic” alert fusion en-gine. Described in [15], the approach relies on the definition ofsome similarity metrics between alerts; the correlation phase cal-culates a weighted similarity value and finds ‘‘near” alerts to begrouped together. The features used include source IDS identifiers,timestamps, source and destination addresses and ports. However,
Deg
ree
of m
embe
rshi
p
Time (s)
Instantaneous alertCrisp window
Deg
ree
of m
embe
rshi
p
Time (s)
Fuzzy alert eventFuzzy window
Closeness
a b
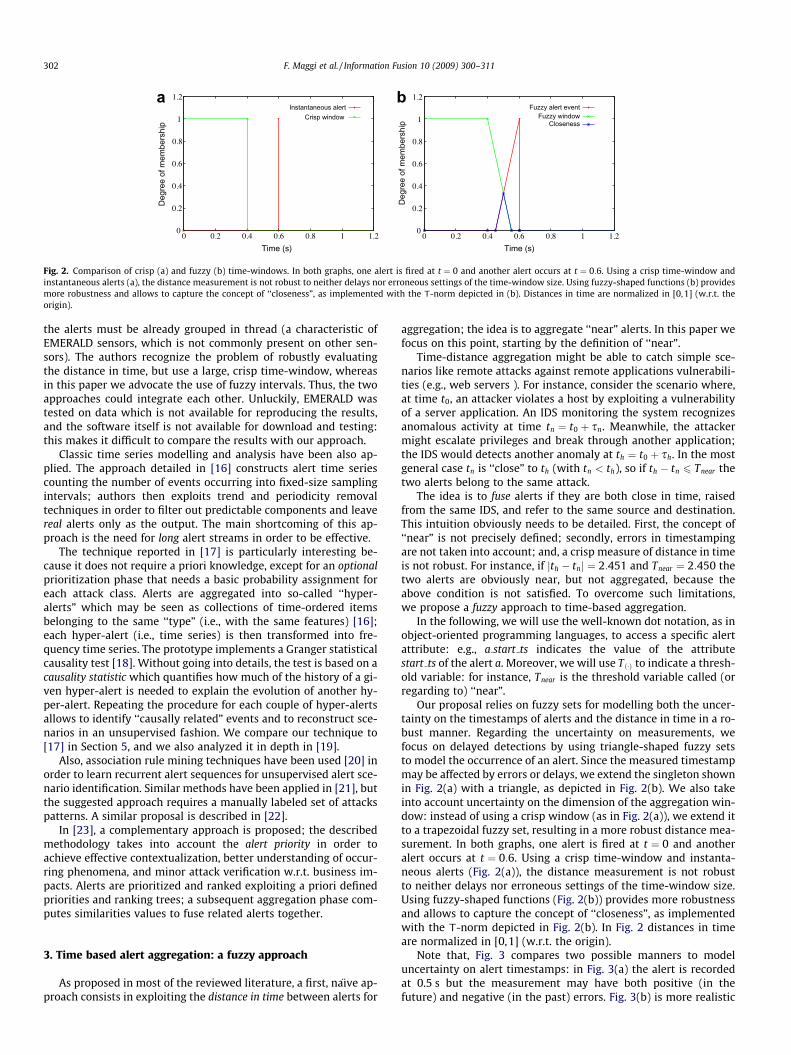
Fig. 2. Comparison of crisp (a) and fuzzy (b) time-windows. In both graphs, one alert is fired at t ¼ 0 and another alert occurs at t ¼ 0:6. Using a crisp time-window andinstantaneous alerts (a), the distance measurement is not robust to neither delays nor erroneous settings of the time-window size. Using fuzzy-shaped functions (b) providesmore robustness and allows to capture the concept of ‘‘closeness”, as implemented with the T-norm depicted in (b). Distances in time are normalized in [0,1] (w.r.t. theorigin).
302 F. Maggi et al. / Information Fusion 10 (2009) 300–311
the alerts must be already grouped in thread (a characteristic ofEMERALD sensors, which is not commonly present on other sen-sors). The authors recognize the problem of robustly evaluatingthe distance in time, but use a large, crisp time-window, whereasin this paper we advocate the use of fuzzy intervals. Thus, the twoapproaches could integrate each other. Unluckily, EMERALD wastested on data which is not available for reproducing the results,and the software itself is not available for download and testing:this makes it difficult to compare the results with our approach.
Classic time series modelling and analysis have been also ap-plied. The approach detailed in [16] constructs alert time seriescounting the number of events occurring into fixed-size samplingintervals; authors then exploits trend and periodicity removaltechniques in order to filter out predictable components and leavereal alerts only as the output. The main shortcoming of this ap-proach is the need for long alert streams in order to be effective.
The technique reported in [17] is particularly interesting be-cause it does not require a priori knowledge, except for an optionalprioritization phase that needs a basic probability assignment foreach attack class. Alerts are aggregated into so-called ‘‘hyper-alerts” which may be seen as collections of time-ordered itemsbelonging to the same ‘‘type” (i.e., with the same features) [16];each hyper-alert (i.e., time series) is then transformed into fre-quency time series. The prototype implements a Granger statisticalcausality test [18]. Without going into details, the test is based on acausality statistic which quantifies how much of the history of a gi-ven hyper-alert is needed to explain the evolution of another hy-per-alert. Repeating the procedure for each couple of hyper-alertsallows to identify ‘‘causally related” events and to reconstruct sce-narios in an unsupervised fashion. We compare our technique to[17] in Section 5, and we also analyzed it in depth in [19].
Also, association rule mining techniques have been used [20] inorder to learn recurrent alert sequences for unsupervised alert sce-nario identification. Similar methods have been applied in [21], butthe suggested approach requires a manually labeled set of attackspatterns. A similar proposal is described in [22].
In [23], a complementary approach is proposed; the describedmethodology takes into account the alert priority in order toachieve effective contextualization, better understanding of occur-ring phenomena, and minor attack verification w.r.t. business im-pacts. Alerts are prioritized and ranked exploiting a priori definedpriorities and ranking trees; a subsequent aggregation phase com-putes similarities values to fuse related alerts together.
3. Time based alert aggregation: a fuzzy approach
As proposed in most of the reviewed literature, a first, naıve ap-proach consists in exploiting the distance in time between alerts for
aggregation; the idea is to aggregate ‘‘near” alerts. In this paper wefocus on this point, starting by the definition of ‘‘near”.
Time-distance aggregation might be able to catch simple sce-narios like remote attacks against remote applications vulnerabili-ties (e.g., web servers ). For instance, consider the scenario where,at time t0, an attacker violates a host by exploiting a vulnerabilityof a server application. An IDS monitoring the system recognizesanomalous activity at time tn ¼ t0 þ sn. Meanwhile, the attackermight escalate privileges and break through another application;the IDS would detects another anomaly at th ¼ t0 þ sh. In the mostgeneral case tn is ‘‘close” to th (with tn < th), so if th � tn 6 Tnear thetwo alerts belong to the same attack.
The idea is to fuse alerts if they are both close in time, raisedfrom the same IDS, and refer to the same source and destination.This intuition obviously needs to be detailed. First, the concept of‘‘near” is not precisely defined; secondly, errors in timestampingare not taken into account; and, a crisp measure of distance in timeis not robust. For instance, if jth � tnj ¼ 2:451 and Tnear ¼ 2:450 thetwo alerts are obviously near, but not aggregated, because theabove condition is not satisfied. To overcome such limitations,we propose a fuzzy approach to time-based aggregation.
In the following, we will use the well-known dot notation, as inobject-oriented programming languages, to access a specific alertattribute: e.g., a:start ts indicates the value of the attributestart ts of the alert a. Moreover, we will use T ð�Þ to indicate a thresh-old variable: for instance, Tnear is the threshold variable called (orregarding to) ‘‘near”.
Our proposal relies on fuzzy sets for modelling both the uncer-tainty on the timestamps of alerts and the distance in time in a ro-bust manner. Regarding the uncertainty on measurements, wefocus on delayed detections by using triangle-shaped fuzzy setsto model the occurrence of an alert. Since the measured timestampmay be affected by errors or delays, we extend the singleton shownin Fig. 2(a) with a triangle, as depicted in Fig. 2(b). We also takeinto account uncertainty on the dimension of the aggregation win-dow: instead of using a crisp window (as in Fig. 2(a)), we extend itto a trapezoidal fuzzy set, resulting in a more robust distance mea-surement. In both graphs, one alert is fired at t ¼ 0 and anotheralert occurs at t ¼ 0:6. Using a crisp time-window and instanta-neous alerts (Fig. 2(a)), the distance measurement is not robustto neither delays nor erroneous settings of the time-window size.Using fuzzy-shaped functions (Fig. 2(b)) provides more robustnessand allows to capture the concept of ‘‘closeness”, as implementedwith the T-norm depicted in Fig. 2(b). In Fig. 2 distances in timeare normalized in [0,1] (w.r.t. the origin).
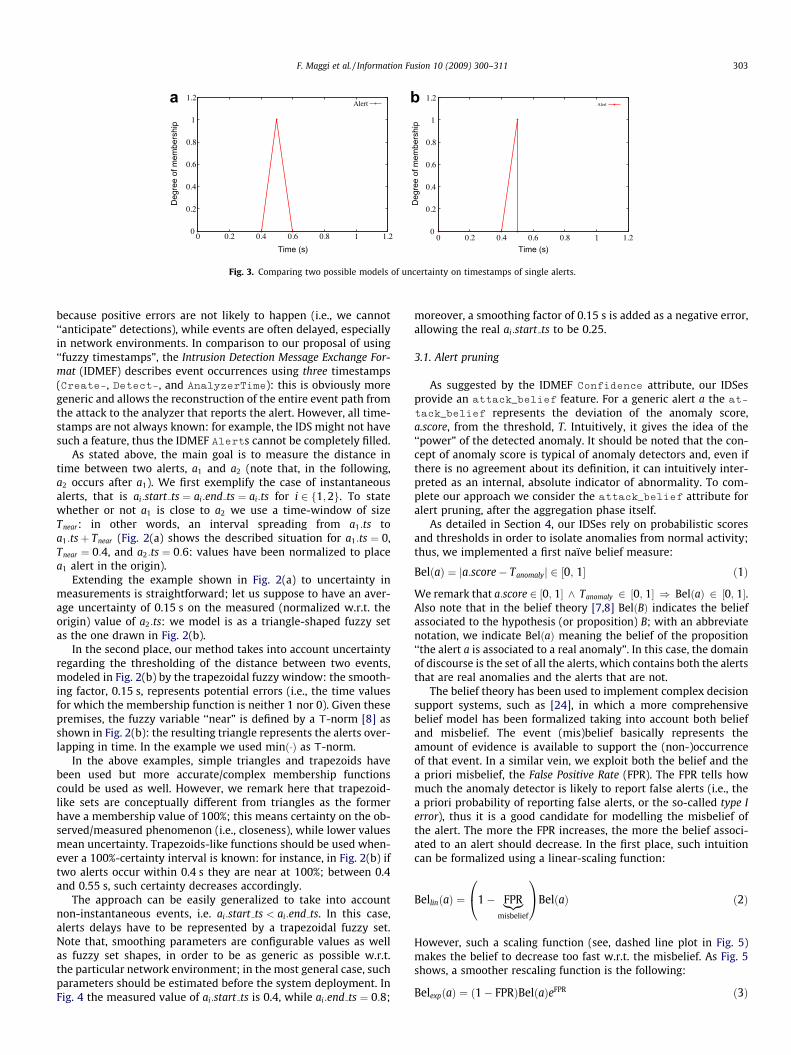
Note that, Fig. 3 compares two possible manners to modeluncertainty on alert timestamps: in Fig. 3(a) the alert is recordedat 0.5 s but the measurement may have both positive (in thefuture) and negative (in the past) errors. Fig. 3(b) is more realistic
Deg
ree
of m
embe
rshi
p
Time (s)
Deg
ree
of m
embe
rshi
p
Time (s)
a b
Fig. 3. Comparing two possible models of uncertainty on timestamps of single alerts.
F. Maggi et al. / Information Fusion 10 (2009) 300–311 303
because positive errors are not likely to happen (i.e., we cannot‘‘anticipate” detections), while events are often delayed, especiallyin network environments. In comparison to our proposal of using‘‘fuzzy timestamps”, the Intrusion Detection Message Exchange For-mat (IDMEF) describes event occurrences using three timestamps(Create-, Detect-, and AnalyzerTime): this is obviously moregeneric and allows the reconstruction of the entire event path fromthe attack to the analyzer that reports the alert. However, all time-stamps are not always known: for example, the IDS might not havesuch a feature, thus the IDMEF Alerts cannot be completely filled.
As stated above, the main goal is to measure the distance intime between two alerts, a1 and a2 (note that, in the following,a2 occurs after a1). We first exemplify the case of instantaneousalerts, that is ai:start ts ¼ ai:end ts ¼ ai:ts for i 2 1;2f g. To statewhether or not a1 is close to a2 we use a time-window of sizeTnear: in other words, an interval spreading from a1:ts toa1:tsþ Tnear (Fig. 2(a) shows the described situation for a1:ts ¼ 0,Tnear ¼ 0:4, and a2:ts ¼ 0:6: values have been normalized to placea1 alert in the origin).
Extending the example shown in Fig. 2(a) to uncertainty inmeasurements is straightforward; let us suppose to have an aver-age uncertainty of 0.15 s on the measured (normalized w.r.t. theorigin) value of a2:ts: we model is as a triangle-shaped fuzzy setas the one drawn in Fig. 2(b).
In the second place, our method takes into account uncertaintyregarding the thresholding of the distance between two events,modeled in Fig. 2(b) by the trapezoidal fuzzy window: the smooth-ing factor, 0.15 s, represents potential errors (i.e., the time valuesfor which the membership function is neither 1 nor 0). Given thesepremises, the fuzzy variable ‘‘near” is defined by a T-norm [8] asshown in Fig. 2(b): the resulting triangle represents the alerts over-lapping in time. In the example we used minð�Þ as T-norm.
In the above examples, simple triangles and trapezoids havebeen used but more accurate/complex membership functionscould be used as well. However, we remark here that trapezoid-like sets are conceptually different from triangles as the formerhave a membership value of 100%; this means certainty on the ob-served/measured phenomenon (i.e., closeness), while lower valuesmean uncertainty. Trapezoids-like functions should be used when-ever a 100%-certainty interval is known: for instance, in Fig. 2(b) iftwo alerts occur within 0.4 s they are near at 100%; between 0.4and 0.55 s, such certainty decreases accordingly.
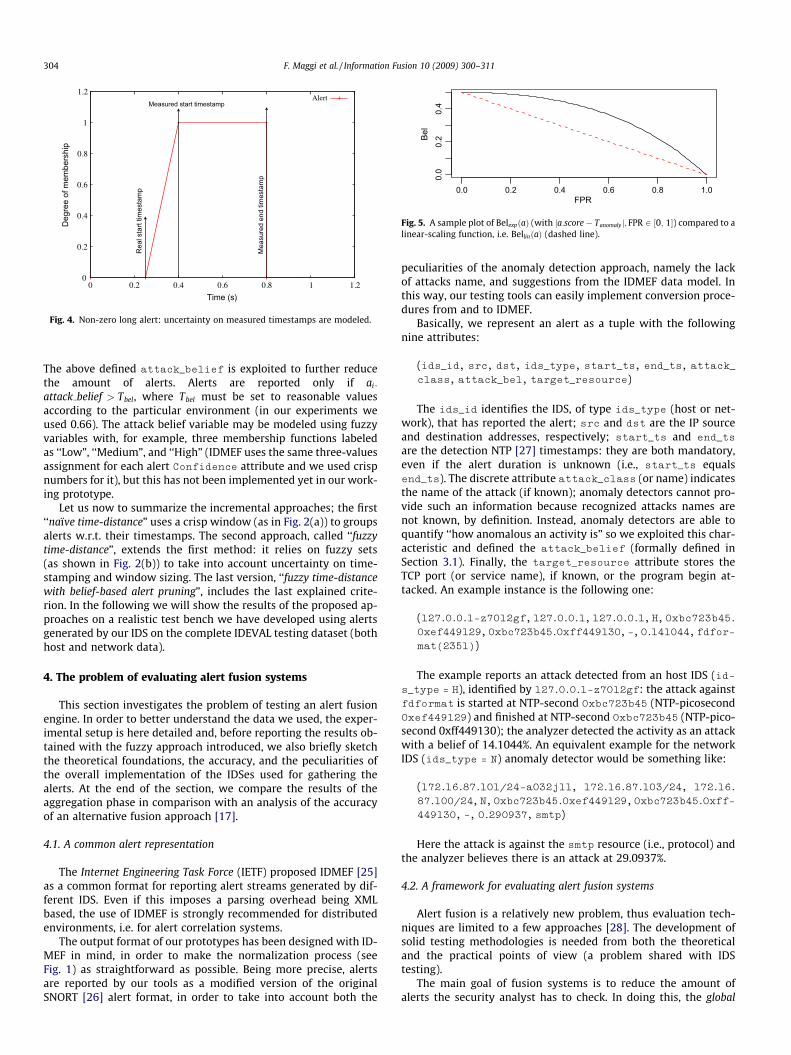
The approach can be easily generalized to take into accountnon-instantaneous events, i.e. ai:start ts < ai:end ts. In this case,alerts delays have to be represented by a trapezoidal fuzzy set.Note that, smoothing parameters are configurable values as wellas fuzzy set shapes, in order to be as generic as possible w.r.t.the particular network environment; in the most general case, suchparameters should be estimated before the system deployment. InFig. 4 the measured value of ai:start ts is 0.4, while ai:end ts ¼ 0:8;
moreover, a smoothing factor of 0.15 s is added as a negative error,allowing the real ai:start ts to be 0.25.
3.1. Alert pruning
As suggested by the IDMEF Confidence attribute, our IDSesprovide an attack_belief feature. For a generic alert a the at-
tack_belief represents the deviation of the anomaly score,a.score, from the threshold, T. Intuitively, it gives the idea of the‘‘power” of the detected anomaly. It should be noted that the con-cept of anomaly score is typical of anomaly detectors and, even ifthere is no agreement about its definition, it can intuitively inter-preted as an internal, absolute indicator of abnormality. To com-plete our approach we consider the attack_belief attribute foralert pruning, after the aggregation phase itself.
As detailed in Section 4, our IDSes rely on probabilistic scoresand thresholds in order to isolate anomalies from normal activity;thus, we implemented a first naïve belief measure:
BelðaÞ ¼ ja:score� Tanomalyj 2 ½0; 1� ð1Þ
We remark that a:score 2 ½0; 1� ^ Tanomaly 2 ½0; 1� ) BelðaÞ 2 ½0; 1�.Also note that in the belief theory [7,8] BelðBÞ indicates the beliefassociated to the hypothesis (or proposition) B; with an abbreviatenotation, we indicate BelðaÞ meaning the belief of the proposition‘‘the alert a is associated to a real anomaly”. In this case, the domainof discourse is the set of all the alerts, which contains both the alertsthat are real anomalies and the alerts that are not.
The belief theory has been used to implement complex decisionsupport systems, such as [24], in which a more comprehensivebelief model has been formalized taking into account both beliefand misbelief. The event (mis)belief basically represents theamount of evidence is available to support the (non-)occurrenceof that event. In a similar vein, we exploit both the belief and thea priori misbelief, the False Positive Rate (FPR). The FPR tells howmuch the anomaly detector is likely to report false alerts (i.e., thea priori probability of reporting false alerts, or the so-called type Ierror), thus it is a good candidate for modelling the misbelief ofthe alert. The more the FPR increases, the more the belief associ-ated to an alert should decrease. In the first place, such intuitioncan be formalized using a linear-scaling function:
BellinðaÞ ¼ 1� FPR|{z}misbelief
0@
1ABelðaÞ ð2Þ
However, such a scaling function (see, dashed line plot in Fig. 5)makes the belief to decrease too fast w.r.t. the misbelief. As Fig. 5shows, a smoother rescaling function is the following:
BelexpðaÞ ¼ ð1� FPRÞBelðaÞeFPR ð3Þ
0.0 0.2 0.4 0.6 0.8 1.0
0.0
0.2
0.4
FPR
Bel
Fig. 5. A sample plot of BelexpðaÞ (with ja:score� Tanomalyj; FPR 2 ½0; 1�) compared to alinear-scaling function, i.e. BellinðaÞ (dashed line).
Deg
ree
of m
embe
rshi
p
Time (s)
Measured start timestamp
Rea
l sta
rt tim
esta
mp
Mea
sure
d en
d tim
esta
mp
Fig. 4. Non-zero long alert: uncertainty on measured timestamps are modeled.
304 F. Maggi et al. / Information Fusion 10 (2009) 300–311
The above defined attack_belief is exploited to further reducethe amount of alerts. Alerts are reported only if ai:
attack belief > Tbel, where Tbel must be set to reasonable valuesaccording to the particular environment (in our experiments weused 0.66). The attack belief variable may be modeled using fuzzyvariables with, for example, three membership functions labeledas ‘‘Low”, ‘‘Medium”, and ‘‘High” (IDMEF uses the same three-valuesassignment for each alert Confidence attribute and we used crispnumbers for it), but this has not been implemented yet in our work-ing prototype.
Let us now to summarize the incremental approaches; the first‘‘naïve time-distance” uses a crisp window (as in Fig. 2(a)) to groupsalerts w.r.t. their timestamps. The second approach, called ‘‘fuzzytime-distance”, extends the first method: it relies on fuzzy sets(as shown in Fig. 2(b)) to take into account uncertainty on time-stamping and window sizing. The last version, ‘‘fuzzy time-distancewith belief-based alert pruning”, includes the last explained crite-rion. In the following we will show the results of the proposed ap-proaches on a realistic test bench we have developed using alertsgenerated by our IDS on the complete IDEVAL testing dataset (bothhost and network data).
4. The problem of evaluating alert fusion systems
This section investigates the problem of testing an alert fusionengine. In order to better understand the data we used, the exper-imental setup is here detailed and, before reporting the results ob-tained with the fuzzy approach introduced, we also briefly sketchthe theoretical foundations, the accuracy, and the peculiarities ofthe overall implementation of the IDSes used for gathering thealerts. At the end of the section, we compare the results of theaggregation phase in comparison with an analysis of the accuracyof an alternative fusion approach [17].
4.1. A common alert representation
The Internet Engineering Task Force (IETF) proposed IDMEF [25]as a common format for reporting alert streams generated by dif-ferent IDS. Even if this imposes a parsing overhead being XMLbased, the use of IDMEF is strongly recommended for distributedenvironments, i.e. for alert correlation systems.
The output format of our prototypes has been designed with ID-MEF in mind, in order to make the normalization process (seeFig. 1) as straightforward as possible. Being more precise, alertsare reported by our tools as a modified version of the originalSNORT [26] alert format, in order to take into account both the
peculiarities of the anomaly detection approach, namely the lackof attacks name, and suggestions from the IDMEF data model. Inthis way, our testing tools can easily implement conversion proce-dures from and to IDMEF.
Basically, we represent an alert as a tuple with the followingnine attributes:
(ids_id, src, dst, ids_type, start_ts, end_ts, attack_class, attack_bel, target_resource)
The ids_id identifies the IDS, of type ids_type (host or net-work), that has reported the alert; src and dst are the IP sourceand destination addresses, respectively; start_ts and end_tsare the detection NTP [27] timestamps: they are both mandatory,even if the alert duration is unknown (i.e., start_ts equalsend_ts). The discrete attribute attack_class (or name) indicatesthe name of the attack (if known); anomaly detectors cannot pro-vide such an information because recognized attacks names arenot known, by definition. Instead, anomaly detectors are able toquantify ‘‘how anomalous an activity is” so we exploited this char-acteristic and defined the attack_belief (formally defined inSection 3.1). Finally, the target_resource attribute stores theTCP port (or service name), if known, or the program begin at-tacked. An example instance is the following one:
(127.0.0.1-z7012gf, 127.0.0.1, 127.0.0.1, H, 0xbc723b45.0xef449129, 0xbc723b45.0xff449130, -, 0.141044, fdfor-
mat(2351))
The example reports an attack detected from an host IDS (id-s_type = H), identified by 127.0.0.1-z7012gf: the attack againstfdformat is started at NTP-second 0xbc723b45 (NTP-picosecond0xef449129) and finished at NTP-second 0xbc723b45 (NTP-pico-second 0xff449130); the analyzer detected the activity as an attackwith a belief of 14.1044%. An equivalent example for the networkIDS (ids_type = N) anomaly detector would be something like:
(172.16.87.101/24-a032j11, 172.16.87.103/24, 172.16.
87.100/24, N, 0xbc723b45.0xef449129, 0xbc723b45.0xff-
449130, -, 0.290937, smtp)
Here the attack is against the smtp resource (i.e., protocol) andthe analyzer believes there is an attack at 29.0937%.
4.2. A framework for evaluating alert fusion systems
Alert fusion is a relatively new problem, thus evaluation tech-niques are limited to a few approaches [28]. The development ofsolid testing methodologies is needed from both the theoreticaland the practical points of view (a problem shared with IDStesting).
The main goal of fusion systems is to reduce the amount ofalerts the security analyst has to check. In doing this, the global
0 0.02 0.04 0.06 0.08 0.1 0.12 0.14 0.16 0.18 0.20.200
0.30
0.400
0.50
0.600
0.70
0.800
0.90
1.000
Alert Reduction Rate
Glo
bal D
R
Best performances
Average performances
Poor performances
0 0.02 0.04 0.06 0.08 0.1 0.12 0.14 0.16 0.18 0.20.015
0.02
0.025
0.03
0.035
0.04
0.045
0.05
0.055
Best performances
Average performances
Poor performances
Alert Reduction Rate
Glo
bal F
PR
a b
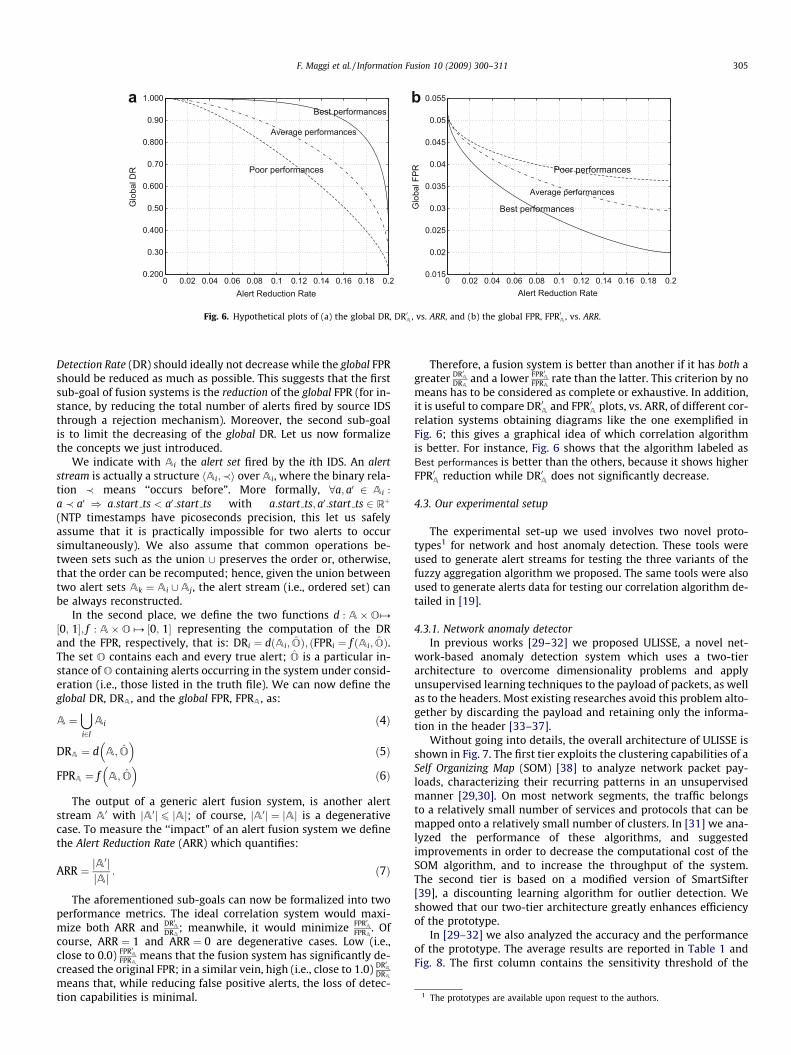
Fig. 6. Hypothetical plots of (a) the global DR, DR0A , vs. ARR, and (b) the global FPR, FPR0A , vs. ARR.
1 The prototypes are available upon request to the authors.
F. Maggi et al. / Information Fusion 10 (2009) 300–311 305
Detection Rate (DR) should ideally not decrease while the global FPRshould be reduced as much as possible. This suggests that the firstsub-goal of fusion systems is the reduction of the global FPR (for in-stance, by reducing the total number of alerts fired by source IDSthrough a rejection mechanism). Moreover, the second sub-goalis to limit the decreasing of the global DR. Let us now formalizethe concepts we just introduced.
We indicate with Ai the alert set fired by the ith IDS. An alertstream is actually a structure hAi;�i over Ai, where the binary rela-tion � means ‘‘occurs before”. More formally, 8a; a0 2 Ai :
a � a0 ) a:start ts < a0:start ts with a:start ts; a0:start ts 2 Rþ
(NTP timestamps have picoseconds precision, this let us safelyassume that it is practically impossible for two alerts to occursimultaneously). We also assume that common operations be-tween sets such as the union [ preserves the order or, otherwise,that the order can be recomputed; hence, given the union betweentwo alert sets Ak ¼ Ai [Aj, the alert stream (i.e., ordered set) canbe always reconstructed.
In the second place, we define the two functions d : A�O#
½0; 1�; f : A�O # ½0; 1� representing the computation of the DRand the FPR, respectively, that is: DRi ¼ dðAi; OÞ; ðFPRi ¼ f ðAi; OÞ.The set O contains each and every true alert; O is a particular in-stance of O containing alerts occurring in the system under consid-eration (i.e., those listed in the truth file). We can now define theglobal DR, DRA, and the global FPR, FPRA, as:
A ¼[i2I
Ai ð4Þ
DRA ¼ d A; O� �
ð5Þ
FPRA ¼ f A; O� �
ð6Þ
The output of a generic alert fusion system, is another alertstream A0 with jA0j 6 jAj; of course, jA0j ¼ jAj is a degenerativecase. To measure the ‘‘impact” of an alert fusion system we definethe Alert Reduction Rate (ARR) which quantifies:
ARR ¼ jA0jjAj : ð7Þ
The aforementioned sub-goals can now be formalized into twoperformance metrics. The ideal correlation system would maxi-mize both ARR and DR0A
DRA; meanwhile, it would minimize FPR0A
FPRA. Of
course, ARR ¼ 1 and ARR ¼ 0 are degenerative cases. Low (i.e.,close to 0.0) FPR0A
FPRAmeans that the fusion system has significantly de-
creased the original FPR; in a similar vein, high (i.e., close to 1.0) DR0ADRA
means that, while reducing false positive alerts, the loss of detec-tion capabilities is minimal.
Therefore, a fusion system is better than another if it has both agreater DR0A
DRAand a lower FPR0A
FPRArate than the latter. This criterion by no
means has to be considered as complete or exhaustive. In addition,it is useful to compare DR0A and FPR0A plots, vs. ARR, of different cor-relation systems obtaining diagrams like the one exemplified inFig. 6; this gives a graphical idea of which correlation algorithmis better. For instance, Fig. 6 shows that the algorithm labeled asBest performances is better than the others, because it shows higherFPR0A reduction while DR0A does not significantly decrease.
4.3. Our experimental setup
The experimental set-up we used involves two novel proto-types1 for network and host anomaly detection. These tools wereused to generate alert streams for testing the three variants of thefuzzy aggregation algorithm we proposed. The same tools were alsoused to generate alerts data for testing our correlation algorithm de-tailed in [19].
4.3.1. Network anomaly detectorIn previous works [29–32] we proposed ULISSE, a novel net-
work-based anomaly detection system which uses a two-tierarchitecture to overcome dimensionality problems and applyunsupervised learning techniques to the payload of packets, as wellas to the headers. Most existing researches avoid this problem alto-gether by discarding the payload and retaining only the informa-tion in the header [33–37].
Without going into details, the overall architecture of ULISSE isshown in Fig. 7. The first tier exploits the clustering capabilities of aSelf Organizing Map (SOM) [38] to analyze network packet pay-loads, characterizing their recurring patterns in an unsupervisedmanner [29,30]. On most network segments, the traffic belongsto a relatively small number of services and protocols that can bemapped onto a relatively small number of clusters. In [31] we ana-lyzed the performance of these algorithms, and suggestedimprovements in order to decrease the computational cost of theSOM algorithm, and to increase the throughput of the system.The second tier is based on a modified version of SmartSifter[39], a discounting learning algorithm for outlier detection. Weshowed that our two-tier architecture greatly enhances efficiencyof the prototype.
In [29–32] we also analyzed the accuracy and the performanceof the prototype. The average results are reported in Table 1 andFig. 8. The first column contains the sensitivity threshold of the

LAYER 3header
IP
LAYER 4header
TCP/UDP/...
PAYLOAD(upper layer protocol data)
Ethernet: 0–1460 bytes
Decoded Header Data
(IP, ports, flags)
Payload Classification
(from first stage)
.
.
.
.
.
.
.
.
.
.
.
.
.
.
.
LAYER 3header
IP
LAYER 4header
TCP/UDP/...
PAYLOAD(upper layer protocol data)
Ethernet: 0–1460 bytes
Decoded Header Data
(IP, ports, flags)
Payload Classification
(from first stage)
LAYER 3header
IP
LAYER 4header
TCP/UDP/...
PAYLOAD(upper layer protocol data)
Ethernet: 0–1460 bytes
Decoded Header Data
(IP, ports, flags)
Payload Classification
(from first stage)
FIR
ST S
TAG
EU
nsup
ervi
sed
lear
ning
cla
ssifi
er
Dec
oded
H
eade
r Dat
a(IP
, por
ts, fl
ags)
Payl
oad
Cla
ssifi
catio
n(fr
om fi
rst s
tage
)
Dec
oded
H
eade
r Dat
a(IP
, por
ts, fl
ags)
Payl
oad
Cla
ssifi
catio
n(fr
om fi
rst s
tage
)
Dec
oded
H
eade
r Dat
a(IP
, por
ts, fl
ags)
Payl
oad
Cla
ssifi
catio
n(fr
om fi
rst s
tage
)
Dec
oded
H
eade
r Dat
a(IP
, por
ts, fl
ags)
Payl
oad
Cla
ssifi
catio
n(fr
om fi
rst s
tage
)
Dec
oded
H
eade
r Dat
a(IP
, por
ts, fl
ags)
Payl
oad
Cla
ssifi
catio
n(fr
om fi
rst s
tage
)
Dec
oded
H
eade
r Dat
a(IP
, por
ts, fl
ags)
Payl
oad
Cla
ssifi
catio
n(fr
om fi
rst s
tage
)
SECOND STAGETime correlation and outlier detection
Time
Time
Fig. 7. The overall architecture of the two-stage network-based IDS prototype.
Table 1Detection rates and false positive rates for our prototype.
Threshold (%) Detection rate (%) False positive rate (%)
0.03 66.7 0.0310.05 72.2 0.0550.08 77.8 0.0860.09 88.9 0.095
306 F. Maggi et al. / Information Fusion 10 (2009) 300–311
algorithm, generated as a quantile of the approximated distribu-tion of observed data [40]; as it could be expected, it is a properstatistical predictor of the percentage of data that will be flaggedas outliers by the algorithm (i.e., the empirical distribution is closeto the real one). As we can see, it is also a good predictor of the FPR,if the attack rate is not too high. The prototype is able to reach a66.7% DR with as few as 0.03% false positives. In comparison, inthe only prototype dealing with payloads, available in the litera-ture [41], the best overall result leads to the detection of 58.7% ofthe attacks, with a FPR that is between 0.1% and 1%. Our prototypeshows thus a better DR, with a number of false positives which isbetween one and two order of magnitudes lower than comparablesystems (e.g., [41]), as shown in the Receiver Operating Characteris-tic (ROC) curve Fig. 8.
4.3.2. System call anomaly detectorThe second prototype, proposed and detailed in [42], is S2A2DE,
a Host-based IDS (HIDS) which can detect anomalies by analyzingsystem call arguments and sequences. S2A2DE is an almost com-plete re-engineering of SyscallAnomaly [43], that was able to de-tect only anomalies in arguments in its original release. Inparticular, our prototype implements some of the ideas of Syscall-Anomaly along with Markovian based modelling, clustering andbehavior identification outperforming the original application withboth an increased DR and a reduced FPR.
S2A2DE works by analyzing syscall traces logged in OpenBSM[44] or other custom ASCII formats. The overall architecture is
drawn in Fig. 9. During training, a hierarchical clustering algorithm,based on a distance measure between probabilistic models, is usedto identify groups of similar syscalls (for details see [32,42]); theresulting clusters become the nodes a of Markov chain built inthe second stage to characterize and learn the process behaviorof each application in terms of syscall sequences behavior. At theend of this training step we store both clusters and transition mod-els, along with two thresholds (syscall threshold and sequencethreshold) required at runtime for deciding whether or not anew call or a new syscall sequence is anomalous. For further detailson cluster models, implementation of the transition models, andthreshold computation please refer to [32,42].
As detailed in [42], S2A2DE is implemented in ANSI C and it iscapable of processing around 103 system calls per second in thetraining phase; the runtime throughput is as high as 22266syscall=s. We recall that the prototype is also very accurate: on no-vel attacks (e.g., custom and stealthy exploits against bsdtar andeject), it is capable of DR between 88% and 100% with no morethan 1.6% as FPR. For comprehensive accuracy and performancetests, please refer to [42]. We also recall the accuracy of the proto-type: the DR vs. FPR is plot in Fig. 10.
4.4. Test data generation
A well-known problem in IDS research is the lack of reliablesources of test data. Gathering full traces of real world networksis generally impossible for privacy reasons; also, IDS researchersneed clearly labeled data where attacks are described in full de-tails, something which is usually impossible to achieve with realworld dumps. The dataset created by the Lincoln Laboratory atM.I.T., also known as ‘‘DARPA IDS Evaluation dataset” [45], is basi-cally the only dataset of this kind which is freely available alongwith complete truth files. Other datasets exist (e.g., the DEFCONCTF packet capture [46]), but they are not labeled and do not con-tain ‘‘background traffic” (i.e., attack-free activity for IDS training).Thus, most existing researches on network-based IDS use mainlythe DARPA datasets for evaluation.

0
20
40
60
80
100
0,000 2,000 4,000 6,000 8,000 10,000 12,000FPR (%)
DR
(%)
Fig. 10. The ROC curve of the host anomaly detector.0
10
20
30
40
50
60
70
80
90
100
0,000 0,100 0,200 0,300 0,400 0,500 0,600 0,700 0,800 0,900 1,000FPR (%)
DR
(%)
Fig. 8. The ROC curve of the network anomaly detector: the tool has been trainedwith about 106 TCP/IP dumped packets and tested with about 104 packets.
F. Maggi et al. / Information Fusion 10 (2009) 300–311 307
These data have been artificially generated and collected in or-der to evaluate detection rates and false positives rates of IDS.There are two datasets: 1998 and 1999. The 1999 dataset [47],which we extensively used in this work, spans over 5 weeks, andcontains the packet dumps in tcpdump format of 5 weeks, over 2sniffers, one placed between the gateway and 5 ‘‘target” machines(thus emulating an ‘‘internal” sniffer), and the other placed beyondthe gateway, recording packets flowing between the simulatedLAN and the simulated Internet. Both attack-free data and clearlylabeled attack traces are present. Besides the tcpdump traces,BSM auditing data for Solaris systems, NT auditing data for Win-dows systems, directory tree snapshots of each system, the contentof sensitive directories, and inode data are available.
A common question is how realistic these data are, having beenartificially generated specifically for IDS evaluation. Many authorsalready analyzed the network data of the 1999 dataset, findingmany shortcomings [48,49]: no detail is available on the genera-tion methods, there is no evidence that the traffic is actually real-istic, and no spurious packet, checksum errors or fragmentedpackets are present. In addition, the synthetic packets sharestrange regularities. Host auditing data is all but immune fromproblems as well, as we showed in [42]: the dataset is limited, fullof artifacts, and prone to overfitting. However, it must be noted
Fig. 9. The overall architecture of
that these anomalies are mainly an issue when evaluating the per-formance of single intrusion detectors. In our case, they are not ex-tremely relevant.
What is relevant, actually, is that the whole dataset is outdated,both in the background traffic and the in the attacks. The mostused attack technique is buffer overflow, and intrusion scenariosare extremely simple. Additionally, even if IDEVAL contains bothhost and network auditing data, some attacks are not directlydetectable in both systems, making them less relevant for correla-tion testing. The only such attacks are the ones in which an attack-er exploits a vulnerability in a local or remote service to allow anintruder to obtain or escalate privileges. One of the best targethosts for finding such correlations is pascal.eyrie.af.mil,which runs Solaris 2.5.1.
For all the previous reasons, in our testing we will use the IDE-VAL dataset with the following simplification: we will just try tofuse the stream of alerts coming from a HIDS sensor and a NIDSsensor, which is monitoring the whole network. To this end, weran the two prototypes described above in Section 4.3 on the whole1999 IDEVAL testing dataset, using the network dumps and thehost-based logs from pascal. We ran the NIDS prototype on tcp-
dump data and collected 128 alerts for attacks against the hostpascal.eyrie.af.mil. The NIDS also generated 1009 alerts re-lated to other hosts. Using the HIDS prototype we generated1070 alerts from the dumps of the host pascal.eyrie.af.mil.With respect to these alerts, the NIDS was capable of detecting
the host-based IDS prototype.
0 0.02 0.04 0.06 0.08 0.1 0.12 0.14 0.16 0.18 0.20.7
0.75
0.8
0.85
0.9
0.95
1CrispFuzzyFuzzy (belief)
Alert Reduction Rate
Glo
bal D
R
0 0.02 0.04 0.06 0.08 0.1 0.12 0.14 0.16 0.18 0.20.015
0.02
0.025
0.03
0.035
0.04
0.045
0.05
0.055
Alert Reduction Rate
Glo
bal F
PR
CrispFuzzyFuzzy (belief)
a b
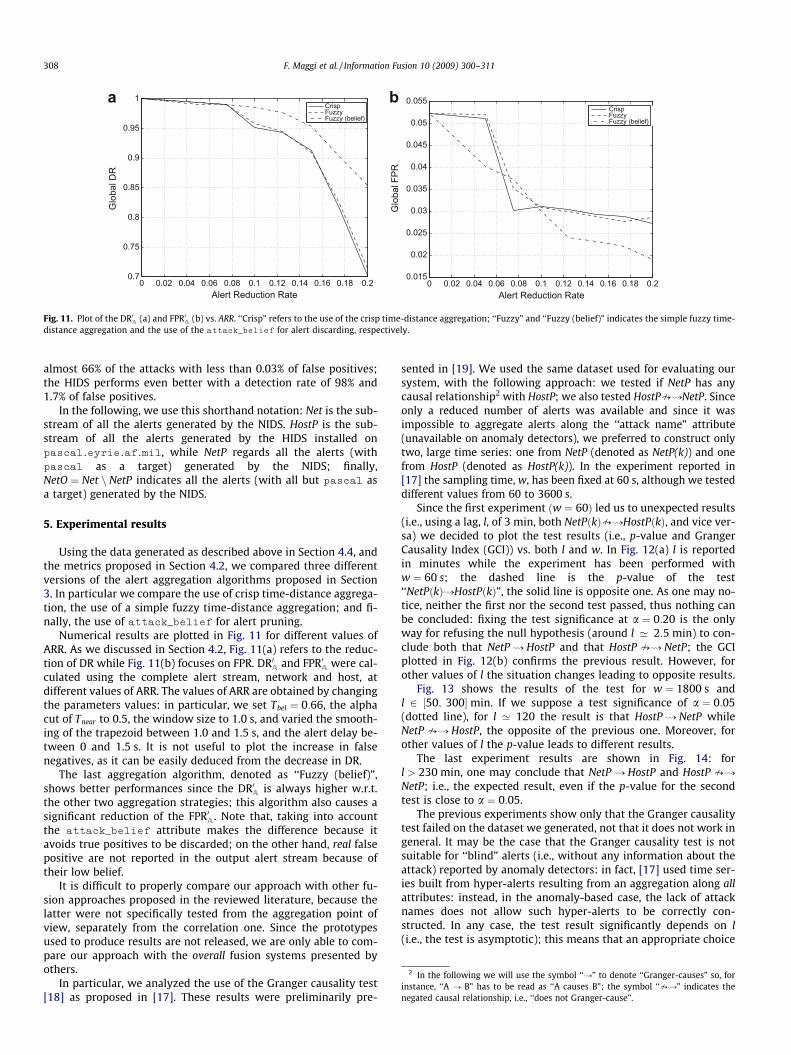
Fig. 11. Plot of the DR0A (a) and FPR0A (b) vs. ARR. ‘‘Crisp” refers to the use of the crisp time-distance aggregation; ‘‘Fuzzy” and ‘‘Fuzzy (belief)” indicates the simple fuzzy time-distance aggregation and the use of the attack_belief for alert discarding, respectively.
2 In the following we will use the symbol ‘‘,” to denote ‘‘Granger-causes” so, forstance, ‘‘A , B” has to be read as ‘‘A causes B”; the symbol ‘‘O,” indicates the
egated causal relationship, i.e., ‘‘does not Granger-cause”.
308 F. Maggi et al. / Information Fusion 10 (2009) 300–311
almost 66% of the attacks with less than 0.03% of false positives;the HIDS performs even better with a detection rate of 98% and1.7% of false positives.
In the following, we use this shorthand notation: Net is the sub-stream of all the alerts generated by the NIDS. HostP is the sub-stream of all the alerts generated by the HIDS installed onpascal.eyrie.af.mil, while NetP regards all the alerts (withpascal as a target) generated by the NIDS; finally,NetO ¼ Net n NetP indicates all the alerts (with all but pascal asa target) generated by the NIDS.
5. Experimental results
Using the data generated as described above in Section 4.4, andthe metrics proposed in Section 4.2, we compared three differentversions of the alert aggregation algorithms proposed in Section3. In particular we compare the use of crisp time-distance aggrega-tion, the use of a simple fuzzy time-distance aggregation; and fi-nally, the use of attack_belief for alert pruning.
Numerical results are plotted in Fig. 11 for different values ofARR. As we discussed in Section 4.2, Fig. 11(a) refers to the reduc-tion of DR while Fig. 11(b) focuses on FPR. DR0A and FPR0A were cal-culated using the complete alert stream, network and host, atdifferent values of ARR. The values of ARR are obtained by changingthe parameters values: in particular, we set Tbel ¼ 0:66, the alphacut of Tnear to 0.5, the window size to 1.0 s, and varied the smooth-ing of the trapezoid between 1.0 and 1.5 s, and the alert delay be-tween 0 and 1.5 s. It is not useful to plot the increase in falsenegatives, as it can be easily deduced from the decrease in DR.
The last aggregation algorithm, denoted as ‘‘Fuzzy (belief)”,shows better performances since the DR0A is always higher w.r.t.the other two aggregation strategies; this algorithm also causes asignificant reduction of the FPR0A. Note that, taking into accountthe attack_belief attribute makes the difference because itavoids true positives to be discarded; on the other hand, real falsepositive are not reported in the output alert stream because oftheir low belief.
It is difficult to properly compare our approach with other fu-sion approaches proposed in the reviewed literature, because thelatter were not specifically tested from the aggregation point ofview, separately from the correlation one. Since the prototypesused to produce results are not released, we are only able to com-pare our approach with the overall fusion systems presented byothers.
In particular, we analyzed the use of the Granger causality test[18] as proposed in [17]. These results were preliminarily pre-
sented in [19]. We used the same dataset used for evaluating oursystem, with the following approach: we tested if NetP has anycausal relationship2 with HostP; we also tested HostPO,NetP. Sinceonly a reduced number of alerts was available and since it wasimpossible to aggregate alerts along the ‘‘attack name” attribute(unavailable on anomaly detectors), we preferred to construct onlytwo, large time series: one from NetP (denoted as NetP(k)) and onefrom HostP (denoted as HostP(k)). In the experiment reported in[17] the sampling time, w, has been fixed at 60 s, although we testeddifferent values from 60 to 3600 s.
Since the first experiment ðw ¼ 60Þ led us to unexpected results(i.e., using a lag, l, of 3 min, both NetPðkÞO,HostPðkÞ, and vice ver-sa) we decided to plot the test results (i.e., p-value and GrangerCausality Index (GCI)) vs. both l and w. In Fig. 12(a) l is reportedin minutes while the experiment has been performed withw ¼ 60 s; the dashed line is the p-value of the test‘‘NetPðkÞ,HostPðkÞ”, the solid line is opposite one. As one may no-tice, neither the first nor the second test passed, thus nothing canbe concluded: fixing the test significance at a ¼ 0:20 is the onlyway for refusing the null hypothesis (around l ’ 2:5 min) to con-clude both that NetP , HostP and that HostP O, NetP; the GCIplotted in Fig. 12(b) confirms the previous result. However, forother values of l the situation changes leading to opposite results.
Fig. 13 shows the results of the test for w ¼ 1800 s andl 2 ½50; 300�min. If we suppose a test significance of a ¼ 0:05(dotted line), for l ’ 120 the result is that HostP , NetP whileNetP O, HostP, the opposite of the previous one. Moreover, forother values of l the p-value leads to different results.
The last experiment results are shown in Fig. 14: forl > 230 min, one may conclude that NetP , HostP and HostP O,
NetP; i.e., the expected result, even if the p-value for the secondtest is close to a ¼ 0:05.
The previous experiments show only that the Granger causalitytest failed on the dataset we generated, not that it does not work ingeneral. It may be the case that the Granger causality test is notsuitable for ‘‘blind” alerts (i.e., without any information about theattack) reported by anomaly detectors: in fact, [17] used time ser-ies built from hyper-alerts resulting from an aggregation along allattributes: instead, in the anomaly-based case, the lack of attacknames does not allow such hyper-alerts to be correctly con-structed. In any case, the test result significantly depends on l(i.e., the test is asymptotic); this means that an appropriate choice
inn

0 10 20 30 40
0.0
0.2
0.4
0.6
0.8
1.0
Lag [minutes]
p−Va
lue
0 10 20 30 40
0.0
0.5
1.0
1.5
2.0
Lag [minutes]
Gra
nger
Cau
salit
y In
dex
a b
Fig. 12. p-value (a) and GCI (b) vs. l (in minutes) for the first Granger causality test experiment (w ¼ 60:0 s): ‘‘NetPðkÞ, HostPðkÞ” (dashed line), ‘‘HostPðkÞ, NetPðkÞ” (solidline).
100 150 200 250 300
0.0
0.2
0.4
0.6
0.8
1.0
Lag [minuti]
p−Va
lue
100 150 200 250 300
2.0
2.5
3.0
3.5
4.0
4.5
Lag [minuti]
Gra
nger
Cau
salit
y In
dex
a b
Fig. 14. p-value (a) and GCI (b) vs. p (in minutes) for the first Granger causality test experiment (w ¼ 3600:0 s): ‘‘NetPðkÞ, HostPðkÞ” (dashed line), ‘‘HostPðkÞ, NetPðkÞ”(solid line).
50 100 150 200 250
0.0
0.1
0.2
0.3
0.4
Lag [minutes]
p−Va
lue
50 100 150 200 250
24
68
Lag [minutes]
Gra
nger
Cau
salit
y In
dex
a b
Fig. 13. p-value (a) and GCI (b) vs. l (in minutes) for the first Granger causality test experiment (w ¼ 1800:0 s): ‘‘NetPðkÞ, HostPðkÞ” (dashed line), ‘‘HostPðkÞ, NetPðkÞ” (solidline).
F. Maggi et al. / Information Fusion 10 (2009) 300–311 309
of l will be required, depending on specific environmental condi-tions. The optimal l is also likely to change over time in a givenenvironment.
6. Conclusions
In this paper we described and evaluated a technique whichuses fuzzy sets and measures to fuse alerts reported by the anom-aly detectors. After a brief framework description and precise prob-lem statement, we analyzed previous literature about alert fusion
(i.e., aggregation and correlation), and found that effective tech-niques have been proposed, but they are not really suitable foranomaly detection, because they require a priori knowledge (e.g.,attack names or division into classes) to perform well.
Our proposal defines simple, but robust criteria for computingthe time distance between alerts in order to take into accountuncertainty on both measurements and the threshold-distance siz-ing. In addition, we considered the implementation of a post-aggregation phase to remove unaggregated alerts according totheir belief, a value indicating how much the IDS believes the de-tected attack to be real. Moreover, we defined and used some sim-

310 F. Maggi et al. / Information Fusion 10 (2009) 300–311
ple metrics for the evaluation of alert fusion systems. In particular,we propose to plot both the DR and the FPR vs. the degree of outputalert reduction vs. the size of the input alert stream.
We performed experiments for validating our proposal. To thisend, we used two prototypes we previously developed: a hostanomaly detector, that exploits the analysis of system calls argu-ments and behavior, and a network anomaly detector, based onunsupervised payload clustering and classification techniques thatenables an effective outlier detection algorithm to flag anomalies.During our experiments, we were able to outline many shortcom-ings of the IDEVAL dataset (the only available IDS benchmark)when used for evaluating alert fusion systems. In addition toknown anomalies in network and host data, IDEVAL is outdatedboth in terms of background traffic and attack scenarios.
Our experiments showed that the proposed fuzzy aggregationapproach is able to decrease the FPR at the price of a small reduc-tion of the DR (a necessary consequence). The approach defines thenotion of ‘‘closeness” in time as the natural extension of the naıve,crisp way; to this end, we rely both on fuzzy set theory and fuzzymeasures to semantically ground the concept of ‘‘closeness”. Bydefinition, our method is robust because it takes into account ma-jor uncertainties on timestamps; this means the choice of windowsize is less sensitive to fluctuations in the network delays becauseof the smoothing allowed by the fuzziness of the window itself. Ofcourse, if the delays are varying too much, a dynamic resizing isstill necessary. The biggest challenge with our approach wouldbe its extension to the correlation of distributed alerts: in the cur-rent state, our modelling is not complete, but can potentially be ex-tended in such a way; being the lack of alert features the maindifficult.
We also showed preliminary results on the use of the Grangercausality test to recognize logically linked alerts, also giving a sta-tistical quantification of the degree of ‘‘causality”. However, a fullexploitation of this technique is the subject for future extensionsof this work. Even if the method does not require a priori knowl-edge, we identified two significant issues: first, the statistical testrelies on non-obvious configuration parameters which values sig-nificantly affect the final result; second, in order to extensively testsuch a methods a better dataset than IDEVAL would be needed. Webelieve that the use of the Granger causality test might be appliedto alerts reported by anomaly detectors as well. Another possibleextension of this work is the investigation of algorithms and crite-ria to correlate anomaly and misuse-based alerts together, in orderto bridge the gap between the existing paradigms of intrusiondetection.
Acknowledgements
Most of this work was supported by the Italian Ministry ofEducation and Research under the FIRB Project ‘‘Performanceevaluation for complex systems”, in the research unit led byProf. Giuseppe Serazzi, whose support we gratefully acknowledge.We need also to thank Prof. Andrea Bonarini for his helpfulcomments.
References
[1] S. Zanero, Detecting 0-day attacks with learning intrusion detection systems,in: Blackhat USA, Briefings, 2004.
[2] T.H. Ptacek, T.N. Newsham, Insertion, Evasion, and Denial of Service: EludingNetwork Intrusion Detection, Technical Report T2R-0Y6, Secure Networks,Calgary, Canada, 1998.
[3] G. Vigna, W. Robertson, D. Balzarotti, Testing network-based intrusiondetection signatures using mutant exploits, in: Proceedings of the ACMConference on Computer and Communication Security (ACM CCS),Washington, DC, 2004, pp. 21–30.
[4] D.E. Denning, An intrusion-detection model, IEEE Trans. Software Eng. SE 13(2) (1987) 222–232.
[5] J.P. Anderson, Computer Security Threat Monitoring and Surveillance,Technical Report, J.P. Anderson Co., Ft. Washington, Pennsylvania, April 1980.
[6] F. Valeur, A comprehensive approach to intrusion detection alert correlation,IEEE Trans. Dependable Secur. Comput. 1 (3) (2004) 146–169. Member-Giovanni Vigna and Member-Christopher Kruegel and Fellow-Richard A.Kemmerer.
[7] Z. Wang, G.J. Klir, Fuzzy Measure Theory, Kluwer Academic Publishers,Norwell, MA, USA, 1993.
[8] G.J. Klir, T.A. Folger, Fuzzy Sets Uncertainty and Information, Prentice-Hall, Inc.,Upper Saddle River, NJ, USA, 1987.
[9] R.G. Bace, Intrusion Detection, Macmillan Publishing Co., Inc., Indianapolis, IN,USA, 2000.
[10] S. Eckmann, G. Vigna, R. Kemmerer, STATL: an attack language for state-basedintrusion detection, in: Proceedings of the ACM Workshop on IntrusionDetection, Athens, 2000.
[11] S.J. Templeton, K. Levitt, A requires/provides model for computer attacks, in:NSPW’00: Proceedings of the 2000 Workshop on New Security Paradigms,ACM Press, New York, NY, USA, 2000, pp. 31–38.
[12] F. Cuppens, A. MiTge, Alert correlation in a cooperative intrusion detectionframework, in: SP’02: Proceedings of the 2002 IEEE Symposium on Securityand Privacy, IEEE Computer Society, Washington, DC, USA, 2002, p. 202.
[13] P. Ning, Y. Cui, D.S. Reeves, D. Xu, Techniques and tools for analyzing intrusionalerts, ACM Trans. Inf Syst. Secur. 7 (2) (2004) 274–318.
[14] P.A. Porras, P.G. Neumann, EMERALD: event monitoring enabling responses toanomalous live disturbances, in: Proceedings of the 20th NIST-NCSC NationalInformation Systems Security Conference, 1997, pp. 353–365.
[15] A. Valdes, K. Skinner, Probabilistic alert correlation, in: RAID’00: Proceedings ofthe Fourth International Symposium on Recent Advances in IntrusionDetection, Springer-Verlag, London, UK, 2001, pp. 54–68.
[16] J. Viinikka, H. Debar, L. Mé, R. Séguier, Time series modeling for IDS alertmanagement, in: ASIACCS’06: Proceedings of the 2006 ACM Symposium onInformation, Computer and Communications Security, ACM Press, New York,NY, USA, 2006, pp. 102–113.
[17] X. Qin, W. Lee, Statistical causality analysis of infosec alert data, in: RAID, 2003,pp. 73–93.
[18] C. Granger, Investigating causal relations by econometric methods and cross-spectral methods, Econometrica 34 (1969) 424–428.
[19] F. Maggi, S. Zanero, On the use of different statistical tests for alert correlation– short paper, in: C. Krügel, R. Lippmann, A. Clark (Eds.), RAID, Lecture Notes inComputer Science, vol. 4637, Springer, 2007, pp. 167–177.
[20] K. Julisch, M. Dacier, Mining intrusion detection alarms for actionableknowledge, in: KDD’02: Proceedings of the Eighth ACM SIGKDDInternational Conference on Knowledge Discovery and Data Mining, ACMPress, New York, NY, USA, 2002, pp. 366–375.
[21] O. Dain, R. Cunningham, Fusing heterogeneous alert streams into scenarios, in:Proceedings of the ACM Workshop on Data Mining for Security Applications,2001, pp. 1–13.
[22] H. Debar, A. Wespi, Aggregation and correlation of intrusion-detection alerts,in: RAID’00: Proceedings of the Fourth International Symposium on RecentAdvances in Intrusion Detection, Springer-Verlag, London, UK, 2001, pp. 85–103.
[23] P.A. Porras, M.W. Fong, A. Valdes, A mission-impact-based approach toinfosec alarm correlation, Lecture Notes in Computer Science 2516/2002(2002) 35.
[24] E.H. Shortliffe, Computer-based medical consultations: MYCIN, Elsevier, 1976.[25] H. Debar, D. Curry, B. Feinstein, The Intrusion Detection Message Exchange
Format, Technical Report, France Telecom and Guardian and TNT, March 2006.[26] Snort, 2006. <http://www.snort.org>.[27] D.L. Mills, Rfc1305: Network Time Protocol (version 3), 1992. <http://
www.ietf.org/rfc/rfc1305.txt>.[28] J. Haines, D.K. Ryder, L. Tinnel, S. Taylor, Validation of sensor alert correlators,
IEEE Security and Privacy 01 (1) (2003) 46–56.[29] S. Zanero, S.M. Savaresi, Unsupervised learning techniques for an intrusion
detection system, in: Proceedings of the 2004 ACM Symposium on AppliedComputing, ACM Press, 2004, pp. 412–419.
[30] S. Zanero, Analyzing tcp traffic patterns using self organizing maps, in: F. Roli,S. Vitulano (Eds.), Proceedings of the 13th International Conference on ImageAnalysis and Processing – ICIAP 2005, Lecture Notes in Computer Science, vol.3617, Springer, Cagliari, Italy, 2005, pp. 83–90.
[31] S. Zanero, Improving self organizing map performance for network intrusiondetection, in: SDM 2005 Workshop on ‘‘Clustering High Dimensional Data andits Applications”, 2005.
[32] S. Zanero, Unsupervised Learning Algorithms for Intrusion Detection, Ph.D.Thesis, Politecnico di Milano T.U., Milano, Italy, May 2006.
[33] M. Mahoney, P. Chan, Detecting Novel Attacks by Identifying AnomalousNetwork Packet Headers, Technical Report CS-2001-2, Florida Institute ofTechnology, 2001.
[34] C. Chow, Parzen-Window network intrusion detectors, in: ICPR’02: Proceedingsof the 16th International Conference on Pattern Recognition (ICPR’02), IEEEComputer Society, vol. 4, Washington, DC, USA, 2002, pp. 385–388.
[35] K. Labib, R. Vemuri, NSOM: a real-time network-based intrusion detectionsystem using self-organizing maps, Technical Report, Department of AppliedScience, University of California, Davis, 2002.
[36] M.V. Mahoney, P.K. Chan, A machine learning approach to detecting attacks byidentifying anomalies in network traffic, Technical Report CS-2002-08, FloridaInstitute of Technology, 2002.
F. Maggi et al. / Information Fusion 10 (2009) 300–311 311
[37] M.V. Mahoney, Network traffic anomaly detection based on packet bytes, in:Proceedings of the 19th Annual ACM Symposium on Applied Computing, 2003.
[38] T. Kohonen, Self-Organizing Maps, third ed., Springer-Verlag, Berlin, 2001.[39] K. Yamanishi, J.-I. Takeuchi, G. Williams, P. Milne, On-line unsupervised outlier
detection using finite mixtures with discounting learning algorithms, DataMin. Knowledge Discov. 8 (3) (2004) 275–300.
[40] K. Yamanishi, J.-I. Takeuchi, G.J. Williams, P. Milne, Online unsupervisedoutlier detection using finite mixtures with discounting learning algorithms,Knowledge Discov. Data Min. 8 (3) (2004) 275–300.
[41] K. Wang, S.J. Stolfo, Anomalous payload-based network intrusion detection, in:RAID Symposium, 2004.
[42] F. Maggi, M. Matteucci, S. Zanero, Detecting intrusions through system callsequence and argument analysis, IEEE Transactions on Dependable and SecureComputing, accepted for publication.
[43] C. Kruegel, D. Mutz, F. Valeur, G. Vigna, On the detection of anomalous systemcall arguments, in: Proceedings of the 2003 European Symposium on Researchin Computer Security, Gjøvik, Norway, 2003.
[44] R.N.M. Watson, W. Salamon, The FreeBSD audit system, in: UKUUG LISAConference, Durham, UK, 2006.
[45] M. Zissman, Darpa intrusion detection evaluation, 1999. <http://www.ll.mit.edu/IST/ideval/data/dataindex.html>.
[46] B. Potter, The Shmoo Group Capture the CTF project, 2006. <http://cctf.shmoo.com>.
[47] R. Lippmann, J.W. Haines, D.J. Fried, J. Korba, K. Das, Analysis and results of the1999 DARPA off-line intrusion detection evaluation, in: Proceedings of theThird International Workshop on Recent Advances in Intrusion Detection,Springer-Verlag, London, UK, 2000, pp. 162–182.
[48] J. McHugh, Testing intrusion detection systems: a critique of the 1998 and1999 DARPA intrusion detection system evaluations as performed by Lincolnlaboratory, ACM Trans. Inf. Syst. Secur. 3 (4) (2000) 262–294.
[49] M.V. Mahoney, P.K. Chan, An analysis of the 1999 DARPA/Lincoln laboratoryevaluation data for network anomaly detection, in: Proceedings of the SixthInternational Symposium on Recent Advances in Intrusion Detection (RAID2003), Pittsburgh, PA, USA, 2003, pp. 220–237.