reduced density airport lighting system evaluation · 2002-08-29 · composition, and construction...
TRANSCRIPT
Advanced General Aviation Transport Experiments
Impact of Aircraft Operation on Composite Airframe
Temperatures AGATE-WP3.3-033051-112 October 2001 L. Scott Miller, Ph.D. Department of Aerospace Engineering National Institute for Aviation Research Wichita State University Wichita, KS 67260
ABSTRACT
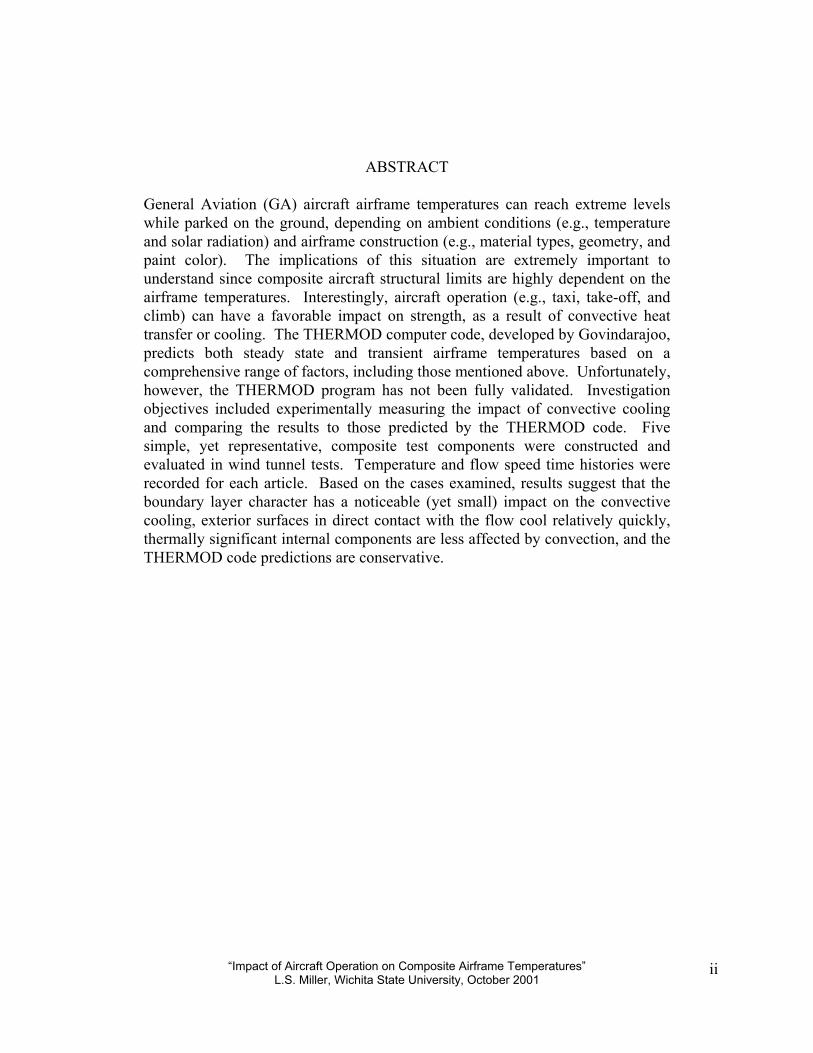
General Aviation (GA) aircraft airframe temperatures can reach extreme levels while parked on the ground, depending on ambient conditions (e.g., temperature and solar radiation) and airframe construction (e.g., material types, geometry, and paint color). The implications of this situation are extremely important to understand since composite aircraft structural limits are highly dependent on the airframe temperatures. Interestingly, aircraft operation (e.g., taxi, take-off, and climb) can have a favorable impact on strength, as a result of convective heat transfer or cooling. The THERMOD computer code, developed by Govindarajoo, predicts both steady state and transient airframe temperatures based on a comprehensive range of factors, including those mentioned above. Unfortunately, however, the THERMOD program has not been fully validated. Investigation objectives included experimentally measuring the impact of convective cooling and comparing the results to those predicted by the THERMOD code. Five simple, yet representative, composite test components were constructed and evaluated in wind tunnel tests. Temperature and flow speed time histories were recorded for each article. Based on the cases examined, results suggest that the boundary layer character has a noticeable (yet small) impact on the convective cooling, exterior surfaces in direct contact with the flow cool relatively quickly, thermally significant internal components are less affected by convection, and the THERMOD code predictions are conservative.
“Impact of Aircraft Operation on Composite Airframe Temperatures” L.S. Miller, Wichita State University, October 2001
ii

TABLE OF CONTENTS
Page 1. Introduction 1
1.1 Purpose 1 1.2 Background 1 1.3 Goals 1
2. Method 2
2.1 Basic Approach 2 2.2 Test Components 2 2.3 Apparatus, Sensors And Procedure 6
3. Results 13
3.1 Wind Tunnel Tests 13 3.2 THERMOD/Experiment Comparisons 14
4. Conclusions 27
5. Acknowledgements 27
6. References 28
“Impact of Aircraft Operation on Composite Airframe Temperatures”
L.S. Miller, Wichita State University, October 2001 iii
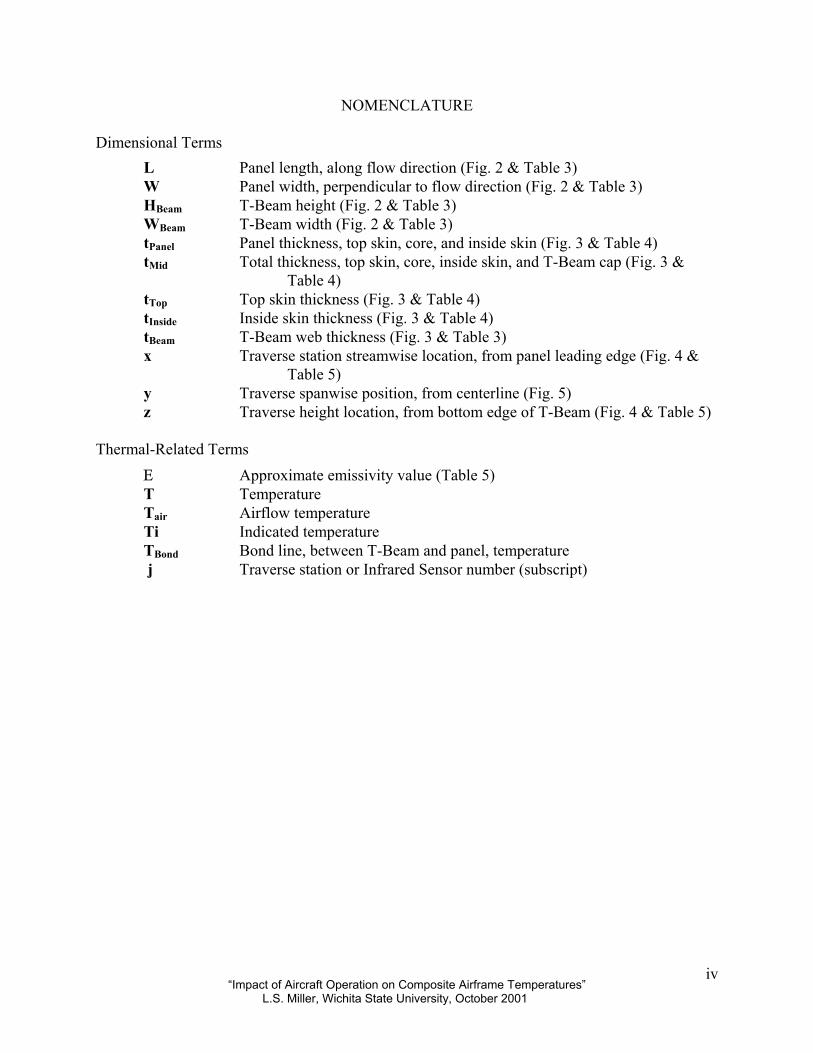
NOMENCLATURE
Dimensional Terms
L Panel length, along flow direction (Fig. 2 & Table 3) W Panel width, perpendicular to flow direction (Fig. 2 & Table 3) HBeam T-Beam height (Fig. 2 & Table 3) WBeam T-Beam width (Fig. 2 & Table 3) tPanel Panel thickness, top skin, core, and inside skin (Fig. 3 & Table 4) tMid Total thickness, top skin, core, inside skin, and T-Beam cap (Fig. 3 &
Table 4) tTop Top skin thickness (Fig. 3 & Table 4) tInside Inside skin thickness (Fig. 3 & Table 4) tBeam T-Beam web thickness (Fig. 3 & Table 3) x Traverse station streamwise location, from panel leading edge (Fig. 4 &
Table 5) y Traverse spanwise position, from centerline (Fig. 5) z Traverse height location, from bottom edge of T-Beam (Fig. 4 & Table 5)
Thermal-Related Terms
Ε Approximate emissivity value (Table 5) T Temperature Tair Airflow temperature Ti Indicated temperature TBond Bond line, between T-Beam and panel, temperature j Traverse station or Infrared Sensor number (subscript)
“Impact of Aircraft Operation on Composite Airframe Temperatures”
L.S. Miller, Wichita State University, October 2001 iv

LIST OF FIGURES Page Figure 1. Diagram Illustrating Selection Of Test Component Geometry 2
Figure 2. Lower Surface Photographs Of Two Test Panels 4
Figure 3. Diagram Showing Test Panel Dimensional Information 5
Figure 4. Diagram Showing Test Panel Dimensional Information 6
Figure 5. Schematic Diagram And Photograph Of Test Fixture In The Wind Tunnel 7
Figure 6. Front-Corner View Of Fixture In The Wind Tunnel 8
Figure 7. Diagram Showing IR-Sensor Traverse Stations 9
Figure 8. Top-Front View Of Fixture And Installed Test Panel 9
Figure 9. Fixture Interior And Traverse Arms 10
Figure 10. Example Of Panel IR-Sensor Temperature Survey 11
Figure 11. Example Of Experimental Data, Showing Temperature And Flow Time Histories 14
Figure 12. Carbon 1 Experiment And THERMOD Time History Comparisons (Panel Center) 16
Figure 13. Carbon 2 Experiment And THERMOD Time History Comparisons (Panel Center) 17
Figure 14. Glass/Foam Experiment And THERMOD Time History Comparisons (Panel Center) 18
Figure 15. Thin Carbon Experiment And THERMOD Time History Comparisons (Panel Center) 19
Figure 16. Glass/Nomex Experiment And THERMOD Time History Comparisons (Panel Center) 20
Figure 17. Carbon 1 Experiment And THERMOD Time History Comparisons (Away From T-Beam) 22
Figure 18. Carbon 2 Experiment And THERMOD Time History Comparisons (Away From T-Beam) 23
Figure 19. Glass/Foam Experiment And THERMOD Time History Comparisons (Away From T-Beam) 24
Figure 20. Thin Carbon Experiment And THERMOD Time History Comparisons (Away From T-Beam) 25
Figure 21. Glass/Nomex Experiment And THERMOD Time History Comparisons (Away From T-Beam) 26
LIST OF TABLES Page Table 1. Sandwich Panel Compositions 3 Table 2. T-Beam Compositions 3 Table 3. Panel And T-Beam Dimensions 4 Table 4. Panel And T-Beam Thickness 5 Table 5. Panel And T-Beam Temperature Deviations 12 Table 6. Panel And T-Beam Approximate Emissivity Values And Traverse Station Locations 12
“Impact of Aircraft Operation on Composite Airframe Temperatures”
L.S. Miller, Wichita State University, October 2001
vi

1. INTRODUCTION
1.1 PURPOSE. A series of wind tunnel experiments were undertaken to identify convective cooling effects on representative aircraft composite airframe components. This report's specific intent is to describe the experimental investigation, document results, and provide a comparison of measured data with computer code predictions.
1.2 BACKGROUND. General Aviation (GA) aircraft airframe temperatures can reach extreme levels while parked on the ground, due to solar radiation and extreme ambient conditions. The implications of this situation are extremely important to understand since composite aircraft structural limits are highly dependent on temperature. Put simply, a very hot and thermally soaked composite airplane is potentially weaker. Unfortunately, it is commonly assumed that there is minimal airframe cooling prior to application of the highest expected air loads during flight. Any effect or tool that might reduce airframe temperatures or more accurately predict the true values offers the potential for aircraft weight, strength and capability improvements. Resultant airplane temperatures depend on a range of factors. For example, ambient weather conditions (e.g., temperature, solar radiation and reflections, and wind velocity), airframe composition, and construction (e.g., material types, geometry, windows, and paint color) all contribute to actual airframe temperatures and strength. As was mentioned before, any type of airframe cooling can have an obvious positive effect. Aircraft operation, for example, during taxi, take-off, and climb can have a favorable impact on strength, as a result of convective heat transfer or cooling. The THERMOD computer code, developed by Govindarajoo, predicts airframe temperatures based on a comprehensive range of factors, including those mentioned previously.1 Both steady state and transient airframe temperature distributions are predicted. Unfortunately, however, the THERMOD program has not been fully validated. High confidence results from this and other analysis tools (e.g., NASTRAN) are necessary to assure that composite airframe designs are both safe and not over- or under-designed.
1.3 GOALS. The specific investigation goals were to:
a. Conduct wind tunnel tests on representative composite airframe components subjected to potentially favorable convective cooling, as is typically experienced during aircraft operations.
b. Present, for computer code validation purposes, initial conditions and temperature and wind-speed time-histories for each component.
“Impact of Aircraft Operation on Composite Airframe Temperatures” L.S. Miller, Wichita State University, October 2001 1
c. Compare experimental and computer code results. d. Identify any other factors that notably influence thermal cooling effects and develop
recommendations for follow-on efforts.
2. METHOD
2.1 BASIC APPROACH. Five wind tunnel models, built using various representative composite materials and construction methods, were heated until thermal equilibrium was established. The models were placed in a low-speed wind tunnel and the flow was initiated. Temperatures, at various locations, and wind tunnel flow conditions were then measured for a suitable time period as the models cooled. 2.2 TEST COMPONENTS. Prior to conducting the experiments, it was necessary to define a test component composition and geometry. A number of requirements and constraints were considered, including the following. a) Five different components of representative composite materials, construction, and sizes
were desired. b) Each component had to be reasonably easy to build and install in the wind tunnel. c) The geometry must be relatively easy to define, for code validation purposes, and be
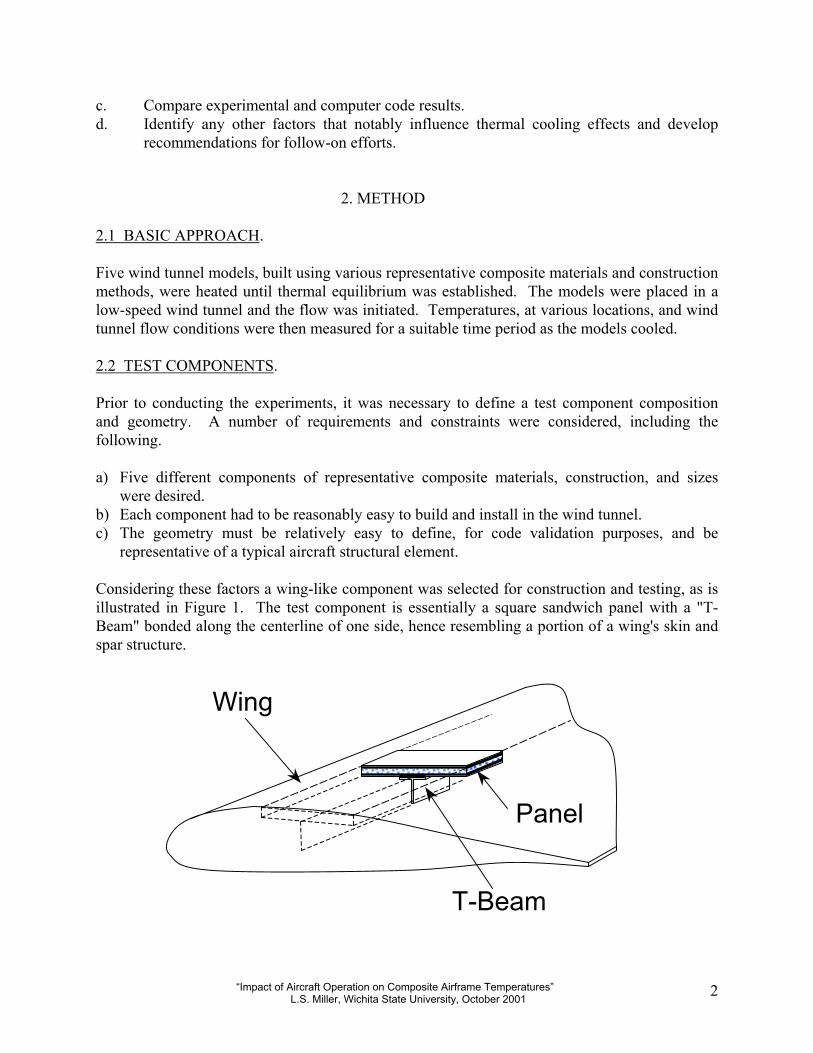
representative of a typical aircraft structural element. Considering these factors a wing-like component was selected for construction and testing, as is illustrated in Figure 1. The test component is essentially a square sandwich panel with a "T-Beam" bonded along the centerline of one side, hence resembling a portion of a wing's skin and spar structure.
Wing
T-Beam
Panel
“Impact of Aircraft Operation on Composite Airframe Temperatures” L.S. Miller, Wichita State University, October 2001 2

FIGURE 1. DIAGRAM ILLUSTRATING SELECTION OF TEST COMPONENT GEOMETRY
The panels and T-Beams were constructed, in the Wichita State University (WSU) composites laboratory, using materials and methods common to the aircraft industry. Tables 1 and 2 summarize the composition of each test component and Figure 2 shows photographs of two components. Henceforth, for brevity and simplicity, the entire “component” (i.e., sandwich panel and T-beam) will be referred to as a “panel”. Important dimensions are given in Tables 3 and 4, with Figures 3 through 4 identifying associated nomenclature.
TABLE 1. SANDWICH PANEL COMPOSITIONS
Panel
Plys
Fabric/Matrix
Core
Carbon 1
4 3K70P/E765 3/8" Honeycomb
Carbon 2
2 3K70P/E765 3/8" Honeycomb
Glass/Foam
2 7781/NB321 3/8" Divinycell
Thin Carbon
6 3K70P/E765 none
Glass/Nomex
2 7781/NB321 3/8" Honeycomb
TABLE 2. T-BEAM COMPOSITIONS
T-Beam
Plys
Fabric/Matrix
Carbon 1
14 3K70P/E765
Carbon 2
14 3K70P/E765
Glass/Foam
12 7781/NB321
Thin Carbon
14 3K70P/E765
Glass/Nomex
12 7781/NB321
“Impact of Aircraft Operation on Composite Airframe Temperatures” L.S. Miller, Wichita State University, October 2001 3

FIGURE 2. LOWER SURFACE PHOTOGRAPHS OF TWO TEST PANELS (NOTE BOND-LINE THERMOCOUPLE CONNECTORS AND WIRES)
TABLE 3. PANEL AND T-BEAM DIMENSIONS
Panel
L
W
HBeam
WBeam
tBeam
Carbon 1
17.9688"
18.0313"
2.0900"
2.5400"
0.1240" (± 0.0313") (± 0.0313") (± 0.0395") (± 0.0395") (± 0.0200")
Carbon 2 17.9688" 18.0000" 2.0200" 2.4650" 0.1256" (± 0.0313") (± 0.0313") (± 0.0395") (± 0.0395") (± 0.0200")
Glass/Foam 17.9688" 18.0000" 2.0600" 2.5250" 0.1107" (± 0.0069") (± 0.0313") (± 0.0395") (± 0.0395") (± 0.0200")
Thin Carbon 18.0000" 18.0313" 2.1300") 2.5450" 0.1208" (± 0.0313") (± 0.0313") (± 0.0395") (± 0.0395") (± 0.0200")
Glass/Nomex 17.8750" 18.0000" 2.0850" 2.5100" 0.1125") (± 0.0313") (± 0.0313") (± 0.0395") (± 0.0395") (± 0.0200")
“Impact of Aircraft Operation on Composite Airframe Temperatures” L.S. Miller, Wichita State University, October 2001 4

TABLE 4. PANEL AND T-BEAM THICKNESS
Panel
tPanel
tMid
tTop
tInside
tBeam
Carbon 1
0.4275"
0.5371"
0.0398"
0.0465"
0.1240" (± 0.0034") (± 0.0104") (±0.0093") (±0.0086") (±0.0068")
Carbon 2 0.4006" 0.5111" 0.0288" 0.0378" 0.1256" (± 0.0035") (± 0.0013") (±0.0057") (±0.0117") (±0.0090")
Glass/Foam 0.3829" 0.4745" 0.0184" 0.0192" 0.1107" (± 0.0069") (± 0.0039") (± 0.0018") (± 0.0024") (±0.0066")
Thin Carbon 0.0502" 0.1616" - - 0.1208" (± 0.0009") (± 0.0017") - - (±0.0045")
Glass/Nomex 0.3993" 0.5040" 0.0380" 0.0298" 0.1125" (± 0.0014") (± 0.0021") (± 0.0038") (± 0.0033") (±0.0028")
WBeam
HBeam
LW
Flow
“Impact of Aircraft Operation on Composite Airframe Temperatures” L.S. Miller, Wichita State University, October 2001 5

FIGURE 3. DIAGRAM SHOWING TEST PANEL DIMENSIONAL INFORMATION
tPanel
tBeam
tMid
tInside
tTop
Flow
FIGURE 4. DIAGRAM SHOWING TEST PANEL DIMENSIONAL INFORMATION
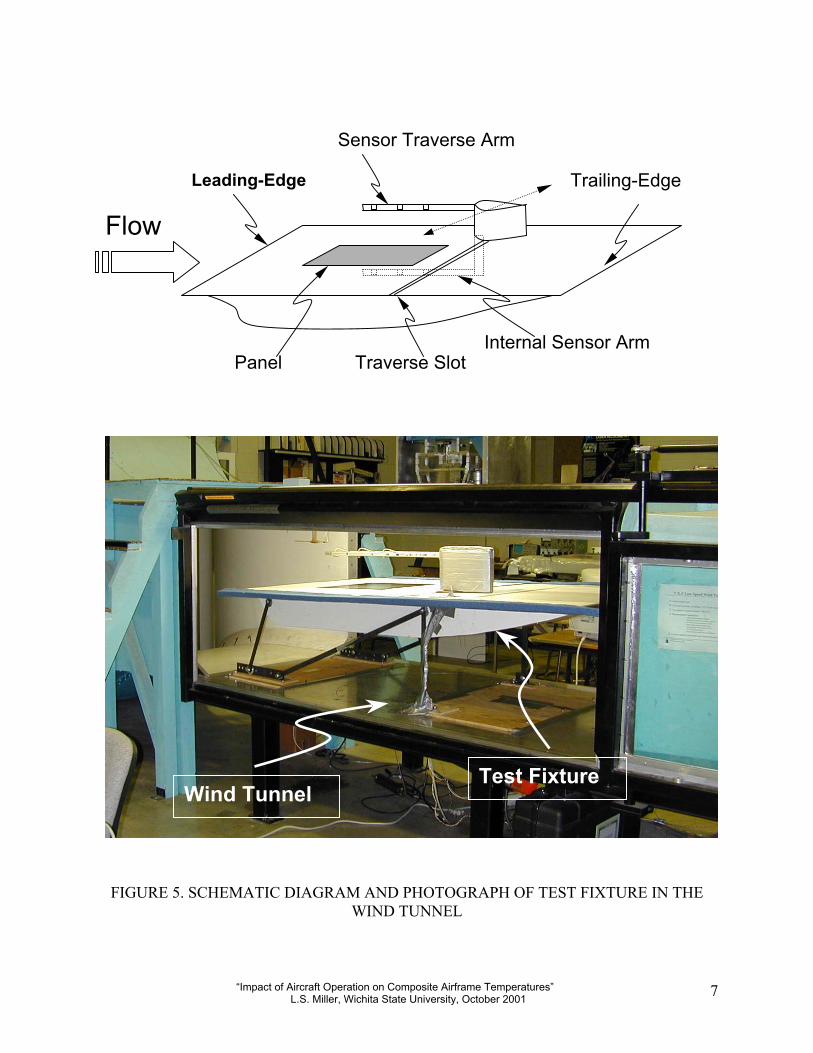
2.3 APPARATUS, SENSORS AND PROCEDURE. A simple oven was used to heat each panel to about 80°C prior to testing. Once thermal equilibrium was obtained, the component was placed in an insulated box for transport to the wind tunnel. The panel was then quickly installed into a specialized fixture located in the wind tunnel test section and then the test began. An open return low-speed wind tunnel, with a 1.0X1.3-meter test section, was utilized for all testing. After panel installation, data acquisition began and airflow speed was quickly ramped up to a value of about 35 m/s. Because it is an open return tunnel, air temperature was not controllable and varied with outside (i.e., atmospheric) weather conditions. The wind tunnel fixture, or cradle, served three prime functions. First, it provided an aerodynamic shape to hold the panel for testing. Second, it thermally isolated the test panel from the surroundings on all sides except one, which was intentionally exposed to the wind tunnel flow. Third, the cradle supported and enclosed measurement instrumentation and sensors. A schematic diagram and photograph of the fixture is shown in Figure 5.
“Impact of Aircraft Operation on Composite Airframe Temperatures” L.S. Miller, Wichita State University, October 2001 6
Sensor Traverse Arm
Internal Sensor Arm
Trailing-Edge Leading-Edge
Panel Traverse Slot
Flow
Test Fixture Wind Tunnel
FIGURE 5. SCHEMATIC DIAGRAM AND PHOTOGRAPH OF TEST FIXTURE IN THE WIND TUNNEL
“Impact of Aircraft Operation on Composite Airframe Temperatures” L.S. Miller, Wichita State University, October 2001 7

As is shown in Figure 6, each panel fits flush within the sharp leading-edge flat plate upper surface of the fixture, thus creating a simple aerodynamic surface for testing. The cradle interior was thermally insulated and made as airtight as possible. A thin layer of felt (~3.175 mm thick) served as an insulator and gasket to minimize heat conduction or air leakage around the panel edges. A strip of cellophane tape further sealed the gap and the panel into the cradle.
A traversing mechanism, mounted within the fixture, continuously oscillated six Infrared (IR) temperature sensors back-and-forth in the spanwise direction (see Figures 5-9). Measurements from these sensors, along with sensor position, defined three interior and three exterior temperature profiles. In addition to the IR-sensors, a thermocouple provided temperature data at the bond-line (between the panel and the T-Beam) inside each panel. Figure 7 identifies the location of each temperature profile. IR-sensors offer a flexible means to measure temperatures without direct contact. This ability was particularly attractive since it greatly simplified component construction and measurement capabilities. Each sensor (Cole-Parmer, P-39669-04), with an adjustable emissivity capability, utilizes a 10:1 distance-to-target-size ratio lens. As a result, given the sensor distance was about 15.24 cm away from the surface, the measured temperature represented the spatial average over about a 1.524 cm area. The variable emissivity feature proved valuable since it offered a means to both assure measurement accuracy and to identify each panel’s emissivity value (needed input data for the THERMOD computer code).
L.S. Miller, Wichita State UniversityX2 & 5
, October 2001 8
Fixture
Wind Tunnel
FIGURE 6. FRONT-CORNER VIEW OF FIXTURE IN THE WIND TUNNEL
X3 & 6
“Impact of Aircraft Operation on Composite Airframe Temperatures”
X1 & 4

FIGURE 7. DIAGRAM SHOWING IR-SENSOR TRAVERSE STATIONS
“Impact of Aircraft Operation on Composite Airframe Temperatures” L.S. Miller, Wichita State University, October 2001 9
Traverse Panel
Fixture Leading-Edge
FIGURE 8. TOP-FRONT VIEW OF FIXTURE AND INSTALLED TEST PANEL
Panel

FIGURE 9. FIXTURE INTERIOR AND TRAVERSE ARMS
Prior to wind tunnel testing simple “calibration” surveys were performed, with each panel in thermal equilibrium. In each case, the signal conditioning electronics emissivity “jumper” was adjusted until the IR-sensor temperature readings matched the panel temperature as measured by a thermocouple. This activity served the functions of properly adjusting the IR-sensors and, simultaneously, identifying panel emissivity values. Figure 10 shows sample temperature surveys for one panel and all six sensors. Small variations are observed, despite the fact that the panel temperature is assumed constant everywhere. However, these differences appear reasonable and are likely explained given IR-sensor accuracy limitations (published as ± 2°C), natural deviations in the panel emissivities, and potentially real surface temperature variations. Table 5 summarizes the calibration survey results and gives a measure of the temperature measurement differences and uncertainties. Table 6 identifies the emissivity values and traverse locations for each test panel. Simple thermocouple sensors were utilized to measure the temperature within each panel and in the approaching airstream. As previously mentioned, a single thermocouple was installed during construction within each component on the bond-line between the panel bottom and the T-beam. Data from the traverse position encoder, IR-sensors, the bond-line thermocouple, an airflow thermocouple, and the wind tunnel airspeed system were continuously measured and recorded by a digital data acquisition system (DataQ DI-720 16-Bit, 8-Channel Analog-to-Digital converter and a PC running WinDaq software). Data was archived to a hard disk and CD-ROM.
“Impact of Aircraft Operation on Composite Airframe Temperatures” L.S. Miller, Wichita State University, October 2001 10

-20 -10 0 10 20Spanwise Position - cm
-20
0
20
40
60
80Te
mpe
ratu
re -
degr
ees
CCarbon 2
Panel Temperature UncertaintiesNo Heat or Flow
Miller/WSU, 2001
Internal - FrontInternal - MiddleInternal - AftExternal - FrontExternal - MiddleExternal - AftT-Beam Bond-Line
FIGURE 10. EXAMPLE OF PANEL IR-SENSOR TEMPERATURE SURVEY
“Impact of Aircraft Operation on Composite Airframe Temperatures” L.S. Miller, Wichita State University, October 2001 11

TABLE 5. PANEL AND T-BEAM TEMPERATURE DEVIATIONS
Panel
Tair
TBond
Ti1
(Inside-Frt)
Ti 2
(Beam)
Ti 3
(Inside-Aft)
Ti 4
(Top-Frt)
Ti 5
(Top-Mid)
Ti 6
(Top-Aft)
Carbon 1
20.14°C
19.24°C
19.02°C
17.33°C
18.74°C
16.66°C
19.56°C
19.85°C (± 0.89) (± 0.82) (± 0.39) (± 0.61) (± 0.17) (± 0.61) (± 0.35) (± 0.22)
Carbon 2 21.87°C 20.19°C 19.55°C 18.93°C 19.44°C 17.66°C 20.52°C 20.68°C (± 1.16) (± 0.97) (± 0.35) (± 0.35) (± 0.36) (± 0.50) (± 0.34) (± 0.34)
Glass/Foam 23.40°C 21.39°C 21.34°C 20.80°C 21.22°C 19.07°C 21.69°C 21.88°C (± 0.91) (± 0.85) (± 0.19) (± 0.36) (± 0.17) (± 0.40) (± 0.14) (± 0.15)
Thin Carbon 21.12°C 20.38°C 19.87°C 17.99°C 19.38°C 17.75°C 20.45°C 20.61°C (± 1.11) (± 1.00) (± 0.24) (± 0.67) (± 0.15) (± 0.45) (± 0.22) (± 0.16)
Glass/Nomex 24.82°C 22.58°C 22.13°C 21.48°C 21.88°C 20.60°C 23.06°C 23.04°C (± 0.98) (± 0.85) (± 0.26) (± 0.25) (± 0.16) (± 0.46) (± 0.18) (± 0.17)
TABLE 6. PANEL AND T-BEAM APPROXIMATE EMISSIVITY VALUES AND TRAVERSE STATION LOCATIONS
Panel
ΕTop
ΕInside
ΕBeam
x1 & 4
x2 & 5
x3 & 6
z2
Carbon 1
0.90
0.90
0.90
2.4844"
8.9844"
15.4844"
1.1520"
(± 0.0313") (± 0.0313") (± 0.0313") (± 0.0395")
Carbon 2 0.89 0.89 0.89 2.5000" 9.0000" 15.5000" 1.0820" (± 0.0313") (± 0.0313") (± 0.0313") (± 0.0395")
Glass/Foam 0.95 0.95 0.95 2.4844" 8.9844" 15.4844" 1.1520" (± 0.0313") (± 0.0313") (± 0.0313") (± 0.0395")
Thin Carbon 0.96 0.96 0.96 2.5000" 9.0000" 15.5000" 1.0820" (± 0.0313") (± 0.0313") (± 0.0313") (± 0.0395")
Glass/Nomex 0.95 0.95 0.95 2.51565" 9.01565" 15.51565" 1.1470" (± 0.0313") (± 0.0313") (± 0.0313") (± 0.0395")
3. RESULTS
“Impact of Aircraft Operation on Composite Airframe Temperatures” L.S. Miller, Wichita State University, October 2001 12
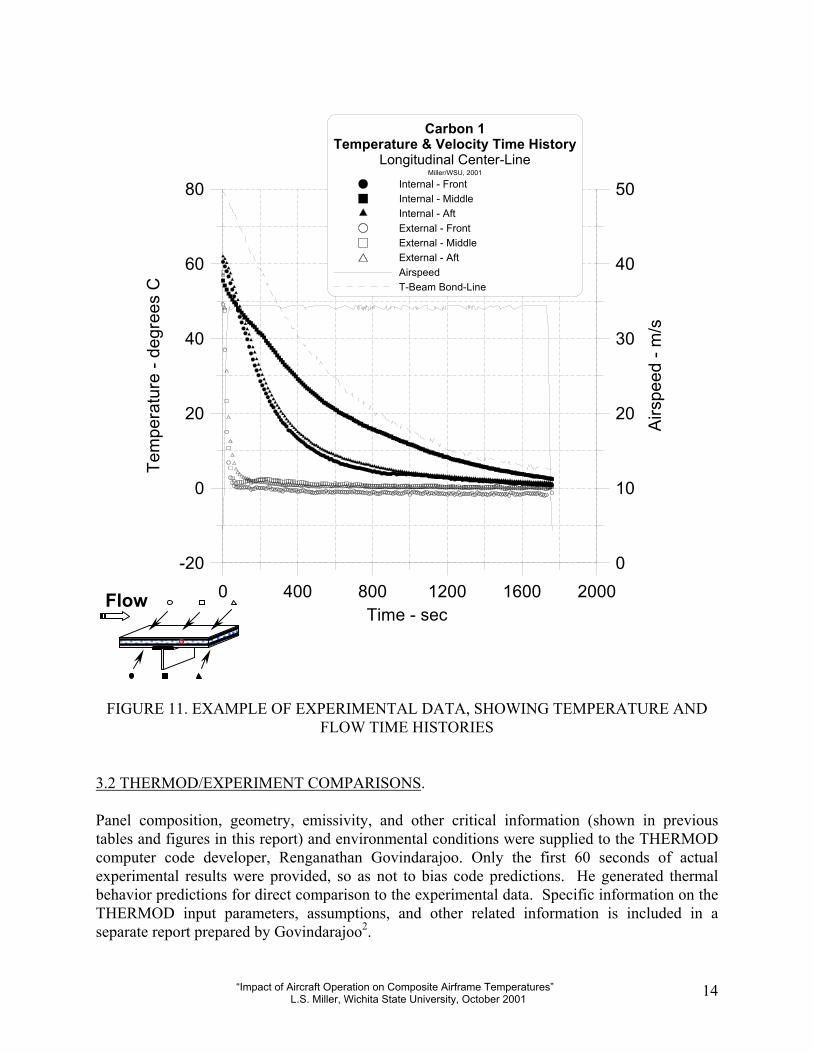
3.1 WIND TUNNEL TESTS. Experimental efforts fell into essentially three categories: calibration tests, “wind-off,” and “wind-on” runs. Each panel was run multiple times in each category and thousands of measurements were obtained as a function of time and location. The calibration tests included flow visualization, boundary layer characterization, and IR-sensor and panel calibration runs. Tufts (small yarn strings) were mounted on the test fixture to verify that no separated flow was present. In addition, an acoustic boundary layer probe was used to survey the fixture and panel to identify the boundary layer condition. These tests determined that the flow was turbulent over the panel, with transition typically occurring a short distance up-stream. The IR-sensor calibration and panel emissivity identification results were discussed and presented in a previous section. Wind-off tunnel runs were performed to identify natural heat convection effects and to ascertain if heat conduction from the panels into the test fixture was occurring. Wind-on runs obviously focused on determining forced convection effects. Minimal temperature differences between the panel centerline and outboard portions were observed during tests, suggesting that there was minimal heat conduction occurring between the panel and test fixture. In light of these results, data presented in the following sections are for centerline locations only. Figure 11 illustrates some wind-on results for the Carbon 1 panel. Wind tunnel speed and IR-sensor temperature time histories, for three exterior and three interior locations and the T-Beam bond-line, are shown. Results for the other panels parallel this data in basic trends and will be shown later in direct comparisons with THERMOD computer code predictions. Some basic experimental observations deserve note. The panel exterior cools more quickly than the interior, as one might expect given the airflow effects and the insulated fixture used to hold the panel. Also shown in Figure 11, the T-Beam represents a considerable thermal mass and it takes the longest to cool. In addition, as is classically associated with boundary layer flow development and convective heat transfer, the front panel stations consistently cool slightly more than the downstream portions. It is important to note, final exterior temperatures converge to below zero degrees for the specific case shown in Figure 11. These temperatures are within the expected sensor accuracy and properly reflect the weather conditions on the day the Carbon 1 panel was tested. However, they are at the published minimum acceptable sensor operating conditions. Simple testing showed that the sensors become slightly “under-damped” when exposed to sudden temperature changes at such low ambient conditions, as was the case when the tunnel started under these circumstances. The IR-sensors did behave properly as the run progressed. Fortunately, this is the only panel that was subjected to such atmospheric temperature extremes (the weather got better).
“Impact of Aircraft Operation on Composite Airframe Temperatures” L.S. Miller, Wichita State University, October 2001 13
0 400 800 1200 1600 2000Time - sec
-20
0
20
40
60
80
Tem
pera
ture
- de
gree
s C
0
10
20
30
40
50
Airs
peed
- m
/s
Carbon 1Temperature & Velocity Time History
Longitudinal Center-LineMiller/WSU, 2001
Internal - FrontInternal - MiddleInternal - AftExternal - FrontExternal - MiddleExternal - AftAirspeedT-Beam Bond-Line
Flow
FIGURE 11. EXAMPLE OF EXPERIMENTAL DATA, SHOWING TEMPERATURE AND
FLOW TIME HISTORIES 3.2 THERMOD/EXPERIMENT COMPARISONS. Panel composition, geometry, emissivity, and other critical information (shown in previous tables and figures in this report) and environmental conditions were supplied to the THERMOD computer code developer, Renganathan Govindarajoo. Only the first 60 seconds of actual experimental results were provided, so as not to bias code predictions. He generated thermal behavior predictions for direct comparison to the experimental data. Specific information on the THERMOD input parameters, assumptions, and other related information is included in a separate report prepared by Govindarajoo2.
“Impact of Aircraft Operation on Composite Airframe Temperatures” L.S. Miller, Wichita State University, October 2001 14
Figures 12-16 illustrate some comparisons between THERMOD predictions and experimental measurements for all five test components during wind-off and wind-on conditions. These specific results are at a location near the panel center on the exterior and at the T-Beam bond-line location. Some basic and universal differences surface in these plots. Specifically, THERMOD predictions show a slower initial rate of change and higher final temperatures. The variance is most pronounced at the end of wind-off runs with THERMOD predictions showing, respectively, external and T-Beam bond-line temperatures approximately 10-20°C and 15-25°C higher. Wind-on external and T-Beam bond-line differences are smaller, being respectively 5-10°C and 5-20°C hotter.
“Impact of Aircraft Operation on Composite Airframe Temperatures” L.S. Miller, Wichita State University, October 2001 15

0 400 800 1200 1600 2000Time - sec
-20
0
20
40
60
80
Tem
pera
ture
- de
gree
s C
Carbon 1No Flow Temperature Time History
THERMOD/Experiment Comparison - Panel CenterMiller/WSU, 2001
Experiment External THERMOD ExternalExperiment T-Beam Bond-LineTHERMOD T-Beam Bond-Line
0 400 800 1200 1600 2000Time - sec
-20
0
20
40
60
80
Tem
pera
ture
- de
gree
s C
0
10
20
30
40
50Ai
rspe
ed -
m/s
Carbon 1Temperature & Velocity Time History
THERMOD/Experiment Comparison - Panel CenterMiller/WSU, 2001
Experiment ExternalTHERMOD ExternalExperiment T-Beam Bond-LineTHERMOD T-Beam Bond-LineAirspeed
FIGURE 12. CARBON 1 EXPERIMENT AND THERMOD TIME HISTORY
COMPARISONS (PANEL CENTER)
“Impact of Aircraft Operation on Composite Airframe Temperatures” L.S. Miller, Wichita State University, October 2001 16

0 400 800 1200 1600 2000Time - sec
-20
0
20
40
60
80
Tem
pera
ture
- de
gree
s C
Carbon 2No Flow Temperature Time HistoryTHERMOD/Experiment - Panel Center
Miller/WSU, 2001
Experiment External THERMOD ExternalExperiment T-Beam Bond-LineTHERMOD T-Beam Bond-Line
0 400 800 1200 1600 2000Time - sec
-20
0
20
40
60
80
Tem
pera
ture
- de
gree
s C
0
10
20
30
40
50
Airs
peed
- m
/s
Carbon 2Temperature & Velocity Time History
THERMOD/Experiment Comparison - Panel CenterMiller/WSU, 2001
Experiment ExternalTHERMOD ExternalExperiment T-Beam Bond-LineTHERMOD T-Beam Bond-LineAirspeed
FIGURE 13. CARBON 2 EXPERIMENT AND THERMOD TIME HISTORY
COMPARISONS (PANEL CENTER)
“Impact of Aircraft Operation on Composite Airframe Temperatures” L.S. Miller, Wichita State University, October 2001 17

0 400 800 1200 1600 2000Time - sec
-20
0
20
40
60
80
Tem
pera
ture
- de
gree
s C
Glass/FoamNo Flow Temperature Time HistoryTHERMOD/Experiment - Panel Center
Miller/WSU, 2001
Experiment External THERMOD ExternalExperiement T-Beam Bond-LineTHERMOD T-Beam Bond-Line
0 400 800 1200 1600 2000Time - sec
-20
0
20
40
60
80
Tem
pera
ture
- de
gree
s C
0
10
20
30
40
50Ai
rspe
ed -
m/s
Glass/FoamTemperature & Velocity Time History
THERMOD/Experiment Comparison - Panel CenterMiller/WSU, 2001
Experiment External THERMOD ExternalExperiment T-Beam Bond-LineTHERMOD T-Beam Bond-LineAirspeed
FIGURE 14. GLASS/FOAM EXPERIMENT AND THERMOD TIME HISTORY
COMPARISONS (PANEL CENTER)
“Impact of Aircraft Operation on Composite Airframe Temperatures” L.S. Miller, Wichita State University, October 2001 18

0 400 800 1200 1600 2000Time - sec
-20
0
20
40
60
80
Tem
pera
ture
- de
gree
s C
Thin CarbonNo Flow Temperature Time HistoryTHERMOD/Experiment - Panel Center
Miller/WSU, 2001
Experiment ExternalTHERMOD ExternalExperiment T-Beam Bond-LineTHERMOD T-Beam Bond-Line
0 400 800 1200 1600 2000Time - sec
-20
0
20
40
60
80
Tem
pera
ture
- de
gree
s C
0
10
20
30
40
50
Airs
peed
- m
/s
Thin CarbonTemperature & Velocity Time History
THERMOD/Experiment Comparison - Panel CenterMiller/WSU, 2001
Experiment ExternalTHERMOD ExternalExperiment T-Beam Bond-LineTHERMOD T-Beam Bond-LineAirspeed
FIGURE 15. THIN CARBON EXPERIMENT AND THERMOD TIME HISTORY COMPARISONS (PANEL CENTER)
“Impact of Aircraft Operation on Composite Airframe Temperatures” L.S. Miller, Wichita State University, October 2001 19

0 400 800 1200 1600 2000Time - sec
-20
0
20
40
60
80
Tem
pera
ture
- de
gree
s C
Glass/NomexNo Flow Temperature Time HistoryTHERMOD/Experiment - Panel Center
Miller/WSU, 2001
Experiment ExternalTHERMOD ExternalExperiment T-Beam Bond-LineTHERMOD T-Beam Bond-Line
0 400 800 1200 1600 2000Time - sec
-20
0
20
40
60
80
Tem
pera
ture
- de
gree
s C
0
10
20
30
40
50Ai
rspe
ed -
m/s
Glass/NomexTemperature & Velocity Time History
THERMOD/Experiment Comparison - Panel CenterMiller/WSU, 2001
Experiment ExternalTHERMOD ExternalExperiment T-Beam Bond-LineTHERMOD T-Beam Bond-LineAirspeed
FIGURE 16. GLASS/NOMEX EXPERIMENT AND THERMOD TIME HISTORY
COMPARISONS (PANEL CENTER)
“Impact of Aircraft Operation on Composite Airframe Temperatures” L.S. Miller, Wichita State University, October 2001 20

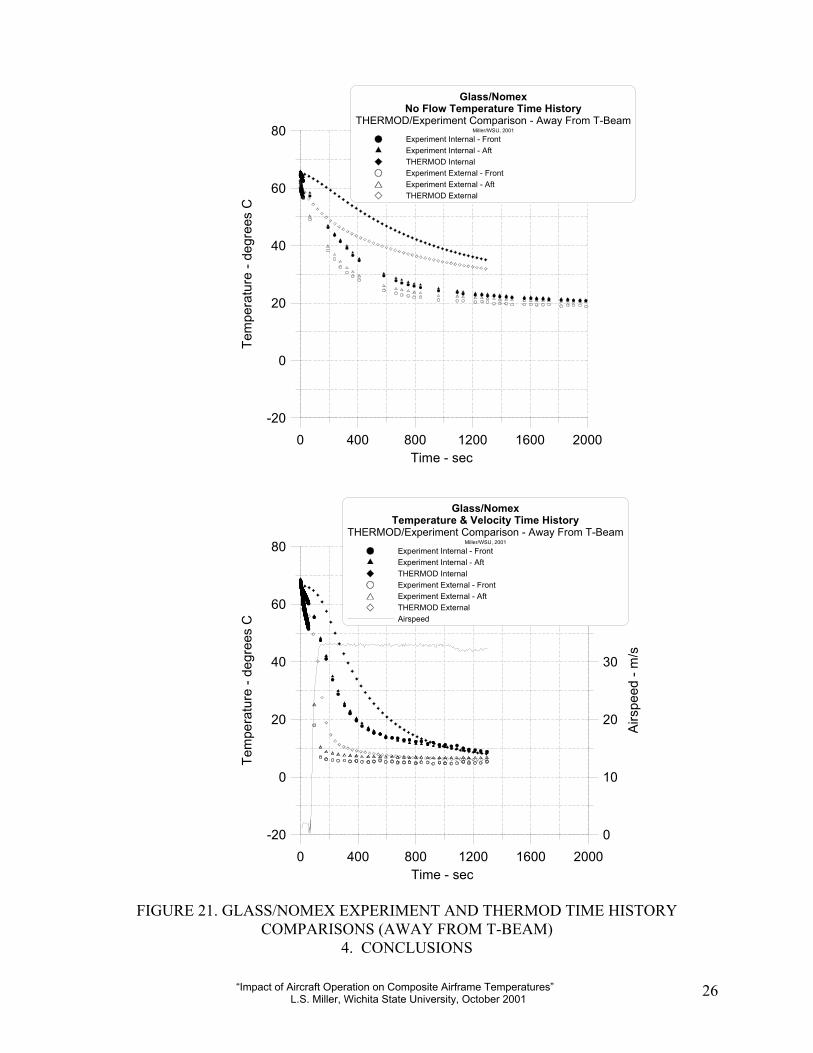
Figures 17-21 illustrate comparisons between THERMOD predictions and experimental measurements for all five test components, during wind-off and wind-on conditions, at locations away from the panel center. Experimental results are for front and aft locations (as shown in Figure 7), whereas the THERMOD modeling and predictions do not differentiate between up-stream and downstream locations. Results are similar in many respects to those previously presented and discussed, with the notable exception that final temperature differences, between predictions and experiment, are now reduced and within about 10°C. This important observation underscores that the T-Beam’s presence significantly affects the results, in both the experiment and THERMOD modeling. Significant internal, including longitudinal, heat conduction is be expected and should be predicted.
“Impact of Aircraft Operation on Composite Airframe Temperatures” L.S. Miller, Wichita State University, October 2001 21

0 400 800 1200 1600 2000Time - sec
-20
0
20
40
60
80
Tem
pera
ture
- de
gree
s C
Carbon 1No Flow Temperature Time History
THERMOD/Experiment Comparison - Away From T-BeamMiller/WSU, 2001
Experiment Internal - FrontExperiment Internal - AftTHERMOD InternalExperiment External - FrontExperiment External - AftTHERMOD External
0 400 800 1200 1600 2000Time - sec
-20
0
20
40
60
80
Tem
pera
ture
- de
gree
s C
0
10
20
30
40
50
Airs
peed
- m
/s
Carbon 1Temperature & Velocity Time History
THERMOD/Experiment Comparison - Away From T-BeamMiller/WSU, 2001
Experiment Internal - FrontExperiment Internal - AftTHERMOD InternalExperiment External - FrontExperiment External - AftTHERMOD ExternalAirspeed
FIGURE 17. CARBON 1 EXPERIMENT AND THERMOD TIME HISTORY
COMPARISONS (AWAY FROM T-BEAM)
“Impact of Aircraft Operation on Composite Airframe Temperatures” L.S. Miller, Wichita State University, October 2001 22

0 400 800 1200 1600 2000Time - sec
-20
0
20
40
60
80
Tem
pera
ture
- de
gree
s C
Carbon 2No Flow Temperature Time History
THERMOD/Experiment Comparison - Away From T-BeamMiller/WSU, 2001
Experiment Internal - FrontExperiment Internal - AftTHERMOD InternalExperiment External - FrontExperiment External - AftTHERMOD External
0 400 800 1200 1600 2000Time - sec
-20
0
20
40
60
80
Tem
pera
ture
- de
gree
s C
0
10
20
30
40
50
Airs
peed
- m
/s
Carbon 2Temperature & Velocity Time History
THERMOD/Experiment Comparison - Away From T-BeamMiller/WSU, 2001
Experiment Internal - FrontExperiment Internal - AftTHERMOD InternalExperiment External - FrontExperiment External - AftTHERMOD ExternalAirspeed
FIGURE 18. CARBON 2 EXPERIMENT AND THERMOD TIME HISTORY
COMPARISONS (AWAY FROM T-BEAM)
“Impact of Aircraft Operation on Composite Airframe Temperatures” L.S. Miller, Wichita State University, October 2001 23

0 400 800 1200 1600 2000Time - sec
-20
0
20
40
60
80
Tem
pera
ture
- de
gree
s C
Glass/FoamNo Flow Temperature Time History
THERMOD/Experiment Comparison - Away From T-BeamMiller/WSU, 2001
Experiment Internal - FrontExperiment Internal - AftTHERMOD InternalExperiment External - FrontExperiment External - AftTHERMOD External
0 400 800 1200 1600 2000Time - sec
-20
0
20
40
60
80
Tem
pera
ture
- de
gree
s C
0
10
20
30
40
50
Airs
peed
- m
/s
Glass/FoamTemperature & Velocity Time History
THERMOD/Experiment Comparison - Away From T-BeamMiller/WSU, 2001
Experiment Internal - FrontExperiment Internal - AftTHERMOD InternalExperiment External - FrontExperiment External - AftTHERMOD ExternalAirspeed
FIGURE 19. GLASS/FOAM EXPERIMENT AND THERMOD TIME HISTORY
COMPARISONS (AWAY FROM T-BEAM)
“Impact of Aircraft Operation on Composite Airframe Temperatures” L.S. Miller, Wichita State University, October 2001 24

0 400 800 1200 1600 2000Time - sec
-20
0
20
40
60
80
Tem
pera
ture
- de
gree
s C
Thin CarbonNo Flow Temperature Time History
THERMOD/Experiment Comparison - Away From the T-BeamMiller/WSU, 2001
Experiment Internal - FrontExperiment Internal - AftTHERMOD InternalExperiment External - FrontExperiment External - AftTHERMOD External
0 400 800 1200 1600 2000Time - sec
-20
0
20
40
60
80
Tem
pera
ture
- de
gree
s C
0
10
20
30
40
50
Airs
peed
- m
/s
Thin CarbonTemperature & Velocity Time History
THERMOD/Experiment Comparison - Away From T-BeamMiller/WSU, 2001
Experiment Internal - FrontExperiment Internal - AftTHERMOD InternalExperiment External - FrontExperiment External - AftTHERMOD ExternalAirspeed
FIGURE 20. THIN CARBON EXPERIMENT AND THERMOD TIME HISTORY COMPARISONS (AWAY FROM T-BEAM)
“Impact of Aircraft Operation on Composite Airframe Temperatures” L.S. Miller, Wichita State University, October 2001 25
0 400 800 1200 1600 2000Time - sec
-20
0
20
40
60
80
Tem
pera
ture
- de
gree
s C
Glass/NomexNo Flow Temperature Time History
THERMOD/Experiment Comparison - Away From T-BeamMiller/WSU, 2001
Experiment Internal - FrontExperiment Internal - AftTHERMOD InternalExperiment External - FrontExperiment External - AftTHERMOD External
0 400 800 1200 1600 2000Time - sec
-20
0
20
40
60
80
Tem
pera
ture
- de
gree
s C
0
10
20
30
40
50
Airs
peed
- m
/s
Glass/NomexTemperature & Velocity Time History
THERMOD/Experiment Comparison - Away From T-BeamMiller/WSU, 2001
Experiment Internal - FrontExperiment Internal - AftTHERMOD InternalExperiment External - FrontExperiment External - AftTHERMOD ExternalAirspeed
FIGURE 21. GLASS/NOMEX EXPERIMENT AND THERMOD TIME HISTORY
COMPARISONS (AWAY FROM T-BEAM) 4. CONCLUSIONS
“Impact of Aircraft Operation on Composite Airframe Temperatures” L.S. Miller, Wichita State University, October 2001 26
Based on the experiment results, the following conclusions are offered. 1. Aircraft exterior skins can be expected to cool relatively quickly as they begin operations and
convective cooling takes place. Some internal components, like a large heavy spar or well-insulated structure, can experience a notable delay in cooling.
2. Boundary layer condition and development, which is not modeled in the THERMOD computer code, is observed to have a slight effect on the cooling rate in the downstream direction.
3. The THERMOD computer code predictions tend, for the cases examined, to capture fundamental trends very well. However, the results appear to show slower cooling rates and higher final temperatures. Most significantly, the predictions are conservative (favoring safety).
4. The discrepancy between experiment and THERMOD code results appears to depend on the corresponding structural complexity, specifically that associated with the T-Beam’s presence. Differences as low as 10°C and as high as 25°C were observed for, respectively, simple (i.e., skins and core) and more complex (i.e., skins, core, and T-Beam) portions of the test panels. These observations suggest that internal conduction may play a critical role in distributing heat in the longitudinal directions.
5. The current investigation was intentionally limited to and focused on convective cooling effects. Additional tests examining the impact of other factors that influence both airframe heating and cooling are warranted.
5. ACKNOWLEDGEMENTS A number of people participated in this project and deserve special recognition and thanks. Over the years Donald Oplinger, Peter Shyprykevich, and Larry Ilcewicz from the Federal Aviation Administration (FAA) provided significant project support, guidance, feedback, and help. In addition, special gratitude goes to NASA/AGATE and specifically Steve Hooper and John Tomblin who supplied support, insight, and advice that was critical, timely, and most appreciated. I must also note the hard work and efforts of various Wichita State University (WSU) students that participated in the project. Mike Murdin (now with Boeing), James Waltner, Tejas Mazmudar (007), Monal Merchant, and Yeow Ng excelled and played a critical role. Without everyone’s contributions the project would have never happened or been completed. Thank you all very much.
6. REFERENCES
“Impact of Aircraft Operation on Composite Airframe Temperatures” L.S. Miller, Wichita State University, October 2001 27

“Impact of Aircraft Operation on Composite Airframe Temperatures” L.S. Miller, Wichita State University, October 2001 28
1. Govindarajoo, Renganathan, "THERMOD: A Thermal Model for Predicting Aircraft MOL
Temperatures," Report No. REK0002A.DOC, Cirrus Design Corporation, Duluth, MN, October, 1996.
2. Govindarajoo, Renganathan, "A Thermal Model (THERMOD) for Simulating Maximum
Operating Limit Temperatures of Aircraft (Revision)," publication pending.