redgram transplanting technologysri.ciifad.cornell.edu/aboutsri/othercrops/othersci/...vermicompost...
TRANSCRIPT

UNIVERSITY OF AGRICULTURAL SCIENCES, RAICHUR
ICAR – KRISHI VIGYAN KENDRA, BIDAR
RED GRAM TRANSPLANTING TECHNOLOGY Situation:
Pigeon pea is commonly known in India as red gram or Arhar or Tur. It is a tropical crop
predominantly grown in India, during the kharif season both as a sole crop or as an intercrop,
cultivated in wide range of agro-ecological situations. The plants owes a large measure of its
popularity to the fact that it restores nitrogen to the soil and adds a lot of organic matter to the soil.
Thus, pigeon pea finds a promising place in crop rotations and crop mixtures. Being a leguminous
plant, it is capable of fixing atmospheric nitrogen, and its deep rooting system helps in extracting
nutrients and moisture from deeper soil layers, thus making it suitable for rainfed conditions. The
deep root system of the crop also helps in breaking plough pans, thereby improving soil structure.
Hence, it is sometimes called a ‘biological plough’.
Nearly 5.14 lakh ha is under red gram in Karnataka state, with a production of 2.42 lakh
tons giving an average yield of 766 kg / ha. Bidar district is considered as the pulse bowl of
Karnataka, where pulses like black gram, green gram, red gram and Bengal gram are major crops
grown on 2.14 lakh ha. Among these pulses, the red gram share is 68,625 ha. Red gram is one of
the most important commercial crops for dryland farmers. The average yield levels of the crop for
the world, nation, state and district are given below :
Table 1. Average productivity levels (kg/ha)
World National State District Potential Yield gap 714 685 766 829 2,700 1,871
To close this yield gap (1,871 kg/ha.) KVK-Bidar organized a farmer-scientist interface
meeting wherein progressive farmers and KVK scientists discussed various aspects of boosting
the yield levels of red gram, finally arriving at the ideas of “transplanting / dibbling technology.”
To assess this idea, the scientists of KVK designed trials about transplanting technology.
Feeler trial during : 2004-05
OFTs conducted : 2005-06 and 2006-07
FLDs conducted : 2008-09, 2009-10, 2010-11, 2011-12, 2012-13, 2013-14 &
2014-15
[OFTs = On-farm trials; FLDs = Front-line demonstrations]

DETAILS OF ON-FARM TRIALS & FRONT-LINE DEMONSTRATIONS :
OFT RESULTS (2005-06)
Technology Production (qtls/ha.) BC Ratio Irrigated Rainfed Irrigated Rainfed
Farmer’s practice (sowing) 16.12 13.12 5.24 4.62 Technology assessed (dibbling) 20.67 16.25 7.08 5.64
Technology refined (transplanting) 48.75 34.67 12.09 8.31
OFT RESULTS (2006-07)
Technology Production (qtls/ha.) Irrigated Rainfed
Farmer’s practice (sowing) 7.00 6.50 Technology assessed (dibbling) 13.00 12.50
Technology refined (transplanting) 58.08 38.25
These above results clearly indicated that transplanting method was found superior,
recording the highest yields under both rainfed and irrigated condition. The increased yield may
be due to the advanced date of sowing and to optimum plant geometry.
FLD RESULTS (2010-11)
No. of farmer Demo. area (ha)
Demo. yield (q/ha.)
Check yield (q/ha.)
% increase
15 15 29.7 17.5 69%
ECONOMIC IMPACT DURING 2010-11 – MARKET RATE (RS. 4200/ QTL)
Sl. No.
Particulars Average yield (q/ha)
Cost of Cultivation
(Rs.)/ha.
Gross income (Rs./ha)
Net Income (Rs./ha.)
B:C Ratio
1 Transplanting technology
29.7 17,500 124,740 107,240 1 : 6.12
2 Farmers practice (sowing method)
17.5 15,000 73,000 58,500 1 : 3.90

FLD RESULTS (2011-12)
No. of farmer Demo. area (ha)
Demo. yield (q/ha.)
Check yield (q/ha.)
% increase
25 10 28.56 12.0 138 ECONOMIC IMPACT DURING 2011-12 – MARKET RATE (RS. 4800/ QTL)
Sl. No.
Particulars Average yield (q/ha)
Cost of Cultivation
(Rs.)/ha.
Gross income (Rs./ha)
Net Income (Rs./ha.)
B:C Ratio
1 Transplanting technology
28.56 16,250 137,088 120,838 1 : 7.43
2 Farmers practice (sowing method)
12.0 15,250 57,600 42,350 1 : 2.77
FLD RESULTS (2012-13)
No. of farmer Demo. area (ha)
Demo. yield (q/ha.)
Check yield (q/ha.)
% increase
34 12 29.80 15.0 70% ECONOMIC IMPACT DURING 2012-13 – MARKET RATE (RS. 4,200/ QTL)
Sl. No.
Particulars Average yield (q/ha)
Cost of Cultivation
(Rs.)/ha.
Gross income (Rs./ha)
Net Income (Rs./ha.)
B:C Ratio
1 Transplanting technology
29.80 16,250 125,160 108,910 1 : 7.70
2 Farmers practice (Sowing method)
15.0 11,750 63,000 51,250 1 : 5.36
FLD RESULTS (2013-14)
No. of farmer Demo. area (ha)
Demo. yield (q/ha.)
Check yield (q/ha.)
% increase
20 8 23.47 15.0 51% ECONOMIC IMPACT DURING 2013-14 – MARKET RATE (RS. 3,600/ QTL)
Sl. No.
Particulars Average yield (q/ha)
Cost of Cultivation
(Rs.)/ha.
Gross income (Rs./ha)
Net Income (Rs./ha.)
B:C Ratio
1 Transplanting technology
23.47 18,250 84,492 66,242 1 : 4.62
2 Farmers practice (Sowing method)
15.50 14,760 55,800 41,040 1 : 3.78

FLD RESULTS (2014-15)
No. of farmer Demo. area (ha)
Demo. yield (q/ha.)
Check yield (q/ha.)
% increase
10 4 26.50 16.0 66% ECONOMIC IMPACT DURING 2014-15 – MARKET RATE (RS. 3,656/ QTL)
Sl. No.
Particulars Average yield (q/ha)
Cost of Cultivation
(Rs.)/ha.
Gross income (Rs./ha)
Net Income (Rs./ha.)
B:C Ratio
1 Transplanting technology
26.50 19,250 96,900 77,650 1 : 5.03
2 Farmers practice (Sowing method)
16.00 15,760 60,800 45,040 1 : 3.85
From five years data of FLDs, it was found that there was 51% to 138% increase in yield
in transplanting technology when compared to farmers’ practice. Due to this technology, red gram
growing farmers expressed that earlier they have not harvested this much yield, and they have
realized about yield potentiality and maximum profit in red gram.
29.7 28.56 29.8
23.4726.5
17.5
1215 15 16
0
5
10
15
20
25
30
35
2008-09 2009-10 2010-11 2011-12 2012-13
Yie
ld (q
tls/h
a)
Year
FLD RESULTS FROM 2010-11 to 2014-15
Demo Yield (qtls/ha) Check Yield (qtls/ha)
2010-11 2011-12 2012-13 2013-14 2014-15
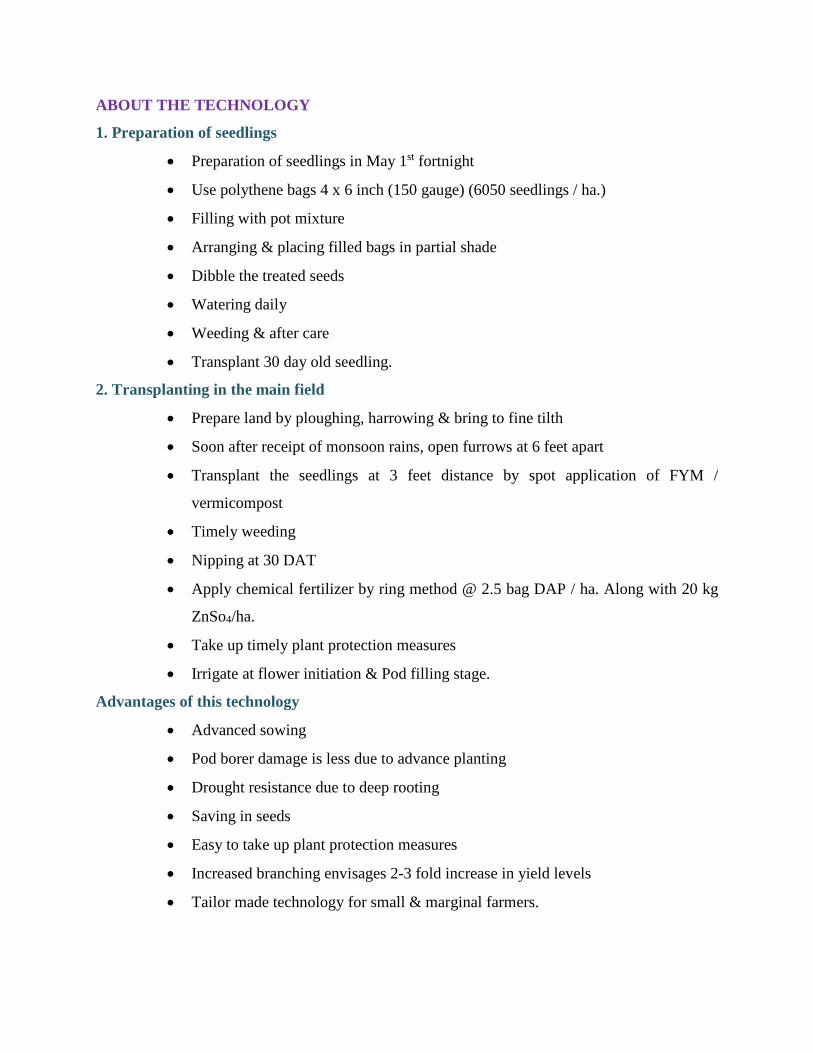
ABOUT THE TECHNOLOGY
1. Preparation of seedlings
• Preparation of seedlings in May 1st fortnight
• Use polythene bags 4 x 6 inch (150 gauge) (6050 seedlings / ha.)
• Filling with pot mixture
• Arranging & placing filled bags in partial shade
• Dibble the treated seeds
• Watering daily
• Weeding & after care
• Transplant 30 day old seedling.
2. Transplanting in the main field
• Prepare land by ploughing, harrowing & bring to fine tilth
• Soon after receipt of monsoon rains, open furrows at 6 feet apart
• Transplant the seedlings at 3 feet distance by spot application of FYM /
vermicompost
• Timely weeding
• Nipping at 30 DAT
• Apply chemical fertilizer by ring method @ 2.5 bag DAP / ha. Along with 20 kg
ZnSo4/ha.
• Take up timely plant protection measures
• Irrigate at flower initiation & Pod filling stage.
Advantages of this technology
• Advanced sowing
• Pod borer damage is less due to advance planting
• Drought resistance due to deep rooting
• Saving in seeds
• Easy to take up plant protection measures
• Increased branching envisages 2-3 fold increase in yield levels
• Tailor made technology for small & marginal farmers.

Extra requirements of this technology
• More labour
• Protective irrigation facilities
Process adopted to spread technology
• Training programmes : 85
• Field days : 42
• Exhibitions : 28
• Radio programmes : 08
• TV programmes : 10
• Print media : 65
• Publication of leaflets : 20 (1000 each copy)
• CDs prepared : 2
• Mobile messages : 110
• Sale of seeds (BSMR-736) under revolving fund : 900 qtls
• University calendar : -

PROCESS OF SPREAD OF RED GRAM TRANSPLANTING TECHNOLOGY
Training on red gram transplanting/ dibbling for progressive farmers of Latur and Osmanabad districts
for extension functionaries of Department of Agriculture during 2009-10 Maharashtra : 23rd April, 2011
Tamil Nadu farmers visited transplanted red gram plot
Visit of H’ble.Vice Chancellor Dr. B.V.Patil along with DR and DE, UAS Raichur to transplanted red gram
field
SEMINAR ON RED GRAM TRANSPLANTING VISIT OF PTI DIGNITARIES NEW DELHI TO
DEMONSTRATION PLOT

PROCESS OF SPREAD OF RED GRAM TRANSPLANTING TECHNOLOGY
ALL-INDIA RADIO PROGRAMME ON RED
GRAM TRANSPLANTING DOORDARSHAN PROGRAMME ON RED GRAM
TRANSPLANTING
Display of Red gram transplanting technology in Vibrant Gujarat on 3-5th September, 2012
Delivering lecture on Red gram transplanting/dibbling method during summer
school on “Resource conservation technology for enhancing input use efficiency and sustainable pulse production “at IIPR, Kanpur (UP), 17th September,
2011
Delivering lecture on Red gram transplanting/ dibbling method at State level interference at
Tanjavuru (TN), 18th November, 2011
Video DVD on Red Ggram Transplanting (Kannada and English)

Horizontal Spread of the Technology
ECONOMIC IMPACT IN THE DISTRICT
During 2010-11
Area Adopted : 2000 ha. Market rate @ Rs. 4200/qtls
Sl. No.
Particulars Average yield (q/ha)
Total production qtls/400 ha.
Value of production Rs. crores
1 Transplanting technology
29.7 59,400 24.94
2 Farmers’ practice 17.5 35,000 14.70 Increase in revenue 10.24
During 2011-12
Area Adopted : 4000 ha. Market rate @ Rs. 4800/qtls
Sl. No.
Particulars Average yield (q/ha)
Total production qtls/400 ha.
Value of production Rs. crores
1 Transplanting technology
28.56 114,240 54.83
2 Farmers’ practice 12.0 48,000 23.04 Increase in revenue 31.79
KVK, Bidar Bijapur
Dist
Koppal Dist
Haveri Dist
Raichur Dist
Bagalkot Dist
Maharashtra
Chatishgad State
Orissa State
Bidar 2000

During 2012-13
Area Adopted : 4200 ha. Market rate @ Rs. 4200/qtls
Sl. No.
Particulars Average yield (q/ha)
Total production qtls/400 ha.
Value of production Rs. In crores
1 Transplanting technology
29.80 125,160 47.98
2 Farmers’ practice 15.0 63,600 26.71 Increase in revenue 21.27
During 2013-14
Area Adopted : 4800 ha. Market rate @ Rs. 3,600/qtls
Sl. No.
Particulars Average yield (q/ha)
Total production qtls/400 ha.
Valueof production Rs. crores
1 Transplanting technology
23.47 112,656 40.55
2 Farmers’ practice 15.50 74,400 26.78 Increase in revenue 13.77
During 2014-15
Area Adopted : 4900 ha. Market rate @ Rs. 3,656/qtls
Sl. No.
Particulars Average yield (q/ha)
Total production qtls/400 ha.
Value of production Rs. crores
1 Transplanting technology
26.50 129,850 47.47
2 Farmers practice 16.00 78,400 28.66 Increase in revenue 18.8
After introduction of transplanting / dibbling technology in red gram and constant efforts made
by KVK-Bidar, the area of adoption under this technology in Bidar district and neighbouring
districts is being increasing year after year. It is one of the best examples for transfer of technology
in recent years after Bt cotton in northern district of Karnataka, due to break-through record yield
levels in red gram ecosystems coinciding with increased market prices in pulses. The economic
scenario of the district has been completely changed. Lot of new red gram processing units are
establishing in Bidar district, simultaneously creating employment opportunities.
Recently red gram growing farmers in the district are started forming associations. In coming
future, they are planning to export processed dal to neighbouring states as well as abroad. Further,

due to this technology living standard of red gram growing farmers is being changing slowly in
the pulse bowl of Karnataka.
Socio-Economic Impact
Hereto, under irrigated conditions, the main commercial crop was sugarcane in this district which
has resulted in power shortage, water scarcity, and market glut. This led to distress of farmers.
They were in need of alternative profitable crop to sugarcane. Red gram transplanting technology
emerged as a solution.
COMPARISON BETWEEN SUGARCANE & RED GRAM CULTIVATION Particulars Sugarcane Red gram Duration 12 months 6 months Nutritional requirement Exhaustive crop Improves fertility Water requirement High (25 irrigations) Less (3 irrigations) Average yield 62.5 ton/ha. 27.5 qtls/ha. Cost of cultivation Rs. 65,000/ha. Rs. 17,500/ha. Gross returns Rs. 125,000/- Rs. 132,000/- Net return Rs. 60,000/- Rs. 114,500/- Marketability Perishable, can’t be stored Non-perishable, can be stored
Advantages of Red Gram Cultivation
• Requires less water
• Less duration
• Improves soil fertility
• Non-dependency for marketing
Lessons Learned
• Requires wider spacing of more than 6 feet
• Technology required to restrict the biomass production
Factors of Success
During 2008-13, sugarcane growers were badly hit by low prices coupled with marketing problems and scarcity in water & electricity. Due to these problems, sugarcane growers were in search of an alternative crop at the same time that pulse production was declining in the country. As a result, red gram fetched highest rates. These factors attributed for adoption of red gram transplanting / dibbling technology. This technology increased the name and fame of KVK-Bidar. As a result, it has become talk of the day. We the scientists of KVK-Bidar are proud to record that the hidden potentiality of red gram crop was identified at this centre. Red gram was a neglected crop. By this technology, the crop has become one of the major commercial crops.
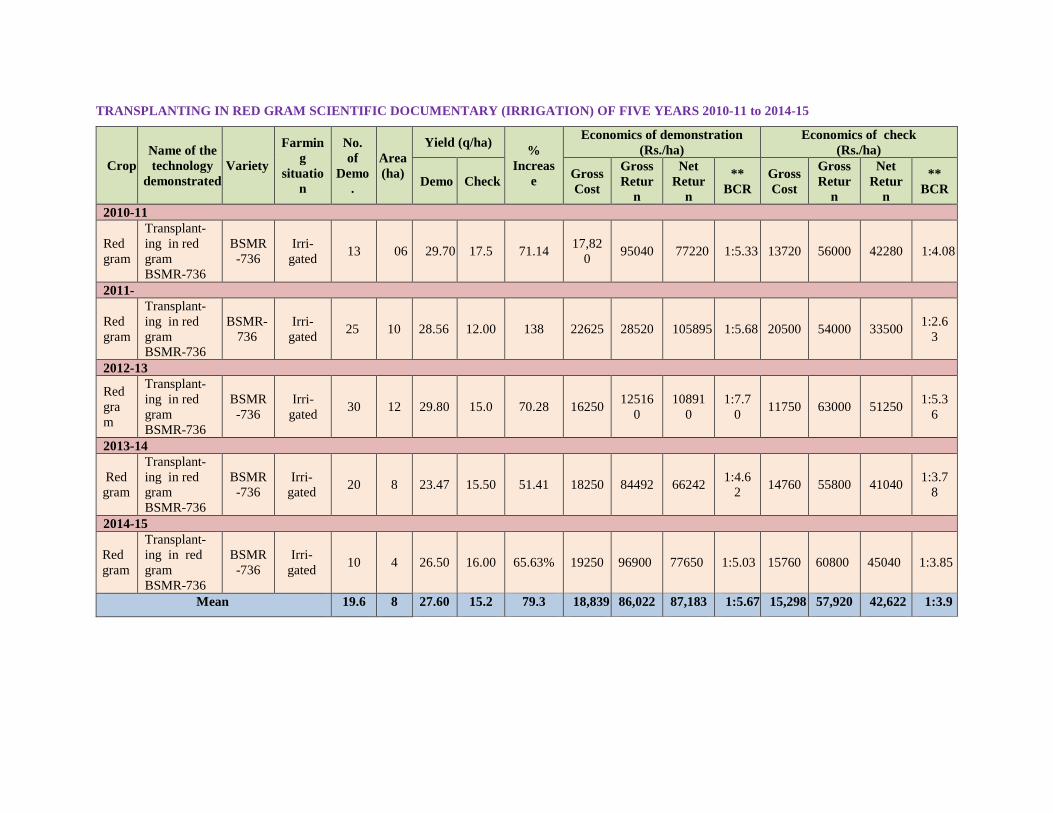
TRANSPLANTING IN RED GRAM SCIENTIFIC DOCUMENTARY (IRRIGATION) OF FIVE YEARS 2010-11 to 2014-15
Crop Name of the technology
demonstrated Variety
Farming
situation
No. of
Demo.
Area (ha)
Yield (q/ha) % Increas
e
Economics of demonstration (Rs./ha)
Economics of check (Rs./ha)
Demo Check Gross Cost
Gross Retur
n
Net Retur
n
** BCR
Gross Cost
Gross Retur
n
Net Retur
n
** BCR
2010-11
Red gram
Transplant-ing in red gram BSMR-736
BSMR-736
Irri-gated 13 06 29.70 17.5 71.14 17,82
0 95040 77220 1:5.33 13720 56000 42280 1:4.08
2011-
Red gram
Transplant-ing in red gram BSMR-736
BSMR- 736
Irri- gated 25 10 28.56 12.00 138 22625 28520 105895 1:5.68 20500 54000 33500 1:2.6
3
2012-13
Red gram
Transplant-ing in red gram BSMR-736
BSMR-736
Irri- gated 30 12 29.80 15.0 70.28 16250 12516
0 10891
0 1:7.7
0 11750 63000 51250 1:5.36
2013-14
Red gram
Transplant-ing in red gram BSMR-736
BSMR-736
Irri- gated 20 8 23.47 15.50 51.41 18250 84492 66242 1:4.6
2 14760 55800 41040 1:3.78
2014-15
Red gram
Transplant-ing in red gram BSMR-736
BSMR-736
Irri- gated 10 4 26.50 16.00 65.63% 19250 96900 77650 1:5.03 15760 60800 45040 1:3.85
Mean 19.6 8 27.60 15.2 79.3 18,839 86,022 87,183 1:5.67 15,298 57,920 42,622 1:3.9

TRANSPLANTING METHOD OF RED GRAM CULTIVATION - DEMONSTRATION FARMERS (N=60) 2010-11
Sl.No Name Village Taluka Variety Area (Ha)
Yield (Qa/Ha)
Price (Rs/Qa)
Gross Income (Rs/Ha)
Total Cost
(Rs/Ha)
Net Profit
(Rs/Ha)
B:C Ratio
1 Gurulingappa Melododdi Hudagi Humanbad BSMR-736 1.6 35 4,200 147000 22,250 124,750 6.61
2 Shivakumar Peddi Hudagi Humanbad BSMR-736 0.8 33.75 4,000 135000 22,225 112,775 6.07 3 Mallikarjun Siddan Hudagi Humanbad BSMR-736 0.8 37.5 4,100 153750 22,375 131,375 6.87 4 Dulappa Kumbar Nimbur Humanbad BSMR-736 1.2 38.75 4,000 155000 24,625 130,375 6.29
5 IndreshKumar Deshmuk Nimbur Humanbad BSMR-736 1 35 4,000 140000 23,875 116,125 5.86
6 Sunil Reddy Chitaguppa Humanbad BSMR-736 0.8 37.5 4,150 155625 23,875 131,750 6.52 7 Basavaraj Pedagi Chitaguppa Humanbad BSMR-736 0.8 38.75 4,200 162750 24,938 137,813 6.53 8 Shivakumar Adaki Chitaguppa Humanbad BSMR-736 1.2 38.75 4,100 158875 23,750 135,125 6.69
9 Shivasharangouda Patil Talamadagi Humanbad
BSMR-736 1.8 32.5 4,150 134875 21,625 113,250 6.24
10 Guralingappa Pawshetti Talamadagi Humanbad
BSMR-736 0.8 38.75 4,100 158875 24,625 134,250 6.45
11 Mallikarjun Patil Rajgera Bidar BSMR-736 0.8 36.25 4,050 146812 23,750 123,063 6.18
12 Muneerruddin Rajgera Bidar BSMR-736 0.8 38.75 4,000 155000 25,000 130,000 6.20
13 Taya Ali Magadal Bidar BSMR-736 0.8 35 4,100 143500 22,875 120,625 6.27
14 Jabbar Patel Magadal Bidar BSMR-736 0.8 36.25 4,000 145000 21,875 123,125 6.63
15 Nandakumar Kulakarn Magadal Bidar
BSMR-736 1.2 36.25 4,200 152250 21,375 130,875 7.12
16 Basavaraj Patil Janawad Bidar BSMR-736 0.8 35 4,250 148750 22,500 126,250 6.61
17 Danaraj Patil Janawad Bidar BSMR-736 0.8 32.5 4,100 133250 21,375 111,875 6.23
18 Venkatarao Janawad Bidar BSMR-736 0.6 36.25 4,000 145000 23,375 121,625 6.20
19 Prakash Patil Astur Bidar BSMR-736 1.2 38.75 4,200 162750 21,625 141,125 7.53
20 Shenkar Nagaladiddi Astur Bidar BSMR-736 0.8 35 4,250 148750 24,125 124,625 6.17
21 Galleppa Siddeswari Jojana Aurad BSMR-736 1.2 33.75 4,100 138375 21,750 116,625 6.36
22 Shankareppa Avarave Jojana Aurad BSMR-736 1.2 37.5 4,250 159375 23,375 136,000 6.82
23 Nagashetti Bore Jojana Aurad BSMR-736 1.2 35 4,200 147000 22,475 124,525 6.54

24 Rajkumar Deshmuk Naganpalli Aurad BSMR-736 0.8 36.25 4,150 150437 20,625 129,813 7.29
25 Pundalirao Patil Naganpalli Aurad BSMR-736 1.2 36.25 4,250 154062 22,375 131,688 6.89
26 Anilkumar Swami Shembelli Aurad BSMR-736 1.6 36.25 4,200 152250 22,000 130,250 6.92
27 Siddappa More Shembelli Aurad BSMR-736 1.2 35 4,000 140000 23,375 116,625 5.99
28 Rajshekar Patil Shembelli Aurad BSMR-736 1.6 37.5 4,000 150000 24,625 125,375 6.09
29 Sathish Namosh Gadikushnoor Aurad BSMR-736 1.6 35 4,100 143500 21,375 122,125 6.71
30 Basavaraj Shivapuje Gadikushnoor Aurad BSMR-736 1.8 37.5 4,250 159375 22,375 137,000 7.12

TRANSPLANTING METHOD OF RED GRAM CULTIVATION – NON-DEMONSTRATION FARMERS (N=60) 2010-11
Sl.No Name Village Taluka Variety Area (Ha)
Yield (Qa/Ha)
Price (Rs/Qa)
Gross Income (Rs/Ha)
Total Cost
(Rs/Ha)
Net Profit
(Rs/Ha)
B:C Ratio
1 Sadashiva Kanshetti Hudagi Humanbad BSMR-736 0.8 11.25 4,100 46125 15,250 30,875 3.02 2 Narasappa Hudagi Humanbad Asha 2 10 4,200 42000 15,625 26,375 2.69 3 Anand Gouda Nimbur Humanbad Asha 2 11.25 4,100 46125 15,500 30,625 2.98 4 Dattappa Jathapa Nimbur Humanbad BSMR-736 2 11.25 4,000 45000 15,625 29,375 2.88 5 Nagappa Kolagal Nimbur Humanbad BSMR-736 0.8 13.75 4,150 57062 15,500 41,563 3.68 6 Amaresh Swami Chitaguppa Humanbad Asha 2 10 4,150 41500 15,250 26,250 2.72 7 Rammanna Billigaddi Chitaguppa Humanbad Asha 2 12.5 4,100 51250 14,875 36,375 3.45 8 Channabasanagouda Talamadagi Humanbad Asha 1.2 10 4,050 40500 15,500 25,000 2.61 9 N G Hampanna Talamadagi Humanbad Marithi 1.6 11.25 4,100 46125 15,500 30,625 2.98 10 Naridappa Gaddi Talamadagi Humanbad BSMR-736 1.6 11.25 4,000 45000 15,550 29,450 2.89 11 V B Reddy Rajgera Bidar BSMR-736 0.8 12.5 4,150 51875 15,650 36,225 3.31 12 Basheer Ahmad Rajgera Bidar Asha 1.2 11.25 4,150 46687 15,625 31,063 2.99 13 Basavaraj T Rajgera Bidar Asha 0.8 12.5 4,200 52500 15,600 36,900 3.37 14 Rajsab K S Magadal Bidar BSMR-736 0.8 10 4,150 41500 15,500 26,000 2.68 15 D Eresh Magadal Bidar Maruti 0.8 12.5 4,100 51250 15,500 35,750 3.31 16 Siddanna Gouda Janawad Bidar Maruti 1.2 11.25 4,150 46687 15,625 31,063 2.99 17 D M Amareshnna Janawad Bidar Maruti 2.4 10 4,250 42500 14,875 27,625 2.86 18 Vasanthgouda Roti Astur Bidar BSMR-736 1.2 11.25 4,200 47250 14,750 32,500 3.20 19 Raju Sigli Astur Bidar Maruti 0.8 8.75 4,000 35000 15,375 19,625 2.28 20 Kareppa Daddi Astur Bidar Maruti 0.8 10 4,150 41500 15,250 26,250 2.72 21 Sanjeevakumar Jojana Aurad Asha 2 10 4,150 41500 15,125 26,375 2.74 22 Sharanappa Jojana Aurad BSMR-736 1.2 8.75 4,100 35875 14,975 20,900 2.40 23 Allhuddin Naganpalli Aurad BSMR-736 1.6 11.25 4,100 46125 14,950 31,175 3.09 24 G Kariyya Naganpalli Aurad Maruti 2.4 12.5 4,250 53125 14,875 38,250 3.57 25 G Lachamappa Naganpalli Aurad Maruti 1.2 10 4,200 42000 15,375 26,625 2.73 26 Shitaram Shembelli Aurad Asha 1.4 12.5 4,100 51250 15,300 35,950 3.35 27 Panpanna Venkatesh Shembelli Aurad Marithi 1.6 10 4,000 40000 15,525 24,475 2.58 28 Errayya Swami Gadikushnoor Aurad BSMR-736 1.2 10 4,250 42500 15,375 27,125 2.76 29 Sanna Siddappa Gadikushnoor Aurad Asha 1.2 8.75 4,200 36750 15,375 21,375 2.39 30 Sanna Basanna Gadikushnoor Aurad Maruthi 2 11.25 4,100 46125 15,625 30,500 2.95

COST AND RETURN OF TRANSPLANTING RED GRAM CULTIVATION, 2010-11
Demonstration Non Demonstration
Particulars Frequency Percentage Particulars Frequency Percentage
Yield/Ha Yield/Ha
<35quintals 12 40.00 <10.50 quintals 13 43.33
35-36.50quintals 7 23.33 10.50-11.50 quintals 10 33.33
> 36.50quintals 11 36.67 > 11.50 quintals 7 23.33
Gross Income/Ha Gross Income/Ha
< Rs 1,45,700 10 33.33 < Rs 42,800 13 43.33
Rs 1,45,700-1,52,700 9 30.00 Rs 42,800-47,300 10 33.33
>Rs 1,52,700 11 36.67 >Rs 47,300 7 23.33
Cost/Ha Cost/Ha
< Rs 22,350 11 36.67 < Rs 15,000 6 20.00
Rs 22,350-23,400 9 30.00 Rs 15,000-15,500 15 50.00
>Rs 23,400 10 33.33 >Rs 15,500 9 30.00
Profit/Ha Profit/Ha
< Rs 1,23,000 9 30.00 < Rs 27,500 12 40.00
Rs 1,23,000-1,29,700 7 23.33 Rs 27,500-32,000 10 33.33
>Rs 1,29,700 14 46.67 >Rs 32,000 8 26.67
B:C Ratio 6.53 B:C Ratio 2.94

TRANSPLANTING METHOD OF RED GRAM CULTIVATION – DEMONSTRATION FARMERS (N=60) 2011-12 Sl.No Name Village Taluka Variety Area
(Ha) Yield (Qa/Ha)
Price (Rs/Qa)
Gross Income (Rs/Ha)
Total Cost (Rs/Ha)
Net Profit (Rs/Ha)
B:C Ratio
1 Kashinath Danappa
Hudagi Humanbad BSMR-736 1.2 27.5 3,950 108625 21,375 87,250 5.08
2 Karibasappa Malashetti
Hudagi Humanbad BSMR-736 0.8 30 3,850 115500 22,375 93,125 5.16
3 Udaykumar Patil Nimbur Humanbad BSMR-736 1.6 31.25 4,100 128125 24,750 103,375 5.18 4 Manikrao
Deshmukh Nimbur Humanbad BSMR-736 1.4 32.5 3,800 123500 22,475 101,025 5.49
5 Mallikarjun Swami
Nimbur Humanbad BSMR-736 1.4 25 4,150 103750 22,500 81,250 4.61
6 Prashanth Borale Chitaguppa Humanbad BSMR-736 0.8 26.25 3,700 97125 22,475 74,650 4.32 7 Panduranga
Marata Chitaguppa Humanbad BSMR-736 0.8 27.5 3,800 104500 21,875 82,625 4.78
8 Mallamma Tambaki
Talamadagi Humanbad BSMR-736 1 31.25 3,950 123437 23,125 100,313 5.34
9 Shankarappa Tambaki
Talamadagi Humanbad BSMR-736 1.4 31.25 4,050 126562 21,625 104,938 5.85
10 Basavaraj Patil Talamadagi Humanbad BSMR-736 1 32.5 3,950 128375 23,000 105,375 5.58 11 Shanthkumar
Sherikar Rajgera Bidar BSMR-736 1 26.25 3,990 104737 24,500 80,238 4.28
12 Ramesh Dunasiri Rajgera Bidar BSMR-736 1.4 28.75 3,950 113562 23,125 90,438 4.91 13 Shamrao
Kulkarni Rajgera Bidar BSMR-736 1.2 27.5 4,000 110000 23,125 86,875 4.76
14 Basavaraj Gadi Magadal Bidar BSMR-736 0.8 27.5 4,100 112750 22,375 90,375 5.04 15 Sharanappa Patil Magadal Bidar BSMR-736 0.8 30 3,800 114000 23,875 90,125 4.77 16 Ashok Tigale Janawad Bidar BSMR-736 0.8 30 4,000 120000 22,875 97,125 5.25 17 RajKumar Patil Janawad Bidar BSMR-736 0.8 31.25 4,100 128125 20,625 107,500 6.21 18 Veerashetti
Malipatil Astur Bidar BSMR-736 0.8 26.25 3,950 103687 23,375 80,313 4.44
19 Nagashetti Malipatil
Astur Bidar BSMR-736 1.2 25 4,050 101250 23,875 77,375 4.24
20 Ganapatha Rao Astur Bidar BSMR-736 0.8 25 4,150 103750 21,625 82,125 4.80 21 Shankar Mashetti Jojana Aurad BSMR-736 0.8 25 3,950 98750 21,125 77,625 4.67 22 Santhosh Patil Jojana Aurad BSMR-736 0.8 27.5 3,850 105875 24,625 81,250 4.30 23 Santhosh Reddy Naganpalli Aurad BSMR-736 0.8 28.75 3,950 113562 22,375 91,188 5.08

24 Mukthameya Naganpalli Aurad BSMR-736 1.4 32.5 4,100 133250 23,875 109,375 5.58 25 Rachappa Patil Naganpalli Aurad BSMR-736 0.8 33.75 3,800 128250 21,375 106,875 6.00 26 Rajkumar N K Shembelli Aurad BSMR-736 1.2 32.5 4,050 131625 21,250 110,375 6.19 27 Rajkumar Swami Shembelli Aurad BSMR-736 0.8 30 3,850 115500 21,375 94,125 5.40 28 Umakanth
Shivapuje Gadikushnoor Aurad BSMR-736 1.6 31.25 3,880 121250 21,375 99,875 5.67
29 Shivabasappa Patil
Gadikushnoor Aurad BSMR-736 1.2 28.75 4,100 117875 24,125 93,750 4.89
30 Chandrappa Patil Gadikushnoor Aurad BSMR-736 0.8 27.5 3,900 107250 23,875 83,375 4.49 TRANSPLANTING METHOD OF RED GRAM CULTIVATION – NON-DEMONSTRATION FARRMERS (N=60) 2011-12
Sl. No
Name Village Taluka Variety Area (Ha)
Yield (Qa/Ha)
Price (Rs/Qa)
Gross Income (Rs/Ha)
Total Cost (Rs/Ha)
Net Profit (Rs/Ha)
B:C Ratio
1 Muttanna Madival
Hudagi Humanbad Maruti 0.8 11.25 3,900 43875 15,250 28,625 2.88
2 Anjush Rao Hudagi Humanbad Maruti 2 10 3,950 39500 15,625 23,875 2.53 3 Bhemanna
Manik Hudagi Humanbad Asha 2 11.25 3,850 43312 15,500 27,813 2.79
4 Virpakasha Nimbur Humanbad Asha 2 11.25 3,950 44437 15,625 28,813 2.84 5 Eranagouda Patil Nimbur Humanbad Marithi 0.8 13.75 3,890 53487 15,500 37,988 3.45 6 S Veerasappa Chitaguppa Humanbad Maruti 2 10 3,850 38500 15,250 23,250 2.52 7 Kasimappa H Chitaguppa Humanbad Maruti 2 12.5 3,800 47500 14,875 32,625 3.19 8 Ramswami Chitaguppa Humanbad Maruti 1.2 10 3,950 39500 15,500 24,000 2.55 9 Basavaraj
Veeresh Talamadagi Humanbad BSMR-736 1.6 11.25 3,950 44437 15,500 28,938 2.87
10 S Basavaraj Talamadagi Humanbad Maruti 1.6 11.25 3,750 42187 15,550 26,638 2.71 11 Prasanna Ramgir Rajgera Bidar Maruti 0.8 12.5 3,800 47500 15,650 31,850 3.04 12 Mallareddy
Gouda Rajgera Bidar Asha 1.2 11.25 3,950 44437 15,625 28,813 2.84
13 Nagaraj Patri Magadal Bidar Marithi 0.8 12.5 3,950 49375 15,600 33,775 3.17 14 Laxmiputra S T Magadal Bidar Asha 0.8 10 3,850 38500 15,500 23,000 2.48 15 Hanamanth
Tanti Magadal Bidar BSMR-736 0.8 12.5 3,900 48750 15,500 33,250 3.15
16 M A Biradar Janawad Bidar Asha 1.2 11.25 3,850 43312 15,625 27,688 2.77 17 Somashekar
Patil Janawad Bidar Asha 2.4 10 3,950 39500 14,875 24,625 2.66
18 Ramesh Kumar Janawad Bidar Asha 1.2 11.25 3,850 43312 14,750 28,563 2.94

19 Rammanna Basappa
Astur Bidar Marithi 0.8 8.75 3,750 32812 15,375 17,438 2.13
20 Halappa Gouda Astur Bidar BSMR-736 0.8 10 3,850 38500 15,250 23,250 2.52 21 Prakash
Kulkarni Jojana Aurad Asha 2 10 3,800 38000 15,125 22,875 2.51
22 Ravikumar Kali Jojana Aurad Asha 1.2 8.75 3,750 32812 14,975 17,838 2.19 23 Shivakumar
Patil Jojana Aurad Marithi 1.6 11.25 3,950 44437 14,950 29,488 2.97
24 Urukunda Naganpalli Aurad Asha 2.4 12.5 3,950 49375 14,875 34,500 3.32 25 V Devaraja Naganpalli Aurad BSMR-736 1.2 10 3,850 38500 15,375 23,125 2.50 26 Kareppa Shembelli Aurad Maruti 1.4 12.5 3,700 46250 15,300 30,950 3.02 27 Kareppa Kalitab Shembelli Aurad Asha 1.6 10 3,850 38500 15,525 22,975 2.48 28 Sharanappa V Shembelli Aurad Asha 1.2 10 3,950 39500 15,375 24,125 2.57 29 Venkatesh Gadikushnoor Aurad BSMR-736 1.2 8.75 3,850 33687 15,375 18,313 2.19 30 Channaveer Gadikushnoor Aurad BSMR-736 2 11.25 3,800 42750 15,625 27,125 2.74

Cost and Return of Transplanting Method of Red Gram Cultivation 2011-12
Demonstration Non Demonstration
Particulars Frequency Percentage Particulars Frequency Percentage Yield/Ha Yield/Ha
<28quintals 13 43.33 <10.50 quintals 13 43.33
28-30quintals 7 23.33 10.50-11.50 quintals 10 33.33
> 30 quintals 10 33.33 > 11.50 quintals 7 23.33
Gross Income/Ha Gross Income/Ha < Rs 1,10,300 12 40.00 < Rs 40,000 13 43.33
Rs 1,10,300-1,19,300
7 23.33 Rs 40,000-44,350 6 20.00
>Rs 1,19,300 11 36.67 >Rs 44,350 11 36.67
Cost/Ha Cost/Ha
< Rs 22,200 10 33.33 < Rs 15,200 7 23.33
Rs 22,200-23,100 8 26.67 Rs 15,200-15,400 8 26.67
>Rs 23,100 12 40.00 >Rs 15,400 15 50.00
Profit/Ha Profit/Ha < Rs 87,500 12 40.00 < Rs 24,750 13 43.33
Rs 87,500-96,700 7 23.33 Rs 24,750-29,000 9 30.00
>Rs 96,700 11 36.67 >Rs 29,000 8 26.67
B:C Ratio 5.08 B:C Ratio 2.75