redefining packaging for
TRANSCRIPT

DS Smith Plc
Annual Report 2021
Annual Report 2021
Redefining Packaging for a Changing World

2020/21 Financial highlights
2020/21 Non-financial highlights
14%reduction in accident frequency rate
£5,976mRevenue2
(2020: £6,043m)
12.1pDividend per share(2020: nil)
23%CO2e per tonne reduction since 2015
£311mOperating profit2
(2020: £455m)
£486mFree cash flow1
(2020: £354m)
54 millionunits of plastic replaced in the year
8.4%Return on sales1
(2020: 10.9%)
-£306mto £1,795m net debt(2020: £2,101m)
x4 increase in training attendance across all platforms
+3.5%Corrugated box volumes(2020: +0.6%)
£502mAdjusted operating profit1
(2020: £660m)
1. Based upon continuing operations, before adjusting items and amortisation. These are all non-GAAP performance measures – see note 32 to the consolidated financial statements.
2. From continuing operations.
ContentsStrategic Report
Highlights1 Group Chief Executive’s introduction2 Redefining Packaging for a Changing World3 Our stakeholders4 Our business – at a glance6 The changing relationship with packaging9 Helping customers meet their biggest
challenges10 Leading the transition to the circular
economy12 Now and Next – our sustainability strategy14 Chairman’s statement15 Section 172 statement16 Our business model18 Our differentiation and market drivers20 Group Chief Executive’s interview22 Our strategy – customers24 Our strategy – people30 Our strategy – sustainability34 Our strategy – financial36 Operating review40 Financial review47 Principal risks 49 Viability statement56 Task Force on Climate-related Financial
Disclosures (TCFD)59 Non-financial information statement
Governance62 Board of Directors64 Chairman’s introduction to Governance67 Board leadership and Company Purpose70 Division of responsibilities72 Composition, succession and evaluation73 Nomination Committee Report76 Audit, risk and internal control78 Audit Committee Report84 Remuneration Committee Report108 Additional information
Financial Statements111 Independent Auditor’s report121 Consolidated income statement122 Consolidated statement of comprehensive income123 Consolidated statement of financial position124 Consolidated statement of changes in equity125 Consolidated statement of cash flows126 Notes to the consolidated financial statements182 Parent Company statement of
financial position183 Parent Company statement of
changes in equity184 Notes to the parent Company
financial statements191 Five-year financial summary192 Shareholder information
Please note: Some of the images in this report were taken before the Covid-19 pandemic and the need for social distancing.
Foreword
Over the course of 2020/21 we have not only responded to the impact of Covid-19, we have continued to make significant progress in furthering our strategy to be the leading supplier of sustainable packaging solutions. Our priority throughout this pandemic has been and continues to be the safety and wellbeing of our people. We have worked in tandem with governments to ensure that our factories could remain open and continue to keep goods moving, including vital supplies like medicines and food. The opportunity for DS Smith is clear. We are an industry leader, with a fast moving consumer goods (FMCG) focused customer base and high quality assets across Europe and into North America, built up over the last decade and led by our customers’ requirements. We have invested substantially in innovation for many years resulting in differentiated, value-adding solutions in growth areas of the market, such as e-commerce and plastic replacement. As such, we are at the intersection of powerful trends – sustainability, e-commerce and digital – which result in compelling opportunities for us and we are partnering with customers and stakeholders to realise those. The launch of our new sustainability vision and strategy, Now and Next, maps out ambitious commitments and goals for the next decade. We are furthering our transition to a circular economy by partnering with our employees, customers, communities and stakeholders to keep materials in use, design out waste and regenerate natural systems, while continuing to focus on CO₂ reduction, protecting biodiversity and reducing water consumption.And while paper and packaging is one of the hardest sectors to de-carbonise, we were delighted to commit to a science-based target by 2030 and Net Zero by 2050 to reinforce our leadership in the circular economy and climate action.
GROUP CHIEF EXECUTIVE’S INTRODUCTION
We also recognise that this changing world has placed increased demands on our employees’ wellbeing, which is why we have launched a new framework to support this critical area. Our safety statistics have again improved, for the 12th year in a row. Meanwhile, from Kemsley to Krusevac, Tampere to Timisoara, and in over 300 locations across the world, our employees continue to embody our values by supporting the local communities in which we operate. In this report we set out what we have achieved in the year 2020/21, but also how we are well positioned to respond to the uncertain outlook facing the global economy. We explain the underlying growth drivers for the corrugated industry, and why DS Smith is ready to take advantage of those opportunities from the surge in e-commerce to plastic replacement.There is no denying the world has dramatically changed and through our Purpose of ‘Redefining Packaging for a Changing World’, which we have been working hard to embed over the past two years, we continue to support our customers and stakeholders to respond to a more digitally connected world. Finally, I would like to take this opportunity to officially welcome Geoff Drabble as Chairman and thank, once again, our outgoing Chairman Gareth Davis for his decade of service to DS Smith. Miles RobertsGroup Chief Executive
“In this report we set out details of our performance and strong momentum in the second half of the year 2020/21, and how our business is extremely well positioned through our circular business model to meet the challenges of the changing world.”Miles Roberts, Group Chief Executive
Annual Report 2021 dssmith.com 1
STRATEGIC REPORT

Redefining Packaging for a Changing World
Our Purpose is to ’Redefine Packaging for a Changing World’. It is our reason for being. It sets out why we exist and the value we bring to our customers and all stakeholder groups.Our Purpose focuses our DS Smith team on the rapidly changing world around us as consumers’ lives and shopping habits are changing due to the acceleration of the digital world. It encourages us to look outside of the confines of the packaging industry and forward to see how these changes influence shopping patterns, such as switches from stores to home shopping, and will impact on the environment and how packaging plays its part in a more sustainable experience for all.
Underpinned by our values
Be caringWe take pride in what we do and we care about our customers, our people and the world around us
Be challengingWe are not afraid to constructively challenge each other and ourselves to find a better way forward
Be responsiveWe seek new ideas and understanding and are quick to react to opportunities
Our Purpose sharpens our instincts and encourages us to tackle some of the world’s biggest challenges, such as replacing problem plastics. Our Purpose feeds all parts of our organisation, including people, policies, research and development, design and customer interactions. We are redefining packaging through our four strategic goals: delighting our customers. Realising the potential of our people, leading the way in sustainability and doubling our size and profitability. We believe that if we deliver in this way, we will meet our vision to be the leading supplier of sustainable packaging solutions.
Helps us to deliver our visionTo be the leading supplier of sustainable packaging solutions
Our Purpose‘Redefining Packaging for a Changing World’
We deliver our Purpose through our strategic goals:
To delight our customers: by delivering outstanding
results to them as we increase their sales, reduce
their costs, manage their risk and become circular ready
To realise the potential of our people: by creating a safe environment where
every colleague can develop their skills and ideas
To lead the way in sustainability: by
championing sustainable supply cycle solutions and
using materials responsibly through our production processes and beyond
To double our size and profitability: by driving
operational and commercial excellence, growing our
market share and expanding into new markets
Be tenaciousWe get things done
Be trustedWe can always be trusted to deliver on our promises
2
OUR BUSINESS
Our peopleWe are around 29,000 people across 34 countries worldwide, speaking 26 languages. We are inspired by our Purpose and are diverse in our thinking. By giving everyone a voice, we provide a meritocracy with development opportunities for all and recognition of personal achievement, regardless of gender, ethnicity, age or religion. We have workplace conversations through team briefings, leadership visits, digital and hard copy communications. We have mechanisms for feedback through our employee works councils, biennial employee survey and more regular pulse surveys, which inform local action plans and sharing of best practice. We also have a confidential hotline known as ‘Speak Up!’ for employees to report concerns where they do not wish to go through their local management. More formally, our European Works Council (EWC) brings together employee representatives from the European countries in which we operate and provides a forum for information sharing and consultation.Read more on page 24
Our customersOur customers are largely fast moving consumer goods (FMCG) companies that produce goods typically sold in supermarkets and increasingly via e-commerce channels. We make corrugated packaging for some of the largest global food brands. We also make packaging for online retailers and industrial customers and sell paper and recycling to third parties. As the world changed through the Covid-19 pandemic, our customers’ needs changed. They require an innovative and flexible partner with world class supply chains and scale. We aim to be the easiest packaging company to do business with and provide more ways to work with customers than ever before.Read more on page 22
Our investorsOur shares are listed on the London Stock Exchange, and we raise our debt from banks and through listed bonds. Our equity and bonds are owned by a wide range of investors in the UK, Europe, the US and beyond. We engage with equity investors and analysts through regular meetings and conferences, and similarly engage with our banking syndicate, fixed income investors and ratings agencies periodically.
Our suppliersWe have approximately 40,000 suppliers, ranging from small suppliers of goods and services, to large paper manufacturers from whom we source substantial volumes of paper for our corrugated board. We engage with suppliers to enforce our established supplier standards and supplier code of conduct, which set out our ways of working, including for example, in relation to our obligations under anti-modern slavery laws.
The environment and communitiesLeading in sustainability and care for the environment is core to our Purpose and one of our four strategic goals. Reducing CO₂, water usage and waste to landfill are priorities, and we have committed to setting science-based carbon-reduction targets in alignment with the Paris Agreement. The transition to a circular economy is our particular focus. Our strategic partnership with the Ellen MacArthur Foundation is informing our Now and Next sustainability strategy and is supporting our work in replacing problem plastic with fibre-based packaging, and educating five million people across Europe and North America in the circular economy. Our Purpose also guides our community programmes and charitable foundation which supports local and larger initiatives, from sponsoring local educational projects to donations to environmental and education-focused charities, such as the Arkwright Foundation. Since its establishment in 2011, the DS Smith Charitable Foundation has donated over £2 million to causes aligned with our Purpose. DS Smith manages more packaging for recycling than it makes, meaning we are a net recycler of packaging. We have testing environmental targets so that we continue to improve our impact on the environment.Read more on page 30
Governments and non-governmental organisationsWe engage in detailed consultation with governments to promote efficient fibre recycling and the acceleration of the circular economy, and we participate in industry organisations to combine our influence. We take a leadership role with relevant non-governmental organisations, such as our global partnership with the Ellen MacArthur Foundation. We are engaging with leading ESG organisations such as the Science Based Targets initiative to set meaningful and ambitious goals around our carbon emissions.
Our stakeholdersOur strategic goals are aligned with the requirements of all our stakeholders, so that we are delivering for all.
A sample of the talented women across DS Smith who shared their career stories as part of our International Women’s Day celebration in March 2021.
Annual Report 2021 dssmith.com 3
STRATEGIC REPORT

Our business model overview
Insight Innovation
Design
Manufacturing
Our resources• Our people and
values• Manufacturing and
other physical assets
• Our relationships • Intellectual capital• Financial capital• Natural capital
What we do The value we create• Satisfied customers• Packaging that is sustainable• Returns to our capital providers• Safety and opportunities for our
people• Leadership in sustainability• Community involvement
Find out more on page 16
At a glance
PackagingWe are a leading international sustainable packaging company, delivering innovative corrugated products with a high quality service across Europe and North America. Our product portfolio includes packaging for consumer products, e-commerce, promotion, transit and industrial packaging.We partner with customers to provide innovative packaging solutions. Not only do we help specify packaging solutions to generate more sales, but we do so while ensuring lower cost and meeting performance criteria. We complement our product range with consultancy services on supply chain optimisation and creative design.Our packaging is fully sustainable and made from largely recycled and/or recyclable material, which means the packaging we produce helps our customers to achieve their own sustainability targets. Our corrugated packaging is typically produced within c. 200km of its destination due to the requirements for just-in-time delivery and the increased focus on sustainability.c. 24,000 employeesc. 8.8 billion m2 corrugated board sold in 2020/21
PaperWe are a leading international manufacturer of corrugated case material (CCM), which is the paper used for conversion into corrugated board. We also manufacture some specialist paper grades such as plasterboard liner. DS Smith is overall ‘short paper’, meaning we are a net buyer of paper for our packaging requirements. We operate a paper sourcing platform that ensures we procure the paper that is right for our customers’ packaging. We determine whether we make or buy our required paper, and then we sell some of our paper output. Paper is readily transportable and is traded globally, so in some cases it is more efficient to sell our paper and buy in other regions, depending on local pricing.We operate 14 CCM paper mills, 12 in Europe and two in the US. Of those, two are kraftliner (virgin paper) mills (one in the US, one in Europe) and the remainder are principally dedicated to the production of recycled CCM (testliner). We also have two small mills in Europe producing specialist paper grades. Fibre for our testliner is principally sourced from our own recycling operations.c. 4,000 employeesc. 4.6 million tonnes CCM produced in 2020/21
RecyclingWe provide a full recycling and waste management service, ranging from simple recycling collections through to full recycling and waste management solutions, which help us take responsibility for the collection of used packaging.We are Europe’s largest cardboard and paper recycler and are also one of the leading full service recycling and waste management companies in Europe. We collect quality paper and cardboard for recycling from a range of sectors, including retailers, manufacturers, local authorities, and other recycling and waste management companies. The used paper and board we collect provides cost efficient raw material for the Group’s recycled paper making processes. We also sell used fibre to third parties globally.c. 1,000 employeesc. 6 million tonnes fibre managed in 2020/21
We have created a circular business focused on sustainable packaging.
4
OUR BUSINESS
Where we operateOur business operates in four geographic segments, three in Europe and one in North America.
Northern Europe£2,370m2020/21 revenue
c. 11,000 employeesBelgium, Denmark, Finland, Germany, Netherlands, Norway, Sweden, Switzerland and United Kingdom
Southern Europe£2,156m2020/21 revenue
c. 9,000 employeesFrance, Italy, Portugal and Spain
Eastern Europe£909m2020/21 revenue
c. 7,000 employeesAustria, Bosnia-Herzegovina, Bulgaria, Croatia, Czechia, Estonia, Greece, Hungary, Latvia, Lithuania, Macedonia, Poland, Romania, Serbia, Slovakia, Slovenia and Turkey
North America£541m2020/21 revenue
c. 2,000 employeesUnited States
We also have offices in India and China, where we offer sourcing and consultancy services, and a packaging sales site in Morocco.
Annual Report 2021 dssmith.com 5
STRATEGIC REPORT

The changing relationship with packagingOver the past year, we have seen an acceleration of the ongoing structural changes in the packaging market driven by the evolving consumer relationship with packaging. New technologies, customer demands and external pressures like Covid-19 and climate change are all aligning to reshape shopping behaviours with an increased focus on areas such as e-commerce, health and wellbeing and a continued prioritisation on sustainable packaging.As we enter recovery, research shows that many of the online shopping habits European consumers adopted over lockdown are here to stay. This, together with changing demographics, access to fast broadband, advances in artificial intelligence and improvements in delivery infrastructure, will surely contribute to continued fast growth in 2021 and beyond.Products being over-packaged or delivered in non-recyclable materials can lead to strong criticism, complaints, and active public debate. Plastics are perceived to be the least sustainable form of packaging and brands, retailers and food producers are increasingly looking for more sustainable alternatives. With European consumers planning to continue or increase buying groceries online (62 per cent) and home meal kits (49 per cent)1, we have responded to the challenges of these segments by partnering with TemperPack to introduce ClimaCell®, a sustainable thermal insulation barrier for temperature-sensitive goods such as meal kits, perishable groceries and medical products.While leveraging the convenience of these new delivery channels, consumers continue to prioritise sustainable packaging. Almost a third (29 per cent) have stopped buying from particular brands because their packaging was not sustainable, with half (48 per cent) of online shoppers saying that they have experienced ‘unsustainable packaging’2. It is not just sustainability that has increased in importance. Awareness of the hygiene and food safety of packaging has also significantly shifted, with 71 per cent of respondents in the US more concerned than prior to the pandemic3. While there is no evidence of virus transfer from cardboard, we partnered with Touchguard to develop a new range of bacteria and virus-safeguarded sustainable cardboard packaging. The easily identifiable touch-safe zones can be applied at scale across a range of industries and applications.
1. DS Smith and OnePoll, 2020.2. Ipsos MORI and DS Smith, Sustainable Packaging – Did Covid-19 change everything?, 2020.3. McKinsey Packaging Survey (2020).
48%European shoppers have experienced ’unsustainable packaging’
29%European consumers have stopped buying from a particular brand because their packaging was unsustainable
6
REDEFINING PACKAGING FOR A CHANGING WORLD
Annual Report 2021 dssmith.com 7
STRATEGIC REPORT

8
REDEFINING PACKAGING FOR A CHANGING WORLD
Helping customers meet their biggest challengesWhile consumers’ relationships with packaging has undeniably changed, so too have the needs of our customers and the challenges they have faced. We have responded with tailor-made solutions that helped our customers respond to trends such as increased e-commerce demand or the need for more sustainable packaging. We continue to help new and existing customers navigate this period of uncertainty through security of supply, quality and innovation.As is often the case, adversity encourages innovation and many companies saw real opportunity around e-commerce driven by unprecedented demand. Since summer 2020, more than 85,000 UK businesses including farms and restaurants have launched online stores selling directly to their local communities and beyond. This has necessitated interactions with a raft of new customers designing supply chains for the first time. Through our ePack online platform, we have helped small and medium-sized businesses make this transition to ensure they can continue trading and delighting their consumers.It is not just small brands that have had to adapt to changing consumer behaviours. To respond to increasing demand during the pandemic, food retailer Delhaize and DS Smith worked together to introduce an automated box erecting machine to ensure efficient delivery to homes and shops across Belgium.We have worked hard to continue innovating with our customers to respond to these trends, transforming our sustainability and innovation workshops through new digital platforms. By launching ‘Impact Centre Online’, we are working directly with our customers to develop the next generation of e-commerce packaging, implement new sustainable design principles and develop alternatives to problem plastics.Meanwhile, alongside ongoing calls from consumers for sustainable packaging, by taking a leadership role in alliances such as 4Evergreen, we are supporting plans to increase the 84 per cent fibre-based packaging recycling rate in Europe to 90 per cent by the end of the decade. This can only be achieved through innovative collaboration between the packaging and recycling supply cycle – by working together to deliver innovation from product design through to collection and recycling systems infrastructure. This is particularly important as more packaging ends up in people’s homes. And this is why our circular approach is so important. By thinking differently and working closely with our customer Laithwaite’s Wine, DS Smith has closed the loop on over 1,000 tonnes of cardboard packaging, ensuring materials are kept in the supply cycle for as long as possible, while maximising value.
“We continue to help new and existing customers navigate this period of uncertainty through security of supply, quality and innovation.”
Annual Report 2021 dssmith.com 9
STRATEGIC REPORT

1. United Nations Development Programme, People’s Climate Vote, 2021.2. The Ellen MacArthur Foundation, Completing the Picture: How the Circular Economy
Tackles Climate Change (2019).3. DS Smith and OnePoll, 2021.
46%Europeans want to use more cardboard or paper-based packaging, rather than plastic-based packaging
54 millionUnits of plastic replaced in the year
Leading the transition to the circular economy
Today, we face huge challenges to mitigate the effects of climate change and achieve agreed climate targets, with a 2021 UN poll suggesting that two-thirds of people want action against climate change1. By improving circularity of resources, as well as decarbonising energy production, business and society can work together to lead a step change in sustainable business.Greenhouse gas emissions are not falling quickly enough to achieve climate targets. According to the Ellen MacArthur Foundation, a switch to renewable energy can only cut them by 55 per cent, which means a further 45 per cent of the target must be tackled through better adoption of a circular economy2. At DS Smith, our Purpose of ‘Redefining Packaging for a Changing World’ is reinforced by our robust circular business model. Our products are made from renewable resources and once our paper and cardboard has been used it can be recycled up to 25 times.DS Smith’s new sustainability strategy, Now and Next, allows us to move beyond just having a strong circular business model ourselves to delivering more circular solutions for our customers and wider society – replacing problem plastics, taking carbon out of supply chains and providing innovative recycling solutions.Almost half of Europeans (46 per cent) say they want to use more cardboard or paper-based packaging rather than plastic-based packaging, and almost a third of European shoppers say they have stopped buying particular brands altogether because their packaging was not sustainable3. With over 700 packaging designers developing thousands of packaging specifications every year, we are helping our customers to create circular alternatives.Through our circular design principles, brands can keep materials in use, design out waste so that it is easier for consumers to reuse and recycle packaging, and regenerate natural systems. Moreover, we have been working to reduce plastic packaging by innovating in sectors where sustainable fibre-based packaging can make a big difference in reducing plastic use. Through partnerships, such as Aquapak and MULTIVAC, we have extended our ability to tackle ‘hard to recycle’ plastics and we’ve developed over 650 designs focused specifically on plastic replacement – with over 54 million units of plastic replaced in the year alone.As companies embrace sustainable packaging, there is an opportunity to make significant progress against their environmental and social responsibilities while also responding to changing consumer behaviours in light of Covid-19.
10
REDEFINING PACKAGING FOR A CHANGING WORLD
Annual Report 2021 dssmith.com 11
STRATEGIC REPORT

Led by our Purpose and to achieve our vision to be the leading supplier of sustainable packaging solutions, Now and Next is our new sustainability strategy that sets out how we will tackle the sustainability challenges we are facing today, as well as those that will impact future generations.
NOW
By 2021, we will train 100 per cent of our designers on Circular Design Principles By 2023, we will manufacture 100 per cent reusable or recyclable packaging
By 2025, we will optimise fibre use for individual supply chains in 100 per cent of our new packaging solutions
By 2025, we will take one billion pieces of problem plastics off supermarket shelves, take 250,000 lorries off the road and work with partners to find solutions for ‘hard to recycle’ packaging
By 2025, we will engage 100 per cent of our people on the circular economy
We work with customers to design circular packaging solutions that achieve more from less, delivering for rapidly changing consumer lifestyles with minimum impact on the world around us.
Managing water responsibly• By 2021, all sites in current or future
water stressed areas will have a mitigation plan in place
• By 2025, achieve zero non-conformances with consents to discharge
• By 2030, all paper mills to operate at or below internal benchmark rates for water consumption
Sending zero waste to landfill• By 2030, send zero waste to landfill
Sourcing sustainably• By 2025, ensure that 100 per cent of our
suppliers comply with our sustainability standards
• By 2025, we will measure and improve biodiversity in our own forests
• Maintain that 100 per cent of the papers we purchase are recycled or chain of custody certified each year2
• Maintain that 100 per cent of relevant sites are FSC certified each year3
Contributing to our communities• By 2025, launch 100 biodiversity
projects across Europe and North America
• By 2025, all of our paper mills will run a biodiversity programme in their local community
Now and Next strategy
Closing the loop through better
design
Protecting natural resources by
making the most of every fibre
Reducing waste and pollution
through circular solutions
Equipping people to lead the transition
to a circular economy
Our focus is on:
We will continue to:Drive carbon reduction
Care for forests and their biodiversity
By 2025 we will protect forests and enhance biodiversity wherever we operate
By 2030 we will reduce our CO2 emissions by 30 per cent per tonne of production against a 2015 baseline
Maintain that 100 per cent of in-scope sites are ISO 50001 certified each year1
Now and Next sustainability strategy
12
REDEFINING PACKAGING FOR A CHANGING WORLD
NEXT
By 2030, we aim for all of our packaging to be recycled or reused and to pilot 20 new business models for improving post-consumer waste quality and recycling rates
By 2030 we are aiming to optimise every fibre for every supply chain
By 2030 our aim is to use packaging and recycling to enable the circular economy by replacing problem plastics, reducing customer carbon and eliminating consumer packaging waste
By 2030 we will engage five million people on the circular economy and circular lifestyles
Alignment with international frameworksWe support several international frameworks:• United Nations Global Compact• United Nations Declaration of Human Rights and the
Convention on the Rights of the Child
• International Labour Organization Eight Fundamental Conventions
• Organisation for Economic Co-operation and Development Guidelines for Multinational Enterprises.
For more information, see our latest Sustainability Report.
Increasing our ambition on climate changeWe have announced new climate targets, including a commitment to reach Net Zero emissions by 2050 and a science based target for 2030, which requires at least a 40 per cent reduction of CO2 emissions per tonne of product compared to 2019. Turn to pages 30 and 31 to learn more.
We will work together with partners to develop fully circular strategies, from design to production and supply to recycling, creating positive impact packaging for our changing world.
Responsible Consumption and Production: we keep materials in use for longer, reduce waste and pollution and protect natural resources.
How we contribute to the Sustainable Development GoalsThe UN Sustainable Development Goals (UN SDGs) are an ambitious plan to create a better world by 2030.Although we impact many of the goals, we have identified four that are most relevant to our business and where we can make a significant contribution:
Climate Action: we reduce our emissions to combat climate change and its impacts.
Life on Land: we minimise our use of sustainably sourced fibre, protecting and restoring ecosystems.
Decent Work and Economic Growth: we commit to being a responsible employer, underlining our ethical, labour and employment standards.
• Maintain that 100 per cent of our sites are engaged in community programmes each year4
Respecting human rights• By 2022, we will conduct a human rights
risk assessment
Find out more online at www.dssmith.com
People are the foundation of our success and we prioritise their health, safety and wellbeing and contribute to our communities
1. Includes sites accounting for at least 90 per cent of overall Group energy consumption.2. Includes certification to controlled wood standard as a minimum.3. Includes Packaging, Paper and Paper Sourcing sites that trade or manufacture products
derived from timber.4. Includes sites with greater than 50 employees.
Annual Report 2021 dssmith.com 13
STRATEGIC REPORT

I am delighted to have joined the Board as your new Chairman, and it has been a pleasure getting to know the business, albeit virtually in most instances. I have been very impressed with the commitment of the people I have met, and look forward to meeting many more as lockdown and travel restrictions progressively ease.
A year of challenge and progressOur Purpose of ‘Redefining Packaging for a Changing World’ has never been more relevant in a year that has presented significant challenges for society at large from the Covid-19 pandemic. As a packaging provider we have continued to operate throughout, thanks to the dedication and commitment of our people, as we are integral to the food and medical supply chain and classified as an essential industry. We have long been committed to fast moving consumer goods (FMCG) and e-commerce customers and we have seen very strong growth within e-commerce from an accelerated change in shopping habits and an evolving retail environment.
Covid-19Throughout the year, we have been guided by our values and core priorities: firstly, to the health and wellbeing of our people; and secondly, to serving our customers. Our people have responded magnificently, adapting ways of working where needed. This has enabled us to continue to serve our customers, ultimately getting food and other vital supplies to consumers around Europe and beyond. I would particularly like to thank my colleagues who have worked so hard throughout such a challenging period, whether coping with health issues or anxieties for themselves or their families, or the strains that the various restrictions have placed on us all. Thank you.
PerformanceVolumes have been resilient throughout the year, dipping only modestly in the first half of the year as activity among our industrial customers temporarily fell, and accelerating
considerably in the second half of the year, driven by solutions for e-commerce customers in particular. Volumes from our bedrock of FMCG customers remained solid throughout. Covid-19 restrictions resulted in significant volatility in various input costs, including used fibre, impacting profitability. I am delighted to see the improved performance from our US business, as we begin to see the benefit of the Indiana site develop and market conditions improve. While it has been a challenging year, we are well placed to benefit from the accelerated, long-term growth drivers of e-commerce and sustainable solutions. We have consistently invested in these key areas over many years in anticipation of the growth which is now playing out as expected, with e-commerce in particular accelerated by Covid-19. That investment has taken the form of designers, technicians and equipment, resulting in a range of both e-commerce products and services, so that our packaging adds value in the e-commerce supply cycle. Looking ahead, we are investing further in new packaging sites in Italy and Poland. These sites will provide capacity to allow us to take advantage of the customer demand and growth in these regions and we are confident in the returns they will deliver. Health and safety is of paramount importance to us, and I am very pleased to note that we have continued our long-term trend of improvement, with the accident frequency rate, our headline measure for health and safety, declining by 14 per cent compared to last year, the 12th year of improvement in a row.
SustainabilitySustainability is at the heart of our business, both in how we operate and as an opportunity for growth. In the year, we launched an ambitious new sustainability strategy, Now and Next, focused on the circular economy, taking us to 2030, and we have committed to setting further, more challenging science-based targets in relation to carbon reduction, in line with the Paris Agreement. We are engaging with stakeholders, particularly customers and investors, on the topic of sustainability and ESG
Chairman’s statement
“Our Purpose of ‘Redefining Packaging for a Changing World’ has never been more relevant in a year that has presented significant challenges for society at large from the Covid-19 pandemic. As a packaging provider we have continued to operate throughout, thanks to the dedication and commitment of our people.”Geoff Drabble, Chairman
14
Engaging with stakeholders: Section 172 statementThe Board aims to promote the success of the Company for the benefit of its shareholders as a whole, taking into account the long-term consequences of its decisions and looking at those decisions through a variety of lenses. This involves the Board and management considering in detail and discussing the interests of the Company’s stakeholders, including our people, our customers, our investors, local communities and non-governmental organisations and our suppliers; the importance of maintaining our reputation for high standards of business conduct; and the environment. More information about our stakeholders is set out on page 3. Examples of what that has looked like in practice over the past year are summarised below. In the governance section of this Annual Report we use s172 to highlight the examples referred to below:
Stakeholder Strategic Report Governance
Our people Pages 3 and 27 (engagement and feedback), 28 (decisions made in consultation with employees), 25 (engagement on health and safety), 28 (global recognition programme)
Pages 68 (engagement with our workforce), 67 (involvement in virtual onboarding), 69 (induction site visits), 68 (EWC meetings and EWC representative attending Remuneration Committee meetings and Remuneration Committee Chairman attending EWC Executive meeting)
Our customers Pages 3 (engagement), 9 (collaboration) Page 68 (engagement with our customers via updates from sales, marketing and innovation functions)
Our investors Page 3 (engagement) Pages 67 (engagement with our shareholders)
The environment and communities
Pages 3 (engagement and charitable giving), 32 (engagement with ESG rating agencies)
Pages 67 (discussion of environmental impact assessments), 68 (engagement with other stakeholders including briefing on community engagement)
Governmentsand non-governmentalorganisations
Page 3 (engagement) Page 68 (engagement with other stakeholders including the Ellen MacArthur Foundation)
Our suppliers Page 3 (engagement and supplier standards) Page 68 (engagement with our suppliers via updates from Group procurement)
This statement is made in conformity with the requirement to explain how directors fulfil section 172 of the Companies Act 2006.
more widely, more than ever, as their interests and requirements grow, and we are taking a leadership position in the debate, in collaboration with the Ellen MacArthur Foundation, as the only packaging business that is a global strategic partner.
The BoardI would first like to thank the outgoing Chairman, Gareth Davis, on behalf of the Board and the Company, for his tireless service as Chairman over the past nine years. He has championed the strategy taken by the management team and seen the business through some transformative acquisitions, with the Company now past its third anniversary of being in the FTSE 100. His enthusiasm, commitment and wise counsel will be missed. On 1 May 2020, Alina Kessel was appointed to the Board as a Non-Executive Director, and Chris Britton stepped down at our 2020 AGM. I would like to welcome Alina and thank Chris for over seven years of service.
DividendThe Board considers the dividend to be a very important component of shareholder returns and it is integral to our capital allocation policy of delivering a return to shareholders while maintaining a robust balance sheet with the flexibility for re-investment in projects expected to deliver returns in our return on capital range, in the medium term. We have a longstanding capital allocation and dividend policy of paying a dividend with cover of 2.0 – 2.5 times to adjusted EPS. Having taken the prudent
decision to pause dividends in 2019/20 at the peak of the Covid-19 crisis, due to the uncertainty created by restrictions on activity, I am very pleased to be able to resume payment this year. In respect of 2020/21, we paid an interim dividend of 4.0 pence and propose a final dividend of 8.1 pence, together 12.1 pence, representing a cover of 2.0 times, in line with our policy.
OutlookOn behalf of the Board, I would like to welcome colleagues who have joined DS Smith during the year and to thank everyone for their commitment and hard work. The continued investment in our business, together with the strong support of our customers and the momentum built over recent quarters, give us confidence for the current year and future. Whilst the business has seen reduced profitability over the last twelve months, we firmly believe that we exit 2020/21 stronger, further focused on the accelerated opportunities a post Covid-19 world offers and that our customers will continue to recognise this going forward. The current year has started well, with the volume momentum of the final quarter of FY21 continuing into this year. Inflationary cost pressures have also continued, in particular old corrugated cases, but also other costs such as energy, transport and labour. Packaging prices have started to increase and we expect to fully recover these increasing costs. Accordingly, while there remains uncertainty in the overall economic environment, demand is strong and we expect to make good progress this year.
Annual Report 2021 dssmith.com 15
STRATEGIC REPORT

To be the leader in sustainable packaging solutionsOur business model is focused on value-adding corrugated packaging and supported by upstream paper production and recycled paper collection.
Our relationships and resourcesOur people and valuesWe employ around 29,000 people globally and develop them so they can realise their potential. Our values and management standards guide how we operate.
Manufacturing and other physical assetsWe have an extensive network of packaging manufacturing sites, paper mills, recycling depots and innovation centres, supported by the infrastructure of the countries in which we operate.
Our relationships We interact in a way consistent with our corporate values to build and maintain trusted relationships with our customers, suppliers and communities.
Intellectual capitalWe have substantial customer understanding, innovation and patented designs.
Financial capitalWe are funded by a combination of shareholder equity, debt and reinvested cash flow.
Natural capitalWe operate a circular model through the recycling of natural material, in particular wood fibre.
1. InsightWe work with leading fast moving consumer goods (FMCG) brand owners, major retailers and industrial companies. This breadth of interaction means that we have considerable knowledge of how changing consumer, retail and regulatory trends affect the use of packaging. We use this insight to inform our innovation.
2. Innovation Our Impact Centres are where we showcase our insight and our designers partner with customers to create inspiring, innovative packaging solutions. Best practice is shared across all our regions.We are also innovators in the use of light-weight corrugated board. Our proprietary technology to test the strength of corrugated board as it is manufactured means we can use the optimum paper weight required.
Our circular business model
How we create value
OCC: old corrugated cases, i.e. used corrugated board, a feedstock for recycled paperCCM: corrugated case material, the paper used to form corrugated board
Corrugated packaging
Paper manufacturing
Recycling
CustomersRetailers
Consumers
CCMPaper is converted
into corrugated board and then into
packaging
Used packagingUsed packaging is collected and brought to our recycling facilities
BoxesPackaging is used by our customers,
retailers and consumers
OCC and recovered fibreOCC and recovered fibre is converted into paper again
16
OUR BUSINESS MODEL
The value we createSatisfied customersWe develop packaging that helps our customers sell more, reduce costs, manage risks and become circular-ready.
Packaging that is sustainable Our packaging is usually fully recyclable and made from largely recycled material. We recycle more packaging than we produce.
Returns to our capital providers Investors benefit from strong operational and financial performance.
Safety and opportunity for our people We aim to create equality of opportunity for people to grow and develop throughout their career in a safe working environment.
Leadership in sustainability We are leading the debate on packaging sustainability through our engagement with major organisations such as the Ellen MacArthur Foundation.
Community involvement We have an active programme of community involvement in addition to satisfying a societal need for recyclable packaging.
3. DesignUsing our network of designers and PackRight Centres, we create packaging that fulfils our customers’ requirements for all stages of the primary product’s journey, whether improving protection in transit, ease of identification in the supply cycle, or presenting the primary product to maximise sales.
4. ManufacturingOur paper mills manufacture corrugated case material (CCM) and our corrugated plants convert CCM into corrugated board, then print, cut and pre-glue the boxes, which are then shipped flat on pallets, ready for assembly and filling at our customers’ factories. We maximise the efficiency of our manufacturing, for example, using light-weight papers where possible to reduce the cost and carbon impact of the packaging produced.
Our differentiators Market drivers
Scale
Innovation
Sustainability and circular economy
Responding to retail channel changes
E-commerce
Sustainability
See more on pages 18 and 19
Annual Report 2021 dssmith.com 17
STRATEGIC REPORT
Our differentiation and market drivers
DifferentiatorsScaleOur packaging and paper operations cover 34 countries
giving the widest coverage of any packaging company across Europe. We have around 29,000 employees and over 300 manufacturing sites, including our growing operations in the US.Our footprint matches our customers’ requirements. Our large customers are multinational, so require a global, consistent approach to their packaging. For example, over 50 per cent of our boxes are for customers served in more than one country. Customers are increasingly looking for closer partnership with their suppliers and need to work with fewer, more sophisticated suppliers. Our people have a deep understanding of our customers as a result of working closely with them over many years. Our understanding around emerging trends and creativity to design innovative, sophisticated packaging that solves our customers’ challenges, helps us to develop our relationships further by extending the ranges, categories and services we provide. As a demonstration of this success, our average rate of box volume growth among large customers has been over 10 per cent over the last three years, considerably ahead of Group volume growth.
InnovationDS Smith is a leader in packaging innovation, with c. 700
designers and innovators. Through our network of innovation hubs, nine Impact Centres, and 42 PackRight Centres, supported by designers at our manufacturing sites, we work collaboratively with customers to solve their challenges. To offer a more flexible approach we have created an enhanced customer experience through virtual collaboration. Innovation is delivered by DS Smith and then applied across our wide customer base. Examples of innovation are performance packaging and ParceLive.Our packaging is vital to keep supply chains running, meet the complex needs of our customers and ensure that each valuable product is making it safely to its destination. With supply chains becoming more integrated and demanding, we strive to maximise the performance of our packaging, such as strength, while reducing costs and the amount of material used.
By using performance as the basis of supply, we provide packaging that delivers a certain performance rather than being specified by the weight of paper used. Our industry-first science-based optimisation programme PACE™ (Performance, Assurance, Consistency & Environmental excellence) enables us to guarantee performance. Using proprietary technology, we measure the board strength throughout the process to optimise the use of fibre. We analyse the supply chain challenges to define the right specification and deliver cost, efficiency and carbon savings for our customers. Other innovation includes ParceLive, an advanced multi-sensory tracker allowing us to record real-time data linked to every touchpoint along the supply chain.Advising global brands, we engage early in their product development process. This includes providing design input on the development of their primary packaging with a focus on sustainability and circularity, efficiency and brand consistency throughout all the packaging touchpoints.
Sustainability and circular economySustainability is at the heart of our offering and our circular
business model delivers corrugated packaging made from renewable resources that are recyclable in our closed loop systems. Through this approach we keep valuable materials in use for longer, reducing waste. By prioritising recycled papers and championing responsible forest management, we help protect our natural resources and create value for our customers. As our customers set ambitious sustainability targets and consumers demand more sustainable packaging, we can help our customers to get ready for the circular economy. The decisions we make during the packaging design stage can have a domino effect on cost, carbon and other environmental efficiencies in supply chains. Our Circular Design Principles are a key tool for our designers to protect brands and products, not use more materials than necessary, design for supply cycle efficiency, design to keep materials in use and find a better way by always challenging the status quo.
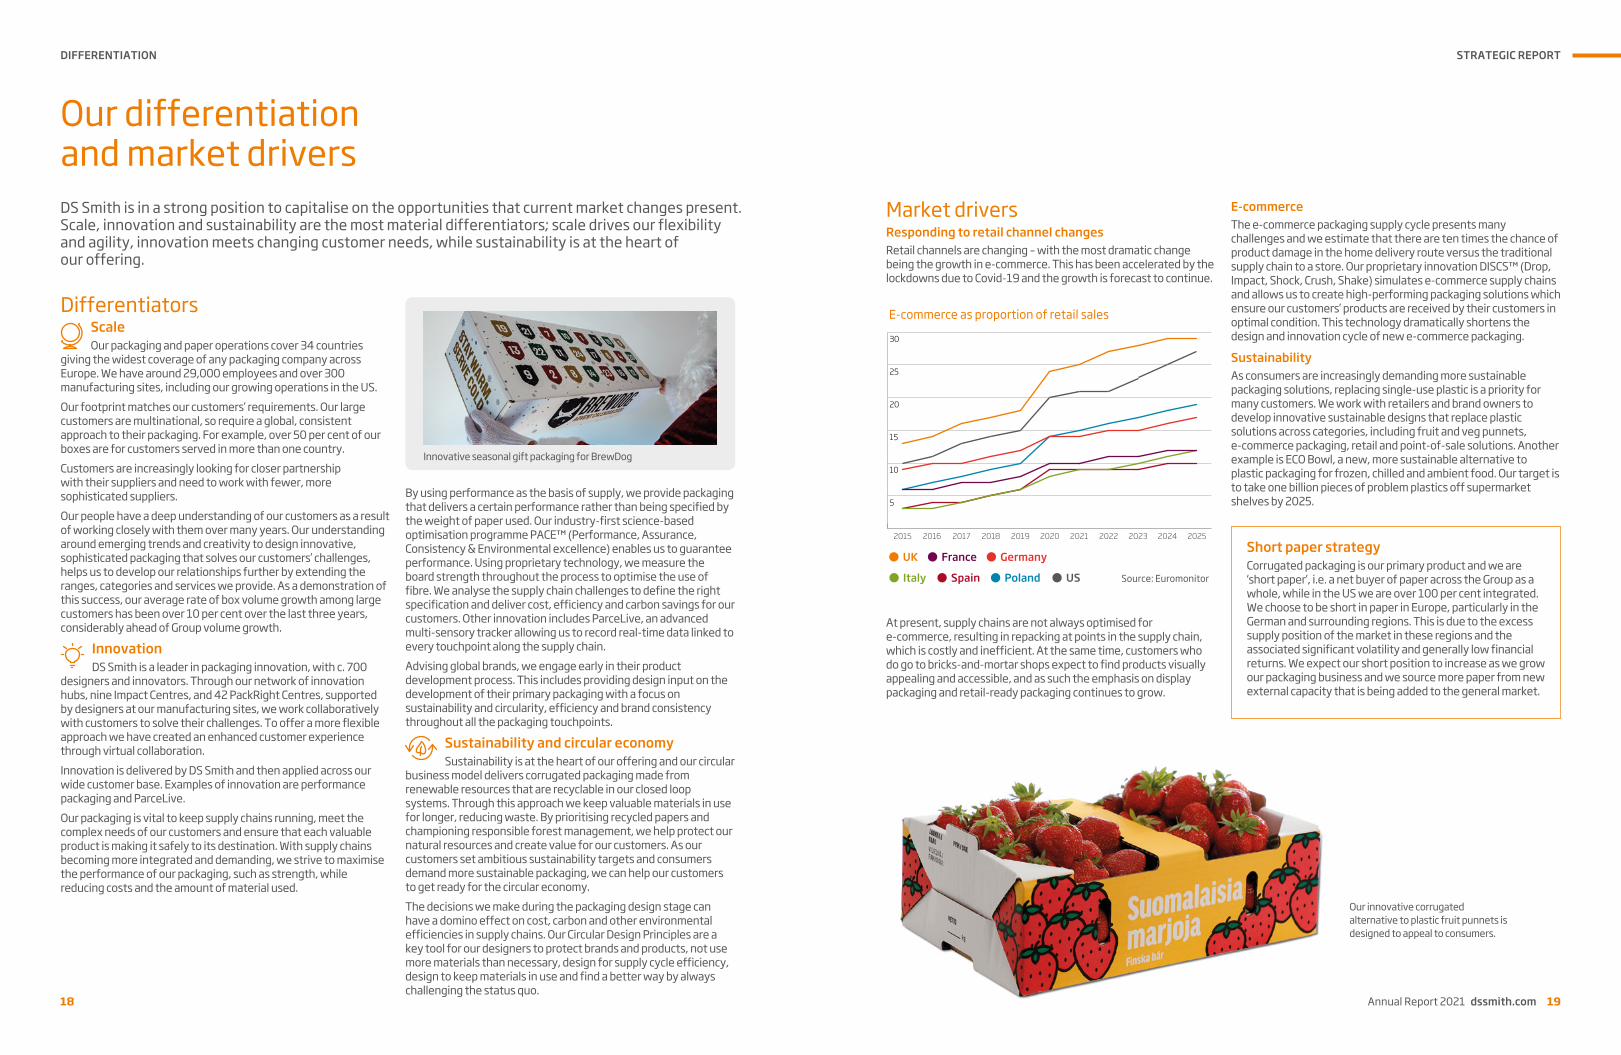
DS Smith is in a strong position to capitalise on the opportunities that current market changes present. Scale, innovation and sustainability are the most material differentiators; scale drives our flexibility and agility, innovation meets changing customer needs, while sustainability is at the heart of our offering.
Innovative seasonal gift packaging for BrewDog
18
DIFFERENTIATION
5
10
15
20
25
30
20252024202320222021202020192018201720162015
E-commerce as proportion of retail sales
Source: Euromonitor
UK France Germany
Italy Spain Poland US
Short paper strategyCorrugated packaging is our primary product and we are ‘short paper’, i.e. a net buyer of paper across the Group as a whole, while in the US we are over 100 per cent integrated. We choose to be short in paper in Europe, particularly in the German and surrounding regions. This is due to the excess supply position of the market in these regions and the associated significant volatility and generally low financial returns. We expect our short position to increase as we grow our packaging business and we source more paper from new external capacity that is being added to the general market.
Market driversResponding to retail channel changesRetail channels are changing – with the most dramatic change being the growth in e-commerce. This has been accelerated by the lockdowns due to Covid-19 and the growth is forecast to continue.
E-commerceThe e-commerce packaging supply cycle presents many challenges and we estimate that there are ten times the chance of product damage in the home delivery route versus the traditional supply chain to a store. Our proprietary innovation DISCS™ (Drop, Impact, Shock, Crush, Shake) simulates e-commerce supply chains and allows us to create high-performing packaging solutions which ensure our customers’ products are received by their customers in optimal condition. This technology dramatically shortens the design and innovation cycle of new e-commerce packaging.
SustainabilityAs consumers are increasingly demanding more sustainable packaging solutions, replacing single-use plastic is a priority for many customers. We work with retailers and brand owners to develop innovative sustainable designs that replace plastic solutions across categories, including fruit and veg punnets, e-commerce packaging, retail and point-of-sale solutions. Another example is ECO Bowl, a new, more sustainable alternative to plastic packaging for frozen, chilled and ambient food. Our target is to take one billion pieces of problem plastics off supermarket shelves by 2025.
Our innovative corrugated alternative to plastic fruit punnets is designed to appeal to consumers.
At present, supply chains are not always optimised for e-commerce, resulting in repacking at points in the supply chain, which is costly and inefficient. At the same time, customers who do go to bricks-and-mortar shops expect to find products visually appealing and accessible, and as such the emphasis on display packaging and retail-ready packaging continues to grow.
Annual Report 2021 dssmith.com 19
STRATEGIC REPORT

Q How has DS Smith continued to adapt to Covid-19?
I am extremely proud of the commitment, professionalism and flexibility of our employees over the past year, keeping all our plants operational and responding to our customers’ needs throughout the period. We invested significantly to ensure that we had the right procedures in place to ensure the wellbeing and safety of every one of our employees. Meanwhile, in spite of the pandemic, we have maintained our track record of winning market share through our fibre-based offering focused on fast moving consumer goods (FMCG) and e-commerce customers, with growth across our largest customers, in particular, continuing. Our US business has seen good underlying progress over the past year, reflecting the recent investment in our new plant in Indiana and the award of a number of significant supply contracts from major FMCG companies.
Q E-commerce has grown significantly as a result of the pandemic, how is DS Smith leveraging this opportunity?
Covid-19 has accelerated some of the trends we were seeing previously, including the growth in e-commerce and demand for sustainable packaging. As we enter recovery, we believe we will see a continued structural change in how people shop and live. With much of this growth in e-commerce expected to be permanent, DS Smith is well positioned as the leading provider of e-commerce packaging in Europe to benefit, having invested in innovation and development in this market segment for many years.
“Our Purpose, ‘Redefining Packaging for a Changing World’, has never been more apt and we are well positioned to capitalise on a dynamic global environment.”Miles Roberts, Group Chief Executive
Q You have launched a number of partnerships over the past year, why?
Innovation is a critical part of our strategy and as we reinforce our position as the leading provider of sustainable packaging solutions, we have worked closely with a number of partners over the past year to further expand our offering. Examples of our partnerships include ClimaCell®, which offers a replacement for plastic cool chain with 100 per cent recyclable options, as well as Touchguard, who we have worked with to develop anti-microbial packaging to provide an additional layer of protection across the value chain.
Q How is DS Smith driving forward its commitment to the circular economy?
Our Now and Next sustainability strategy positions DS Smith at the forefront of the packaging industry and sets a clear roadmap to address immediate challenges, while also working to meet the needs of the next generation by creating solutions that are aligned with the principles of the circular economy. By taking a whole systems approach, we have an opportunity to make significant progress against our environmental, social and governance responsibilities.Meanwhile, our business model is inherently circular and our box-to-box model in 14 days is representative of our commitment to this and we continue to manage more recycling than we put on the market.
Q Carbon reduction is a key area of focus globally, what is DS Smith doing to respond?
Over the past five years, DS Smith has achieved a 23 per cent reduction in carbon emissions per tonne of production of our
Q&A: Delivering circularity
20
GROUP CHIEF EXECUTIVE’S INTERVIEW
historic target of a 30 per cent reduction by 2030. However, we recognised that we must go further. As a manufacturing business, this has to include decisions on which technologies to invest in at what time to ensure maximum reduction of carbon per pound of investment. I am therefore delighted to announce our commitment to a science-based target by 2030 and Net Zero by 2050, which will support our production of fully renewable and recyclable packaging. To further underline our ambition, we have also joined the UN’s Race to Zero.However, in addition to our carbon commitments it is also critical to consider our wider impact. Following the launch of our Purpose, ‘Redefining Packaging for a Changing World’, in 2019, we recognised there was a gap between our ambition and our existing nine long-term sustainability goals and hence our Now and Next sustainability strategy was launched in 2020. The strategy sets out four key pillars, alongside a continued commitment to reduce CO₂ emissions and care for forests and biodiversity wherever we operate. The key areas of the strategy will drive sustainable growth at DS Smith, including a focus on closing the loop through better design; protecting natural resources by making the most of every fibre; reducing waste and pollution through circular solutions; and equipping people to lead the transition to a circular economy. We will be measuring our progress towards these goals, holding ourselves accountable to our stakeholders through regular indices and processes like the Ellen MacArthur Foundation Circulytics benchmark.
Q DS Smith recently announced two new greenfield sites in Poland and Italy, why are you expanding in these regions?
We announced plans to expand packaging production through investment in two new, state-of-the-art facilities in Poland and Italy, which will provide a platform for organic growth in the regions. The facilities will deliver cutting-edge manufacturing technology, innovation and sustainable performance. The investments follow significant growth over the past three years in these markets and support DS Smith’s ambitious plans for organic growth. We see good returns from investing in growth markets, and we are financing it through the organic cash flow.
Our strategyOur strategy is based on balancing the requirements of our core stakeholders:
To delight our customers
How we engage with customers
See more on page 22
To realise the potential of our peopleHow we engage with our people
See more on page 24
To lead the way in sustainabilityHow we engage
with societySee more on page 30
To double our size and profitabilityHow we engage with
our investorsSee more on page 34
Q 2020/21 has seen continued volume growth. How have you achieved this in challenging market conditions?
Innovation is a critical part of our strategy and our long-term strategic direction focused on FMCG and consumer markets, embracing e-commerce and technology-based solutions, has been accelerated by consumer trends resulting from the pandemic. The business has continued to grow volumes despite challenging macro-economic conditions. Corrugated box volumes have grown progressively throughout the financial year with the second half achieving a volume increase in excess of 8 per cent over the comparative period last year.
Q Can you explain what you are doing to make progress in the area of diversity and inclusion?
We recognise that diversity is key to our continued success. Creating a diverse and inclusive culture is core to our values and Purpose. I am pleased with the progress we have made in this area over the past year, which includes the expansion of our diversity and inclusion forum with representation from across the business to develop the networks and local action plans that will have the biggest positive impact for our people and the communities they serve. This is supported by a programme of awareness training. Meanwhile, 37.5 per cent of our Board members are women, meeting the Hampton-Alexander Review’s target. We have made significant progress over the past two years on women in senior positions, while we have achieved gender parity on offers for our graduate programme.
Q What do you see the coming year bringing for DS Smith?
While we are hopeful that the vaccine will mark a turning point in the pandemic and a road to recovery, we are facing an uncertain macro-economic outlook for the upcoming year. However, our focus on resilient FMCG and e-commerce markets, as well as demand for sustainable packaging solutions within these critical value chains, will give us the platform to drive market gains and reinforce our strategic customer partnerships across our integrated footprint.As a business, we are focused on delivering for all our stakeholders including employees, customers, suppliers and shareholders who expect us to deliver real value and grow our business in a sustainable way over the coming year.
Annual Report 2021 dssmith.com 21
STRATEGIC REPORT

Q&A with Marc ChironSales, Marketing and Innovation Director, Packaging
Q How would you describe your customer portfolio?
We work with some of the world’s most visible and iconic brands. We have a diverse customer base, but our market share in the dynamic fast moving consumer goods (FMCG) category is well above the corrugated industry average and, over the past year, we have worked hard to ensure that they have benefitted from innovation, sustainable solutions and most importantly continuity of supply to keep goods moving throughout the pandemic.
Q How do you partner with your customers?Our job is to add value to these brands by making them
attractive to new consumers, available when shoppers look for them online or in-store and helping our customers’ products to be sold at the targeted price-position. In addition, we focus on transforming the design of point-of-sale, to shorten supply chain complexities and allow our customers to be quicker to market.
Q What role do you have in supporting your customers to meet the changing expectations of consumers?
We help customers meet consumer demand for more sustainable solutions and respond better to changing retail channels, including the fast growth in e-commerce. Our end-to-end approach is adopted by many of our multinational accounts and has been a real source of value growth in these relationships. We engage our customers about their future business priorities and opportunities and create shared roadmaps to meet their future needs.
We do this by:• Delivering on our commitments for
quality and service• Providing value-adding packaging
solutions• Driving innovation, rolled out
internationally
In 2020/21 we:• Maintained continuity of service to our
customers throughout the pandemic • Adapted to new purchase behaviours
and increasing, rapid growth of e-commerce
• Accelerated innovation programmes, including for plastic replacement
• Operated with increased flexibility and agility in our co-operation with customers
Our KPI
On-time, in-full deliveries (OTIF)DefinitionThe proportion of our orders that are delivered on-time, in-full across our businesses.
Why this is a KPIPackaging is an essential part of an efficient supply chain. Delivering as promised is a critical component to ensuring we remain a trusted partner to our customers.
2020/21 performanceIn the year 2020/21 our overall OTIF remained at 95 per cent, despite the significant disruption caused by Covid-19, close to our overall target of 97 per cent. We continue to strive for higher service levels.
In 2021/22 we will:• Strengthen our value proposition to help
customers get ready for the circular economy
• Accelerate our leadership on ecommerce• Continue to scale up innovations within
core business priorities • Sustain continuous improvement of
service levels
To delight our customers
2021 Target: 97%
2021
2020
2019
95%
95%
95%
0 100
22
OUR STRATEGY
Our packaging customersWe have a diverse customer base, with over 80 per cent of our customers being fast moving consumer goods (FMCG) and other consumer products. This compares to the market in Europe which is c. 73 per cent consumer goods, making our market share in the dynamic FMCG category well above the corrugated industry average. This is important to our business model as the food, drink and personal care categories are resilient in an uncertain economic outlook. These are goods that consumers use in their everyday lives and purchase regularly from supermarkets and, increasingly, online. FMCG customers require high quality, innovative, value-adding packaging. We invest in the insights and innovation needed to meet this demand; and deliver this on a multinational scale. FMCG customers require packaging that helps build brand loyalty. Packaging can add real value to the brand experience. To stand out, consumer goods packaging is diverse and creative, and packaging plays a role in marketing a product within a competitive retail environment beyond simply providing protection. FMCG customers want value. We approach packaging at every step of the supply chain to ensure that it provides sustainable, optimised performance from end-to-end. FMCG customers have a global outlook. Our multinational customers require a partner that has a geographic footprint which matches their own. DS Smith is exceptional in having the scale, expertise and innovative approaches to support our customers around the world. Over the past year, we have onboarded key global accounts across our US operations and specifically utilised our Indiana site, which continues to expand operations. FMCG customers demand secure supply of goods. By creating joint business contingency plans we secure continuity of operations and resilience of our supply chains.
DS Smith has a higher proportion of FMCG customers than the market average
Our corrugated packaging customers by volume
European industry average corrugated packaging by volume
FMCG and other consumer goods
Industrial
Our paper customersSupplying customers across the globe, we are a leading manufacturer of sustainable packaging and speciality papers made from 100 per cent recycled or chain of custody certified fibre sources. The high performing packaging papers we produce, such as corrugated case materials and kraftliners, are integral in allowing the Group’s packaging division to produce sustainable paper-based packaging solutions. Our customers for speciality papers, such as plasterboard liners, come from across a variety of industries including construction, printing, food manufacturing, stationery supplies and education.Combining our expertise of 16 mills across Europe and North America with a forward-thinking research and development focus enables us to provide customers with the high performing quality papers they need for their onward manufacturing operations. Through our stringent quality measurement systems and ability to track fibre through the complete papermaking process, we ensure delivery of high quality finished papers to all our customers. Our commitment is to create sustainable, high performing papers, that deliver the packaging solutions needed in an ever-changing world.
Our recycling customersWe provide recycling and waste management services to companies of all sizes across a diverse range of sectors in both Europe and North America. From municipalities and waste management companies, to printers, manufacturers, wholesalers, and some of the best-known brands and retailers the world over, our customers benefit from our recycling expertise. We partner with organisations large and small to keep over six million tonnes of paper and cardboard out of landfill or incineration every year. The paper and cardboard we collect for recycling serves our own paper mills as part of our closed loop recycling business model, while also being sold into our global network of third-party paper mills. With a full recycling and waste management service, we work with our customers to reduce waste and recycle more. By innovating around collection infrastructures and working with customers to build recyclability into their supply chains, we are helping to provide solutions for our customers’ and wider society’s biggest recycling challenges. In 2020 we took our experience and expertise gathered from our pan-European network of recycling operations to help support our customers in North America, with the launch of our first dedicated recycling operation in the US. This new plant can handle over 36,000 tons of paper and cardboard, helping to facilitate fully closed loop packaging and recycling solutions for our customers in this region.
Source: DS Smith analysis
Source: FEFCO 73%
27%
82%
18%
Value proposition for customers
More salesWe help our customers
generate more sales with the
right packaging
Lower costWe help our customers eliminate
unnecessary cost
Risk managedWe help our customers
address risk throughout the supply
chain
Circular readyWe help our customers
with circular packaging solutions
Annual Report 2021 dssmith.com 23
STRATEGIC REPORT

To realise the potential of our people
Q&A with Darren LittleboyGroup Human Resources Director
Q What does diversity and inclusion mean for DS Smith?
For us, inclusion starts with the belief that everyone, regardless of background, is valued, respected and has the opportunity to flourish. It is about embracing our differences and valuing the creative opportunities that brings for our business and customers. These principles are core to our diversity and inclusion programme across the Group.
Q How have you supported your employees during the past year?
To support our colleagues working remotely we ran a pulse survey and nearly 3,500 colleagues participated. Remaining at the workplace throughout the pandemic brought different challenges for our front-line operational colleagues, so we also ensured their feedback was heard. We actively used all of our employee feedback to improve our support to employee health, safety and wellbeing.
Q What have you done to develop people?Opening up access to development opportunities remained a core priority. Covid-19 challenged us to reconsider how we deliver learning. Our learning and development community rose to the challenge to continue to increase the range and accessibility of the learning offer and we accelerated our move to providing more blended solutions using virtual learning, immersive learning and e-learning, delivering a fourfold increase in all learning.
We do this by:• Creating an environment that people are
proud of and where they can give their best
• Ensuring the health and safety and wellbeing of all
• Building capability for the future
In 2020/21 we:• Prioritised the health, safety and
wellbeing of our people during the Covid-19 pandemic – listening and responding to feedback
• Celebrated the contribution and success of colleagues through our first Smithies awards event
• Launched our refreshed and simplified Management Standards
• Adapted and extended our development offer – embracing technology to overcome the challenges of Covid-19
Our KPI
Accident frequency rate (AFR)DefinitionThe number of lost time accidents (LTAs) per million hours worked.
Why this is a KPIWe have a strong focus on individual ownership, and we believe that by engaging our people to contribute to a safe working environment and culture, everyone can influence a reduction in our AFR.
2020/21 performanceA healthy and safe working environment and culture is the cornerstone of any responsible, sustainable and profitable business. In the context of our health and safety aim of zero harm, our target AFR is zero.The past year has been like no other. The Covid-19 pandemic has had a profound effect, touching every aspect of how we work. It is therefore a remarkable achievement that against this ever changing and increasingly demanding landscape, we have managed to maintain and improve our health and safety performance. We are very pleased with this tremendous achievement.
Health and safety key performance indicators
2020/21 2019/20Variance vs.
pro formaReported Pro forma3
Total LTAs1 102 97 119 -14%AFR2 2.06 2.08 2.40 -14%
1. Lost time accident (LTA): number of accidents resulting in lost time of one shift or more.
2. Accident frequency rate (AFR): number of LTAs per million hours worked.3. Pro forma data adjusted for acquisitions and disposals.
In 2021/22 we will:• Progress our new sustainable ways of
working with a renewed focus on flexibility and wellbeing
• Continue to invest in the capability of our managers and leaders to build high-performing teams
• Provide consistent and standardised training to further develop our technical and operational capability
• Continue progress to build an inclusive and diverse workplace
• Open up development opportunities even further, blending technology with face-to-face learning
24
OUR STRATEGY
To realise our Purpose of ‘Redefining Packaging for a Changing World’ we need a modern, diverse, motivated and engaged workforce where everyone has the opportunity to realise their potential. We are passionate about working together, sharing ideas and exploring new ways to innovate and delight our customers; it is fundamental to our business success. These values have been at the forefront during the past year. Our priority has been the health and wellbeing of our people, continuing to serve our customers and to support the communities we serve. At the same time, we have not lost focus or momentum on building an inclusive workplace, recognising the contribution of colleagues across the business and providing development opportunities for all. As we look forward, we are building on the experience and learning gained through the Covid-19 pandemic to shape new sustainable ways of working that recognise the importance of flexibility, connectedness and mental health and wellbeing.
Ensuring the health and safety of allWe are highly ambitious about health and safety with a focus on continual improvement and high standards to achieve our target of zero harm.
Health and safety – Vision ZeroOur vision is to provide a working environment and culture where health and safety is integral to our business and all our people actively engage in our drive to continuous health and safety excellence.The campaign for zero harm focuses on our four main strategic goals:Leadership – Our successful health and safety onboarding programme has continued this year, albeit virtually, inducting all new and promoted site managers into the behaviours and mindsets required to perform as health and safety leaders. In addition, virtual roll out has commenced of our Fundamentals of First Line Management programme which incorporates content consistent with the senior manager programme. Our next focus is to create content applicable for all our employees to support the drive of required health and safety mindset and behaviours further into the organisation. In 2020/21 we also developed and launched our bespoke e-learning sessions on incident investigation and risk assessment for our health and safety professionals. The aim is to ensure a consistent understanding and service on these topics across our sites. The focus on developing the leadership and technical skills of our health and safety professionals has been very warmly received and will continue into 2021/22. Engagement – Our new proactive internal KPI, the health and safety engagement rate (measuring the number of near misses/safety observations per person) has increased significantly this year, up by 15 per cent. We are particularly pleased with this, as it reflects our people’s engagement with seeing and raising health and safety standards. Engagement with critical health and safety processes, like Lock Out, Tag Out, Try Out (LOTOTO) are essential to ensure safe working environments. This year we launched a competition inviting our employees to create materials which would inspire and motivate others to use LOTOTO. The response was fantastic with over 63 innovative entries. The chosen top ten were incorporated into a montage for display at sites, whilst the top three entries were put to a vote with over 960 employees taking part.
The eventual winner was Timisoara, our Romanian site – with a very moving and inspiring film which has been translated into our core languages for use in training and raising awareness. Processes – We completed a Group-wide auditing process this year which resulted in an overall audit score increase of 8 per cent. We are pleased with the progress all sites are making to meet our very high standards of health and safety and in 2021/22 we will continue to develop our Group-wide minimum standards to challenge us further on our Vision Zero journey. Culture – All our work on leadership, engagement, systems and processes is designed to drive a culture of continuous improvement and setting high standards. We firmly believe that we are building the foundations to drive the change in our culture to achieve sustainably excellent performances, year-on-year. This year we celebrated 246 sites with zero accidents by awarding Gold, Silver and Bronze certificates. Ten of our sites achieved our prestigious Gold award, showing excellence in audit scores and health and safety engagement in addition to zero accidents. These sites were celebrated at our first ever Smithies event (see page 28 for more information).
The winning core LOTOTO Team (General Manager, Gabriel Balogh; HSE Manager, Tiberiu Tozser; Production Manager, Christian Schmidt; Corrugator Coordinator, Marius Brisc). DS Smith Packaging Timisoara, Romania
“The great reaction we received to our competition entry shows that the story touched the hearts of many colleagues and is proof that all at DS Smith are very connected to the topic of health and safety. We are proud to be the competition winners out of a group of highly responsible and engaged teams throughout the organisation and we are continuing to drive the health and safety procedures.“Gabriel Balogh, General Manager, DS Smith Packaging Timisoara, Romania.
Annual Report 2021 dssmith.com 25
STRATEGIC REPORT

Health and wellbeing The changing world, with restrictions and lockdowns, has meant increased demands on our employees’ physical and mental wellbeing. Therefore, this year we have been refreshing and consolidating our strategy on this highly important subject, incorporating best practice from internal and external benchmarking. Our new framework is designed to build positive, healthy working environments, enabling our people to thrive and perform sustainably. To achieve this our framework focuses on four key areas:
Taking The Lead – Encouraging everyone to visibly and demonstrably set the example and champion health and wellbeingLearning & Development – Providing knowledge and information to empower people to take ownership of their physical and mental wellbeingEngagement – Working together, involving and including all our colleagues to continuously improve health and wellbeingToolkits – Providing best practice tools to inspire and motivate positive and healthy people and workplacesIn summary, our aim for 2021/22 is to build on our foundations and focus on achieving sustainable world-class performances in health, safety and wellbeing across our Group.
Development for allAt DS Smith we are committed to our learning and development strategy which is to:• Deliver a sustainable, accessible and measurable learning and
development proposition• Have a model of learning that blends structured learning with
workplace application• Provide colleagues with support and accountability for their
own development• Prioritise our interventions to ensure we can focus on the skills
and capabilities that will contribute to the future growth of our business.
We launched ‘DS Smith Learning’, our virtual home for learning, open to colleagues from across the business, which provides access to our library of learning programmes.
This offers online learning and resources as well as curated content on core management and leadership skills and dedicated professional development content for functional and specialist colleagues. During 2020/21 we have seen a fourfold increase in the volume of learning and development activity taking place across the business. Our e-learning platform provides access to both generic development content, books, videos and audio as well as bespoke DS Smith content on subjects ranging from paper making to continuous improvement practices and our sales processes, and has seen over 10,000 users. Alongside this platform we provide a range of bitesize virtual training modules prioritising learning most relevant to current business challenges and equipping managers to support their team in topics such as leading remote teams, resilience and change management, with more than 4,000 attendees between September 2020 and April 2021. We are continuing to work with our external partner Oxford Saïd Business School. Our Global Leadership Programme and Aspire Programmes were moved successfully to virtual delivery and expanded to reflect new challenges which have faced our leaders during Covid-19.
“Aspire is a great opportunity to discuss and reflect about yourself as being a leader. The mix of content given by professionals of the Oxford Saïd Business School as well as the open exchange with other DS Smith leaders within and beyond the courses gives you a fantastic chance to improve your leadership skills. Bringing Aspire to a digital level was an inevitable step, but due to regular vibrant online sessions it’s not a loss at all.”Daniel Malolepszy, Site Manager, Germany
“For me personally Aspire is an absolutely inspiring programme which strongly supported me to grow my confidence into my leadership skills. The regular – now virtual – exchange with colleagues across the business is giving so many new perspectives and reflects an incredibly valuable part of the programme.”Marina Wimmer, Head of Commercial Finance, AustriaOur internal ‘Fundamentals of First Line Management’ modular programme was also rapidly redesigned for virtual delivery by our team of 50 in-house trainers and we aim to reach 3,000 managers by the end of 2020/21. Here are some quotes from recent attendees:“I liked the delivery and content, it gives the FLM good tools to use and will improve us as managers.”“The exercises challenged me to be more self-aware and understand how my natural self can be used to manage people and situations.”
26
TO REALISE THE POTENTIAL OF OUR PEOPLE CONTINUED
Webinars and other resources have covered content as diverse as boundary management – juggling home and work-life, parenting, mindfulness and wellbeing.This hugely impactful resource will continue to grow in 2021/22 to ensure that we provide learning pathways which align to the needs of our business and meet the challenges of new ways of working. We are passionate about providing all our colleagues with opportunities to grow in their current roles and to meet aspirations for the future.
Enabling our managersHaving capable managers who enable our people to thrive and perform at their best is a core pillar of our strategy and is reflected in our strategic people risk priorities (organisational capability risk) outlined on page 54. Our Group values and management standards provide clarity around expectations and consistency in our management practices across the Group. During 2020/21 we launched our refreshed and simplified standards with four core standards on health, safety and environment, customer, team management and our focus on continuous improvement – ‘the DS Smith Way’. The standards are embedded in our performance management approach and underpinned with guidance and training to bring them to life.
Developing diverse leadership talentWe continue to take action to grow a strong and diverse pipeline of leadership talent. During 2021 additional cohorts will join our Global Leadership and Aspire programmes delivered in partnership with the Oxford Saïd Business School. Alumni from both programmes are increasingly taking the lead as coaches and mentors for emerging talent across the Group.In addition, we will pilot a targeted career development offer for mid-level female talent to continue to accelerate progress towards a more gender diverse leadership population.
Wellness WednesdaysTo focus wellbeing communications in our North American business, the team has introduced concise, bi-weekly communications providing tips on preserving and improving mental and physical health. A DS Smith employee is featured each week to provide insight into their wellness strategies.
EngagementBy giving all employees a voice, we create the opportunity to improve their work experience and feel pride in working for DS Smith. During the year, responding to the need to support and engage colleagues working remotely we deployed a real-time pulse survey in which nearly 3,500 colleagues participated.Feedback told us that they felt supported by their managers and had confidence their safety was being prioritised but there was more we could do to help them manage some of the challenges of remote working. The findings directly influenced the immediate response locally and are now shaping new ways of working that support greater flexibility, working in remote teams and staying connected with colleagues as well as informing our new health and wellbeing strategy.Recognising that remaining at the workplace throughout the pandemic brought specific challenges for our front-line operational colleagues, we have worked hard to ensure their feedback is heard. Across locations in the UK and the Nordic countries we sought feedback by enabling front-line operational colleagues to participate in digital surveys. At a time when a second wave of infections was being recorded and social restrictions were tightening, most colleagues reported a strong sense of togetherness, positive line manager support and that they felt able to continue to work safely.Understanding what matters to colleagues and how we help them to thrive and succeed continues to be the priority. 2021/22 will see the introduction of our new Let’s Keep Talking initiative as we focus on keeping conversations going. We will pilot new technology including on-site touchscreen feedback kiosks as well as checking in with all 29,000 of our people via our engagement survey.
Annual Report 2021 dssmith.com 27
STRATEGIC REPORT

The SmithiesIn 2020 we launched a global recognition programme – The Smithies – to recognise and celebrate individuals and teams who go above and beyond and excel at what they do – our hidden gems of DS Smith. We were determined that the challenges of restricted travel and social distancing would not prevent us celebrating their successes and so created an online awards event that proved to be an inspiring and inclusive highlight of the year.
The first Smithies event was held virtually in September recognising 28 finalists and seven winners, watched by thousands of employees across the world. In a post-event poll, 99 per cent said they were more inspired to recognise their colleagues.
European Works CouncilThe purpose of our European Works Council (EWC) is to bring together employee representatives from the different European countries where we operate. The aim of the EWC is to engage employees through an effective information and consultation process focused on business decisions which affect the workforce and impact on the interests of employees. This improves business outcomes, individuals’ contribution to the business and development opportunities.We worked closely with the EWC members to prioritise areas where we can jointly improve policies and processes. 2020/21 has seen us work in partnership to develop joint action plans to address aspects of health and safety, diversity and inclusion, sustainable employment and fairness in the workplace.
“The secret to the success of the DS Smith EWC is no secret; we work together with senior management to jointly improve policies and processes within the Company. The EWC and senior management both understand that we all want to bring the business forward. We do not claim to be perfect, but we are working hard at trying to make DS Smith an employer of choice and make our colleagues proud to work here. This takes mutual respect and hard work from all of us, and the reward is to be described by people outside of the Company as setting the standard in Europe for EWCs. True to our Purpose of ‘Redefining Packaging for a Changing World’.”Joseph Reed, European Works Council Chairman
Creating a modern, inclusive and diverse culture2020/21 has seen us delivering on the actions in our diversity and inclusion plan, to build awareness and ownership and embed the principles of inclusion and diversity in all aspects of our people policies and practices. We implemented our Equal Opportunities and Anti-Discrimination policy. The policy sets clear expectations about inclusion and a zero tolerance for discrimination, but we know that real change comes from people not policies. To ensure this has a practical positive impact on inclusion, we are focusing on building real understanding and engagement, working in partnership with our employee forums. Translated into multiple languages, the policy is supported by modules adapted for both online and site-based learning and engaging videos addressing unconscious bias and building inclusive leadership.Meaningful change starts at the top and during the year we developed an inclusive leadership virtual workshop built around a simple but powerful framework of ‘Courage, Curiosity and Trust’. Over 100 of our senior leaders have participated globally so far and they now form an internationally and culturally diverse alumni group, role modelling and extending the principles into their teams. We will continue to extend participation during 2021/22.We understand that with such an international and diverse business, the specific diversity and inclusion challenges will differ between regions. That is why we established a diversity and inclusion forum with representation from across the business to build the inclusive networks and local action plans that will have the biggest positive impact for our people and the communities they serve.The year has seen the forum go from strength to strength, driving engagement and action across the business. In the UK, the leadership team has hosted roundtable events with external speakers sharing insights and ideas on a range of diversity and inclusion topics. From celebrating Black History Month with our US team to hosting a range of events and activities on International Women’s Day, colleagues are taking the lead on inclusion.The coming year will see us increasingly connecting our work across inclusion and wellbeing as both are at the heart of a sustainable healthy workplace.
28
TO REALISE THE POTENTIAL OF OUR PEOPLE CONTINUED
Diversity of Executive teamWe voluntarily take part in the Hampton-Alexander Review which sets out recommendations for FTSE 350 companies to improve the representation of women both on their executive committees and the direct reports to those committees. DS Smith has three committees that together comprise our Executive Committee; Group Operating Committee, the Group Strategy Committee and the Group Health, Safety, Environment and Sustainability Committee, as described on page 71.The Hampton-Alexander Review set a target of 33 per cent female representation on FTSE 350 boards by 2020. The 2020 report was published in February 2021 and represents women on Boards as of 11 January 2021 and senior management as at 31 October 2020.Our position at that date is outlined below:Ranking in industry sector (general industrials) 4thOverall FTSE 100 ranking 44thWomen on plc Board 37.5%*
Female Executive Committee and direct reports 30.2%**
* Compared to FTSE 100 average of 36.2%.** Compared to FTSE 100 average of 30.6%.
Our gender split as of 30 April 2021 is outlined in the table below:
Gender diversity
All employees – Total: 28,864
Senior management – Total: 77
Board of Directors – Total: 835
52 25
22,545 6,319
Female Male
We have adopted the Hampton-Alexander Review definition of senior management to provide a consistent and comparable measure of progress on gender diversity.It has been historically challenging to attract women into our industry, but we are determined to make progress. As a result of our continued action on graduate recruitment 2021, 64 per cent of our offers went to female candidates.
“As part of the Packaging graduate scheme, I get the opportunity to work across multiple projects that involve some of the world’s biggest brands, and it is so rewarding to work on something that creates such a positive impact for both people and planet. It is such an exciting time to be a part of a brand that continuously anticipates the opportunity for packaging to lead the way in sustainability, and I look forward to being a part of this along my graduate journey.”Amy Strudwick, 2020 graduate
We are also reviewing our broader talent attraction strategy and developing external partnerships to engage with women at all stages of their careers to understand what they want from a modern workplace and encourage them to consider joining us. We are now a corporate member of the WISE (Women In Science and Engineering) campaign that promotes opportunities for women in STEM careers and are working with our recruitment team to reach a broader audience, showcasing our female talent and demonstrating the diversity of opportunities available across the business.For gender pay gap reporting we choose to report not only on the UK legal entities where headcount is above 250, but on the UK total figures to provide a comprehensive view. This year the mean gender pay gap was 3.5 per cent (4.7 per cent in 2019) whilst the median gender pay gap was 6.2 per cent (6.7 per cent in 2019). The improvement is encouraging but to move further we need more women in senior positions and are working hard to deepen the leadership pipeline. We currently have 32 per cent in our global senior management population. We know that gaining exposure to strategy development is key for executive succession and three female leaders now sit on two of the Group Executive Committees. During 2021/22 we will pilot and launch a new mid-level female career development programme to accelerate the progression of female talent into senior leadership roles. We have also further extended mentoring and executive coaching support.You can find our detailed UK gender pay gap report on dssmith.com by searching ‘gender pay gap report’. This explains the reasons for the gap and information on the actions we have in place to help close the gap. However, the UK only represents a small proportion of our total workforce and our policies and practices are applied globally.
Annual Report 2021 dssmith.com 29
STRATEGIC REPORT

To lead the way in sustainability
Q&A with Wouter van Tol:Head of Sustainability, Government and Community Affairs
Q Since launching Now and Next, what have you done to embed the new strategy?
We have been collaborating across the business to ensure that our people have the tools they need to deliver change. During the launch, we briefed over 2,100 managers through online seminars and interactive training, inviting employees to be involved in achieving our ambitious targets. Clearly defined roles and responsibilities to deliver progress have been established and we have invested in our reporting capabilities to regularly evaluate our performance.
Q How are you helping customers transition to the circular economy?
Our customers, like us, see the urgency in moving beyond the traditional ‘take-make-dispose’ model to a circular system built for long-term, multiple lifecycles. We believe that there is an enormous opportunity to do more with corrugated board to accelerate the transition to a circular economy, particularly as an alternative to plastic, which remains difficult to recycle in practice. Many of our Now and Next targets respond to this opportunity.
Q How are you increasing your ambition on carbon reduction?
In 2020/21, we challenged consultants to help us to increase our ambition on carbon reduction and to optimise our decarbonisation roadmap. We are pleased to announce our commitment to reach Net Zero emissions by 2050 and a science-based target for 2030. We have a strong roadmap of investments coming online in the coming years that will reduce our emissions, paving the way for our circular packaging to play a powerful role in helping brands and consumers reduce their carbon footprint.
We do this by:• Closing the loop through better design• Reducing waste and pollution through
circular solutions• Equipping people to lead the transition to
a circular economy• Protecting natural resources by making
the most of every fibre
In 2020/21 we:• Launched our Now and Next
sustainability strategy, unveiling our ambitions for the coming decade
• Achieved targets, including implementing mitigation plans at sites located in areas at risk of water stress
• Increased our MSCI rating from ‘A’ to ‘AA’, designating us as a Containers and Packaging leader
• Continued collaborating with the Ellen MacArthur Foundation
In 2021/22 we will:• Conclude the process of setting a
science-based target and commitment to achieve Net Zero emissions by 2050, increasing the pace at which to decarbonise our business
• Continue embedding Now and Next, involving every employee in delivering our new sustainability strategy
• Continue delivering progress on Now and Next and improvements in ESG ratings
• Continue partnering for sustainable product innovations, such as ClimaCell®, Hydropol™, ParceLive and Touchguard™ anti-microbial surface coatings
• Take account of a number of ESG factors when the Remuneration Committee considers the 2021/22 annual bonus
Redefining Packaging for a Changing World
Sustainability Report 2021
For more information about how we are leading the way in sustainability with our Now and Next sustainability strategy, please refer to the latest DS Smith Sustainability Report and DS Smith Sustainability Databook 2021, which include additional metrics and further information on our sustainability performance.
We have again been awarded the LSE Green Economy Mark, as we derive substantial revenues from environmental solutions.
30
OUR STRATEGY
Summary of Now and Next progressClosing the loop through better designIn 2020/21, we achieved our target to train 100 per cent of our designers on the circular economy, ensuring our designers are skilled in building circularity into packaging design. Our community of over 700 designers is actively applying our Circular Design Principles, developed in collaboration with the Ellen MacArthur Foundation, to hundreds of thousands of new packaging designs. We are progressing against our target to manufacture 100 per cent recyclable or reusable packaging, a target originally set with a deadline of 2025 but that we have brought forward to 2023, with 99.2 per cent (2019/20: 98 per cent) of packaging manufactured in 2020/21 meeting this standard. We continue to pilot substitutes for a small remainder of materials that are presently difficult to recycle, such as wax coatings.
Reducing waste and pollutionOur designers have developed over 650 designs representing hundreds of thousands of products geared towards plastic replacement. In 2020/21, 53.9 million pieces of problem plastics were removed from supply chains and replaced with recyclable corrugated alternatives. We are also optimising transport by developing solutions to remove wasted air in transit and lessen the number of lorries on the road. In 2020/21, we invested in the capability within our Value Tool to gather data to measure progress against our target to remove 250,000 lorries from the road by 2025. We have begun to explore new business models for the rise in e-commerce waste and carbon-neutral packaging.
Equipping people to lead the transition to the circular economyIn 2020/21, over 2,500 employees in design, senior management and leadership, graduate and procurement roles completed formal circular economy training, representing 9 per cent of employees overall. Our next step is to engage sales and marketing teams as we extend learning opportunities to eventually reach all our people. A further 57 senior leaders and others participated in the Ellen MacArthur Foundation Circular Economy Masterclass, delivered by the University of Exeter. In 2020/21, we engaged over 519,000 people on the circular economy and circular lifestyles through online content, including posts ‘liked’ and shared, videos viewed, and reports downloaded. We developed a lesson plan for school engagement. We streamed a pilot of this live lesson via YouTube, where over 100 families participated, and hope to be able to spend more time in our communities next year to promote the circular economy and circular lifestyles.
Protecting natural resourcesIn 2020/21, fibre use in around a quarter of new packaging solutions was fully optimised for individual supply chains, ensuring that whilst we use recycled fibre where we can, virgin fibre consumption is minimised as far as practicable. There is a significant opportunity to increase this, given that optimisation leads to less impact , as transporting fewer fibres through the production process requires less water and energy. We maintain our standard that 100 per cent of papers used are sourced from recycled or chain of custody certified sources, having achieved this target in 2019/20. Furthermore, 100 per cent of our sites1 hold chain of custody certification and we achieved our target for
100 per cent of our forests to be certified, meaning that we comply with the highest social and environmental standards for forestry in the market.
Driving carbon reductionWe have delivered a 23 per cent (2019: 20 per cent) reduction in CO2e per tonne of production on a like-for-like basis since 2015, demonstrating pace ahead of our target, driven mostly by investment in energy efficiency and equipment upgrades made at our mills. Our Group carbon emission intensity for 2020 was 212kg CO2e /t nsp (2019: 220kg CO2e /t nsp), a reduction of 4 per cent compared to last year on a like-for-like basis. Following our Group Sustainability Data and Reporting policy and Greenhouse Gas Protocol guidance, we have calculated this performance on a like-for-like basis by including estimates of emissions from acquisitions in our base year, which has been independently verified. Our Europac acquisition is therefore included in all figures to enable meaningful comparison.In 2020, at Belišće Mill c. 27,000 tonnes of CO2e has been saved by purchasing green electricity. Since August 2020, steam generation at Kemsley Mill is powered by the neighbouring Wheelabrator Combined Heat and Power (CHP) plant, reducing the mill’s reliance on fossil fuels, removing c. 8,000 tonnes of CO2e per year. At Lucca Mill, a new aeroderivative gas turbine has been installed in partnership with GE Gas Power, delivering a 2 per cent efficiency improvement, removing c. 4,000 tonnes of CO2e per year. Finally, a new biomass dry line has been installed at Viana Mill, saving c. 3,100 tonnes of CO2e per year. At our packaging plants, our LED lighting rollout now has 36,672 lamps installed at 96 sites, saving c. 14,000 tonnes of CO2e per year. The past year was the first complete year of operation for our state-of-the-art biomass boiler that uses residual low grade timber waste to generate energy for our plant in Värnamo, Sweden; saving c. 2,200 tonnes of CO2e by switching from LPG. Additionally, new CHP plants have been operational for around one year at Blunham and Fordham. These plants generate electrical power for the sites whilst also harnessing the waste heat from the process, increasing overall efficiency. We maintained ISO 50001 certification at 100 per cent of our relevant sites2, a target achieved in 2019/20, which continues to drive energy efficiency.Our continued investment in carbon reduction over the coming years will set us on the way to achieving our ambitious climate targets, including a commitment to reach Net Zero emissions by 2050, and a science-based target for 2030 which will require at least a 40 per cent reduction in CO2 emissions per tonne of product compared to 2019. These targets will be validated by the Science Based Target initiative as being in line with what the latest science considers necessary to meet the goals of the Paris Agreement. We will begin to report progress towards achieving this new target next year.
Managing water responsiblyWe are delighted that in the past year we achieved our target for 100 per cent of sites at risk of current or future water stress to have mitigation plans in place, accounting for 36 per cent of our total water consumption. These plans involve identifying opportunities for water reduction, reuse and recycling, regular reporting on water performance and engagement with local stakeholders, such as the water authority. Further discussion on
1. Includes all Packaging and Supply Engine (Paper and Paper Sourcing) sites that trade or manufacture products derived from timber.2. Includes sites accounting for at least 90 per cent of energy consumption.
Annual Report 2021 dssmith.com 31
STRATEGIC REPORT

water stress as a climate-related risk can be found on page 57. Over the year, six (2019: six) of our mills performed better than our benchmark rates for water consumption, with plans to bring one additional mill per year beneath our benchmark rates, enabling cost savings through improved efficiency. Water abstraction reduced by 5 per cent per tonne of paper production versus last year on a like-for-like basis, driven by behaviour change and improvements made to our operational processes. In the past year we received 21 notifications of water non-conformances from local authorities (2019: 79), a substantial decrease owed to stronger management.
Sending zero waste to landfillIn 2020, waste sent to landfill from our paper mills decreased by 32 per cent per tonne of production compared to last year on a like-for-like basis. Overall for the Group, 268 kt (2019: 348 kt) of waste was sent to landfill. This reduction was driven predominantly by a significant improvement at Zarnesti Mill, which achieved zero operational waste to landfill in the past year. Furthermore, Aschaffenburg, De Hoop and Witzenhausen paper mills sent zero waste to landfill during the past year. At the remaining mills, we are developing innovative, circular solutions for waste. For example, Lucca Mill reduced its landfill by 62 per cent compared to last year owed to reducing rejects and utilising sludge to produce bricks. Pazardzhik Mill diverted landfill waste partly to biogas and compost production, a reduction of 82 per cent compared to last year. Finally, Riceboro Mill reduced landfill waste by 24 per cent through landspread opportunities. With a waste diversion rate of 98.9 per cent in our Packaging division, only 1.1 per cent of waste is sent to landfill, representing c. 6,000 tonnes. This year, we undertook a project to identify common sources of landfilled waste and held a series of workshops to train sites on new waste reduction, reuse and recycle opportunities, leading to a 13 per cent reduction.
Sourcing sustainablyWhilst we put sustainability at the heart of our business, we recognise that our impacts also occur in the supply chain and so our target is to ensure that 100 per cent of our suppliers comply with our sustainability standards by 2025. Our Global Supplier Standard (GSS) sets out our expectations and in 2020/21, 100 per cent (2019/20: 74 per cent) of our strategic suppliers and 45 per cent (2019/20: 11 per cent) of our suppliers overall have agreed to our standards. Having rolled out circular economy training to our Procurement function, in January 2021 we introduced a group of suppliers to Circulytics® to invite them to measure their circularity and identify opportunities to become more circular.
Contributing to our communitiesWith support from the DS Smith Charitable Foundation, we continued to develop our community programme themes of inspiring the next generation through circular lifestyles and protecting our environment through biodiversity. In 2020/21, 57 projects to improve biodiversity were funded by the Charitable Foundation, with a further 47 applications in progress, from wildflower meadows and community gardens to bug hotels and ponds. For example, at DS Smith Kielce in Poland, 130 employees and their families participated in planting over 5,000 trees and funding has been used by our Louth plant to install a beehive and a wildflower meadow. We continue to welcome applications, encouraging our colleagues to act as biodiversity ambassadors. So far, three of our mills have begun biodiversity programmes.
For example, Aschaffenburg Mill is growing wild plant species and significantly improving soil quality at the site, attracting butterflies and bees. At Kemsley Mill, a wildflower meadow and a variety of educational initiatives are being set up. These are just the beginnings of new initiatives that will improve the environment for plants and animals, protect natural habitats and enhance species diversity. We are delighted that for the second year running, 100 per cent of our sites (with greater than 50 employees) engaged in community activity, having achieved this target in 2019/20.
Caring for our peopleWe are committed to the health, safety and wellbeing of our people, with a vision of zero accidents and zero harm. We are an inclusive employer where people can thrive, succeed, and achieve their potential. Information about how we are realising the potential of our people can be found on pages 24-29.
Respecting human rightsAs an employer of around 29,000 people and with an extensive global supply chain involving hundreds of thousands more people, we have a responsibility to identify, prevent and mitigate negative human rights impacts. In 2020/21, we planned and scoped a human rights impact assessment, selected a partner and identified key stakeholders to involve. In 2021/22, we will conduct the assessment, which will highlight the parts of our business with the greatest risk to human rights. Following this, clear actions to manage and mitigate these risks will be identified and addressed.
External recognition• MSCI: Rated AA• EcoVadis: Rated Gold• Circulytics: Rated A-• CDP: Rated B (Climate Change), B (Forests) and A-
(Water Security)• DJSI: Rated 51• FTSE4Good: Included since 2012• ISS: Rated ‘Prime’ B-• LSE Green Economy mark• Support the Goals: Rated 4 out of 5 stars• Sustainalytics: Rated 15.9 ‘Low ESG Risk’• UN Global Compact: Member since 2013
32
TO LEAD THE WAY IN SUSTAINABILITY CONTINUED
Group environmental KPIs
KPI Unit2015
(base line)2019
(re-stated) 2020Compared
to last yearCompared
to base year
Direct (Scope 1) CO2e emissions kt CO2e 2,461 2,401 2,267 -6% -8%Indirect (Scope 2) CO2e emissions kt CO2e 967 803 764 -5% -21%Emissions from energy exports kt CO2e 717 859 766 -11% 7%Total CO2e (net energy export)1 kt CO2e 2,711 2,345 2,265 -3% -16%Energy exported GWh 2,187 2,112 1,924 -9% -12%Energy consumption (net)2 GWh 17,240 16,604 16,276 -2% -6%Total production kt nsp* 9,898 10,648 10,708 1% 8%Waste to landfill3 kt 87 348 268 -23% 208%CO2e per tonne of production kg CO2e/t nsp* 274 220 212 -4% -23%1. 21% of carbon emissions generated from UK-based operations in 2020.2. 14% of energy consumption by UK-based operations in 2020.3. Waste to landfill 2015 not re-based. * net saleable production
Greenhouse gas emissions data is collected and reported in accordance with the Greenhouse Gas Protocol Corporate Accounting and Reporting Standard (Revised). As the Company has grown over recent years through acquisitions, our emissions generating activities have increased, making historic performance incomparable to today. Following Greenhouse Gas Protocol guidance and our Group Sustainability Data and Reporting policy, we are now including estimations of emissions from acquisitions in our base year and historic years, enabling meaningful comparison of emissions on a like-for-like basis over a long period. In the table above, both 2015 and 2019 figures have been restated to include acquisitions (and remove disposals) to provide a comparison to the business as it exists today. Our latest Sustainability Report includes both recalculated and restated historic emissions and historic emissions as reported, alongside additional materials, energy, water and waste metrics. Definitions, scope and emission factors applied are also provided.
Independent Assurance StatementBureau Veritas UK Limited has been commissioned by DS Smith Plc to provide an independent opinion on the following environmental performance indicators: total energy consumption; total energy exported; Scope 1 and 2 greenhouse gas (GHG) emissions; raw material usage; water consumption; total water effluent; landfill waste; discharge to air and water; and total production, for calendar year 2020. In addition, the verification scope included review of the estimation calculations used to determine the following information for the restated calendar year 2015 base year data: Scope 1 and 2 (GHG) emissions; emissions from energy exports; and total production. Bureau Veritas UK Limited reported: ‘Based on our verification activities and scope of work, nothing has come to our attention to suggest that the reported data does not provide a fair representation of environmental performance across DS Smith for the defined period’. A full verification statement including methodology, limitations and exclusions can be found on the DS Smith website (https://www.dssmith.com/sustainability/reports-performance-and-data).
Redefining Packaging for a Changing World
Sustainability Report 2021
For a complete review of our Now and Next progress, please see the latest DS Smith Sustainability Report.
For the second year running, we’ve implemented the SASB ‘Containers & Packaging’ standard.Please see page 63 of the latest DS Smith Sustainability Report for our standard disclosure.
Annual Report 2021 dssmith.com 33
STRATEGIC REPORT

To double our size and profitability
Q&A with Adrian MarshGroup Finance Director
Q How have you delivered against your financial KPIs in 2020/21?
Delivery against our KPIs has been good, in the context of Covid-19. We have dramatically out-performed our corrugated box volume target of GDP+1, because our volumes have held up well, with a substantial acceleration in the second half of the year, while GDP has fallen very markedly. The trend has been fuelled by e-commerce which we anticipate continuing to grow, as consumers have adopted online purchasing as part of their way of life. On the other hand, the first half of the year was challenging overall, particularly due to one-off effects from Covid-19, and that impacted the return on sales and return on average capital employed (ROACE) metrics. Looking at the second half of the year, with the bulk of the one-off impacts behind us, then you see an improved return on sales, and I expect to see that continue into the new financial year.
Q How has cash flow fared over the year?
We remain highly focused on cash flow with free cash flow up 37 per cent to £486 million, reflecting a focus on working capital and costs generally. This has resulted in our net debt falling by £306 million to £1,795 million at the year end.
We do this by:• Driving organic market share gains• Investing behind innovation in growing
areas of the corrugated packaging market
• Investing in new corrugated packaging capacity
In 2020/21 we delivered:• +3.5 per cent like-for-like corrugated box
volume growth – ahead of target• +37 per cent growth in free cash flow• Maintained operations throughout
Covid-19 disruption
In 2021/22 we will:• Continue to drive growth through
organic investment• Develop new corrugated packaging sites
in Europe• Drive volume growth and operational
efficiency from the packaging site in Indiana, US
Our KPIsLike-for-like corrugated box volume growthDefinitionLike-for-like volume of corrugated box products sold (excluding the effect of acquisitions), measured by area.
Why this is a KPIWe target volume growth of at least GDP +1 per cent because we expect to win market share by delivering value to our customers across their supply chain on a multinational basis.
2021 PerformanceWe delivered volume growth of +3.5 per cent, being -1.0 per cent in H1 and +8.2 per cent in H2. The exceptional growth in the second half of the year was driven by very strong demand in particular from e-commerce customers and also a recovering trend in industrial customers. While all regions showed good growth, the UK was the stand-out country, due to our success in e-commerce.
Further information on the calculation of financial KPIs and other non-GAAP performance measures is given in note 32 to the consolidated financial statements.
2021 Target: GDP+1% = -5.5%
2021
2020
2019
3.5%
0.6%
2.4%
0 4
34
OUR STRATEGY
Return on sales1
DefinitionEarnings before interest, tax, amortisation and adjusting items as a percentage of revenue.
Why this is a KPIThe margin we achieve reflects the value we deliver to our customers and our ability to charge for that value. It is also driven by our scale. A higher return on sales makes the profit more resilient to adverse effects.
2021 PerformanceReturn on sales of 8.4 per cent, down 250 basis points on 2020, reflects the reduction in profitability in the year, driven by Covid-19 impacts and a decline in pricing in H1 combined with input cost pressures in H2.
Cash conversionDefinitionFree cash flow before tax, net interest, growth capex, pension payments and adjusting items as a percentage of earnings before interest, tax, amortisation and adjusting items. Free cash flow is the net movement on debt before cash outflow for adjusting items, dividends paid, acquisition and disposal of subsidiary businesses (including borrowings acquired) and proceeds from issue of share capital.
Why this is a KPIWe focus on cash conversion as part of our wider focus on capital management and maintaining a prudent balance sheet. Working capital is a key focus within the business in order that all capital is employed where it can best deliver returns for the business.
2021 PerformanceCash conversion was 150 per cent, in line with our target, reflecting a particularly strong working capital improvement.
1. Comparative results for 2019 have not been restated for IFRS 16 Leases adopted in 2020.
Net debt/EBITDA1
DefinitionAdjusted net debt (calculated at average FX rates and after deducting IFRS 16 lease liabilities) over earnings before interest, tax, depreciation, amortisation, and adjusting items for the preceding 12 month period (adjusted for acquisitions and disposals made during the financial year, and to remove the income effect of IFRS 16 Leases). This definition is in accordance with the Group’s covenants.
Why this is a KPINet debt/EBITDA is a key measure of balance sheet strength and financial stability.
2021 PerformanceNet debt reduced by £306 million to £1,795 million, reflecting strong cash flow, while net debt/EBITDA ended the year at 2.2 times, broadly similar to last year and a good reduction compared to the half year at 2.4 times.
Adjusted return on average capital employed1
DefinitionEarnings before interest, tax, amortisation and adjusting items as a percentage of average capital employed, including goodwill, over the prior 12 month period.
Why this is a KPIOur target ROACE to be delivered throughout the economic cycle, is above our cost of capital. ROACE is a key measure of financial success and sustainability of returns and reflects the returns available for investment in the business and for the servicing of debt and equity. All investments and acquisitions are assessed with reference to this target.
2021 PerformanceROACE declined 240 basis points to 8.2 per cent, reflecting the reduction in adjusted operating profit for the business in the year on a stable capital base.
2021 Target: ≤2.0x
2021
2020
2019
2.2x
2.1x
2.3x
0 2.5
2021 Target: 12%-15%
2021
2020
2019
8.2%
10.6%
13.6%
0 15
2021 Target: 10%-12%
2021
2020
2019
8.4%
10.9%
10.2%
0 12
2021 Target: ≥100%
2021
2020
2019
150%
103%
102%
0 150
Annual Report 2021 dssmith.com 35
STRATEGIC REPORT

Operating review
OverviewThrough clear and consistent strategic direction we have positioned our business as a solely fibre-based Group, centred on innovation and sustainability with the scale and expertise to deliver for multinational consumer companies predominantly in the fast moving consumer goods (FMCG) and e-commerce sectors.The start of the 2020/21 financial year coincided with the initial impacts of Covid-19 being felt across many parts of the business. This manifested in an initial fall in our packaging volumes and significant volatility in the cost of various raw materials. In response we invested in safeguarding the health and safety of our colleagues, and in the security and operational effectiveness of all our sites. This was in addition to carrying additional costs from production underutilisation. The effect of the above was a significant fall in profitability during the first quarter of the year.With all our sites fully operational and the maintenance of high levels of customer service, we started to see a good gain in market share with increasingly positive volume growth, primarily in the FMCG/e-commerce sectors, during the second quarter of the year. This was combined with a lessening in the volatility of input costs. The second quarter of the year therefore showed a significant improvement in the run-rate of profitability over the first quarter, albeit at a lower level than the comparative period last year.Encouragingly, the momentum in packaging volumes seen in the second quarter has continued to build throughout the remainder of the financial year resulting in second half growth of 8.2 per cent, against the previous comparative period, which compares to -1.0 per cent in the first half.The strong demand for packaging was accompanied by an increase in input costs, particularly in the fourth quarter of the financial year. Given the strong demand, and good levels of customer service, these costs are starting to be recovered with good initial progress.Overall profitability in H2 therefore showed a strong improvement over the first half and significantly closed the underperformance with the comparative period last year. Our US operations have performed very well, particularly in H2, with profit for the year up 70 per cent (on a constant currency basis) compared to the prior year, and H2 63 per cent ahead of H1, reflecting strong corrugated box volumes overall and improved paper and packaging market pricing in the second half.During the year we continued to invest in our business to capitalise on the accelerated growth trends of e-commerce and sustainability and the strong pipeline of opportunities ahead. This included the announcement of two new state-of-the-art packaging plants in Italy and Poland, increased investment in digital platforms and innovation of new products.
Focus on people and customers during Covid-19Throughout the Covid-19 pandemic our primary focus has been on the health and wellbeing of our c. 29,000 employees, who have responded magnificently to the challenge. Secondly, we have focused on maintaining an uninterrupted supply to our customers,
the majority of whom are FMCG companies which are essential in the food supply chain. As such, our factories were classified by governments as essential operations and I am extremely proud that all our Paper and Packaging sites have remained operational throughout the pandemic. New ways of working have been implemented to reflect the best guidance on safe operations, which led to some additional costs. In the year 2020/21, we saw a reduction in our overall box volumes during the first quarter principally due to weakness in the industrial customer categories, together with increased volatility of input costs, when the crisis was at its peak. The greater impact however has been from the cost of paper for recycling (PfR) and old corrugated cases (OCC). Here, we were impacted by an initial, short increase in prices in May and June 2020, due to sudden and extreme supply constraints caused by national lockdowns. These initial short spikes were not recovered in paper prices; however, the subsequent rises which occurred in H2 coupled with strong demand for paper have been reflected in higher paper prices which are being passed through to packaging prices along with other inflationary costs.
Strong organic growth momentumOrganic corrugated box volumes have grown 3.5 per cent across the year, reflecting substantial growth from H1 (-1.0 per cent) into H2 (+8.2 per cent). The progression in H2 was driven by exceptionally strong growth from Northern Europe, notably the UK, and strong growth also in Eastern Europe and North America. E-commerce was the driver behind much of the growth reflecting very substantial growth with existing e-commerce customers, while working with other customers to accelerate their transition into e-commerce sales.The core market growth drivers of e-commerce, consumer and retail channel evolution and plastic substitution are more relevant than ever in the post Covid-19 world. Public awareness of the importance of alternatives to plastic packaging has continued to grow over the past 12 months despite the pandemic and we have continued to develop corrugated packaging alternatives to take advantage of this opportunity. Our packaging growth has also been supported by the development and implementation of new digitally enabled platforms that allow for enhanced ways of working with our customers. These include, for example, digital virtual creation centres that allow for the remote development of new products and designs through to platforms that enable the placing of new orders centrally with delivery from our extensive distribution network throughout Europe. For the full year, revenue declined 1 per cent on a constant currency basis. There was an overall positive contribution from corrugated box volumes (£123 million), having been negative (down £21 million) in H1, demonstrating the strength of growth in H2. This benefit was offset by reduced box pricing throughout H1, reflecting the annualisation of lower paper pricing in prior periods with some net improvement in H2 (£137 million decline for the full year), and a decline in other volumes (£60 million) particularly due
36
to increased paper and recyclate integration and reduced volumes of corrugated sheet sold externally. Operating profit declined year-on-year to £311 million (2019/20: £455 million). Adjusted operating profit fell by 24 per cent on a constant currency basis to £502 million (2019/20: £660 million), resulting in a return on sales for the Group of 8.4 per cent (2019/20: 10.9 per cent). This profit decline was despite corrugated box volume growth of £40 million, offset by additional costs incurred by the business in dealing with Covid-19 and ensuring all our colleagues were safe and our factories remained operational, and a more general input cost volatility, particularly in recyclate, in total a £66 million headwind. Profits were also impacted by the lower average selling prices for boxes, largely in H1 (as set out above), although in H2 we have seen more general price inflation. Corrugated box prices stabilised through H2 as the testliner price also increased, with some annualised pricing declines offset by new price increases agreed, with the increased box prices expected to continue to benefit the business as we progress through the current financial year. The Europac acquisition synergies came in as expected at £21 million, completing the programme of €70 million overall.Basic earnings per share from continuing operations fell 38 per cent on a constant currency basis to 13.3 pence (2019/20: 21.2 pence). Adjusted basic earnings per share of 24.2 pence fell by 28 per cent compared to the prior year on a constant currency basis (2019/20: 33.2 pence), reflecting the decline in operating profit.
Momentum in our businessOur corrugated box business is over 80 per cent weighted by volume to the growing FMCG, e-commerce and consumer sector, with the remaining sectors being mainly industrial, such as automotive and chemicals. E-commerce volumes are split across FMCG and the other consumer categories, depending on the product sold. The benefit of this end-customer profile is both the resilience of volumes in difficult economic times, as seen in our H1 period, and the exceptional growth evidenced in the past six months, as consumers have appreciated the convenience of e-commerce and our customers have expanded their offerings, and we expect this trend to continue. Box pricing is also gathering momentum. In the past year, particularly in H2, paper prices have increased materially and we are actively recovering these through well established pricing mechanisms albeit with the customary level of delay. This is consistent with 2017 and 2018, when paper prices of similar magnitudes were all successfully recovered. Exceptionally strong demand for packaging has allowed us to ensure this price recovery is already well progressed with the major benefit to fall in the 2021/22 financial year. Overall, the acceleration of volumes and momentum in pricing resulted in much stronger H2 profitability versus H1, with adjusted operating profit for the H2 period of £272 million versus £230 million for the H1 period.
Investing for growth We continue to invest behind the strong structural demand for our products and are focused on ensuring we are able to respond to our customer needs across our global footprint. As announced in December 2020, we are building two new greenfield corrugated box plants, in Italy and Poland. Both represent additional packaging capacity, including dedicated equipment focused on
e-commerce packaging. The Polish site will be quickly filled with existing customer demand and the Italian site will allow us to expand further our strong e-commerce offer. Work on both sites has begun and both are expected to begin operations in Q4 of the current financial year. In addition to these new sites, we are significantly expanding our Arnstadt packaging facility in Germany, a site which serves a range of high quality FMCG customers. Together, these three site developments add c. 5 per cent to our corrugated capacity. Capex for 2021/22 is expected to increase from the £323 million in 2020/21 to around £430 million of which c. 55 per cent has been allocated to growth, efficiency and environmental capex. We remain extremely focused on capital allocation and where possible recycling capital from disposal of non-core assets into investment in growth assets. All the projects undertaken have estimated returns on capital in excess of the Group target ROACE.
Leading the way in sustainabilitySustainability has been at the heart of our business for many years as we have developed and grown into a solely fibre based packaging business. This has accompanied the setting of stretching environmental targets since 2011 that have been consistently upgraded on the back of strong performance and also the desire to consistently outperform our customers’ requirements. Our latest sustainability strategy, Now and Next, was launched in the autumn of 2020. This is focused on the circular economy, where we take the leading packaging role as well as carbon reduction. This policy includes 26 KPIs covering a broad range of sustainability issues, from carbon reduction to recyclability, where DS Smith can and does make a difference. On 9 June 2021, we announced a series of further enhanced climate targets. These include a science-based target which requires a minimum 40 per cent reduction of CO2 emissions per tonne of product by 2030, compared to 2019 levels, and a commitment to reach at least Net Zero emissions by 2050. These targets will be validated by the Science Based Targets initiative as in line with the goals of the Paris Agreement. To further underline the Group’s ambition and commitment, we also announced our membership of the UN’s Race to Zero.This year, we have continued to deliver against all of our ESG targets. Most notably, our CO2e emissions (per tonne of production) have reduced by 23 per cent compared to our comparative 2015 baseline. This excellent reduction puts us ahead of target to deliver against our current goal of 30 per cent by 2030. Please go to our website and/or our latest Sustainability Report for more details on our delivery against ESG goals.In addition to our progress against our own sustainability targets, we continue to work actively with our customers to help them address their sustainability challenges. Our circular design principles and our recently-launched circularity metrics allow us to analyse our customers’ increasing sustainability requirements. We have invested significantly in training and development in our designers’ capabilities, which differentiates our offering as we drive re-use, recyclability, carbon and other resource utilisation for the benefit of our customers, their customers and the environment.
Annual Report 2021 dssmith.com 37
STRATEGIC REPORT

DividendThe Board considers the dividend to be a very important component of shareholder returns. In December 2020 we announced an interim dividend of 4.0 pence per share. Our policy is that dividends will be progressive and that, in the medium term, dividend cover should be on average of 2 to 2.5 times (relative to adjusted earnings per share), through the cycle. Accordingly, we are announcing a final dividend for this year of 8.1 pence, taking the total dividend for the year to 12.1 pence (2019/20: nil), in line with our policy.
Our medium-term targets and key performance indicatorsWe measure our performance according to both our financial and non-financial medium-term targets and key performance indicators. Whilst a number of the outcomes are clearly disappointing, they are reflective of a highly unusual year and the Board is committed to restoring our performance to the levels of achievement prior to the pandemic.As set out above, like-for-like corrugated box volumes grew by 3.5 per cent, well ahead of our target of GDP+1 per cent of -5.5 per cent, based on year-on-year GDP growth to 30 April 2021, weighted by our sales in the markets in which we operate, estimated at -6.5 per cent. The GDP figure is particularly impacted by Covid-19. As described earlier, volume growth has been led by growth with e-commerce and consumer-focused customers. Return on sales fell 250 basis points to 8.4 per cent (2019/20: 10.9 per cent), due to the overall fall in adjusted operating profit, below our medium-term target range of 10 to 12 per cent. Adjusted return on average capital employed (ROACE) is 8.2 per cent (2019/20: 10.6 per cent), below our medium-term target range of 12 to 15 per cent. The reduction reflects the decline in adjusted operating profit, and the continued impact of Interstate Resources in North America and of Europac in Europe, which have been dilutive to return on capital in these initial years. This pattern was also seen at the time of the SCA Packaging acquisition in 2012, where ROACE initially dipped and then built up as the acquisition synergies were fully realised and our expectations are for ROACE to improve into the target range as the effects of the pandemic are reduced.Net debt as at 30 April 2021 was £1,795 million (30 April 2020: £2,101 million), with the reduction principally due to excellent cash management resulting in free cash flow of £486 million. Working capital performance was extremely good with both a strong focus in the business and the benefit of rising input costs such as paper and OCC on our payables. Some of this commodity related payables benefit may reverse in 2021/22. Cash generated from operations before adjusting cash items of £943 million was used to invest in net capex of £323 million, an 11 per cent reduction on the prior year reflecting capex constraints put in place at the start of the year and eased later in the year. Net debt/EBITDA (calculated in accordance with our banking covenant requirements) is 2.2 times (2019/20: 2.1 times), substantially below our banking covenant of 3.75 times. The Group remains fully committed to its investment grade credit rating.During the year, the Group generated free cash flow of £486 million (2019/20: £354 million), despite the reduction in profit. Cash conversion, as defined in our financial KPIs (note 32), was 150 per cent, well ahead of our target of being at or above 100 per cent.
DS Smith is committed to providing all employees with a safe and productive working environment. We are pleased once again, for the 12th consecutive year, to report improvements in our safety record, with our accident frequency rate (defined as the number of lost time accidents per million hours worked) reducing by a further 14 per cent to 2.06, reflecting our ongoing commitment to best practice in health and safety. We are proud to report that 246 sites achieved our target of zero accidents this year and we continue to strive for zero accidents for the Group as a whole.The Group has a challenging target for customer service of 97 per cent on-time, in-full deliveries. Despite the significant operational challenges due to Covid-19, in the year we achieved a continued strong performance at 95 per cent. However, management remains fully committed to delivering our target and the highest standards of service, quality and innovation to all our customers and we will continue to challenge ourselves to meet the demanding standards our customers expect. Other markers of quality such as our defects rate (measured in parts-per-million) have improved significantly, having reduced 22 per cent.
Operating reviewUnless otherwise stated, any commentary and comparable analysis in the operating review is based on constant currency performance.
Group
£m
Year ended 30 April
2021
Year ended 30 April
2020Change – reported
Change – constant currency
Revenue £5,976m £6,043m (1%) (1%) Adjusted operating profit1 £502m £660m (24%) (24% )Operating profit £311m £455m (32%) (32%) 1. Adjusted to exclude amortisation and adjusting items.
Revenue from corrugated box volume growth offset by a reduction in sales price and mix resulted in a decrease in revenue of 1 per cent. Operating profit declined 32 per cent to £311 million due to the decline in sales price and mix and input cost headwinds, partially offset by the benefit from strong volume growth.
Northern Europe
£m
Year ended 30 April
2021
Year ended 30 April
2020Change – reported
Change – constant currency
Revenue £2,370m £2,333m +2% +1%Adjusted operating profit1 £138m £219m (37%) (37%)Return on sales1 5.8% 9.4% (360bps) (350bps)
1. Adjusted to exclude amortisation and adjusting items.
The Northern Europe division has seen very strong corrugated box volume growth, reflecting an exceptional level of growth in the UK, driven in particular by e-commerce, and good trading in Benelux and Germany.While revenues remained broadly flat, the reduction in adjusted operating profit reflects very good corrugated box volume growth more than offset by the annualisation of pricing declines, and a significant impact on input costs in our paper mills due to the volatility in OCC pricing. This region has a higher proportion of higher value point-of-sales and display business which was particularly badly impacted by retailers in-store activity during lockdowns. Return on sales reduced by 350 basis points to
OPERATING REVIEW CONTINUED
38
5.8 per cent. The recovery of the higher paper prices and margins is well underway and in-store retail activity is also recovering quickly.
Southern Europe
£m
Year ended 30 April
2021
Year ended 30 April
2020Change – reported
Change – constant currency
Revenue £2,156m £2,214m (3%) (4%)Adjusted operating profit1 £223 £314m (29%) (30%)Return on sales1 10.3% 14.2% (390bps) (390bps)
1. Adjusted to exclude amortisation and adjusting items.
Volumes in the year have grown across the region, driven by good volume growth in Italy, while revenues declined 4 per cent as average selling prices reflected prior paper price declines.Adjusted operating profit fell by 30 per cent, reflecting the challenging economic and market environment and in particular the volatility of OCC and of pulp used at our Viana kraftliner mill. This region was particularly badly impacted in H1 with significantly lower tourist and agricultural activity in the early months of the pandemic.
Eastern Europe
£m
Year ended 30 April
2021
Year ended 30 April
2020Change – reported
Change – constant currency
Revenue £909m £892m +2% +2%Adjusted operating profit1 £78m £88m (11%) (10%)Return on sales1 8.6% 9.9% (130bps) (120bps)
1. Adjusted to exclude amortisation and adjusting items.
Volumes in this region have again been very good throughout the period, with particularly strong performance in operations in Poland and the Baltics, with revenues increasing 2 per cent. Adjusted operating profit fell by 10 per cent, reflecting declines in both the Paper and Packaging operations in the region. The region has less paper capacity than the others and as such did not see the same impact from the OCC volatility in the period.
North America
£m
Year ended 30 April
2021
Year ended 30 April
2020Change – reported
Change – constant currency
Revenue £541m £604m (10%) (5%)Adjusted operating profit1 £63m £39m +62% +70%Return on sales1 11.6% 6.5% +510bps +510bps
1. Adjusted to exclude amortisation and adjusting items.
Volumes in the region have been very good, reflecting growth in a number of packaging sites as we manage the ramp-up of the new box plant in Indiana. Full utilisation is expected to be completed on plan in the financial year 2022/23. Volumes in North America were badly impacted by Covid-19 in Q1 due to certain customer site closures, so the recovery through the year has been particularly pleasing and a testament to the support and confidence of many old and new customers to our new products, production capacity and ways of working.
Revenue fell 5 per cent, principally due to increased internal utilisation of paper. Adjusted operating profit for the division improved by 70 per cent, reflecting improved volumes across our packaging plants, including the ramp-up of the new Indiana site, the improvement in domestic paper and packaging pricing and the US export paper price. As a result, return on sales improved to 11.6 per cent, with H2 profitability substantially ahead of H1.
Brexit The UK left the EU in January 2020 and the transition period ended on 31 December 2020. The UK comprises 15 per cent of Group revenue with the majority of our operations in continental Europe. Product for UK customers is largely manufactured within the UK and materials sourced within the UK, and as such we did not experience substantial disruption in the first few months of 2021 as the new trading arrangements between the UK and EU came into place. While there are some friction impacts of Brexit, in particular limited capacity with carriers and brokers at the start of the year, we have planned, in collaboration with key trading partners, and accordingly the overall impact on DS Smith has not been material.
OutlookThe continued investment in our business, together with the strong support of our customers and the momentum built over recent quarters, give us confidence for the current year and future. Whilst the business has seen reduced profitability over the last twelve months, we firmly believe that we exit 2020/21 stronger, further focused on the accelerated opportunities a post-Covid-19 world offers and that our customers will continue to recognise this going forward.The current year has started well, with the volume momentum of the final quarter of FY21 continuing into this year. Inflationary cost pressures have also continued, in particular OCC, but also other costs such as energy, transport and labour. Packaging prices have started to increase and we expect to fully recover these increasing costs.Accordingly, while there remains uncertainty in the overall economic environment, demand is strong and we expect to make good progress this year.
Annual Report 2021 dssmith.com 39
STRATEGIC REPORT

FINANCIAL REVIEW
Robust performance despite challenging environment
Overview2020/21 presented a variety of challenges, most notably the economic contraction triggered by the Covid-19 pandemic. From an operations standpoint the business continued uninterrupted throughout the year in all regions, providing essential products and services to its customers.
After a challenging first half year influenced by the pandemic, the second half year saw a strong recovery in box volumes across all regions with momentum continuing to build throughout the period. The recent commencement of work on greenfield sites in Italy and Poland will add further capacity to the growing demand in these markets. The Indiana site in North America continues to drive both packaging volume growth and a shortening of the paper position in this market, in line with our long-term strategic objectives.
The business experienced higher input costs in 2020/21, most notably the cost of recyclate. The final quarter of 2019/20 saw fibre prices close to record lows; however, dual price spikes in Q1 and Q4 of 2020/21 drove the average cost of paper production significantly higher. During the first half of the year, paper prices continued the decline seen in H2 of 2019/20. However, the second half saw prices increase above pre-pandemic levels, driven by both tightness of demand and increases in core input costs.
The effective pass-through of these higher prices on to customers in both the Paper and Packaging businesses mitigated some of the input cost impact and will continue to be a key focus area in 2021/22.
During this significant period of macro-economic uncertainty, the Group remains committed to achieving its medium-term financial measures and key performance indicators, as established by the Board. The results, which do not make any adjustments for the impact of Covid-19, are described below:
• Organic corrugated box volume growth of 3.5 per cent (2019/20: +0.6 per cent)
• Revenue down 1 per cent on a constant currency and reported basis to £5,976 million (2019/20: £6,043 million)
• Adjusted operating profit of £502 million, a decrease of 24 per cent on a reported and constant currency basis (2019/20: £660 million)
• 32 per cent decrease in operating profit to £311 million on a statutory basis; 32 per cent decrease on a constant currency basis (2019/20: £455 million)
• 38 per cent decrease in statutory profit before tax to £231 million on a constant currency basis and 37 per cent decrease on a reported basis (2019/20: £368 million)
“Excellent box volume growth year-on-year and strong cash performance demonstrated the resilience of our business model, with uninterrupted operation through the extraordinary pandemic challenges, working to meet customers’ needs. Our new greenfield investments provide further growth and reflect our ongoing commitment to supplying sustainable, innovative fibre based packaging solutions, providing the leadership our customers expect from us.”Adrian Marsh, Group Finance Director
40
• Decrease in adjusted return on sales of 250 bps to 8.4 per cent (2019/20: 10.9 per cent)
• Adjusted return on average capital employed of 8.2 per cent (2019/20: 10.6 per cent)
• Net debt to EBITDA ratio of 2.2 times (2019/20: 2.1 times)• Cash conversion 150 per cent (2019/20: 103 per cent).Unless otherwise stated, the commentary below references the continuing operations of the Group.
Non-GAAP performance measuresThe Group presents non-GAAP measures alongside reported measures, in order to provide a balanced and comparable view of the Group’s overall performance and position. Non-GAAP performance measures eliminate amortisation and unusual or non-operational items that may obscure understanding of the key trends and performance. These measures are used both internally and externally to evaluate business performance, as a key constituent of the Group’s planning process, they are applied in the Group’s financial and debt covenants, as well as comprising targets against which compensation is determined. Amortisation relates primarily to customer contracts and relationships arising from business combinations. Unusual or non-operational items include business disposals, restructuring, acquisition related and integration costs and impairments, and are referred to as adjusting items.Reporting of non-GAAP measures alongside statutory measures is considered useful by investors to understand how management evaluates performance and value creation, enabling them to track the Group’s performance and the key business drivers which underpin it and the basis on which to anticipate future prospects.Note 32 explains further the use of non-GAAP performance measures and provides reconciliations as appropriate to information derived directly from the financial statements. Where a non-GAAP measure is referred to in the review, the equivalent measure stemming directly from the financial statements (if available and appropriate) is also referred to.
Trading resultsRevenue decreased by 1 per cent on a reported basis to £5,976 million (2019/20: £6,043 million). Despite higher box volumes, Packaging revenue saw a reduction in realised selling prices, largely reflecting the decline in paper price benchmarks in H2 2019/20 and H1 2020/21. Strong internal demand for paper meant that the Group continued to integrate further in 2020/21. This also contributed to lower revenues as a higher proportion of the paper produced in the Group’s own paper mills was consumed internally by the Group’s box plants rather than being sold externally. These impacts were partially offset by higher recyclate prices sold externally in both Europe and North America.Reported revenues are subject to foreign currency translation effects. In the year, the euro accounted for 59 per cent of Group revenue. As such, the movements of the euro against sterling during the year constituted the majority of the £20 million of
positive foreign exchange translation impact. On a constant currency basis, revenues decreased by 1 per cent.Corrugated box volume growth of 3.5 per cent (2019/20: 0.6 per cent growth) reflects the resilience of the Group’s business model and the momentum seen in its core markets and segments, with market share gains in all segments. While Q1 growth was constrained by the unfolding pandemic, box volumes rebounded progressively from Q2 onwards. The Group was well positioned to meet the corresponding changes in consumer behaviour which drove higher demand for both e-commerce and FMCG products. The Group target of volume growth of GDP+1 per cent was achieved during 2020/21, with GDP (weighted by the countries’ mix) estimated at -6.5 per cent for the 12 months to April 2021. As a Group, c. 82 per cent of corrugated box volumes are sold to consumer goods customers, substantially ahead of the industry average, an indicator that the continued development of tailored and innovative packaging solutions is regarded as a differential offering in the market.Adjusted operating profit of £502 million on a reported basis is a decrease of 24 per cent (2019/20: £660 million). This reduction is largely attributable to pandemic effects with a lower average selling price and mix in the Packaging and Paper business (£(137) million) as a result of declining paper benchmarks, volatile input costs (£(66) million) and lower other volumes of £(19) million.These impacts were partially offset by higher box volume (£40 million), continued strong delivery of Europac synergies (£21 million) and FX and other impacts (£3 million).Operating profit at £311 million, is a decrease of 32 per cent both on a constant currency and reported basis (2019/20: £455 million). The Group benefitted from a strong performance by the Packaging business in mitigating various commercial pressures, including the headwinds of cost inflation prior to the pandemic and lately the impact of rising paper prices. In addition, the strong focus on value-added packaging and overall performance improvement targeted in North America more than offset the start-up costs associated with the commissioning and progression towards full operation of the new facility in Indiana, US.Depreciation increased to £304 million on a reported basis (2019/20: £296 million), an £8 million increase driven by the additional capital commissioned during the year to support the Group’s growth programme. Amortisation decreased marginally to £142 million.The Group has continued to focus on margin recovery through commercial disciplines and ongoing cost management and efficiency programmes, but the impact of the pandemic, in spite of the resilience demonstrated by the Group, led to an adjusted return on sales decrease of 250 basis points to 8.4 per cent (2019/20: 10.9 per cent). The Group does not expect a repeat of the costs incurred specifically in keeping our colleagues safe and our factories open.
Annual Report 2021 dssmith.com 41
STRATEGIC REPORT

FINANCIAL REVIEW CONTINUED
The adjusted return on average capital employed (ROACE) decreased to 8.2 per cent (2019/20: 10.6 per cent). The ROACE remains below the target set by the Board of 12 to 15 per cent and the Board remains fully committed to achieving this target again as global economies recover from the pandemicIncome statement – from continuing operations (unless otherwise stated)
2020/21£m
2019/20 £m
Revenue 5,976 6,043Adjusted operating profit1 502 660Operating profit 311 455 Adjusted return on sales1 8.4% 10.9%Adjusted net financing costs (78) (87)Share of profit of equity-accounted investments, net of tax 5 7Profit before income tax 231 368 Adjusted profit before income tax1 429 580 Adjusted income tax expense 1 (97) (125) Adjusted earnings1 332 455 Profit from discontinued operations, net of tax 12 237Basic adjusted earnings per share 24.2p 33.2pProfit for the year attributable to owners of the parent (including discontinued operations) 194 527Basic earnings per share from continuing and discontinued operations 1 14.2p 38.5p Basic earnings per share 13.3p 21.2p
1. Adjusted to exclude amortisation and adjusting items (see note 4).
Covid-19The Group’s operations across all its regions were affected throughout the year by the pandemic. However, as an essential supplier for critical supply chains in areas such as FMCG food and drink, pharmaceuticals and other essential suppliers the Group’s sites remained fully operational throughout the period. The Group adapted quickly to changes in the box demand profile as a result of the pandemic, with strong volume growth achieved in both e-commerce and FMCG segments. Lockdown-induced disruption in waste collections has resulted in a volatile year in the recyclate market. Prices spiked in Q1 and then fell across the summer months before spiking again in the final quarter of the year with prices now at or near a historical high in certain core markets.
Adjusting itemsAdjusting items before tax and financing costs were £49 million (2019/20: £62 million). The costs primarily consisted of ongoing integration programmes relating to acquisitions made in prior years of £17 million (2019/20: £30 million) and other restructuring programmes of £27 million (2019/20: £24 million). Of the integration costs, £14 million related to the Europac integration programme,
including costs to deliver synergy projects implemented during the year, IT operational costs and site rebranding, and £3 million related to the North American integration programme, which included the centralisation of transaction processing in that region. Both these integration programmes were highlighted in their respective Class 1 circulars and have now completed in this financial year.Within restructuring costs, £23 million principally relates to a major restructuring programme in Germany and a structured review of the underlying, indirect cost base of the European Packaging business.Merger and acquisition-related costs of £2 million (2019/20: £10 million) were incurred, being predominantly professional advisory fees, and contractual deferred consideration payments on prior year acquisitions.Loss on divestments was £3 million primarily relating to the disposal of a small sheet plant operation in North America. Within discontinued operations, the gain related to the finalisation of certain provisions made on disposal of the Plastics business and the recognition of a deferred tax asset of £9 million arising on tax losses in relation to the disposal. The Group continues to provide transitional support services to the buyer. Adjusting items in 2021/22 are estimated to be less than £10 million.
Interest, tax and earnings per shareNet finance costs were £85 million (2019/20: £94 million). The decrease of £9 million on last year is primarily a result of lower levels of debt throughout the year. The employment benefit net finance expense of £3 million has remained at a similar level to the prior year.Adjusting financing costs of £7 million (2019/20: £7 million) represents the unwind of the Interstate Resources put option.The share of profits of equity-accounted investments was £5 million (2019/20: £7 million).Profit before tax decreased by 37 per cent on a reported basis to £231 million (2019/20: £368 million), driven by the decrease in operating profit, partly offset by a reduction in financing costs. Adjusted profit before tax of £429 million (2019/20: £580 million) decreased by 26 per cent on a reported basis, again due to the decrease in the underlying adjusted operating profit.The tax charge of £49 million (2019/20: £78 million) reflects the impact of lower profits and recognition of a deferred tax asset on losses in France, partially offset by an increase in provisions in relation to uncertain tax positions on non-adjusting items. The Group’s effective tax rate on adjusted profit, excluding amortisation, adjusting items and associates was 23.0 per cent (2019/20: 22.0 per cent). The tax credit through adjusting items was £16 million (2019/20: £14 million).The previous year discontinued operations profit after tax of £237 million includes the £230 million net gain on sale of the Plastics business.
42
Reported profit after tax, amortisation and adjusting items for continuing and discontinued operations was £194 million (2019/20: £527 million).The decrease in operating profit led to a decrease of 37 per cent in basic earnings per share on a reported basis to 13.3 pence (2019/20: 21.2 pence), with adjusted earnings per share 27 per cent lower at 24.2 pence (2019/20: 33.2 pence).
Acquisitions and disposalsIn recent years, the Group’s strategy has focused on growth in order to support our global customers in the regions in which they operate. Throughout 2020/21, the Group continued to successfully integrate earlier acquisitions, including Europac in Iberia and Corrugated Container Corporation in North America, both acquired in 2018/19 and Interstate Resources in North America, acquired in 2017/18. As set out in the respective Class 1 acquisition circulars for Interstate and Europac, the integration programmes have now concluded.During 2019/20 , the Group agreed to the purchase of a further 10 per cent holding in Interstate Resources for £106 million, following the exercise of part of the pre-existing put option by the former owners of that business. A cash settlement of £82 million was made in June 2020 with the balance to be paid in October 2021. The final 10 per cent stake remains subject to the put option conditions.
Cash flowReported net debt of £1,795 million (30 April 2020: £2,101 million) has decreased from the prior year, driven by higher cash inflows from operating activities and steps taken during the year to conserve cash during the pandemic.Net working capital inflows of £173 million are driven by a strong focus on cash management, in particular cash collection, inventory management and influenced by higher commodity prices, most notably the cost of recyclate and paper costs at the end of the year leading to increases in trade payables at the year-end compared to the prior year. The Group has demonstrated ongoing success in driving sustainable working capital improvements. Trade receivables factoring is £21 million lower than April 2020 at £407 million. Going forward the Group expects to continue to sell high credit quality receivables under this programme within the range £350-400 million outstanding at any one time. This is a reduction of some 30 per cent from the peak balance of £565 million in 2018.Net capital expenditure decreased by £41 million to £323 million in the year. Spending on some capital projects was initially delayed until greater confidence in the economic outlook was established. However, despite these constraints, the Group continued to focus on growth and efficiency capital projects, which represented 53 per cent of the reported spend in the year. Proceeds from the disposal of property, plant and equipment were £8 million (2019/20: £12 million).Tax paid of £66 million is £28 million lower than the prior year, as a result of tax receipts of £20 million in North America, lower tax payments in general and the timing of certain payments.
Net interest payments of £68 million decreased by £9 million over the prior year driven by the maturity of debt bearing higher interest rates and a lower net debt position throughout the year. The remainder of interest principally comprises interest on the Euro medium-term notes and US private placements, with amortisation of debt issuance and other finance costs accounting for the majority of the difference between cash interest paid and finance costs reported in the income statement. Cash outflows associated with adjusting items decreased by £5 million to £48 million, and include restructuring and integration costs. The current year reduction is driven by a further decrease in merger and acquisition costs incurred in the prior year.No dividend payments were made during the year, with payments resumed in May 2021.Cash generated from operations before adjusting cash items increased by £54 million to £943 million. Net cash inflow was £366 million, a £195 million decrease on the prior year, which benefitted from the disposal proceeds of the Plastics business and the Europac remedy disposals of £480 million.Acquisitions and disposals of £74 million in the year include payments made for the 10 per cent settlement of the Interstate put option of £82 million and proceeds from the sale of a small sheet business in North America of £16 million.
Cash flow2020/21
£m2019/20
£m
Cash generated from operations before adjusting cash items 943 889Capital expenditure (net of disposal of fixed assets) (323) (364)Tax paid (66) (94)Net interest paid (68) (77)Free cash flow 486 354Cash outflow for adjusting items (48) (53)Dividends – (222)Acquisitions and disposals of businesses, net of cash and cash equivalents (74) 480Other 2 2Net cash flow 366 561Issue of share capital 3 2Loans, borrowings and finance leases divested 3 2Foreign exchange, fair value and other movements (56) (118)Net debt movement – contining operations 316 447Net debt movement – discontinued operations (10) (29)IFRS 16 right-of-use obligation at 1 May 2019 – (242)Opening net debt (2,101) (2,277)Closing net debt (1,795) (2,101)
Annual Report 2021 dssmith.com 43
STRATEGIC REPORT

FINANCIAL REVIEW CONTINUED
Statement of financial positionAt 30 April 2021, shareholder funds increased to £3,533 million, from £3,350 million in the prior year. Profit attributable to shareholders of £194 million contributed to the growth (2019/20: £527 million), which was increased by a net change in cash flow hedges of £112 million (2019/20: £32 million loss), offset by actuarial losses on employee benefits of £5 million (2019/20: £46 million loss) and foreign currency translation effects of £95 million (2019/20: credit of £39 million). There were no dividends paid in the year (2019/20: £222 million). Equity attributable to non-controlling interests was £2 million (2019/20: £1 million).The Group’s bank and private placement debt covenants stipulate the methodology upon which the net debt to adjusted earnings before interest, tax, depreciation and amortisation (EBITDA) ratio is to be calculated. Factored receivables and the effects of IFRS 16 Leases, adopted since 1 May 2019, are excluded from the ratio’s determination. The ratio has increased to 2.2 times, as the reduction in EBITDA more than offset the improvement in debt, but represents an improvement from the H1 position of 2.4 times. The ratio remains compliant with the covenant requirements, which across all banking debt is 3.75 times. We retain a 3.25 times level in the remaining US Private Placement loan notes ($298 million) of which $30 million will mature by August 2021 and the balance by August 2022. As the exercise of the second tranche of the Interstate Resources put option is still outstanding at 30 April 2021, this has not been factored in to the calculated ratio. If the exercise of the remaining 10 per cent stake subject to the put option was included, the ratio would increase to c. 2.4 times. The Group’s publicly traded euro and sterling bonds are not subject to any financial covenants. The bonds are, however, subject to a coupon step up of 125 basis points for any period the Group falls below an investment grade credit rating.The Group is also compliant with a second banking covenant requiring an EBITDA to net interest payable ratio of not less than 4.50 times.The covenant calculations also exclude income statement items identified as adjusting by the Group and any interest arising from the defined benefit pension schemes. At 30 April 2021, the Group has substantial headroom under its covenants, with the future outlook assessed as part of the annual going concern review. The Group’s investment grade credit rating from Standard and Poor’s remains stable at BBB-, which takes into account all the items excluded from covenant calculations and working capital.
Statement of financial position
30 April 2021
£m
30 April 2020
£m
Intangible assets 2,995 3,197Property, plant and equipment 3,050 3,042Right-of-use assets 226 256 Inventories 537 518Trade and other receivables 819 772Cash and cash equivalents 813 595Other 260 245Total assets 8,700 8,625Bank overdrafts (94) (90)Borrowings (2,301) (2,398)Trade and other payables (1,849) (1,723)Provisions (56) (70)Employee benefits (175) (199)Lease liabilities (230) (255)Other (460) (539)Total liabilities (5,165) (5,274)Net assets 3,535 3,351Net debt 1,795 2,101Net debt to EBITDA ratio 2.2x 2.1x
Energy costsProduction facilities, in particular paper mills, are energy intensive, therefore energy costs are significant for the Group. In 2020/21, costs for gas, electricity and other fuels, net of periodic local incentives, were £325 million (2019/20: £318 million). This year-on-year comparison does, however, mask a significant increase in energy costs from H1 £146 million to H2 £179 million. The Group continues to invest in energy efficiency projects and limits the exposure to volatile energy pricing by hedging energy costs with suppliers and financial institutions, managed by the Group’s Energy Procurement team.
Capital structure and treasury management In addition to its trading cash flow, the Group finances its operations using a combination of borrowings, property and equipment leases, shareholders’ equity and, where appropriate, disposals of non-core businesses. The Group’s funding strategy is to achieve a capital structure that provides an appropriate cost of capital whilst providing the desired flexibility in short and medium-term funding to enable the execution of material investments or acquisitions, as required.
44
Facilities CurrencyMaturity
Date£m
equivalent
Syndicated RCF 2018 Various 2024-25 1,400Euro medium-term notes EUR 2022-26 1,608Euro RCF 2020 EUR 2023 52Sterling bond medium-term note GBP 2029 250Euro bilateral loans EUR 2021-23 130US dollar private placement USD 2021-22 215Euro term loan EUR 2025 35Committed facilities at 30 April 2021 3,690
ImpairmentThe net book value of goodwill and other intangibles at 30 April 2021 was £2,995 million (30 April 2020: £3,197 million). IAS 36 Impairment of Assets requires annual testing of goodwill and other intangible assets, as well as an assessment of any other assets for which there may be indicators of impairment. As part of this testing, the Group compares the carrying amount of the assets subject to testing with the higher of their net realisable value and value-in-use to identify whether any impairment exists. The asset or group of assets value-in-use is determined by discounting the future cash flows they expect to generate by the assumed pre-tax discount rate of 9.5 per cent, plus a blended country risk premium for each group of assets. Asset values were tested as at 30 April 2021, with no impairment identified as a result of the testing performed.
The Group aims to maintain a strong balance sheet enabling significant headroom within the financial covenants and to ensure continuity of funding by having a range of maturities from a variety of sources. The Group has an investment grade rating from Standard and Poor’s of BBB – stable outlook.The Group’s overarching treasury objective is to ensure sufficient funds are available for the Group to execute its strategy and to manage the financial risks to which the Group is exposed.In November 2018, the Group signed a £1.4 billion five-year committed syndicated revolving credit facility (RCF) with its core banks. The second extension option was exercised in November 2020. £1.1 billion of the facility now matures in 2025 with the remaining £0.3 billion maturing in 2024.Available cash and debt facilities are reviewed regularly to ensure sufficient funds are available to support the Group’s activities. At 30 April 2021, the Group’s committed facilities totalled £3.7 billion, of which £1.5 billion remained undrawn and £3.5 billion matures beyond one year or more. Undrawn committed borrowing facilities are maintained to provide protection against refinancing risk.At 30 April 2021, the committed borrowing facilities had a weighted average maturity of 3.9 years (30 April 2020: 4.5 years). Additional detail on these facilities is provided below. Total gross borrowings at 30 April 2021 were £2,301 million (30 April 2020: £2,398 million). The committed borrowing facilities described do not include the £460 million of three-year committed factoring facilities, which allow the sale of receivables without recourse. Given the three-year committed nature of these facilities, they fully protect the Group from any short-term liquidity risks which may arise from volatility in financial markets.The balance of trade receivables sold as part of the factoring programme decreased by £21 million to £407 million at 30 April 2021 (30 April 2020: £428 million).In November 2019, the Group established a €1 billion Euro Commercial Paper Programme. At 30 April 2021, the programme was undrawn due to the positive cash position in the Group.
Annual Report 2021 dssmith.com 45
STRATEGIC REPORT
FINANCIAL REVIEW CONTINUED
PensionsThe Group’s primary funded defined benefit pension scheme, based in the UK, is closed to future accrual. There are a variety of other post-retirement and employee benefit schemes operated locally for overseas operations, and an additional unfunded scheme in the UK relating to three former directors which is secured against assets of the UK business. In accordance with IAS 19 Employee Benefits (Revised 2011), the Group is required to make assumptions surrounding rates of inflation, discount rates and current and future life expectancies, amongst others, which could materially impact the value of any scheme surplus or liability. A material revaluation of the relevant assets and liabilities could result in a change to the cost to fund the scheme liabilities. The assumptions applied are subject to periodic review.A summary of the balance sheet position as at 30 April is as follows:
30 April 2021
£m
30 April 2020
£m
Aggregate gross assets of schemes 1,178 1,164 Aggregate gross liabilities of schemes (1,353) (1,363)Gross balance sheet deficit (175) (199) Deferred tax assets 40 45 Net balance sheet deficit (135) (154)
The net deficit has decreased versus prior year driven by two scheme settlements and discount rate assumptions having a small impact at 30 April 2021, as well as the asset valuations increasing.
The 2019 triennial valuation of the main UK scheme incorporated updates to underlying scheme assumptions, including demographic and life expectancy rates, which, along with updates surrounding mortality and proportion married assumptions and future improvements, resulted in a net c. 1 per cent increase in the valuation of the scheme liabilities. No changes were made to the previously approved funding plan following the triennial valuation.Total cash contributions paid into the Group pension schemes, reported within cash generated from operations in the cash flow, were £20 million in 2020/21 (2019/20: £20 million), which primarily constitute the agreed contributions under the UK defined benefit scheme deficit recovery plan.
Discontinued operationsThe consolidated statement of cash flows presents a single amount of net cash flow from discontinued operations.During the previous year, 2019/20, the Plastics business was sold, representing £230 million of the £237 million profit from discontinued operations, net of tax. In the current year the gain of £12 million predominantly relates to the recognition of a deferred tax asset (£9 million) relating to the Plastics business disposal.
46
Evolving the way we manage riskOur Group risk policy Our Group risk policy provides the framework to ensure there is a common understanding of risk management practices across all parts of the Group and is fully integrated with our annual corporate planning process. We use these practices to evaluate and accept those risks that we believe we have the capacity, know-how and experience to manage, or to understand and tolerate those risks that we cannot influence, in order to realise the potential opportunities for growth and development.
Changes in 2020/21We recognise that risks are evolving rapidly in our changing world and that requires new ways of thinking and working to identify, assess and manage risks effectively. We continue to build on the solid foundation that we have already established. Our preparedness for events such as the Covid-19 pandemic and the resulting consequences enabled the Group to take a more detailed review and further improve the risk process to obtain better quality output from the corporate planning process and year-end risk assessments. Changes included: • Simplified assessments to clearly make the link between key
risks and our Corporate Plan priorities/opportunities • In-depth reviews of principal and emerging risks with our Group
Strategy Committee (GSC), Group Operating Committee (GOC) and Audit Committee
• Surveyed a wide internal audience to rate the severity, likelihood and speed of a large range of relevant risks
• Implemented regular and focused risk reviews within existing management team meetings to assess mitigations
• Stress tested our business continuity strategies in preparation for subsequent waves of Covid-19 following the first wave
• Launched our refreshed ‘Management Standards’ where governance, risk management and compliance are at the core.
Risk governanceOur governance framework remains robust and largely unchanged in the past year, and has also proven pivotal in managing the business impacts of Covid-19. In summary:• The Board sets out the Group’s risk appetite annually, based on
the level of risk it is willing to accept in pursuit of corporate targets
• The risk strategy and setting of objectives is executed by the GOC with oversight from the Audit Committee and Board
• Our GOC, management committees and specialist Group functions provide guidance to the businesses on how to better integrate risk management processes into day-to-day activities.
The Group’s risk policy sets out how this governance framework translates into the annual risk reporting cycle, which links with our internal audit cycle (see page 77) and informs our management and governance processes specifically for climate related risks (see pages 56 to 58).
PRINCIPAL RISKS AND UNCERTAINTIES
Report on our principal risksLike many other businesses we are subject to general risks such as changes in social, political, financial, regulatory and legislative changes. Our principal risks and uncertainties are those that may have the greatest impact on our key priorities when assessed by considering our controls and other mitigating factors on a net risk basis. These risks have been discussed at Audit Committee meetings during 2020/21. They are summarised with details of our key mitigating activities on pages 52 to 55.
Risks identifiedOur key risks continue to follow similar themes to those in previous years but they evolved over the past year, mainly due to the impacts and learnings from the Covid-19 pandemic. 12 principal risks have been identified in our latest assessment across strategic, market, operational, financial, geopolitical and technological risk categories. The changes compared to 2019/20 include:• The risk of fibre packaging being substituted by non-fibre based
materials has returned to the top 12• A new demand-led principal risk reflects the need to satisfy
significant packaging volume growth with limited production capacity
• The recognition of increasing digitalisation risk, or missed digital opportunities, within our operations and supply chain
• Cyber risk was previously split between a) ransomware and b) phishing, but they are now treated on a combined basis
• Two talent-related risks have been combined and redefined to focus on the organisation capability of our people and assets
• Sustainability risk has been redefined to be more specific about our carbon and circular economy commitments (i.e. climate-related ’transition’ risks)
• Disruptive markets risk has been redefined to focus on specific and potentially highly damaging strategies of major players, compared to a general view of market-place activity
• Recent and projected changes in shopping habits are now more likely to present opportunities for our business than risks
• Increased confidence of liquidity risk mitigation has regraded the risk to outside of the principal risk level.
Annual Report 2021 dssmith.com 47
STRATEGIC REPORT

Risk
likel
ihoo
d (w
ith m
itiga
tion)
Risks assessedThere are four risks that are considered to be the most disruptive to our plans. These have been placed in the highest priority category. These four risks are:• Macro-economic and political environments in Europe, the US
and broader world economies, given the international nature of our supply chain, the competitive nature of the markets within which we operate, and weakening major economies impacting the level of consumer spend and demand for our packaging products
• Volatile paper/fibre price cycles continue to put pressure on our integrated paper and packaging business model and our ability to capture appropriate margins
• Cyber attacks targeting business’ informational or operational technologies are becoming more frequent and increasingly sophisticated and, despite our defences, we and our suppliers and customers cannot be complacent
• Sustainability has remained at the forefront throughout the pandemic and expectations on large organisations to transition to a low-carbon circular economy have continued to accelerate, and present our manufacturing operations with a variety of challenges as well as significant opportunities.
Emerging risks Our risk management programme includes a formal review of emerging risks. We define emerging risks as those which take the form of a systemic issue or business practice that has either not previously been identified, has been identified but has remained dormant, or has yet to rise to an area of significant concern. The impacts of the pandemic and ‘what if’ scenario discussions over the past year have created a heightened awareness of new and emerging risks that could impact the Group, our suppliers and customers; for example, post-pandemic ways of working and longer-term skill requirements may emerge as workforce planning risks. Furthermore, scenario work to follow the TCFD guidelines has also focused the identification and assessment of potential short to longer-term emerging risks linked with climate change. The Group continues to develop a more detailed understanding of this specific area of risk management.
Prioritising our risk management effortsMitigating and/or preventing the effect of risk on our Corporate Plan remains a cornerstone of our Executive and operational management team efforts. Our risk heat map opposite provides a summary of how we assess and evaluate the relationship between the likelihood and severity of our principal risks and uncertainties, taking into account the effectiveness of current mitigations, and informs where the Group should prioritise investments to manage them.
PRINCIPAL RISKS AND UNCERTAINTIES CONTINUED
List of risksEurozone and macro-economic impactsPaper/fibre price volatility
Cyber attacks
Sustainability commitments
Regulation and governance
Security of paper/fibre supply
Packaging capacity limits to growth
Organisation capability
Substitution of fibre packaging
Disruptive market players
Digitalisation
Shopping habits
Bubble colour reflects risk relative priority (red highest risk, amber second level, green third level priority)
Net (mitigated) risk heat map results
1
2
3
4
5
6
8
9
11
12
10
7
Risk severity (with mitigation)
12
59
7
23
4
1
116
8
10b
10
48
Viability Statement ContextThe Group’s strategy and key differentiators are detailed on page 2 and pages 18 and 19, and our risk management framework is described on pages 76 and 77. Understanding of our business model, our strategy and our principal risks is a key element in the assessment of the Group’s prospects, as well as the formal consideration of viability.The Group’s Corporate Plan cycle is the primary annual strategic and financial planning activity through which the Board assesses the prospects of the Group, extending for the three successive financial years that follow beyond the year ending after the assessment date. The planning process involves modelling under a series of assumptions surrounding both internal and external parameters, with key assumptions including economic growth projections, input pricing (including paper, fibre, energy and labour), foreign exchange rates and packaging volume growth; combined with the effects of major capital initiatives. The robust Corporate Plan process is led by the Group Chief Executive, the Group Finance Director and the Group Head of Strategy, in conjunction with divisional management. The Board undertakes a detailed review of the Corporate Plan during its December Board meeting.The most recent Corporate Plan process was undertaken against the backdrop of the ongoing Covid-19 pandemic but anticipated a return to pre-Covid-19 levels of activity/profitability in 2022/23. The budget process for 2021/22, conducted subsequent to the Corporate Planning process, reflected different dynamics, particularly with regard to fibre and paper prices, but validated the overall Group profitability as set out in the Corporate Plan in the first financial year. Similarly, the going concern exercise which builds on the budget validated the overall Group profitability as set out in the Corporate Plan for the second year. On that basis, the Directors are satisfied that the Corporate Plan provides a suitable basis for the viability assessment.The Group’s trading performance will be reviewed by the senior management team and the Board in the context of the objectives and targets of the re-forecast, within which the Group’s strategy remains embedded.Although the Directors have no reason to believe that the Group will not be viable over a longer period, the three-year period was chosen for this assessment, having considered the speed and degree of change possible in the key assumptions influencing the Group, as well as the speed of evolution in the footprint of the Group, which limits the Directors’ ability to predict beyond this period reliably. Indeed, given the pace of change in the primary sectors in which the Group operates, particularly FMCG and e-commerce, as illustrated by the recent moves away from plastic packaging and the acceleration into e-commerce driven by the Covid-19 pandemic, the Directors believe that three years represents the most realistic and appropriate timescale over which to assess the Group’s viability.
Assessment of longer-term viabilityIn accordance with the UK Corporate Governance Code, the Directors have assessed the viability of the Group over a three-year period to 30 April 2024, which is a longer period than the 12-month outlook required in adopting the going concern basis of accounting. This assessment period remains appropriate given the timescale of the Group’s planning and investment cycle.The Directors confirm that they have performed a robust assessment of the principal risks facing the Group as detailed on pages 47 and 48, including those that will threaten its business model, future performance and solvency or liquidity.The assessment of the Group’s viability considers a severe but plausible scenario aligned to the principal risks and uncertainties set out on pages 52 to 55 where the realisation of these risks is considered remote, considering the effectiveness of the Group’s risk management and control systems and current risk appetite. The degree of severity applied in this scenario was based on management’s experience and knowledge of the industry to determine plausible movements in assumptions. The Directors note that the Group enjoyed a large degree of resilience to the consequential downturns from the Covid-19 pandemic.The Group has significant financial resources including committed and uncommitted banking and debt facilities, detailed in note 20. In assessing the Group’s viability, the Directors have assumed that the existing banking and debt facilities will remain in place or mature as intended. The Directors have also considered mitigating actions available to the Group to respond to the stress scenarios such as restrictions on capital investment, further cost reduction opportunities, and dividend suspension or restriction on dividend levels. The Directors have assumed that these mitigating actions can be applied on a timely basis and at insignificant or no cost.
Confirmation of viabilityBased on the analysis, the Directors have a reasonable expectation that the Group will be able to continue in operation and meet its liabilities as they fall due over the three-year period of their assessment.
Annual Report 2021 dssmith.com 49
STRATEGIC REPORT
Going concernOverviewIn determining the going concern basis for preparing the financial statements, the Directors consider the Company’s objectives and strategy, its principal risks and uncertainties in achieving its objectives and its review of business performance and financial position, which are all set out in the Strategic Report, Operating review and Financial review sections of this Annual Report. The performance of the Group was impacted during the year by the Covid-19 pandemic but, as an essential supplier, the Group continued to operate throughout the most restrictive lockdown periods. In preparing the financial statements, the Directors have undertaken a going concern review. Further details, including the analysis performed and conclusion reached, are set out below.
Liquidity and financing positionThe Group’s liquidity and funding arrangements are described in notes 19 and 20 to the consolidated financial statements, as well as in the capital structure and treasury management section of the strategic report. The total drawn debt facilities at 30 April 2021 were £2.3 billion, £1.9 billion is publicly listed debt with no attached covenants and £0.2 billion carries a covenant of net debt: EBITDA of less than 3.25 times. In addition, the Group has access to c. £1.4 billion committed bank facilities, which were undrawn at 30 April 2021, which provide liquidity to the Group and carry the same covenant of net debt: EBITDA of less than 3.75 times. The Group is not forecast to increase net debt in the going concern analysis to 30 April 2023.There is significant liquidity/financing headroom (in excess of £1 billion) across the going concern forecast period in all scenarios considered and outlined in more detail below. For this reason, the going concern review has focused more on forecast covenant compliance which is considered further below.
Operational and business impact of Covid-19As a critical part of the supply chain across each of the geographies in which the Group operates, our operations were designated as essential businesses throughout the initial and subsequent lockdown periods. The Group has therefore continued to trade fully throughout the pandemic. Changes were made to operating processes and practices to ensure the business could respond to the specific local government requirements in each country in which it operates. Although the duration and severity of the lockdown restrictions varied from country to country, in general Covid-19 impacted trading during the first wave of the pandemic from March to June 2020. The Group experienced modest growth towards the end of the first half, with higher and consistent monthly growth in the second half, including those periods impacted by subsequent waves and restrictions. This experience informs the going concern modelling undertaken, which anticipates less impact from Covid-19 going forward than was experienced in the year to 30 April 2021.
While the outlook for the Group is more certain than it was during the last annual going concern review process, there is still uncertainty in a number of key areas. Ongoing variability in the speed of the economic recovery across the regions we operate in, continued restrictions on movement across Europe and volatility in the price of core materials mean that a level of uncertainty persists going into the new financial year.
Financial modellingThe Group has modelled two scenarios in its assessment of going concern. These are:• The base case• The downside case.
The base case:The base case is derived from the full year 2022 budget, which was approved by the Board in April 2021, and anticipates Covid-19 restrictions and impacts to reduce as the 2021/22 year progresses. The key inputs and assumptions in the base case include:• Packaging volume growth consistent with 2020/2021 reflected
across the period considered by the modelling, driven by continued strong levels of FMCG and ecommerce demand, together with a recovery in industrial volumes from current levels
• The price of paper is included in the modelling at levels consistent with those experienced in the final quarter of 2020/21 and reflecting the upward trajectory from the market lows seen in October 2020
• Fibre prices are included in this scenario at levels consistent with the paper price, taking into account the high entry point anticipated for 2021/22 in the first quarter of the fiscal year.
The downside case:In addition to the base case, a downside case has been constructed from the more conservative scenario compiled during the Corporate Plan process. Key assumptions are as follows:• European packaging volumes largely stagnate at current levels
in 2021/22 • A rise in fibre prices from 2020/21 levels not mitigated by a
commensurate increase in paper prices. With a significant portion of our packaging contracts being either directly linked/referenced to a paper index, this results in higher input costs for the Group that those are more difficult to pass through to end customers
• A substantial cash outflow from working capital is incorporated into 2021/22, providing an additional headwind to the Group’s net debt and covenant ratios.
PRINCIPAL RISKS AND UNCERTAINTIES CONTINUED
50
OutturnsThe purpose of the assessment was to consider if there was a significant risk that the Group would breach its key financial covenants on the committed bank facilities of net debt: EBITDA less than 3.75 times. Under neither scenario was the covenant breached at any of the forecast testing dates – 31 October 2021, 30 April 2022, 31 October 2022 and 30 April 2023 – and significant headroom was available in each case.An explicit reverse stress test scenario has not been modelled on the basis that the Board feels that the downside case already represents conservative assumptions that are considered unlikely to occur in combination and, even if they did occur, there remains considerable headroom over the going concern period. At a high level, we have estimated that the Group’s EBITA would have to fall by around half from the £502 million achieved in the year ended 30 April 2021 before the net debt: EBITDA covenant 3.75 times ratio would be breached in the going concern assessment period. Given the current and expected future market conditions, this reduction, and the factors that would need to occur for this scenario to materialise, is considered to be extremely remote.
Mitigating actionsThe outturns of the above scenario modelling, combined with the strong performance operating throughout the pandemic in 2020/21, provide the Group a level of comfort that no significant cost/cash flow mitigations need to be built into the going concern modelling. However, a range of options remain at the Group’s disposal should they be required which provide the opportunity to support operating profit, cash flow and net debt, including:• Action in respect of variable and controllable costs such as
discretionary bonuses, pay rises, recruitment freezes and wider labour force actions in response to higher levels of volume reductions
• Limiting capital expenditure to minimum maintenance levels by pausing growth spend (including greenfield sites and other expansionary spend)
• Satisfaction of the outstanding Interstate put option for shares instead of cash
• Strategic actions in respect of the Group’s asset base could be considered in respect of disposals, mothballing and closures
• A reduction or temporary suspension of the Group’s dividend.The Group could also consider actions to assist covenant compliance, such as optimising working capital by negotiating longer payment terms whilst continuing to pay suppliers in full and in line with contractual terms.
Going concern basisBased on the forecast and the scenarios modelled, together with the performance of the Group in 2020/21, the Directors consider that the Group has significant covenant and liquidity headroom in its borrowing facilities to continue in operational existence for the foreseeable future. Accordingly, at the June 2021 Board meeting, the Directors concluded from this analysis it was appropriate to continue to adopt the going concern basis in preparing the financial statements. The long-term impact of Covid-19 is uncertain and should the impact of the pandemic on trading conditions be more prolonged or severe than currently anticipated by the Directors under the downside scenario, the Group has sufficient operational or financial options available to mitigate any risk to this going concern assumption.
Annual Report 2021 dssmith.com 51
STRATEGIC REPORT
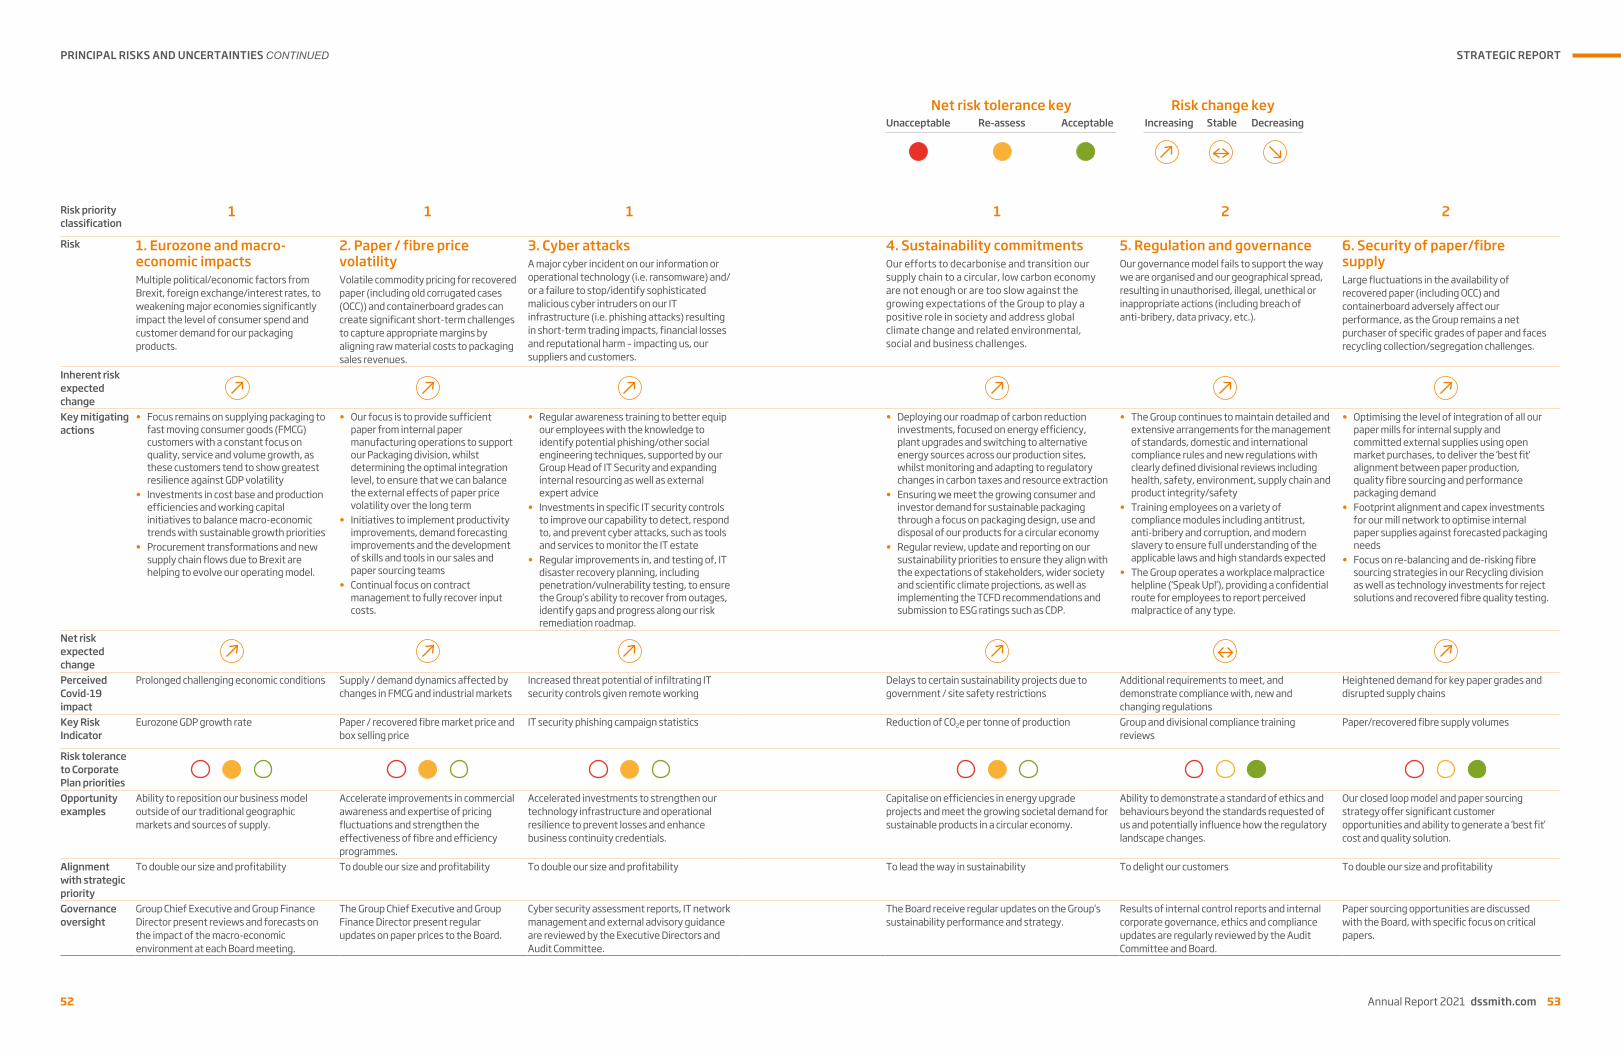
PRINCIPAL RISKS AND UNCERTAINTIES CONTINUED
Risk priority classification
1 1 1 1 2 2
Risk 1. Eurozone and macro-economic impacts Multiple political/economic factors from Brexit, foreign exchange/interest rates, to weakening major economies significantly impact the level of consumer spend and customer demand for our packaging products.
2. Paper / fibre price volatilityVolatile commodity pricing for recovered paper (including old corrugated cases (OCC)) and containerboard grades can create significant short-term challenges to capture appropriate margins by aligning raw material costs to packaging sales revenues.
3. Cyber attacksA major cyber incident on our information or operational technology (i.e. ransomware) and/or a failure to stop/identify sophisticated malicious cyber intruders on our IT infrastructure (i.e. phishing attacks) resulting in short-term trading impacts, financial losses and reputational harm – impacting us, our suppliers and customers.
4. Sustainability commitmentsOur efforts to decarbonise and transition our supply chain to a circular, low carbon economy are not enough or are too slow against the growing expectations of the Group to play a positive role in society and address global climate change and related environmental, social and business challenges.
5. Regulation and governanceOur governance model fails to support the way we are organised and our geographical spread, resulting in unauthorised, illegal, unethical or inappropriate actions (including breach of anti-bribery, data privacy, etc.).
6. Security of paper/fibre supplyLarge fluctuations in the availability of recovered paper (including OCC) and containerboard adversely affect our performance, as the Group remains a net purchaser of specific grades of paper and faces recycling collection/segregation challenges.
Inherent risk expected change
Key mitigating actions
• Focus remains on supplying packaging to fast moving consumer goods (FMCG) customers with a constant focus on quality, service and volume growth, as these customers tend to show greatest resilience against GDP volatility
• Investments in cost base and production efficiencies and working capital initiatives to balance macro-economic trends with sustainable growth priorities
• Procurement transformations and new supply chain flows due to Brexit are helping to evolve our operating model.
• Our focus is to provide sufficient paper from internal paper manufacturing operations to support our Packaging division, whilst determining the optimal integration level, to ensure that we can balance the external effects of paper price volatility over the long term
• Initiatives to implement productivity improvements, demand forecasting improvements and the development of skills and tools in our sales and paper sourcing teams
• Continual focus on contract management to fully recover input costs.
• Regular awareness training to better equip our employees with the knowledge to identify potential phishing/other social engineering techniques, supported by our Group Head of IT Security and expanding internal resourcing as well as external expert advice
• Investments in specific IT security controls to improve our capability to detect, respond to, and prevent cyber attacks, such as tools and services to monitor the IT estate
• Regular improvements in, and testing of, IT disaster recovery planning, including penetration/vulnerability testing, to ensure the Group’s ability to recover from outages, identify gaps and progress along our risk remediation roadmap.
• Deploying our roadmap of carbon reduction investments, focused on energy efficiency, plant upgrades and switching to alternative energy sources across our production sites, whilst monitoring and adapting to regulatory changes in carbon taxes and resource extraction
• Ensuring we meet the growing consumer and investor demand for sustainable packaging through a focus on packaging design, use and disposal of our products for a circular economy
• Regular review, update and reporting on our sustainability priorities to ensure they align with the expectations of stakeholders, wider society and scientific climate projections, as well as implementing the TCFD recommendations and submission to ESG ratings such as CDP.
• The Group continues to maintain detailed and extensive arrangements for the management of standards, domestic and international compliance rules and new regulations with clearly defined divisional reviews including health, safety, environment, supply chain and product integrity/safety
• Training employees on a variety of compliance modules including antitrust, anti-bribery and corruption, and modern slavery to ensure full understanding of the applicable laws and high standards expected
• The Group operates a workplace malpractice helpline (‘Speak Up!’), providing a confidential route for employees to report perceived malpractice of any type.
• Optimising the level of integration of all our paper mills for internal supply and committed external supplies using open market purchases, to deliver the ‘best fit’ alignment between paper production, quality fibre sourcing and performance packaging demand
• Footprint alignment and capex investments for our mill network to optimise internal paper supplies against forecasted packaging needs
• Focus on re-balancing and de-risking fibre sourcing strategies in our Recycling division as well as technology investments for reject solutions and recovered fibre quality testing.
Net risk expected change
Perceived Covid-19 impact
Prolonged challenging economic conditions Supply / demand dynamics affected by changes in FMCG and industrial markets
Increased threat potential of infiltrating IT security controls given remote working
Delays to certain sustainability projects due to government / site safety restrictions
Additional requirements to meet, and demonstrate compliance with, new and changing regulations
Heightened demand for key paper grades and disrupted supply chains
Key Risk Indicator
Eurozone GDP growth rate Paper / recovered fibre market price and box selling price
IT security phishing campaign statistics Reduction of CO2e per tonne of production Group and divisional compliance training reviews
Paper/recovered fibre supply volumes
Risk tolerance to Corporate Plan priorities
Opportunity examples
Ability to reposition our business model outside of our traditional geographic markets and sources of supply.
Accelerate improvements in commercial awareness and expertise of pricing fluctuations and strengthen the effectiveness of fibre and efficiency programmes.
Accelerated investments to strengthen our technology infrastructure and operational resilience to prevent losses and enhance business continuity credentials.
Capitalise on efficiencies in energy upgrade projects and meet the growing societal demand for sustainable products in a circular economy.
Ability to demonstrate a standard of ethics and behaviours beyond the standards requested of us and potentially influence how the regulatory landscape changes.
Our closed loop model and paper sourcing strategy offer significant customer opportunities and ability to generate a ‘best fit’ cost and quality solution.
Alignment with strategic priority
To double our size and profitability To double our size and profitability To double our size and profitability To lead the way in sustainability To delight our customers To double our size and profitability
Governance oversight
Group Chief Executive and Group Finance Director present reviews and forecasts on the impact of the macro-economic environment at each Board meeting.
The Group Chief Executive and Group Finance Director present regular updates on paper prices to the Board.
Cyber security assessment reports, IT network management and external advisory guidance are reviewed by the Executive Directors and Audit Committee.
The Board receive regular updates on the Group’s sustainability performance and strategy.
Results of internal control reports and internal corporate governance, ethics and compliance updates are regularly reviewed by the Audit Committee and Board.
Paper sourcing opportunities are discussed with the Board, with specific focus on critical papers.
52
Increasing Stable DecreasingRisk change key
Unacceptable Re-assess AcceptableNet risk tolerance key
Risk priority classification
1 1 1 1 2 2
Risk 1. Eurozone and macro-economic impacts Multiple political/economic factors from Brexit, foreign exchange/interest rates, to weakening major economies significantly impact the level of consumer spend and customer demand for our packaging products.
2. Paper / fibre price volatilityVolatile commodity pricing for recovered paper (including old corrugated cases (OCC)) and containerboard grades can create significant short-term challenges to capture appropriate margins by aligning raw material costs to packaging sales revenues.
3. Cyber attacksA major cyber incident on our information or operational technology (i.e. ransomware) and/or a failure to stop/identify sophisticated malicious cyber intruders on our IT infrastructure (i.e. phishing attacks) resulting in short-term trading impacts, financial losses and reputational harm – impacting us, our suppliers and customers.
4. Sustainability commitmentsOur efforts to decarbonise and transition our supply chain to a circular, low carbon economy are not enough or are too slow against the growing expectations of the Group to play a positive role in society and address global climate change and related environmental, social and business challenges.
5. Regulation and governanceOur governance model fails to support the way we are organised and our geographical spread, resulting in unauthorised, illegal, unethical or inappropriate actions (including breach of anti-bribery, data privacy, etc.).
6. Security of paper/fibre supplyLarge fluctuations in the availability of recovered paper (including OCC) and containerboard adversely affect our performance, as the Group remains a net purchaser of specific grades of paper and faces recycling collection/segregation challenges.
Inherent risk expected change
Key mitigating actions
• Focus remains on supplying packaging to fast moving consumer goods (FMCG) customers with a constant focus on quality, service and volume growth, as these customers tend to show greatest resilience against GDP volatility
• Investments in cost base and production efficiencies and working capital initiatives to balance macro-economic trends with sustainable growth priorities
• Procurement transformations and new supply chain flows due to Brexit are helping to evolve our operating model.
• Our focus is to provide sufficient paper from internal paper manufacturing operations to support our Packaging division, whilst determining the optimal integration level, to ensure that we can balance the external effects of paper price volatility over the long term
• Initiatives to implement productivity improvements, demand forecasting improvements and the development of skills and tools in our sales and paper sourcing teams
• Continual focus on contract management to fully recover input costs.
• Regular awareness training to better equip our employees with the knowledge to identify potential phishing/other social engineering techniques, supported by our Group Head of IT Security and expanding internal resourcing as well as external expert advice
• Investments in specific IT security controls to improve our capability to detect, respond to, and prevent cyber attacks, such as tools and services to monitor the IT estate
• Regular improvements in, and testing of, IT disaster recovery planning, including penetration/vulnerability testing, to ensure the Group’s ability to recover from outages, identify gaps and progress along our risk remediation roadmap.
• Deploying our roadmap of carbon reduction investments, focused on energy efficiency, plant upgrades and switching to alternative energy sources across our production sites, whilst monitoring and adapting to regulatory changes in carbon taxes and resource extraction
• Ensuring we meet the growing consumer and investor demand for sustainable packaging through a focus on packaging design, use and disposal of our products for a circular economy
• Regular review, update and reporting on our sustainability priorities to ensure they align with the expectations of stakeholders, wider society and scientific climate projections, as well as implementing the TCFD recommendations and submission to ESG ratings such as CDP.
• The Group continues to maintain detailed and extensive arrangements for the management of standards, domestic and international compliance rules and new regulations with clearly defined divisional reviews including health, safety, environment, supply chain and product integrity/safety
• Training employees on a variety of compliance modules including antitrust, anti-bribery and corruption, and modern slavery to ensure full understanding of the applicable laws and high standards expected
• The Group operates a workplace malpractice helpline (‘Speak Up!’), providing a confidential route for employees to report perceived malpractice of any type.
• Optimising the level of integration of all our paper mills for internal supply and committed external supplies using open market purchases, to deliver the ‘best fit’ alignment between paper production, quality fibre sourcing and performance packaging demand
• Footprint alignment and capex investments for our mill network to optimise internal paper supplies against forecasted packaging needs
• Focus on re-balancing and de-risking fibre sourcing strategies in our Recycling division as well as technology investments for reject solutions and recovered fibre quality testing.
Net risk expected change
Perceived Covid-19 impact
Prolonged challenging economic conditions Supply / demand dynamics affected by changes in FMCG and industrial markets
Increased threat potential of infiltrating IT security controls given remote working
Delays to certain sustainability projects due to government / site safety restrictions
Additional requirements to meet, and demonstrate compliance with, new and changing regulations
Heightened demand for key paper grades and disrupted supply chains
Key Risk Indicator
Eurozone GDP growth rate Paper / recovered fibre market price and box selling price
IT security phishing campaign statistics Reduction of CO2e per tonne of production Group and divisional compliance training reviews
Paper/recovered fibre supply volumes
Risk tolerance to Corporate Plan priorities
Opportunity examples
Ability to reposition our business model outside of our traditional geographic markets and sources of supply.
Accelerate improvements in commercial awareness and expertise of pricing fluctuations and strengthen the effectiveness of fibre and efficiency programmes.
Accelerated investments to strengthen our technology infrastructure and operational resilience to prevent losses and enhance business continuity credentials.
Capitalise on efficiencies in energy upgrade projects and meet the growing societal demand for sustainable products in a circular economy.
Ability to demonstrate a standard of ethics and behaviours beyond the standards requested of us and potentially influence how the regulatory landscape changes.
Our closed loop model and paper sourcing strategy offer significant customer opportunities and ability to generate a ‘best fit’ cost and quality solution.
Alignment with strategic priority
To double our size and profitability To double our size and profitability To double our size and profitability To lead the way in sustainability To delight our customers To double our size and profitability
Governance oversight
Group Chief Executive and Group Finance Director present reviews and forecasts on the impact of the macro-economic environment at each Board meeting.
The Group Chief Executive and Group Finance Director present regular updates on paper prices to the Board.
Cyber security assessment reports, IT network management and external advisory guidance are reviewed by the Executive Directors and Audit Committee.
The Board receive regular updates on the Group’s sustainability performance and strategy.
Results of internal control reports and internal corporate governance, ethics and compliance updates are regularly reviewed by the Audit Committee and Board.
Paper sourcing opportunities are discussed with the Board, with specific focus on critical papers.
Annual Report 2021 dssmith.com 53
STRATEGIC REPORT
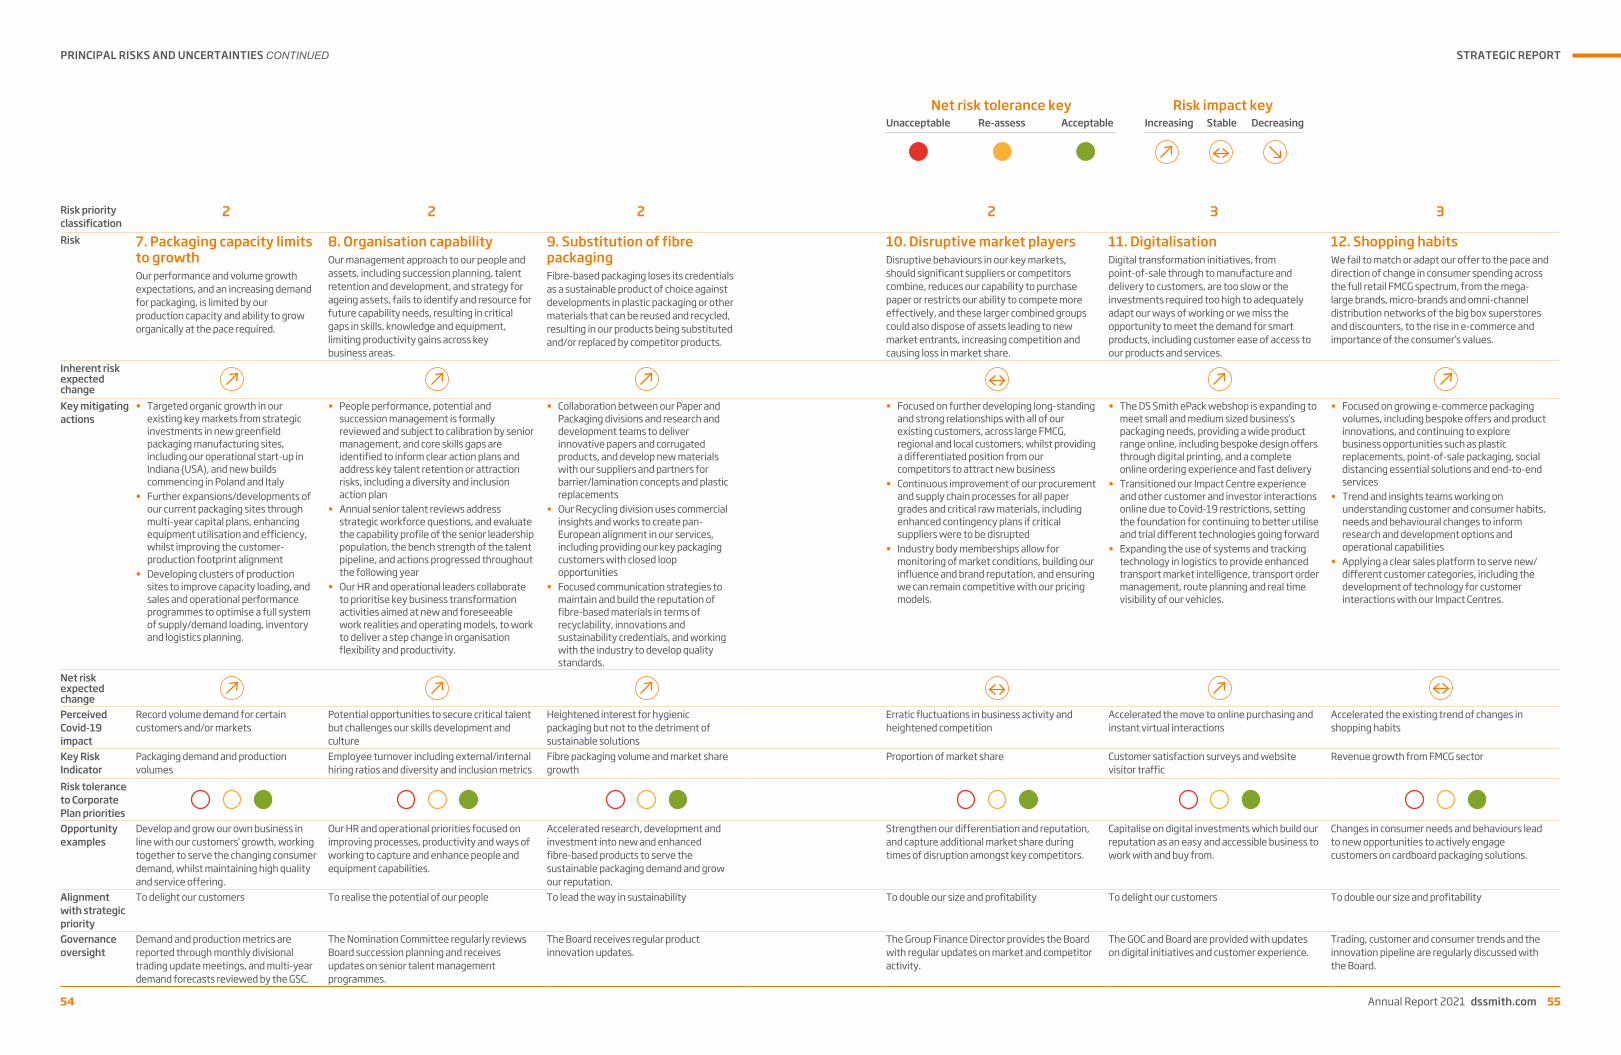
Risk priority classification
2 2 2 2 3 3
Risk 7. Packaging capacity limits to growthOur performance and volume growth expectations, and an increasing demand for packaging, is limited by our production capacity and ability to grow organically at the pace required.
8. Organisation capabilityOur management approach to our people and assets, including succession planning, talent retention and development, and strategy for ageing assets, fails to identify and resource for future capability needs, resulting in critical gaps in skills, knowledge and equipment, limiting productivity gains across key business areas.
9. Substitution of fibre packaging Fibre-based packaging loses its credentials as a sustainable product of choice against developments in plastic packaging or other materials that can be reused and recycled, resulting in our products being substituted and/or replaced by competitor products.
10. Disruptive market playersDisruptive behaviours in our key markets, should significant suppliers or competitors combine, reduces our capability to purchase paper or restricts our ability to compete more effectively, and these larger combined groups could also dispose of assets leading to new market entrants, increasing competition and causing loss in market share.
11. DigitalisationDigital transformation initiatives, from point-of-sale through to manufacture and delivery to customers, are too slow or the investments required too high to adequately adapt our ways of working or we miss the opportunity to meet the demand for smart products, including customer ease of access to our products and services.
12. Shopping habitsWe fail to match or adapt our offer to the pace and direction of change in consumer spending across the full retail FMCG spectrum, from the mega-large brands, micro-brands and omni-channel distribution networks of the big box superstores and discounters, to the rise in e-commerce and importance of the consumer’s values.
Inherent risk expected change
Key mitigating actions
• Targeted organic growth in our existing key markets from strategic investments in new greenfield packaging manufacturing sites, including our operational start-up in Indiana (USA), and new builds commencing in Poland and Italy
• Further expansions/developments of our current packaging sites through multi-year capital plans, enhancing equipment utilisation and efficiency, whilst improving the customer-production footprint alignment
• Developing clusters of production sites to improve capacity loading, and sales and operational performance programmes to optimise a full system of supply/demand loading, inventory and logistics planning.
• People performance, potential and succession management is formally reviewed and subject to calibration by senior management, and core skills gaps are identified to inform clear action plans and address key talent retention or attraction risks, including a diversity and inclusion action plan
• Annual senior talent reviews address strategic workforce questions, and evaluate the capability profile of the senior leadership population, the bench strength of the talent pipeline, and actions progressed throughout the following year
• Our HR and operational leaders collaborate to prioritise key business transformation activities aimed at new and foreseeable work realities and operating models, to work to deliver a step change in organisation flexibility and productivity.
• Collaboration between our Paper and Packaging divisions and research and development teams to deliver innovative papers and corrugated products, and develop new materials with our suppliers and partners for barrier/lamination concepts and plastic replacements
• Our Recycling division uses commercial insights and works to create pan-European alignment in our services, including providing our key packaging customers with closed loop opportunities
• Focused communication strategies to maintain and build the reputation of fibre-based materials in terms of recyclability, innovations and sustainability credentials, and working with the industry to develop quality standards.
• Focused on further developing long-standing and strong relationships with all of our existing customers, across large FMCG, regional and local customers, whilst providing a differentiated position from our competitors to attract new business
• Continuous improvement of our procurement and supply chain processes for all paper grades and critical raw materials, including enhanced contingency plans if critical suppliers were to be disrupted
• Industry body memberships allow for monitoring of market conditions, building our influence and brand reputation, and ensuring we can remain competitive with our pricing models.
• The DS Smith ePack webshop is expanding to meet small and medium sized business’s packaging needs, providing a wide product range online, including bespoke design offers through digital printing, and a complete online ordering experience and fast delivery
• Transitioned our Impact Centre experience and other customer and investor interactions online due to Covid-19 restrictions, setting the foundation for continuing to better utilise and trial different technologies going forward
• Expanding the use of systems and tracking technology in logistics to provide enhanced transport market intelligence, transport order management, route planning and real time visibility of our vehicles.
• Focused on growing e-commerce packaging volumes, including bespoke offers and product innovations, and continuing to explore business opportunities such as plastic replacements, point-of-sale packaging, social distancing essential solutions and end-to-end services
• Trend and insights teams working on understanding customer and consumer habits, needs and behavioural changes to inform research and development options and operational capabilities
• Applying a clear sales platform to serve new/different customer categories, including the development of technology for customer interactions with our Impact Centres.
Net risk expected change
Perceived Covid-19 impact
Record volume demand for certain customers and/or markets
Potential opportunities to secure critical talent but challenges our skills development and culture
Heightened interest for hygienic packaging but not to the detriment of sustainable solutions
Erratic fluctuations in business activity and heightened competition
Accelerated the move to online purchasing and instant virtual interactions
Accelerated the existing trend of changes in shopping habits
Key Risk Indicator
Packaging demand and production volumes
Employee turnover including external/internal hiring ratios and diversity and inclusion metrics
Fibre packaging volume and market share growth
Proportion of market share Customer satisfaction surveys and website visitor traffic
Revenue growth from FMCG sector
Risk tolerance to Corporate Plan priorities
Opportunity examples
Develop and grow our own business in line with our customers’ growth, working together to serve the changing consumer demand, whilst maintaining high quality and service offering.
Our HR and operational priorities focused on improving processes, productivity and ways of working to capture and enhance people and equipment capabilities.
Accelerated research, development and investment into new and enhanced fibre-based products to serve the sustainable packaging demand and grow our reputation.
Strengthen our differentiation and reputation, and capture additional market share during times of disruption amongst key competitors.
Capitalise on digital investments which build our reputation as an easy and accessible business to work with and buy from.
Changes in consumer needs and behaviours lead to new opportunities to actively engage customers on cardboard packaging solutions.
Alignment with strategic priority
To delight our customers To realise the potential of our people To lead the way in sustainability To double our size and profitability To delight our customers To double our size and profitability
Governance oversight
Demand and production metrics are reported through monthly divisional trading update meetings, and multi-year demand forecasts reviewed by the GSC.
The Nomination Committee regularly reviews Board succession planning and receives updates on senior talent management programmes.
The Board receives regular product innovation updates.
The Group Finance Director provides the Board with regular updates on market and competitor activity.
The GOC and Board are provided with updates on digital initiatives and customer experience.
Trading, customer and consumer trends and the innovation pipeline are regularly discussed with the Board.
PRINCIPAL RISKS AND UNCERTAINTIES CONTINUED
54
Risk priority classification
2 2 2 2 3 3
Risk 7. Packaging capacity limits to growthOur performance and volume growth expectations, and an increasing demand for packaging, is limited by our production capacity and ability to grow organically at the pace required.
8. Organisation capabilityOur management approach to our people and assets, including succession planning, talent retention and development, and strategy for ageing assets, fails to identify and resource for future capability needs, resulting in critical gaps in skills, knowledge and equipment, limiting productivity gains across key business areas.
9. Substitution of fibre packaging Fibre-based packaging loses its credentials as a sustainable product of choice against developments in plastic packaging or other materials that can be reused and recycled, resulting in our products being substituted and/or replaced by competitor products.
10. Disruptive market playersDisruptive behaviours in our key markets, should significant suppliers or competitors combine, reduces our capability to purchase paper or restricts our ability to compete more effectively, and these larger combined groups could also dispose of assets leading to new market entrants, increasing competition and causing loss in market share.
11. DigitalisationDigital transformation initiatives, from point-of-sale through to manufacture and delivery to customers, are too slow or the investments required too high to adequately adapt our ways of working or we miss the opportunity to meet the demand for smart products, including customer ease of access to our products and services.
12. Shopping habitsWe fail to match or adapt our offer to the pace and direction of change in consumer spending across the full retail FMCG spectrum, from the mega-large brands, micro-brands and omni-channel distribution networks of the big box superstores and discounters, to the rise in e-commerce and importance of the consumer’s values.
Inherent risk expected change
Key mitigating actions
• Targeted organic growth in our existing key markets from strategic investments in new greenfield packaging manufacturing sites, including our operational start-up in Indiana (USA), and new builds commencing in Poland and Italy
• Further expansions/developments of our current packaging sites through multi-year capital plans, enhancing equipment utilisation and efficiency, whilst improving the customer-production footprint alignment
• Developing clusters of production sites to improve capacity loading, and sales and operational performance programmes to optimise a full system of supply/demand loading, inventory and logistics planning.
• People performance, potential and succession management is formally reviewed and subject to calibration by senior management, and core skills gaps are identified to inform clear action plans and address key talent retention or attraction risks, including a diversity and inclusion action plan
• Annual senior talent reviews address strategic workforce questions, and evaluate the capability profile of the senior leadership population, the bench strength of the talent pipeline, and actions progressed throughout the following year
• Our HR and operational leaders collaborate to prioritise key business transformation activities aimed at new and foreseeable work realities and operating models, to work to deliver a step change in organisation flexibility and productivity.
• Collaboration between our Paper and Packaging divisions and research and development teams to deliver innovative papers and corrugated products, and develop new materials with our suppliers and partners for barrier/lamination concepts and plastic replacements
• Our Recycling division uses commercial insights and works to create pan-European alignment in our services, including providing our key packaging customers with closed loop opportunities
• Focused communication strategies to maintain and build the reputation of fibre-based materials in terms of recyclability, innovations and sustainability credentials, and working with the industry to develop quality standards.
• Focused on further developing long-standing and strong relationships with all of our existing customers, across large FMCG, regional and local customers, whilst providing a differentiated position from our competitors to attract new business
• Continuous improvement of our procurement and supply chain processes for all paper grades and critical raw materials, including enhanced contingency plans if critical suppliers were to be disrupted
• Industry body memberships allow for monitoring of market conditions, building our influence and brand reputation, and ensuring we can remain competitive with our pricing models.
• The DS Smith ePack webshop is expanding to meet small and medium sized business’s packaging needs, providing a wide product range online, including bespoke design offers through digital printing, and a complete online ordering experience and fast delivery
• Transitioned our Impact Centre experience and other customer and investor interactions online due to Covid-19 restrictions, setting the foundation for continuing to better utilise and trial different technologies going forward
• Expanding the use of systems and tracking technology in logistics to provide enhanced transport market intelligence, transport order management, route planning and real time visibility of our vehicles.
• Focused on growing e-commerce packaging volumes, including bespoke offers and product innovations, and continuing to explore business opportunities such as plastic replacements, point-of-sale packaging, social distancing essential solutions and end-to-end services
• Trend and insights teams working on understanding customer and consumer habits, needs and behavioural changes to inform research and development options and operational capabilities
• Applying a clear sales platform to serve new/different customer categories, including the development of technology for customer interactions with our Impact Centres.
Net risk expected change
Perceived Covid-19 impact
Record volume demand for certain customers and/or markets
Potential opportunities to secure critical talent but challenges our skills development and culture
Heightened interest for hygienic packaging but not to the detriment of sustainable solutions
Erratic fluctuations in business activity and heightened competition
Accelerated the move to online purchasing and instant virtual interactions
Accelerated the existing trend of changes in shopping habits
Key Risk Indicator
Packaging demand and production volumes
Employee turnover including external/internal hiring ratios and diversity and inclusion metrics
Fibre packaging volume and market share growth
Proportion of market share Customer satisfaction surveys and website visitor traffic
Revenue growth from FMCG sector
Risk tolerance to Corporate Plan priorities
Opportunity examples
Develop and grow our own business in line with our customers’ growth, working together to serve the changing consumer demand, whilst maintaining high quality and service offering.
Our HR and operational priorities focused on improving processes, productivity and ways of working to capture and enhance people and equipment capabilities.
Accelerated research, development and investment into new and enhanced fibre-based products to serve the sustainable packaging demand and grow our reputation.
Strengthen our differentiation and reputation, and capture additional market share during times of disruption amongst key competitors.
Capitalise on digital investments which build our reputation as an easy and accessible business to work with and buy from.
Changes in consumer needs and behaviours lead to new opportunities to actively engage customers on cardboard packaging solutions.
Alignment with strategic priority
To delight our customers To realise the potential of our people To lead the way in sustainability To double our size and profitability To delight our customers To double our size and profitability
Governance oversight
Demand and production metrics are reported through monthly divisional trading update meetings, and multi-year demand forecasts reviewed by the GSC.
The Nomination Committee regularly reviews Board succession planning and receives updates on senior talent management programmes.
The Board receives regular product innovation updates.
The Group Finance Director provides the Board with regular updates on market and competitor activity.
The GOC and Board are provided with updates on digital initiatives and customer experience.
Trading, customer and consumer trends and the innovation pipeline are regularly discussed with the Board.
Increasing Stable DecreasingRisk impact key
Unacceptable Re-assess AcceptableNet risk tolerance key
Annual Report 2021 dssmith.com 55
STRATEGIC REPORT

Adapting to a changing climate
As the pace of change in the world around us increases, it is becoming more apparent that we only have limited time in which to act if the world is to avoid the worst effects of climate change. This presents businesses and policymakers with a range of challenges and opportunities, not least for energy-intensive industries such as paper and pulp. In our circular business model, materials are kept in use for longer, which reduces waste and pollution. Energy is used to transform materials as they move through this system in a circular process. Lowering carbon emissions requires a combination of resource efficiency, technological advances, renewables deployment and policy measures, as set out in the CEPI 2050 roadmap.We are supportive of the Paris Agreement on climate change, recognising the urgent need to limit the increase in global average temperature to 1.5°C above pre-industrial levels by the end of the century, substantially reducing the impact of climate change. We have implemented the recommendations set out by the Task Force on Climate-related Financial Disclosures (TCFD), taking the opportunity to evaluate potential financial and strategic implications arising from climate change and develop appropriate responses.
StrategyOur Purpose is ‘Redefining Packaging for a Changing World’. Amongst other megatrends, climate change is a force reshaping the world, calling for rapid decarbonisation of the global economy. Consumers demand greater performance from our circular packaging solutions, which reduce emissions through reusability and recyclability. The environmental performance of our packaging is driven largely by energy consumed during manufacture, which exposes the Group to regulation aimed at increasing the cost of greenhouse gas emissions (for example, carbon taxes such as the EU Emissions Trading Scheme (ETS)). There is therefore an opportunity to minimise our spend on carbon taxes by lowering our emissions through utilisation of renewable energy sources and energy efficiency measures that in turn improve the environmental performance of our product. Our greatest opportunity is to meet the increasing demand for environmental performance in the design, use and disposal of our products, responding to consumer preferences that favour low-impact packaging. Once deployed, our roadmap of carbon reduction investments will increase the long-term resilience of our energy supply, providing reliable, affordable and clean energy and improving the environmental performance of our packaging. In the long term, shifts in market forces and changes in weather patterns have the potential to threaten the supply or cost of key raw materials such as recyclate, pulp and starch. There is a chance that without substantial climate action, more disruptive physical risks such as water scarcity take hold. This invites opportunities to reduce reliance on key resources through efficiency and technological measures that reduce operating costs, and increase supply chain resilience and our ability to operate under various conditions.
Scenario analysisWe applied several peer-reviewed reference scenarios to our most material risks and opportunities to consider the effect of various plausible future conditions on our business. In each scenario, we assumed that we have the same business activities that we have today and focus on a specific material risk or opportunity. We used a combination of quantitative and qualitative methods in our analysis, giving preference to quantitative information where good quality, decision-useful data is available from reputable sources. We worked with a leading climate change consultancy, who validated our climate scenario analysis findings to date and have recommended that we continue to develop this work to inform our approach to climate change. Where good quality data is available from these scenarios, we calculated the financial implications of material risks and opportunities as illustrative estimates based on present day costs and in the context given within each scenario.The estimated impacts therefore should be considered in the context of current financial performance and the actual future impact will vary according to prevailing costs and pricing at that time.
Quantifying our climate risksIncreasing spend on carbon taxesUnder EU ETS, our European mills must purchase additional carbon allowances to cover their emissions. In
2020, we paid €39 million to the scheme. The free-issued allowances are being reduced whilst the price of additional allowances is increasing, therefore increasing our operating costs. There is a risk that by 2030 the price could increase, for example, from €50 to €110 per tonne of carbon which were this to happen could result in an annual cost of c. €80 million by 2030, depending on the allocation of free allowances. There is the possibility that the scheme could be extended or that new carbon taxes could be introduced in other parts of the world to incentivise decarbonisation. For example, the IEA ETP 2°C scenario describes the introduction of a North American carbon tax rising to $210 per tonne by 2050. If this tax were applied to our projected future emissions, this could result in an additional cost of c. £9 million annually by 2030.
IEA SDS 1.5°C Pulp & Paper1: In this scenario, growth in production and energy consumption are decoupled to achieve decarbonisation to the extent required to be on track with the Sustainable Development Scenario by 2030.IEA ETP SDS 2°C2: In this scenario, mitigation measures are applied to carbon intensive industries, alongside technological advancements to the extent required to limit global warming to within 2°C by 2100 versus pre-industrial levels.IPPC RCP 8.5 6°C3: In this scenario, a ‘business as usual’ state of no policy changes leads to growth in emissions, causing some of the physical effects of climate change to be felt with greater severity.
56
TASK FORCE ON CLIMATE-RELATED FINANCIAL DISCLOSURES (TCFD)
Increasing cost of raw materials or threat to supplyKey raw materials (e.g. pulp, recyclate or starch) could become more expensive and/or difficult to acquire
because of climate change. This could be due to chronic physical reasons (e.g. extreme variability in weather patterns), regulatory change (e.g. caps on resource extraction) or market disincentives (e.g. licences for extraction). Aspects of climate change are likely to affect forest growth and productivity, impacting the virgin fibre market. Although our exposure to this market is limited as our packaging is primarily manufactured from recycled fibres (c. 83 per cent of the papers used by our Packaging division are from 100 per cent recycled content), potential future yield losses could drive up the price of virgin fibre and changing input prices may be passed on to us by suppliers and have a subsequent impact on papers for recycling. Using data from the Global Forest Products Model to assume, for example, that average virgin paper price increases by 5 per cent by 2030, this could result in an additional cost, which would likely have to be recovered through increased pricing to our end customers. Paper and fibre price volatility and security of supply are considered principal risks for the Group and are balanced over the long term by optimising the best fit between paper production, fibre sourcing and packaging demand.
Increasing likelihood of water stressCompetition for limited water resources could increase in the long term in river basins. Using the WRI Aqueduct
tool4, we identified 25 sites at risk of future water stress and in 2020/21 we achieved our target to implement a water stress mitigation plan at these sites. This involves business continuity planning and regular water performance reviews, requiring that sites maintain contact with external stakeholders (e.g. water authority and community). We are implementing water reduction, reuse and recycle opportunities, for example at our De Hoop and Lucca Mills, where water is recirculated before it is returned to the natural environment. In the IPCC RCP 8.5°C scenario, the worst-case scenario suggests that ten further sites become at risk of water stress during the period 2030-40. Initial analysis suggests that this would be unlikely to have a material impact in our most pessimistic scenario, valued at less than c. £1 million business interruption value at risk by 2030.
Quantifying our climate opportunitiesGrowth in demand for sustainable packagingAs society transitions to a low emissions economy, we see an opportunity for circular packaging to play a
powerful role in helping brands and consumers reduce their carbon footprint. There is an opportunity to grow market share and value in meeting the demand for sustainable packaging and we continue to invest in innovation that balances cost, service, quality and sustainability. Led by our strategic goal, ‘to double in size and profitability’, we continue to drive organic growth, maximise the opportunities from acquired businesses and invest in growing areas of the corrugated packaging market. In the IEA SDS 1.5°C scenario, annual paper production is described as growing by 1.2 per cent annually over the decade to 2030, meeting demand for packaging and necessitating greater recycling. This presents a growth opportunity that could be valued at c. £32 million increase in EBITDA per year by 2030.
Use of emerging renewable technologiesIn order to avoid the worst consequences of climate change, the global energy system must radically reduce
emissions, calling for rapid deployment of low carbon energy generation. Delivering our carbon reduction target requires a mixture of energy efficiency, fuel-switching and plant upgrade measures. As energy systems and technologies evolve, there is an opportunity to be at the forefront of adoption, for example increasing the use of alternative fuels to reduce reliance on fossil fuels. In the IEA SDS 1.5°C scenario, energy use in the Pulp and Paper sector is described as declining by 0.6 per cent per year to get on track with the Sustainable Development Scenario (SDS) by 2030. A reduction in energy consumption results in a lesser cost, an opportunity that could be valued at c. £16 million per year by 2030 based on current energy costs. An example of realising this opportunity is at our Lucca Mill, where in 2020/21 in partnership with GE Gas Power, we deployed a new gas turbine which will result in a 2 per cent improvement in efficiency, reducing gas consumption and carbon emissions per tonne of product.
Increasing resource efficiencyWe can achieve greater resource efficiency by encouraging markets to improve recycling infrastructure,
including increasing waste segregation to create raw material streams that are cleaner and require less processing. Access to high quality wastepaper for recycling means less processing (therefore less energy and water consumption) and less volume of recyclate needed overall, which generates cost savings for our papermaking operations. We continue to advocate for separate collection of paper and cardboard recyclables to improve quality of material by reducing contamination, increasing recycling rates, lowering environmental impact and cost for local authorities as part of our engagement with policymakers to contribute to realising this opportunity.
Summary of our climate scenario analysisWhilst the climate scenario analysis suggests that there could be some financial risk to DS Smith by 2030, predominantly due to increased costs which would need to be managed, we would not have to make material changes to our business model. There are opportunities to increase the sophistication of our modelling. For example, we have not considered the financial implications of secondary impacts, for example reputational damage that may occur under some of the scenarios. Particularly as new, higher quality data becomes available (for example, better long-term projections of future raw material supply under various conditions), we will continue to use climate scenario analysis to understand the effects climate change may have on our business and ensure we have appropriate mitigations in place to remain competitive in the future environment in which we will operate.
1. IEA Pulp & Paper Analysis: https://www.iea.org/reports/pulp-and-paper.2. IEA Energy Technology Perspectives – Sustainable Development Scenario:
https://www.iea.org/reports/world-energy-model/sustainable-development-scenario.
3. Intergovernmental Panel on Climate Change Representative Concentration Pathways: https://www.wri.org/resources/data-sets/aqueduct-water-stress-projections-data.
4. WRI Aqueduct Water Risk Atlas: https://www.wri.org/aqueduct.
Annual Report 2021 dssmith.com 57
STRATEGIC REPORT

Risk managementWe undertake regular materiality analysis to ensure our sustainability priorities remain aligned to those of our stakeholders. In our most recent analysis, conducted in late 2019, we consulted stakeholders on a range of climate issues, asking them about their perception of each issue as a risk or opportunity to our sustainability strategy. This assessment, combined with a range of other credible sources (such as CEPI and CDP), is used to evaluate the likelihood of occurrence and the estimated severity of resulting financial or strategic impact over the short term (0-1 year), medium term (1-3 years) and long term (3+ years). Based on this assessment, material risks are evaluated in greater depth, considering our operations, supply chain, stakeholder expectations and regulation. Transition risks are assessed by Group strategy and Group sustainability teams, collaborating across multiple functions to develop responses to the financial and strategic implications. Physical risks are assessed by each division, supported by the Group Risk and Insurance team, involving other internal stakeholders and drawing on expertise from specialist organisations. Whether to mitigate, transfer or accept a risk is influenced by a range of factors, including but not limited to site location and added value, prioritising strategic locations. Our risk management processes require that our material business risks, including climate risks, are graded on a scoring scale from negligible to critical using specific impact criteria such as a financial value range. By way of example, a financial impact between 2.5 per cent and 10 per cent of operating income or net profit is considered moderate financial or strategic impact. Climate risks are evaluated using the Group’s common risk language and are incorporated into our enterprise risk assessments where such risks could materially affect the business during our Corporate Plan time horizon. All divisions produce formal principal risk assessment reports twice per year, and undertake frequent risk reviews, considering the ratings, trends and controls. The most material climate risks and opportunities have been selected for climate scenario analysis, prioritising those for which good quality data is available.
GovernanceMembers of the Board, Audit Committee and Health, Safety, Environment and Sustainability (HSES) Committee maintain oversight of climate risk. Risks are monitored as part of our standard operating processes to ensure that appropriate mitigations are in place and are regularly reviewed by management. Climate issues are assessed by the sustainability leadership team (SUS LT) and HSES Committee when developing strategies and policies. These are reported to executive management on an ongoing basis, providing updates on the delivery of plans. Progress against our targets for addressing climate issues is monitored by the Board and Group Operating Committee (GOC), chaired by the Group Chief Executive. The Board receives regular updates on risk mitigation methods and progress.
Metrics and targetsWe use metrics and targets to report progress to external audiences annually and review performance internally on a monthly basis. We have set a range of targets in our Now and Next sustainability strategy that address climate risk such as our carbon reduction target and water stewardship targets (pages 12 and 13). Metrics are used to monitor progress towards these targets, including monitoring metrics, such as ‘carbon intensity per tonne of production (kg CO2e/tnsp)’ (page 33) and ‘total water consumption in areas at risk of water stress (%)‘ (page 31), in addition to mitigation metrics, such as ‘total energy consumption (GWh)’ (page 33) and ‘sites at risk of current or future water stress with mitigation plans in place (%)‘ (page 31). In addition, in recognition of the importance and commitment to sustainability, an ESG underpin has been introduced into the 2021/22 Executive Director annual bonus plan.
“As society transitions to a low emissions economy, we see an opportunity for circular packaging to play a powerful role in helping brands and consumers reduce their carbon footprint.”
Redefining Packaging for a Changing World
Sustainability Report 2021
For more information about how we are leading the way in sustainability, please see the latest DS Smith Sustainability Report.
58
TASK FORCE ON CLIMATE-RELATED FINANCIAL DISCLOSURES (TCFD) CONTINUED
Non-financial information statement
The table below sets out where stakeholders can find information in our Strategic Report that relates to non-financial matters as required under the Non-Financial Reporting Directive requirements:
Reporting requirements Some of the relevant policiesWhere to read more in this report about our impact, including the principal risks relating to these matters Page(s)
Environmental matters
• Group Sustainability policy1 • Our sustainability approach, strategy, focus and targets • Our sustainability performance • Our differentiators • Risk – sustainability
1230-33
1853
Employees • Code of Conduct2
• ‘Speak Up!’2• Group Health and Safety policy2
• Equal Opportunities and Anti-Discrimination policy1
• Personal Data Protection policy1
• Data Retention policy1
• What we create for our people • Diversity and Inclusion• To realise the potential of our people – performance
Health, safety and wellbeing• Risk – organisation capability • Gender pay gap reporting • Our Purpose
242824255429
2Human rights • Code of Conduct2
• Anti-Slavery and Human Trafficking policy2
• Sustainable governance• Risk – governance
5353
Social matters • Code of Conduct2
• Gifts and Hospitality policy2
• Contributing to our communities 32
Compliance • Compliance Framework policy (Corporate Criminal Offence)2
• Anti-Bribery and Anti-Corruption policy2
• Competition Law Compliance policy1
• Commercial Agents policy1
• Risk – governance 53
Business model • Our business model 16Non-financial KPIs • Employees: accident frequency rate
• Sustainability: CO2 equivalent emissions • Customers: on-time in-full deliveries
243322
1. Available to all employees through the DS Smith intranet. Not published externally. 2. Available both on our website www.dssmith.com and to employees through the DS Smith intranet.
Our policies A combination of online and in person training on all the key policies is carried out across the Group and there is also a system of bi-annual certification for senior managers, certifying that they have read and understood the policies, have cascaded down to their direct reports and that they are not aware of any breach of such policies. All employees, contractors and third parties are encouraged to report any circumstances where there is a suspected or actual breach of any of the DS Smith policies, applicable laws, or the high standards as set out in the Code of Conduct, either through their managers, the confidential ‘Speak Up!’ helpline or directly to the Group General Counsel and Company Secretary. All reported incidences of actual or suspected breach of any of the policies are promptly and thoroughly investigated. The Compliance Committee and the Audit Committee also consider any high risk areas identified by the internal audit function, the legal team or the divisional compliance teams.
Annual Report 2021 dssmith.com 59
STRATEGIC REPORT
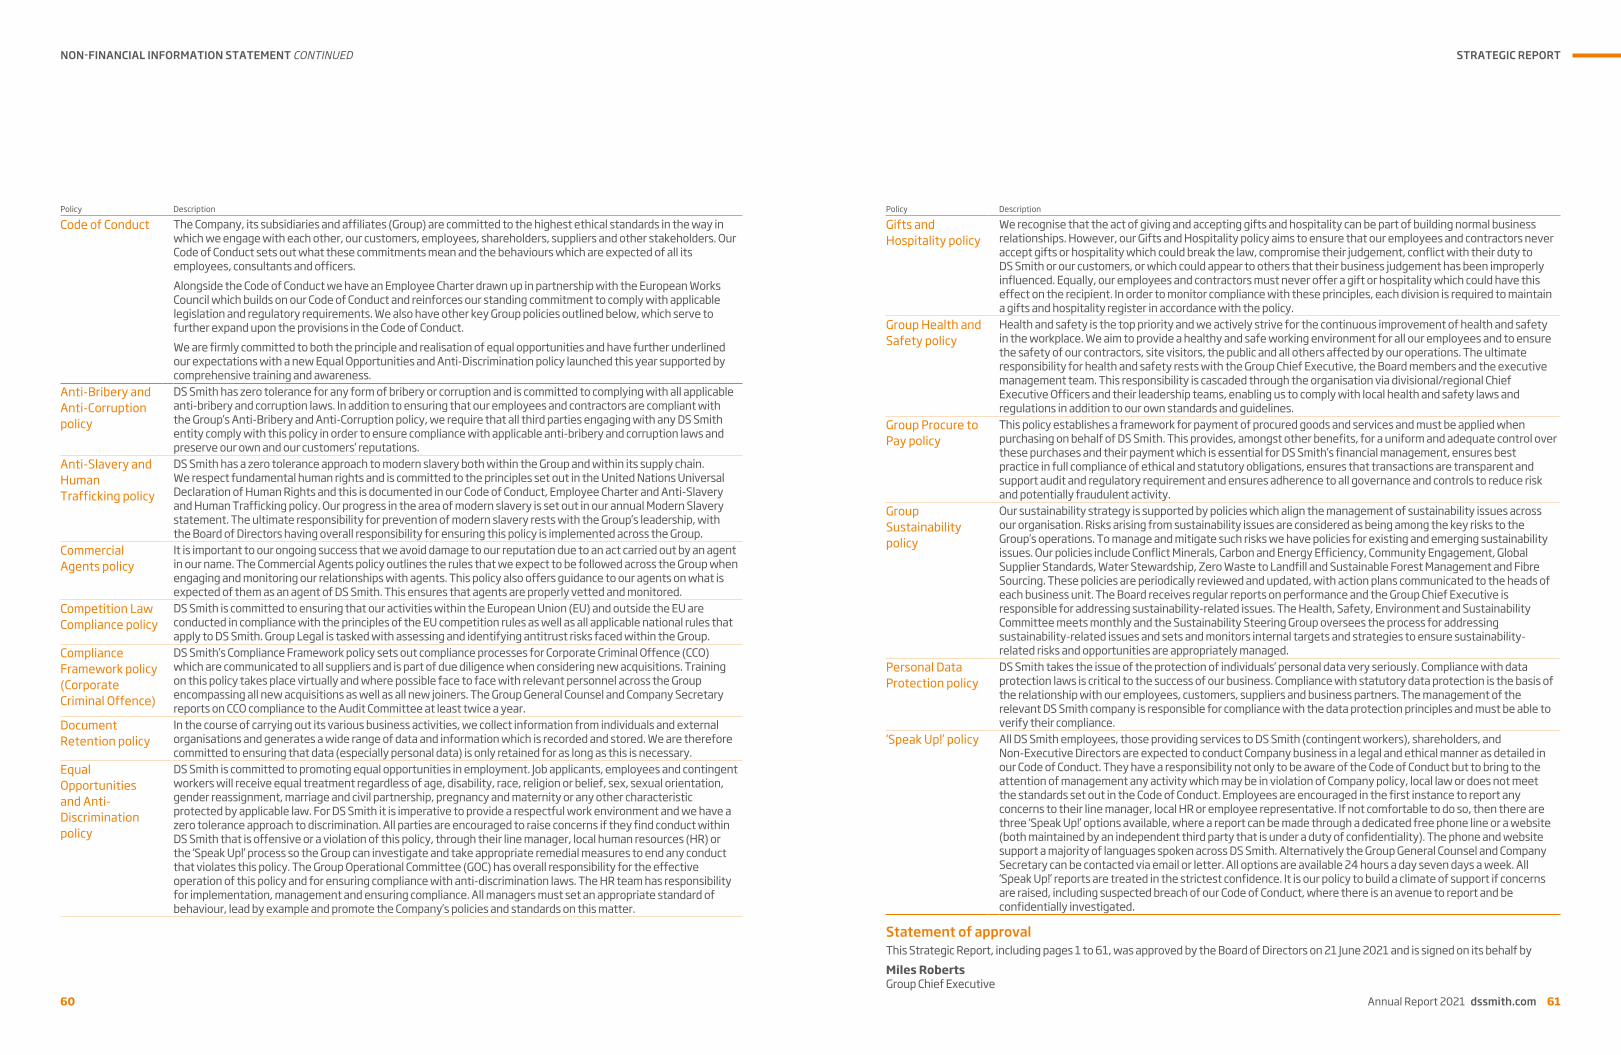
Policy Description
Code of Conduct The Company, its subsidiaries and affiliates (Group) are committed to the highest ethical standards in the way in which we engage with each other, our customers, employees, shareholders, suppliers and other stakeholders. Our Code of Conduct sets out what these commitments mean and the behaviours which are expected of all its employees, consultants and officers. Alongside the Code of Conduct we have an Employee Charter drawn up in partnership with the European Works Council which builds on our Code of Conduct and reinforces our standing commitment to comply with applicable legislation and regulatory requirements. We also have other key Group policies outlined below, which serve to further expand upon the provisions in the Code of Conduct. We are firmly committed to both the principle and realisation of equal opportunities and have further underlined our expectations with a new Equal Opportunities and Anti-Discrimination policy launched this year supported by comprehensive training and awareness.
Anti-Bribery and Anti-Corruption policy
DS Smith has zero tolerance for any form of bribery or corruption and is committed to complying with all applicable anti-bribery and corruption laws. In addition to ensuring that our employees and contractors are compliant with the Group’s Anti-Bribery and Anti-Corruption policy, we require that all third parties engaging with any DS Smith entity comply with this policy in order to ensure compliance with applicable anti-bribery and corruption laws and preserve our own and our customers’ reputations.
Anti-Slavery and Human Trafficking policy
DS Smith has a zero tolerance approach to modern slavery both within the Group and within its supply chain. We respect fundamental human rights and is committed to the principles set out in the United Nations Universal Declaration of Human Rights and this is documented in our Code of Conduct, Employee Charter and Anti-Slavery and Human Trafficking policy. Our progress in the area of modern slavery is set out in our annual Modern Slavery statement. The ultimate responsibility for prevention of modern slavery rests with the Group’s leadership, with the Board of Directors having overall responsibility for ensuring this policy is implemented across the Group.
Commercial Agents policy
It is important to our ongoing success that we avoid damage to our reputation due to an act carried out by an agent in our name. The Commercial Agents policy outlines the rules that we expect to be followed across the Group when engaging and monitoring our relationships with agents. This policy also offers guidance to our agents on what is expected of them as an agent of DS Smith. This ensures that agents are properly vetted and monitored.
Competition LawCompliance policy
DS Smith is committed to ensuring that our activities within the European Union (EU) and outside the EU are conducted in compliance with the principles of the EU competition rules as well as all applicable national rules that apply to DS Smith. Group Legal is tasked with assessing and identifying antitrust risks faced within the Group.
Compliance Framework policy (Corporate Criminal Offence)
DS Smith’s Compliance Framework policy sets out compliance processes for Corporate Criminal Offence (CCO) which are communicated to all suppliers and is part of due diligence when considering new acquisitions. Training on this policy takes place virtually and where possible face to face with relevant personnel across the Group encompassing all new acquisitions as well as all new joiners. The Group General Counsel and Company Secretary reports on CCO compliance to the Audit Committee at least twice a year.
Document Retention policy
In the course of carrying out its various business activities, we collect information from individuals and external organisations and generates a wide range of data and information which is recorded and stored. We are therefore committed to ensuring that data (especially personal data) is only retained for as long as this is necessary.
Equal Opportunities and Anti-Discrimination policy
DS Smith is committed to promoting equal opportunities in employment. Job applicants, employees and contingent workers will receive equal treatment regardless of age, disability, race, religion or belief, sex, sexual orientation, gender reassignment, marriage and civil partnership, pregnancy and maternity or any other characteristic protected by applicable law. For DS Smith it is imperative to provide a respectful work environment and we have a zero tolerance approach to discrimination. All parties are encouraged to raise concerns if they find conduct within DS Smith that is offensive or a violation of this policy, through their line manager, local human resources (HR) or the ‘Speak Up!’ process so the Group can investigate and take appropriate remedial measures to end any conduct that violates this policy. The Group Operational Committee (GOC) has overall responsibility for the effective operation of this policy and for ensuring compliance with anti-discrimination laws. The HR team has responsibility for implementation, management and ensuring compliance. All managers must set an appropriate standard of behaviour, lead by example and promote the Company’s policies and standards on this matter.
60
NON-FINANCIAL INFORMATION STATEMENT CONTINUED
Policy Description
Gifts and Hospitality policy
We recognise that the act of giving and accepting gifts and hospitality can be part of building normal business relationships. However, our Gifts and Hospitality policy aims to ensure that our employees and contractors never accept gifts or hospitality which could break the law, compromise their judgement, conflict with their duty to DS Smith or our customers, or which could appear to others that their business judgement has been improperly influenced. Equally, our employees and contractors must never offer a gift or hospitality which could have this effect on the recipient. In order to monitor compliance with these principles, each division is required to maintain a gifts and hospitality register in accordance with the policy.
Group Health and Safety policy
Health and safety is the top priority and we actively strive for the continuous improvement of health and safety in the workplace. We aim to provide a healthy and safe working environment for all our employees and to ensure the safety of our contractors, site visitors, the public and all others affected by our operations. The ultimate responsibility for health and safety rests with the Group Chief Executive, the Board members and the executive management team. This responsibility is cascaded through the organisation via divisional/regional Chief Executive Officers and their leadership teams, enabling us to comply with local health and safety laws and regulations in addition to our own standards and guidelines.
Group Procure to Pay policy
This policy establishes a framework for payment of procured goods and services and must be applied when purchasing on behalf of DS Smith. This provides, amongst other benefits, for a uniform and adequate control over these purchases and their payment which is essential for DS Smith’s financial management, ensures best practice in full compliance of ethical and statutory obligations, ensures that transactions are transparent and support audit and regulatory requirement and ensures adherence to all governance and controls to reduce risk and potentially fraudulent activity.
Group Sustainability policy
Our sustainability strategy is supported by policies which align the management of sustainability issues across our organisation. Risks arising from sustainability issues are considered as being among the key risks to the Group’s operations. To manage and mitigate such risks we have policies for existing and emerging sustainability issues. Our policies include Conflict Minerals, Carbon and Energy Efficiency, Community Engagement, Global Supplier Standards, Water Stewardship, Zero Waste to Landfill and Sustainable Forest Management and Fibre Sourcing. These policies are periodically reviewed and updated, with action plans communicated to the heads of each business unit. The Board receives regular reports on performance and the Group Chief Executive is responsible for addressing sustainability-related issues. The Health, Safety, Environment and Sustainability Committee meets monthly and the Sustainability Steering Group oversees the process for addressing sustainability-related issues and sets and monitors internal targets and strategies to ensure sustainability-related risks and opportunities are appropriately managed.
Personal Data Protection policy
DS Smith takes the issue of the protection of individuals’ personal data very seriously. Compliance with data protection laws is critical to the success of our business. Compliance with statutory data protection is the basis of the relationship with our employees, customers, suppliers and business partners. The management of the relevant DS Smith company is responsible for compliance with the data protection principles and must be able to verify their compliance.
‘Speak Up!’ policy All DS Smith employees, those providing services to DS Smith (contingent workers), shareholders, and Non-Executive Directors are expected to conduct Company business in a legal and ethical manner as detailed in our Code of Conduct. They have a responsibility not only to be aware of the Code of Conduct but to bring to the attention of management any activity which may be in violation of Company policy, local law or does not meet the standards set out in the Code of Conduct. Employees are encouraged in the first instance to report any concerns to their line manager, local HR or employee representative. If not comfortable to do so, then there are three ‘Speak Up!’ options available, where a report can be made through a dedicated free phone line or a website (both maintained by an independent third party that is under a duty of confidentiality). The phone and website support a majority of languages spoken across DS Smith. Alternatively the Group General Counsel and Company Secretary can be contacted via email or letter. All options are available 24 hours a day seven days a week. All ‘Speak Up!’ reports are treated in the strictest confidence. It is our policy to build a climate of support if concerns are raised, including suspected breach of our Code of Conduct, where there is an avenue to report and be confidentially investigated.
Statement of approvalThis Strategic Report, including pages 1 to 61, was approved by the Board of Directors on 21 June 2021 and is signed on its behalf byMiles RobertsGroup Chief Executive
Annual Report 2021 dssmith.com 61
STRATEGIC REPORT

Geoff Drabble Chairman
Key strengths:• Wealth of industrial and
international experience• Extensive experience as a
chairman
External appointments:• Geoff is Non-Executive
Chairman of Ferguson plc and a Non-Executive Director of Howden Joinery Group Plc.
Geoff was appointed to the Board on 1 September 2020 as a Non-Executive Director and became the Chairman of the Board and the Nomination Committee on 3 January 2021. Geoff served for 12 years as Chief Executive of Ashtead Group plc, the FTSE 100 industrial equipment rental company. He was previously an executive director of The Laird Group plc and held a number of senior management positions at Black & Decker.
Geoff’s wealth of industrial and international experience, combined with his experience of chairing boards of listed companies and his awareness of both the non-executive and chief executive perspective, means that his skills and experience contribute to the Board’s practical understanding of good governance in action, balancing stakeholders’ interests across the range of issues considered by the Board, including environmental, social and governance matters.
Miles RobertsGroup Chief Executive
Key strengths:• Clear strategic mindset • Strong leadership skills
External appointment:• Miles is a non-executive
director of Aggreko plc
Miles was appointed to the Board on 4 May 2010 as Group Chief Executive.
Following his engineering degree he became a chartered accountant and brings to the Board extensive financial and operational experience. He was previously Chief Executive of McBride plc, having originally joined as its Group Finance Director. He was Senior Independent Director of Poundland Group plc until September 2016.
As Group Chief Executive Miles leads the executive management of the Group and is responsible for DS Smith’s overall environmental, social and governance (ESG) performance and its clear objectives at the centre of our business model. He chairs the Group’s Health, Safety, Environment and Sustainability Committee that monitors the establishment of goals, reporting and related governance procedures.
Miles’ strong leadership skills combined with his clear strategic mindset, rooted in the practicality of his engineering and accountancy training, means that his skills and experience, and ability to identify material risks and sustainable growth opportunities for the Group’s business, contribute to the Board’s clear strategic vision.
Adrian MarshGroup Finance Director
Key strengths:• Strong financial expertise
within an international context
• Wealth of finance experience in large listed multinationals
External appointment:• Adrian is a non-executive
director and audit committee chairman at John Wood Group PLC
Adrian was appointed to the Board on 24 September 2013 as Group Finance Director.
As the former head of Tax, Treasury and Corporate Finance at Tesco PLC, Adrian has helped DS Smith to significantly build the finance function and deliver strong financial results. As a qualified accountant, and coming from a FTSE background, he has held divisional CFO positions at both AstraZeneca plc and Pilkington plc.
Adrian’s depth of experience in a range of financial roles in large listed multinationals means that his skills and experience contribute to the Board’s understanding of all aspects of the financial implications, whether risks or opportunities, of both the routine and project aspects of the Group’s business and operations.
Celia BaxterNon-Executive Director
Key strengths:• Extensive HR experience
and ESG knowledge and experience
• Board experience in non-UK listed companies
External appointments:• Celia is the senior
independent director and the remuneration committee chair at Senior plc and remuneration committee chair at RHI Magnesita NV
Celia was appointed to the Board as a Non-Executive Director and Chairman of the Remuneration Committee on 9 October 2019.
Most recently Celia was Director of Group HR and responsible for all ESG activities at Bunzl plc for 13 years. Her early executive career was with Ford Motor Company and KPMG. She has held HR positions with Hays plc, Enterprise Oil Plc and Tate & Lyle Plc. As a non-executive director she was on the board of NV Bekaert SA until May 2020.
Celia’s background of working in a range of sectors means that, as well as her experience as a remuneration committee chairman and her understanding of employee dynamics and ESG issues, she brings extensive and practical business knowledge to the Board.
Alina KesselNon-Executive Director
Key strengths:• Broad and wide-ranging
marketing experience• International outlook
External appointment:• Alina is a Global Client
Leader at WPP, a leading international marketing communications company
Alina was appointed to the Board on 1 May 2020 as a Non-Executive Director.
She has over 25 years of experience building global brands for large multinational clients, helping them grow their business through communications, experience, commerce and technology. Her current role with WPP includes working with global clients on their sustainability agenda. Originally from the Ukraine and a US national, Alina has lived and worked in the UK, US, Australia and Germany, where she was CEO of Grey Advertising and, later, of DDB Tribal Group.
Alina’s experience of living, as well as working, in a number of different countries, including the US, combined with her expertise in marketing and communications means that her skills and experience will contribute an additional perspective to the Board’s discussions, particularly when considering the interests of employees (based in over 30 countries) and our global customers and discussing how to communicate key non-financial aspects of our business.
N RNARNAN R
62
Board of Directors
David RobbieNon-Executive Director
Key strengths:• Strong financial and
corporate finance experience
• International and strategic mindset
External appointments:• David is the senior
independent director and audit committee chair at FirstGroup PLC and non-executive director of easyJet plc.
David was appointed to the Board as a Non-Executive Director on 11 April 2019 and became Chairman of the Audit Committee at the conclusion of the 2019 AGM.
He was previously Finance Director of Rexam PLC, before its £4.3 billion acquisition by Ball Corporation in 2016. Prior to his role at Rexam, in the aluminium packaging business, David served in senior finance roles at BTR plc before becoming Group Finance Director at CMG plc in 2000 and then Chief Financial Officer at Royal P&O Nedloyd N.V. in 2004. He served as a non-executive director of the BBC between 2006 and 2010 and as Chairman of their audit committee. David qualified as a chartered accountant at KPMG.
David’s strong financial, risk management and corporate finance experience combined with his international and strategic mindset and deep and practical governance experience with over 20 years serving as a director on FTSE boards means that his skills and experience add depth to the Board’s discussions in these areas.
Louise SmalleyNon-Executive Director
Key strengths:• Strong HR experience• Extensive knowledge of
people management, rewards and remuneration schemes
External appointment:• Louise is Group Human
Resources Director and an executive director of Whitbread PLC
Louise was appointed to the Board on 23 June 2014 as a Non-Executive Director.
She has held several key transformation and HR roles at Whitbread PLC, spanning 25 years of growth and significant change for the companies in that group. She previously worked as an HR professional in the oil industry, with BP and Esso Petroleum. Louise is an alumna of the Cambridge Institute for Sustainability Leadership and has experience of leading timely evolutions to sustainability strategies.
Louise’s experience as a serving listed company executive director over the last eight years, combined with her extensive knowledge of progressive people management practices in multi-site large scale businesses, means that her skill and experience contribute to the Board’s focus on the importance of enabling everyone who works for the Group, whatever their background, to realise their potential.
Rupert Soames OBESenior Independent Director
Key strengths:• Wealth of international
operational experience • Extensive understanding
of UK plc environment as a serving CEO
External appointment:• Rupert is Group Chief
Executive Officer at Serco Group plc
Rupert was appointed to the Board on 1 March 2019 as a Non-Executive Director and became Senior Independent Director at the conclusion of the 2019 AGM.
He was previously Chief Executive at Aggreko plc and Chief Executive of Misys plc Banking and Securities Division. Until July 2016 Rupert was also Senior Independent Director of Electrocomponents plc and a member of its Remuneration, Nomination and Audit Committees.
Rupert’s hands on experience of the UK plc environment as a serving CEO, balancing the management of risk and reward, combined with the wealth of his international operational experience means that his skills and experience contribute to the Board’s international outlook, embedded in a clear-sighted view of operational realities in today’s world.
Iain SimmGroup General Counsel and Company Secretary
Key strengths:• Legal expertise• Wealth of experience in
assisting boards with legal and governance matters
External appointment:• None
Iain was appointed Group General Counsel and Company Secretary on 6 June 2016.
He has previously held General Counsel and Company Secretary roles with Signature Aviation plc and P&O Ports Ltd. He undertook his legal training with Slaughter and May and worked for a number of years in their corporate and commercial department.
Principal Board Committees key:
A Audit Committee N Nomination
Committee R Remuneration Committee
Chair
RNA RNA RNA
GOVERNANCE
Annual Report 2021 dssmith.com 63

IntroductionThis section of the Annual Report focuses on corporate governance. In essence, good governance requires the right information to be brought before the right people at the right time.Never has this been more important than in the past 12 months, when we have all faced challenges in every aspect of our lives and when having as comprehensive and rounded a view of the context in which our decisions are taken has never been more relevant, nor, at some stages in the year, more difficult.
UK Corporate Governance CodeYour Board understands that good corporate governance is an essential element in helping to build a successful business in a sustainable manner. There are five sections to the UK’s Corporate Governance Code (Code) and the governance section of our Annual Report follows the same order as the Code.
Board leadership and Company PurposeThe Code provides that a board should establish a company’s purpose and values as well as its strategy and that its directors should lead by example and promote the desired culture.More information about how we engage with our stakeholders as part of our Board activities is set out on pages 67 to 69 and how we do so as a Group is summarised on page 3.
“Good governance requires the right information to be brought before the right people at the right time.”Geoff Drabble, Chairman
Division of responsibilities My role as Chairman is to lead the Board and be responsible for its overall effectiveness in directing the Company. It is important that each member of the Board is clear about their responsibilities and also that each member of the Board is able to contribute fully to all aspects of the discussions we have as a Board. The approval of certain Group policies (including some of those listed in the non-financial information statement on pages 59 to 61) is one of the matters reserved to the Board and is one of the ways as a Board we have oversight of longer-term aspects of the Group’s operations, including our leadership on sustainability matters and our progress in addressing climate-related issues.
Board composition, succession planning and evaluation I joined the Board as Non-Executive Director on 1 September 2020 and became Chairman on 3 January 2021, following Gareth Davis’ retirement from the Board. Gareth made an enormous contribution to the Group and, as well as being instrumental in the successful development of the business over the last decade, he chaired the Board with consummate skill and always kept a wide range of considerations in clear focus. Alina Kessel joined the Board with effect from 1 May 2020, bringing her international experience and marketing expertise to our discussions. As at 1 May 2021 our eight member Board was made up of three women and five men. Over the course of the last two years the Board has had a period of structured change, as the succession planning for Non-Executive Directors has led to a phased series of appointments and retirements. For each appointment made, the Board looked to appoint an outstanding candidate, with a diverse range of experience, to maximise Board effectiveness. When we think
64
Chairman’s introduction to Governanceabout diversity we recognise that diversity can take many forms, including diversity of gender, social and ethnic backgrounds, and of cognitive and personal strengths, and that diversity at Board level and throughout the Company is a valuable strength. We also recognise that the mix of skills needed by Board members will change as the landscape in which the Group operates changes. Therefore, as we consider each new Board appointment, the role specification is not a direct replication of the role of a retiring Board member.The next external evaluation of the Board and its Committees and how they have contributed to the overall effectiveness of the Group will be undertaken in the autumn of 2021. More information about how the Board has assessed in 2021 its progression in meeting the objectives we set ourselves after the 2020 internal Board evaluation is set out on page 72.
Balancing stakeholders’ interests The Board is conscious that all our stakeholders have multiple roles and the past 12 months have been a difficult balancing act for many. One example is our employees who have had to manage home schooling of children while also, as friends or family members, trying to give care and support to others from a distance. As a business too we know that balancing the many, sometimes divergent, often competing, interests of our different stakeholders requires sensitive vigilance. As a Board we understand the importance of making a decision in the moment and at the time when a decision is needed. We also recognise that some commentators might make different judgements. Each Board pack for each Board meeting includes on the agenda a reminder of each Director’s duties under section 172 of the Companies Act, framing our deliberations at each meeting in the context of a reminder that each Director must act in the way they consider, in good faith, would be most likely to promote the success of the Company for the benefit of its members as a whole, while thinking about the likely consequences of any decision in the long term, the interests of the Company’s employees, the need to foster the Company’s business relationships with suppliers, customers and others, the impact of the Company’s operations on the community and the environment, the desirability of the Company maintaining a reputation for high standards of business conduct, and the need to act fairly as between the members of the Company.
A principal decision we took as a Board in 2020, that was a high profile example of considering the balance of all these factors, was the decision not to pay a dividend in respect of the financial year 2019/20. Further background to this decision is set out on page 67.The Board has taken a close interest in our stakeholders’ reactions to the publication of our Now and Next sustainability strategy. Our progress to date in realising our strategic goal of leading the way in sustainability is summarised on pages 30 to 33 of this report, with more details being available in our latest Sustainability Report. Since joining the Board I have been impressed by the way in which the Group has shown agility, adapting to the circumstances of the pandemic-aware world that we all now live in. As your Chairman I look forward to supporting and challenging the team to continue to show that agility and ability to adapt and evolve to the long-term benefit of all our stakeholders as we realise our Purpose of ‘Redefining Packaging for a Changing World’. Geoff DrabbleChairman
21 June 2021
We use boxes like this throughout the governance section of the Annual Report to highlight why we are telling you the information. We hope that this will help you both find what you are looking for in our report and understand the way we have structured our disclosures to be both compliant with regulation and, we hope, readable.
We use this symbol throughout the governance section of the Annual Report to highlight examples referred to in the
section 172 statement on page 15.
This year the governance section of the Annual Report opens by summarising what each Board member contributes to the governance of the Company and its long-term success. The Chairman’s introduction to governance puts DS Smith’s approach to matters of corporate governance into our DS Smith context. It is followed by a brief summary of our approach to each of the five sections of the Code.
s172
GOVERNANCE
Annual Report 2021 dssmith.com 65

Corporate Governance in action The 2018 UK Corporate Governance Code (the Code) published by the Financial Reporting Council (FRC) and available at www.frc.org.uk asks companies to focus on the application of the principles of good governance in their specific context. In the introduction to the Code the FRC recognises that high-quality reporting on the provisions of the Code may include an explanation of how the spirit of the principles has been applied, which, in some cases, may be by a different route from that suggested in the Code’s provisions.
Our compliance with the UK Corporate Governance Code’s five sections1 Board leadership and Company Purpose
Your Board rigorously challenges strategy, assesses performance and balances the interests of all our stakeholders to ensure that every decision we make is of the highest quality. Robust and constructive debate is particularly important when there are no easy answers as we all adjust to the near and longer-term implications of the Covid-19 pandemic. From page 67
2 Division of responsibilitiesYour Board and its Directors, both executive and non-executive, operate within a clear framework of roles and responsibilities. One of the roles of Non-Executive Directors is to broaden the diversity of viewpoints shared in the boardroom discussion, drawing on the full range of their experience in other industries and other countries. This has been particularly valuable as your Board considers how we can better serve our customers in this time of uncertainty.From page 70
3 Composition, succession and evaluationYour Board scrutinises the effectiveness of its performance in an annual Board evaluation and evaluates the balance of skills, experience, knowledge and independence of the Directors. That then informs the succession planning process, which also takes into account the contribution made by having a diversity of backgrounds (whether of gender, of social or ethnic backgrounds, or of the less immediately visible cognitive differences). All new Directors receive a tailored induction programme, which builds on their personal experience and ensures that appointments can be made from a wider pool of talent than one limited to only those with previous experience of holding a directorship with a UK listed company.The background to Gareth Davis having been on the Board for longer than nine years when he retired from the Board in January 2021, although he was Chairman for less than nine, was described in both the 2019 and 2020 Annual Reports.From page 72
4 Audit, risk and internal control All your Board’s decisions are discussed within the context of the risks involved. Effective risk management, set in the context of a well-structured internal control framework, is central to achieving our strategic objectives, particularly as we balance the sometimes conflicting interests of our stakeholders. From page 76
RemunerationOur remuneration policy, which was approved at the 2020 AGM, is designed to support our long-term strategy and to promote long-term sustainable success. It was developed taking into account wider circumstances as your Board currently understands them and setting those in the context of the longer-term future of DS Smith in this changed world. Each element of remuneration is looked at, both individually and cumulatively. As described on page 85 in the Remuneration Report, the pension contribution rates for Executive Directors are not, at the date of this report, fully aligned to that available to the workforce, although future alignment has been confirmed. (The Group Chief Executive’s pension contribution reduced by 10% in 2020 and will reduce by a further 5% on 1 August 2021 to 15% of annual salary. The Group Finance Director’s pension contribution was reduced by 5% in 2020 and will reduce by a further 5% on 1 August 2021 to 10% of annual salary.) As previously explained on page 93 of the 2020 Remuneration Report, there could, in theory, be a combination of events that might, in the case of a certain type of ‘good leaver’, mean that the period from grant of long-term share award to release of award might not be five years, as, for any PSP awards which vest following departure that have been granted good leaver treatment, the Remuneration Committee will reduce the two year post-vesting holding period so that it does not extend beyond the second anniversary of departure (provided that the three year vesting period has been completed).Our remuneration policy is aligned to our Purpose of ‘Redefining Packaging for a Changing World’. Each year we look afresh at our reward principles and test that they continue to support our values as a Group.From page 84
5
This report outlines how we have applied the Code’s main principles and explains where, in three specific instances (provisions 19, 36 and 38), our approach (summarised in the box below) differs from the Code’s. The FRC and investors agree that a company is compliant with the Code if it chooses to depart from a provision of the Code, so long as ample, transparent explanation is given.
66
Corporate Governance in contextBoard leadership in action The Covid-19 pandemic has thrown up a wide range of challenges. Every aspect of the business has been impacted throughout the past year. In response to this the Board has met more regularly than in prior years, adding informal briefing calls, their frequency being responsive to the evolving priorities of the business. The regular scheduled meetings have continued to take place. All these meetings have taken place with the support of technology, a compromise that reduces time spent travelling, but also constrains some of the interaction that in-person meetings facilitate. Nevertheless the scheduled meetings continue to cover all the topics essential to support the regular cycle of annual reporting and corporate planning processes and continue to give opportunity to explore with the management team background to proposals, such as the proposals to begin work on two new greenfield sites, one in Italy and one in Poland (that were
announced in December 2020). In discussing our new greenfield site proposals, one of the principal decisions in 2020/21, the Directors asked for more information about environmental impact assessments done in relation to the potential sites and sought clarification about how having these two new sites would impact the Group’s overall carbon footprint.Health and safety is always a priority item on the Board’s agenda. Setting the example from the top down is critically important.
Miles Roberts took part this year in our virtual health and safety on-boarding sessions, introducing the programme and then in
the second session a month later, reviewing progress on participant commitments made at the first session. The Code highlights the importance of effective engagement with shareholders and other stakeholders. The Group’s key stakeholders and their differing perspectives are identified and taken into account, not only as part of the Board’s annual strategy and corporate planning discussions, but also in our project assessments and in other Board conversations. The Board understands that the Group has a role as an employer and as a taxpayer as well as a member of the wider communities in which our sites are based and as a key link in the supply chains through which so many goods pass, and that these roles are broader than the more traditional single role of a corporate entity reporting on its financial results to its shareholders. The balancing of the differing perspectives of all our key stakeholders is a recurrent theme in our Board’s conversations.All discussions, assessments and conversations focus not only on delivering increased value for shareholders, but also assess the impacts of our decisions and strategies on the Group’s wider stakeholders. The Board recognises the importance of regular, open and constructive dialogue with shareholders and other stakeholders and this has long been a key aspect of our culture and of our decision-making.
Engagement with our shareholdersDialogue with investors continues throughout the year, not only ahead of the AGM. In 2020 DS Smith, like all other businesses, was not able to offer shareholders the opportunity of attending the AGM in person, due to the public health guidance and measures regarding the conduct of general meetings brought in by legislation. Instead we encouraged shareholders to email in their questions and to watch on our website the video of the presentation that our Group Chief Executive gave on the Company’s performance and strategy.The Group’s Investor Relations team coordinates ongoing communication with shareholders and analysts and the Board receives regular updates on the views of the Group’s shareholders from our internal team and also from the Company’s brokers. Celia Baxter, as Chairman of the Remuneration Committee, leads the engagement with shareholders when we have remuneration matters to discuss. Rupert Soames, as Senior Independent Director, led the engagement with our shareholders about succession planning for the Chairman’s role and Geoff Drabble met a number of shareholders shortly after becoming Chairman.In respect of the financial year 2019/20 the Company did not pay either an interim or a final dividend. The Board recognises that the dividend is an important component of shareholder returns. In the context of the unprecedented uncertainty due to the Covid-19 pandemic, exacerbated by its timing in relation to the 30 April year end of the Company, decisions on the dividend needed to be taken earlier in 2020 than had to be taken by 31 December year end companies and had to be taken at the height of the Covid-19 uncertainty. The Board took the view that it was prudent, despite the Group’s strong liquidity profile and resilient trading to April 2020, not to pay the interim dividend in May 2020, nor, when assessing the overall outlook in June 2020, to pay a final dividend for the year ending 30 April 2020. The Board is aware that this difficult decision disappointed shareholders. In considering the appropriate course of action in the context of all the dimensions of the pandemic-fuelled uncertainty, the preferences of shareholders were balanced with those of other stakeholders. By September 2020 the Board was able to signal to investors that it would resume payment of dividends and in December 2020 declared an interim dividend, reflecting the strong demand for packaging, and increasing visibility and confidence over the future.Each year shareholders (and other interested bodies) issue materials concerning their expectations of companies. These are summarised for, and considered by, the Board, which also informs the comments that Board members make on the working drafts of the Annual Report that they review, prior to its final approval and publication.
s172
s172
s172
s172
GOVERNANCE
Annual Report 2021 dssmith.com 67
Board leadership and Company Purpose

Engagement with our workforceOur engagement with our workforce is being developed further, making good use of the already well-established European Works Council (EWC) structure.
EWC representatives meet regularly with our Group Chief Executive and Group HR Director to discuss a wide range of
topics. While health and safety, Group performance and sustainable employment are always on the agenda for these discussions, this year topics have also included the implementation of our employee charter, IT security and use of CCTV, and the many aspects of adapting to the pandemic, including discussion about measures to contain any spread, the expectations of employees displaying symptoms, travel restrictions and recognising employee contributions.
Members of management continued to attend EWC meetings, held virtually on a platform that enables live interpretation.
Again this year an EWC representative joined a meeting of the Remuneration Committee. At that meeting the EWC representative presented to the Remuneration Committee a summary of results and insights provided by the Group-wide employee survey about Sharesave, our employee share plan (as
further described on page 86). Celia Baxter, the Chairman of our Remuneration Committee, has also met with the EWC
Executive in 2021 and, building on the dialogue started at their meeting in 2020, she both gave a presentation and answered questions about the main changes to the Directors’ remuneration policy approved by shareholders at the 2020 AGM and the impact of the pandemic on the Remuneration Committee’s deliberations on executive remuneration. Additionally the EWC Executive asked her about how the voting process worked for resolutions at the AGM and about the Group’s commitment to diversity at senior levels of management.The regular schedule of reporting to the Board includes, in relation to our workforce, such matters as reviewing the outcomes from the topic-based, pulse employee engagement surveys and the regular schedule of reporting to the Nomination Committee includes the review of employee talent. All these activities ensure that the voice of our workforce is heard regularly in the boardroom and provides richer context for the Board’s decision-making.
s172
s172
s172
s172
s172
Engagement with our suppliers, customers and other stakeholdersThe business relationships with our suppliers, customers and other stakeholders, such as regulators and non-governmental organisations, are matters which the Group Chief Executive covers in his regular reports to the Board. As Group Chief Executive, Miles Roberts is responsible for the Group’s overall ESG performance and its clear objectives at the centre of our business model. The Board recognises the crucial importance of delivering on our sustainability ambitions, helping reduce waste and protect natural resources as our designers realise the opportunities within the circular economy by applying our Circular Design Principles. One of the challenges in this area can be some customers’ shorter-term goals. The Board appreciates that there may be occasions when the longer-term, more sustainable approach may, in the shorter term, have a financial impact.The Board receives regular updates from the Group procurement function which has first-line responsibility for relationships with suppliers. In the past year the Board has discussed the carbon implications of the Group’s sources of energy and how supply planning takes account of future developments in this area.Complementing the regular briefings from operational and functional management about Group-specific matters (such as reports from our Corporate Affairs Director on progress made during the year on both sustainability and our programme of wider engagement in the community and the report to each Board meeting on health and safety), the Board also has a programme of briefings from the Group’s external advisers on a range of topics. This enables current and future plans to be set in the wider context of the broader environment. This covers not just topics currently visible, but emerging areas of interest and concern across a diverse range of fields. One of the actions from the 2020 Board evaluation was to change the frequency of Board discussions on topics such as relationships with customers and suppliers and our continuing engagement with the Ellen MacArthur Foundation. This has increased in 2020/21. For example, this year the Board heard from the head of our sales, marketing and innovation (SMI) function who takes overall responsibility for relationships with our packaging customers, but this remains an area where the Board recognises that more could be done. Our engagement with the local communities of which our sites and employees are a part has been a developing area of focus in recent years. A key target in our Now and Next sustainability strategy is to engage in community programmes at all our sites that have more than 50 employees, which we have again achieved in 2020/21. These programmes are guided by our Purpose and focus on supporting the improvement and protection of the environment and inspiring and educating. In addition this year there have been a number of one-off donations, such as 10,000 multipurpose auxiliary bedside tables made from corrugated cardboard donated by our Madrid plant to a field hospital in Spain and 100,000 cardboard plane and helicopter toy models
BOARD LEADERSHIP AND COMPANY PURPOSE CONTINUED
68
distributed in France to children confined to their homes during their school holidays. As part of the regular cycle of briefings the Board has been updated on these and such
community programmes as the eco-classroom, featuring a rainwater collection system, solar panels and an organic garden in a primary school in Hungary, and the development of the biodiversity programmes at each of our paper mills.
Board engagement through site visitsBoard site visits are an important way in which Board members can engage with our employees and understand more about our customers and suppliers. While travelling to attend a physical meeting as a Board, in the way that the Board did in October 2019 when it visited our kraft paper mill in Viana, Portugal, was not possible this year, Alina Kessel and Geoff Drabble, as part of their induction programme, were taken
on a virtual tour of the Livingston facility by the UK Packaging management team. In addition to a full review of
the site, the tour included updates and discussions about current performance projects at the site and the measures in place to manage health and safety risks, including those related to Covid-19. Non-Executive Directors are encouraged, when they can, to visit sites individually, as Celia Baxter, David Robbie and Rupert Soames were able to do as part of their induction programmes when they first joined the Board. Such visits enable Directors individually to assess in more detail what our Purpose of ’Redefining Packaging for a Changing World’ looks like at a local, site level and how our values (see page 2) underpin the delivery of our Purpose through our strategic goals.At each Board meeting health and safety is reported on, including the total number of near misses and safety observations and the number per employee. These are seen as indicators of employee engagement in observing and reporting positive behaviour and identifying health and safety risks. The level of engagement is seen as a reflection of the culture and health and safety leadership at a site. This financial year the total number has increased by 25 per cent with the engagement rate showing a similar improvement. On a site visit the impact of that employee engagement with all aspects of health and safety can be seen in action.
The regulatory requirement is to include in the Strategic Report a statement about the Directors’ compliance with section 172 of the Companies Act 2006 concerning taking into account the interests of a variety of stakeholders. This is on page 15. What that statement means in practice is also illustrated in this part of the report, which also links to the topics covered in section 1 of the Code (board leadership and company purpose). Here we also explain how we have applied aspects of Code principles A to E and how we have put the related provisions of the Code into practice.
In addition to the regulatory requirement to include a statement about section 172 of the Companies Act 2006 in the Strategic Report, there is also a requirement to make a statement about the Company’s engagement with the wider UK workforce and with suppliers and customers. The methods of engagement in the UK and across the wider workforce are broadly the same, so we have cross-referenced, not repeated, our disclosures on these matters.
In this report we sometimes report on ‘employees’ and sometimes on ‘workforce’. This is because sometimes the regulatory requirements specifically ask us to report on matters relating to ‘employees’ (those who are employed directly by the Group under contracts of service). When we use the term ‘workforce’ we are including all those who work for the Group, including those sub-contracted to work for the Group.
Statement about the Company’s engagement with the wider UK workforceMore detail about how we realise the potential of our people by engaging with our wider workforce (a term, as described below, that is wider than the term employees, who are those employed directly by the Group under contracts of service) wherever they are based (not just those based in the UK) is set out on pages 24 to 29 of the Strategic Report.
Statement about the Company’s engagement with suppliers and customersMore detail about how we engage with our customers and the importance of sustainability throughout our supply chain is set out on pages 22 and 23 and 30 to 33 of the Strategic Report.
Throughout the uncertain times of Covid-19 the safety and wellbeing of our people has been our first priority, while recognising our responsibility to support our customers as they keep essential goods such as food and pharmaceuticals moving. All our decisions have been taken in that context.
s172
s172
GOVERNANCE
Annual Report 2021 dssmith.com 69

Division of responsibilities of the Board and its principal Committees
In addition there were a number of informal briefing calls that the Chairman and Group Chief Executive held with the Board and other ad hoc Board meetings were held to discuss business matters that the Chairman and Group Chief Executive decided should be considered by the Board. Due to the public health
Section 2 (division of responsibilities) of the Code sets out matters relating to independence of Directors and the structure of the Board and its Committees. We cover these items (including the application of
aspects of Code principles F to I) in this part of the report and in the Nomination Committee Report that follows, where we also have more information about the independence of Directors.
The BoardThe Board is collectively responsible for the long-term success of the Group and for ensuring leadership within a framework of effective controls. The key roles of the Board are:
• Setting the strategic direction of the Group• Overseeing implementation of the strategy by ensuring that the
Group is suitably resourced to achieve its strategic aspirations
• Providing entrepreneurial leadership within a framework of prudent and effective controls which enables risk to be assessed and managed
• Ensuring that the necessary financial and human resources are in place for the Group to meet its objectives
• Setting the Group’s values.
Chairman• Primarily responsible for overall operation, leadership and
governance of the Board• Leads the Board, sets the agenda and promotes a culture of open
debate between Executive and Non-Executive Directors • Regularly meets with the Group Chief Executive and other senior
management to stay informed• Ensures effective communication with our shareholders.
Group Chief Executive• Responsible for executive management of the Group as a whole• Delivers strategic and commercial objectives within the Board’s
stated risk appetite• Builds positive relationships with all the Group’s stakeholders.
Senior Independent Director• Provides a sounding board to the Chairman and appraises
their performance• Acts as intermediary for other Directors, if needed• Available to respond to shareholder concerns if contact through
the normal channels is inappropriate.
Non-Executive Directors• Constructively challenge and help develop proposals on strategy• Scrutinise the performance of management • Monitor the reporting of performance.
Board and Board Committee meetings attendance Board
Nomination Committee
Audit Committee
Remuneration Committee
Total number of meetings in 2020/21 7 4 4 8 Executive DirectorsMiles Roberts 7/7 4/4 n/a n/aAdrian Marsh 7/7 n/a n/a n/aNon-Executive DirectorsGeoff Drabble – joined the Board on 1 September 2020 6/6 3/3 n/a 6/6Gareth Davis – retired from the Board on 3 January 2021 4/4 3/3 n/a 5/5Celia Baxter 7/7 4/4 4/4 8/8Chris Britton – retired from the Board on 8 September 2020 1/1 2/2 1/1 3/3Alina Kessel 7/7 4/4 4/4 8/8David Robbie 7/7 4/4 4/4 8/8Louise Smalley 7/7 4/4 4/4 8/8Rupert Soames 7/7 4/4 4/4 8/8
guidance and measures regarding the conduct of general meetings brought in by legislation, the full Board, like other shareholders, were not able to attend the AGM in 2020 in person, which was attended by the Chairman and the Group General Counsel and Company Secretary.
70
Division of responsibilities Board’s principal Committees
Board standing sub-committeesIn addition to the three principal Committees of the Board there are four further standing sub-committees of the Board.
Management committeesThree management committees, chaired by the Group Chief Executive, and the Group Compliance Committee also support the work of the Board and its principal Committees.
Audit Committee • Monitors the integrity of the
Group’s reporting process and financial management, its accounting processes and audits (internal and external)
• Ensures that risks are carefully identified and assessed and that sound systems of risk management and internal control are in place
• Oversees fraud prevention arrangements and reports received under the ‘Speak Up!’ policy.
For more information see page 78
Disclosure Committee which oversees the Company’s compliance with its disclosure obligations.
Group Health, Safety, Environment and Sustainability CommitteeMeets monthlyOversees the management processes, targets and strategies designed to manage health and safety and environmental and sustainability risks and opportunities, to ensure compliance with the Group’s health and safety and environmental and sustainability responsibilities and commitments.Group Operating CommitteeMeets monthlyConsiders Group-wide initiatives and priorities. Reviews the implementation of
operational plans. Reviews changes to policies and procedures and facilitates the discussion of the development of new projects.Group Strategy CommitteeMeets monthlyPlans the business strategy implementation as approved by the Board and set out by the annual Corporate Plan process. The Corporate Plan is used to develop the Group’s strategy, based on the set strategic direction. The Corporate Plan’s focus is primarily on strategic actions, supported by high level financial information. It covers a three-year time horizon and is reviewed annually by the Board.
US Sub Committee which oversees the strategic direction of business in the US, together with any associated risks or opportunities in the business.
Group Compliance CommitteeMeets quarterlyOversees compliance with all legal, regulatory and organisational requirements including the effective interface between the financial, legal, risk and internal audit functions, reporting back to both the Group Operating Committee and the Audit Committee.
General Purposes Committee which facilitates efficient operational management decision-making in relation to day-to-day financing and administrative matters.
Share Schemes Committee which facilitates administrative matters in relation to the Group’s share schemes.
Nomination Committee• Reviews the structure, size and
composition of the Board and its Committees
• Identifies and recommends suitable candidates to be appointed to the Board and reviews the wider senior management talent pool
• Considers wider elements of succession planning below Board level, including diversity.
For more information see page 73
Remuneration Committee• Recommends the policy for the
remuneration of the Chairman, the Executive Directors, the Company Secretary and senior executives, in alignment with the Group’s reward principles
• Reviews workforce remuneration and related policies and alignment of incentives and rewards with culture, to help inform setting of remuneration policy
• Considers the business strategy of the Group and how the remuneration policy reflects and supports that strategy.
For more information see page 84
GOVERNANCE
Annual Report 2021 dssmith.com 71

Board evaluation in practiceFormal evaluation is a valuable tool for improvement. It can be used iteratively as part of a structured process to build, year by year, on the assessments of prior years. It can help inform decisions about succession planning for the Board and senior management and therefore the composition of the Board. As well as giving a structured opportunity to consider areas for potential future development, a formal evaluation is an opportunity to think consciously about what has worked well and how to maintain that in the coming year, as well as what has been less effective and how that might be changed. When considering the timing of the 2021 external Board evaluation the Board decided that it should be undertaken in October 2021 after Geoff Drabble has spent a preliminary period in the Chairman’s role, including the closing of the 2020/21 financial year end. It is also hoped that the evaluation can by October be carried out in person, rather than remotely through video technologies, giving a richer opportunity for insight and feedback from the external evaluator. Following on from the internal evaluation undertaken in 2019/20, for its 2020/21 Board evaluation and performance review the Board revisited the action plan that had been agreed as part of the 2019/20 evaluation, looked at how fully it had addressed those actions, considered whether those actions needed to be amended or added to and also looked generally at the performance and effectiveness of the Board and its Committees. • The Board was satisfied with the way the Nomination
Committee had operated during the year and, following the appointment of a new Group HR Director, was confident that improvements to the process for recruiting to senior management roles were underway.
• The nature of the past year has reduced the amount of time available for wider horizon-scanning discussions in the regularly scheduled Board meetings. It is hoped that 2021 will permit the Board to spend more focused time understanding insights around global, societal and consumer trends, including those outside the immediate categories in which the Company operates, utilising both internal and external expertise.
• The Board has valued the increased frequency and depth of the Board discussions of briefings (including metrics) on ESG (environmental, social and governance) topics such as relationships with customers, suppliers and the businesses’ efforts and involvement in the many and diverse communities in which we operate, and recognises that these are fast-evolving areas .
As with every high performing board, the Directors will continue to watch for areas of improvement, not just when Board evaluation is a formal agenda item at a Board meeting.
This section and the Nomination Committee Report that follows explain how we have applied aspects of Code principles J to L in section 3 (composition, succession and evaluation) and how we have put the provisions of that section of the Code into practice.
Succession and compositionMore details about succession planning are set out in the Nomination Committee Report, later in this Report. More details about the current composition of the Board are set out in the biographies of the Directors on pages 62 and 63. Geoff Drabble joined the Board with effect from 1 September 2020. Chris Britton retired from the Board on 8 September 2020 and Gareth Davis retired from the Board with effect from 3 January 2021. All the other Directors held office throughout the year under review.
72
Composition, succession and evaluation
Dear shareholdersThe Nomination Committee supports the Board in executive and non-executive succession planning. Our principal objectives as a Nomination Committee are:• To make sure the Board has individuals with the necessary
range of skills and knowledge and diversity of experiences to lead the Company
• To ensure that the Board is effective in discharging its responsibilities and overseeing appropriately all matters relating to corporate governance.
Our key responsibilitiesAs a Committee we have delegated authority from the Board to focus on Board and Committee composition and succession planning. In discharging those key responsibilities in relation to succession planning we also consider ways to: • Improve diversity in the pipeline for senior management roles• Further strengthen the senior management team.As Chairman of this Committee, I report to the Board on the outcome of our meetings.
Our year under reviewAlina Kessel joined the Board in May 2020 and I joined in September 2020. I then took on the role of Chairman when Gareth Davis retired from the Board in January 2021. Alina and I each bring our own perspectives and experience to these roles and look forward to building on the contributions of our predecessors.
“A key objective is to make sure the Board has individuals with the necessary range of skills and knowledge and diversity of experiences to lead the Company.”Geoff Drabble, Chairman of Nomination Committee
Our priorities over the year were:• To scope out the key skills, experience, characteristics and
requirements for new Non-Executive Directors • To keep under review succession planning at the Executive
Director level and support succession planning at senior management levels
• To keep under review our leadership needs, both executive and non-executive, with a view to ensuring the continued ability of DS Smith to compete effectively in the marketplace
• To monitor the Group’s progress towards increasing the relative number of women in senior management positions
• To improve the diversity on the Board and in the pipeline for senior management.
Membership and operation of the CommitteeMember Since
Geoff Drabble (Chairman since 3 January 2021) 2020Celia Baxter 2019Alina Kessel 2020Miles Roberts 2010David Robbie 2019Louise Smalley 2014Rupert Soames 2019
Chris Britton retired from the Board and its Committees on 8 September 2020 and Gareth Davis retired from the Board and its Committees on 3 January 2021.
During the year, the Committee held four formal meetings and there were regular updates between formal meetings and a number of ad hoc briefings. Details of individual Directors’ attendance can be found on page 70. The Group General Counsel and Company Secretary acts as Secretary to the Committee.
GOVERNANCE
Annual Report 2021 dssmith.com 73
Nomination Committee Report

Succession planning and recruitment Over the course of the last two years the Board has had a period of structured change, as the succession planning for Non-Executive Directors has led to a phased series of appointments and retirements. The process for the appointments of Alina Kessel and myself as new Non-Executive Directors began with inviting a number of recruitment firms to participate in a selection process, focusing on a series of key questions in order to identify the appropriate consultants to support our search. Inzito were selected in that process. A role specification was agreed and provided to Inzito, who then put forward a shortlist of candidates for review by the Committee. The shortlisted candidates were interviewed by a number of the Executive and Non-Executive Directors and the Committee made a recommendation to the Board. Rupert Soames chaired those meetings when the recruitment of a new Chairman was being considered and Gareth Davis was not involved in the process of the selection or appointment. When making decisions on new appointments, Board members consider the skills, experience and knowledge already represented on the Board and the benefits of diversity, in all its forms, including of gender, ethnicity and life experience. A similar process will be followed for the next recruitment of a Non-Executive Director to the Board.Apart from assisting with recruitment, Inzito has no other connection to the Company. Inzito has no connection with any individual Directors.One of the actions arising from the 2020 Board evaluation was to understand better the reasons for the length of time it had been taking to recruit to senior roles and how the process might be improved. A new Group HR Director joined in 2020 and an improvement of those processes is now underway.The Committee keeps under regular review succession planning at the Executive Director level and supports succession planning at senior management levels. During 2018/19 the Nomination Committee reviewed the contingency plan for unexpected departures and the Group Chief Executive’s succession plan. At our March 2021 meeting the Committee looked again at those plans (which contemplate the role being filled by either an internal or external candidate) and considered succession candidates and emergency cover candidates for each member of the General Operating Committee, including the Group Finance Director. The Group HR Director has also briefed the Committee on the talent review and calibration undertaken in relation to the Group’s top management positions that report in to members of the General Operating Committee, as well as the associated leadership development programme being held at Oxford’s Saïd Business School.
Induction, training and development programmesUpon appointment to the Board, Directors undertake an induction programme, receiving a broad range of information about the Group tailored to their previous experience. This includes information on the operational and sustainability performance and business of the Group and details of Group strategy, corporate governance and Board procedures. Alina Kessel and I have both undertaken a tailored induction programme, which included a virtual tour of the Livingston facility. Alina’s programme was tailored to this being her first role on the board of a publicly listed company, so it included an externally-run course specifically designed for those new to such roles.Assisted by the Group Company Secretary, I have responsibility for Directors’ induction programmes, and also for the Board’s training and professional development. Directors have been given training and presentations during the course of the year to keep their knowledge current and enhance their experience. This has included topics such as cyber security and developments in corporate governance generally and in particular on stakeholders’ expectations on remuneration reporting. Directors will continue to receive regular training updates from appropriate internal and external specialists on governance issues, financial and reporting standards, digital development, cyber security and sustainability. In addition, Directors are fully aware of their own responsibility for identifying and satisfying their own specific training requirements.
Time commitments Under the Code the reasons for the Board permitting its members to enter into significant new external appointments should be explained in the Annual Report. In November 2020 David Robbie was appointed as a non-executive director of easyJet plc, which the Board noted, when approving his appointment, was his third directorship in his portfolio of listed company appointments. As explained in the 2020 Annual Report, as part of the process of appointing Alina Kessel to the Board, the value of her experience of living, as well as working, in a variety of countries, along with her marketing and communication experience which is kept current in her senior role with WPP, was noted. In relation to my appointment, the Committee noted the value of my range of extensive experience, particularly internationally, while also giving careful consideration to the time commitments required by these other roles.The experience gained in all these external roles held by our Board members broadens and deepens the knowledge and experience of the Directors, which in turn benefits the Company.
74
NOMINATION COMMITTEE REPORT CONTINUED
DiversityDS Smith acknowledges the importance of diversity of thought, skills and experience to the effective functioning of the Board and the wider organisation. This diversity may arise from any number of sources, including differences in age, gender, ethnicity, disability, sexual orientation, cultural background and religious belief. Our Directors have experience of a wide range of industries and backgrounds, as well as complex organisations with a global reach.The Board diversity and inclusion policy (most recently reviewed by the Board in March 2021) is a policy which acknowledges the importance of diversity and includes an explicit requirement to take into account diversity when considering appointments to the Board. The Board recognises that some challenges in achieving diversity arise from social contexts with impacts not limited to the DS Smith Group, but the Board remains committed to ensuring that all have an equal chance of developing their careers within our business. (See pages 26 and 27 for more about our programmes to develop diverse leadership talent; from whom might be drawn a future generation of non-executive directors.)As at 1 May 2021 our eight member Board was made up of three women and five men, meeting the Hampton-Alexander Review’s target of one-third of Board members being women. We are very conscious of the Parker Review recommendation that each FTSE 100 board should have at least one director from an ethnic minority background by 2021 and are actively engaged currently in running such a recruitment process.Our most recently published UK gender pay gap report is available on our website. We know that we have a relative lack of women in senior management positions and year by year the percentage of women in the roles that are defined as senior management roles will fluctuate (see page 29 for details), but the trend in recent years has been towards a better gender balance.
Independence and re-election of DirectorsBiographical details of each Director, including their other directorships, their skills and experience, can be found on pages 62 and 63. The Nomination Committee makes an assessment each year of the criteria set out in the Code concerning independence and the Committee also reviews the time commitment of Non-Executive Directors to assess whether each has sufficient time to discharge their duties. The Committee confirms that all the Non-Executive Directors are independent and each has sufficient time to discharge their duties. The Committee also considered Geoff Drabble to be independent on his appointment to the Board.
The Nomination Committee this year considered the then current term of appointment to the Board of Louise Smalley. Board members reviewed her commitment and contribution to the Board and its Committees, as well as the balance of her skills, knowledge and experience with those of the other Directors and it was agreed that her letter of appointment should be renewed for a further year. (Directors do not participate in any debate or decision about their own re-appointment.) The expiry date of the current term of each of the Non-Executive Directors is set out on page 102. Information about this year’s evaluation of the Board and its Committees can be found on page 72.
Looking forwardAs well as the regular cycle of matters that the Committee schedules for consideration each year, we are planning over the next 12 months to:• Assess ways that the Nomination Committee could work more
effectively• Encourage the focus on diversity and inclusion at all levels
throughout the Group and understand more about the challenges and benefits of improving our reporting on diversity
• Maintain the focus on succession planning for our Executive Directors and Group Operating Committee members. Through both our organic growth and acquisitions, DS Smith has a significant pool of executive talent and the Committee continues to oversee the structure and processes in developing these executives for potential succession, including ensuring they are benchmarked against external talent.
Geoff DrabbleChairman of the Nomination Committee
21 June 2021
GOVERNANCE
Annual Report 2021 dssmith.com 75
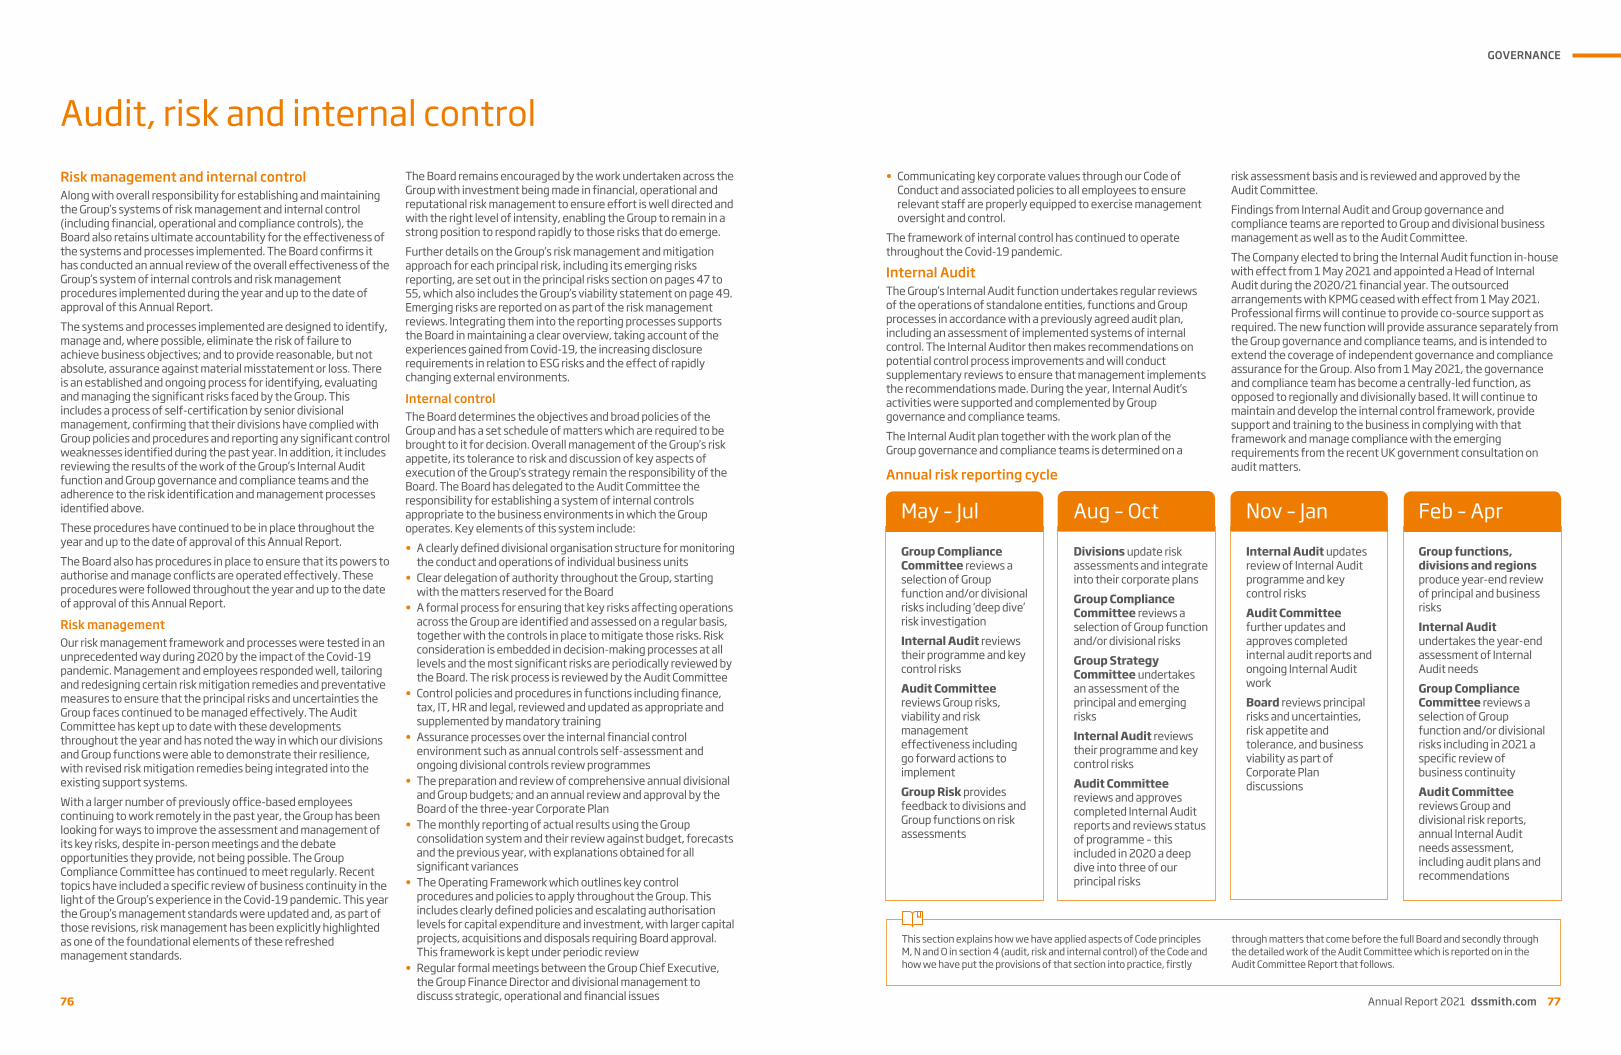
Risk management and internal controlAlong with overall responsibility for establishing and maintaining the Group’s systems of risk management and internal control (including financial, operational and compliance controls), the Board also retains ultimate accountability for the effectiveness of the systems and processes implemented. The Board confirms it has conducted an annual review of the overall effectiveness of the Group’s system of internal controls and risk management procedures implemented during the year and up to the date of approval of this Annual Report. The systems and processes implemented are designed to identify, manage and, where possible, eliminate the risk of failure to achieve business objectives; and to provide reasonable, but not absolute, assurance against material misstatement or loss. There is an established and ongoing process for identifying, evaluating and managing the significant risks faced by the Group. This includes a process of self-certification by senior divisional management, confirming that their divisions have complied with Group policies and procedures and reporting any significant control weaknesses identified during the past year. In addition, it includes reviewing the results of the work of the Group’s Internal Audit function and Group governance and compliance teams and the adherence to the risk identification and management processes identified above.These procedures have continued to be in place throughout the year and up to the date of approval of this Annual Report.The Board also has procedures in place to ensure that its powers to authorise and manage conflicts are operated effectively. These procedures were followed throughout the year and up to the date of approval of this Annual Report.
Risk managementOur risk management framework and processes were tested in an unprecedented way during 2020 by the impact of the Covid-19 pandemic. Management and employees responded well, tailoring and redesigning certain risk mitigation remedies and preventative measures to ensure that the principal risks and uncertainties the Group faces continued to be managed effectively. The Audit Committee has kept up to date with these developments throughout the year and has noted the way in which our divisions and Group functions were able to demonstrate their resilience, with revised risk mitigation remedies being integrated into the existing support systems.With a larger number of previously office-based employees continuing to work remotely in the past year, the Group has been looking for ways to improve the assessment and management of its key risks, despite in-person meetings and the debate opportunities they provide, not being possible. The Group Compliance Committee has continued to meet regularly. Recent topics have included a specific review of business continuity in the light of the Group’s experience in the Covid-19 pandemic. This year the Group’s management standards were updated and, as part of those revisions, risk management has been explicitly highlighted as one of the foundational elements of these refreshed management standards.
The Board remains encouraged by the work undertaken across the Group with investment being made in financial, operational and reputational risk management to ensure effort is well directed and with the right level of intensity, enabling the Group to remain in a strong position to respond rapidly to those risks that do emerge. Further details on the Group’s risk management and mitigation approach for each principal risk, including its emerging risks reporting, are set out in the principal risks section on pages 47 to 55, which also includes the Group’s viability statement on page 49. Emerging risks are reported on as part of the risk management reviews. Integrating them into the reporting processes supports the Board in maintaining a clear overview, taking account of the experiences gained from Covid-19, the increasing disclosure requirements in relation to ESG risks and the effect of rapidly changing external environments.
Internal controlThe Board determines the objectives and broad policies of the Group and has a set schedule of matters which are required to be brought to it for decision. Overall management of the Group’s risk appetite, its tolerance to risk and discussion of key aspects of execution of the Group’s strategy remain the responsibility of the Board. The Board has delegated to the Audit Committee the responsibility for establishing a system of internal controls appropriate to the business environments in which the Group operates. Key elements of this system include: • A clearly defined divisional organisation structure for monitoring
the conduct and operations of individual business units• Clear delegation of authority throughout the Group, starting
with the matters reserved for the Board• A formal process for ensuring that key risks affecting operations
across the Group are identified and assessed on a regular basis, together with the controls in place to mitigate those risks. Risk consideration is embedded in decision-making processes at all levels and the most significant risks are periodically reviewed by the Board. The risk process is reviewed by the Audit Committee
• Control policies and procedures in functions including finance, tax, IT, HR and legal, reviewed and updated as appropriate and supplemented by mandatory training
• Assurance processes over the internal financial control environment such as annual controls self-assessment and ongoing divisional controls review programmes
• The preparation and review of comprehensive annual divisional and Group budgets; and an annual review and approval by the Board of the three-year Corporate Plan
• The monthly reporting of actual results using the Group consolidation system and their review against budget, forecasts and the previous year, with explanations obtained for all significant variances
• The Operating Framework which outlines key control procedures and policies to apply throughout the Group. This includes clearly defined policies and escalating authorisation levels for capital expenditure and investment, with larger capital projects, acquisitions and disposals requiring Board approval. This framework is kept under periodic review
• Regular formal meetings between the Group Chief Executive, the Group Finance Director and divisional management to discuss strategic, operational and financial issues76
Audit, risk and internal control
This section explains how we have applied aspects of Code principles M, N and O in section 4 (audit, risk and internal control) of the Code and how we have put the provisions of that section into practice, firstly
through matters that come before the full Board and secondly through the detailed work of the Audit Committee which is reported on in the Audit Committee Report that follows.
• Communicating key corporate values through our Code of Conduct and associated policies to all employees to ensure relevant staff are properly equipped to exercise management oversight and control.
The framework of internal control has continued to operate throughout the Covid-19 pandemic.
Internal AuditThe Group’s Internal Audit function undertakes regular reviews of the operations of standalone entities, functions and Group processes in accordance with a previously agreed audit plan, including an assessment of implemented systems of internal control. The Internal Auditor then makes recommendations on potential control process improvements and will conduct supplementary reviews to ensure that management implements the recommendations made. During the year, Internal Audit’s activities were supported and complemented by Group governance and compliance teams. The Internal Audit plan together with the work plan of the Group governance and compliance teams is determined on a
risk assessment basis and is reviewed and approved by the Audit Committee. Findings from Internal Audit and Group governance and compliance teams are reported to Group and divisional business management as well as to the Audit Committee. The Company elected to bring the Internal Audit function in-house with effect from 1 May 2021 and appointed a Head of Internal Audit during the 2020/21 financial year. The outsourced arrangements with KPMG ceased with effect from 1 May 2021. Professional firms will continue to provide co-source support as required. The new function will provide assurance separately from the Group governance and compliance teams, and is intended to extend the coverage of independent governance and compliance assurance for the Group. Also from 1 May 2021, the governance and compliance team has become a centrally-led function, as opposed to regionally and divisionally based. It will continue to maintain and develop the internal control framework, provide support and training to the business in complying with that framework and manage compliance with the emerging requirements from the recent UK government consultation on audit matters. Annual risk reporting cycle
May – Jul
Group Compliance Committee reviews a selection of Group function and/or divisional risks including ‘deep dive’ risk investigationInternal Audit reviews their programme and key control risksAudit Committee reviews Group risks, viability and risk management effectiveness including go forward actions to implementGroup Risk provides feedback to divisions and Group functions on risk assessments
Aug – Oct
Divisions update risk assessments and integrate into their corporate plansGroup Compliance Committee reviews a selection of Group function and/or divisional risksGroup Strategy Committee undertakes an assessment of the principal and emerging risksInternal Audit reviews their programme and key control risksAudit Committee reviews and approves completed Internal Audit reports and reviews status of programme – this included in 2020 a deep dive into three of our principal risks
Nov – Jan
Internal Audit updates review of Internal Audit programme and key control risksAudit Committee further updates and approves completed internal audit reports and ongoing Internal Audit workBoard reviews principal risks and uncertainties, risk appetite and tolerance, and business viability as part of Corporate Plan discussions
Feb – Apr
Group functions, divisions and regions produce year-end review of principal and business risksInternal Audit undertakes the year-end assessment of Internal Audit needsGroup Compliance Committee reviews a selection of Group function and/or divisional risks including in 2021 a specific review of business continuity Audit Committee reviews Group and divisional risk reports, annual Internal Audit needs assessment, including audit plans and recommendations
GOVERNANCE
Annual Report 2021 dssmith.com 77

Dear shareholdersThe Audit Committee supports the Board in its oversight of the control framework across the Group. Our principal objectives as an Audit Committee are:• To monitor the integrity of the Group’s reporting process and
adherence to the Group’s accounting policies and procedures• To ensure that risks are carefully identified and assessed; and
that sound systems of risk management and internal control are implemented.
I am pleased to report that the Group’s established procedures and systems to identify, mitigate and manage risks enabled the financial reporting process to continue uninterrupted during the year, despite the many challenges presented by the Covid-19 pandemic. The finance team delivered an impressive volume of work in difficult times and I would like to thank them for their sustained commitment.
Our roleThe Audit Committee’s role is pivotal in ensuring the robustness of the Group’s risk management activities and internal control environment, thereby ensuring the integrity of the financial reporting process. As Chairman of the Audit Committee I make myself available at the Company’s annual general meeting (AGM) to answer any shareholder questions on the Committee’s remit.
Membership and operation of the CommitteeMember Since
David Robbie (Chairman) 2019Celia Baxter 2019Alina Kessel 2020Louise Smalley 2014Rupert Soames 2019
The Audit Committee met on four occasions during the year, with meetings scheduled to align with the Group’s external financial reporting obligations. Details of individual Directors’ attendance can be found on page 70. As and when required, the Audit Committee members and I were joined by the Group Chief Executive, the Group Finance Director, the Group Financial Controller and representatives from the external Auditor and Internal Audit for parts of these meetings, by invitation. The external Auditor was not present at meetings where their performance and/or remuneration was discussed. The Audit Committee also met privately with the external Auditor as appropriate.The Group General Counsel and Company Secretary acts as Secretary to the Committee.The Board is satisfied that I, as Chairman of the Committee, and the other members of the Audit Committee have both current and relevant financial experience (as set out on pages 62 and 63) and that the Audit Committee, as a whole, has competence relevant to the sector (namely manufacturing) in which the Company operates. In addition to the scheduled Committee meetings, I, as Chairman of the Audit Committee, held separate individual meetings during the year with representatives from Internal Audit, the Group Finance Director and his team and the external Auditor.The Audit Committee received sufficient, reliable and timely information from management to enable it to fulfil its responsibilities.
“The Group’s established procedures enabled the financial reporting process to continue efficiently during the year, despite the many challenges presented by the Covid-19 pandemic.”David Robbie, Chairman of Audit Committee
Audit Committee Report
78
Matters particularly focused on by the Audit Committee in its discussions with management include:
Risk management, internal control and compliance enhancements
Quality of earnings
Financial commitments and liabilities
Update on M&A-related activity
Pensions
Taxation matters, including review of strategy and risks
Internal Audit status update, in-house governance compliance and corporate governance update
June 2020• Review of the 2019/20 Annual Report and announcement, including a review to
ensure the report was fair, balanced and understandable• Going concern and viability statement, including Covid-19 impact assessment• Impairment assessment review• Effectiveness of internal control framework update• Review of adjusting items • Review of risk appetite and tolerance statement• 2020/21 Internal Audit plan• External Auditor report• Review of external Auditor effectiveness paper and recommendation to the Board
to re-appoint Deloitte for 2020/21• Cyber review
October 2020• Further rigorous review of adjusting items • Non-financial areas to be targeted by Internal Audit plan• Impairment assessment review• 2020/21 external Auditor plan• 2020/21 Internal Audit plan and confirmation of KPMG LLP’s independence• Ethics and compliance report review • Corporate governance training (provided by Deloitte)
December 2020• Update on half year forecast results• Going concern • Review of announcement of half year results• External Auditor half year report, including confirmation of independence and
objectivity• Internal Audit review (joint with recently appointed Head of Internal Audit and
KPMG LLP)• Non-audit fees review
April 2021• Update on full year forecast results and trading outlook• Interim going concern assessment and consideration of significant accounting
policies and judgements• Annual impairment review• Effectiveness of internal controls review• Ethics and compliance report review• Update on external Auditor plan and fees (including for non-audit services)• Review of emerging risks and risk update• Review of Internal Audit Plan
June 2021• Review of the 2020/21 Annual Report and announcement, including a review to
ensure the report was fair, balanced and understandable • Going concern and viability statement• Impairment assessment review • Effectiveness of internal control framework update• Review of adjusting items • Review of risk appetite and tolerance statement • 2021/22 Internal Audit plan • External Auditor report• Review of external Auditor effectiveness paper and recommendation to the Board
to re-appoint Deloitte for 2021/22• Review of the audit tender process and agreement of recommendation to the Board
GOVERNANCE
Annual Report 2021 dssmith.com 79

Risk management, internal control and Internal AuditIn fulfilling the Committee’s oversight of the risk management and control environment, a number of key activities are undertaken during the year, including regular meetings with senior management.The Audit Committee considered the Group’s risk management activities during the year (with specific discussions of such topics as paper price volatility, regulation and governance, packaging product development risks, business continuity and emerging risk developments). The Audit Committee continued its regular review of risk reporting to ensure that the balance between risk and opportunity was in keeping with the Group’s risk appetite and tolerance. The Audit Committee is satisfied that the Group’s executive compensation arrangements do not prejudice robust controls and good stewardship.The Committee approved the Group’s annual Internal Audit plan, which was primarily risk-based, focusing on the assurance of core processes and projects, as well as overseeing internal compliance activities. During the year, the Committee received regular reports summarising findings from the Internal Audit reviews performed, action plans to address any areas highlighted for improvement and additional activity review summaries from internal compliance teams. An ongoing review of the effectiveness of the Internal Audit function is performed by the Committee, focusing on the content and delivery of the regularly-received reviews, action plans and activity summaries. This, along with the annual review and evaluation of the performance of the Internal Audit function, enabled the Committee to remain satisfied that the quality, experience and expertise of the function is appropriate for the business. Owing to the strong capabilities of our governance and compliance team, which have developed with the support of the KPMG LLP-led Internal Audit function, the Company has elected to return to an in-house Internal Audit model from 1 May 2021 to provide independent assurance. We would like to thank KPMG LLP for their service and insightful reviews provided during a period of significant growth and change for the Group.The expanded internal control framework developed during the 2019/20 financial year has been rolled out as intended, complemented with comprehensive training.
A key element of the Committee’s oversight role is to challenge management and test the validity of any critical assumptions, never more so than in times of uncertainty. In 2020/21, building on its work in 2019/20, the Committee has again focused on debating cyber risks generally, including those present in operational technology. In light of Covid-19 and in common with other businesses, the imperative of encouraging an even wider range of scenarios than usual to be developed to enhance the supporting evidence in relation to the viability statement and going concern basis of accounting in the 2020 Annual Report was recognised and acted upon. Other discussions have probed the implications of the number of employees working from home, or other unaccustomed locations, due to Covid-19; the degree to which a strength, if over developed, could become a weakness; and the level of engagement at all levels of the Group with the risk management processes.
Confidential reportingThe Committee receives a separate report on matters raised through ‘Speak Up!’, the Group’s confidential reporting channel, and any related investigations. The Code specifies that reports arising from such confidential reporting channels should either be reviewed by the Board or an explanation given. All Board members attend that part of the Audit Committee meeting when ‘Speak Up!’ and any related investigations are reported on. This means that representatives from both Internal Audit and the external Auditor (who attend the Audit Committee meetings but not Board meetings) can contribute their perspectives, which is a valuable part of the review process. Internal Audit are also able to provide specialist support where such assurance is considered necessary. Following consultation with the EWC, in March 2021 the Board reviewed and approved a revised ’Speak Up!’ policy, updated to reflect recent legislative developments. Board members during that review debated the tensions inherent in having a comprehensive policy that by its length might be less accessible than the highly visual and simplified posters that have recently been refreshed.
80
AUDIT COMMITTEE REPORT CONTINUED
Financial reportingThe Code requires the Board to confirm that the Annual Report presents a fair, balanced and understandable assessment of the Group’s performance, business model and strategy. This is an important area of focus for the Committee. At the request of the Board, the Committee undertook procedures to advise the Board on this. Committee members gave input at various stages during the planning and drafting process, as well as taking the opportunity to review the Annual Report as a whole and discuss, prior to the June Audit Committee meetings, any areas requiring additional clarity or better balance in the messaging.
Significant matters considered in relation to the financial statementsIssue Review and conclusionClassifications and presentation of adjusting items
The Committee considered the application of the Group’s accounting policies, principles and disclosures in the financial statements that relate to critical accounting estimates and judgements, and challenged the underlying assumptions applied in areas including provisions (such as litigation and restructuring) and adjusting items .Continued scrutiny over the appropriateness and application of the adjusting items policy was applied during the year, in particular around the continued costs incurred to deliver programmes to optimise the operational footprint. Such items include acquisition costs, integration costs, impairments and gains or losses on business disposals, which are classified as adjusting items because of their nature, incidence or size. The Directors have considered the ongoing regulator focus on Alternative Performance Measures but believe that identification and separate classification of these items assists in enhancing the understanding of the trading and financial results of the Group.The Audit Committee has reviewed the appropriateness of the income and costs both included in and excluded from adjusting items by challenging and seeking explanations from management. The Committee reviewed reports on the items provided by management and the external Auditor. This item is a recurring agenda item in all Audit Committee meetings.The Audit Committee is satisfied that the resulting presentation and disclosure of all accounting policies and principles is appropriate.
Taxation Taxation remains a key area of focus for the Committee, due to the continued level of fiscal authority activity, ongoing tax enquiries and disputes, and the Group’s M&A activity. The Group is exposed to differing tax regimes and risks which affect both the carrying values of tax balances (including deferred tax) and the resultant income statement charges. The Audit Committee reviewed the tax charge for the half year and the full year, including the underlying tax charge, the appropriateness of and movement in tax provisions recognised and the risks associated with them. The Audit Committee is satisfied that the amounts recognised and the disclosure provided are appropriate.
GOVERNANCE
Annual Report 2021 dssmith.com 81

Other activities of the CommitteeFinancial Reporting Council (FRC) correspondence In November 2020, the FRC issued their annual advice letter to Audit Committee Chairs and Finance Directors in advance of the 2020/21 reporting period. Not surprisingly, the presentation of financial information in a Covid-19 environment was a key item in this year’s letter. Guidance provided by the FRC subsequent to the preparation of the 2019/20 Annual Report was reviewed against the disclosures made in the prior year’s Annual Report and considered in the preparation of the current year’s Annual Report. Other matters raised by the FRC included the impact of Brexit on company-specific risks and uncertainties and the section 172 statement and reporting. All matters raised have been reviewed and appropriate disclosure updates reflected, where required.
Continued developmentIn order to help the Committee continue to meet its responsibilities, Committee meetings include regular corporate governance updates and briefings from external advisers, such as cyber specialists, or from members of senior management. At its briefing session in October 2020, the Committee considered what might be the next steps taken in response to the recommendations in the Brydon Review, the CMA report and the Kingman Review and in April 2021 the Committee was briefed on the UK government’s March 2021 consultation paper calling for feedback on a number of questions in these areas. The Committee reviewed its effectiveness as part of the wider Board’s review of its effectiveness, as described on page 72.
External AuditorEffectivenessIn addition to the external Auditor confirming their independence, and objectivity, the Audit Committee also evaluates and monitors their effectiveness through a review of the qualifications, expertise and resources of the engagement team. This is conducted through direct assessment and recurring activities. As part of the current assessment of effectiveness, the Audit Committee has taken into consideration the guidance issued by the FRC. Based on evidence from management, the external Auditor and, as appropriate, external sources together with its own experience, the Audit Committee assessed the mindset and culture, skills, character and knowledge, quality control and judgement of the Auditor. The assessment considered the degree of challenge to management, the issues identified and the quality of explanations. The Audit Committee recognises that the quality of an audit is paramount. Particular note was taken of the current year audit work, considered against the backdrop of the Covid-19 pandemic, which has presented practical process challenges and required enhanced audit requirements. The Committee is satisfied with the effectiveness of the Auditor and that the current year audit was one of high quality. The quality of the audit is also assessed by the Committee, informed by discussion of each post-audit review.Separate to the meetings of the Audit Committee, I meet regularly with the lead external Audit engagement partner, as do other individual members of the Committee.In December 2019, an update to the May 2015 Audit Committee Practice Aid on Audit Quality was published by the FRC. The update contained significant changes in respect of the external audit tendering process as well as refined guidance on the assessment of auditor effectiveness. Our approach to auditor effectiveness complies with this guidance.
Our key responsibilitiesAs a Committee we have delegated authority from the Board to focus on the following key responsibilities: • Ensuring the integrity of financial reporting and associated
external announcements• Reviewing and challenging the application of the accounting
policies and principles reflected in the Group’s financial statements
• Assessing the basis on which the viability statement and going concern statement are being made and testing assumptions underlying them
• Managing the appointment, independence, effectiveness and remuneration of the Group’s external Auditor, including the policy on the supply of non-audit services
• Initiating and conducting the audit tender process for the external audit
• Monitoring the adequacy and effectiveness of the internal control environment
• Challenging the plans and effectiveness of the Internal Audit function, performed on the Group’s behalf during the year by KPMG LLP, and going forward by the in-house Internal Audit function, which is independent from the Group’s external Auditor
• Overseeing the Group’s risk management processes and performance
• Reviewing the effectiveness of established fraud prevention arrangements and reports made through the confidential ‘Speak Up!’ policy process
• Assessing the Group’s compliance with the 2018 UK Corporate Governance Code (Code)
• Providing advice to the Board on whether the Annual Report and financial statements, when taken as a whole, are fair, balanced and understandable and provide all the necessary information for shareholders to assess the Group’s performance, business model and strategy.
82
AUDIT COMMITTEE REPORT CONTINUED
Independence and objectivityIn order to ensure the independence and objectivity of the external Auditor, the Audit Committee maintains and regularly reviews the Auditor Independence policy which covers non-audit services which may be provided by the external Auditor, and permitted fees.The Group has a policy on the supply of non-audit services by the external Auditor, which was most recently updated in April 2020. The policy prohibits certain categories of work in accordance with guidance such as the FRC Ethical Standard. It specifies that the Group should not employ the external Auditor to provide non-audit services where either the nature of the work or the extent of such services might impair their independence or objectivity. The external Auditor is permitted to undertake some non-audit services under the Group’s policy, providing it has the skill, competence, integrity and appropriate independence safeguards in place to carry out the work in the best interests of the Group, for example, permissible reporting accountant work associated with significant acquisitions. All proposed permitted non-audit services are subject to the prior approval of the Audit Committee.Non-audit services and fees are reported to the Audit Committee twice each year. During 2020/21, total non-audit fees paid to the external Auditor of £0.4 million were 9 per cent of the annual Group audit fee (2019/20: £0.3 million: 8 per cent): see note 3 to the consolidated financial statements. In addition, £9.4 million was paid to other accounting firms for non-audit work, including £0.7 million for work relating to Internal Audit. The EU Audit Regulation (Retained Legislation) and the FRC’s revised Ethical Standard mean that, with effect from the Group’s 2020/21 year, a cap on the ratio of non-audit fees to audit fees paid to the external Auditor of 70 per cent applies, which will further restrict the non-audit services permitted.Annually, the Audit Committee receives written confirmation from the external Auditor of the following: • Whether they have identified any relationships that might have
a bearing on their independence• Whether they consider themselves independent within the
meaning of the UK regulatory and professional requirements • The continued suitability of their quality control processes and
ethical standards. The external Auditor also confirmed that no non-audit services prohibited by the FRC’s Revised Ethical Standard were provided to the Group or parent Company. On the basis of the Committee’s own review, approval requirements in the non-audit services policy, and the external Auditor’s confirmations, the Audit Committee is satisfied with the external Auditor’s independence and effectiveness.
Auditor’s fee, appointment and tender processExternal audit fee negotiations are approved by the Audit Committee each year. There are no contractual restrictions on the Group in regard to the current external Auditor’s appointment.Deloitte LLP were first appointed as external Auditor to the Group in 2006. Nicola Mitchell became the lead audit partner for the
2018/19 year end, with her five year rotation to end with the 2022/23 audit.Pursuant to the terms of the Statutory Audit Services for Large Companies Market Investigation (Mandatory Use of Competitive Tender Process and Audit Committee Responsibilities) Order 2014 (Competition & Markets Authority Order), which is now in force, the Audit Committee is solely responsible for negotiating and agreeing the external Auditor’s fee, the scope of the statutory audit and initiating and supervising any competitive tender process for the external audit. When a tender is undertaken, the Committee is responsible for making recommendations to the Board as to the external Auditor’s appointment. The Committee’s policy is that the role of external Auditor will be put out to tender at least every ten years in line with the applicable rules. Deloitte has been the external Auditor following the tender process in 2013/14. Mindful of the constraints within the audit market, the Committee decided to put the external audit out to tender a year earlier than the ten-year limit would require. The tender process was conducted in accordance with the applicable legal requirements and followed the relevant FRC guidance. At its June 2021 meeting the Committee recommended to the Board that Ernst & Young LLP be appointed external Auditor with effect from the 2022/23 audit.The Audit Committee confirms that the Company has complied with the provisions of the Competition & Markets Authority Order with regards to external audit tendering and audit responsibilities throughout its financial year ended 30 April 2021.
Looking forward As well as the regular cycle of matters that the Committee schedules for consideration each year, we are planning over the next 12 months to:• Expand the range of Internal Audit’s reviews in the coming
year to include Group processes and functional assurances such as looking at the safeguards around anti-bribery and corruption policies and the effective operation of the ‘Speak Up!’ protocols while maintaining the rigour of internal financial control assurance
• Look in greater detail at emerging risks for the Group• Continue to monitor legislative and regulatory changes that may
impact the work of the Committee, particularly the outcome of the UK government’s consultation paper on restoring trust in audit and corporate governance which develops many of the recommendations in the earlier Brydon Review, the CMA report and the Kingman Review
• Monitor adjusting items and policy.David RobbieChairman of Audit Committee
21 June 2021
GOVERNANCE
Annual Report 2021 dssmith.com 83

Dear shareholdersIntroductionOn behalf of the Board, I am pleased to present the Directors’ Remuneration Report for the year ended 30 April 2021, which sets out our implementation of the remuneration policy that was approved by shareholders at the Annual General Meeting (AGM) in September 2020. As usual, my letter on pages 84 to 86, the summary on pages 87 and 88 and the Annual Report on Remuneration on pages 94 to 107 will also be presented for approval by an advisory vote at our AGM in September 2021.Our purpose as a Remuneration Committee is to develop a reward package that supports our vision and strategy as a Group and to ensure the rewards are performance-based and encourage long-term shareholder value creation. In the past 12 months many things have changed in the world around us, but the Group’s strategic focus continues to be on being a leader in sustainable fibre-based packaging, with a corporate Purpose of ‘Redefining Packaging for a Changing World’. All regions in which the Group operates were affected by the Covid-19 pandemic, but all our sites remained operational as essential suppliers to critical supply chains. We continued to deliver to our customers, to develop new and improved ways of meeting their needs (for example our new web-based business, ePack) and to develop innovative sustainable solutions. All these factors drive the Group’s ongoing profitability and cash flow, which are the current performance measures for our incentive plans.
Our achievements and variable pay outcomeThe full financial year of 2020/21 has been impacted by Covid-19 and this has been a year unlike any other in our lifetimes, but in these uncertain times we have worked in tandem with governments to ensure that our factories could remain open and continue to keep goods moving, including vital supplies like medicines and food. Putting the safety and wellbeing of our
workforce as our first priority has enabled us to support our customers and their supply chains and we are proud of what our employees have delivered for our customers in these difficult times.You can read about the achievements of our business during 2020/21 in more detail in the Strategic Report starting on page 1. Highlights for the 2020/21 financial year include:• Return on sales of 8.4%• Adjusted operating profit of £502 million• 14% reduction in accident frequency rate• MSCI Index rating has increased from A to AA.In respect of the variable pay elements linked to the 2020/21 financial year, the Committee has decided that the Executive Directors will receive 98% of the maximum annual bonus opportunity. Further details are set out below and on pages 96 and 97.Unfortunately, the performance share plan (PSP) award made in 2018 which was due to vest in June 2021 based on the three year average earnings per share (EPS) and return on average capital employed (ROACE) performance between 2018/19 and 2020/21 and the three year cumulative relative total shareholder return (TSR) performance, did not meet the threshold targets for the two financial measures and fell below median for the relative TSR measure. The financial targets were set in 2018 in the context of the expectation of a stable economy and were not adjusted, but the negative impact of the pandemic on the 2020/21 results made those targets unachievable.With many of DS Smith’s markets in lockdown at the beginning of the year, and consequently very weak trading and an uncertain outlook, 2020/21 presented the Committee with significant challenges in setting realistic but stretching targets for the annual bonus incentive. The targets the Committee chose demanded a significant improvement in profitability month by month as the year progressed and were aligned to the sell-side consensus at the time; they ultimately proved successful in incentivising an impressive recovery from the very weak trading seen in the first
“As a Committee, we take our decisions in the context of the Group’s achievements and the wider stakeholder experience.”Celia Baxter, Chairman of Remuneration Committee
Remuneration Committee Report
84
months of the year. The targets were not amended by the Committee.The bonus award as a percentage of maximum will apply to around 1,500 employees who participate in the Group bonus plan and the vesting percentage of 0% under the 2018 PSP will apply to the top 150 senior managers who participate in the Group’s long term incentive plan. When deciding the level of these variable pay elements, the Committee considered the experience of the Group’s stakeholders during the 2020/21 financial year. In respect of the 2020/21 financial year, an interim dividend has been paid and a final dividend has been recommended, subject to the approval of shareholders at the forthcoming AGM. The share price on 30 April 2021 was £4.21, up from a low of £2.53 earlier in 2020. Employment levels Group-wide have been maintained, with a strong focus on employee health and wellbeing, exemplified by a Group-wide extra day of holiday offered in 2021. Any UK Government furlough support taken in the initial stages of the pandemic, when the situation was very uncertain, has been repaid. The Group’s connection with the local communities where our sites are based has become much stronger in the past year through increased engagement in community programmes. (Some examples of this are described on page 32). Our commitment to carbon reduction has continued, with a 23% relative to production decrease from 2015 levels. Most importantly for our customers, and for their customers, putting in place new policies and practices to allow production to continue, has enabled volume growth and supported responsiveness to react to changes in customers’ needs. The proportion of orders that are delivered on time, in full across our businesses has, despite the circumstances of the past 12 months, remained at 95 per cent, as it has been for the previous two years. The Committee also noted that there were some negative impacts of the pandemic in the last quarter of 2019/20 and this had resulted in no bonus award being payable under the 2019/20 plan. The Committee concluded that the variable pay outcome (both of the annual bonus and PSP) in respect of 2020/21 appropriately reflected the Company’s performance in the period and was commensurate with the broader stakeholder experience in the period. It was therefore not felt necessary to apply any discretion to amend the outcome. The Committee also concluded that the remuneration policy has operated as intended, both in terms of appropriately incentivising corporate performance and in respect of quantum.
Our year under reviewThe key discussions and decisions taken since 1 May 2020 were:• Finalising the proposed remuneration policy for 2020-2023 that
was approved at the 2020 AGM• Considering the impact of Covid-19 on the business when
deciding on the appropriate approach for bonus and PSP: for determining vesting levels and the grant size, selecting performance measures and targets, making sure that such decisions take into account the new economic context with reference to the wider workforce and the expectations of other stakeholders, such as our investors, suppliers and customers, but at the same time balancing the business need for meaningful incentivisation for management and recognition for leading through unusually challenging and turbulent times
• Reviewing the salaries of the Group Chief Executive and Group Finance Director and the next layer of management. Agreeing that for them (unlike the majority of the workforce) pay increases in August 2020 would be postponed until the economic situation was more certain. Deciding, having gained the necessary clarifications and in line with the approach taken for others within the workforce affected by the pay review postponement, an interim pay review would be implemented
with effect from 1 January 2021. Reviewing these salaries as usual in April 2021 and deciding that a pay increase in line with the average increase provided to the workforce as a whole would be implemented on 1 August 2021
• Reviewing the market rates for comparable positions when setting the fee for the Chairman with effect from 3 January 2021
• Bringing forward the further review of the alignment of the Executive Directors’ pension contributions with the workforce and making a commitment for the incumbent Executive Directors’ pension contributions to be aligned with that available to the workforce in the UK (being the country where they are based for employment purposes). The Group Chief Executive’s pension contribution reduced by 10% in 2020 and will reduce by a further 5% on 1 August 2021 to 15% of annual salary. The Group Finance Director’s pension contribution was reduced by 5% in 2020 and will reduce by a further 5% on 1 August 2021 to 10% of annual salary. Due to the amount of the pension contribution reduction required to align with that available to the workforce in the UK, currently 6%, the Committee agreed that full alignment with the UK workforce rate would be achieved by 1 August 2024
• Setting the targets for the annual bonus and PSP awards made in 2020/21 and the performance measures and weighting for the 2021/22 awards. For recipients of PSP awards below Executive Director level it was agreed that part of the award made in 2020 would, with an appropriate discount applied, be made in restricted stock with no performance conditions. This decision was taken at a time of uncertainty in July 2020 when the impact of the pandemic was unclear, but the need for meaningful incentivisation and retention was clear
• Agreeing to make a retention and recognition award in 2020 under the Deferred Share Bonus Plan (DSBP) to over 1,500 employees below Executive Director level whose annual bonus is determined by reference to the Group bonus plan
• Reviewing the Group Finance Director’s PSP award level and deciding to increase it from 175% to 200% of salary and commensurately increasing the shareholding requirement for from 175% to 200% of salary. This was done taking into account his experience and advancement in the role and the market position, ensuring that the resulting total remuneration package remained no higher than mid-market for the Group Finance Director role in companies in the FTSE51 to 150 (excluding Financial Services companies); while noting that the opportunity will only be realised if the corporate targets are met and five years after the awards have been granted
• Assessing the costs and benefits of operating Group-wide employee Sharesave plans and deciding to continue to operate them in countries where there are larger employee populations and no constraining legal or taxation restrictions
• As part of developing the Committee’s understanding of the remuneration-related policies that apply to the wider Group’s workforce, we have held a series of briefing sessions to further enhance our knowledge of the broader approach to reward being taken across the Group, building on the programme that started in 2018/19. During the year we completed the initial 18 month programme of briefing sessions, to provide information on the type of benefits available across the Group including retirement benefits, healthcare, life insurance, disability cover and employee assistance programmes, including, as appropriate, the level of State support. (Separate updates were given to those Non-Executive Directors who had recently joined the Committee and missed parts of the programme.) Going
GOVERNANCE
Annual Report 2021 dssmith.com 85

forward the Committee will be updated on any major policy changes for the workforce or new approaches to remuneration.
Our conversation with our workforceThe diagram on page 89 sets out the approach the Group is taking to collate ideas and hear any concerns from the workforce around reward. One of the consequences of Covid-19 has been an enforced delay on our planned expansion of this programme of engagement at site level. While there are many things that can be done through the medium of electronic meetings, focus sessions at site level are most valuable and insightful when held in person. The UK Corporate Governance Code asks the Board to ensure effective engagement with, and encourage participation from, its shareholders and stakeholders. As a Board we decided that the complexities of consulting and engaging with around 29,000 people at more than 350 sites and offices, in more than 30 countries are such that engagement with the workforce was not a role for just one person (such as a designated non-executive director). The Board has used as its starting point for this important work the European Works Council (EWC), a formal workforce advisory panel. It has chosen to build on that existing structure as it is already a well-established forum for engagement on a range of matters relating to the workforce. The Board considers it appropriate to use this body, initially, as a communication channel with the workforce to hear the ‘employee voice’ in the boardroom.An EWC representative joined a Committee meeting this year to support and inform discussions about Sharesave (our employee share plan). Prior to that meeting we worked closely with the EWC representative to design a questionnaire to send out to all employees across the Group to find out:• What people thought about Sharesave • What their motivations for joining the plan were • What the main reasons holding people back from joining the
plan were. The EWC representative then attended the Committee meeting to present the feedback received from around 4,000 employees (drawn from across a broad representation of the whole employee population). He also provided his own insight on what improvements could be made to continue to increase participation levels. Overall, the satisfaction for those participating in Sharesave was extremely high. Accordingly, the ongoing focus will be on ensuring that those employees who choose not to participate are making a fully informed choice and understand the benefits provided by Sharesave that they are foregoing. In addition, I once again attended a meeting of the EWC Executive to engage with them and give an updated presentation about how executive remuneration policy is set and take questions from them about the way in which the Committee operates. In our meeting in March 2021 we covered the changes made to the remuneration policy which had been approved by shareholders at the 2020 AGM and discussed some of the considerations the Committee has to take into account in making its decisions about executive remuneration in the new Covid-19 environment. The focus of the meeting was to engage with the EWC representatives to explain how executive remuneration aligns with wider Group pay policy, but the representatives were also keen to share their views on aspects of the remuneration of the wider workforce, such as the level of discount offered when setting the Sharesave option price and the scope for an increase in the pension contribution rates offered to the workforce. These meetings are now a regular feature of the routine timetable as the EWC Executive value the opportunity they provide and find them useful to understand more
about matters relating to the Executive Directors’ remuneration and its alignment with that of the wider workforce. Any other reward-related feedback from any sources, whether that is from pulse engagement surveys, Town Hall meetings, management site visits or social media is fed back to the Remuneration Committee.The Committee decided to take this more structured approach to consulting with the workforce on executive pay, as we felt that it would be a more effective way to open and develop the dialogue about remuneration matters. The Committee will consider further steps to consult more widely, taking into consideration the complexities of achieving this when travel is likely to remain restricted for a period in the pandemic-aware world.
Looking forwardAs well as the regular annual cycle of matters that the Committee schedules for consideration, we are planning over the next 12 months to: • Develop further the programme of topics discussed with the
EWC representative• Work with the EWC Executive to support them in keeping the
wider workforce appropriately informed and listening to their feedback on executive remuneration matters
• Keep abreast of the continuing changes in regulation and best practice with regard to remuneration policy and practice and carefully consider the applicability of any such trends to our business.
Due to the current uncertain times, the difficulties of predicting customer demand and the economic conditions, target setting for incentive plans continues to be challenging. The Committee recognises that it may need to exercise discretion on any vesting of the respective plans in forthcoming years.As a Committee we are mindful that some shareholders are encouraging companies to introduce non-financial performance measures, particularly ESG (environmental, social and governance) measures. To lead the way in sustainability is a key pillar of our corporate strategy and success in the delivery of that strategy feeds directly into the financial KPIs used in our short and long-term incentive plans. To reinforce the importance and commitment to this, the 2021/22 annual bonus plan will include an ESG underpin (see page 97 for more details). Looking further ahead, although we have the flexibility in our remuneration policy to introduce such ESG metrics into the primary performance measures, the Committee is conscious that this would need careful consideration. The current incentive measures are considered to be clear, challenging, consistent and well understood. The Committee will however continue to consider and review this matter as practice matures. More details about our approach to sustainability are set out on pages 30 to 33 of the Annual Report, as well as in our latest Sustainability Report.
Our conversation with our shareholdersShareholder views, whether directly or indirectly expressed, together with relevant guidance and emerging trends, are carefully considered when reviewing reward design and outcomes. At the AGM in September 2021, shareholders will be asked to vote on the Remuneration Report. I hope that the Committee will have your support. As Committee Chairman, I continue to be available to engage with shareholders, as they so wish, on remuneration matters.Celia BaxterChairman of Remuneration Committee
21 June 2021 86
REMUNERATION COMMITTEE REPORT CONTINUED
Remuneration at a glance
Miles Roberts
Adrian Marsh
£984 £1,541
£593 £726
Fixed pay(salary/benefits/pension)
Annual bonus
£2,525
£1,319
Single total figure of remuneration for 2020/21 (£'000s) (Audited)
Total £’000 Increase (decrease)
2020/21 2019/20 Miles Roberts 2,525 1,422 78%Adrian Marsh 1,319 796 66%
For more information on how this is calculated see page 94.
2020/21 performance related outcomes Vesting as a % of maximum
2020/21 annual bonus
2018/19 PSP vesting in 2021/22
Miles Roberts 98% 0%Adrian Marsh 98% 0%
Salary and shareholdingsSalary increases with effect from 1 August 2021 are set out on page 95.The percentage of salary each Executive Director holds in shares is set out on page 101.
Pension The contribution rates for incumbent Executive Directors are being reduced. Miles Roberts receives an annual pension allowance which was reduced from 30% of base salary to 20% with effect from 1 August 2020 and will be reduced again to 15% with effect from 1 August 2021. Adrian Marsh receives an annual pension allowance which was reduced from 20% of base salary to 15% with effect from 1 August 2020 and will be reduced again to 10% with effect from 1 August 2021. The pension allowance of both Miles Roberts and Adrian Marsh will be reduced further so that their pension benefit will be aligned with that available to the workforce in the UK (being the country where they are based for employment purposes) with effect from 1 August 2024.
2021/22 applicationThe table below sets out a summary of how the remuneration policy for 2020-23 will apply during 2021/22.
Remuneration element Application of the remuneration policyBase salary • Salaries will be increased by 2.5% (in line with the average increase of 2.5% for the workforce as a
whole) as follows:• Group Chief Executive £814,000; and• Group Finance Director £511,500.
Annual bonus • No changes to maximum award levels of:• Group Chief Executive 200%; and• Group Finance Director 150%.
• Bonus paid half in cash and half in deferred shares, under the deferred share bonus plan (DSBP), with the shares vesting after three years.
• The performance measures for 2021/22 remain as adjusted EBTA and free cash flow with equal weighting. (Details of the ESG underpin are set out on page 97.)
Performance share plan (PSP)
• No change to maximum award level for Group Chief Executive of 225%• Increase in award level for Group Finance Director from 175% to 200%.• The performance measures for 2021/22 will remain as adjusted EPS, adjusted ROACE and relative
TSR with equal weighting.• Any shares that vest under this award must be retained for a further two years before they can be
sold and they are also subject to a post-employment holding condition.
GOVERNANCE
Annual Report 2021 dssmith.com 87

Remuneration element Application of the remuneration policy in 2021/22 (continued)Pension • With effect from 1 August 2021 the contribution or cash alternative rate is reduced:
• Group Chief Executive from 20% to 15%; and• Group Finance Director from 15% to 10%.
Shareholding guidelines • Shareholding target remains at 225% of salary for the Group Chief Executive and increases from 175% to 200% for the Group Finance Director.
• Actual holding (valued at 30 April 2021 share price) was 1,317% and 551% respectively.Any shares that vest under the PSP awards granted in 2020/2 1 will be held in a nominee arrangement for the appropriate period, because they are also subject to a post-employment holding condition (in addition to the two-year post-vesting holding condition).
Illustration of the application in 2021/22 of the remuneration policyThe balance between fixed and variable ‘at risk’ elements of remuneration changes with performance. Our remuneration policy results in a significant proportion of remuneration received by Executive Directors being dependent on performance. The total remuneration of the Executive Directors for maximum, target and minimum performance in 2021/22 is presented in the charts below. (The basis of the calculation of the share price appreciation is that the share price embedded in the calculation for the PSP awards in the maximum bar chart is assumed to increase by 50% across the performance period.) These figures are indicative as future share prices and future dividends are not known at present.
Miles Roberts Adrian Marsh
£962 £1,618
Fixed pay: 18% Bonus: 31% PSP: 51%
£5,260£2,680
£962 £1,618
Fixed pay: 22% Bonus: 37% PSP: 41%
£4,367£1,787
£962 £809
Bonus: 37% PSP: 20%
£2,218£447
Fixed pay: 100%
£962
£584 £763
Fixed pay: 20% Bonus: 27% PSP: 53%
£2,844£1,497
£584 £763
Fixed pay: 25% Bonus: 32% PSP: 43%
£2,345£998
Fixed pay: 100%
£584
Fixed pay: 43%
£584 £381
Bonus: 31% PSP: 21%
£1,215£250
Fixed pay: 48%
Key attributes to consider in reviewing remuneration matters Under the 2018 Corporate Governance Code (the Code) the Committee is asked to describe with examples how it has considered six specific factors. In 2020 the Committee’s review of the remuneration policy was an example of taking all these factors into account, but in every year the decisions made in relation to remuneration matters are taken in alignment with the over-arching reward principles that apply to all executive management. These principles are periodically reviewed by management and considered by the Remuneration Committee. In 2021 the Committee reviewed the reward principles (set out on page 89) and noted that these principles are clear and
expressed simply. Under our reward principles incentive levels are to be proportionate and designed in a way to minimise any behavioural risks.All the criteria for each element of an individual’s remuneration are explained, so that each individual has a clear and predictable line of sight as to what actions will impact their remuneration outcomes, so that all remuneration is appropriately earned for genuine business performance aligned to Company strategy.
Minimum (fixed remuneration only, i.e. latest known salary, benefits and pension) £’000s
Target (fixed remuneration plus half of maximum annual bonus opportunity plus 25% vesting at threshold of performance shares) £’000s
Maximum (fixed remuneration plus maximum annual bonus opportunity plus 100% vesting of performance shares) and share price appreciation of 50%: £’000s
Maximum (fixed remuneration plus maximum annual bonus opportunity plus 100% vesting of performance shares) £’000s
88
REMUNERATION AT A GLANCE CONTINUED
DS Smith reward principlesAs part of good practice for any reputable company we apply the following baseline principles when setting reward across the organisation:• Meets legal and regulatory requirements• Simple and clear to understand• Affordable and sustainable• Is competitive in the market on a total reward basis to enable
DS Smith to attract and retain the right level of talent.However, to differentiate our employee value proposition and ensure that our approach to reward aligns to our culture, we have developed the following DS Smith reward principles.1. We support a culture of meritocracy where our people are
encouraged to reach their potential and are clear on what they need to do to succeed. For salaried employees, reward should be differentiated using our Group salary and incentive ranges for entry, established and high performers. Where pay is determined through collective bargaining and there is less scope to differentiate by individual, the highest performers should be rewarded through development, promotion and other recognition opportunities.
2. We strive to have consistent policies and practices at a local level and transparency in our benefits offering and policies.
3. Incentives are designed to reward collective rather than individual effort to support our one DS Smith culture. For senior managers, this is Group financial performance but for
middle managers and frontline employees, performance measures can be the key value drivers that the individuals are able to influence directly such as cost, quality and service.
4. All employees should have the opportunity to share in the success of the Group.
5. Share ownership is fundamental at senior levels and desirable across the Group.
6. The Group respects the need for employees to make their own choices around what they value, although there are certain reward components linked to health and wellbeing where the Group may decide it is appropriate to set a minimum Group standard.
7. Our pension offering should be competitive with the local market where this is a benefit valued by employees.
8. When determining rewards, demonstration of an individual’s behaviours in line with the Group’s values (be caring, be challenging, be trusted, be responsive and be tenacious) are considered alongside the results achieved.
9. In managed exits people should be treated fairly, in line with the Group’s values and with dignity, but failure should not be rewarded.
10. Safeguards are applied to ensure that incentive levels are proportionate, appropriately earned for genuine business performance aligned to Company strategy and designed in a way to minimise any behavioural risks.
Employee voice in the boardroom
Use of existing European Works Council (EWC) structure
Run reward focus sessions at site level
Include a reward session at quarterly EWC Chairman meetings led by the Group HR Director and the Group Head of Reward
Invite EWC representative to speak regularly at Remuneration Committee meetings
Sessions led by Group reward
Particular focus on regions not covered by the EWC
Other sources of feedback on the total employee experience
BoardRemuneration Committee
Any reward-related feedback also shared with Remuneration Committee
Information flow
Information
flow
The remuneration sections of this report explain how we have applied aspects of principles P, Q and R in section 5 (remuneration) of the Code and how we have put the provisions of that section into practice, as well as how we have complied with the Companies Act 2006 and other regulatory requirements in relation to remuneration matters. After the introductory letter from the Chairman of the Remuneration Committee, we summarise the remuneration of the Executive Directors in our ‘at a glance’ section. We have put that summary section next as we know some readers are less interested in the more detailed sections that follow about how the implementation of the remuneration policy has operated in practice in the year under review in 2020/21 and how the remuneration policy will operate in 2021/22. Finally there are some other required disclosures that also relate to remuneration matters included in the last part of this Remuneration Report.
GOVERNANCE
Annual Report 2021 dssmith.com 89
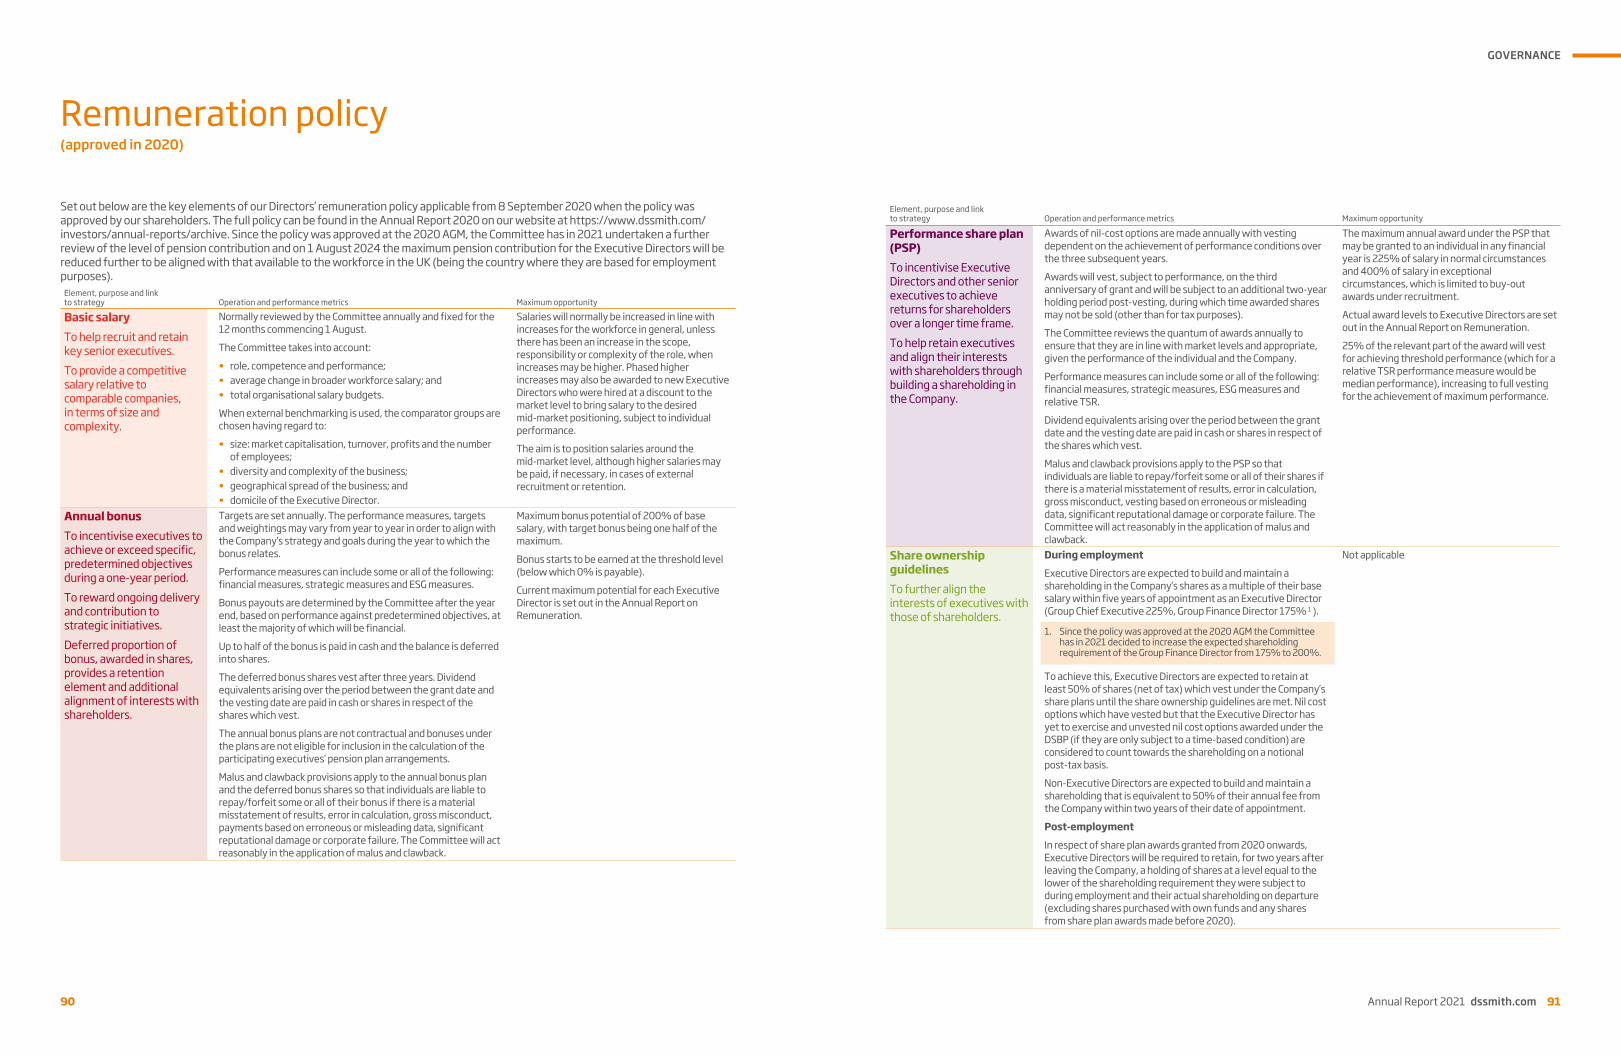
Set out below are the key elements of our Directors’ remuneration policy applicable from 8 September 2020 when the policy was approved by our shareholders. The full policy can be found in the Annual Report 2020 on our website at https://www.dssmith.com/investors/annual-reports/archive. Since the policy was approved at the 2020 AGM, the Committee has in 2021 undertaken a further review of the level of pension contribution and on 1 August 2024 the maximum pension contribution for the Executive Directors will be reduced further to be aligned with that available to the workforce in the UK (being the country where they are based for employment purposes).
Element, purpose and link to strategy Operation and performance metrics Maximum opportunity
Basic salaryTo help recruit and retain key senior executives.To provide a competitive salary relative to comparable companies, in terms of size and complexity.
Normally reviewed by the Committee annually and fixed for the 12 months commencing 1 August.
The Committee takes into account:
• role, competence and performance;• average change in broader workforce salary; and• total organisational salary budgets.
When external benchmarking is used, the comparator groups are chosen having regard to:
• size: market capitalisation, turnover, profits and the number of employees;
• diversity and complexity of the business;• geographical spread of the business; and• domicile of the Executive Director.
Salaries will normally be increased in line with increases for the workforce in general, unless there has been an increase in the scope, responsibility or complexity of the role, when increases may be higher. Phased higher increases may also be awarded to new Executive Directors who were hired at a discount to the market level to bring salary to the desired mid-market positioning, subject to individual performance.
The aim is to position salaries around the mid-market level, although higher salaries may be paid, if necessary, in cases of external recruitment or retention.
Annual bonusTo incentivise executives to achieve or exceed specific, predetermined objectives during a one-year period.To reward ongoing delivery and contribution to strategic initiatives.Deferred proportion of bonus, awarded in shares, provides a retention element and additional alignment of interests with shareholders.
Targets are set annually. The performance measures, targets and weightings may vary from year to year in order to align with the Company’s strategy and goals during the year to which the bonus relates.
Performance measures can include some or all of the following: financial measures, strategic measures and ESG measures.
Bonus payouts are determined by the Committee after the year end, based on performance against predetermined objectives, at least the majority of which will be financial.
Up to half of the bonus is paid in cash and the balance is deferred into shares.
The deferred bonus shares vest after three years. Dividend equivalents arising over the period between the grant date and the vesting date are paid in cash or shares in respect of the shares which vest.
The annual bonus plans are not contractual and bonuses under the plans are not eligible for inclusion in the calculation of the participating executives’ pension plan arrangements.
Malus and clawback provisions apply to the annual bonus plan and the deferred bonus shares so that individuals are liable to repay/forfeit some or all of their bonus if there is a material misstatement of results, error in calculation, gross misconduct, payments based on erroneous or misleading data, significant reputational damage or corporate failure. The Committee will act reasonably in the application of malus and clawback.
Maximum bonus potential of 200% of base salary, with target bonus being one half of the maximum.
Bonus starts to be earned at the threshold level (below which 0% is payable).
Current maximum potential for each Executive Director is set out in the Annual Report on Remuneration.
90
Remuneration policy(approved in 2020)
Element, purpose and link to strategy Operation and performance metrics Maximum opportunity
Performance share plan (PSP)To incentivise Executive Directors and other senior executives to achieve returns for shareholders over a longer time frame.To help retain executives and align their interests with shareholders through building a shareholding in the Company.
Awards of nil-cost options are made annually with vesting dependent on the achievement of performance conditions over the three subsequent years.
Awards will vest, subject to performance, on the third anniversary of grant and will be subject to an additional two-year holding period post-vesting, during which time awarded shares may not be sold (other than for tax purposes).
The Committee reviews the quantum of awards annually to ensure that they are in line with market levels and appropriate, given the performance of the individual and the Company.
Performance measures can include some or all of the following: financial measures, strategic measures, ESG measures and relative TSR.
Dividend equivalents arising over the period between the grant date and the vesting date are paid in cash or shares in respect of the shares which vest.
Malus and clawback provisions apply to the PSP so that individuals are liable to repay/forfeit some or all of their shares if there is a material misstatement of results, error in calculation, gross misconduct, vesting based on erroneous or misleading data, significant reputational damage or corporate failure. The Committee will act reasonably in the application of malus and clawback.
The maximum annual award under the PSP that may be granted to an individual in any financial year is 225% of salary in normal circumstances and 400% of salary in exceptional circumstances, which is limited to buy-out awards under recruitment.
Actual award levels to Executive Directors are set out in the Annual Report on Remuneration.
25% of the relevant part of the award will vest for achieving threshold performance (which for a relative TSR performance measure would be median performance), increasing to full vesting for the achievement of maximum performance.
Share ownership guidelinesTo further align the interests of executives with those of shareholders.
During employment
Executive Directors are expected to build and maintain a shareholding in the Company’s shares as a multiple of their base salary within five years of appointment as an Executive Director (Group Chief Executive 225%, Group Finance Director 175% 1 ).
1. Since the policy was approved at the 2020 AGM the Committee has in 2021 decided to increase the expected shareholding requirement of the Group Finance Director from 175% to 200%.
To achieve this, Executive Directors are expected to retain at least 50% of shares (net of tax) which vest under the Company’s share plans until the share ownership guidelines are met. Nil cost options which have vested but that the Executive Director has yet to exercise and unvested nil cost options awarded under the DSBP (if they are only subject to a time-based condition) are considered to count towards the shareholding on a notional post-tax basis.
Non-Executive Directors are expected to build and maintain a shareholding that is equivalent to 50% of their annual fee from the Company within two years of their date of appointment.
Post-employment
In respect of share plan awards granted from 2020 onwards, Executive Directors will be required to retain, for two years after leaving the Company, a holding of shares at a level equal to the lower of the shareholding requirement they were subject to during employment and their actual shareholding on departure (excluding shares purchased with own funds and any shares from share plan awards made before 2020).
Not applicable
GOVERNANCE
Annual Report 2021 dssmith.com 91

Element, purpose and link to strategy Operation and performance metrics Maximum opportunity
All employee share planEncourages long-term shareholding in the Company.
Executive Directors have the opportunity to participate in the UK or international sharesave plans on the same terms as other eligible employees (which is currently an opportunity to save up to £250, or local currency equivalent, per month). There are no performance conditions applicable to awards.
Up to £500 per month (or local currency equivalent).
PensionTo remain competitive in the marketplace and provide income in retirement.
Executive Directors can elect to:
• participate in the Group’s registered defined contribution plan (DC Plan); or
• receive a salary supplement; or• a combination of the above.
Maximum: 20% (for Group Chief Executive) and 15% (for Group Finance Director) of base salary from 1 August 2020 (combined cash supplement and DC Plan contribution).
On 1 August 2021 the maximum pension contribution will be reduced to 15% (for Group Chief Executive) and 10% (for Group Finance Director) of base salary.
A further review of the level of pension contribution will take place in 20221.
1. Since the policy was approved at the 2020 AGM the Committee has in 2021 undertaken a further review of the level of pension contribution and on 1 August 2024 the maximum pension contribution for the Executive Directors will be reduced further to be aligned with that available to the workforce in the UK (being the country where they are based for employment purposes).
Future appointments to the Board or any Board member changing roles would be given a pension benefit aligned with that available to the workforce in the country where they are based for employment purposes.
BenefitsTo help retain employees and remain competitive in the marketplace.
Directors, along with other UK senior executives, receive a car allowance or company car equivalent, income protection insurance, four times life cover, family medical insurance and subsidised gym membership. Additional benefits (including a relocation allowance) may be provided from time to time, where they are in line with market practice.
Any reasonable business related expenses may be reimbursed (including tax thereon, if deemed to be a taxable benefit).
Benefit levels may be increased in line with market levels to ensure they remain competitive and valued by the recipient. However, as the cost of the provision of benefits can vary without any change in the level of provisions, no maximum is predetermined.
Non-Executive Directors and ChairmanAttract and retain high performing individuals.
Reviewed annually by the Board (after recommendation by the Committee in respect of the Chairman).
Fee increases, if applicable, are normally effective from 1 August. The Board and, where appropriate, the Committee, considers pay data at comparable companies of similar scale.
The Senior Independent Director and the Chairmen of the Audit and Remuneration Committees receive additional fees.
No eligibility for participation in bonuses, retirement plans or share plans but limited benefits may be delivered in relation to the permanency of their duties as a Director (e.g. hospitality, provision of a mobile phone, tablet/laptop and travel-related expenses). Tax may be reimbursed if these benefits are deemed to be a taxable benefit.
If there is a temporary yet material increase in the time commitments for non-Executive Directors, the Board may pay extra fees on a pro-rata basis to recognise the additional workload.
No prescribed maximum annual increase.
Details of current fees are set out in the annual report on remuneration.
Aggregate annual fees limited to £1,000,000 by Articles of Association.
92
REMUNERATION POLICY CONTINUED
Discretions and judgementsThe Committee will operate the annual bonus plan and long-term plans according to the rules of each respective plan, their respective ancillary documents and the UK Financial Conduct Authority’s Listing Rules, which, consistent with market practice, include discretion in a number of respects in relation to the operation of each plan. Discretions include:• who participates in the plan• determining the timing of grants of awards and/or payments• determining the quantum of an award and/or payment• determining the extent of vesting• how to deal with a change of control or restructuring of
the Group• whether an Executive Director or a senior manager is a good/bad
leaver for incentive plan purposes and whether the proportion of awards that vest do so at the time of leaving or at the normal vesting date(s)
• how and whether an award may be adjusted in certain circumstances (e.g. for a rights issue, a corporate restructuring or for special dividends)
• what the weighting, measures and targets should be for the annual bonus plan and PSP awards from year to year
• the Committee also retains the ability, within the policy, if events occur that cause it to determine that the conditions set in relation to an annual bonus plan or a granted PSP award are unable to fulfil their original intended purpose, to adjust targets and/or set different measures or weightings for the applicable annual bonus plan and PSP awards.
The Committee can use its judgement to make adjustments to published outturns for significant events or changes in the Company’s asset base that were not envisaged when the targets were originally set or for changes to accounting standards, to ensure that the performance conditions achieve their original purpose.The Committee also has the discretion to reduce or apply other restrictions to an award if, after taking into account all circumstances known to the Committee, it determines that the amount which a participant would otherwise receive pursuant to an incentive award in accordance with its terms would result in the participant receiving an amount which the Committee considers cannot be justified or which the Committee considers to be an unfair or undeserved benefit to the participant.The Committee has the discretion to override formulaic outcomes to the bonus and the PSP or DSBP in order to ensure that outcomes reflect true underlying business performance or to reduce awards if the business has suffered an exceptional negative event in order to ensure that outcomes reflect overall corporate performance.The Committee can use its discretion to waive the post-employment shareholding requirement in the event of ill health or death.
Any historic share awards (other than those granted in 2020) that were granted before 8 September 2020 (when the revised policy came into force) and still remain outstanding will remain eligible to vest or be exercised or sold based on their original award terms and the remuneration policy that was in force when those awards were granted.
In summary: key objectives of our remuneration policyThe purpose of our remuneration policy is to deliver a remuneration package that:• Attracts and retains high calibre Executive Directors and
senior managers in a challenging and competitive business environment
• Reduces complexity, delivering an appropriate balance between fixed and variable pay for each Executive Director and the senior management team
• Encourages long-term performance by setting challenging targets linked to sustainable growth
• Is strongly aligned to the achievement of the Group’s objectives and shareholder interests and to the delivery of sustainable value to shareholders
• Seeks to avoid creating excessive risks in the achievement of performance targets
• Is consistent with the Company’s Purpose and values• Is commensurate with pay conditions across the Group• Is aligned to the DS Smith reward principles (as set out on
page 89) • Takes into account overall corporate performance as well
as business performance.All our decisions as a Remuneration Committee are taken in this context.
GOVERNANCE
Annual Report 2021 dssmith.com 93

The tables below show how we have applied the remuneration policy during 2020/21. They disclose all the elements of remuneration earned by the Directors during the year. Full details of the policy that was voted on in 2020 are included in the 2020 Annual Report and is available on our website. Deloitte LLP has audited, as required by the applicable regulations, those tables labelled as audited.
Single total figure of remuneration for each Director (audited)
Executive Directors Salary £’000
Benefits1 £’000
Pensions2 £’000
Total fixedremuneration
Annual bonus3 £’000
Long-term incentives
£’0004Total variableremuneration
Total singleremuneration
figure
Miles RobertsGroup Chief Executive
2019/20 778 22 233 1,033 0 389 4 389 1,4222020/21 786 21 177 984 1,541 0 1,541 2,525
Adrian MarshGroup Finance Director
2019/20 489 19 98 606 0 1904 190 7962020/21 494 19 80 593 726 0 726 1,319
1. Taxable benefits in 2019/20 and 2020/21 principally include a car allowance of £20,000 for Miles Roberts and £17,500 for Adrian Marsh. Both Directors also receive income protection, life and health cover.
2. In lieu of membership of the defined contribution scheme Miles Roberts receives an annual pension allowance which was reduced from 30% with effect from 1 August 2020 to 20% of base salary and Adrian Marsh receives an annual pension allowance which was reduced from 20% with effect from 1 August 2020 to 15% of base salary. The annual pension allowances are not pensionable and are not considered to be salary for the purpose of calculating any bonus payment. More details about the further planned reductions in pension benefits are set out on page 87.
3. The annual bonus, when paid, is paid 50% in cash and 50% in deferred shares as described in the policy table on page 90.4. The long-term incentives for 2019/20 were valued in the 2020 Annual Report using the average share price for the last three months of that financial year, which
was 311.7p. This has been restated to reflect the share price on the next working day following the actual vesting date of Saturday 18 July 2020, which was 278.6p. This also impacts the total and sub-total figures for 2019/20.
Fees £’000 Total8
2020/21 £’000
Total8
2019/20 £’0002020/21 2019/20
Non-Executive Directors Geoff Drabble1 128 – 128 –Gareth Davis2 191 284 191 284Celia Baxter3 76 43 76 43Chris Britton4 22 60 22 60Alina Kessel5 61 – 61 –David Robbie6 76 70 76 70Louise Smalley 61 60 61 60Rupert Soames7 71 67 71 67Total 686 584 686 584
1. Geoff Drabble joined the Board with effect from 1 September 2020 and became Chairman with effect from 3 January 2021, when his fee increased to £330,000 per annum (fixed for three years).
2. Gareth Davis stepped down from the Board with effect from 3 January 2021.3. Celia Baxter joined the Board with effect from 9 October 2019.4. Chris Britton stepped down from the Board with effect from 8 September 2020.5. Alina Kessel joined the Board with effect from 1 May 2020.6. David Robbie joined the Board with effect from 11 April 2019. 7. Rupert Soames joined the Board with effect from 1 March 2019.8. Non-Executive Directors received no taxable benefits, annual bonus, long-term incentives or pension payments during 2019/20 or 2020/21 .
94
Annual report on remunerationFixed payBasic salary (audited)
Salaries for Executive Directors (audited)
Salaries effective from Earned in 2020/21
(£)1 August 2019
(£) 1 August 2020
(£)1 January 2021
(£)1 August 2021
(£)
Miles Roberts 782,300 782,300 794,000 814,000 786,200Adrian Marsh 491,600 491,600 499,000 511,500 494,067
When reviewing salaries the Committee takes account of a number of factors, with particular focus on the general level of salary increases awarded to employees throughout the Group. Where relevant, the Committee also considers external market data on salary and total remuneration. When initially considering the Executive Directors’ salary increase for 2021, the Committee also looked at the data for the peer group of FTSE 51-150 companies (excluding Financial Services companies). It chose that comparator group as one that (in line with the remuneration policy) reflected a similar size and complexity of business and of geographical spread as well as the domicile of the Executive Directors. The Committee applies judgement when considering such data. In 2020 the outcome of the salary review for the UK workforce was on average an increase of 1.7%. In view of the economic uncertainty caused by Covid-19, the Company took the decision not to go ahead with an ‘across the board’ review in the normal timeframe (which varies by country and business area). This decision impacted all management roles and certain business areas where any collective pay arrangements were not already in progress or in the pipeline. Consistent with the treatment of the rest of the management population, the Executive Directors did not receive a salary increase in August 2020. At the end of 2020, due to the resilient performance of the business in the second six months of 2020, this area was revisited and pay increases were awarded, with effect from 1 January 2021, with an average pay increase of 1.7 % where given. Accordingly, the Committee felt that it was appropriate to treat the Executive Directors in the same way, awarding them a 1.5% pay increase with effect from 1 January 2021. The usual review of executive remuneration was held in April 2021 and it was agreed that a pay increase of 2.5% (in line with the average increase for the workforce as a whole) would be implemented on 1 August 2021.
Fees for Non-Executive Directors and the Chairman (audited)In addition to a base fee of £60,500, the Chairman of the Audit Committee and the Chairman of the Remuneration Committee each receive a fee of £15,000 per annum and the Senior Independent Director receives a fee of £10,000 per annum. For the same reasons (as set out above) that the Executive Directors did not receive a salary increase in August 2020, there was no increase in the Non-Executive Director base fee or the additional role fees in August 2020. Nor was there an increase in January 2021. The fee for the Chairman with effect from 3 January 2021 was set taking into account market rates for comparable positions and is fixed for three years. It was agreed that an increase of 2.5% (in line with the average increase for the workforce as a whole) would be implemented in respect of the base fee for Non-Executive Directors on 1 August 2021.The rates for the Chairman’s and Non-Executive Directors’ fees are:
Base fee effective from Earned in 2020/21
(£)1 August 2019
(£)1 August 20208
(£) 1 August 2021
(£)
Geoff Drabble1 – – 330,000 128,284Gareth Davis2 285,400 285,400 n/a 191,364 Celia Baxter3 60,500 60,500 62,000 75,500 Chris Britton4 60,500 60,500 n/a 21,563Alina Kessel5 - 60,500 62,000 60,500David Robbie6 60,500 60,500 62,000 75,500 Louise Smalley 60,500 60,500 62,000 60,500Rupert Soames7 60,500 60,500 62,000 70,5001. Geoff Drabble joined the Board with effect from 1 September 2020 and became Chairman with effect from 3 January 2021. His fee as a Non-Executive Director
was £60,500 per annum. His total fee as a Non-Executive Chairman is £330,000 per annum, which will not be reviewed for three years.2. Gareth Davis stepped down from the Board with effect from 3 January 2021.3. Celia Baxter joined the Board with effect from 9 October 2019.4. Chris Britton stepped down from the Board with effect from 8 September 2020.5. Alina Kessel joined the Board with effect from 1 May 2020.6. David Robbie joined the Board with effect from 11 April 2019. 7. Rupert Soames joined the Board with effect from 1 March 2019.8. In line with the decision made for the Executive Directors above, a decision was taken not to go ahead with a fee review at the normal time on 1 August 2020 for
Non-Executive Directors .
GOVERNANCE
Annual Report 2021 dssmith.com 95
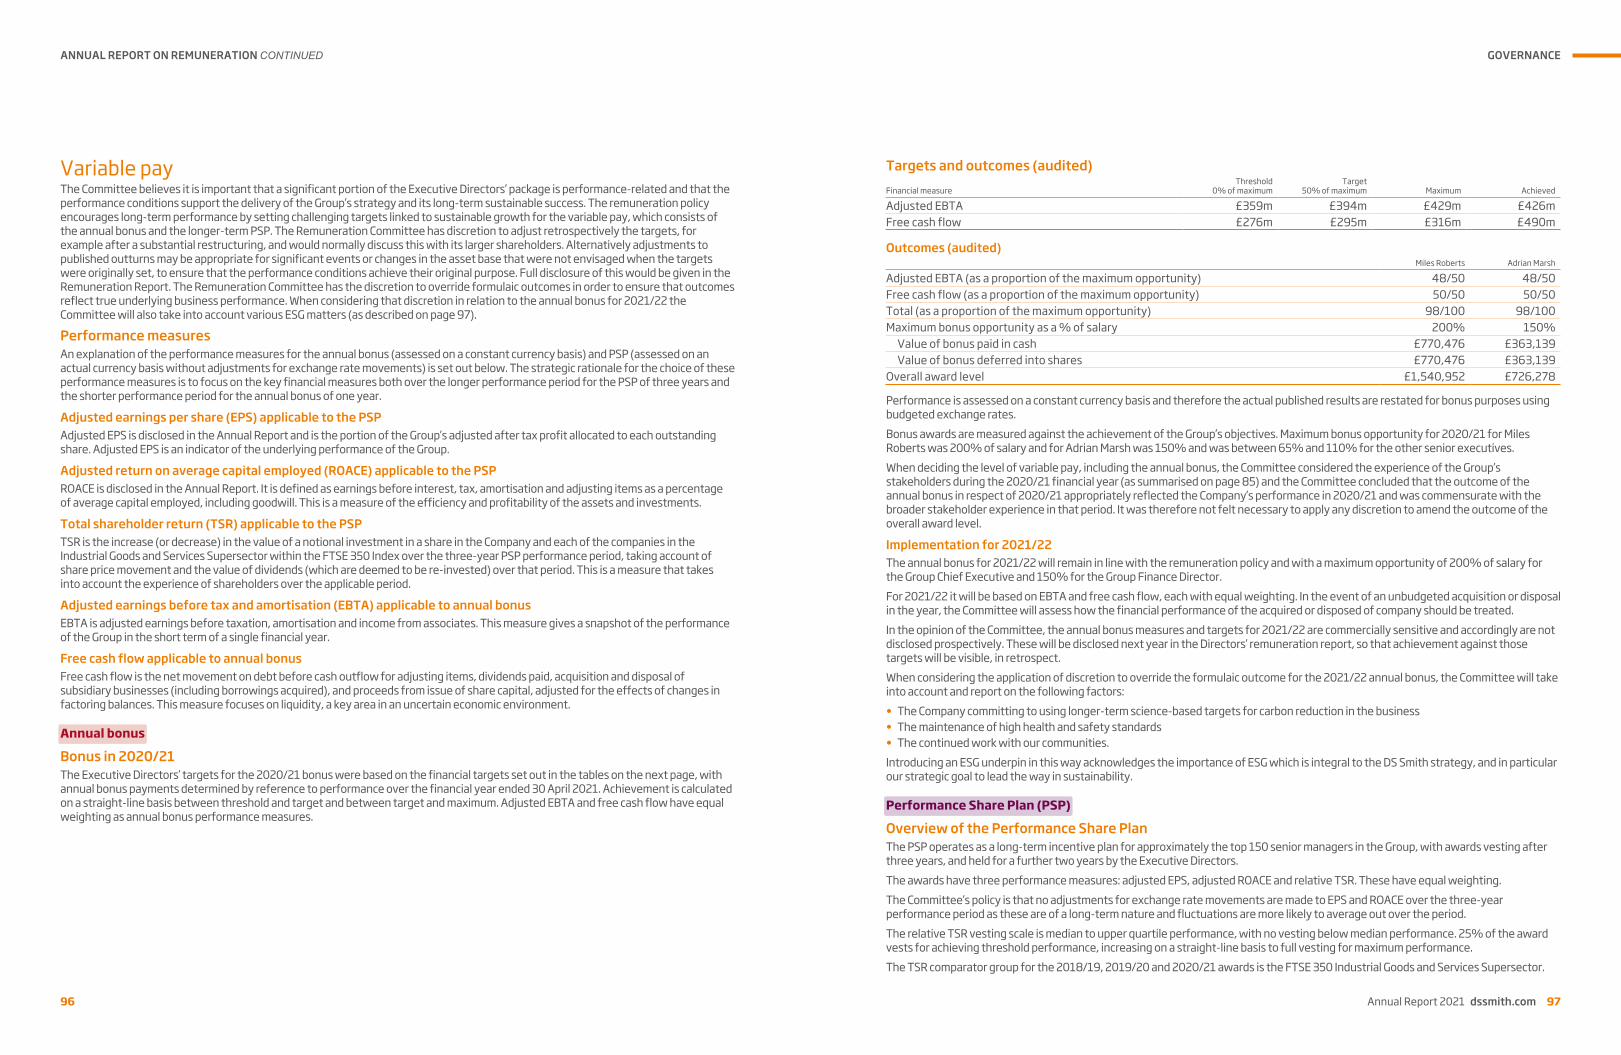
Variable payThe Committee believes it is important that a significant portion of the Executive Directors’ package is performance-related and that the performance conditions support the delivery of the Group’s strategy and its long-term sustainable success. The remuneration policy encourages long-term performance by setting challenging targets linked to sustainable growth for the variable pay, which consists of the annual bonus and the longer-term PSP. The Remuneration Committee has discretion to adjust retrospectively the targets, for example after a substantial restructuring, and would normally discuss this with its larger shareholders. Alternatively adjustments to published outturns may be appropriate for significant events or changes in the asset base that were not envisaged when the targets were originally set, to ensure that the performance conditions achieve their original purpose. Full disclosure of this would be given in the Remuneration Report. The Remuneration Committee has the discretion to override formulaic outcomes in order to ensure that outcomes reflect true underlying business performance. When considering that discretion in relation to the annual bonus for 2021/22 the Committee will also take into account various ESG matters (as described on page 97).
Performance measuresAn explanation of the performance measures for the annual bonus (assessed on a constant currency basis) and PSP (assessed on an actual currency basis without adjustments for exchange rate movements) is set out below. The strategic rationale for the choice of these performance measures is to focus on the key financial measures both over the longer performance period for the PSP of three years and the shorter performance period for the annual bonus of one year.
Adjusted earnings per share (EPS) applicable to the PSPAdjusted EPS is disclosed in the Annual Report and is the portion of the Group’s adjusted after tax profit allocated to each outstanding share. Adjusted EPS is an indicator of the underlying performance of the Group.
Adjusted return on average capital employed (ROACE) applicable to the PSP ROACE is disclosed in the Annual Report. It is defined as earnings before interest, tax, amortisation and adjusting items as a percentage of average capital employed, including goodwill. This is a measure of the efficiency and profitability of the assets and investments.
Total shareholder return (TSR) applicable to the PSPTSR is the increase (or decrease) in the value of a notional investment in a share in the Company and each of the companies in the Industrial Goods and Services Supersector within the FTSE 350 Index over the three-year PSP performance period, taking account of share price movement and the value of dividends (which are deemed to be re-invested) over that period. This is a measure that takes into account the experience of shareholders over the applicable period.
Adjusted earnings before tax and amortisation (EBTA) applicable to annual bonusEBTA is adjusted earnings before taxation, amortisation and income from associates. This measure gives a snapshot of the performance of the Group in the short term of a single financial year.
Free cash flow applicable to annual bonusFree cash flow is the net movement on debt before cash outflow for adjusting items, dividends paid, acquisition and disposal of subsidiary businesses (including borrowings acquired), and proceeds from issue of share capital, adjusted for the effects of changes in factoring balances. This measure focuses on liquidity, a key area in an uncertain economic environment.
Annual bonus
Bonus in 2020/21The Executive Directors’ targets for the 2020/21 bonus were based on the financial targets set out in the tables on the next page, with annual bonus payments determined by reference to performance over the financial year ended 30 April 2021. Achievement is calculated on a straight-line basis between threshold and target and between target and maximum. Adjusted EBTA and free cash flow have equal weighting as annual bonus performance measures.
96
ANNUAL REPORT ON REMUNERATION CONTINUED
Targets and outcomes (audited)Financial measure
Threshold 0% of maximum
Target50% of maximum Maximum Achieved
Adjusted EBTA £359m £394m £429m £426mFree cash flow £276m £295m £316m £490m
Outcomes (audited)Miles Roberts Adrian Marsh
Adjusted EBTA (as a proportion of the maximum opportunity) 48/50 48/50Free cash flow (as a proportion of the maximum opportunity) 50/50 50/50Total (as a proportion of the maximum opportunity) 98/100 98/100Maximum bonus opportunity as a % of salary 200% 150%
Value of bonus paid in cash £770,476 £363,139Value of bonus deferred into shares £770,476 £363,139
Overall award level £1,540,952 £726,278
Performance is assessed on a constant currency basis and therefore the actual published results are restated for bonus purposes using budgeted exchange rates.Bonus awards are measured against the achievement of the Group’s objectives. Maximum bonus opportunity for 2020/21 for Miles Roberts was 200% of salary and for Adrian Marsh was 150% and was between 65% and 110% for the other senior executives.When deciding the level of variable pay, including the annual bonus, the Committee considered the experience of the Group’s stakeholders during the 2020/21 financial year (as summarised on page 85) and the Committee concluded that the outcome of the annual bonus in respect of 2020/21 appropriately reflected the Company’s performance in 2020/21 and was commensurate with the broader stakeholder experience in that period. It was therefore not felt necessary to apply any discretion to amend the outcome of the overall award level.
Implementation for 2021/22The annual bonus for 2021/22 will remain in line with the remuneration policy and with a maximum opportunity of 200% of salary for the Group Chief Executive and 150% for the Group Finance Director.For 2021/22 it will be based on EBTA and free cash flow, each with equal weighting. In the event of an unbudgeted acquisition or disposal in the year, the Committee will assess how the financial performance of the acquired or disposed of company should be treated.In the opinion of the Committee, the annual bonus measures and targets for 2021/22 are commercially sensitive and accordingly are not disclosed prospectively. These will be disclosed next year in the Directors’ remuneration report, so that achievement against those targets will be visible, in retrospect.When considering the application of discretion to override the formulaic outcome for the 2021/22 annual bonus, the Committee will take into account and report on the following factors:• The Company committing to using longer-term science-based targets for carbon reduction in the business• The maintenance of high health and safety standards• The continued work with our communities.Introducing an ESG underpin in this way acknowledges the importance of ESG which is integral to the DS Smith strategy, and in particular our strategic goal to lead the way in sustainability.
Performance Share Plan (PSP)
Overview of the Performance Share PlanThe PSP operates as a long-term incentive plan for approximately the top 150 senior managers in the Group, with awards vesting after three years, and held for a further two years by the Executive Directors.The awards have three performance measures: adjusted EPS, adjusted ROACE and relative TSR. These have equal weighting. The Committee’s policy is that no adjustments for exchange rate movements are made to EPS and ROACE over the three-year performance period as these are of a long-term nature and fluctuations are more likely to average out over the period.The relative TSR vesting scale is median to upper quartile performance, with no vesting below median performance. 25% of the award vests for achieving threshold performance, increasing on a straight-line basis to full vesting for maximum performance.The TSR comparator group for the 2018/19, 2019/20 and 2020/21 awards is the FTSE 350 Industrial Goods and Services Supersector.
GOVERNANCE
Annual Report 2021 dssmith.com 97

2018/19 awards vesting in 2021/22 based on performance in the three-year period to 2020/21Unfortunately, the PSP award granted on 22 June 2018 which was due to vest in June 2021 based on the 3 year average EPS and ROACE performance between 2018/19 and 2020/21 and the 3 year cumulative relative TSR performance (each equally weighted), did not meet the threshold targets for the two financial measures and fell below median for the relative TSR measure. The financial targets (in the table below) were set in 2018 in the context of the expectation of a stable economy, but the negative impact of the pandemic on the 2020/21 results made those targets unachievable.
EPS, ROACE and TSR performance targets for 2018/19 awards based on performance in the three-year period to 2020-21 (audited)
WeightingThreshold
(25% vests)Maximum
(100% vests) Outcome
Three-year average EPS One third 35.7p 40.8p 30.5pThree-year average ROACE One third 12.3% 13.5% 10.8%Relative TSR1 One third Median Upper quartile Below median
1. Measured against the FTSE 350 Industrial Goods and Services Supersector.
25% of the PSP award vests for achieving threshold performance, increasing on a straight-line basis to full vesting for maximum performance.
Deferred share bonus plan (DSBP) awards vesting in 2021The DSBP award vesting in 2021 relates to the deferral into shares of half of the bonus paid in June 2018 in relation to the financial year 2017/18. The number of shares vesting in 2021 under the DSBP award granted on 22 June 2018 when adjusted for the rights issue is 132,849 for Miles Roberts and 62,603 for Adrian Marsh. Details of those awards and the single total figure of remuneration that included them were set out in the remuneration report for 2017/18. Dividend equivalents for the DSBP award also accrued during the three-year vesting period. Those dividend equivalents will be paid in shares (10,588 for Miles Roberts and 4,989 for Adrian Marsh) shortly after the award vests on 22 June 2021, the third anniversary of grant of the award.
PSP awards granted in 2020 vesting in 2023/24 and DSBP awards in 2020 (audited) The PSP awards made in 2020 in respect of 2020/21 were in line with the current remuneration policy and, as reported in last year’s remuneration report, were:• 225% of salary for the Group Chief Executive and 175% of salary for the Group Finance Director• Any shares that vest under the PSP awards granted in 2020/21 must be retained for a further two years before they can be sold (a
total of five years from original grant) and they are also subject to a post-employment holding condition, meaning that any shares that vest will be held in a nominee arrangement for the appropriate period. For any PSP awards which vest following departure that have been granted good leaver treatment, the Committee will reduce the two year post-vesting holding period so that it does not extend beyond the second anniversary of departure, provided that the three year vesting period has been completed.
• The PSP awards were granted as nil-cost options and are subject to three performance measures: adjusted EPS, adjusted ROACE and relative TSR, with equal weighting on each element.
Executive Director Award
Number of options granted under award
on 14 July 2020
Face value of award at time of grant
(£)
Miles Roberts PSP 647,123 1,760,175Adrian Marsh PSP 316,286 860,298
The PSP awards were made on 14 July 2020. The face value in the above table is calculated using 272p which was the average price of a DS Smith share for the three trading days preceding the grant of the award and the price used in the calculation of the number of options awarded.
98
ANNUAL REPORT ON REMUNERATION CONTINUED
The targets for the 2020/21 PSP award are set out below:
% vesting as a proportionAdjusted EPS
One third1Adjusted ROACE
One third1Relative TSR
One third2
100% 36.5p 12.5% Upper quartileBetween 25% and 100% 34.2-36.5p 11.0%-12.5% Between median and upper quartile25% 34.2p 11.0% Median
Awards vest on a straight-line basis between threshold and maximum performance. The performance measurement period for the adjusted EPS and adjusted ROACE targets is the 2022/23 financial year and for the relative TSR target is the three years to 30 April 2023.1. The 2019/20 baseline results are 33.2p for adjusted EPS and 10.6% for adjusted ROACE. 2. The comparator group for measurement of relative TSR is the FTSE 350 Industrial Goods and Services Supersector, as it was in 2018/19 and 2019/20.
No DSBP awards were granted to Executive Directors in 2020, because no annual bonus in respect of the 2019/20 financial year was paid.
PSP awards to be granted in 2021 vesting in 2024/25 The PSP awards to be made in 2021 in respect of 2021/22 will remain in line with the remuneration policy. For the Group Chief Executive this will remain at the same level as the award level in 2020/21, namely 225% of salary. In recognition of the progression that the Group Finance Director has made in his role with regard to his personal performance and the increased complexity of the business in recent years, the award level for the Group Finance Director will increase from 175% of salary to 200% of salary which serves to close the gap to the market position for the role. The opportunity is only able to be realised if the corporate targets are met and five years after the awards have been granted. At the same time, the shareholding requirement for the Group Finance Director will increase from 175% to 200%. As a matter of best practice, before finalising the PSP award levels, the Committee considered the movements in the share price since the beginning of the 2020/21 financial year. As the share price had increased over the period and continues to trade strongly, it was felt appropriate to grant the PSP awards based on the normal percentage of salary. The performance measures and their weighting for the award will remain the same as in 2020/21. The targets for the 2021/22 PSP award will be:
% vesting as a proportion Adjusted EPS
One thirdAdjusted ROACE
One thirdRelative TSR
One third1
100% 40.0p 13.1% Upper quartileBetween 25% and 100% 35.2-40.0p 11.2-13.1% Between median and upper quartile25% 35.2p 11.2% Median
Awards vest on a straight-line basis between threshold and maximum performance. The performance measurement period for the adjusted EPS and adjusted ROACE targets is the 2023/24 financial year and for the relative TSR target is the three years to 30 April 2024.1. The comparator group for measurement of relative TSR will be the FTSE 350 Industrial Goods and Services Supersector, as it was in 2020/21 and 2019/20.The Committee’s aim, as always, has been to set robust targets with a strong degree of stretch. In setting the target ranges the Committee took into account a number of factors which included the broker forecast consensus for DS Smith performance and a recognition that the 2020/21 results provided too low a starting point on which to base the three year targets. So for the PSP targets for the 2021 awards we have instead built growth into the PSP targets set for last year’s awards. Our desire continues to be to set targets which balance stretch with the ability to at least achieve the threshold level so that awards remain motivating and meaningful to the c.150 plan participants. The Committee will, as a matter of good practice, take a step back when determining the vesting outturn in three years’ time to consider whether any discretion should be applied to the formulaic outturn.
DSBP awards in 2021As set out on page 97, half of the value of the bonus to be paid in 2021 in respect of the performance over the financial year ended 30 April 2021, will be deferred into shares, which will not vest until 2024.
GOVERNANCE
Annual Report 2021 dssmith.com 99

Outstanding PSP and DSBP share awards during 2020/21 and as at 30 April 2021 (audited)The table below sets out details of Executive Directors’ outstanding share awards, both under the PSP and the DSBP, during the year under review. Unvested awards will vest in future years subject to performance and/or continued service. Vested awards will expire if not exercised before the relevant expiry date.
Award date
Awards held at 30 April
2020 GrantedDividend
equivalentsExercised/
vested1Lapsed/
forfeitedGrant price
for award (p)2
Market price on date of
exercise (p)
Awards held at 30 April
2021
Vesting date(if any
performance conditions applicable
are met) Expiry date
Miles Roberts PSP 1 Jul 16 256,822 – – – – 379.80 – 256,822 1 Jul 19 1 Jul 26PSP 18 Jul 17 360,117 – 12,929 126,761 233,356 484.70 – 139,690 18 Jul 20 18 Jul 27PSP 22 Jun 18 341,748 – – – – 523.47 – 341,748 22 Jun 21 22 Jun 28PSP 15 Jul 19 481,039 – – – – 357.00 – 481,039 15 Jul 22 15 Jul 29PSP 14 Jul 20 – 647,123 – – – 272.00 – 647,123 14 Jul 23 14 Jul 30 DSBP 1 Jul 16 156,676 – – – – 379.80 – 156,676 1 Jul 19 1 Jul 26DSBP 18 Jul 17 72,022 – 7,346 72,022 – 484.70 – 79,368 18 Jul 20 18 Jul 27DSBP 22 Jun 18 132,849 – – – – 523.47 – 132,849 22 Jun 21 22 Jun 28DSBP 15 Jul 19 157,055 – – – – 357.00 – 157,055 15 Jul 22 15 Jul 29 2,392,370 Adrian MarshPSP 18 Jul 17 175,977 – 6,318 68,261 114,034 484.70 383 .00 0 18 Jul 20 18 Jul 27PSP 22 Jun 18 167,015 – – – – 523.47 – 167,015 22 Jun 21 22 Jun 28PSP 15 Jul 19 235,098 – – – – 357.00 – 235,098 15 Jul 22 15 Jul 29PSP 14 Jul 20 – 316,286 – – – 272.00 – 316,286 14 Jul 23 14 Jul 30 DSBP 18 Jul 17 33,937 – 3,461 37,398 – 484.70 383.00 0 18 Jul 20 18 Jul 27DSBP 22 Jun 18 62,603 – – – – 523.47 – 62,603 22 Jun 21 22 Jun 28DSBP 15 Jul 19 74,015 – – – – 357.00 – 74,015 15 Jul 22 15 Jul 29 855,017
1. This includes the awards granted in 2017 which vested during 2020/21 and, in the case of Adrian Marsh, dividend equivalent shares and vested awards which were exercised during 2020/21. Adrian Marsh as at 30 April 2021 did not hold any vested but unexercised awards. Miles Roberts as at 30 April 2021 held awards granted on 1 July 2016 and 18 July 2017 which have now vested but have not been exercised.
2. The figure in this column is the average price of a DS Smith share for the three trading days preceding the award and is the price used in the calculation of the number of options originally awarded. The number of options originally awarded was subsequently adjusted for the rights issue in 2018 as described in the Annual Report for 2019.
The target ranges for the 2018/19 PSP awards are set out on page 98. The target ranges for the 2020/21 awards are set out on page 99. The relative TSR target for the 2019/20 award is the same as it was for the 2018/19 award. For the 2019/20 awards the target ranges for EPS and ROACE are set out in the audited table below. PSP plan EPS range ROACE range
2019/20 37.4p-42.0p 12.4%-13.6%
It is currently intended that any ordinary shares required to fulfil entitlements under the DSBP will be provided by Computershare Trustees (Jersey) Limited in its capacity as trustee of the employee benefit trust (the Trust), which buys shares to do so. The Trust may also be used to fulfil certain entitlements under the PSP and the employee sharesave plans or those may be fulfilled by newly-issued shares.
100
ANNUAL REPORT ON REMUNERATION CONTINUED
Sharesave – employee share plans (audited)Our sharesave (SAYE) plans align our employees’ interests with those of our long-term shareholders. Our commitment is to deliver an opportunity for our employees to be engaged with the strategic direction of DS Smith and to share in its financial success. Executive Directors are eligible to participate in the SAYE on the same terms as all other UK-based employees of the Company and participating subsidiaries of the Group. Options are granted under the SAYE, which, in the UK, is an HMRC tax-advantaged plan. Participants contract to save up to the equivalent of £250 per month over a period of three years (two years in the US). The current maximum permitted monthly saving of the equivalent of £250 is set by the Company. Under the applicable plan rules (and the remuneration policy) the monthly maximum could be increased in the future to up to the equivalent of £500 per month. The option price is discounted by up to 20% (15% in the US) of the average closing mid-market price of the Company’s shares on the three dealing days prior to invitation (20-day average to the day before grant in France and the higher of the mid-market average price on the day before invitation and the mid-market average on the day before grant in the US). In common with most plans of this type, there are no performance conditions applicable to options granted under the SAYE.
Name of Director
Options held at
30 April 2020
Options granted during
the year
Options exercised
during the yearOptions lapsed
during the year
Market price on date of exercise
(p)Options held at
30 April 2021Exercise price
(p)
Date from which exercisable Expiry date
Miles Roberts 2,899 - – 2,899 – – 310.351 1 Apr 20 30 Sep 20Miles Roberts - 2,769 – – – 2,769 325.00 1 Apr 24 30 Sep 24Adrian Marsh 2,899 - – 2,899 – – 310.351 1 Apr 20 30 Sep 20Adrian Marsh - 2,769 – – – 2,769 325.00 1 Apr 24 30 Sep 24
1. Exercise price after adjusted for rights issue
Share ownership guidelinesExecutive Directors are required to build a significant shareholding in the Company within five years from the date of their appointment. Executive Directors’ shareholdings (including those of their connected persons) are summarised in the following audited table.
Name of Director
Total shareholding as at
30 April 2020
Total shareholding as at
30 April 2021
Unvested only subject to continued
employment1Vested awards
(not exercised)2
Shareholding required
(% salary)
Shareholding at 30 April 2021
(% salary)3Requirement
met
Executive Directors Miles Roberts 1,989,927 1,989,927 159,261 335,255 225% 1,317% YesAdrian Marsh 521,996 577,889 75,052 0 175% 551% Yes
1. Includes the deferred bonus shares awards granted in 2018 and 2019. A reduction to the gross award levels of 47% has been applied for the expected level of tax and social security deductions that will ultimately be due on these shares.
2. The awards granted on 1 July 2016 and 18 July 2017 which have now vested but have not been exercised by Miles Roberts. A reduction to the gross award levels of 47% has been applied for the expected level of tax and social security deductions that will ultimately be due on these shares.
3. Based on the salary as at 30 April 2021 and a share price of 420.8p (being the closing price on 30 April 2021) multiplied by the current year shareholding and interests in shares which count towards the shareholding requirement.
The PSP awards granted in 2019 and 2020 are unvested and remain subject to performance conditions so are not included in the above table as they do not count towards the shareholding requirement. Nil-cost options which have vested but have yet to be exercised are considered to count towards the shareholding requirement, other than any such shares that correspond to the estimated tax and national insurance contributions. Adrian Marsh as at 30 April 2021 did not hold any such vested but unexercised awards; but Miles Roberts did.Failure to meet the minimum shareholding requirement is taken into account when determining eligibility for share-based incentive awards for Executive Directors. There have been no changes to the shareholdings set out above between the financial year-end and the date of this report.
GOVERNANCE
Annual Report 2021 dssmith.com 101

Non-Executive Directors are required to build up a holding of 50% of their fees in shares within two years of their date of appointment. Non-Executive Directors’ shareholdings (including those of their connected persons) are summarised in the following audited table:
Name of Director
Total shareholding as at
30 April 2020
Total shareholding as at
30 April 2021Shareholding required
(% fee)
Shareholding at 30 April 2021
(% fee)1Requirement
met
Non-Executive Directors Geoff Drabble2 – 60,000 50% 77% Yes2
Gareth Davis3 136,054 not applicable not applicable – –Celia Baxter4 10,993 10,993 50% 61% Yes4
Chris Britton5 13,427 not applicable not applicable – –Alina Kessel6 – 7,000 50% 49% not yet applicable6
David Robbie 20,000 20,000 50% 111% YesLouise Smalley 18,600 18,600 50% 129% YesRupert Soames 28,800 28,800 50% 172% Yes
1. Based on the fee as at 30 April 2021 and a share price of 420.8p (being the closing price on 30 April 2021) multiplied by the current year shareholding and interests in shares which count towards the shareholding requirement.
2. Geoff Drabble joined the Board with effect from 1 September 2020 and became Chairman with effect from 3 January 2021. He has not yet been on the Board for two years.
3. Gareth Davis stepped down from the Board with effect from 3 January 2021. At that date his shareholding was 136,054 shares.4. Celia Baxter joined the Board with effect from 9 October 2019. She has not yet been on the Board for two years.5. Chris Britton stepped down from the Board with effect from 8 September 2021. At that date his shareholding was 13,427 shares.6. Alina Kessel joined the Board with effect from 1 May 2020. She has not yet been on the Board for two years.
External appointmentsThe Board supports Executive Directors taking up appointments outside the Company to broaden their knowledge and experience. Each Executive Director is permitted to accept one non-executive appointment (or in exceptional circumstances two appointments) from which they may retain any fee. Any external appointment must not conflict with a Director’s duties and commitments to DS Smith.Miles Roberts is a non-executive director of Aggreko plc and retained fees of £61,000 for the year ended 30 April 2021 (£61,000 for the year ended 30 April 2020). Adrian Marsh is a non-executive director of John Wood Group PLC and retained fees of £61,975 for the year ended 30 April 2021 (£56,557 for the year ended 30 April 2020).
Directors’ contracts and notice periods
Date of contract/date of initial appointment to the Board
Expiry date of current term for Non-Executive Directors
Geoff Drabble Chairman 1 September 2020 31 August 2023Miles Roberts Group Chief Executive 4 May 2010 not applicableAdrian Marsh Group Finance Director 24 September 2013 not applicableCelia Baxter Chairman of Remuneration Committee 9 October 2019 8 October 2022Alina Kessel 1 May 2020 30 April 2023David Robbie Chairman of Audit Committee 11 April 2019 10 April 2022Louise Smalley 23 June 2014 22 June 2022Rupert Soames Senior Independent Director 1 March 2019 28 February 2022
Miles Roberts and Adrian Marsh each have a notice period of 12 months exercisable by either the Company or the individual. Non-Executive Directors have letters of appointment for an initial term of three years whereupon they are normally renewed. The current terms of the Non-Executive Directors are set out in the table above. The notice period is one month exercisable by either the Company or the Non-Executive Director. Non-Executive Directors are not eligible for payments on termination. In line with the UK Corporate Governance Code, all Directors (including Non-Executive Directors) are subject to annual re-election by shareholders at the AGM. Their letters of appointment detail the time commitment expected of each Non-Executive Director. Both these and the Executive Directors’ service contracts are available for inspection at the registered office during normal business hours and at each AGM.
Payments to past Directors or for loss of office (audited)No payments were made to past Executive Directors during the year ended 30 April 2021 (2019/20: Nil). No payments were made in respect of loss of office during the year ended 30 April 2021 (2019/20: Nil).
102
ANNUAL REPORT ON REMUNERATION CONTINUED
Relative importance of spend on payThe table below shows the expenditure and percentage change in overall spend on employee remuneration and dividends.
2020/21
£m2019/20
£mPercentage
change
Overall expenditure on employee pay1 1,363 1,312 3.9%Dividend paid during the year 0 222 n/a1. Total remuneration reflects overall employee costs and includes some exchange rate fluctuation. See consolidated financial statements note 6 for further
information.
Remuneration of the Group Chief ExecutiveThe table below shows the total remuneration figure for the Group Chief Executive for each of the last ten financial years. The total remuneration figure includes the annual bonus and long-term incentive awards which vested, based on performance in those years. The annual bonus and long-term incentive awards percentages show the payout for each year as a percentage of the maximum available for the financial year.
2011/12 2012/13 2013/14 2014/15 2015/16 2016/17 2017/18 2018/19 2019/201 2020/21
Total remuneration (£’000) 2,170 6,057 3,696 5,527 4,447 4,861 4,220 3,065 1,422 2,525Annual bonus 100% 82% 85% 88% 79% 45% 88% 74% 0% 98%Long-term incentive vesting 100% 100% 98% 92% 94% 100% 93% 52% 35% 0%
1. The 2019/20 figure has been restated to include the actual share price on the next working day following the date of vesting on Saturday 18 July 2020 for the options vesting under the 2017/18 PSP award now that this is known.
2120191817161514131211
100
200
300
400
500
0
DS Smith FTSE 100 FTSE 250
Total shareholder return +311%
Review of past performance — total shareholder return graphThe graph above illustrates the Company’s TSR performance since 1 May 2011 (the period required by the applicable regulations), relative to the FTSE 100 Index as well as the FTSE 250 Index. In December 2017 the Company joined the FTSE 100 Index from the FTSE 250 Index. Therefore, both indices are considered appropriate comparator indices for the Company. As at 30 April 2021 DS Smith ranked 87 by market capitalisation. This graph looks at the value, over the ten years to 30 April 2021, of an initial investment of £100 in DS Smith shares compared with that of £100 invested in both the FTSE 100 and FTSE 250 Index. The other points plotted are the values at intervening financial year ends.
GOVERNANCE
Annual Report 2021 dssmith.com 103
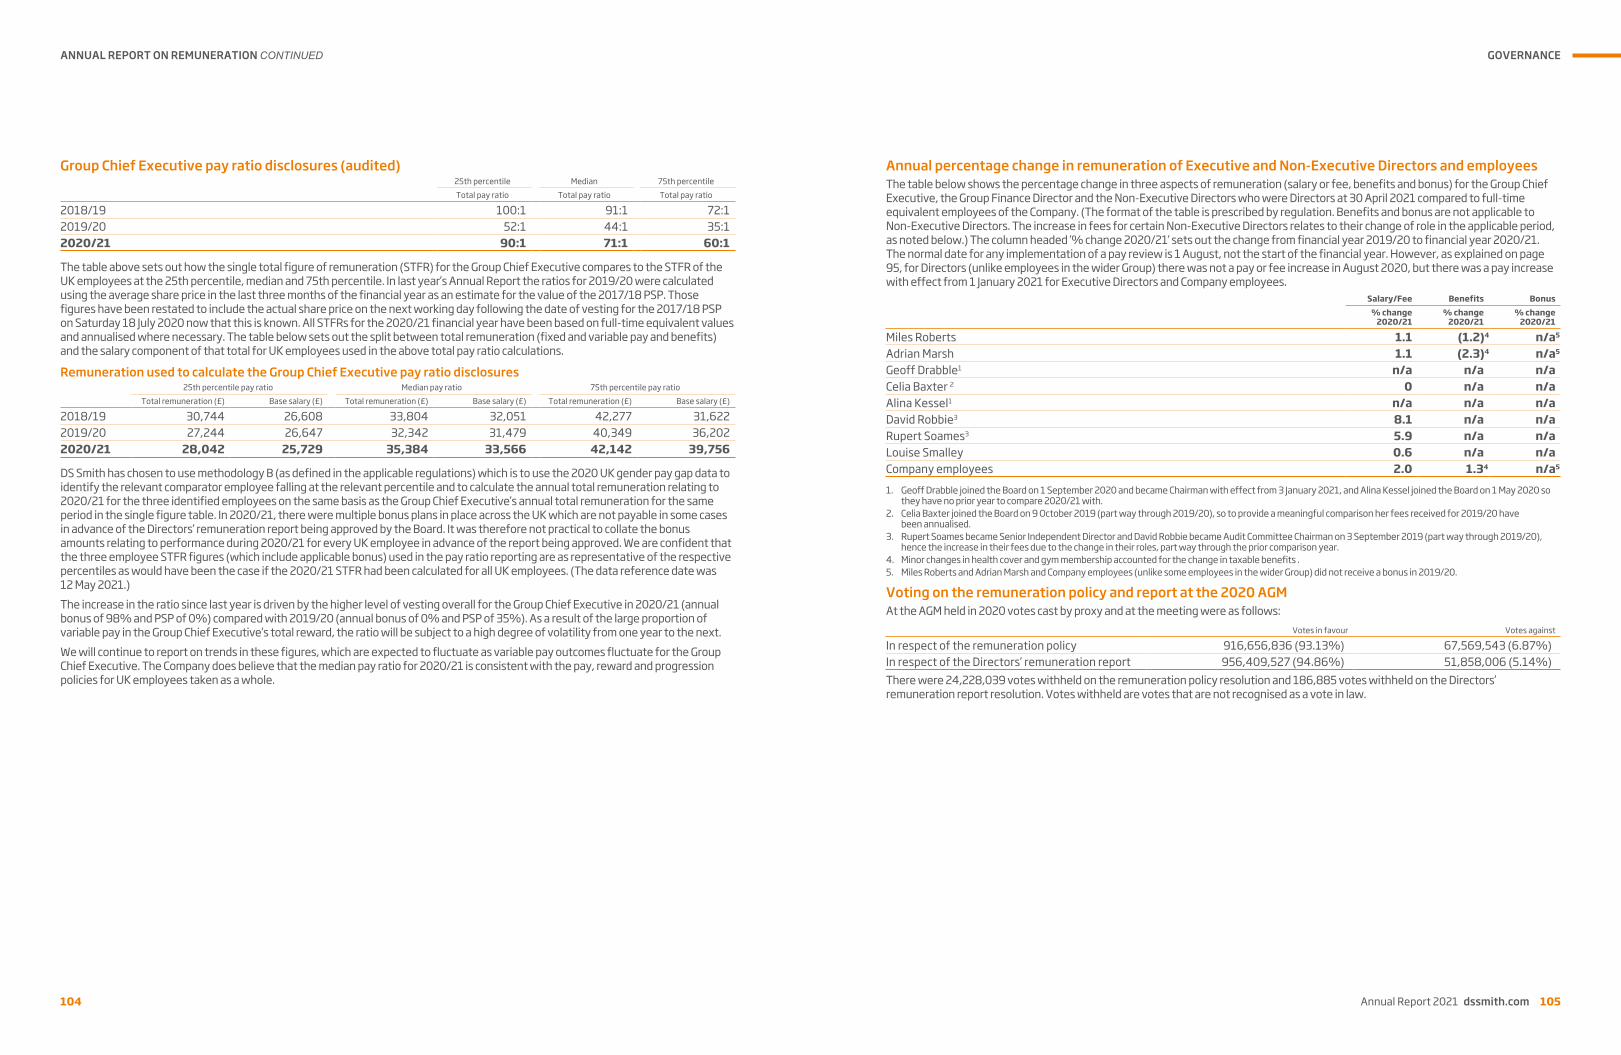
Group Chief Executive pay ratio disclosures (audited)
25th percentile Median 75th percentileTotal pay ratio Total pay ratio Total pay ratio
2018/19 100:1 91:1 72:12019/20 52:1 44:1 35:12020/21 90:1 71:1 60:1
The table above sets out how the single total figure of remuneration (STFR) for the Group Chief Executive compares to the STFR of the UK employees at the 25th percentile, median and 75th percentile. In last year’s Annual Report the ratios for 2019/20 were calculated using the average share price in the last three months of the financial year as an estimate for the value of the 2017/18 PSP. Those figures have been restated to include the actual share price on the next working day following the date of vesting for the 2017/18 PSP on Saturday 18 July 2020 now that this is known. All STFRs for the 2020/21 financial year have been based on full-time equivalent values and annualised where necessary. The table below sets out the split between total remuneration (fixed and variable pay and benefits) and the salary component of that total for UK employees used in the above total pay ratio calculations.
Remuneration used to calculate the Group Chief Executive pay ratio disclosures
25th percentile pay ratio Median pay ratio 75th percentile pay ratio
Total remuneration (£) Base salary (£) Total remuneration (£) Base salary (£) Total remuneration (£) Base salary (£)
2018/19 30,744 26,608 33,804 32,051 42,277 31,622 2019/20 27,244 26,647 32,342 31,479 40,349 36,202 2020/21 28,042 25,729 35,384 33,566 42,142 39,756
DS Smith has chosen to use methodology B (as defined in the applicable regulations) which is to use the 2020 UK gender pay gap data to identify the relevant comparator employee falling at the relevant percentile and to calculate the annual total remuneration relating to 2020/21 for the three identified employees on the same basis as the Group Chief Executive’s annual total remuneration for the same period in the single figure table. In 2020/21, there were multiple bonus plans in place across the UK which are not payable in some cases in advance of the Directors’ remuneration report being approved by the Board. It was therefore not practical to collate the bonus amounts relating to performance during 2020/21 for every UK employee in advance of the report being approved. We are confident that the three employee STFR figures (which include applicable bonus) used in the pay ratio reporting are as representative of the respective percentiles as would have been the case if the 2020/21 STFR had been calculated for all UK employees. (The data reference date was 12 May 2021.)The increase in the ratio since last year is driven by the higher level of vesting overall for the Group Chief Executive in 2020/21 (annual bonus of 98% and PSP of 0%) compared with 2019/20 (annual bonus of 0% and PSP of 35%). As a result of the large proportion of variable pay in the Group Chief Executive’s total reward, the ratio will be subject to a high degree of volatility from one year to the next.We will continue to report on trends in these figures, which are expected to fluctuate as variable pay outcomes fluctuate for the Group Chief Executive. The Company does believe that the median pay ratio for 2020/21 is consistent with the pay, reward and progression policies for UK employees taken as a whole.
104
ANNUAL REPORT ON REMUNERATION CONTINUED
Annual percentage change in remuneration of Executive and Non-Executive Directors and employeesThe table below shows the percentage change in three aspects of remuneration (salary or fee, benefits and bonus) for the Group Chief Executive, the Group Finance Director and the Non-Executive Directors who were Directors at 30 April 2021 compared to full-time equivalent employees of the Company. (The format of the table is prescribed by regulation. Benefits and bonus are not applicable to Non-Executive Directors. The increase in fees for certain Non-Executive Directors relates to their change of role in the applicable period, as noted below.) The column headed ’% change 2020/21’ sets out the change from financial year 2019/20 to financial year 2020/21. The normal date for any implementation of a pay review is 1 August, not the start of the financial year. However, as explained on page 95, for Directors (unlike employees in the wider Group) there was not a pay or fee increase in August 2020, but there was a pay increase with effect from 1 January 2021 for Executive Directors and Company employees.
Salary/Fee Benefits Bonus
% change
2020/21% change
2020/21% change
2020/21
Miles Roberts 1.1 (1.2)4 n/a5
Adrian Marsh 1.1 (2.3)4 n/a5
Geoff Drabble1 n/a n/a n/aCelia Baxter 2 0 n/a n/aAlina Kessel1 n/a n/a n/aDavid Robbie3 8.1 n/a n/aRupert Soames3 5.9 n/a n/aLouise Smalley 0.6 n/a n/aCompany employees 2.0 1.34 n/a5
1. Geoff Drabble joined the Board on 1 September 2020 and became Chairman with effect from 3 January 2021, and Alina Kessel joined the Board on 1 May 2020 so they have no prior year to compare 2020/21 with.
2. Celia Baxter joined the Board on 9 October 2019 (part way through 2019/20), so to provide a meaningful comparison her fees received for 2019/20 have been annualised.
3. Rupert Soames became Senior Independent Director and David Robbie became Audit Committee Chairman on 3 September 2019 (part way through 2019/20), hence the increase in their fees due to the change in their roles, part way through the prior comparison year.
4. Minor changes in health cover and gym membership accounted for the change in taxable benefits .5. Miles Roberts and Adrian Marsh and Company employees (unlike some employees in the wider Group) did not receive a bonus in 2019/20.
Voting on the remuneration policy and report at the 2020 AGMAt the AGM held in 2020 votes cast by proxy and at the meeting were as follows:
Votes in favour Votes against
In respect of the remuneration policy 916,656,836 (93.13%) 67,569,543 (6.87%)In respect of the Directors’ remuneration report 956,409,527 (94.86%) 51,858,006 (5.14%)There were 24,228,039 votes withheld on the remuneration policy resolution and 186,885 votes withheld on the Directors’ remuneration report resolution. Votes withheld are votes that are not recognised as a vote in law.
GOVERNANCE
Annual Report 2021 dssmith.com 105

Remuneration Committee governanceThe Board is ultimately accountable for executive remuneration and delegates this responsibility to the Remuneration Committee. The Committee’s principal function is to support the Group’s strategy by ensuring that its delivery is underpinned by the Company’s overall remuneration policy, as described earlier in this report. It also determines the specific remuneration package, including service contracts and pension arrangements, for each Executive Director and our most senior executives, as well as the fees paid to the Chairman. The Remuneration Committee’s Terms of Reference can be found at www.dssmith.com/investors/corporate-governance/committees/
All members of the Committee are independent Non-Executive Directors. This is fundamental to ensuring Executive Directors’ and senior executives’ remuneration is set by people who are independent and have no personal financial interest, other than as shareholders, in the matters discussed. There are no potential conflicts of interest arising from cross-directorships and there is no day-to-day involvement in running the business. The Committee consults with the Group Chief Executive, who may attend meetings of the Committee, although he is not involved in deciding his own remuneration. The Committee is assisted by the Group Head of Reward, the Deputy Company Secretary, the Group General Counsel and Company Secretary and the Group Human Resources Director. No-one is allowed to participate in any matter directly concerning the details of their own remuneration or conditions of service.As described earlier in the report, the Company has discussed with the EWC Executive matters relating to Executive Directors’ remuneration. When considering matters relating to the remuneration of the Executive Directors, the Committee takes into account the overall approach to reward for, and the pay and employment conditions of, other employees in the Group.To differentiate our employee value proposition and reinforce our strong DS Smith culture, the Group has developed the DS Smith reward principles (set out on page 89) which are endorsed by the Committee and were last reviewed by the Committee in 2021. Current policies and future decision making are matched against these to drive continuous improvement in this area.
Members Since
Celia Baxter (Chairman since October 2019) 2019Geoff Drabble 2020Alina Kessel 2020David Robbie 2019Louise Smalley 2014Rupert Soames 2019
Chris Britton retired from the Board and its Committees on 8 September 2020. Gareth Davis retired from the Board and its Committees on 3 January 2021. Geoff Drabble joined the Committee on his appointment to the Board on 1 September 2020.Details of individual Directors’ attendance can be found on page 70. The Group General Counsel and Company Secretary acts as Secretary to the Committee.
Key responsibilities of the Remuneration Committee• Designing the remuneration policy• Implementing the remuneration policy• Ensuring the competitiveness of reward, within an
appropriate governance framework• Designing the incentive plans• Setting incentive targets and determining award levels• Overseeing all share awards across the Group.Each of these responsibilities impacts the other. The Committee is very conscious of the importance of the wider context in which it operates in discharging these responsibilities.
106
ANNUAL REPORT ON REMUNERATION CONTINUED
Topics considered as part of regular annual decision-making cycle of Remuneration Committee• How the business has performed• Forecasts for the year to come• Feedback from both the employee survey and pulse surveys on how employees feel about the quality of the Group’s leadership. This
includes whether the leadership team continues to demonstrate living our values, how we measure employee performance and whether employees believe we have the right approach to reward
• Review of guidance from the government and investor bodies• Holistic view of market practices• Assessing whether our remuneration framework is appropriately aligned with our culture and continues to motivate our leaders to
achieve the Group’s strategic objectives and does not inadvertently motivate inappropriate behaviour giving rise to environmental, social, governance or other risks
• Consideration of remuneration and related policies across the Group • Discussion of the relevant aspects of this year’s Board effectiveness review.In January 2021, following a thorough tender process, Korn Ferry were appointed as the Committee’s advisers. During the financial year of 2020/21 the Committee was advised by Korn Ferry in relation to various aspects of the remuneration of Executive Directors for which they were paid £8,250, partly on a fixed fee basis and partly on a time and materials basis. Korn Ferry in the financial year 2020/21 has also provided executive search and talent assessment services to the Group. The teams providing this advice are separate from the Remuneration Committee advisers and there was no conflict of interest. During the financial year of 2020/21 the Committee was also advised by PricewaterhouseCoopers LLP (PwC) on the remuneration of Executive Directors and other senior executives. PwC had been appointed by the Committee as its advisers in January 2018. The total fees in respect of PwC’s services to the Remuneration Committee during the year were £4,000. These fees were incurred on a time and materials basis. PwC provided advice to the Company in connection with the accounting charge for the Company’s share-based incentive plans and to different parts of the Group on tax and other advisory and consultancy matters. The teams providing this advice are separate from the Remuneration Committee advisers and there was no conflict of interest. The Committee is satisfied that the advice it receives from its advisers is objective and independent. Korn Ferry and PwC are both members of the Remuneration Consultants Group and adhere to the Code of Conduct for Remuneration Consultants (which can be found at www.remunerationconsultantsgroup.com).This report has been prepared in accordance with applicable legislation and regulatory requirements, including those of the Large and Medium-Sized Companies and Groups (Accounts and Reports) (Amendment) Regulations 2013 (Regulations). The Regulations require the Auditor to report to shareholders on the audited information within this report and to state whether, in their opinion, the relevant sections have been prepared in accordance with the Companies Act 2006. The Auditor’s opinion is set out in the Independent Auditor’s report and we have clearly marked the audited sections of this annual report on remuneration.On behalf of the BoardCelia BaxterChairman of the Remuneration Committee
21 June 2021
GOVERNANCE
Annual Report 2021 dssmith.com 107
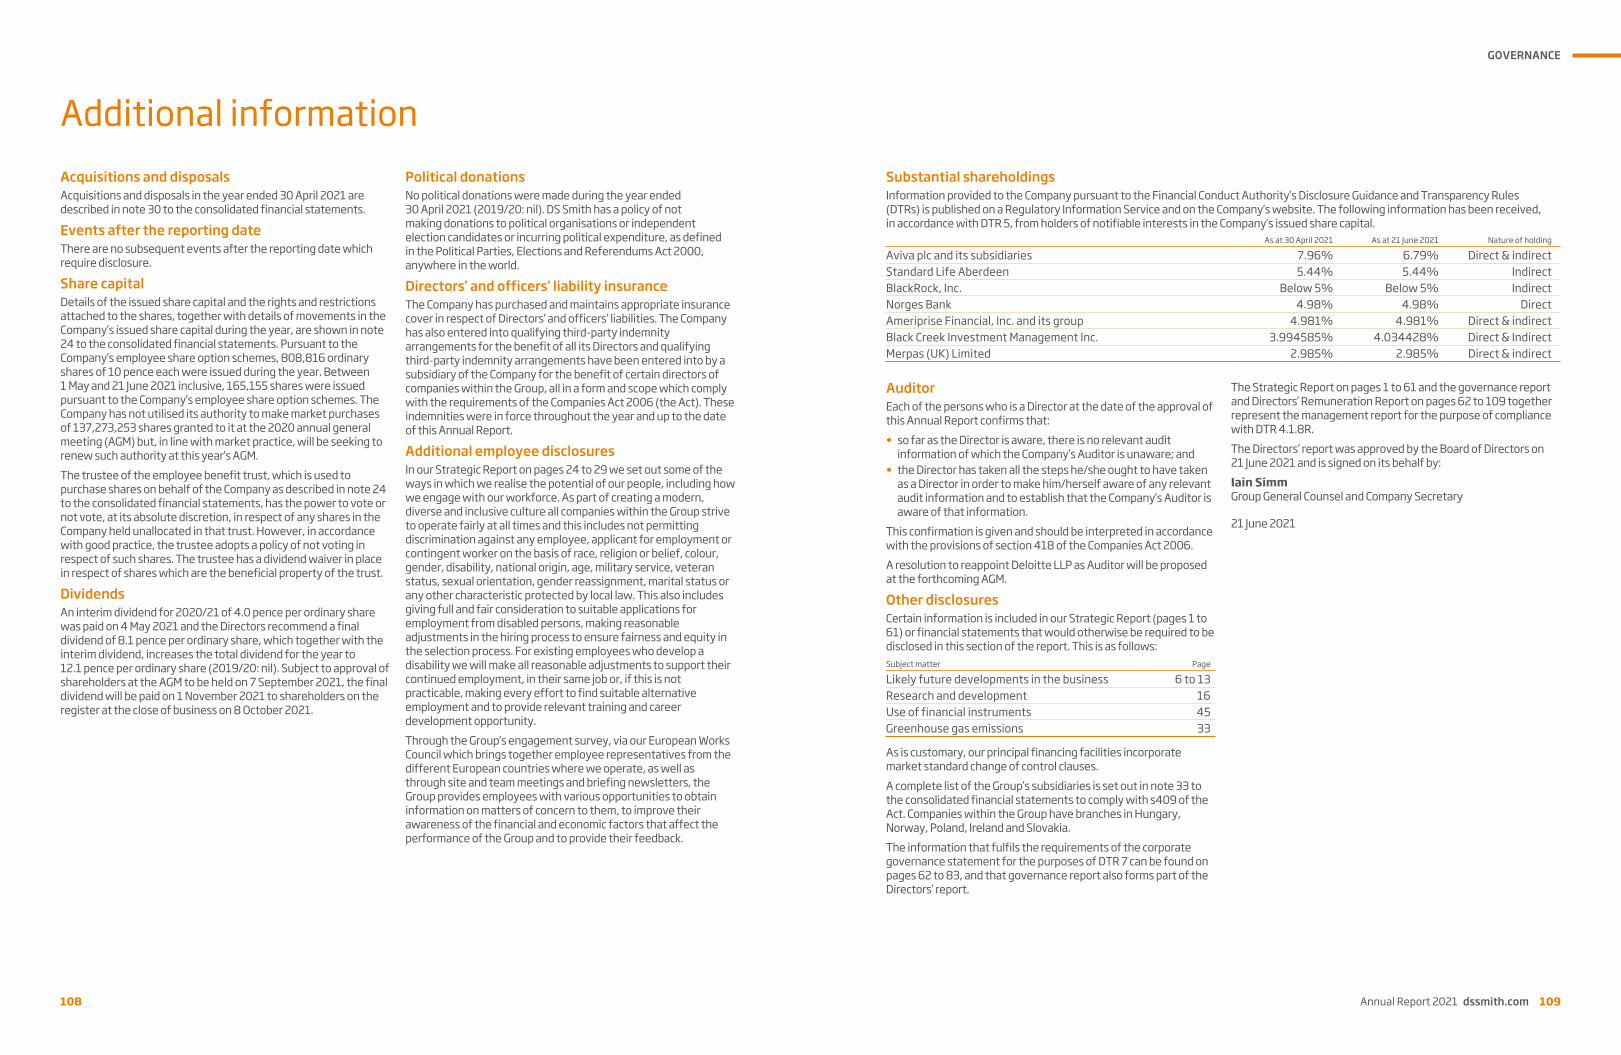
Acquisitions and disposalsAcquisitions and disposals in the year ended 30 April 2021 are described in note 30 to the consolidated financial statements.
Events after the reporting dateThere are no subsequent events after the reporting date which require disclosure.
Share capitalDetails of the issued share capital and the rights and restrictions attached to the shares, together with details of movements in the Company’s issued share capital during the year, are shown in note 24 to the consolidated financial statements. Pursuant to the Company’s employee share option schemes, 808,816 ordinary shares of 10 pence each were issued during the year. Between 1 May and 21 June 2021 inclusive, 165,155 shares were issued pursuant to the Company’s employee share option schemes. The Company has not utilised its authority to make market purchases of 137,273,253 shares granted to it at the 2020 annual general meeting (AGM) but, in line with market practice, will be seeking to renew such authority at this year’s AGM. The trustee of the employee benefit trust, which is used to purchase shares on behalf of the Company as described in note 24 to the consolidated financial statements, has the power to vote or not vote, at its absolute discretion, in respect of any shares in the Company held unallocated in that trust. However, in accordance with good practice, the trustee adopts a policy of not voting in respect of such shares. The trustee has a dividend waiver in place in respect of shares which are the beneficial property of the trust.
DividendsAn interim dividend for 2020/21 of 4.0 pence per ordinary share was paid on 4 May 2021 and the Directors recommend a final dividend of 8.1 pence per ordinary share, which together with the interim dividend, increases the total dividend for the year to 12.1 pence per ordinary share (2019/20: nil). Subject to approval of shareholders at the AGM to be held on 7 September 2021, the final dividend will be paid on 1 November 2021 to shareholders on the register at the close of business on 8 October 2021.
Political donationsNo political donations were made during the year ended 30 April 2021 (2019/20: nil). DS Smith has a policy of not making donations to political organisations or independent election candidates or incurring political expenditure, as defined in the Political Parties, Elections and Referendums Act 2000, anywhere in the world.
Directors’ and officers’ liability insuranceThe Company has purchased and maintains appropriate insurance cover in respect of Directors’ and officers’ liabilities. The Company has also entered into qualifying third-party indemnity arrangements for the benefit of all its Directors and qualifying third-party indemnity arrangements have been entered into by a subsidiary of the Company for the benefit of certain directors of companies within the Group, all in a form and scope which comply with the requirements of the Companies Act 2006 (the Act). These indemnities were in force throughout the year and up to the date of this Annual Report.
Additional employee disclosuresIn our Strategic Report on pages 24 to 29 we set out some of the ways in which we realise the potential of our people, including how we engage with our workforce. As part of creating a modern, diverse and inclusive culture all companies within the Group strive to operate fairly at all times and this includes not permitting discrimination against any employee, applicant for employment or contingent worker on the basis of race, religion or belief, colour, gender, disability, national origin, age, military service, veteran status, sexual orientation, gender reassignment, marital status or any other characteristic protected by local law. This also includes giving full and fair consideration to suitable applications for employment from disabled persons, making reasonable adjustments in the hiring process to ensure fairness and equity in the selection process. For existing employees who develop a disability we will make all reasonable adjustments to support their continued employment, in their same job or, if this is not practicable, making every effort to find suitable alternative employment and to provide relevant training and career development opportunity. Through the Group’s engagement survey, via our European Works Council which brings together employee representatives from the different European countries where we operate, as well as through site and team meetings and briefing newsletters, the Group provides employees with various opportunities to obtain information on matters of concern to them, to improve their awareness of the financial and economic factors that affect the performance of the Group and to provide their feedback.
108
Additional informationSubstantial shareholdingsInformation provided to the Company pursuant to the Financial Conduct Authority’s Disclosure Guidance and Transparency Rules (DTRs) is published on a Regulatory Information Service and on the Company’s website. The following information has been received, in accordance with DTR 5, from holders of notifiable interests in the Company’s issued share capital.
As at 30 April 2021 As at 21 June 2021 Nature of holding
Aviva plc and its subsidiaries 7.96% 6.79% Direct & indirectStandard Life Aberdeen 5.44% 5.44% IndirectBlackRock, Inc. Below 5% Below 5% IndirectNorges Bank 4.98% 4.98% DirectAmeriprise Financial, Inc. and its group 4.981% 4.981% Direct & indirectBlack Creek Investment Management Inc. 3.994585% 4.034428% Direct & IndirectMerpas (UK) Limited 2.985% 2.985% Direct & indirect
AuditorEach of the persons who is a Director at the date of the approval of this Annual Report confirms that:• so far as the Director is aware, there is no relevant audit
information of which the Company’s Auditor is unaware; and• the Director has taken all the steps he/she ought to have taken
as a Director in order to make him/herself aware of any relevant audit information and to establish that the Company’s Auditor is aware of that information.
This confirmation is given and should be interpreted in accordance with the provisions of section 418 of the Companies Act 2006.A resolution to reappoint Deloitte LLP as Auditor will be proposed at the forthcoming AGM.
Other disclosuresCertain information is included in our Strategic Report (pages 1 to 61) or financial statements that would otherwise be required to be disclosed in this section of the report. This is as follows:Subject matter Page
Likely future developments in the business 6 to 13Research and development 16Use of financial instruments 45Greenhouse gas emissions 33
As is customary, our principal financing facilities incorporate market standard change of control clauses.A complete list of the Group’s subsidiaries is set out in note 33 to the consolidated financial statements to comply with s409 of the Act. Companies within the Group have branches in Hungary, Norway, Poland, Ireland and Slovakia. The information that fulfils the requirements of the corporate governance statement for the purposes of DTR 7 can be found on pages 62 to 83, and that governance report also forms part of the Directors’ report.
The Strategic Report on pages 1 to 61 and the governance report and Directors’ Remuneration Report on pages 62 to 109 together represent the management report for the purpose of compliance with DTR 4.1.8R.The Directors’ report was approved by the Board of Directors on 21 June 2021 and is signed on its behalf by:Iain SimmGroup General Counsel and Company Secretary
21 June 2021
GOVERNANCE
Annual Report 2021 dssmith.com 109

110
Directors’ responsibilitiesThe Directors are responsible for preparing the Annual Report and the financial statements in accordance with applicable law and regulations.Company law requires the Directors to prepare such financial statements for each financial year. Under that law the Directors are required to prepare the Group financial statements in accordance with international accounting standards in conformity with the requirements of the Companies Act 2006 and International Financial Reporting Standards (IFRSs) adopted pursuant to Regulation (EC) No 1606/2002 as it applies in the European Union. The Group financial statements also comply with International Financial Reporting Standards as issued by the International Accounting Standards Board ( IASB). The Directors have also chosen to prepare the parent Company financial statements in accordance with Financial Reporting Standard 101 Reduced Disclosure Framework. Under company law the Directors must not approve the financial statements unless they are satisfied that they give a true and fair view of the state of affairs of the Company and of the profit or loss of the Company for that period.In preparing the parent Company financial statements, the Directors are required to:• select suitable accounting policies and then apply them
consistently;• make judgements and accounting estimates that are reasonable
and prudent;• state whether Financial Reporting Standard 101 Reduced
Disclosure Framework has been followed, subject to any material departures disclosed and explained in the financial statements; and
• prepare the financial statements on the going concern basis unless it is inappropriate to presume that the Company will continue in business.
In preparing the Group financial statements, International Accounting Standard 1 requires that Directors:• properly select and apply accounting policies;• present information, including accounting policies, in a
manner that provides relevant, reliable, comparable and understandable information;
• provide additional disclosures when compliance with the specific requirements in IFRSs is insufficient to enable users to understand the impact of particular transactions, other events and conditions on the entity’s financial position and financial performance; and
• make an assessment of the Company’s ability to continue as a going concern.
The Directors are responsible for keeping adequate accounting records that are sufficient to show and explain the Company’s transactions and disclose with reasonable accuracy at any time the financial position of the Company and enable them to ensure that the financial statements comply with the Companies Act 2006. They are also responsible for safeguarding the assets of the Company and hence for taking reasonable steps for the prevention and detection of fraud and other irregularities.The Directors are responsible for the maintenance and integrity of the corporate and financial information included on the Company’s website. Legislation in the UK governing the preparation and dissemination of financial statements may differ from legislation in other jurisdictions.
Directors’ responsibility statementWe confirm that to the best of our knowledge:• the financial statements, prepared in accordance with the
relevant financial reporting framework, give a true and fair view of the assets, liabilities, financial position and profit or loss of the Company and the undertakings included in the consolidation taken as a whole;
• the Strategic Report includes a fair review of the development and performance of the business and the position of the Company and the undertakings included in the consolidation taken as a whole, together with a description of the principal risks and uncertainties that they face; and
• the Annual Report and financial statements, taken as a whole, are fair, balanced and understandable and provide the information necessary for shareholders to assess the Company’s position, performance, business model and strategy.
This responsibility statement was approved by the Board of Directors on 21 June 2021 and is signed on its behalf by:Miles RobertsGroup Chief Executive
21 June 2021
Adrian MarshGroup Finance Director
21 June 2021
FINANCIAL STATEMENTS
Annual Report 2021 dssmith.com 111
Independent Auditor’s report to the members of DS Smith Plc
Annual Report 2021 dssmith.com 111
Report on the audit of the financial statements 1. Opinion In our opinion: • the financial statements of DS Smith Plc (the ‘parent Company’) and its subsidiaries (the ‘Group’) give a true and fair view of the state of the
Group’s and of the parent Company’s affairs as at 30 April 2021 and of the Group’s profit for the year then ended; • the Group financial statements have been properly prepared in accordance with international accounting standards in conformity with the
requirements of the Companies Act 2006, International Financial Reporting Standards (IFRSs) as adopted by the European Union and IFRSs as issued by the International Accounting Standards Board (IASB);
• the parent Company financial statements have been properly prepared in accordance with United Kingdom Generally Accepted Accounting Practice, including Financial Reporting Standard 101 Reduced Disclosure Framework; and
• the financial statements have been prepared in accordance with the requirements of the Companies Act 2006.
We have audited the financial statements which comprise : • the consolidated income statement; • the consolidated statement of comprehensive income; • the consolidated and parent Company balance sheets; • the consolidated and parent Company statements of changes in equity; • the consolidated cash flow statement; • the related notes 1 to 34 to the consolidated financial statements; and • the related notes 1 to 16 to the parent Company financial statements.
The financial reporting framework that has been applied in the preparation of the Group financial statements is applicable law, international accounting standards in conformity with the requirements of the Companies Act 2006 and IFRSs as adopted by the European Union and IFRSs as issued by the International Accounting Standards Board (IASB). The financial reporting framework that has been applied in the preparation of the parent Company financial statements is applicable law and United Kingdom Accounting Standards, including FRS 101Reduced Disclosure Framework (United Kingdom Generally Accepted Accounting Practice).
2. Basis for opinion We conducted our audit in accordance with International Standards on Auditing (UK) (ISAs (UK)) and applicable law. Our responsibilities under those standards are further described in the auditor’s responsibilities for the audit of the financial statements section of our report. We are independent of the Group and the parent Company in accordance with the ethical requirements that are relevant to our audit of the financial statements in the UK, including the Financial Reporting Council’s (the ‘FRC’s’) Ethical Standard as applied to listed public interest entities, and we have fulfilled our other ethical responsibilities in accordance with these requirements. The non-audit services provided to the Group and parent Company for the year are disclosed in note 3 to the financial statements. We confirm that the non-audit services prohibited by the FRC’s Ethical Standard were not provided to the Group or the parent Company. We believe that the audit evidence we have obtained is sufficient and appropriate to provide a basis for our opinion.
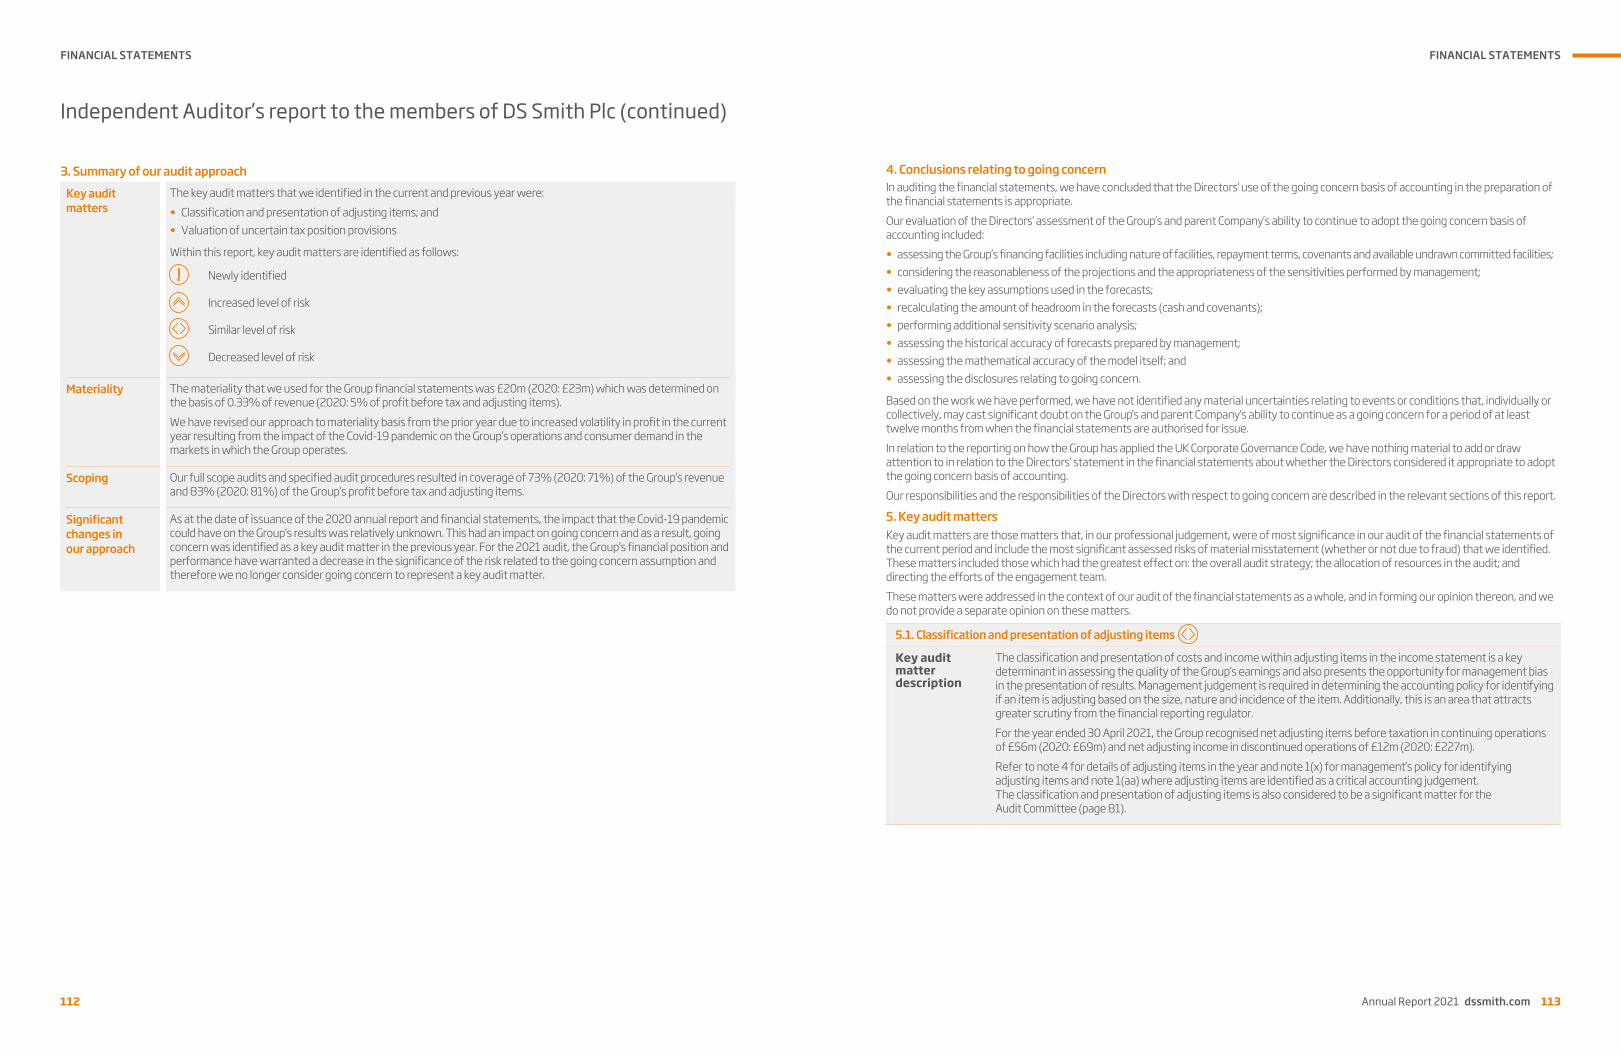
FINANCIAL STATEMENTS
112
Independent Auditor’s report to the members of DS Smith Plc (continued)
112
3. Summary of our audit approach
Key audit matters
The key audit matters that we identified in the current and previous year were:• Classification and presentation of adjusting items; and • Valuation of uncertain tax position provisions
Within this report, key audit matters are identified as follows:
Newly identified
Increased level of risk
Similar level of risk
Decreased level of risk
Materiality The materiality that we used for the Group financial statements was £20m (2020: £23m) which was determined on the basis of 0.33% of revenue (2020: 5% of profit before tax and adjusting items). We have revised our approach to materiality basis from the prior year due to increased volatility in profit in the current year resulting from the impact of the Covid-19 pandemic on the Group’s operations and consumer demand in the markets in which the Group operates.
Scoping Our full scope audits and specified audit procedures resulted in coverage of 73% (2020: 71%) of the Group’s revenue and 83% (2020: 81%) of the Group’s profit before tax and adjusting items.
Significant changes in our approach
As at the date of issuance of the 2020 annual report and financial statements, the impact that the Covid-19 pandemic could have on the Group’s results was relatively unknown. This had an impact on going concern and as a result, going concern was identified as a key audit matter in the previous year. For the 2021 audit, the Group’s financial position and performance have warranted a decrease in the significance of the risk related to the going concern assumption and therefore we no longer consider going concern to represent a key audit matter.
FINANCIAL STATEMENTS
Annual Report 2021 dssmith.com 113
Independent Auditor’s report to the members of DS Smith Plc (continued)
112
3. Summary of our audit approach
Key audit matters
The key audit matters that we identified in the current and previous year were:• Classification and presentation of adjusting items; and • Valuation of uncertain tax position provisions
Within this report, key audit matters are identified as follows:
Newly identified
Increased level of risk
Similar level of risk
Decreased level of risk
Materiality The materiality that we used for the Group financial statements was £20m (2020: £23m) which was determined on the basis of 0.33% of revenue (2020: 5% of profit before tax and adjusting items). We have revised our approach to materiality basis from the prior year due to increased volatility in profit in the current year resulting from the impact of the Covid-19 pandemic on the Group’s operations and consumer demand in the markets in which the Group operates.
Scoping Our full scope audits and specified audit procedures resulted in coverage of 73% (2020: 71%) of the Group’s revenue and 83% (2020: 81%) of the Group’s profit before tax and adjusting items.
Significant changes in our approach
As at the date of issuance of the 2020 annual report and financial statements, the impact that the Covid-19 pandemic could have on the Group’s results was relatively unknown. This had an impact on going concern and as a result, going concern was identified as a key audit matter in the previous year. For the 2021 audit, the Group’s financial position and performance have warranted a decrease in the significance of the risk related to the going concern assumption and therefore we no longer consider going concern to represent a key audit matter.
Annual Report 2021 dssmith.com 113
4. Conclusions relating to going concern In auditing the financial statements, we have concluded that the Directors’ use of the going concern basis of accounting in the preparation of the financial statements is appropriate. Our evaluation of the Directors’ assessment of the Group’s and parent Company’s ability to continue to adopt the going concern basis of accounting included: • assessing the Group’s financing facilities including nature of facilities, repayment terms, covenants and available undrawn committed facilities; • considering the reasonableness of the projections and the appropriateness of the sensitivities performed by management; • evaluating the key assumptions used in the forecasts; • recalculating the amount of headroom in the forecasts (cash and covenants); • performing additional sensitivity scenario analysis; • assessing the historical accuracy of forecasts prepared by management; • assessing the mathematical accuracy of the model itself; and • assessing the disclosures relating to going concern.
Based on the work we have performed, we have not identified any material uncertainties relating to events or conditions that, individually or collectively, may cast significant doubt on the Group's and parent Company’s ability to continue as a going concern for a period of at least twelve months from when the financial statements are authorised for issue. In relation to the reporting on how the Group has applied the UK Corporate Governance Code, we have nothing material to add or draw attention to in relation to the Directors’ statement in the financial statements about whether the Directors considered it appropriate to adopt the going concern basis of accounting. Our responsibilities and the responsibilities of the Directors with respect to going concern are described in the relevant sections of this report.
5. Key audit matters Key audit matters are those matters that, in our professional judgement, were of most significance in our audit of the financial statements of the current period and include the most significant assessed risks of material misstatement (whether or not due to fraud) that we identified. These matters included those which had the greatest effect on: the overall audit strategy; the allocation of resources in the audit; and directing the efforts of the engagement team. These matters were addressed in the context of our audit of the financial statements as a whole, and in forming our opinion thereon, and we do not provide a separate opinion on these matters.
5.1. Classification and presentation of adjusting items
Key audit matter description
The classification and presentation of costs and income within adjusting items in the income statement is a key determinant in assessing the quality of the Group’s earnings and also presents the opportunity for management bias in the presentation of results. Management judgement is required in determining the accounting policy for identifying if an item is adjusting based on the size, nature and incidence of the item. Additionally, this is an area that attracts greater scrutiny from the financial reporting regulator. For the year ended 30 April 2021, the Group recognised net adjusting items before taxation in continuing operations of £56m (2020: £69m) and net adjusting income in discontinued operations of £12m (2020: £227m). Refer to note 4 for details of adjusting items in the year and note 1(x) for management’s policy for identifying adjusting items and note 1(aa) where adjusting items are identified as a critical accounting judgement. The classification and presentation of adjusting items is also considered to be a significant matter for the Audit Committee (page 81).

FINANCIAL STATEMENTS
114
Independent Auditor’s report to the members of DS Smith Plc (continued)
114
How the scope of our audit responded to the key audit matter
As a response to the identified key audit matter, we performed the following audit procedures: • We obtained an understanding of relevant controls in respect of the classification and presentation of
adjusting items; • We considered and challenged the appropriateness and classification of the items which are included within
adjusting items by testing a sample and agreeing them back to relevant supporting documentation; • We tested and considered items within underlying results which may be adjusting by nature but not
separately identified; • We assessed the appropriateness of the adjusting items recorded in accordance with management’s policy and the
latest guidance from the FRC; and • We assessed the related disclosure in the Group financial statements for consistency with the prior period and
current market best practice.
Key observations
We are satisfied that the amounts classified as adjusting items are in accordance with the Group’s accounting policy and the related disclosure of these items in the financial statements is appropriate.
5.2. Valuation of uncertain tax position provisions
Key audit matter description
The value of the tax provisions against a number of uncertain tax positions requires judgement in relation to the likely outcome of negotiations with various tax authorities. Areas of particular focus included transfer pricing provisioning and other uncertain tax positions in the UK and overseas. Refer to note 1(w) for management’s process for estimating and recording tax provisions and note 1(z) for further detail in respect of the range of possible outcomes with regards to those uncertain tax positions. Taxation is also identified in note 1(z) as a key source of estimation uncertainty and to be a significant matter for the Audit Committee (page 81).
How the scope of our audit responded to the key audit matter
We obtained an understanding of relevant controls in respect of the provisioning for uncertain tax positions.We involved our tax specialists, including those in local jurisdictions as required, to challenge the estimates and judgements made by management when calculating the income tax payable in each territory and the associated provisions held in relation to tax exposures. This included consideration of tax exposures relating to transfer pricing and consideration of specific provisions made in relation to UK tax risks. Specifically, we have reviewed the correspondence with the taxation authorities in significant locations and the supporting evidence or opinions received from external counsel or other advisors where management has utilised such opinions to estimate the likely outcome of technical tax treatments in order to assess the reasonableness of the provisions made.
Key observations
We are satisfied that the estimates and judgements made by management used in calculating the tax charge and recording the associated tax provisions are reasonable.
FINANCIAL STATEMENTS
Annual Report 2021 dssmith.com 115
Independent Auditor’s report to the members of DS Smith Plc (continued)
114
How the scope of our audit responded to the key audit matter
As a response to the identified key audit matter, we performed the following audit procedures: • We obtained an understanding of relevant controls in respect of the classification and presentation of
adjusting items; • We considered and challenged the appropriateness and classification of the items which are included within
adjusting items by testing a sample and agreeing them back to relevant supporting documentation; • We tested and considered items within underlying results which may be adjusting by nature but not
separately identified; • We assessed the appropriateness of the adjusting items recorded in accordance with management’s policy and the
latest guidance from the FRC; and • We assessed the related disclosure in the Group financial statements for consistency with the prior period and
current market best practice.
Key observations
We are satisfied that the amounts classified as adjusting items are in accordance with the Group’s accounting policy and the related disclosure of these items in the financial statements is appropriate.
5.2. Valuation of uncertain tax position provisions
Key audit matter description
The value of the tax provisions against a number of uncertain tax positions requires judgement in relation to the likely outcome of negotiations with various tax authorities. Areas of particular focus included transfer pricing provisioning and other uncertain tax positions in the UK and overseas. Refer to note 1(w) for management’s process for estimating and recording tax provisions and note 1(z) for further detail in respect of the range of possible outcomes with regards to those uncertain tax positions. Taxation is also identified in note 1(z) as a key source of estimation uncertainty and to be a significant matter for the Audit Committee (page 81).
How the scope of our audit responded to the key audit matter
We obtained an understanding of relevant controls in respect of the provisioning for uncertain tax positions.We involved our tax specialists, including those in local jurisdictions as required, to challenge the estimates and judgements made by management when calculating the income tax payable in each territory and the associated provisions held in relation to tax exposures. This included consideration of tax exposures relating to transfer pricing and consideration of specific provisions made in relation to UK tax risks. Specifically, we have reviewed the correspondence with the taxation authorities in significant locations and the supporting evidence or opinions received from external counsel or other advisors where management has utilised such opinions to estimate the likely outcome of technical tax treatments in order to assess the reasonableness of the provisions made.
Key observations
We are satisfied that the estimates and judgements made by management used in calculating the tax charge and recording the associated tax provisions are reasonable.
Annual Report 2021 dssmith.com 115
6. Our application of materiality 6.1. Materiality We define materiality as the magnitude of misstatement in the financial statements that makes it probable that the economic decisions of a reasonably knowledgeable person would be changed or influenced. We use materiality both in planning the scope of our audit work and in evaluating the results of our work. Based on our professional judgement, we determined materiality for the financial statements as a whole as follows:
Group financial statements Parent Company financial statements
Materiality £20m (2020: £23m) £10.0m (2020: £8m)
Basis for determining materiality
We have used revenue as the benchmark in determining materiality (2020: profit before tax and adjusting items) and the materiality equates to 0.33% of revenue (2020: approximately 5% of profit before tax and adjusting items). The materiality equates to less than 1% (2020: less than 1%) of net assets. It also equates to approximately 7.0% of statutory profit before tax and adjusting items (2020: 5.3%).
Parent Company materiality equates to less than 1% (2020: less than 1%) of net assets, and is capped at 50% (2020: less than 50%) of Group materiality.
Rationale for the benchmark applied
In light of the impact of Covid-19 on the Group we consider revenue to be a more stable benchmark for the business this year given the Group has not significantly changed in size and scale during the current year. The profit-related benchmarks for the Group are impacted by Covid-19 and are volatile from one period to the next, and therefore they are not representative of the overall size of the business in the current year.
Net assets is typically considered an appropriate benchmark for materiality as the parent Company is the holding company, but given the quantum of net assets on the parent Company balance sheet, we have limited materiality to 40% of Group materiality.
6.2. Performance materiality We set performance materiality at a level lower than materiality to reduce the probability that, in aggregate, uncorrected and undetected misstatements exceed the materiality for the financial statements as a whole.
Group financial statements Parent Company financial statements
Performance materiality
65% (2020: 70%) of Group materiality 65% (2020: 70%) of parent Company materiality
Basis and rationale for determining performance materiality
We have determined performance materiality as 65% (2020 – 70%) of Group materiality to reflect a tolerable error due to Covid-19 and factoring in the risk of uncertainty due to the pandemic, we have also considered the basis of our risk assessment, our assessment of the Group’s control environment, the low number and quantum of corrected and uncorrected misstatements identified and management’s willingness to correct misstatements that may be identified. Accordingly, we set performance materiality for the Group at £13.0m (2020: £16m) and Parent Company at £6.5m (2020 - £5.6m).
Group materiality £20mAdjusted profit £474.5m
Component materiality not more than £6.5m
Audit Committee reporting threshold £1.0m
Adjusted pro�tGroup materiality
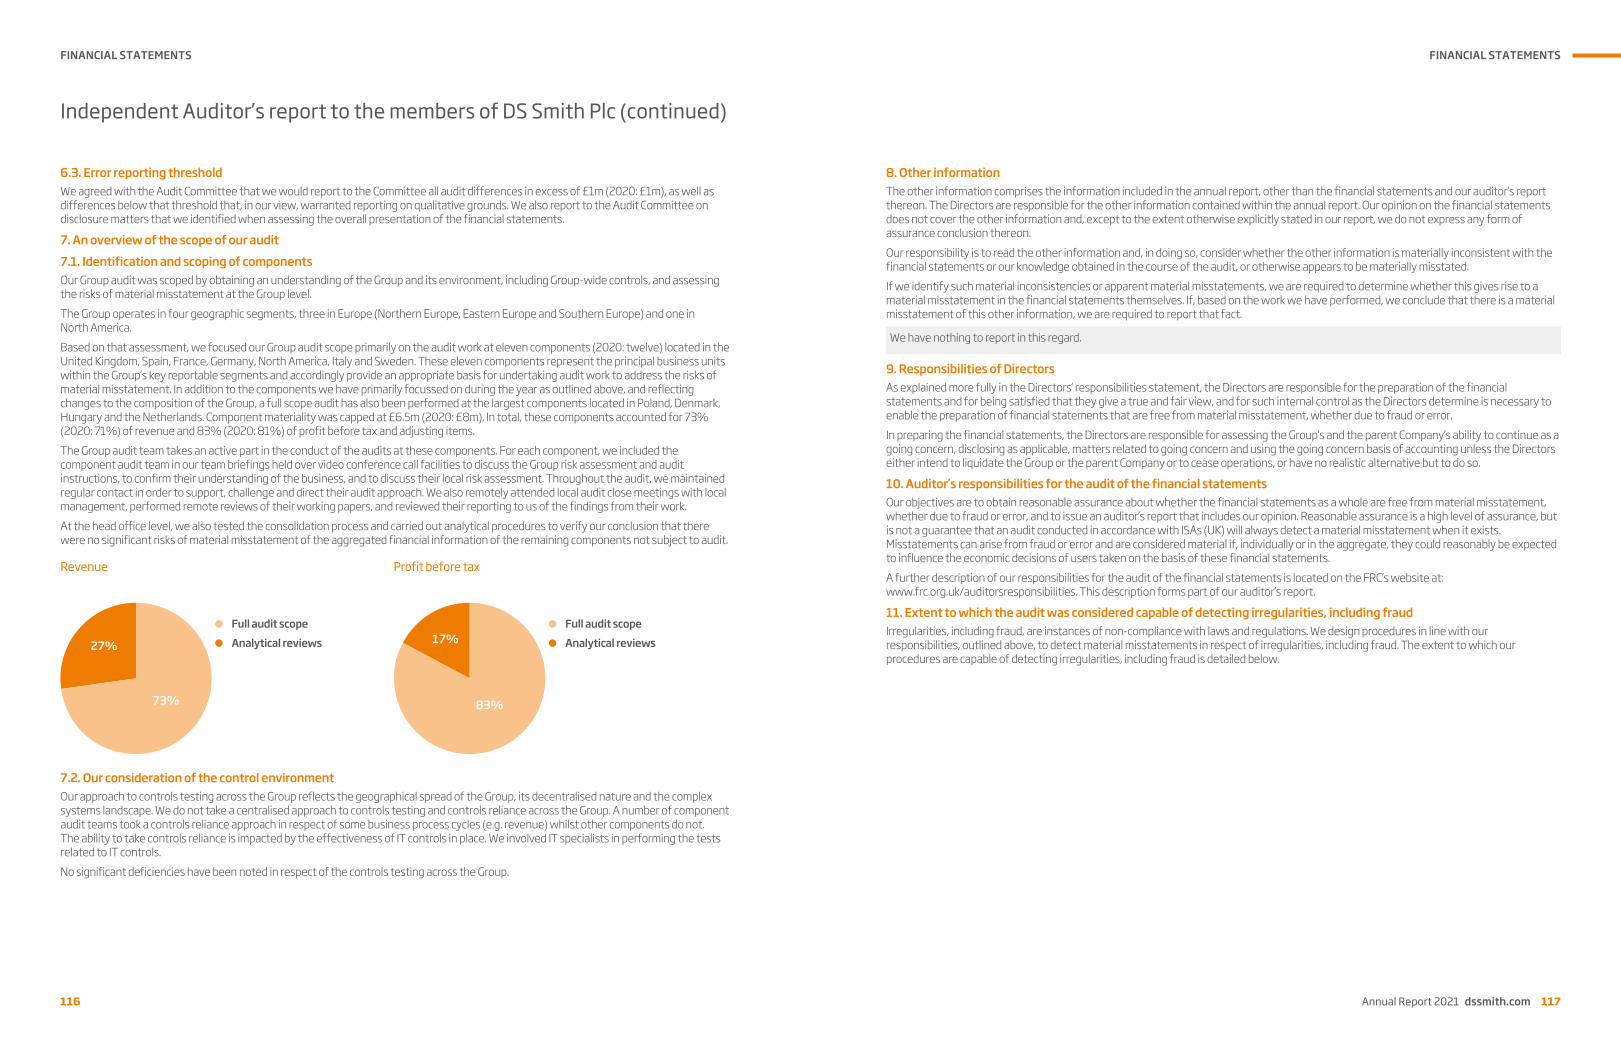
FINANCIAL STATEMENTS
116
Independent Auditor’s report to the members of DS Smith Plc (continued)
116
6.3. Error reporting threshold We agreed with the Audit Committee that we would report to the Committee all audit differences in excess of £1m (2020: £1m), as well as differences below that threshold that, in our view, warranted reporting on qualitative grounds. We also report to the Audit Committee on disclosure matters that we identified when assessing the overall presentation of the financial statements.
7. An overview of the scope of our audit 7.1. Identification and scoping of components Our Group audit was scoped by obtaining an understanding of the Group and its environment, including Group-wide controls, and assessing the risks of material misstatement at the Group level. The Group operates in four geographic segments, three in Europe (Northern Europe, Eastern Europe and Southern Europe) and one in North America. Based on that assessment, we focused our Group audit scope primarily on the audit work at eleven components (2020: twelve) located in the United Kingdom, Spain, France, Germany, North America, Italy and Sweden. These eleven components represent the principal business units within the Group’s key reportable segments and accordingly provide an appropriate basis for undertaking audit work to address the risks of material misstatement. In addition to the components we have primarily focussed on during the year as outlined above, and reflecting changes to the composition of the Group, a full scope audit has also been performed at the largest components located in Poland, Denmark, Hungary and the Netherlands. Component materiality was capped at £6.5m (2020: £8m). In total, these components accounted for 73% (2020: 71%) of revenue and 83% (2020: 81%) of profit before tax and adjusting items. The Group audit team takes an active part in the conduct of the audits at these components. For each component, we included the component audit team in our team briefings held over video conference call facilities to discuss the Group risk assessment and audit instructions, to confirm their understanding of the business, and to discuss their local risk assessment. Throughout the audit, we maintained regular contact in order to support, challenge and direct their audit approach. We also remotely attended local audit close meetings with local management, performed remote reviews of their working papers, and reviewed their reporting to us of the findings from their work. At the head office level, we also tested the consolidation process and carried out analytical procedures to verify our conclusion that there were no significant risks of material misstatement of the aggregated financial information of the remaining components not subject to audit.
Revenue Profit before tax
7.2. Our consideration of the control environment Our approach to controls testing across the Group reflects the geographical spread of the Group, its decentralised nature and the complex systems landscape. We do not take a centralised approach to controls testing and controls reliance across the Group. A number of component audit teams took a controls reliance approach in respect of some business process cycles (e.g. revenue) whilst other components do not. The ability to take controls reliance is impacted by the effectiveness of IT controls in place. We involved IT specialists in performing the tests related to IT controls. No significant deficiencies have been noted in respect of the controls testing across the Group.
Full audit scopeAnalytical reviews
83%
17%Full audit scopeAnalytical reviews
73%
27%
FINANCIAL STATEMENTS
Annual Report 2021 dssmith.com 117
Independent Auditor’s report to the members of DS Smith Plc (continued)
116
6.3. Error reporting threshold We agreed with the Audit Committee that we would report to the Committee all audit differences in excess of £1m (2020: £1m), as well as differences below that threshold that, in our view, warranted reporting on qualitative grounds. We also report to the Audit Committee on disclosure matters that we identified when assessing the overall presentation of the financial statements.
7. An overview of the scope of our audit 7.1. Identification and scoping of components Our Group audit was scoped by obtaining an understanding of the Group and its environment, including Group-wide controls, and assessing the risks of material misstatement at the Group level. The Group operates in four geographic segments, three in Europe (Northern Europe, Eastern Europe and Southern Europe) and one in North America. Based on that assessment, we focused our Group audit scope primarily on the audit work at eleven components (2020: twelve) located in the United Kingdom, Spain, France, Germany, North America, Italy and Sweden. These eleven components represent the principal business units within the Group’s key reportable segments and accordingly provide an appropriate basis for undertaking audit work to address the risks of material misstatement. In addition to the components we have primarily focussed on during the year as outlined above, and reflecting changes to the composition of the Group, a full scope audit has also been performed at the largest components located in Poland, Denmark, Hungary and the Netherlands. Component materiality was capped at £6.5m (2020: £8m). In total, these components accounted for 73% (2020: 71%) of revenue and 83% (2020: 81%) of profit before tax and adjusting items. The Group audit team takes an active part in the conduct of the audits at these components. For each component, we included the component audit team in our team briefings held over video conference call facilities to discuss the Group risk assessment and audit instructions, to confirm their understanding of the business, and to discuss their local risk assessment. Throughout the audit, we maintained regular contact in order to support, challenge and direct their audit approach. We also remotely attended local audit close meetings with local management, performed remote reviews of their working papers, and reviewed their reporting to us of the findings from their work. At the head office level, we also tested the consolidation process and carried out analytical procedures to verify our conclusion that there were no significant risks of material misstatement of the aggregated financial information of the remaining components not subject to audit.
Revenue Profit before tax
7.2. Our consideration of the control environment Our approach to controls testing across the Group reflects the geographical spread of the Group, its decentralised nature and the complex systems landscape. We do not take a centralised approach to controls testing and controls reliance across the Group. A number of component audit teams took a controls reliance approach in respect of some business process cycles (e.g. revenue) whilst other components do not. The ability to take controls reliance is impacted by the effectiveness of IT controls in place. We involved IT specialists in performing the tests related to IT controls. No significant deficiencies have been noted in respect of the controls testing across the Group.
Annual Report 2021 dssmith.com 117
8. Other information The other information comprises the information included in the annual report, other than the financial statements and our auditor’s report thereon. The Directors are responsible for the other information contained within the annual report. Our opinion on the financial statements does not cover the other information and, except to the extent otherwise explicitly stated in our report, we do not express any form of assurance conclusion thereon. Our responsibility is to read the other information and, in doing so, consider whether the other information is materially inconsistent with the financial statements or our knowledge obtained in the course of the audit, or otherwise appears to be materially misstated. If we identify such material inconsistencies or apparent material misstatements, we are required to determine whether this gives rise to a material misstatement in the financial statements themselves. If, based on the work we have performed, we conclude that there is a material misstatement of this other information, we are required to report that fact.
We have nothing to report in this regard.
9. Responsibilities of Directors As explained more fully in the Directors’ responsibilities statement, the Directors are responsible for the preparation of the financial statements and for being satisfied that they give a true and fair view, and for such internal control as the Directors determine is necessary to enable the preparation of financial statements that are free from material misstatement, whether due to fraud or error. In preparing the financial statements, the Directors are responsible for assessing the Group’s and the parent Company’s ability to continue as a going concern, disclosing as applicable, matters related to going concern and using the going concern basis of accounting unless the Directors either intend to liquidate the Group or the parent Company or to cease operations, or have no realistic alternative but to do so.
10. Auditor’s responsibilities for the audit of the financial statements Our objectives are to obtain reasonable assurance about whether the financial statements as a whole are free from material misstatement, whether due to fraud or error, and to issue an auditor’s report that includes our opinion. Reasonable assurance is a high level of assurance, but is not a guarantee that an audit conducted in accordance with ISAs (UK) will always detect a material misstatement when it exists. Misstatements can arise from fraud or error and are considered material if, individually or in the aggregate, they could reasonably be expected to influence the economic decisions of users taken on the basis of these financial statements. A further description of our responsibilities for the audit of the financial statements is located on the FRC’s website at: www.frc.org.uk/auditorsresponsibilities. This description forms part of our auditor’s report.
11. Extent to which the audit was considered capable of detecting irregularities, including fraud Irregularities, including fraud, are instances of non-compliance with laws and regulations. We design procedures in line with our responsibilities, outlined above, to detect material misstatements in respect of irregularities, including fraud. The extent to which our procedures are capable of detecting irregularities, including fraud is detailed below.

FINANCIAL STATEMENTS
118
Independent Auditor’s report to the members of DS Smith Plc (continued)
118
11.1 Identifying and assessing potential risks related to irregularities In identifying and assessing risks of material misstatement in respect of irregularities, including fraud and non-compliance with laws and regulations, we considered the following: • the nature of the industry and sector, control environment and business performance including the design of the Group’s remuneration
policies, key drivers for Directors’ remuneration, bonus levels and performance targets; • results of our enquiries of management, internal audit, and the audit committee about their own identification and assessment of the risks
of irregularities; • any matters we identified having obtained and reviewed the Group’s documentation of their policies and procedures relating to: – identifying, evaluating and complying with laws and regulations and whether they were aware of any instances of non-compliance; – detecting and responding to the risks of fraud and whether they have knowledge of any actual, suspected or alleged fraud; – the internal controls established to mitigate risks of fraud or non-compliance with laws and regulations;
• the matters discussed among the audit engagement team including significant component audit teams and relevant internal specialists, including tax, valuations, pensions and IT specialists regarding how and where fraud might occur in the financial statements and any potential indicators of fraud.
As a result of these procedures, we considered the opportunities and incentives that may exist within the organisation for fraud and identified the greatest potential for fraud related to the classification and presentation of adjusting items. In common with all audits under ISAs (UK), we are also required to perform specific procedures to respond to the risk of management override. We also obtained an understanding of the legal and regulatory frameworks that the Group operates in, focusing on provisions of those laws and regulations that had a direct effect on the determination of material amounts and disclosures in the financial statements. The key laws and regulations we considered in this context included the UK Companies Act, Listing Rules, pensions legislation and tax legislation. In addition, we considered provisions of other laws and regulations that do not have a direct effect on the financial statements but compliance with which may be fundamental to the Group’s ability to operate or to avoid a material penalty. These included the regulatory solvency requirements and environmental regulations.
11.2 Audit response to risks identified As a result of performing the above, we identified classification and presentation of adjusting items as a key audit matter. The key audit matters section of our report explains the matter in more detail and also describes the specific procedures we performed in response to that key audit matter. In addition to the above, our procedures to respond to risks identified included the following: • reviewing the financial statement disclosures and testing to supporting documentation to assess compliance with provisions of relevant
laws and regulations described as having a direct effect on the financial statements; • enquiring of management, the audit committee and in-house legal counsel concerning actual and potential litigation and claims; • performing analytical procedures to identify any unusual or unexpected relationships that may indicate risks of material misstatement due
to fraud; • reading minutes of meetings of those charged with governance, reviewing internal audit reports and reviewing correspondence with; • understanding safeguards management have in place, such as whistleblower hotlines, and making enquiries of internal audit as to the
nature of matters reported; and • in addressing the risk of fraud through management override of controls, testing the appropriateness of journal entries and other
adjustments; assessing whether the judgements made in making accounting estimates are indicative of a potential bias; and evaluating the business rationale of any significant transactions that are unusual or outside the normal course of business.
We also communicated relevant identified laws and regulations and potential fraud risks to all engagement team members including internal specialists and significant component audit teams, and remained alert to any indications of fraud or non-compliance with laws and regulations throughout the audit.
FINANCIAL STATEMENTS
Annual Report 2021 dssmith.com 119
Independent Auditor’s report to the members of DS Smith Plc (continued)
118
11.1 Identifying and assessing potential risks related to irregularities In identifying and assessing risks of material misstatement in respect of irregularities, including fraud and non-compliance with laws and regulations, we considered the following: • the nature of the industry and sector, control environment and business performance including the design of the Group’s remuneration
policies, key drivers for Directors’ remuneration, bonus levels and performance targets; • results of our enquiries of management, internal audit, and the audit committee about their own identification and assessment of the risks
of irregularities; • any matters we identified having obtained and reviewed the Group’s documentation of their policies and procedures relating to: – identifying, evaluating and complying with laws and regulations and whether they were aware of any instances of non-compliance; – detecting and responding to the risks of fraud and whether they have knowledge of any actual, suspected or alleged fraud; – the internal controls established to mitigate risks of fraud or non-compliance with laws and regulations;
• the matters discussed among the audit engagement team including significant component audit teams and relevant internal specialists, including tax, valuations, pensions and IT specialists regarding how and where fraud might occur in the financial statements and any potential indicators of fraud.
As a result of these procedures, we considered the opportunities and incentives that may exist within the organisation for fraud and identified the greatest potential for fraud related to the classification and presentation of adjusting items. In common with all audits under ISAs (UK), we are also required to perform specific procedures to respond to the risk of management override. We also obtained an understanding of the legal and regulatory frameworks that the Group operates in, focusing on provisions of those laws and regulations that had a direct effect on the determination of material amounts and disclosures in the financial statements. The key laws and regulations we considered in this context included the UK Companies Act, Listing Rules, pensions legislation and tax legislation. In addition, we considered provisions of other laws and regulations that do not have a direct effect on the financial statements but compliance with which may be fundamental to the Group’s ability to operate or to avoid a material penalty. These included the regulatory solvency requirements and environmental regulations.
11.2 Audit response to risks identified As a result of performing the above, we identified classification and presentation of adjusting items as a key audit matter. The key audit matters section of our report explains the matter in more detail and also describes the specific procedures we performed in response to that key audit matter. In addition to the above, our procedures to respond to risks identified included the following: • reviewing the financial statement disclosures and testing to supporting documentation to assess compliance with provisions of relevant
laws and regulations described as having a direct effect on the financial statements; • enquiring of management, the audit committee and in-house legal counsel concerning actual and potential litigation and claims; • performing analytical procedures to identify any unusual or unexpected relationships that may indicate risks of material misstatement due
to fraud; • reading minutes of meetings of those charged with governance, reviewing internal audit reports and reviewing correspondence with; • understanding safeguards management have in place, such as whistleblower hotlines, and making enquiries of internal audit as to the
nature of matters reported; and • in addressing the risk of fraud through management override of controls, testing the appropriateness of journal entries and other
adjustments; assessing whether the judgements made in making accounting estimates are indicative of a potential bias; and evaluating the business rationale of any significant transactions that are unusual or outside the normal course of business.
We also communicated relevant identified laws and regulations and potential fraud risks to all engagement team members including internal specialists and significant component audit teams, and remained alert to any indications of fraud or non-compliance with laws and regulations throughout the audit.
Annual Report 2021 dssmith.com 119
Report on other legal and regulatory requirements 12. Opinions on other matters prescribed by the Companies Act 2006
In our opinion the part of the Directors’ remuneration report to be audited has been properly prepared in accordance with the Companies Act 2006. In our opinion, based on the work undertaken in the course of the audit: • the information given in the strategic report and the Directors’ report for the financial year for which the financial statements are prepared
is consistent with the financial statements; and • the strategic report and the Directors’ report have been prepared in accordance with applicable legal requirements.
In the light of the knowledge and understanding of the Group and the parent Company and their environment obtained in the course of the audit, we have not identified any material misstatements in the strategic report or the Directors’ report.
13. Corporate Governance Statement The Listing Rules require us to review the Directors' statement in relation to going concern, longer-term viability and that part of the Corporate Governance Statement relating to the Group’s compliance with the provisions of the UK Corporate Governance Code specified for our review.
Based on the work undertaken as part of our audit, we have concluded that each of the following elements of the Corporate Governance Statement is materially consistent with the financial statements and our knowledge obtained during the audit: • the Directors’ statement with regards to the appropriateness of adopting the going concern basis of accounting and any material
uncertainties identified set out on page 51; • the Directors’ explanation as to its assessment of the Group’s prospects, the period this assessment covers and why the period is
appropriate set out on page 49; • the Directors' statement on fair, balanced and understandable set out on page 110; • the Board’s confirmation that it has carried out a robust assessment of the emerging and principal risks set out on page 76; • the section of the annual report that describes the review of effectiveness of risk management and internal control systems set out on
page 76; and • the section describing the work of the audit committee set out on page 78.
14. Matters on which we are required to report by exception 14.1. Adequacy of explanations received and accounting records Under the Companies Act 2006 we are required to report to you if, in our opinion: • we have not received all the information and explanations we require for our audit; or • adequate accounting records have not been kept by the parent Company, or returns adequate for our audit have not been received from
branches not visited by us; or • the parent Company financial statements are not in agreement with the accounting records and returns.
We have nothing to report in respect of these matters.
14.2. Directors’ remuneration Under the Companies Act 2006 we are also required to report if in our opinion certain disclosures of Directors’ remuneration have not been made or the part of the Directors’ remuneration report to be audited is not in agreement with the accounting records and returns.
We have nothing to report in respect of these matters.

FINANCIAL STATEMENTS
120
Independent Auditor’s report to the members of DS Smith Plc (continued)
120
15. Other matters which we are required to address 15.1. Auditor tenure Following the recommendation of the audit committee, we were appointed by the shareholders on 13 October 2006 to audit the financial statements for the year ended 30 April 2007 and subsequent financial periods. Following a competitive tender process, we were reappointed as auditor for the year ended 30 April 2014 and subsequent financial years. The period of total uninterrupted engagement including previous renewals and reappointments of the firm is 15 years, covering the years ended 30 April 2007 to 30 April 2021.
15.2. Consistency of the audit report with the additional report to the audit committee Our audit opinion is consistent with the additional report to the audit committee we are required to provide in accordance with ISAs (UK).
16. Use of our report This report is made solely to the Company’s members, as a body, in accordance with Chapter 3 of Part 16 of the Companies Act 2006. Our audit work has been undertaken so that we might state to the Company’s members those matters we are required to state to them in an auditor’s report and for no other purpose. To the fullest extent permitted by law, we do not accept or assume responsibility to anyone other than the Company and the Company’s members as a body, for our audit work, for this report, or for the opinions we have formed.
Nicola Mitchell (Senior Statutory Auditor) For and on behalf of Deloitte LLP Statutory Auditor London, United Kingdom 21 June 2021
FINANCIAL STATEMENTS
Annual Report 2021 dssmith.com 121
Independent Auditor’s report to the members of DS Smith Plc (continued)
120
15. Other matters which we are required to address 15.1. Auditor tenure Following the recommendation of the audit committee, we were appointed by the shareholders on 13 October 2006 to audit the financial statements for the year ended 30 April 2007 and subsequent financial periods. Following a competitive tender process, we were reappointed as auditor for the year ended 30 April 2014 and subsequent financial years. The period of total uninterrupted engagement including previous renewals and reappointments of the firm is 15 years, covering the years ended 30 April 2007 to 30 April 2021.
15.2. Consistency of the audit report with the additional report to the audit committee Our audit opinion is consistent with the additional report to the audit committee we are required to provide in accordance with ISAs (UK).
16. Use of our report This report is made solely to the Company’s members, as a body, in accordance with Chapter 3 of Part 16 of the Companies Act 2006. Our audit work has been undertaken so that we might state to the Company’s members those matters we are required to state to them in an auditor’s report and for no other purpose. To the fullest extent permitted by law, we do not accept or assume responsibility to anyone other than the Company and the Company’s members as a body, for our audit work, for this report, or for the opinions we have formed.
Nicola Mitchell (Senior Statutory Auditor) For and on behalf of Deloitte LLP Statutory Auditor London, United Kingdom 21 June 2021
Consolidated income statement Year ended 30 April 2021
Annual Report 2021 dssmith.com 121
Continuing operations Note
Beforeadjusting
items 2021
£m
Adjustingitems 2021
(note 4)£m
After adjusting
items2021
£m
Before adjusting
items 2020
£m
Adjustingitems2020
(note 4)£m
After adjusting
items2020
£m
Revenue 2 5,976 – 5,976 6,043 – 6,043 Operating costs 3,4 (5,474) (44) (5,518) (5,383) (58) (5,441)Operating profit before amortisation, acquisitions and divestments 2 502 (44) 458 660 (58) 602
Amortisation of intangible assets; acquisitions and divestments 10, 4 (142) (5) (147) (143) (4) (147)
Operating profit 4 360 (49) 311 517 (62) 455 Finance income 5 1 – 1 4 – 4 Finance costs 5, 4 (76) (7) (83) (88) (7) (95)Employment benefit net finance expense 25 (3) – (3) (3) – (3)Net financing costs (78) (7) (85) (87) (7) (94)Profit after financing costs 282 (56) 226 430 (69) 361 Share of profit of equity accounted investments, net of tax 13 5 – 5 7 – 7 Profit before income tax 287 (56) 231 437 (69) 368 Income tax (expense)/credit 7, 4 (65) 16 (49) (92) 14 (78)Profit for the year from continuing operations 222 (40) 182 345 (55) 290Discontinued operations Profit for the year from discontinued operations, net of tax 30(b) – 12 12 10 227 237 Profit for the year 222 (28) 194 355 172 527 Profit for the year attributable to:
Owners of the parent 222 (28) 194 355 172 527 Non-controlling interests – – – – – –
Earnings per share Earnings per share from continuing and discontinued operations Basic 8 14.2p 38.5p Diluted 8 14.1p 38.2p Earnings per share from continuing operations Basic 8 13.3p 21.2p Diluted 8 13.2p 21.0p Adjusted earnings per share from continuing operations Basic 8, 33 24.2p 33.2p Diluted 8 24.1p 33.0p
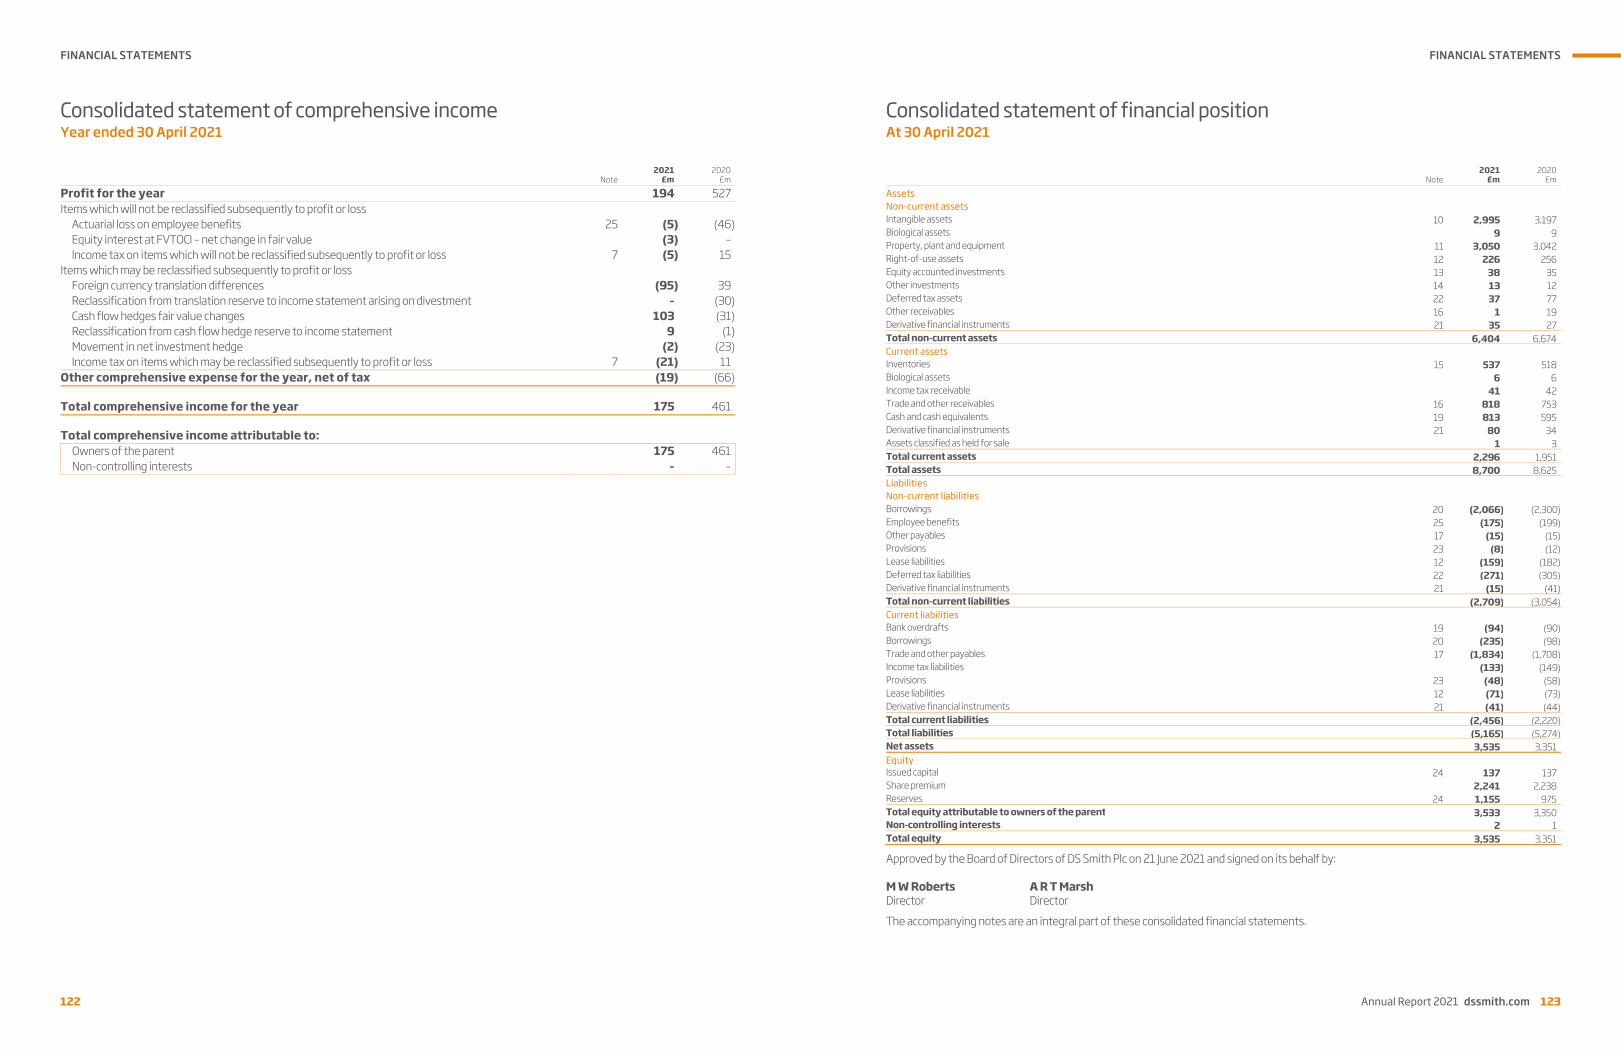
FINANCIAL STATEMENTS
122
Consolidated statement of comprehensive income Year ended 30 April 2021
122
Note 2021
£m2020
£m
Profit for the year 194 527 Items which will not be reclassified subsequently to profit or loss
Actuarial loss on employee benefits 25 (5) (46)Equity interest at FVTOCI – net change in fair value (3) –Income tax on items which will not be reclassified subsequently to profit or loss 7 (5) 15
Items which may be reclassified subsequently to profit or loss Foreign currency translation differences (95) 39 Reclassification from translation reserve to income statement arising on divestment – (30)Cash flow hedges fair value changes 103 (31)Reclassification from cash flow hedge reserve to income statement 9 (1)Movement in net investment hedge (2) (23)Income tax on items which may be reclassified subsequently to profit or loss 7 (21) 11
Other comprehensive expense for the year, net of tax (19) (66) Total comprehensive income for the year 175 461 Total comprehensive income attributable to:
Owners of the parent 175 461 Non-controlling interests – –
FINANCIAL STATEMENTS
Annual Report 2021 dssmith.com 123
Consolidated statement of comprehensive income Year ended 30 April 2021
122
Note 2021
£m2020
£m
Profit for the year 194 527 Items which will not be reclassified subsequently to profit or loss
Actuarial loss on employee benefits 25 (5) (46)Equity interest at FVTOCI – net change in fair value (3) –Income tax on items which will not be reclassified subsequently to profit or loss 7 (5) 15
Items which may be reclassified subsequently to profit or loss Foreign currency translation differences (95) 39 Reclassification from translation reserve to income statement arising on divestment – (30)Cash flow hedges fair value changes 103 (31)Reclassification from cash flow hedge reserve to income statement 9 (1)Movement in net investment hedge (2) (23)Income tax on items which may be reclassified subsequently to profit or loss 7 (21) 11
Other comprehensive expense for the year, net of tax (19) (66) Total comprehensive income for the year 175 461 Total comprehensive income attributable to:
Owners of the parent 175 461 Non-controlling interests – –
Consolidated statement of financial position At 30 April 2021
Annual Report 2021 dssmith.com 123
Note 2021
£m2020
£mAssets Non-current assets Intangible assets 10 2,995 3,197 Biological assets 9 9 Property, plant and equipment 11 3,050 3,042 Right-of-use assets 12 226 256 Equity accounted investments 13 38 35 Other investments 14 13 12 Deferred tax assets 22 37 77 Other receivables 16 1 19Derivative financial instruments 21 35 27 Total non-current assets 6,404 6,674 Current assets Inventories 15 537 518 Biological assets 6 6 Income tax receivable 41 42 Trade and other receivables 16 818 753 Cash and cash equivalents 19 813 595 Derivative financial instruments 21 80 34 Assets classified as held for sale 1 3 Total current assets 2,296 1,951 Total assets 8,700 8,625 Liabilities Non-current liabilities Borrowings 20 (2,066) (2,300)Employee benefits 25 (175) (199)Other payables 17 (15) (15)Provisions 23 (8) (12)Lease liabilities 12 (159) (182)Deferred tax liabilities 22 (271) (305)Derivative financial instruments 21 (15) (41)Total non-current liabilities (2,709) (3,054)Current liabilities Bank overdrafts 19 (94) (90)Borrowings 20 (235) (98)Trade and other payables 17 (1,834) (1,708)Income tax liabilities (133) (149)Provisions 23 (48) (58)Lease liabilities 12 (71) (73)Derivative financial instruments 21 (41) (44)Total current liabilities (2,456) (2,220)Total liabilities (5,165) (5,274)Net assets 3,535 3,351 Equity Issued capital 24 137 137 Share premium 2,241 2,238 Reserves 24 1,155 975 Total equity attributable to owners of the parent 3,533 3,350 Non-controlling interests 2 1 Total equity 3,535 3,351
Approved by the Board of Directors of DS Smith Plc on 21 June 2021 and signed on its behalf by:
M W Roberts A R T Marsh Director Director
The accompanying notes are an integral part of these consolidated financial statements.

FINANCIAL STATEMENTS
124
Consolidated statement of changes in equity Year ended 30 April 2021
124
Note
Sharecapital
£m
Sharepremium
£m
Hedgingreserve
£m
Translationreserve
£m
Ownshares
£m
Retained earnings
1£m
Total equity attributable
to owners of the
parent £m
Non-controlling
interests£m
Total equity
£m
At 1 May 2019 137 2,236 (13) 23 (1) 729 3,111 1 3,112Profit for the year – – – – – 527 527 – 527 Actuarial loss on employee benefits 25 – – – – – (46) (46) – (46)Foreign currency translation differences – – – 39 – – 39 – 39 Reclassification from translation reserve to income statement arising on divestment 30(a) – – – (30) – – (30) – (30)Cash flow hedges fair value changes – – (31) – – – (31) – (31)Reclassification from cash flow hedge reserve to income statement 21(c) – – (1) – – – (1) – (1)Movement in net investment hedge – – – (23) – – (23) – (23)Income tax on other comprehensive income – – 6 5 – 15 26 – 26 Total comprehensive (expense)/ income – – (26) (9) – 496 461 – 461 Issue of share capital – 2 – – – – 2 – 2 Employee share trust – – – – (2) (2) (4) – (4)Share-based payment expense (net of tax) – – – – – 2 2 – 2 Dividends paid 9 – – – – – (222) (222) – (222)Other changes in equity in the year – 2 – – (2) (222) (222) – (222)At 30 April 2020 137 2,238 (39) 14 (3) 1,003 3,350 1 3,351 Profit for the year – – – – – 194 194 – 194Actuarial loss on employee benefits – – – – – (5) (5) – (5)Equity interest at FVTOCI – change in fair value – – – – – (3) (3) – (3)Foreign currency translation differences – – – (95) – – (95) – (95)Cash flow hedges fair value changes – – 103 – – – 103 – 103Reclassification from cash flow hedge reserve to income statement – – 9 – – – 9 – 9Movement in net investment hedge – – – (2) – – (2) – (2)Income tax on other comprehensive income – – (20) (1) – (5) (26) – (26)Total comprehensive income/(expense) – – 92 (98) – 181 175 – 175Issue of share capital – 3 – – – – 3 – 3Employee share trust – – – – – (2) (2) – (2)Share-based payment expense (net of tax) – – – – – 10 10 – 10Transactions with non-controlling interests – – – – – (3) (3) 1 (2)Other changes in equity in the year – 3 – – – 5 8 1 9At 30 April 2021 137 2,241 53 (84) (3) 1,189 3,533 2 3,5351. Retained earnings include a reserve related to merger relief (note 24).
FINANCIAL STATEMENTS
Annual Report 2021 dssmith.com 125
Consolidated statement of changes in equity Year ended 30 April 2021
124
Note
Sharecapital
£m
Sharepremium
£m
Hedgingreserve
£m
Translationreserve
£m
Ownshares
£m
Retained earnings
1£m
Total equity attributable
to owners of the
parent £m
Non-controlling
interests£m
Total equity
£m
At 1 May 2019 137 2,236 (13) 23 (1) 729 3,111 1 3,112Profit for the year – – – – – 527 527 – 527 Actuarial loss on employee benefits 25 – – – – – (46) (46) – (46)Foreign currency translation differences – – – 39 – – 39 – 39 Reclassification from translation reserve to income statement arising on divestment 30(a) – – – (30) – – (30) – (30)Cash flow hedges fair value changes – – (31) – – – (31) – (31)Reclassification from cash flow hedge reserve to income statement 21(c) – – (1) – – – (1) – (1)Movement in net investment hedge – – – (23) – – (23) – (23)Income tax on other comprehensive income – – 6 5 – 15 26 – 26 Total comprehensive (expense)/ income – – (26) (9) – 496 461 – 461 Issue of share capital – 2 – – – – 2 – 2 Employee share trust – – – – (2) (2) (4) – (4)Share-based payment expense (net of tax) – – – – – 2 2 – 2 Dividends paid 9 – – – – – (222) (222) – (222)Other changes in equity in the year – 2 – – (2) (222) (222) – (222)At 30 April 2020 137 2,238 (39) 14 (3) 1,003 3,350 1 3,351 Profit for the year – – – – – 194 194 – 194Actuarial loss on employee benefits – – – – – (5) (5) – (5)Equity interest at FVTOCI – change in fair value – – – – – (3) (3) – (3)Foreign currency translation differences – – – (95) – – (95) – (95)Cash flow hedges fair value changes – – 103 – – – 103 – 103Reclassification from cash flow hedge reserve to income statement – – 9 – – – 9 – 9Movement in net investment hedge – – – (2) – – (2) – (2)Income tax on other comprehensive income – – (20) (1) – (5) (26) – (26)Total comprehensive income/(expense) – – 92 (98) – 181 175 – 175Issue of share capital – 3 – – – – 3 – 3Employee share trust – – – – – (2) (2) – (2)Share-based payment expense (net of tax) – – – – – 10 10 – 10Transactions with non-controlling interests – – – – – (3) (3) 1 (2)Other changes in equity in the year – 3 – – – 5 8 1 9At 30 April 2021 137 2,241 53 (84) (3) 1,189 3,533 2 3,5351. Retained earnings include a reserve related to merger relief (note 24).
Consolidated statement of cash flows Year ended 30 April 2021
Annual Report 2021 dssmith.com 125
Continuing operations Note 2021
£m2020
£m
Operating activities Cash generated from operations 27 895 836 Interest received 1 2 Interest paid (69) (79)Tax paid (66) (94)Cash flows from operating activities 761 665 Investing activities Acquisition of subsidiary businesses, net of cash and cash equivalents 30 (90) (4)Divestment of discontinued operation, net of cash and cash equivalents 30 – 422 Divestment of subsidiary businesses, net of cash and cash equivalents 30 16 62 Capital expenditure (331) (376)Proceeds from sale of property, plant and equipment and intangible assets 8 12 Cash flows from restricted cash and other deposits 4 56 Other investing activities 2 6 Cash flows (used in)/from investing activities (391) 178 Financing activities Proceeds from issue of share capital 3 2 Repayment of borrowings (1,213) (3,497)Proceeds from borrowings 1,157 3,235 Payments in respect of derivative financial instruments (16) (5)Repayment of principal on lease liabilities (73) (71)Dividends paid to Group shareholders 9 – (222)Other – (4)Cash flows used in financing activities (142) (562)Increase in cash and cash equivalents from continuing operations 228 281 Discontinued operation Cash flows used in discontinued operation 30(b) (10) (29)Increase in cash and cash equivalents 218 252 Net cash and cash equivalents at beginning of the year 505 253 Exchange losses on cash and cash equivalents (4) –Net cash and cash equivalents at end of the year 19 719 505
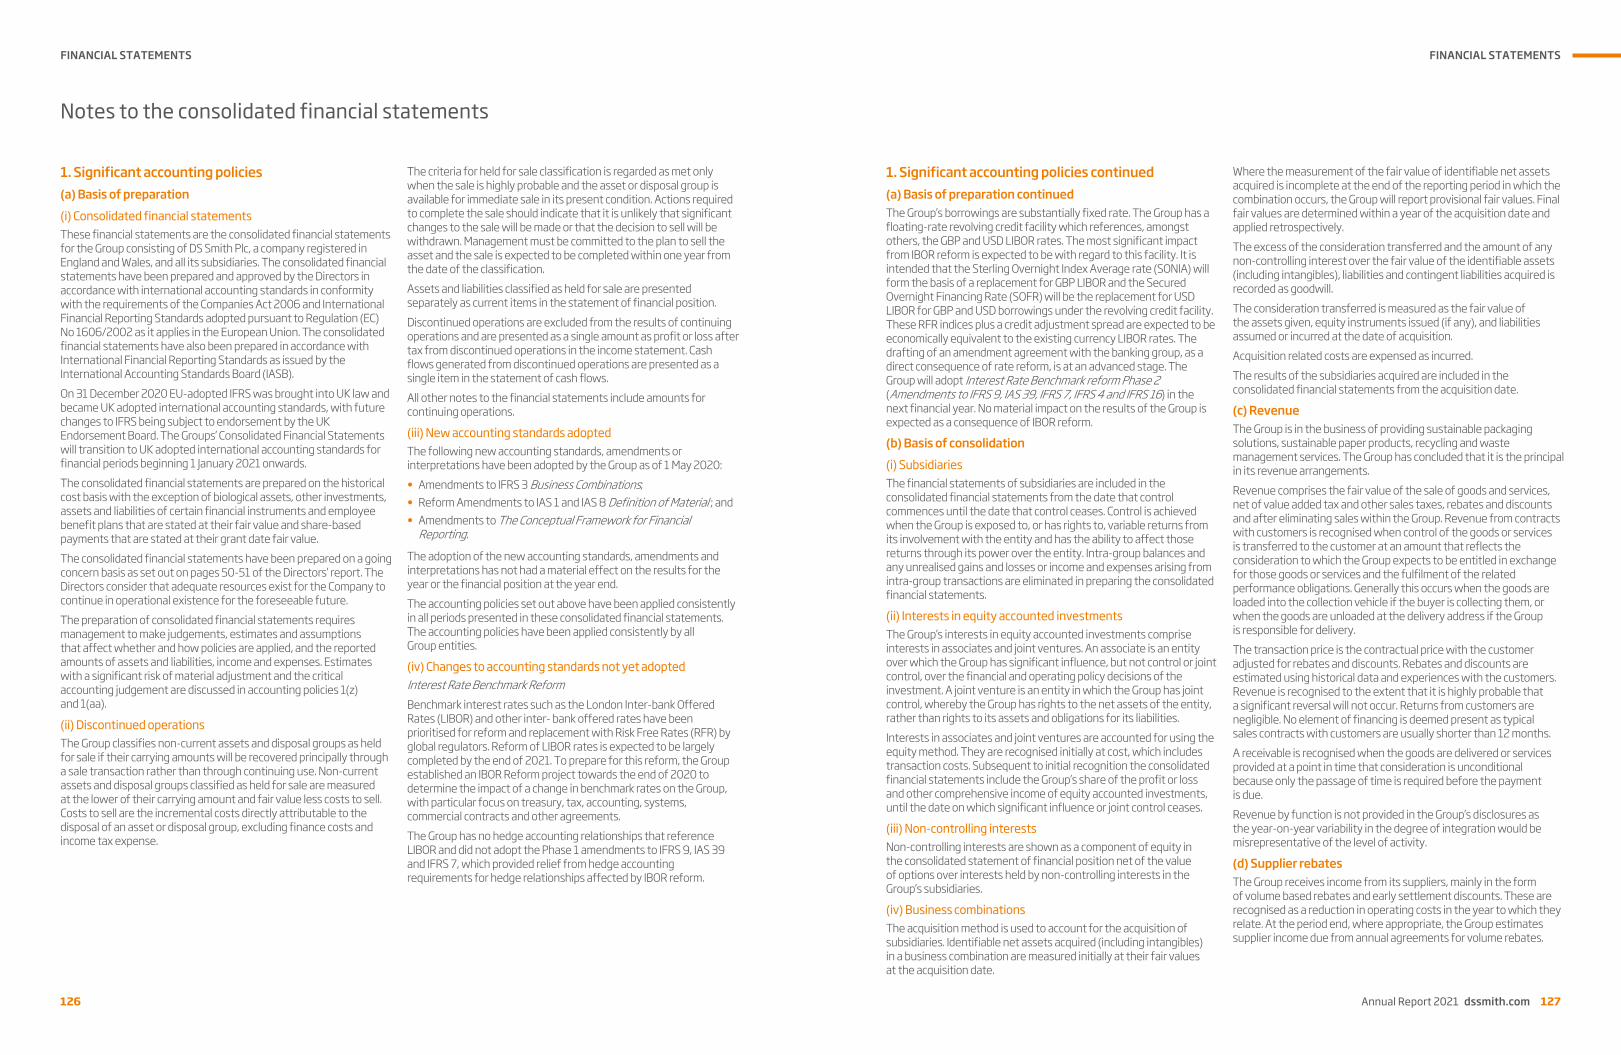
FINANCIAL STATEMENTS
126
Notes to the consolidated financial statements
126
1. Significant accounting policies (a) Basis of preparation (i) Consolidated financial statements These financial statements are the consolidated financial statements for the Group consisting of DS Smith Plc, a company registered in England and Wales, and all its subsidiaries. The consolidated financial statements have been prepared and approved by the Directors in accordance with international accounting standards in conformity with the requirements of the Companies Act 2006 and International Financial Reporting Standards adopted pursuant to Regulation (EC) No 1606/2002 as it applies in the European Union. The consolidated financial statements have also been prepared in accordance with International Financial Reporting Standards as issued by the International Accounting Standards Board (IASB). On 31 December 2020 EU-adopted IFRS was brought into UK law and became UK adopted international accounting standards, with future changes to IFRS being subject to endorsement by the UK Endorsement Board. The Groups’ Consolidated Financial Statements will transition to UK adopted international accounting standards for financial periods beginning 1 January 2021 onwards. The consolidated financial statements are prepared on the historical cost basis with the exception of biological assets, other investments, assets and liabilities of certain financial instruments and employee benefit plans that are stated at their fair value and share-based payments that are stated at their grant date fair value. The consolidated financial statements have been prepared on a going concern basis as set out on pages 50-51 of the Directors’ report. The Directors consider that adequate resources exist for the Company to continue in operational existence for the foreseeable future. The preparation of consolidated financial statements requires management to make judgements, estimates and assumptions that affect whether and how policies are applied, and the reported amounts of assets and liabilities, income and expenses. Estimates with a significant risk of material adjustment and the critical accounting judgement are discussed in accounting policies 1(z) and 1(aa).
(ii) Discontinued operations The Group classifies non-current assets and disposal groups as held for sale if their carrying amounts will be recovered principally through a sale transaction rather than through continuing use. Non-current assets and disposal groups classified as held for sale are measured at the lower of their carrying amount and fair value less costs to sell. Costs to sell are the incremental costs directly attributable to the disposal of an asset or disposal group, excluding finance costs and income tax expense.
The criteria for held for sale classification is regarded as met only when the sale is highly probable and the asset or disposal group is available for immediate sale in its present condition. Actions required to complete the sale should indicate that it is unlikely that significant changes to the sale will be made or that the decision to sell will be withdrawn. Management must be committed to the plan to sell the asset and the sale is expected to be completed within one year from the date of the classification. Assets and liabilities classified as held for sale are presented separately as current items in the statement of financial position. Discontinued operations are excluded from the results of continuing operations and are presented as a single amount as profit or loss after tax from discontinued operations in the income statement. Cash flows generated from discontinued operations are presented as a single item in the statement of cash flows. All other notes to the financial statements include amounts for continuing operations.
(iii) New accounting standards adopted The following new accounting standards, amendments or interpretations have been adopted by the Group as of 1 May 2020: • Amendments to IFRS 3 Business Combinations; • Reform Amendments to IAS 1 and IAS 8 Definition of Material ; and • Amendments to The Conceptual Framework for Financial
Reporting.
The adoption of the new accounting standards, amendments and interpretations has not had a material effect on the results for the year or the financial position at the year end. The accounting policies set out above have been applied consistently in all periods presented in these consolidated financial statements. The accounting policies have been applied consistently by all Group entities.
(iv) Changes to accounting standards not yet adopted Interest Rate Benchmark Reform Benchmark interest rates such as the London Inter-bank Offered Rates (LIBOR) and other inter- bank offered rates have been prioritised for reform and replacement with Risk Free Rates (RFR) by global regulators. Reform of LIBOR rates is expected to be largely completed by the end of 2021. To prepare for this reform, the Group established an IBOR Reform project towards the end of 2020 to determine the impact of a change in benchmark rates on the Group, with particular focus on treasury, tax, accounting, systems, commercial contracts and other agreements. The Group has no hedge accounting relationships that reference LIBOR and did not adopt the Phase 1 amendments to IFRS 9, IAS 39 and IFRS 7, which provided relief from hedge accounting requirements for hedge relationships affected by IBOR reform.
FINANCIAL STATEMENTS
Annual Report 2021 dssmith.com 127
Notes to the consolidated financial statements
126
1. Significant accounting policies (a) Basis of preparation (i) Consolidated financial statements These financial statements are the consolidated financial statements for the Group consisting of DS Smith Plc, a company registered in England and Wales, and all its subsidiaries. The consolidated financial statements have been prepared and approved by the Directors in accordance with international accounting standards in conformity with the requirements of the Companies Act 2006 and International Financial Reporting Standards adopted pursuant to Regulation (EC) No 1606/2002 as it applies in the European Union. The consolidated financial statements have also been prepared in accordance with International Financial Reporting Standards as issued by the International Accounting Standards Board (IASB). On 31 December 2020 EU-adopted IFRS was brought into UK law and became UK adopted international accounting standards, with future changes to IFRS being subject to endorsement by the UK Endorsement Board. The Groups’ Consolidated Financial Statements will transition to UK adopted international accounting standards for financial periods beginning 1 January 2021 onwards. The consolidated financial statements are prepared on the historical cost basis with the exception of biological assets, other investments, assets and liabilities of certain financial instruments and employee benefit plans that are stated at their fair value and share-based payments that are stated at their grant date fair value. The consolidated financial statements have been prepared on a going concern basis as set out on pages 50-51 of the Directors’ report. The Directors consider that adequate resources exist for the Company to continue in operational existence for the foreseeable future. The preparation of consolidated financial statements requires management to make judgements, estimates and assumptions that affect whether and how policies are applied, and the reported amounts of assets and liabilities, income and expenses. Estimates with a significant risk of material adjustment and the critical accounting judgement are discussed in accounting policies 1(z) and 1(aa).
(ii) Discontinued operations The Group classifies non-current assets and disposal groups as held for sale if their carrying amounts will be recovered principally through a sale transaction rather than through continuing use. Non-current assets and disposal groups classified as held for sale are measured at the lower of their carrying amount and fair value less costs to sell. Costs to sell are the incremental costs directly attributable to the disposal of an asset or disposal group, excluding finance costs and income tax expense.
The criteria for held for sale classification is regarded as met only when the sale is highly probable and the asset or disposal group is available for immediate sale in its present condition. Actions required to complete the sale should indicate that it is unlikely that significant changes to the sale will be made or that the decision to sell will be withdrawn. Management must be committed to the plan to sell the asset and the sale is expected to be completed within one year from the date of the classification. Assets and liabilities classified as held for sale are presented separately as current items in the statement of financial position. Discontinued operations are excluded from the results of continuing operations and are presented as a single amount as profit or loss after tax from discontinued operations in the income statement. Cash flows generated from discontinued operations are presented as a single item in the statement of cash flows. All other notes to the financial statements include amounts for continuing operations.
(iii) New accounting standards adopted The following new accounting standards, amendments or interpretations have been adopted by the Group as of 1 May 2020: • Amendments to IFRS 3 Business Combinations; • Reform Amendments to IAS 1 and IAS 8 Definition of Material ; and • Amendments to The Conceptual Framework for Financial
Reporting.
The adoption of the new accounting standards, amendments and interpretations has not had a material effect on the results for the year or the financial position at the year end. The accounting policies set out above have been applied consistently in all periods presented in these consolidated financial statements. The accounting policies have been applied consistently by all Group entities.
(iv) Changes to accounting standards not yet adopted Interest Rate Benchmark Reform Benchmark interest rates such as the London Inter-bank Offered Rates (LIBOR) and other inter- bank offered rates have been prioritised for reform and replacement with Risk Free Rates (RFR) by global regulators. Reform of LIBOR rates is expected to be largely completed by the end of 2021. To prepare for this reform, the Group established an IBOR Reform project towards the end of 2020 to determine the impact of a change in benchmark rates on the Group, with particular focus on treasury, tax, accounting, systems, commercial contracts and other agreements. The Group has no hedge accounting relationships that reference LIBOR and did not adopt the Phase 1 amendments to IFRS 9, IAS 39 and IFRS 7, which provided relief from hedge accounting requirements for hedge relationships affected by IBOR reform.
Annual Report 2021 dssmith.com 127
1. Significant accounting policies continued (a) Basis of preparation continued The Group’s borrowings are substantially fixed rate. The Group has a floating-rate revolving credit facility which references, amongst others, the GBP and USD LIBOR rates. The most significant impact from IBOR reform is expected to be with regard to this facility. It is intended that the Sterling Overnight Index Average rate (SONIA) will form the basis of a replacement for GBP LIBOR and the Secured Overnight Financing Rate (SOFR) will be the replacement for USD LIBOR for GBP and USD borrowings under the revolving credit facility. These RFR indices plus a credit adjustment spread are expected to be economically equivalent to the existing currency LIBOR rates. The drafting of an amendment agreement with the banking group, as a direct consequence of rate reform, is at an advanced stage. The Group will adopt Interest Rate Benchmark reform Phase 2 (Amendments to IFRS 9, IAS 39, IFRS 7, IFRS 4 and IFRS 16) in the next financial year. No material impact on the results of the Group is expected as a consequence of IBOR reform.
(b) Basis of consolidation (i) Subsidiaries The financial statements of subsidiaries are included in the consolidated financial statements from the date that control commences until the date that control ceases. Control is achieved when the Group is exposed to, or has rights to, variable returns from its involvement with the entity and has the ability to affect those returns through its power over the entity. Intra-group balances and any unrealised gains and losses or income and expenses arising from intra-group transactions are eliminated in preparing the consolidated financial statements.
(ii) Interests in equity accounted investments The Group’s interests in equity accounted investments comprise interests in associates and joint ventures. An associate is an entity over which the Group has significant influence, but not control or joint control, over the financial and operating policy decisions of the investment. A joint venture is an entity in which the Group has joint control, whereby the Group has rights to the net assets of the entity, rather than rights to its assets and obligations for its liabilities. Interests in associates and joint ventures are accounted for using the equity method. They are recognised initially at cost, which includes transaction costs. Subsequent to initial recognition the consolidated financial statements include the Group’s share of the profit or loss and other comprehensive income of equity accounted investments, until the date on which significant influence or joint control ceases.
(iii) Non-controlling interests Non-controlling interests are shown as a component of equity in the consolidated statement of financial position net of the value of options over interests held by non-controlling interests in the Group’s subsidiaries.
(iv) Business combinations The acquisition method is used to account for the acquisition of subsidiaries. Identifiable net assets acquired (including intangibles) in a business combination are measured initially at their fair values at the acquisition date.
Where the measurement of the fair value of identifiable net assets acquired is incomplete at the end of the reporting period in which the combination occurs, the Group will report provisional fair values. Final fair values are determined within a year of the acquisition date and applied retrospectively. The excess of the consideration transferred and the amount of any non-controlling interest over the fair value of the identifiable assets (including intangibles), liabilities and contingent liabilities acquired is recorded as goodwill. The consideration transferred is measured as the fair value of the assets given, equity instruments issued (if any), and liabilities assumed or incurred at the date of acquisition. Acquisition related costs are expensed as incurred. The results of the subsidiaries acquired are included in the consolidated financial statements from the acquisition date.
(c) Revenue The Group is in the business of providing sustainable packaging solutions, sustainable paper products, recycling and waste management services. The Group has concluded that it is the principal in its revenue arrangements. Revenue comprises the fair value of the sale of goods and services, net of value added tax and other sales taxes, rebates and discounts and after eliminating sales within the Group. Revenue from contracts with customers is recognised when control of the goods or services is transferred to the customer at an amount that reflects the consideration to which the Group expects to be entitled in exchange for those goods or services and the fulfilment of the related performance obligations. Generally this occurs when the goods are loaded into the collection vehicle if the buyer is collecting them, or when the goods are unloaded at the delivery address if the Group is responsible for delivery. The transaction price is the contractual price with the customer adjusted for rebates and discounts. Rebates and discounts are estimated using historical data and experiences with the customers. Revenue is recognised to the extent that it is highly probable that a significant reversal will not occur. Returns from customers are negligible. No element of financing is deemed present as typical sales contracts with customers are usually shorter than 12 months. A receivable is recognised when the goods are delivered or services provided at a point in time that consideration is unconditional because only the passage of time is required before the payment is due. Revenue by function is not provided in the Group’s disclosures as the year-on-year variability in the degree of integration would be misrepresentative of the level of activity.
(d) Supplier rebates The Group receives income from its suppliers, mainly in the form of volume based rebates and early settlement discounts. These are recognised as a reduction in operating costs in the year to which they relate. At the period end, where appropriate, the Group estimates supplier income due from annual agreements for volume rebates.

FINANCIAL STATEMENTS
128
Notes to the consolidated financial statements (continued)
128
1. Significant accounting policies continued (e) Government grants Government grants are recognised in the statement of financial position initially as deferred income when there is reasonable assurance that they will be received and that the Group will comply with the conditions attached to them. Grants that compensate the Group for expenses incurred are offset against the expenses in the same periods in which the expenses are incurred. Grants relating to assets are released to the income statement over the expected useful life of the asset to which they relate on a basis consistent with the depreciation policy. Depreciation is provided on the full cost of the assets before deducting grants.
(f) Dividends Dividends attributable to the equity holders of the Company paid during the year are recognised directly in equity.
(g) Foreign currency translation The consolidated financial statements are presented in sterling, which is the Group’s presentational currency. Transactions in foreign currencies are translated into the respective functional currencies of Group companies at the foreign exchange rates ruling at the dates of the transactions. Monetary assets and liabilities denominated in foreign currencies at the reporting date are translated into the functional currency at the foreign exchange rates ruling at that date. Foreign exchange differences arising on translation of monetary assets and liabilities are recognised in the consolidated income statement. Non-monetary assets and liabilities that are measured at historical cost in a foreign currency are translated using the exchange rates at the dates of the transactions. The assets and liabilities of all the Group entities that have a functional currency other than sterling are translated at the closing exchange rate at the reporting date. Income and expenses for each income statement are translated at average exchange rates (unless this average is not a reasonable approximation of the cumulative effect of the rates prevailing on the transaction dates, in which case income and expenses are translated at the date of the transactions). On consolidation, exchange differences arising from the translation of the net investment in foreign entities, borrowings, and other financial instruments designated as hedges of such investments, are recognised in the translation reserve. On the disposal of foreign currency entities, the cumulative exchange difference recorded in the translation reserve is taken to the consolidated income statement as part of the gain or loss on disposal.
(h) Intangible assets (i) Goodwill The recognition of business combinations requires the excess of the purchase price of acquisitions over the net book value of identifiable assets acquired to be allocated to the assets and liabilities of the acquired entity. The Group makes judgements and estimates in relation to the fair value allocation of the purchase price. Goodwill is stated at cost less accumulated impairment losses. The useful life of goodwill is considered to be indefinite. Goodwill is allocated to the cash generating units (CGUs), or groups of CGUs, that are expected to benefit from the synergies of the combination and is
tested annually for impairment, or more frequently if an impairment is indicated. On disposal of a subsidiary or a jointly controlled entity, the attributable amount of goodwill is included in the determination of the profit or loss recognised in the consolidated income statement.
(ii) Intellectual property Intellectual property is stated at cost less accumulated amortisation and impairment.
(iii) Computer software Computer software that is integral to a related item of hardware is included within property, plant and equipment. All other computer software is treated as an intangible asset.
(iv) Customer related Customer relationships, acquired as part of a business combination, are capitalised separately from goodwill and are carried at cost less accumulated amortisation and impairment.
(v) Other intangible assets Other intangible assets that are acquired by the Group are carried at cost less accumulated amortisation and impairment.
(vi) Amortisation Amortisation of intangible assets (excluding goodwill) is charged to the income statement on a straight-line basis over the estimated useful lives of intangible assets, unless such lives are indefinite. Intangible assets (other than goodwill) are amortised from the date they are available for use. The estimated useful lives are as follows: Intellectual property Up to 20 yearsComputer software 3–5 yearsCustomer relationships 5–15 years
(i) Property, plant and equipment Property, plant and equipment is stated at cost less accumulated depreciation and impairment. Depreciation is charged to the income statement on a straight-line basis over the estimated useful lives of each item of property, plant and equipment, and major components that are accounted for separately (or in the case of leased assets, the lease period, if shorter). Land is not depreciated. The estimated useful lives are as follows: Freehold and long leasehold properties 10–50 yearsPlant and equipment – motor vehicles 3–5 yearsPlant and equipment – other, fixtures and fittings (including IT hardware)
2–30 years
FINANCIAL STATEMENTS
Annual Report 2021 dssmith.com 129
Notes to the consolidated financial statements (continued)
128
1. Significant accounting policies continued (e) Government grants Government grants are recognised in the statement of financial position initially as deferred income when there is reasonable assurance that they will be received and that the Group will comply with the conditions attached to them. Grants that compensate the Group for expenses incurred are offset against the expenses in the same periods in which the expenses are incurred. Grants relating to assets are released to the income statement over the expected useful life of the asset to which they relate on a basis consistent with the depreciation policy. Depreciation is provided on the full cost of the assets before deducting grants.
(f) Dividends Dividends attributable to the equity holders of the Company paid during the year are recognised directly in equity.
(g) Foreign currency translation The consolidated financial statements are presented in sterling, which is the Group’s presentational currency. Transactions in foreign currencies are translated into the respective functional currencies of Group companies at the foreign exchange rates ruling at the dates of the transactions. Monetary assets and liabilities denominated in foreign currencies at the reporting date are translated into the functional currency at the foreign exchange rates ruling at that date. Foreign exchange differences arising on translation of monetary assets and liabilities are recognised in the consolidated income statement. Non-monetary assets and liabilities that are measured at historical cost in a foreign currency are translated using the exchange rates at the dates of the transactions. The assets and liabilities of all the Group entities that have a functional currency other than sterling are translated at the closing exchange rate at the reporting date. Income and expenses for each income statement are translated at average exchange rates (unless this average is not a reasonable approximation of the cumulative effect of the rates prevailing on the transaction dates, in which case income and expenses are translated at the date of the transactions). On consolidation, exchange differences arising from the translation of the net investment in foreign entities, borrowings, and other financial instruments designated as hedges of such investments, are recognised in the translation reserve. On the disposal of foreign currency entities, the cumulative exchange difference recorded in the translation reserve is taken to the consolidated income statement as part of the gain or loss on disposal.
(h) Intangible assets (i) Goodwill The recognition of business combinations requires the excess of the purchase price of acquisitions over the net book value of identifiable assets acquired to be allocated to the assets and liabilities of the acquired entity. The Group makes judgements and estimates in relation to the fair value allocation of the purchase price. Goodwill is stated at cost less accumulated impairment losses. The useful life of goodwill is considered to be indefinite. Goodwill is allocated to the cash generating units (CGUs), or groups of CGUs, that are expected to benefit from the synergies of the combination and is
tested annually for impairment, or more frequently if an impairment is indicated. On disposal of a subsidiary or a jointly controlled entity, the attributable amount of goodwill is included in the determination of the profit or loss recognised in the consolidated income statement.
(ii) Intellectual property Intellectual property is stated at cost less accumulated amortisation and impairment.
(iii) Computer software Computer software that is integral to a related item of hardware is included within property, plant and equipment. All other computer software is treated as an intangible asset.
(iv) Customer related Customer relationships, acquired as part of a business combination, are capitalised separately from goodwill and are carried at cost less accumulated amortisation and impairment.
(v) Other intangible assets Other intangible assets that are acquired by the Group are carried at cost less accumulated amortisation and impairment.
(vi) Amortisation Amortisation of intangible assets (excluding goodwill) is charged to the income statement on a straight-line basis over the estimated useful lives of intangible assets, unless such lives are indefinite. Intangible assets (other than goodwill) are amortised from the date they are available for use. The estimated useful lives are as follows: Intellectual property Up to 20 yearsComputer software 3–5 yearsCustomer relationships 5–15 years
(i) Property, plant and equipment Property, plant and equipment is stated at cost less accumulated depreciation and impairment. Depreciation is charged to the income statement on a straight-line basis over the estimated useful lives of each item of property, plant and equipment, and major components that are accounted for separately (or in the case of leased assets, the lease period, if shorter). Land is not depreciated. The estimated useful lives are as follows: Freehold and long leasehold properties 10–50 yearsPlant and equipment – motor vehicles 3–5 yearsPlant and equipment – other, fixtures and fittings (including IT hardware)
2–30 years
Annual Report 2021 dssmith.com 129
1. Significant accounting policies continued (i) Property, plant and equipment continued Gains or losses arising on the sale of surplus property assets are recorded through operating profit before adjusting items.
(j) Other investments Other investments primarily consist of investments in unquoted equity securities and restricted cash. Equity securities are measured at fair value. On initial recognition, the Group makes an irrevocable election (on an instrument-by-instrument basis) to designate investments in equity instruments as at fair value through other comprehensive income (FVTOCI). Designation at FVTOCI is not permitted if the equity investment is held for trading or if it is contingent consideration recognised by an acquirer in a business combination. Investment in equity instruments at FVTOCI are initially measured at fair value plus transaction costs. Subsequently, they are measured at fair value with gains and losses arising from changes in fair value recognised in other comprehensive income and accumulated in the investment revaluation reserve. The cumulative gain or loss is not reclassified to profit or loss on divestment of the equity investments; instead, it is transferred to retained earnings. The Group has designated all investments in equity that are not held for trading as at FVTOCI. Restricted cash is carried at amortised cost less any impairment.
(k) Impairment The carrying amounts of the Group’s assets, including tangible and intangible non-current assets, are reviewed at each reporting date to determine whether there are any indicators of impairment. If any such indicators exist, the asset’s recoverable amount is estimated. Goodwill is tested for impairment annually at the same time, regardless of the presence of an impairment indicator. An impairment loss is recognised whenever the carrying amount of an asset, collection of assets or its CGU exceeds its recoverable amount. Impairment losses are recognised in the consolidated income statement.
(i) Cash generating units For the purposes of property, plant and equipment and other intangibles impairment testing, each operating segment, split by process (e.g. Packaging, Paper, Recycling), is a separate individual CGU. Goodwill impairment testing is carried out based on regional groupings of CGUs as set out in note 10, as this is the lowest level at which goodwill is monitored for internal management purposes.
(ii) Calculation of recoverable amount The recoverable amount of the Group’s assets is calculated as the value-in-use of the CGU to which the assets are attributed or the net selling price, if greater. Value-in-use is calculated by discounting the cash flows expected to be generated by the CGU/group of CGUs being tested for evidence of impairment. This is done using a pre-tax discount rate that reflects the current assessment of the time value of money, and the country-specific risks for which the cash flows have not been adjusted. For an asset that does not generate largely independent cash flows, the recoverable amount is determined for the CGU to which the asset belongs.
(iii) Reversals of impairment Impairment losses in respect of goodwill are not reversed. In respect of other assets, an impairment loss is reversed if there has been a change in the estimates used to determine the recoverable amount. An impairment loss is reversed only to the extent that the asset’s carrying amount does not exceed the carrying amount that would have been determined, net of depreciation or amortisation, if no impairment loss had been recognised.
(l) Derivative financial instruments The Group uses derivative financial instruments, primarily currency and commodity swaps, to manage currency and commodity risks associated with the Group’s underlying business activities and the financing of these activities. The Group has a policy not to, and does not, undertake any speculative activity in these instruments. Such derivative financial instruments are initially recognised at fair value on the date on which a derivative contract is entered into and are subsequently remeasured at fair value. Derivatives are carried as assets when the fair value is positive and as liabilities when the fair value is negative. The Group has elected to continue to apply the hedge accounting requirements of IAS 39, as allowed under IFRS 9. Derivative financial instruments are accounted for as hedges when designated as hedges at the inception of the contract and when the financial instruments provide an effective hedge of the underlying risk. For the purpose of hedge accounting, hedges are classified as: • cash flow hedges when hedging exposure to variability in cash
flows that is attributable to a particular risk associated with either a statement of financial position item or a highly probable forecast transaction; or
• hedges of the net investment in a foreign entity.
The treatment of gains and losses arising from revaluing derivatives designated as hedging instruments depends on the nature of the hedging relationship as follows: Cash flow hedges: the effective portion of the gain or loss on the hedging instrument is recognised directly in equity, while the ineffective portion is recognised in the income statement. Amounts taken to equity are transferred to the income statement in the same period during which the hedged transaction affects profit or loss, such as when a forecast sale or purchase occurs. Where the hedged item is the cost of a non-financial asset or liability, the amounts taken to equity are transferred to the initial carrying amount of the non-financial asset or liability. If the hedging instrument expires or is sold, terminated or exercised without replacement or roll-over, the hedged transaction ceases to be highly probable, or if its designation as a hedge is revoked, amounts previously recognised in equity remain in equity until the forecast transaction occurs and are transferred to the income statement or to the initial carrying amount of a non-financial asset or liability as above. If a forecast transaction is no longer expected to occur, amounts previously recognised in equity are transferred to the income statement.
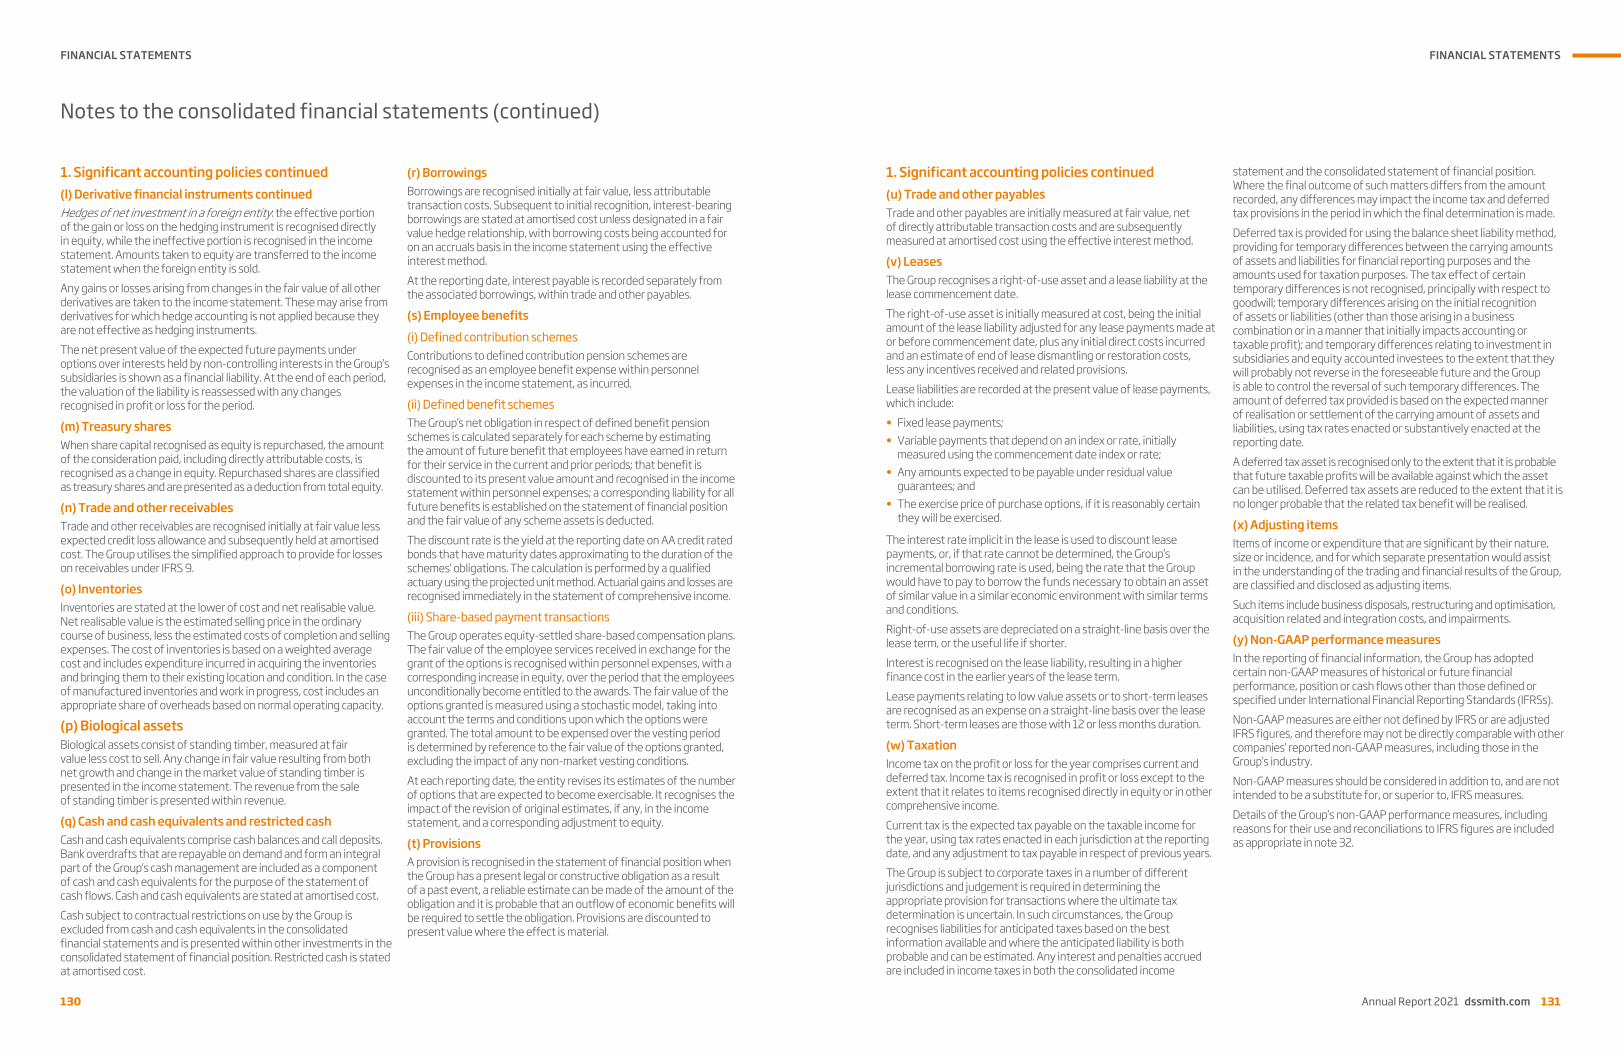
FINANCIAL STATEMENTS
130
Notes to the consolidated financial statements (continued)
130
1. Significant accounting policies continued (l) Derivative financial instruments continued Hedges of net investment in a foreign entity: the effective portion of the gain or loss on the hedging instrument is recognised directly in equity, while the ineffective portion is recognised in the income statement. Amounts taken to equity are transferred to the income statement when the foreign entity is sold. Any gains or losses arising from changes in the fair value of all other derivatives are taken to the income statement. These may arise from derivatives for which hedge accounting is not applied because they are not effective as hedging instruments. The net present value of the expected future payments under options over interests held by non-controlling interests in the Group’s subsidiaries is shown as a financial liability. At the end of each period, the valuation of the liability is reassessed with any changes recognised in profit or loss for the period.
(m) Treasury shares When share capital recognised as equity is repurchased, the amount of the consideration paid, including directly attributable costs, is recognised as a change in equity. Repurchased shares are classified as treasury shares and are presented as a deduction from total equity.
(n) Trade and other receivables Trade and other receivables are recognised initially at fair value less expected credit loss allowance and subsequently held at amortised cost. The Group utilises the simplified approach to provide for losses on receivables under IFRS 9.
(o) Inventories Inventories are stated at the lower of cost and net realisable value. Net realisable value is the estimated selling price in the ordinary course of business, less the estimated costs of completion and selling expenses. The cost of inventories is based on a weighted average cost and includes expenditure incurred in acquiring the inventories and bringing them to their existing location and condition. In the case of manufactured inventories and work in progress, cost includes an appropriate share of overheads based on normal operating capacity.
(p) Biological assets Biological assets consist of standing timber, measured at fair value less cost to sell. Any change in fair value resulting from both net growth and change in the market value of standing timber is presented in the income statement. The revenue from the sale of standing timber is presented within revenue.
(q) Cash and cash equivalents and restricted cash Cash and cash equivalents comprise cash balances and call deposits. Bank overdrafts that are repayable on demand and form an integral part of the Group’s cash management are included as a component of cash and cash equivalents for the purpose of the statement of cash flows. Cash and cash equivalents are stated at amortised cost. Cash subject to contractual restrictions on use by the Group is excluded from cash and cash equivalents in the consolidated financial statements and is presented within other investments in the consolidated statement of financial position. Restricted cash is stated at amortised cost.
(r) Borrowings Borrowings are recognised initially at fair value, less attributable transaction costs. Subsequent to initial recognition, interest-bearing borrowings are stated at amortised cost unless designated in a fair value hedge relationship, with borrowing costs being accounted for on an accruals basis in the income statement using the effective interest method. At the reporting date, interest payable is recorded separately from the associated borrowings, within trade and other payables.
(s) Employee benefits (i) Defined contribution schemes Contributions to defined contribution pension schemes are recognised as an employee benefit expense within personnel expenses in the income statement, as incurred.
(ii) Defined benefit schemes The Group’s net obligation in respect of defined benefit pension schemes is calculated separately for each scheme by estimating the amount of future benefit that employees have earned in return for their service in the current and prior periods; that benefit is discounted to its present value amount and recognised in the income statement within personnel expenses; a corresponding liability for all future benefits is established on the statement of financial position and the fair value of any scheme assets is deducted. The discount rate is the yield at the reporting date on AA credit rated bonds that have maturity dates approximating to the duration of the schemes’ obligations. The calculation is performed by a qualified actuary using the projected unit method. Actuarial gains and losses are recognised immediately in the statement of comprehensive income.
(iii) Share-based payment transactions The Group operates equity-settled share-based compensation plans. The fair value of the employee services received in exchange for the grant of the options is recognised within personnel expenses, with a corresponding increase in equity, over the period that the employees unconditionally become entitled to the awards. The fair value of the options granted is measured using a stochastic model, taking into account the terms and conditions upon which the options were granted. The total amount to be expensed over the vesting period is determined by reference to the fair value of the options granted, excluding the impact of any non-market vesting conditions. At each reporting date, the entity revises its estimates of the number of options that are expected to become exercisable. It recognises the impact of the revision of original estimates, if any, in the income statement, and a corresponding adjustment to equity.
(t) Provisions A provision is recognised in the statement of financial position when the Group has a present legal or constructive obligation as a result of a past event, a reliable estimate can be made of the amount of the obligation and it is probable that an outflow of economic benefits will be required to settle the obligation. Provisions are discounted to present value where the effect is material.
FINANCIAL STATEMENTS
Annual Report 2021 dssmith.com 131
Notes to the consolidated financial statements (continued)
130
1. Significant accounting policies continued (l) Derivative financial instruments continued Hedges of net investment in a foreign entity: the effective portion of the gain or loss on the hedging instrument is recognised directly in equity, while the ineffective portion is recognised in the income statement. Amounts taken to equity are transferred to the income statement when the foreign entity is sold. Any gains or losses arising from changes in the fair value of all other derivatives are taken to the income statement. These may arise from derivatives for which hedge accounting is not applied because they are not effective as hedging instruments. The net present value of the expected future payments under options over interests held by non-controlling interests in the Group’s subsidiaries is shown as a financial liability. At the end of each period, the valuation of the liability is reassessed with any changes recognised in profit or loss for the period.
(m) Treasury shares When share capital recognised as equity is repurchased, the amount of the consideration paid, including directly attributable costs, is recognised as a change in equity. Repurchased shares are classified as treasury shares and are presented as a deduction from total equity.
(n) Trade and other receivables Trade and other receivables are recognised initially at fair value less expected credit loss allowance and subsequently held at amortised cost. The Group utilises the simplified approach to provide for losses on receivables under IFRS 9.
(o) Inventories Inventories are stated at the lower of cost and net realisable value. Net realisable value is the estimated selling price in the ordinary course of business, less the estimated costs of completion and selling expenses. The cost of inventories is based on a weighted average cost and includes expenditure incurred in acquiring the inventories and bringing them to their existing location and condition. In the case of manufactured inventories and work in progress, cost includes an appropriate share of overheads based on normal operating capacity.
(p) Biological assets Biological assets consist of standing timber, measured at fair value less cost to sell. Any change in fair value resulting from both net growth and change in the market value of standing timber is presented in the income statement. The revenue from the sale of standing timber is presented within revenue.
(q) Cash and cash equivalents and restricted cash Cash and cash equivalents comprise cash balances and call deposits. Bank overdrafts that are repayable on demand and form an integral part of the Group’s cash management are included as a component of cash and cash equivalents for the purpose of the statement of cash flows. Cash and cash equivalents are stated at amortised cost. Cash subject to contractual restrictions on use by the Group is excluded from cash and cash equivalents in the consolidated financial statements and is presented within other investments in the consolidated statement of financial position. Restricted cash is stated at amortised cost.
(r) Borrowings Borrowings are recognised initially at fair value, less attributable transaction costs. Subsequent to initial recognition, interest-bearing borrowings are stated at amortised cost unless designated in a fair value hedge relationship, with borrowing costs being accounted for on an accruals basis in the income statement using the effective interest method. At the reporting date, interest payable is recorded separately from the associated borrowings, within trade and other payables.
(s) Employee benefits (i) Defined contribution schemes Contributions to defined contribution pension schemes are recognised as an employee benefit expense within personnel expenses in the income statement, as incurred.
(ii) Defined benefit schemes The Group’s net obligation in respect of defined benefit pension schemes is calculated separately for each scheme by estimating the amount of future benefit that employees have earned in return for their service in the current and prior periods; that benefit is discounted to its present value amount and recognised in the income statement within personnel expenses; a corresponding liability for all future benefits is established on the statement of financial position and the fair value of any scheme assets is deducted. The discount rate is the yield at the reporting date on AA credit rated bonds that have maturity dates approximating to the duration of the schemes’ obligations. The calculation is performed by a qualified actuary using the projected unit method. Actuarial gains and losses are recognised immediately in the statement of comprehensive income.
(iii) Share-based payment transactions The Group operates equity-settled share-based compensation plans. The fair value of the employee services received in exchange for the grant of the options is recognised within personnel expenses, with a corresponding increase in equity, over the period that the employees unconditionally become entitled to the awards. The fair value of the options granted is measured using a stochastic model, taking into account the terms and conditions upon which the options were granted. The total amount to be expensed over the vesting period is determined by reference to the fair value of the options granted, excluding the impact of any non-market vesting conditions. At each reporting date, the entity revises its estimates of the number of options that are expected to become exercisable. It recognises the impact of the revision of original estimates, if any, in the income statement, and a corresponding adjustment to equity.
(t) Provisions A provision is recognised in the statement of financial position when the Group has a present legal or constructive obligation as a result of a past event, a reliable estimate can be made of the amount of the obligation and it is probable that an outflow of economic benefits will be required to settle the obligation. Provisions are discounted to present value where the effect is material.
Annual Report 2021 dssmith.com 131
1. Significant accounting policies continued (u) Trade and other payables Trade and other payables are initially measured at fair value, net of directly attributable transaction costs and are subsequently measured at amortised cost using the effective interest method.
(v) Leases The Group recognises a right-of-use asset and a lease liability at the lease commencement date. The right-of-use asset is initially measured at cost, being the initial amount of the lease liability adjusted for any lease payments made at or before commencement date, plus any initial direct costs incurred and an estimate of end of lease dismantling or restoration costs, less any incentives received and related provisions. Lease liabilities are recorded at the present value of lease payments, which include: • Fixed lease payments; • Variable payments that depend on an index or rate, initially
measured using the commencement date index or rate; • Any amounts expected to be payable under residual value
guarantees; and • The exercise price of purchase options, if it is reasonably certain
they will be exercised.
The interest rate implicit in the lease is used to discount lease payments, or, if that rate cannot be determined, the Group’s incremental borrowing rate is used, being the rate that the Group would have to pay to borrow the funds necessary to obtain an asset of similar value in a similar economic environment with similar terms and conditions. Right-of-use assets are depreciated on a straight-line basis over the lease term, or the useful life if shorter. Interest is recognised on the lease liability, resulting in a higher finance cost in the earlier years of the lease term. Lease payments relating to low value assets or to short-term leases are recognised as an expense on a straight-line basis over the lease term. Short-term leases are those with 12 or less months duration.
(w) Taxation Income tax on the profit or loss for the year comprises current and deferred tax. Income tax is recognised in profit or loss except to the extent that it relates to items recognised directly in equity or in other comprehensive income. Current tax is the expected tax payable on the taxable income for the year, using tax rates enacted in each jurisdiction at the reporting date, and any adjustment to tax payable in respect of previous years. The Group is subject to corporate taxes in a number of different jurisdictions and judgement is required in determining the appropriate provision for transactions where the ultimate tax determination is uncertain. In such circumstances, the Group recognises liabilities for anticipated taxes based on the best information available and where the anticipated liability is both probable and can be estimated. Any interest and penalties accrued are included in income taxes in both the consolidated income
statement and the consolidated statement of financial position. Where the final outcome of such matters differs from the amount recorded, any differences may impact the income tax and deferred tax provisions in the period in which the final determination is made. Deferred tax is provided for using the balance sheet liability method, providing for temporary differences between the carrying amounts of assets and liabilities for financial reporting purposes and the amounts used for taxation purposes. The tax effect of certain temporary differences is not recognised, principally with respect to goodwill; temporary differences arising on the initial recognition of assets or liabilities (other than those arising in a business combination or in a manner that initially impacts accounting or taxable profit); and temporary differences relating to investment in subsidiaries and equity accounted investees to the extent that they will probably not reverse in the foreseeable future and the Group is able to control the reversal of such temporary differences. The amount of deferred tax provided is based on the expected manner of realisation or settlement of the carrying amount of assets and liabilities, using tax rates enacted or substantively enacted at the reporting date. A deferred tax asset is recognised only to the extent that it is probable that future taxable profits will be available against which the asset can be utilised. Deferred tax assets are reduced to the extent that it is no longer probable that the related tax benefit will be realised.
(x) Adjusting items Items of income or expenditure that are significant by their nature, size or incidence, and for which separate presentation would assist in the understanding of the trading and financial results of the Group, are classified and disclosed as adjusting items. Such items include business disposals, restructuring and optimisation, acquisition related and integration costs, and impairments.
(y) Non-GAAP performance measures In the reporting of financial information, the Group has adopted certain non-GAAP measures of historical or future financial performance, position or cash flows other than those defined or specified under International Financial Reporting Standards (IFRSs). Non-GAAP measures are either not defined by IFRS or are adjusted IFRS figures, and therefore may not be directly comparable with other companies’ reported non-GAAP measures, including those in the Group’s industry. Non-GAAP measures should be considered in addition to, and are not intended to be a substitute for, or superior to, IFRS measures. Details of the Group’s non-GAAP performance measures, including reasons for their use and reconciliations to IFRS figures are included as appropriate in note 32.
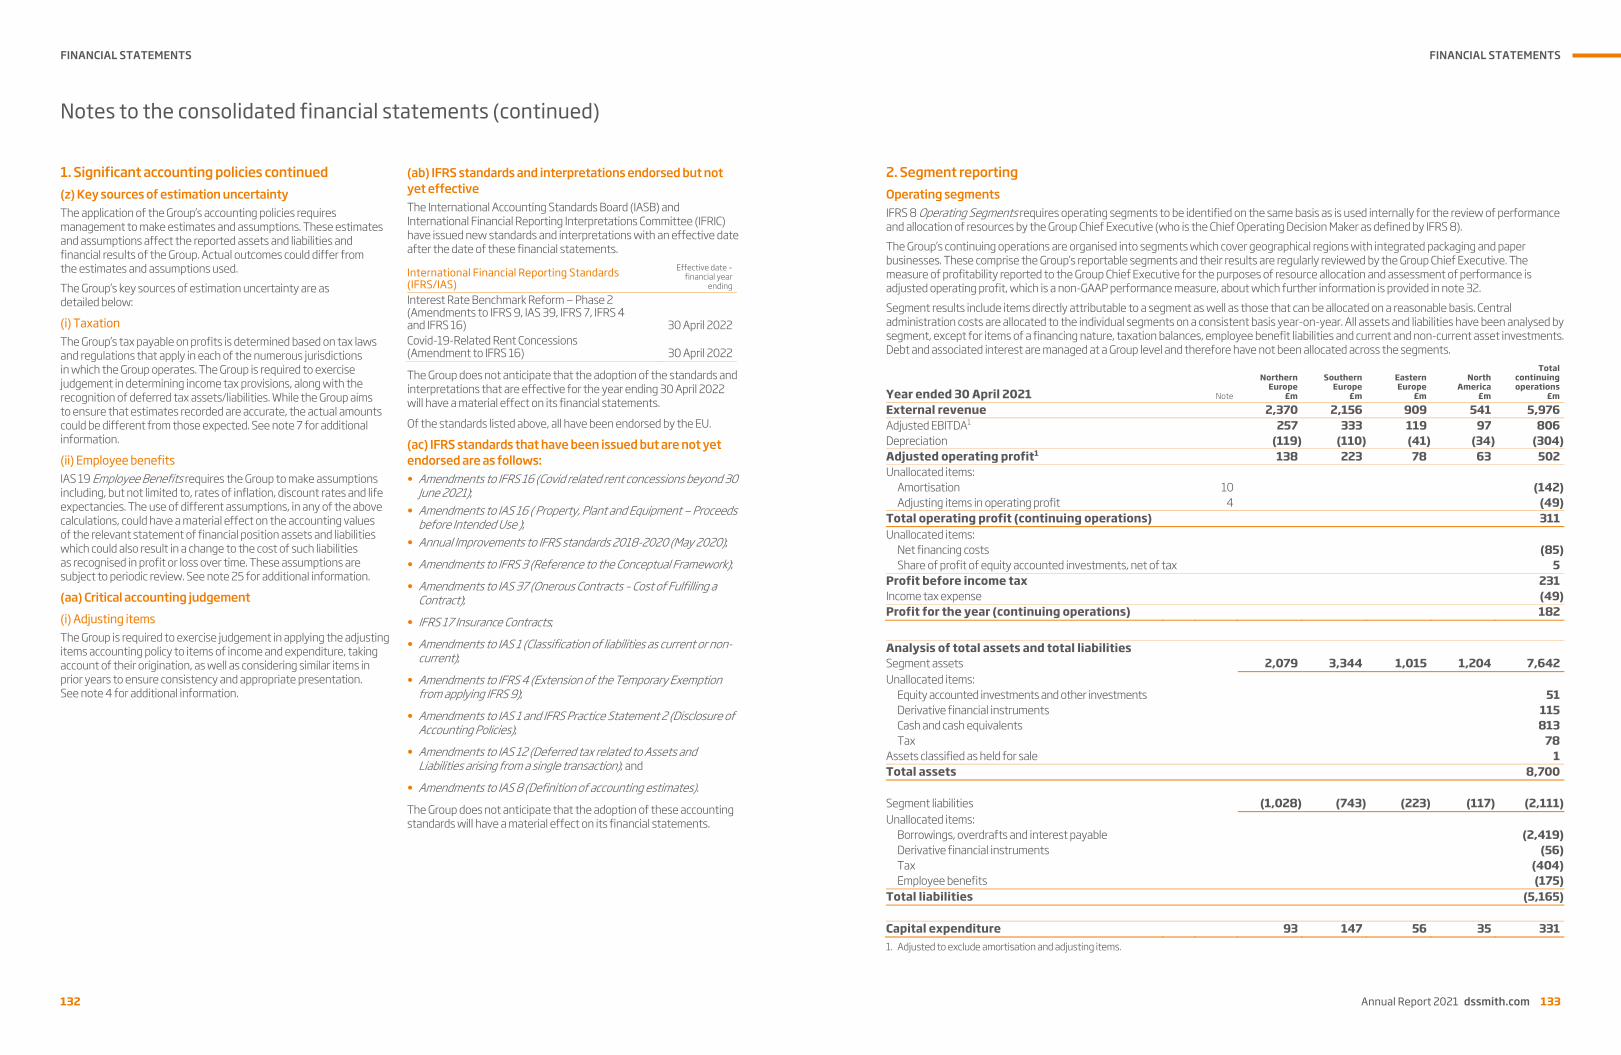
FINANCIAL STATEMENTS
132
Notes to the consolidated financial statements (continued)
132
1. Significant accounting policies continued (z) Key sources of estimation uncertainty The application of the Group’s accounting policies requires management to make estimates and assumptions. These estimates and assumptions affect the reported assets and liabilities and financial results of the Group. Actual outcomes could differ from the estimates and assumptions used. The Group’s key sources of estimation uncertainty are as detailed below:
(i) Taxation The Group’s tax payable on profits is determined based on tax laws and regulations that apply in each of the numerous jurisdictions in which the Group operates. The Group is required to exercise judgement in determining income tax provisions, along with the recognition of deferred tax assets/liabilities. While the Group aims to ensure that estimates recorded are accurate, the actual amounts could be different from those expected. See note 7 for additional information.
(ii) Employee benefits IAS 19 Employee Benefits requires the Group to make assumptions including, but not limited to, rates of inflation, discount rates and life expectancies. The use of different assumptions, in any of the above calculations, could have a material effect on the accounting values of the relevant statement of financial position assets and liabilities which could also result in a change to the cost of such liabilities as recognised in profit or loss over time. These assumptions are subject to periodic review. See note 25 for additional information.
(aa) Critical accounting judgement (i) Adjusting items The Group is required to exercise judgement in applying the adjusting items accounting policy to items of income and expenditure, taking account of their origination, as well as considering similar items in prior years to ensure consistency and appropriate presentation. See note 4 for additional information.
(ab) IFRS standards and interpretations endorsed but not yet effective The International Accounting Standards Board (IASB) and International Financial Reporting Interpretations Committee (IFRIC) have issued new standards and interpretations with an effective date after the date of these financial statements.
International Financial Reporting Standards (IFRS/IAS)
Effective date –financial year
ending
Interest Rate Benchmark Reform — Phase 2 (Amendments to IFRS 9, IAS 39, IFRS 7, IFRS 4 and IFRS 16) 30 April 2022Covid-19-Related Rent Concessions (Amendment to IFRS 16) 30 April 2022
The Group does not anticipate that the adoption of the standards and interpretations that are effective for the year ending 30 April 2022 will have a material effect on its financial statements.
Of the standards listed above, all have been endorsed by the EU.
(ac) IFRS standards that have been issued but are not yet endorsed are as follows: • Amendments to IFRS 16 (Covid related rent concessions beyond 30
June 2021); • Amendments to IAS 16 ( Property, Plant and Equipment — Proceeds
before Intended Use ); • Annual Improvements to IFRS standards 2018-2020 (May 2020);
• Amendments to IFRS 3 (Reference to the Conceptual Framework);
• Amendments to IAS 37 (Onerous Contracts – Cost of Fulfilling a Contract);
• IFRS 17 Insurance Contracts;
• Amendments to IAS 1 (Classification of liabilities as current or non-current);
• Amendments to IFRS 4 (Extension of the Temporary Exemption from applying IFRS 9);
• Amendments to IAS 1 and IFRS Practice Statement 2 (Disclosure of Accounting Policies);
• Amendments to IAS 12 (Deferred tax related to Assets and Liabilities arising from a single transaction); and
• Amendments to IAS 8 (Definition of accounting estimates).
The Group does not anticipate that the adoption of these accounting standards will have a material effect on its financial statements.
FINANCIAL STATEMENTS
Annual Report 2021 dssmith.com 133
Notes to the consolidated financial statements (continued)
132
1. Significant accounting policies continued (z) Key sources of estimation uncertainty The application of the Group’s accounting policies requires management to make estimates and assumptions. These estimates and assumptions affect the reported assets and liabilities and financial results of the Group. Actual outcomes could differ from the estimates and assumptions used. The Group’s key sources of estimation uncertainty are as detailed below:
(i) Taxation The Group’s tax payable on profits is determined based on tax laws and regulations that apply in each of the numerous jurisdictions in which the Group operates. The Group is required to exercise judgement in determining income tax provisions, along with the recognition of deferred tax assets/liabilities. While the Group aims to ensure that estimates recorded are accurate, the actual amounts could be different from those expected. See note 7 for additional information.
(ii) Employee benefits IAS 19 Employee Benefits requires the Group to make assumptions including, but not limited to, rates of inflation, discount rates and life expectancies. The use of different assumptions, in any of the above calculations, could have a material effect on the accounting values of the relevant statement of financial position assets and liabilities which could also result in a change to the cost of such liabilities as recognised in profit or loss over time. These assumptions are subject to periodic review. See note 25 for additional information.
(aa) Critical accounting judgement (i) Adjusting items The Group is required to exercise judgement in applying the adjusting items accounting policy to items of income and expenditure, taking account of their origination, as well as considering similar items in prior years to ensure consistency and appropriate presentation. See note 4 for additional information.
(ab) IFRS standards and interpretations endorsed but not yet effective The International Accounting Standards Board (IASB) and International Financial Reporting Interpretations Committee (IFRIC) have issued new standards and interpretations with an effective date after the date of these financial statements.
International Financial Reporting Standards (IFRS/IAS)
Effective date –financial year
ending
Interest Rate Benchmark Reform — Phase 2 (Amendments to IFRS 9, IAS 39, IFRS 7, IFRS 4 and IFRS 16) 30 April 2022Covid-19-Related Rent Concessions (Amendment to IFRS 16) 30 April 2022
The Group does not anticipate that the adoption of the standards and interpretations that are effective for the year ending 30 April 2022 will have a material effect on its financial statements.
Of the standards listed above, all have been endorsed by the EU.
(ac) IFRS standards that have been issued but are not yet endorsed are as follows: • Amendments to IFRS 16 (Covid related rent concessions beyond 30
June 2021); • Amendments to IAS 16 ( Property, Plant and Equipment — Proceeds
before Intended Use ); • Annual Improvements to IFRS standards 2018-2020 (May 2020);
• Amendments to IFRS 3 (Reference to the Conceptual Framework);
• Amendments to IAS 37 (Onerous Contracts – Cost of Fulfilling a Contract);
• IFRS 17 Insurance Contracts;
• Amendments to IAS 1 (Classification of liabilities as current or non-current);
• Amendments to IFRS 4 (Extension of the Temporary Exemption from applying IFRS 9);
• Amendments to IAS 1 and IFRS Practice Statement 2 (Disclosure of Accounting Policies);
• Amendments to IAS 12 (Deferred tax related to Assets and Liabilities arising from a single transaction); and
• Amendments to IAS 8 (Definition of accounting estimates).
The Group does not anticipate that the adoption of these accounting standards will have a material effect on its financial statements.
Annual Report 2021 dssmith.com 133
2. Segment reporting Operating segments IFRS 8 Operating Segments requires operating segments to be identified on the same basis as is used internally for the review of performance and allocation of resources by the Group Chief Executive (who is the Chief Operating Decision Maker as defined by IFRS 8). The Group’s continuing operations are organised into segments which cover geographical regions with integrated packaging and paper businesses. These comprise the Group’s reportable segments and their results are regularly reviewed by the Group Chief Executive. The measure of profitability reported to the Group Chief Executive for the purposes of resource allocation and assessment of performance is adjusted operating profit, which is a non-GAAP performance measure, about which further information is provided in note 32. Segment results include items directly attributable to a segment as well as those that can be allocated on a reasonable basis. Central administration costs are allocated to the individual segments on a consistent basis year-on-year. All assets and liabilities have been analysed by segment, except for items of a financing nature, taxation balances, employee benefit liabilities and current and non-current asset investments. Debt and associated interest are managed at a Group level and therefore have not been allocated across the segments.
Year ended 30 April 2021 Note
Northern Europe
£m
Southern Europe
£m
Eastern Europe
£m
North America
£m
Total continuing operations
£m
External revenue 2,370 2,156 909 541 5,976Adjusted EBITDA1 257 333 119 97 806Depreciation (119) (110) (41) (34) (304)Adjusted operating profit1 138 223 78 63 502Unallocated items:
Amortisation 10 (142)Adjusting items in operating profit 4 (49)
Total operating profit (continuing operations) 311Unallocated items:
Net financing costs (85)Share of profit of equity accounted investments, net of tax 5
Profit before income tax 231Income tax expense (49)Profit for the year (continuing operations) 182 Analysis of total assets and total liabilities Segment assets 2,079 3,344 1,015 1,204 7,642Unallocated items:
Equity accounted investments and other investments 51Derivative financial instruments 115Cash and cash equivalents 813Tax 78
Assets classified as held for sale 1Total assets 8,700 Segment liabilities (1,028) (743) (223) (117) (2,111)Unallocated items:
Borrowings, overdrafts and interest payable (2,419)Derivative financial instruments (56)Tax (404)Employee benefits (175)
Total liabilities (5,165) Capital expenditure 93 147 56 35 3311. Adjusted to exclude amortisation and adjusting items.

FINANCIAL STATEMENTS
134
Notes to the consolidated financial statements (continued)
134
2. Segment reporting continued
Year ended 30 April 2020 Note
Northern Europe
£m
Southern Europe
£m
Eastern Europe
£m
North America
£m
Total continuing operations
£m
External revenue 2,333 2,214 892 604 6,043Adjusted EBITDA1 335 422 127 72 956Depreciation (116) (108) (39) (33) (296)Adjusted operating profit1 219 314 88 39 660Unallocated items:
Amortisation 10 (143)Adjusting items in operating profit 4 (62)
Total operating profit (continuing operations) 455Unallocated items:
Net financing costs (94)Share of profit of equity accounted investment, net of tax 7
Profit before income tax 368Income tax expense (78)Profit for the year (continuing operations) 290 Analysis of total assets and total liabilities Segment assets 2,107 3,302 1,005 1,386 7,800Unallocated items:
Equity accounted investment and other investments 47Derivative financial instruments 61Cash and cash equivalents 595Tax 119
Assets classified as held for sale 3Total assets 8,625 Segment liabilities (948) (687) (235) (141) (2,011)Unallocated items:
Borrowings, overdrafts and interest payable (2,525)Derivative financial instruments (85)Tax (454)Employee benefits (199)
Total liabilities (5,274) Capital expenditure 103 135 53 85 3761. Adjusted to exclude amortisation and adjusting items.
FINANCIAL STATEMENTS
Annual Report 2021 dssmith.com 135
Notes to the consolidated financial statements (continued)
134
2. Segment reporting continued
Year ended 30 April 2020 Note
Northern Europe
£m
Southern Europe
£m
Eastern Europe
£m
North America
£m
Total continuing operations
£m
External revenue 2,333 2,214 892 604 6,043Adjusted EBITDA1 335 422 127 72 956Depreciation (116) (108) (39) (33) (296)Adjusted operating profit1 219 314 88 39 660Unallocated items:
Amortisation 10 (143)Adjusting items in operating profit 4 (62)
Total operating profit (continuing operations) 455Unallocated items:
Net financing costs (94)Share of profit of equity accounted investment, net of tax 7
Profit before income tax 368Income tax expense (78)Profit for the year (continuing operations) 290 Analysis of total assets and total liabilities Segment assets 2,107 3,302 1,005 1,386 7,800Unallocated items:
Equity accounted investment and other investments 47Derivative financial instruments 61Cash and cash equivalents 595Tax 119
Assets classified as held for sale 3Total assets 8,625 Segment liabilities (948) (687) (235) (141) (2,011)Unallocated items:
Borrowings, overdrafts and interest payable (2,525)Derivative financial instruments (85)Tax (454)Employee benefits (199)
Total liabilities (5,274) Capital expenditure 103 135 53 85 3761. Adjusted to exclude amortisation and adjusting items.
Annual Report 2021 dssmith.com 135
2. Segment reporting continued Geographical areas In presenting information by geographical area, external revenue is based on the geographical location of customers. Non-current assets are based on the geographical location of assets and exclude investments, deferred tax assets, derivative financial instruments and intangible assets (which are monitored at the operating segment level, not at a country level).
External revenue Non-current assets Capital expenditure
Continuing operations 2021
£m2020
£m2021
£m 2020
£m 2021
£m2020
£m
UK 947 828 467 479 26 47France 897 844 438 430 55 59Iberia 654 704 610 607 57 49Germany 599 587 402 395 32 37Italy 599 563 289 264 35 27USA 551 569 338 409 35 85Rest of the World 1,729 1,948 742 742 91 72 5,976 6,043 3,286 3,326 331 376
3. Operating profit
Continuing operations 2021
£m2020
£m
Operating costs Cost of sales 2,816 2,812Other production costs 1,190 1,167Distribution 482 470Administrative expenses 1,030 992 5,518 5,441
During the year, the Group received £5.1m of government support linked to the Covid-19 pandemic. £2.4m was repaid to the UK government of which £0.4m related to 2019/20. The resulting income of £2.7m has been netted off in operating costs . There are no unfulfilled conditions or contingencies attached to these grants.
Details of adjusting items included in operating profit are set out in note 4. Operating profit is stated after charging/(crediting) the following:
Continuing operations 2021
£m2020
£m
Depreciation of owned assets 230 222Depreciation of right-of-use assets 74 74Amortisation of intangible assets 142 143Loss/(profit) on sale of non-current assets 2 (2)Research and development 8 10
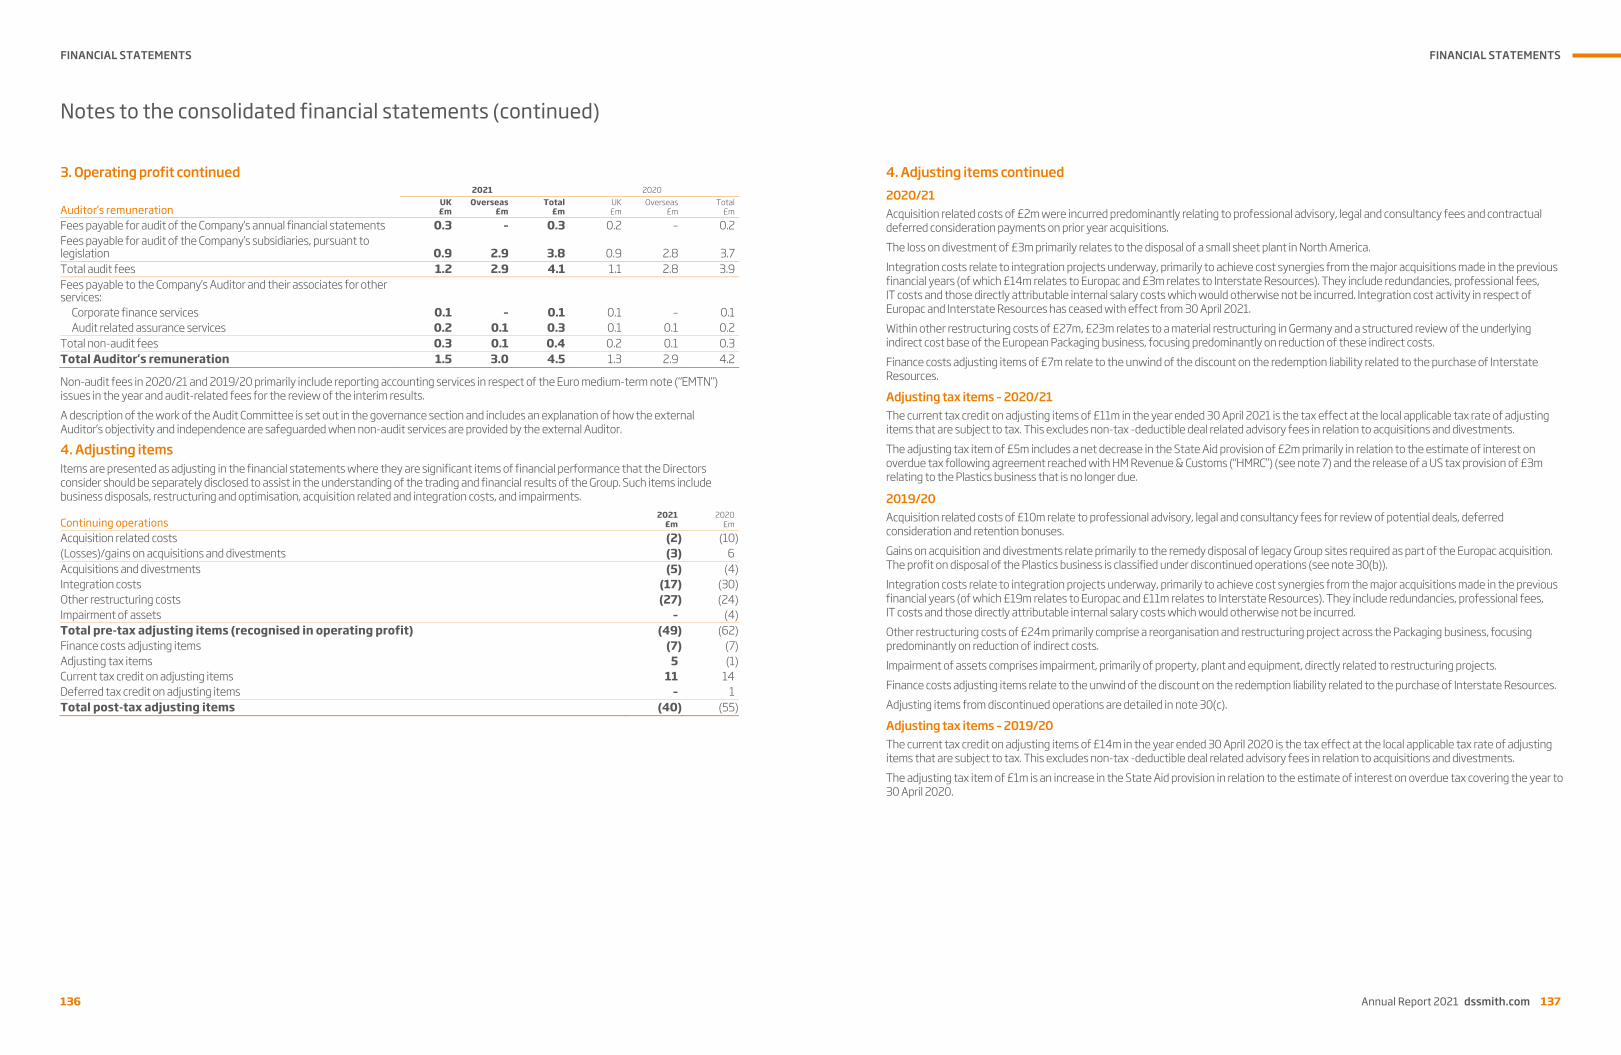
FINANCIAL STATEMENTS
136
Notes to the consolidated financial statements (continued)
136
3. Operating profit continued 2021 2020
Auditor’s remuneration UK£m
Overseas£m
Total£m
UK £m
Overseas£m
Total£m
Fees payable for audit of the Company’s annual financial statements 0.3 – 0.3 0.2 – 0.2Fees payable for audit of the Company’s subsidiaries, pursuant to legislation 0.9 2.9 3.8 0.9 2.8 3.7Total audit fees 1.2 2.9 4.1 1.1 2.8 3.9Fees payable to the Company’s Auditor and their associates for other services:
Corporate finance services 0.1 – 0.1 0.1 – 0.1Audit related assurance services 0.2 0.1 0.3 0.1 0.1 0.2
Total non-audit fees 0.3 0.1 0.4 0.2 0.1 0.3Total Auditor’s remuneration 1.5 3.0 4.5 1.3 2.9 4.2
Non-audit fees in 2020/21 and 2019/20 primarily include reporting accounting services in respect of the Euro medium-term note (“EMTN”) issues in the year and audit-related fees for the review of the interim results. A description of the work of the Audit Committee is set out in the governance section and includes an explanation of how the external Auditor’s objectivity and independence are safeguarded when non-audit services are provided by the external Auditor.
4. Adjusting items Items are presented as adjusting in the financial statements where they are significant items of financial performance that the Directors consider should be separately disclosed to assist in the understanding of the trading and financial results of the Group. Such items include business disposals, restructuring and optimisation, acquisition related and integration costs, and impairments.
Continuing operations 2021
£m2020
£m
Acquisition related costs (2) (10)(Losses)/gains on acquisitions and divestments (3) 6Acquisitions and divestments (5) (4)Integration costs (17) (30)Other restructuring costs (27) (24)Impairment of assets – (4)Total pre-tax adjusting items (recognised in operating profit) (49) (62)Finance costs adjusting items (7) (7)Adjusting tax items 5 (1)Current tax credit on adjusting items 11 14Deferred tax credit on adjusting items – 1Total post-tax adjusting items (40) (55)
FINANCIAL STATEMENTS
Annual Report 2021 dssmith.com 137
Notes to the consolidated financial statements (continued)
136
3. Operating profit continued 2021 2020
Auditor’s remuneration UK£m
Overseas£m
Total£m
UK £m
Overseas£m
Total£m
Fees payable for audit of the Company’s annual financial statements 0.3 – 0.3 0.2 – 0.2Fees payable for audit of the Company’s subsidiaries, pursuant to legislation 0.9 2.9 3.8 0.9 2.8 3.7Total audit fees 1.2 2.9 4.1 1.1 2.8 3.9Fees payable to the Company’s Auditor and their associates for other services:
Corporate finance services 0.1 – 0.1 0.1 – 0.1Audit related assurance services 0.2 0.1 0.3 0.1 0.1 0.2
Total non-audit fees 0.3 0.1 0.4 0.2 0.1 0.3Total Auditor’s remuneration 1.5 3.0 4.5 1.3 2.9 4.2
Non-audit fees in 2020/21 and 2019/20 primarily include reporting accounting services in respect of the Euro medium-term note (“EMTN”) issues in the year and audit-related fees for the review of the interim results. A description of the work of the Audit Committee is set out in the governance section and includes an explanation of how the external Auditor’s objectivity and independence are safeguarded when non-audit services are provided by the external Auditor.
4. Adjusting items Items are presented as adjusting in the financial statements where they are significant items of financial performance that the Directors consider should be separately disclosed to assist in the understanding of the trading and financial results of the Group. Such items include business disposals, restructuring and optimisation, acquisition related and integration costs, and impairments.
Continuing operations 2021
£m2020
£m
Acquisition related costs (2) (10)(Losses)/gains on acquisitions and divestments (3) 6Acquisitions and divestments (5) (4)Integration costs (17) (30)Other restructuring costs (27) (24)Impairment of assets – (4)Total pre-tax adjusting items (recognised in operating profit) (49) (62)Finance costs adjusting items (7) (7)Adjusting tax items 5 (1)Current tax credit on adjusting items 11 14Deferred tax credit on adjusting items – 1Total post-tax adjusting items (40) (55)
Annual Report 2021 dssmith.com 137
4. Adjusting items continued 2020/21 Acquisition related costs of £2m were incurred predominantly relating to professional advisory, legal and consultancy fees and contractual deferred consideration payments on prior year acquisitions. The loss on divestment of £3m primarily relates to the disposal of a small sheet plant in North America. Integration costs relate to integration projects underway, primarily to achieve cost synergies from the major acquisitions made in the previous financial years (of which £14m relates to Europac and £3m relates to Interstate Resources). They include redundancies, professional fees, IT costs and those directly attributable internal salary costs which would otherwise not be incurred. Integration cost activity in respect of Europac and Interstate Resources has ceased with effect from 30 April 2021. Within other restructuring costs of £27m, £23m relates to a material restructuring in Germany and a structured review of the underlying indirect cost base of the European Packaging business, focusing predominantly on reduction of these indirect costs. Finance costs adjusting items of £7m relate to the unwind of the discount on the redemption liability related to the purchase of Interstate Resources.
Adjusting tax items – 2020/21 The current tax credit on adjusting items of £11m in the year ended 30 April 2021 is the tax effect at the local applicable tax rate of adjusting items that are subject to tax. This excludes non-tax -deductible deal related advisory fees in relation to acquisitions and divestments. The adjusting tax item of £5m includes a net decrease in the State Aid provision of £2m primarily in relation to the estimate of interest on overdue tax following agreement reached with HM Revenue & Customs (“HMRC”) (see note 7) and the release of a US tax provision of £3m relating to the Plastics business that is no longer due.
2019/20 Acquisition related costs of £10m relate to professional advisory, legal and consultancy fees for review of potential deals, deferred consideration and retention bonuses. Gains on acquisition and divestments relate primarily to the remedy disposal of legacy Group sites required as part of the Europac acquisition. The profit on disposal of the Plastics business is classified under discontinued operations (see note 30(b)). Integration costs relate to integration projects underway, primarily to achieve cost synergies from the major acquisitions made in the previous financial years (of which £19m relates to Europac and £11m relates to Interstate Resources). They include redundancies, professional fees, IT costs and those directly attributable internal salary costs which would otherwise not be incurred. Other restructuring costs of £24m primarily comprise a reorganisation and restructuring project across the Packaging business, focusing predominantly on reduction of indirect costs. Impairment of assets comprises impairment, primarily of property, plant and equipment, directly related to restructuring projects. Finance costs adjusting items relate to the unwind of the discount on the redemption liability related to the purchase of Interstate Resources. Adjusting items from discontinued operations are detailed in note 30(c).
Adjusting tax items – 2019/20 The current tax credit on adjusting items of £14m in the year ended 30 April 2020 is the tax effect at the local applicable tax rate of adjusting items that are subject to tax. This excludes non-tax -deductible deal related advisory fees in relation to acquisitions and divestments. The adjusting tax item of £1m is an increase in the State Aid provision in relation to the estimate of interest on overdue tax covering the year to 30 April 2020.

FINANCIAL STATEMENTS
138
Notes to the consolidated financial statements (continued)
138
5. Finance income and costs
Continuing operations 2021
£m2020
£m
Interest income from financial assets (1) (2)Other – (2)Finance income (1) (4)Interest on borrowings and overdrafts 55 62Interest on lease liabilities 12 12Other 9 14Finance costs before adjusting items 76 88Finance costs adjusting items (note 4) 7 7Finance costs 83 95
6. Personnel expenses
Continuing operations 2021
£m2020
£m
Wages and salaries 1,085 1,044Social security costs 213 206Contributions to defined contribution pension plans 51 50Service costs for defined benefit schemes (note 25) 5 7Share-based payment expense (note 26) 9 5Personnel expenses 1,363 1,312 Average number of employees
2021Number
2020Number
Northern Europe 10,995 11,443Southern Europe 8,923 8,816Eastern Europe 7,366 7,173North America 1,847 1,879Rest of the World 178 86Average number of employees 29,309 29,397
7. Income tax expense
2021
£m2020
£m
Current tax expense Current year (61) (86)Adjustment in respect of prior years (3) (16) (64) (102)Deferred tax (charge)/ credit Origination and reversal of temporary differences (28) –Change in tax rates – (3)Recognition of previously unrecognised deferred tax assets 18 18Adjustment in respect of prior years 9 (5) (1) 10Total income tax expense before adjusting items (65) (92)Adjusting tax items (note 4) 5 (1)Current tax credit on adjusting items (note 4) 11 14Deferred tax credit on adjusting items (note 4) – 1Total income tax expense in the income statement from continuing operations (49) (78)Total income tax expense in the income statement from discontinued operations (note 30(b)) 9 (11)Total income tax expense in the income statement – total Group (40) (89)
The tax credit on amortisation was £32m (2019/20: £33m).
FINANCIAL STATEMENTS
Annual Report 2021 dssmith.com 139
Notes to the consolidated financial statements (continued)
138
5. Finance income and costs
Continuing operations 2021
£m2020
£m
Interest income from financial assets (1) (2)Other – (2)Finance income (1) (4)Interest on borrowings and overdrafts 55 62Interest on lease liabilities 12 12Other 9 14Finance costs before adjusting items 76 88Finance costs adjusting items (note 4) 7 7Finance costs 83 95
6. Personnel expenses
Continuing operations 2021
£m2020
£m
Wages and salaries 1,085 1,044Social security costs 213 206Contributions to defined contribution pension plans 51 50Service costs for defined benefit schemes (note 25) 5 7Share-based payment expense (note 26) 9 5Personnel expenses 1,363 1,312 Average number of employees
2021Number
2020Number
Northern Europe 10,995 11,443Southern Europe 8,923 8,816Eastern Europe 7,366 7,173North America 1,847 1,879Rest of the World 178 86Average number of employees 29,309 29,397
7. Income tax expense
2021
£m2020
£m
Current tax expense Current year (61) (86)Adjustment in respect of prior years (3) (16) (64) (102)Deferred tax (charge)/ credit Origination and reversal of temporary differences (28) –Change in tax rates – (3)Recognition of previously unrecognised deferred tax assets 18 18Adjustment in respect of prior years 9 (5) (1) 10Total income tax expense before adjusting items (65) (92)Adjusting tax items (note 4) 5 (1)Current tax credit on adjusting items (note 4) 11 14Deferred tax credit on adjusting items (note 4) – 1Total income tax expense in the income statement from continuing operations (49) (78)Total income tax expense in the income statement from discontinued operations (note 30(b)) 9 (11)Total income tax expense in the income statement – total Group (40) (89)
The tax credit on amortisation was £32m (2019/20: £33m).
Annual Report 2021 dssmith.com 139
7. Income tax expense continued The reconciliation of the actual tax charge to the domestic corporation tax rate is as follows:
2021
£m2020
£m
Profit before income tax on continuing operations 231 368Profit before income tax on discontinued operations (note 30(b)) 3 248Share of profit of equity accounted investments, net of tax (5) (7)Profit before tax and share of profit of equity accounted investments, net of tax 229 609 Income tax at the domestic corporation tax rate of 19.00% (2019/20: 19.00%) (44) (116)Effect of additional taxes and tax rates in overseas jurisdictions (23) (41)Additional items deductible for tax purposes 16 19Non-deductible expenses (22) (20)Non-taxable gain on disposal of business – 77Recognition of previously unrecognised deferred tax assets 27 18Deferred tax not recognised (5) (2)Adjustment in respect of prior years1 11 (21)Effect of change in corporation tax rates – (3)Income tax expense – total Group (40) (89)1. Included within the adjustments in respect of prior years is £5m which relates to adjusting items in the current year.
The Group’s effective tax rate, excluding amortisation, adjusting items and share of result from equity accounted investments, was 23.0 % (2019/20: 22.0%).
In the March 2021 Budget, the UK Government announced that legislation will be introduced in the Finance Bill 2021 to increase the main rate of UK corporation tax from 19% to 25%, effective 1 April 2023.
Uncertain tax positions The Group operates in a complex multinational tax environment and is subject to uncertain tax positions and changes in legislation in the jurisdictions in which it operates. The Group’s uncertain tax positions principally include pricing of cross-border transactions and a limited number of specific transaction related tax risks. The assessment of uncertain tax positions is based on management’s expectation of the likely outcome of settlements with tax authorities or litigation. The quantification of the risks at any one point in time, especially with respect to transfer pricing, requires a degree of judgement and estimation by management. Within the consolidated balance sheet at 30 April 2021 for continuing operations are current tax liabilities of £133m (30 April 2020: £149m) which include a provision of £116m (30 April 2020: £138m) relating to uncertain tax positions. It is possible that amounts paid will be different from the amounts provided and the Group estimates the range of reasonably possible outcomes relating to uncertain tax positions to be from £25m to £199m. Following the EU Commission’s decision in April 2019 which concluded that up until 31 December 2018, the UK Controlled Foreign Company legislation partially represented State Aid, the Group recognised a provision in the year ended 30 April 2019 through adjusting items for the maximum potential exposure of £33m, which included an estimate of £2m for interest on overdue tax. During the year, the Group received a charging notice from HMRC under The Taxation (Post Transition Period) Bill for the full exposure. After the offset of deferred tax assets the cash tax liability was reduced to £18m (including interest), which was paid after the end of the accounting period. An amount of £2m is credited to adjusting items in the year being the difference between the provision and the final assessment liability (including the utilisation of deferred tax assets). The Group has filed an application with the General Court of the European Court of Justice for the EU Commission’s decision in respect of State Aid to be annulled. An appeal against the charging notice received from HMRC following detailed analysis conducted supporting the Group’s position has also been filed. The appeals are not expected to conclude in the next 12 months. There are tax audits being conducted by the tax authorities in a number of countries. Whilst there is inherent uncertainty regarding the timing of the resolution of these tax audits and the final tax liabilities to be assessed, the Group does not expect there to be a material change in the provision for uncertain tax positions in the next 12 months. Included within the current tax liabilities is an amount of £9m (30 April 2020: £11m) relating to interest and penalties on uncertain tax positions.

FINANCIAL STATEMENTS
140
Notes to the consolidated financial statements (continued)
140
7. Income tax expense continued Tax on other comprehensive income and equity
Gross2021
£m
Tax credit/(charge)
2021£m
Net2021
£m
Gross 2020
£m
Taxcredit/(charge)
2020 £m
Net2020
£m
Actuarial loss on employee benefits (5) (5) (10) (46) 15 (31)Equity interest at FVTOCI – change in fair value (3) – (3) – – –Foreign currency translation differences (95) – (95) 39 – 39Reclassification from translation reserve to income statement arising on divestment – – – (30) – (30)Movements in cash flow hedges 112 (20) 92 (32) 6 (26)Movement in net investment hedge (2) (1) (3) (23) 5 (18)Other comprehensiveincome/(expense) for the year 7 (26) (19) (92) 26 (66)Issue of share capital 3 – 3 2 – 2Employee share trust (2) – (2) (4) – (4)Share-based payment expense 9 1 10 5 (3) 2Dividends paid to Group shareholders – – – (222) – (222)Transactions with non-controlling interests (2) – (2) – – –Other comprehensive income /(expense) and changes in equity 15 (25) (10) (311) 23 (288)
8. Earnings per share Basic earnings per share from continuing operations 2021 2020
Profit from continuing operations attributable to ordinary shareholders £182m £290mWeighted average number of ordinary shares 1,371m 1,371mBasic earnings per share 13.3p 21.2p
Diluted earnings per share from continuing operations 2021 2020
Profit from continuing operations attributable to ordinary shareholders £182m £290mWeighted average number of ordinary shares 1,371m 1,371mPotentially dilutive shares issuable under share-based payment arrangements 6m 7mWeighted average number of ordinary shares (diluted) 1,377m 1,378mDiluted earnings per share 13.2p 21.0p
The number of shares excludes the weighted average number of the Company’s own shares held as treasury shares during the year of 1m (2019/20: 1m).
2021 2020Basic
pence per share
Diluted pence per
share
Basicpence per
share
Diluted pence per
share
Earnings per share from continuing operations 13.3p 13.2p 21.2p 21.0pEarnings per share from discontinued operations (note 30(b)) 0.9p 0.9p 17.3p 17.2pEarnings per share from continuing and discontinued operations 14.2p 14.1p 38.5p 38.2p
FINANCIAL STATEMENTS
Annual Report 2021 dssmith.com 141
Notes to the consolidated financial statements (continued)
140
7. Income tax expense continued Tax on other comprehensive income and equity
Gross2021
£m
Tax credit/(charge)
2021£m
Net2021
£m
Gross 2020
£m
Taxcredit/(charge)
2020 £m
Net2020
£m
Actuarial loss on employee benefits (5) (5) (10) (46) 15 (31)Equity interest at FVTOCI – change in fair value (3) – (3) – – –Foreign currency translation differences (95) – (95) 39 – 39Reclassification from translation reserve to income statement arising on divestment – – – (30) – (30)Movements in cash flow hedges 112 (20) 92 (32) 6 (26)Movement in net investment hedge (2) (1) (3) (23) 5 (18)Other comprehensiveincome/(expense) for the year 7 (26) (19) (92) 26 (66)Issue of share capital 3 – 3 2 – 2Employee share trust (2) – (2) (4) – (4)Share-based payment expense 9 1 10 5 (3) 2Dividends paid to Group shareholders – – – (222) – (222)Transactions with non-controlling interests (2) – (2) – – –Other comprehensive income /(expense) and changes in equity 15 (25) (10) (311) 23 (288)
8. Earnings per share Basic earnings per share from continuing operations 2021 2020
Profit from continuing operations attributable to ordinary shareholders £182m £290mWeighted average number of ordinary shares 1,371m 1,371mBasic earnings per share 13.3p 21.2p
Diluted earnings per share from continuing operations 2021 2020
Profit from continuing operations attributable to ordinary shareholders £182m £290mWeighted average number of ordinary shares 1,371m 1,371mPotentially dilutive shares issuable under share-based payment arrangements 6m 7mWeighted average number of ordinary shares (diluted) 1,377m 1,378mDiluted earnings per share 13.2p 21.0p
The number of shares excludes the weighted average number of the Company’s own shares held as treasury shares during the year of 1m (2019/20: 1m).
2021 2020Basic
pence per share
Diluted pence per
share
Basicpence per
share
Diluted pence per
share
Earnings per share from continuing operations 13.3p 13.2p 21.2p 21.0pEarnings per share from discontinued operations (note 30(b)) 0.9p 0.9p 17.3p 17.2pEarnings per share from continuing and discontinued operations 14.2p 14.1p 38.5p 38.2p
Annual Report 2021 dssmith.com 141
8. Earnings per share continued Adjusted earnings per share from continuing operations Adjusted earnings per share is a key performance measure for management long-term remuneration and is widely used by the Group’s shareholders. Adjusted earnings is calculated by adding back the post-tax effects of both amortisation and adjusting items. Further detail about the use of non-GAAP performance measures, including details of why amortisation is excluded, is given in note 32. A reconciliation of basic to adjusted earnings per share is as follows:
2021 2020
£m
Basic pence
per share
Diluted pence
per share £m
Basicpence
per share
Diluted pence
per share
Basic earnings 182 13.3p 13.2p 290 21.2p 21.0pAdd back:
Amortisation of intangible assets 142 10.3p 10.3p 143 10.4p 10.4pTax credit on amortisation (32) (2.3p) (2.3p) (33) (2.4p) (2.4p)Adjusting items, before tax 56 4.1p 4.1p 69 5.0p 5.0pTax on adjusting items and adjusting tax items (16) (1.2p) (1.2p) (14) (1.0p) (1.0p)
Adjusted earnings 332 24.2p 24.1p 455 33.2p 33.0p
9. Dividends proposed and paid 2021 2020
Pence per share £m
Penceper share £m
2019/20 interim dividend – proposed and cancelled – – 5.4p 742019/20 final dividend – – nil –2020/21 interim dividend – proposed 4.0p 55 – –2020/21 final dividend – proposed 8.1p 111 – –
2021
£m2020
£m
Paid during the year – 222
The 2020/21 interim dividend of 4.0p was paid after the year end on 4 May 2021. The 2018/19 interim and final dividends were paid during the 2019/20 financial year. The Group announced on 8 April 2020 that the interim dividend in respect of 2019/20 of 5.4 pence per share (£74m), which was due to be paid after the year end on 1 May 2020, would no longer be paid, as a prudent action to respond to the significant uncertainty in the global environment as a result of Covid-19.
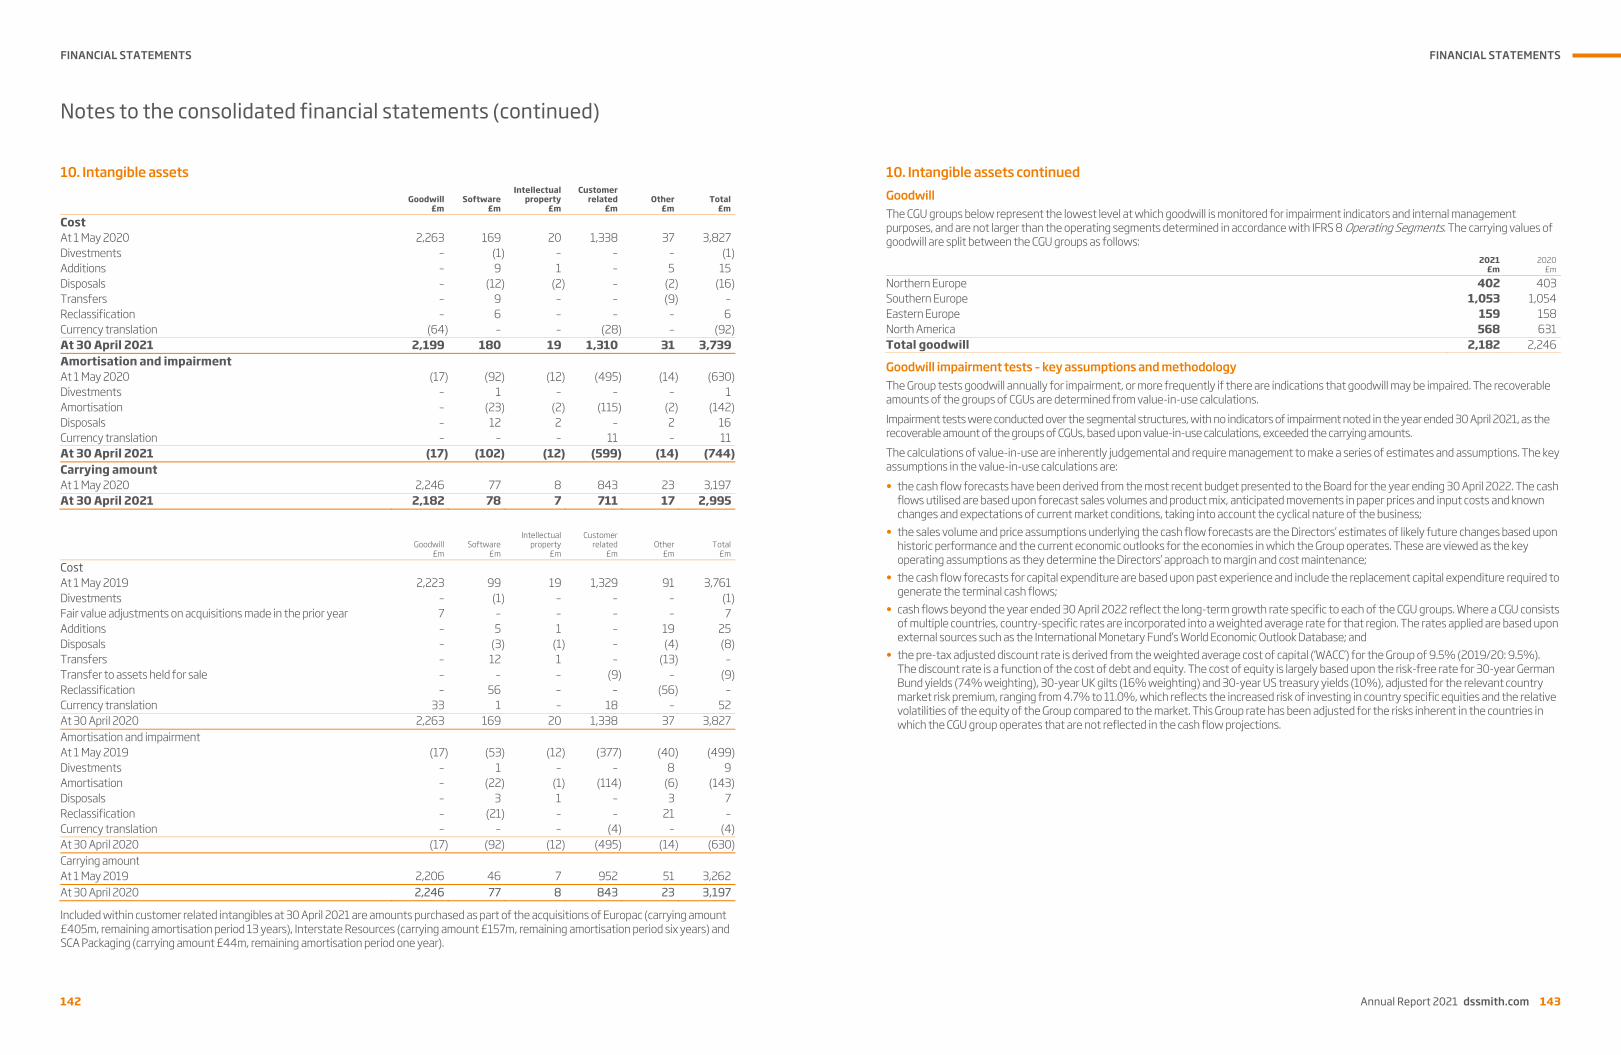
FINANCIAL STATEMENTS
142
Notes to the consolidated financial statements (continued)
142
10. Intangible assets
Goodwill£m
Software£m
Intellectual property
£m
Customer related
£m Other
£mTotal
£m
Cost At 1 May 2020 2,263 169 20 1,338 37 3,827Divestments – (1) – – – (1)Additions – 9 1 – 5 15Disposals – (12) (2) – (2) (16)Transfers – 9 – – (9) –Reclassification – 6 – – – 6Currency translation (64) – – (28) – (92)At 30 April 2021 2,199 180 19 1,310 31 3,739Amortisation and impairment At 1 May 2020 (17) (92) (12) (495) (14) (630)Divestments – 1 – – – 1Amortisation – (23) (2) (115) (2) (142)Disposals – 12 2 – 2 16Currency translation – – – 11 – 11At 30 April 2021 (17) (102) (12) (599) (14) (744)Carrying amount At 1 May 2020 2,246 77 8 843 23 3,197At 30 April 2021 2,182 78 7 711 17 2,995
Goodwill£m
Software£m
Intellectual property
£m
Customer related
£m Other
£mTotal
£m
Cost At 1 May 2019 2,223 99 19 1,329 91 3,761Divestments – (1) – – – (1)Fair value adjustments on acquisitions made in the prior year 7 – – – – 7Additions – 5 1 – 19 25Disposals – (3) (1) – (4) (8)Transfers – 12 1 – (13) –Transfer to assets held for sale – – – (9) – (9)Reclassification – 56 – – (56) –Currency translation 33 1 – 18 – 52At 30 April 2020 2,263 169 20 1,338 37 3,827Amortisation and impairment At 1 May 2019 (17) (53) (12) (377) (40) (499)Divestments – 1 – – 8 9Amortisation – (22) (1) (114) (6) (143)Disposals – 3 1 – 3 7Reclassification – (21) – – 21 –Currency translation – – – (4) – (4)At 30 April 2020 (17) (92) (12) (495) (14) (630)Carrying amount At 1 May 2019 2,206 46 7 952 51 3,262At 30 April 2020 2,246 77 8 843 23 3,197
Included within customer related intangibles at 30 April 2021 are amounts purchased as part of the acquisitions of Europac (carrying amount £405m, remaining amortisation period 13 years), Interstate Resources (carrying amount £157m, remaining amortisation period six years) and SCA Packaging (carrying amount £44m, remaining amortisation period one year).
FINANCIAL STATEMENTS
Annual Report 2021 dssmith.com 143
Notes to the consolidated financial statements (continued)
142
10. Intangible assets
Goodwill£m
Software£m
Intellectual property
£m
Customer related
£m Other
£mTotal
£m
Cost At 1 May 2020 2,263 169 20 1,338 37 3,827Divestments – (1) – – – (1)Additions – 9 1 – 5 15Disposals – (12) (2) – (2) (16)Transfers – 9 – – (9) –Reclassification – 6 – – – 6Currency translation (64) – – (28) – (92)At 30 April 2021 2,199 180 19 1,310 31 3,739Amortisation and impairment At 1 May 2020 (17) (92) (12) (495) (14) (630)Divestments – 1 – – – 1Amortisation – (23) (2) (115) (2) (142)Disposals – 12 2 – 2 16Currency translation – – – 11 – 11At 30 April 2021 (17) (102) (12) (599) (14) (744)Carrying amount At 1 May 2020 2,246 77 8 843 23 3,197At 30 April 2021 2,182 78 7 711 17 2,995
Goodwill£m
Software£m
Intellectual property
£m
Customer related
£m Other
£mTotal
£m
Cost At 1 May 2019 2,223 99 19 1,329 91 3,761Divestments – (1) – – – (1)Fair value adjustments on acquisitions made in the prior year 7 – – – – 7Additions – 5 1 – 19 25Disposals – (3) (1) – (4) (8)Transfers – 12 1 – (13) –Transfer to assets held for sale – – – (9) – (9)Reclassification – 56 – – (56) –Currency translation 33 1 – 18 – 52At 30 April 2020 2,263 169 20 1,338 37 3,827Amortisation and impairment At 1 May 2019 (17) (53) (12) (377) (40) (499)Divestments – 1 – – 8 9Amortisation – (22) (1) (114) (6) (143)Disposals – 3 1 – 3 7Reclassification – (21) – – 21 –Currency translation – – – (4) – (4)At 30 April 2020 (17) (92) (12) (495) (14) (630)Carrying amount At 1 May 2019 2,206 46 7 952 51 3,262At 30 April 2020 2,246 77 8 843 23 3,197
Included within customer related intangibles at 30 April 2021 are amounts purchased as part of the acquisitions of Europac (carrying amount £405m, remaining amortisation period 13 years), Interstate Resources (carrying amount £157m, remaining amortisation period six years) and SCA Packaging (carrying amount £44m, remaining amortisation period one year).
Annual Report 2021 dssmith.com 143
10. Intangible assets continued Goodwill The CGU groups below represent the lowest level at which goodwill is monitored for impairment indicators and internal management purposes, and are not larger than the operating segments determined in accordance with IFRS 8 Operating Segments. The carrying values of goodwill are split between the CGU groups as follows:
2021
£m2020
£m
Northern Europe 402 403Southern Europe 1,053 1,054Eastern Europe 159 158North America 568 631Total goodwill 2,182 2,246
Goodwill impairment tests – key assumptions and methodology The Group tests goodwill annually for impairment, or more frequently if there are indications that goodwill may be impaired. The recoverable amounts of the groups of CGUs are determined from value-in-use calculations. Impairment tests were conducted over the segmental structures, with no indicators of impairment noted in the year ended 30 April 2021, as the recoverable amount of the groups of CGUs, based upon value-in-use calculations, exceeded the carrying amounts. The calculations of value-in-use are inherently judgemental and require management to make a series of estimates and assumptions. The key assumptions in the value-in-use calculations are: • the cash flow forecasts have been derived from the most recent budget presented to the Board for the year ending 30 April 2022. The cash
flows utilised are based upon forecast sales volumes and product mix, anticipated movements in paper prices and input costs and known changes and expectations of current market conditions, taking into account the cyclical nature of the business;
• the sales volume and price assumptions underlying the cash flow forecasts are the Directors’ estimates of likely future changes based upon historic performance and the current economic outlooks for the economies in which the Group operates. These are viewed as the key operating assumptions as they determine the Directors’ approach to margin and cost maintenance;
• the cash flow forecasts for capital expenditure are based upon past experience and include the replacement capital expenditure required to generate the terminal cash flows;
• cash flows beyond the year ended 30 April 2022 reflect the long-term growth rate specific to each of the CGU groups. Where a CGU consists of multiple countries, country-specific rates are incorporated into a weighted average rate for that region. The rates applied are based upon external sources such as the International Monetary Fund’s World Economic Outlook Database; and
• the pre-tax adjusted discount rate is derived from the weighted average cost of capital (‘WACC’) for the Group of 9.5% (2019/20: 9.5%). The discount rate is a function of the cost of debt and equity. The cost of equity is largely based upon the risk-free rate for 30-year German Bund yields (74% weighting), 30-year UK gilts (16% weighting) and 30-year US treasury yields (10%), adjusted for the relevant country market risk premium, ranging from 4.7% to 11.0%, which reflects the increased risk of investing in country specific equities and the relative volatilities of the equity of the Group compared to the market. This Group rate has been adjusted for the risks inherent in the countries in which the CGU group operates that are not reflected in the cash flow projections.

FINANCIAL STATEMENTS
144
Notes to the consolidated financial statements (continued)
144
10. Intangible assets continued
Key assumptions by CGU Northern
EuropeSouthern
Europe Eastern Europe
North America
Long-term growth rate at 30 April 2021 1.4% 1.2% 2.9% 2.0%Long-term growth rate at 30 April 2020 1.6% 1.4% 3.0% 2.0%Discount rate at 30 April 2021 8.8% 10.3% 10.4% 8.7%Discount rate at 30 April 2020 8.8% 10.3% 10.5% 8.6%
Goodwill impairment tests – sensitivities The value-in-use is based upon anticipated discounted future cash flows. At 30 April 2021, the impairment tests concluded that there was headroom across all CGU groups. Whilst the Directors believe the assumptions used are realistic, it is possible that a reduction in the headroom would occur if any of the above key assumptions were adversely changed. Factors which could cause an impairment are: • significant and prolonged underperformance relative to the forecast; and • deteriorations in the economies in which the Group operates. To support their assertions, the Directors have conducted sensitivity analyses to determine the impact that would result from the above situations. Key sensitivities tested included reduction or delays in future growth and increased discount rates. In these cases, if estimates of future recovery from the Covid-19 pandemic were delayed, or if the estimated discount rates applied to the cash flows were increased by 0.5%, there would still be adequate headroom to support the carrying value of the assets. Based on this analysis, the Directors believe that a reasonably possible change in any of the key assumptions detailed above would not cause the carrying value of CGU groups to exceed their recoverable amounts, although the headroom would decrease. Therefore, at 30 April 2021, no impairment charge is required against the carrying value of goodwill.
11. Property, plant and equipment Land and buildings
£m
Plant and equipment
£m
Fixtures and fittings
£m
Under construction
£mTotal
£m
Cost At 1 May 2020 1,055 3,278 87 190 4,610Divestments (3) (29) (2) – (34)Additions 10 67 4 209 290Disposals (7) (77) (3) – (87)Transfers 23 159 7 (189) –Reclassification (2) 7 3 (5) 3Transfer from assets held for sale – 3 – – 3Currency translation (10) (71) (1) (4) (86)At 30 April 2021 1,066 3,337 95 201 4,699Depreciation and impairment At 1 May 2020 (200) (1,331) (37) – (1,568)Divestments 2 20 1 – 23Depreciation charge (32) (189) (9) – (230)Transfers (1) 3 (2) – –Disposals 3 72 3 – 78Reclassification 1 1 – – 2Currency translation 5 41 – – 46At 30 April 2021 (222) (1,383) (44) – (1,649) Carrying amount At 1 May 2020 855 1,947 50 190 3,042At 30 April 2021 844 1,954 51 201 3,050
FINANCIAL STATEMENTS
Annual Report 2021 dssmith.com 145
Notes to the consolidated financial statements (continued)
144
10. Intangible assets continued
Key assumptions by CGU Northern
EuropeSouthern
Europe Eastern Europe
North America
Long-term growth rate at 30 April 2021 1.4% 1.2% 2.9% 2.0%Long-term growth rate at 30 April 2020 1.6% 1.4% 3.0% 2.0%Discount rate at 30 April 2021 8.8% 10.3% 10.4% 8.7%Discount rate at 30 April 2020 8.8% 10.3% 10.5% 8.6%
Goodwill impairment tests – sensitivities The value-in-use is based upon anticipated discounted future cash flows. At 30 April 2021, the impairment tests concluded that there was headroom across all CGU groups. Whilst the Directors believe the assumptions used are realistic, it is possible that a reduction in the headroom would occur if any of the above key assumptions were adversely changed. Factors which could cause an impairment are: • significant and prolonged underperformance relative to the forecast; and • deteriorations in the economies in which the Group operates. To support their assertions, the Directors have conducted sensitivity analyses to determine the impact that would result from the above situations. Key sensitivities tested included reduction or delays in future growth and increased discount rates. In these cases, if estimates of future recovery from the Covid-19 pandemic were delayed, or if the estimated discount rates applied to the cash flows were increased by 0.5%, there would still be adequate headroom to support the carrying value of the assets. Based on this analysis, the Directors believe that a reasonably possible change in any of the key assumptions detailed above would not cause the carrying value of CGU groups to exceed their recoverable amounts, although the headroom would decrease. Therefore, at 30 April 2021, no impairment charge is required against the carrying value of goodwill.
11. Property, plant and equipment Land and buildings
£m
Plant and equipment
£m
Fixtures and fittings
£m
Under construction
£mTotal
£m
Cost At 1 May 2020 1,055 3,278 87 190 4,610Divestments (3) (29) (2) – (34)Additions 10 67 4 209 290Disposals (7) (77) (3) – (87)Transfers 23 159 7 (189) –Reclassification (2) 7 3 (5) 3Transfer from assets held for sale – 3 – – 3Currency translation (10) (71) (1) (4) (86)At 30 April 2021 1,066 3,337 95 201 4,699Depreciation and impairment At 1 May 2020 (200) (1,331) (37) – (1,568)Divestments 2 20 1 – 23Depreciation charge (32) (189) (9) – (230)Transfers (1) 3 (2) – –Disposals 3 72 3 – 78Reclassification 1 1 – – 2Currency translation 5 41 – – 46At 30 April 2021 (222) (1,383) (44) – (1,649) Carrying amount At 1 May 2020 855 1,947 50 190 3,042At 30 April 2021 844 1,954 51 201 3,050
Annual Report 2021 dssmith.com 145
11. Property, plant and equipment continued
Land and buildings
£m
Plant and equipment
£m
Fixtures and fittings
£m
Under construction
£mTotal
£m
Cost At 1 May 2019 1,027 2,981 91 257 4,356Reclassified to right-of-use assets on adoption of IFRS 16 – (38) (1) – (39)Divestments (16) (36) (1) (6) (59)Additions 7 116 3 227 353Disposals (9) (44) (5) – (58)Transfers 36 253 (1) (288) –Transfer to assets held for sale – – – (3) (3)Reclassification – 11 – – 11Currency translation 10 35 1 3 49At 30 April 2020 1,055 3,278 87 190 4,610Depreciation and impairment At 1 May 2019 (178) (1,209) (35) – (1,422)Reclassification to right-of-use assets on adoption of IFRS 16 – 23 – – 23Divestments 7 25 1 – 33Depreciation charge (32) (182) (8) – (222)Impairment (1) (2) – – (3)Disposals 6 38 5 – 49Currency translation (2) (24) – – (26)At 30 April 2020 (200) (1,331) (37) – (1,568) Carrying amount At 1 May 2019 849 1,772 56 257 2,934At 30 April 2020 855 1,947 50 190 3,042
Assets under construction mainly relate to production machines and site improvements being constructed at various sites across the Group.
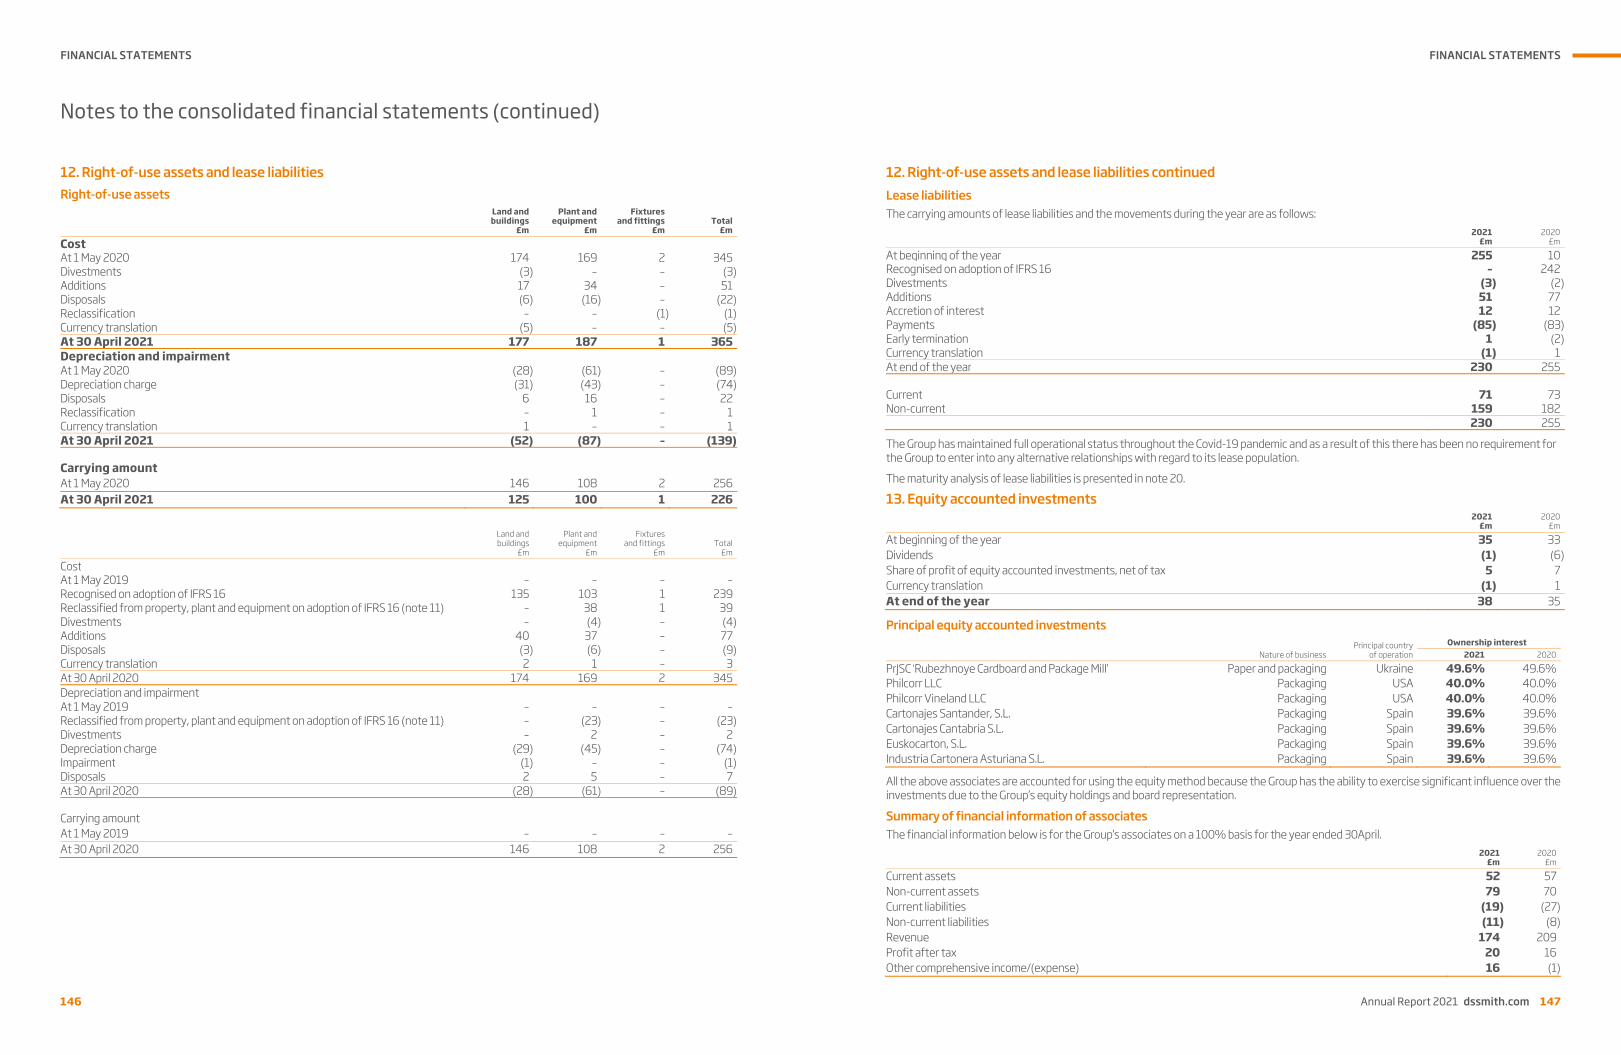
FINANCIAL STATEMENTS
146
Notes to the consolidated financial statements (continued)
146
12. Right-of-use assets and lease liabilities Right-of-use assets
Land and buildings
£m
Plant and equipment
£m
Fixtures and fittings
£mTotal
£m
Cost At 1 May 2020 174 169 2 345Divestments (3) – – (3)Additions 17 34 – 51Disposals (6) (16) – (22)Reclassification – – (1) (1)Currency translation (5) – – (5)At 30 April 2021 177 187 1 365Depreciation and impairment At 1 May 2020 (28) (61) – (89)Depreciation charge (31) (43) – (74)Disposals 6 16 – 22Reclassification – 1 – 1Currency translation 1 – – 1At 30 April 2021 (52) (87) – (139) Carrying amount At 1 May 2020 146 108 2 256At 30 April 2021 125 100 1 226
Land and buildings
£m
Plant and equipment
£m
Fixtures and fittings
£mTotal
£m
Cost At 1 May 2019 – – – –Recognised on adoption of IFRS 16 135 103 1 239Reclassified from property, plant and equipment on adoption of IFRS 16 (note 11) – 38 1 39Divestments – (4) – (4)Additions 40 37 – 77Disposals (3) (6) – (9)Currency translation 2 1 – 3At 30 April 2020 174 169 2 345Depreciation and impairment At 1 May 2019 – – – –Reclassified from property, plant and equipment on adoption of IFRS 16 (note 11) – (23) – (23)Divestments – 2 – 2Depreciation charge (29) (45) – (74)Impairment (1) – – (1)Disposals 2 5 – 7At 30 April 2020 (28) (61) – (89) Carrying amount At 1 May 2019 – – – –At 30 April 2020 146 108 2 256
FINANCIAL STATEMENTS
Annual Report 2021 dssmith.com 147
Notes to the consolidated financial statements (continued)
146
12. Right-of-use assets and lease liabilities Right-of-use assets
Land and buildings
£m
Plant and equipment
£m
Fixtures and fittings
£mTotal
£m
Cost At 1 May 2020 174 169 2 345Divestments (3) – – (3)Additions 17 34 – 51Disposals (6) (16) – (22)Reclassification – – (1) (1)Currency translation (5) – – (5)At 30 April 2021 177 187 1 365Depreciation and impairment At 1 May 2020 (28) (61) – (89)Depreciation charge (31) (43) – (74)Disposals 6 16 – 22Reclassification – 1 – 1Currency translation 1 – – 1At 30 April 2021 (52) (87) – (139) Carrying amount At 1 May 2020 146 108 2 256At 30 April 2021 125 100 1 226
Land and buildings
£m
Plant and equipment
£m
Fixtures and fittings
£mTotal
£m
Cost At 1 May 2019 – – – –Recognised on adoption of IFRS 16 135 103 1 239Reclassified from property, plant and equipment on adoption of IFRS 16 (note 11) – 38 1 39Divestments – (4) – (4)Additions 40 37 – 77Disposals (3) (6) – (9)Currency translation 2 1 – 3At 30 April 2020 174 169 2 345Depreciation and impairment At 1 May 2019 – – – –Reclassified from property, plant and equipment on adoption of IFRS 16 (note 11) – (23) – (23)Divestments – 2 – 2Depreciation charge (29) (45) – (74)Impairment (1) – – (1)Disposals 2 5 – 7At 30 April 2020 (28) (61) – (89) Carrying amount At 1 May 2019 – – – –At 30 April 2020 146 108 2 256
Annual Report 2021 dssmith.com 147
12. Right-of-use assets and lease liabilities continued Lease liabilities The carrying amounts of lease liabilities and the movements during the year are as follows:
2021
£m2020
£m
At beginning of the year 255 10Recognised on adoption of IFRS 16 – 242Divestments (3) (2)Additions 51 77Accretion of interest 12 12Payments (85) (83)Early termination 1 (2)Currency translation (1) 1At end of the year 230 255 Current 71 73Non-current 159 182 230 255
The Group has maintained full operational status throughout the Covid-19 pandemic and as a result of this there has been no requirement for the Group to enter into any alternative relationships with regard to its lease population.
The maturity analysis of lease liabilities is presented in note 20.
13. Equity accounted investments
2021
£m2020
£m
At beginning of the year 35 33Dividends (1) (6)Share of profit of equity accounted investments, net of tax 5 7Currency translation (1) 1At end of the year 38 35
Principal equity accounted investments Principal country
of operation Ownership interest
Nature of business 2021 2020
PrJSC ‘Rubezhnoye Cardboard and Package Mill’ Paper and packaging Ukraine 49.6% 49.6%Philcorr LLC Packaging USA 40.0% 40.0%Philcorr Vineland LLC Packaging USA 40.0% 40.0%Cartonajes Santander, S.L. Packaging Spain 39.6% 39.6%Cartonajes Cantabria S.L. Packaging Spain 39.6% 39.6%Euskocarton, S.L. Packaging Spain 39.6% 39.6%Industria Cartonera Asturiana S.L. Packaging Spain 39.6% 39.6%
All the above associates are accounted for using the equity method because the Group has the ability to exercise significant influence over the investments due to the Group’s equity holdings and board representation.
Summary of financial information of associates The financial information below is for the Group’s associates on a 100% basis for the year ended 30April.
2021
£m2020
£m
Current assets 52 57Non-current assets 79 70Current liabilities (19) (27)Non-current liabilities (11) (8)Revenue 174 209Profit after tax 20 16Other comprehensive income/(expense) 16 (1)
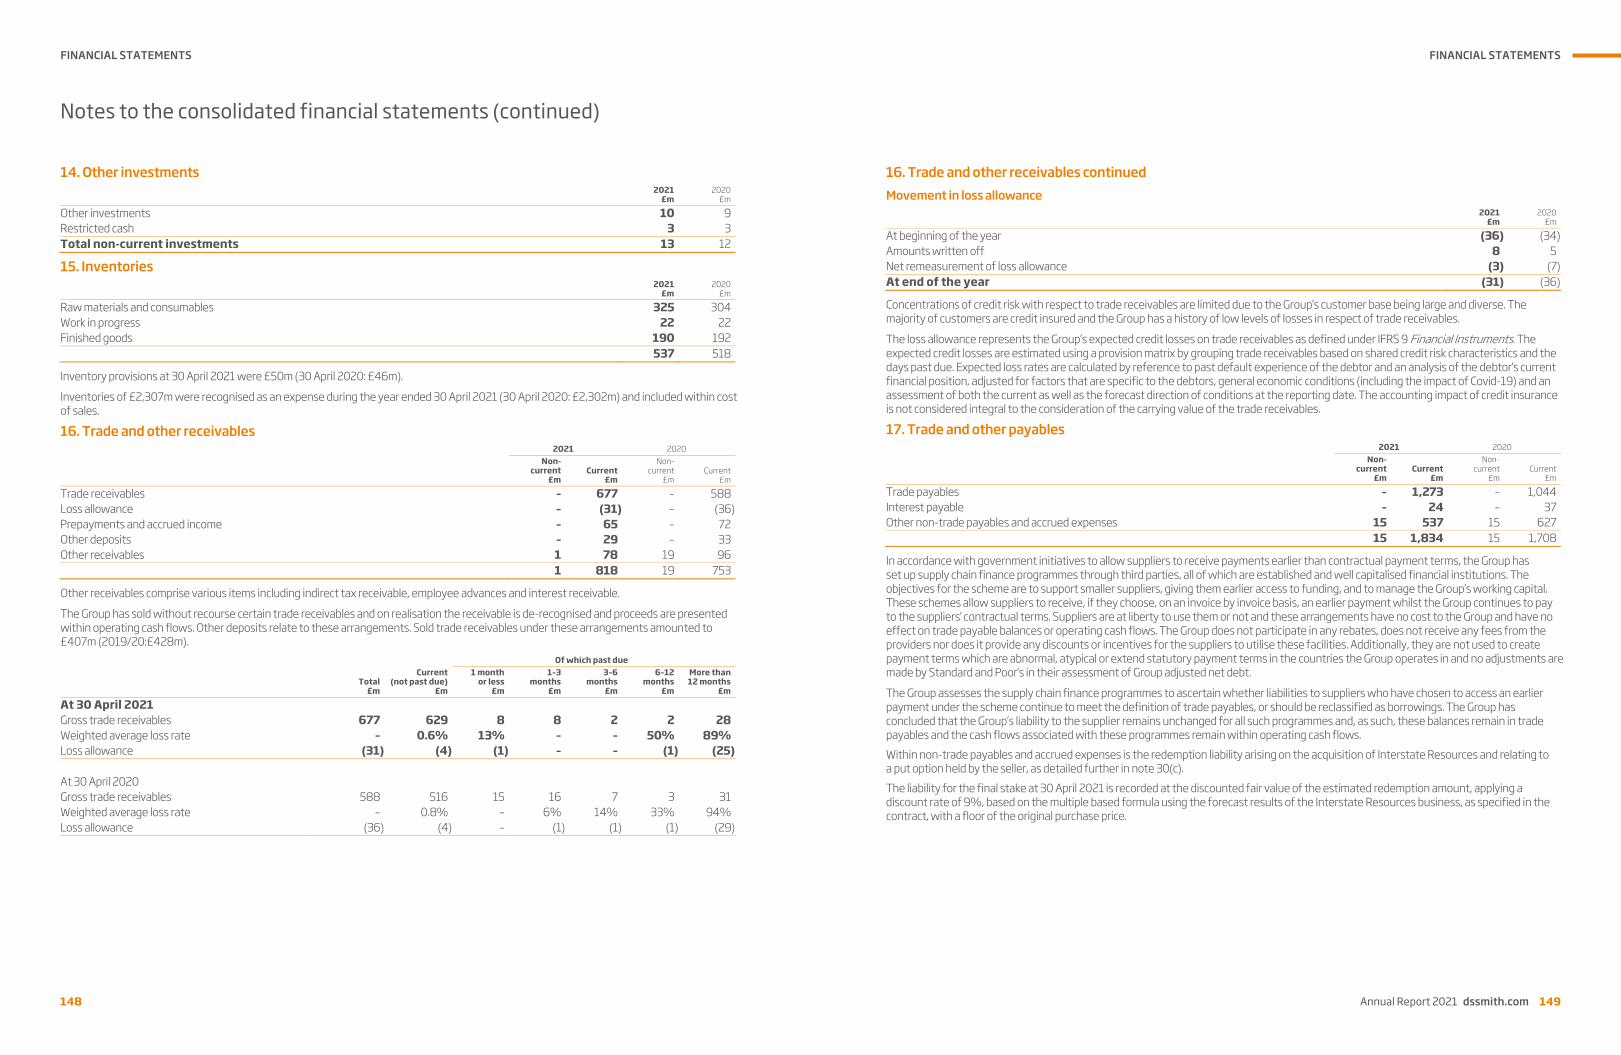
FINANCIAL STATEMENTS
148
Notes to the consolidated financial statements (continued)
148
14. Other investments
2021
£m2020
£m
Other investments 10 9Restricted cash 3 3Total non-current investments 13 12
15. Inventories
2021
£m2020
£m
Raw materials and consumables 325 304Work in progress 22 22Finished goods 190 192 537 518
Inventory provisions at 30 April 2021 were £50m (30 April 2020: £46m).
Inventories of £2,307m were recognised as an expense during the year ended 30 April 2021 (30 April 2020: £2,302m) and included within cost of sales.
16. Trade and other receivables 2021 2020
Non-current
£mCurrent
£m
Non-current
£mCurrent
£m
Trade receivables – 677 – 588Loss allowance – (31) – (36)Prepayments and accrued income – 65 – 72Other deposits – 29 – 33Other receivables 1 78 19 96 1 818 19 753
Other receivables comprise various items including indirect tax receivable, employee advances and interest receivable.
The Group has sold without recourse certain trade receivables and on realisation the receivable is de-recognised and proceeds are presented within operating cash flows. Other deposits relate to these arrangements. Sold trade receivables under these arrangements amounted to £407m (2019/20:£428m).
Total£m
Current (not past due)
£m
Of which past due
1 monthor less
£m
1–3months
£m
3–6 months
£m
6–12 months
£m
More than12 months
£m
At 30 April 2021
Gross trade receivables 677 629 8 8 2 2 28Weighted average loss rate – 0.6% 13% – – 50% 89%Loss allowance (31) (4) (1) – – (1) (25) At 30 April 2020 Gross trade receivables 588 516 15 16 7 3 31Weighted average loss rate – 0.8% – 6% 14% 33% 94%Loss allowance (36) (4) – (1) (1) (1) (29)
FINANCIAL STATEMENTS
Annual Report 2021 dssmith.com 149
Notes to the consolidated financial statements (continued)
148
14. Other investments
2021
£m2020
£m
Other investments 10 9Restricted cash 3 3Total non-current investments 13 12
15. Inventories
2021
£m2020
£m
Raw materials and consumables 325 304Work in progress 22 22Finished goods 190 192 537 518
Inventory provisions at 30 April 2021 were £50m (30 April 2020: £46m).
Inventories of £2,307m were recognised as an expense during the year ended 30 April 2021 (30 April 2020: £2,302m) and included within cost of sales.
16. Trade and other receivables 2021 2020
Non-current
£mCurrent
£m
Non-current
£mCurrent
£m
Trade receivables – 677 – 588Loss allowance – (31) – (36)Prepayments and accrued income – 65 – 72Other deposits – 29 – 33Other receivables 1 78 19 96 1 818 19 753
Other receivables comprise various items including indirect tax receivable, employee advances and interest receivable.
The Group has sold without recourse certain trade receivables and on realisation the receivable is de-recognised and proceeds are presented within operating cash flows. Other deposits relate to these arrangements. Sold trade receivables under these arrangements amounted to £407m (2019/20:£428m).
Total£m
Current (not past due)
£m
Of which past due
1 monthor less
£m
1–3months
£m
3–6 months
£m
6–12 months
£m
More than12 months
£m
At 30 April 2021
Gross trade receivables 677 629 8 8 2 2 28Weighted average loss rate – 0.6% 13% – – 50% 89%Loss allowance (31) (4) (1) – – (1) (25) At 30 April 2020 Gross trade receivables 588 516 15 16 7 3 31Weighted average loss rate – 0.8% – 6% 14% 33% 94%Loss allowance (36) (4) – (1) (1) (1) (29)
Annual Report 2021 dssmith.com 149
16. Trade and other receivables continued Movement in loss allowance
2021
£m2020
£m
At beginning of the year (36) (34)Amounts written off 8 5Net remeasurement of loss allowance (3) (7)At end of the year (31) (36)
Concentrations of credit risk with respect to trade receivables are limited due to the Group’s customer base being large and diverse. The majority of customers are credit insured and the Group has a history of low levels of losses in respect of trade receivables.
The loss allowance represents the Group’s expected credit losses on trade receivables as defined under IFRS 9 Financial Instruments. The expected credit losses are estimated using a provision matrix by grouping trade receivables based on shared credit risk characteristics and the days past due. Expected loss rates are calculated by reference to past default experience of the debtor and an analysis of the debtor’s current financial position, adjusted for factors that are specific to the debtors, general economic conditions (including the impact of Covid-19) and an assessment of both the current as well as the forecast direction of conditions at the reporting date. The accounting impact of credit insurance is not considered integral to the consideration of the carrying value of the trade receivables.
17. Trade and other payables 2021 2020
Non- current
£m Current
£m
Non-current
£mCurrent
£m
Trade payables – 1,273 – 1,044Interest payable – 24 – 37Other non-trade payables and accrued expenses 15 537 15 627 15 1,834 15 1,708
In accordance with government initiatives to allow suppliers to receive payments earlier than contractual payment terms, the Group has set up supply chain finance programmes through third parties, all of which are established and well capitalised financial institutions. The objectives for the scheme are to support smaller suppliers, giving them earlier access to funding, and to manage the Group’s working capital. These schemes allow suppliers to receive, if they choose, on an invoice by invoice basis, an earlier payment whilst the Group continues to pay to the suppliers’ contractual terms. Suppliers are at liberty to use them or not and these arrangements have no cost to the Group and have no effect on trade payable balances or operating cash flows. The Group does not participate in any rebates, does not receive any fees from the providers nor does it provide any discounts or incentives for the suppliers to utilise these facilities. Additionally, they are not used to create payment terms which are abnormal, atypical or extend statutory payment terms in the countries the Group operates in and no adjustments are made by Standard and Poor’s in their assessment of Group adjusted net debt.
The Group assesses the supply chain finance programmes to ascertain whether liabilities to suppliers who have chosen to access an earlier payment under the scheme continue to meet the definition of trade payables, or should be reclassified as borrowings. The Group has concluded that the Group’s liability to the supplier remains unchanged for all such programmes and, as such, these balances remain in trade payables and the cash flows associated with these programmes remain within operating cash flows. Within non-trade payables and accrued expenses is the redemption liability arising on the acquisition of Interstate Resources and relating to a put option held by the seller, as detailed further in note 30(c). The liability for the final stake at 30 April 2021 is recorded at the discounted fair value of the estimated redemption amount, applying a discount rate of 9%, based on the multiple based formula using the forecast results of the Interstate Resources business, as specified in the contract, with a floor of the original purchase price.
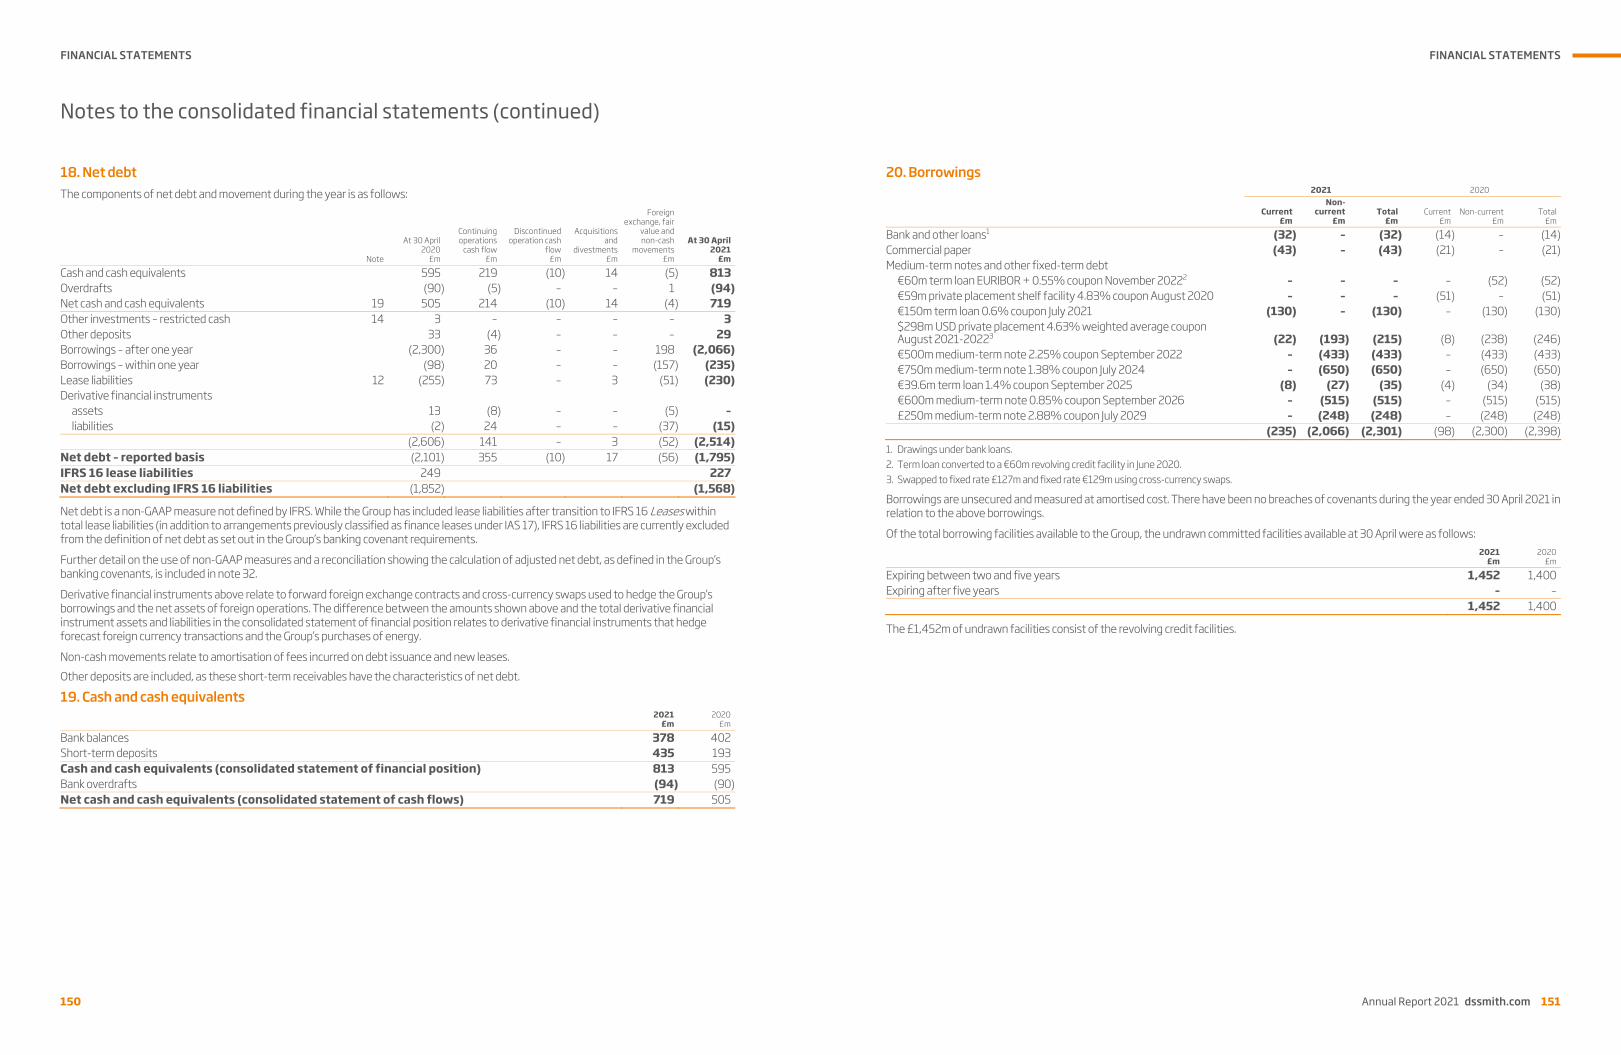
FINANCIAL STATEMENTS
150
Notes to the consolidated financial statements (continued)
150
18. Net debt The components of net debt and movement during the year is as follows:
Note
At 30 April 2020
£m
Continuing operations
cash flow£m
Discontinued operation cash
flow£m
Acquisitions and
divestments £m
Foreign exchange, fair
value and non-cash
movements£m
At 30 April 2021
£m
Cash and cash equivalents 595 219 (10) 14 (5) 813Overdrafts (90) (5) – – 1 (94)Net cash and cash equivalents 19 505 214 (10) 14 (4) 719Other investments – restricted cash 14 3 – – – – 3Other deposits 33 (4) – – – 29Borrowings – after one year (2,300) 36 – – 198 (2,066)Borrowings – within one year (98) 20 – – (157) (235)Lease liabilities 12 (255) 73 – 3 (51) (230)Derivative financial instruments
assets 13 (8) – – (5) –liabilities (2) 24 – – (37) (15)
(2,606) 141 – 3 (52) (2,514)Net debt – reported basis (2,101) 355 (10) 17 (56) (1,795)IFRS 16 lease liabilities 249 227Net debt excluding IFRS 16 liabilities (1,852) (1,568)
Net debt is a non-GAAP measure not defined by IFRS. While the Group has included lease liabilities after transition to IFRS 16 Leases within total lease liabilities (in addition to arrangements previously classified as finance leases under IAS 17), IFRS 16 liabilities are currently excluded from the definition of net debt as set out in the Group’s banking covenant requirements.
Further detail on the use of non-GAAP measures and a reconciliation showing the calculation of adjusted net debt, as defined in the Group’s banking covenants, is included in note 32.
Derivative financial instruments above relate to forward foreign exchange contracts and cross-currency swaps used to hedge the Group’s borrowings and the net assets of foreign operations. The difference between the amounts shown above and the total derivative financial instrument assets and liabilities in the consolidated statement of financial position relates to derivative financial instruments that hedge forecast foreign currency transactions and the Group’s purchases of energy.
Non-cash movements relate to amortisation of fees incurred on debt issuance and new leases. Other deposits are included, as these short-term receivables have the characteristics of net debt.
19. Cash and cash equivalents
2021
£m2020
£m
Bank balances 378 402Short-term deposits 435 193Cash and cash equivalents (consolidated statement of financial position) 813 595Bank overdrafts (94) (90)Net cash and cash equivalents (consolidated statement of cash flows) 719 505
FINANCIAL STATEMENTS
Annual Report 2021 dssmith.com 151
Notes to the consolidated financial statements (continued)
150
18. Net debt The components of net debt and movement during the year is as follows:
Note
At 30 April 2020
£m
Continuing operations
cash flow£m
Discontinued operation cash
flow£m
Acquisitions and
divestments £m
Foreign exchange, fair
value and non-cash
movements£m
At 30 April 2021
£m
Cash and cash equivalents 595 219 (10) 14 (5) 813Overdrafts (90) (5) – – 1 (94)Net cash and cash equivalents 19 505 214 (10) 14 (4) 719Other investments – restricted cash 14 3 – – – – 3Other deposits 33 (4) – – – 29Borrowings – after one year (2,300) 36 – – 198 (2,066)Borrowings – within one year (98) 20 – – (157) (235)Lease liabilities 12 (255) 73 – 3 (51) (230)Derivative financial instruments
assets 13 (8) – – (5) –liabilities (2) 24 – – (37) (15)
(2,606) 141 – 3 (52) (2,514)Net debt – reported basis (2,101) 355 (10) 17 (56) (1,795)IFRS 16 lease liabilities 249 227Net debt excluding IFRS 16 liabilities (1,852) (1,568)
Net debt is a non-GAAP measure not defined by IFRS. While the Group has included lease liabilities after transition to IFRS 16 Leases within total lease liabilities (in addition to arrangements previously classified as finance leases under IAS 17), IFRS 16 liabilities are currently excluded from the definition of net debt as set out in the Group’s banking covenant requirements.
Further detail on the use of non-GAAP measures and a reconciliation showing the calculation of adjusted net debt, as defined in the Group’s banking covenants, is included in note 32.
Derivative financial instruments above relate to forward foreign exchange contracts and cross-currency swaps used to hedge the Group’s borrowings and the net assets of foreign operations. The difference between the amounts shown above and the total derivative financial instrument assets and liabilities in the consolidated statement of financial position relates to derivative financial instruments that hedge forecast foreign currency transactions and the Group’s purchases of energy.
Non-cash movements relate to amortisation of fees incurred on debt issuance and new leases. Other deposits are included, as these short-term receivables have the characteristics of net debt.
19. Cash and cash equivalents
2021
£m2020
£m
Bank balances 378 402Short-term deposits 435 193Cash and cash equivalents (consolidated statement of financial position) 813 595Bank overdrafts (94) (90)Net cash and cash equivalents (consolidated statement of cash flows) 719 505
Annual Report 2021 dssmith.com 151
20. Borrowings 2021 2020
Current£m
Non-current
£mTotal
£m Current
£m Non-current
£mTotal
£m
Bank and other loans1 (32) – (32) (14) – (14)Commercial paper (43) – (43) (21) – (21)Medium-term notes and other fixed-term debt
€60m term loan EURIBOR + 0.55% coupon November 20222 – – – – (52) (52)€59m private placement shelf facility 4.83% coupon August 2020 – – – (51) – (51)€150m term loan 0.6% coupon July 2021 (130) – (130) – (130) (130)$298m USD private placement 4.63% weighted average coupon August 2021-20223 (22) (193) (215) (8) (238) (246)€500m medium-term note 2.25% coupon September 2022 – (433) (433) – (433) (433)€750m medium-term note 1.38% coupon July 2024 – (650) (650) – (650) (650)€39.6m term loan 1.4% coupon September 2025 (8) (27) (35) (4) (34) (38)€600m medium-term note 0.85% coupon September 2026 – (515) (515) – (515) (515)£250m medium-term note 2.88% coupon July 2029 – (248) (248) – (248) (248)
(235) (2,066) (2,301) (98) (2,300) (2,398)1. Drawings under bank loans. 2. Term loan converted to a €60m revolving credit facility in June 2020. 3. Swapped to fixed rate £127m and fixed rate €129m using cross-currency swaps.
Borrowings are unsecured and measured at amortised cost. There have been no breaches of covenants during the year ended 30 April 2021 in relation to the above borrowings.
Of the total borrowing facilities available to the Group, the undrawn committed facilities available at 30 April were as follows:
2021
£m2020
£m
Expiring between two and five years 1,452 1,400Expiring after five years – – 1,452 1,400
The £1,452m of undrawn facilities consist of the revolving credit facilities.

FINANCIAL STATEMENTS
152
Notes to the consolidated financial statements (continued)
152
20. Borrowings continued The repayment profile of the Group’s borrowings, after taking into account the effect of cross-currency swaps and forward foreign exchange contracts, is as follows:
2021 1 yearor less
£m
1–2years
£m
2–5 years
£m
More than5 years
£mTotal
£m
Borrowings Fixed rate (204) (631) (664) (770) (2,269)Floating rate (31) (1) – – (32)
Total borrowings (235) (632) (664) (770) (2,301) 2020
1 yearor less
£m
1–2years
£m
2–5 years
£m
More than5 years
£mTotal
£m
Borrowings Fixed rate (85) (28) (1,446) (772) (2,331)Floating rate (13) (54) – – (67)
Total borrowings (98) (82) (1,446) (772) (2,398)
The Group’s borrowings, after taking into account the effect of cross-currency swaps and forward foreign exchange contracts are denominated in the following currencies:
2021 Sterling
£mEuro
£mUS dollar
£m Other
£mTotal
£m
Borrowings Fixed rate (353) (1,694) (222) – (2,269)Floating rate – (32) – – (32)
(353) (1,726) (222) – (2,301)Net cash and cash equivalents (including bank overdrafts)
Floating rate 288 315 20 96 719Net borrowings at 30 April 2021 (65) (1,411) (202) 96 (1,582) 2020
Sterling£m
Euro£m
US dollar £m
Other£m
Total£m
Borrowings Fixed rate (450) (1,682) (199) – (2,331)Floating rate – (67) – – (67)
(450) (1,749) (199) – (2,398)Net cash and cash equivalents (including bank overdrafts)
Floating rate 107 298 27 73 505Net borrowings at 30 April 2020 (343) (1,451) (172) 73 (1,893)
At 30 April 2021, 75% of the Group’s borrowings, after taking into account the effect of cross-currency swaps and forward foreign exchange contracts, were denominated in euros in order to hedge the underlying assets of the Group’s European operations (30 April 2020: 73%). Interest rates on floating rate borrowings are based on London Interbank Offered Rate (LIBOR), Euro Interbank Offered Rate (EURIBOR) or base rates.
FINANCIAL STATEMENTS
Annual Report 2021 dssmith.com 153
Notes to the consolidated financial statements (continued)
152
20. Borrowings continued The repayment profile of the Group’s borrowings, after taking into account the effect of cross-currency swaps and forward foreign exchange contracts, is as follows:
2021 1 yearor less
£m
1–2years
£m
2–5 years
£m
More than5 years
£mTotal
£m
Borrowings Fixed rate (204) (631) (664) (770) (2,269)Floating rate (31) (1) – – (32)
Total borrowings (235) (632) (664) (770) (2,301) 2020
1 yearor less
£m
1–2years
£m
2–5 years
£m
More than5 years
£mTotal
£m
Borrowings Fixed rate (85) (28) (1,446) (772) (2,331)Floating rate (13) (54) – – (67)
Total borrowings (98) (82) (1,446) (772) (2,398)
The Group’s borrowings, after taking into account the effect of cross-currency swaps and forward foreign exchange contracts are denominated in the following currencies:
2021 Sterling
£mEuro
£mUS dollar
£m Other
£mTotal
£m
Borrowings Fixed rate (353) (1,694) (222) – (2,269)Floating rate – (32) – – (32)
(353) (1,726) (222) – (2,301)Net cash and cash equivalents (including bank overdrafts)
Floating rate 288 315 20 96 719Net borrowings at 30 April 2021 (65) (1,411) (202) 96 (1,582) 2020
Sterling£m
Euro£m
US dollar £m
Other£m
Total£m
Borrowings Fixed rate (450) (1,682) (199) – (2,331)Floating rate – (67) – – (67)
(450) (1,749) (199) – (2,398)Net cash and cash equivalents (including bank overdrafts)
Floating rate 107 298 27 73 505Net borrowings at 30 April 2020 (343) (1,451) (172) 73 (1,893)
At 30 April 2021, 75% of the Group’s borrowings, after taking into account the effect of cross-currency swaps and forward foreign exchange contracts, were denominated in euros in order to hedge the underlying assets of the Group’s European operations (30 April 2020: 73%). Interest rates on floating rate borrowings are based on London Interbank Offered Rate (LIBOR), Euro Interbank Offered Rate (EURIBOR) or base rates.
Annual Report 2021 dssmith.com 153
20. Borrowings continued Maturity of lease liabilities
1 yearor less
£m
1–2 years
£m
2–5 years
£m
More than5 years
£mTotal
£m
At 30 April 2020 (73) (56) (81) (45) (255)At 30 April 2021 (71) (51) (73) (35) (230)
Denomination of lease liabilities Sterling
£mEuro
£m US dollar
£m Other
£mTotal
£m
At 30 April 2020 (53) (126) (46) (30) (255)At 30 April 2021 (49) (114) (36) (31) (230)
Changes in liabilities arising from financing activities
At 1 May
2020£m
Financing cash flows
£m
Acquisitions and divestments
£mNew leases
£m
Movements in fair value
£m Other
£m
At 30 Apr2021
£m
Bank and other loans, including commercial paper (35) (42) – – – 2 (75)Medium-term notes and other fixed-term debt (2,363) 98 – – – 39 (2,226)Lease liabilities (255) 73 3 (51) – – (230)Derivative financial instruments related to hedging of financial liabilities (note 18)
Assets 13 (8) – – (5) – –Liabilities (2) 24 – – (37) – (15)
Total liabilities from financing activities (2,642) 145 3 (51) (42) 41 (2,546)
At 1 May
2019£m
Adoption of IFRS 16
£m
Financing cash flows
£m
Acquisitions and divestments
£mNew leases
£m
Movements in fair value
£m Other
£m
At 30 Apr2020
£m
Bank and other loans, including commercial paper (596) – 575 – – – (14) (35)Medium-term notes and other fixed-term debt (2,019) – (313) – – – (31) (2,363)Lease liabilities (10) (242) 71 2 (77) – 1 (255)Derivative financial instruments related to hedging of financial liabilities (note 18)
Assets 12 – (53) – – 54 – 13Liabilities (9) – 58 – – (51) – (2)
Total liabilities from financing activities (2,622) (242) 338 2 (77) 3 (44) (2,642)
Other changes include foreign exchange movements and amortisation of capitalised borrowing costs. Financing cash flows consist of the net amount of proceeds from borrowings, repayment of borrowings, repayment of lease obligations and proceeds from settlement of derivative financial instruments in the consolidated statement of cash flows. Payments in respect of, and proceeds from settlement of derivative financial instruments in the consolidated statement of cash flows relate solely to derivative financial instruments used to hedge the Group’s borrowings and net assets of foreign operations. Operating cash flows include settlement of commodity derivatives.
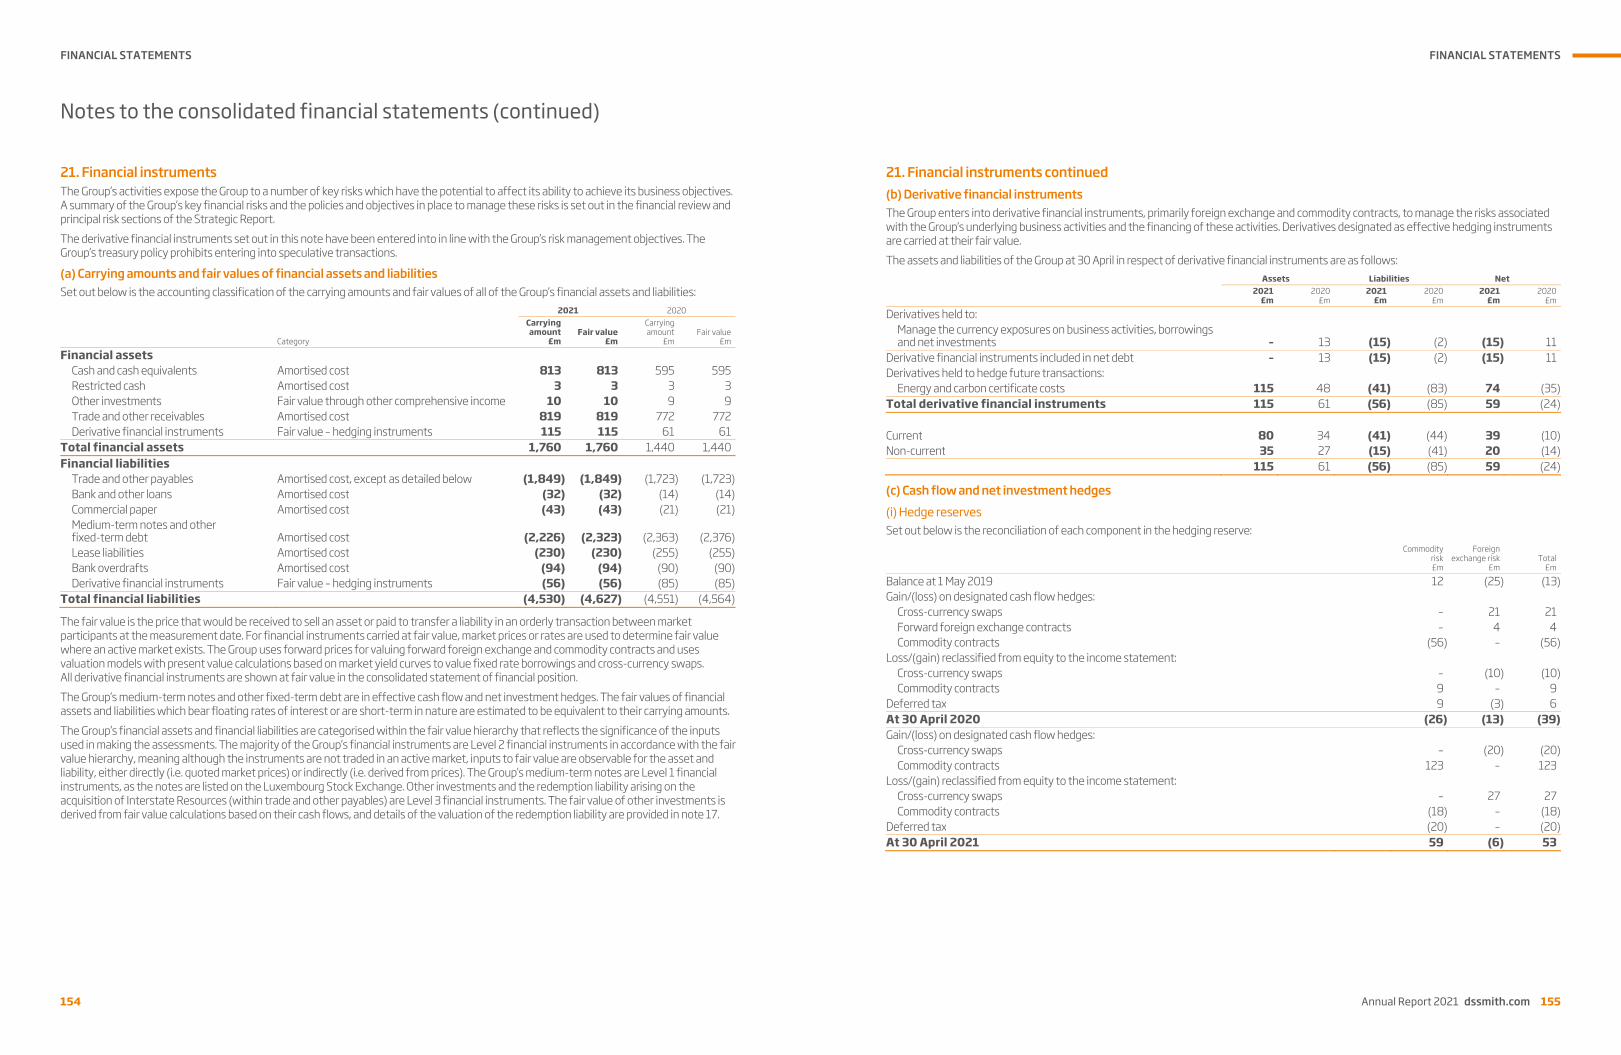
FINANCIAL STATEMENTS
154
Notes to the consolidated financial statements (continued)
154
21. Financial instruments The Group’s activities expose the Group to a number of key risks which have the potential to affect its ability to achieve its business objectives. A summary of the Group’s key financial risks and the policies and objectives in place to manage these risks is set out in the financial review and principal risk sections of the Strategic Report. The derivative financial instruments set out in this note have been entered into in line with the Group’s risk management objectives. The Group’s treasury policy prohibits entering into speculative transactions.
(a) Carrying amounts and fair values of financial assets and liabilities Set out below is the accounting classification of the carrying amounts and fair values of all of the Group’s financial assets and liabilities:
2021 2020
Category
Carrying amount
£mFair value
£m
Carrying amount
£mFair value
£m
Financial assets Cash and cash equivalents Amortised cost 813 813 595 595Restricted cash Amortised cost 3 3 3 3Other investments Fair value through other comprehensive income 10 10 9 9Trade and other receivables Amortised cost 819 819 772 772Derivative financial instruments Fair value – hedging instruments 115 115 61 61
Total financial assets 1,760 1,760 1,440 1,440Financial liabilities
Trade and other payables Amortised cost, except as detailed below (1,849) (1,849) (1,723) (1,723)Bank and other loans Amortised cost (32) (32) (14) (14)Commercial paper Amortised cost (43) (43) (21) (21)Medium-term notes and other fixed-term debt
Amortised cost (2,226) (2,323) (2,363) (2,376)
Lease liabilities Amortised cost (230) (230) (255) (255)Bank overdrafts Amortised cost (94) (94) (90) (90)Derivative financial instruments Fair value – hedging instruments (56) (56) (85) (85)
Total financial liabilities (4,530) (4,627) (4,551) (4,564)
The fair value is the price that would be received to sell an asset or paid to transfer a liability in an orderly transaction between market participants at the measurement date. For financial instruments carried at fair value, market prices or rates are used to determine fair value where an active market exists. The Group uses forward prices for valuing forward foreign exchange and commodity contracts and uses valuation models with present value calculations based on market yield curves to value fixed rate borrowings and cross-currency swaps. All derivative financial instruments are shown at fair value in the consolidated statement of financial position. The Group’s medium-term notes and other fixed-term debt are in effective cash flow and net investment hedges. The fair values of financial assets and liabilities which bear floating rates of interest or are short-term in nature are estimated to be equivalent to their carrying amounts. The Group’s financial assets and financial liabilities are categorised within the fair value hierarchy that reflects the significance of the inputs used in making the assessments. The majority of the Group’s financial instruments are Level 2 financial instruments in accordance with the fair value hierarchy, meaning although the instruments are not traded in an active market, inputs to fair value are observable for the asset and liability, either directly (i.e. quoted market prices) or indirectly (i.e. derived from prices). The Group’s medium-term notes are Level 1 financial instruments, as the notes are listed on the Luxembourg Stock Exchange. Other investments and the redemption liability arising on the acquisition of Interstate Resources (within trade and other payables) are Level 3 financial instruments. The fair value of other investments is derived from fair value calculations based on their cash flows, and details of the valuation of the redemption liability are provided in note 17.
FINANCIAL STATEMENTS
Annual Report 2021 dssmith.com 155
Notes to the consolidated financial statements (continued)
154
21. Financial instruments The Group’s activities expose the Group to a number of key risks which have the potential to affect its ability to achieve its business objectives. A summary of the Group’s key financial risks and the policies and objectives in place to manage these risks is set out in the financial review and principal risk sections of the Strategic Report. The derivative financial instruments set out in this note have been entered into in line with the Group’s risk management objectives. The Group’s treasury policy prohibits entering into speculative transactions.
(a) Carrying amounts and fair values of financial assets and liabilities Set out below is the accounting classification of the carrying amounts and fair values of all of the Group’s financial assets and liabilities:
2021 2020
Category
Carrying amount
£mFair value
£m
Carrying amount
£mFair value
£m
Financial assets Cash and cash equivalents Amortised cost 813 813 595 595Restricted cash Amortised cost 3 3 3 3Other investments Fair value through other comprehensive income 10 10 9 9Trade and other receivables Amortised cost 819 819 772 772Derivative financial instruments Fair value – hedging instruments 115 115 61 61
Total financial assets 1,760 1,760 1,440 1,440Financial liabilities
Trade and other payables Amortised cost, except as detailed below (1,849) (1,849) (1,723) (1,723)Bank and other loans Amortised cost (32) (32) (14) (14)Commercial paper Amortised cost (43) (43) (21) (21)Medium-term notes and other fixed-term debt
Amortised cost (2,226) (2,323) (2,363) (2,376)
Lease liabilities Amortised cost (230) (230) (255) (255)Bank overdrafts Amortised cost (94) (94) (90) (90)Derivative financial instruments Fair value – hedging instruments (56) (56) (85) (85)
Total financial liabilities (4,530) (4,627) (4,551) (4,564)
The fair value is the price that would be received to sell an asset or paid to transfer a liability in an orderly transaction between market participants at the measurement date. For financial instruments carried at fair value, market prices or rates are used to determine fair value where an active market exists. The Group uses forward prices for valuing forward foreign exchange and commodity contracts and uses valuation models with present value calculations based on market yield curves to value fixed rate borrowings and cross-currency swaps. All derivative financial instruments are shown at fair value in the consolidated statement of financial position. The Group’s medium-term notes and other fixed-term debt are in effective cash flow and net investment hedges. The fair values of financial assets and liabilities which bear floating rates of interest or are short-term in nature are estimated to be equivalent to their carrying amounts. The Group’s financial assets and financial liabilities are categorised within the fair value hierarchy that reflects the significance of the inputs used in making the assessments. The majority of the Group’s financial instruments are Level 2 financial instruments in accordance with the fair value hierarchy, meaning although the instruments are not traded in an active market, inputs to fair value are observable for the asset and liability, either directly (i.e. quoted market prices) or indirectly (i.e. derived from prices). The Group’s medium-term notes are Level 1 financial instruments, as the notes are listed on the Luxembourg Stock Exchange. Other investments and the redemption liability arising on the acquisition of Interstate Resources (within trade and other payables) are Level 3 financial instruments. The fair value of other investments is derived from fair value calculations based on their cash flows, and details of the valuation of the redemption liability are provided in note 17.
Annual Report 2021 dssmith.com 155
21. Financial instruments continued (b) Derivative financial instruments The Group enters into derivative financial instruments, primarily foreign exchange and commodity contracts, to manage the risks associated with the Group’s underlying business activities and the financing of these activities. Derivatives designated as effective hedging instruments are carried at their fair value. The assets and liabilities of the Group at 30 April in respect of derivative financial instruments are as follows:
Assets Liabilities Net2021
£m2020
£m2021
£m 2020
£m 2021
£m2020
£m
Derivatives held to: Manage the currency exposures on business activities, borrowings and net investments – 13 (15) (2) (15) 11
Derivative financial instruments included in net debt – 13 (15) (2) (15) 11Derivatives held to hedge future transactions:
Energy and carbon certificate costs 115 48 (41) (83) 74 (35)Total derivative financial instruments 115 61 (56) (85) 59 (24) Current 80 34 (41) (44) 39 (10)Non-current 35 27 (15) (41) 20 (14) 115 61 (56) (85) 59 (24)
(c) Cash flow and net investment hedges (i) Hedge reserves Set out below is the reconciliation of each component in the hedging reserve:
Commodity risk £m
Foreignexchange risk
£mTotal
£m
Balance at 1 May 2019 12 (25) (13)Gain/(loss) on designated cash flow hedges:
Cross-currency swaps – 21 21Forward foreign exchange contracts – 4 4Commodity contracts (56) – (56)
Loss/(gain) reclassified from equity to the income statement: Cross-currency swaps – (10) (10)Commodity contracts 9 – 9
Deferred tax 9 (3) 6At 30 April 2020 (26) (13) (39)Gain/(loss) on designated cash flow hedges:
Cross-currency swaps – (20) (20)Commodity contracts 123 – 123
Loss/(gain) reclassified from equity to the income statement: Cross-currency swaps – 27 27Commodity contracts (18) – (18)
Deferred tax (20) – (20)At 30 April 2021 59 (6) 53

FINANCIAL STATEMENTS
156
Notes to the consolidated financial statements (continued)
156
21. Financial instruments continued (c) Cash flow and net investment hedges continued (i) Hedge reserves continued The amounts reclassified to the income statement from the cash flow hedging reserve during the year are reflected in the following items in the income statement:
2021
£m2020
£m
Operating costs (18) 9Finance costs 27 (10)Total pre-tax loss/(gain) reclassified from equity to the income statement during the year 9 (1)
There was £nil recognised ineffectiveness during the year ended 30 April 2021 (30 April 2020: £nil) in relation to the cross-currency swaps.
(ii) Hedges of net investments in foreign operations The Group utilises foreign currency borrowings, cross-currency swaps and forward foreign exchange contracts as hedges of long-term investments in foreign subsidiaries. The pre-tax losses on the hedges recognised in equity during the year was £2m (2019/20: gain of £23m). This loss is matched by a similar gain in equity on the retranslation of the hedged foreign subsidiary net assets resulting in a net gain of £nil (2019/20: net gain of £nil) treated as hedge ineffectiveness in the income statement.
(d) Risk identification and risk management (i) Capital management The Group defines its managed capital as the sum of equity, as presented in the consolidated statement of financial position, and net debt (note 18).
2021
£m2020
£m
Net debt 1,795 2,101Total equity 3,535 3,351Managed capital 5,330 5,452
There were no significant events leading to the change in managed capital levels during the year. The changes in the Group’s funding were the repayment of private placement borrowings of €59m and $10m in August 2020 and the conversion of a €60m term loan with an original maturity of November 2022 into a revolving credit facility with a maturity of June 2023, with a further two one-year extensions.
Managed capital is different from capital employed (defined as property, plant and equipment, right-of-use assets, goodwill and intangible assets, working capital, capital debtors/creditors, provisions, biological assets and assets/liabilities held for sale). Managed capital relates to our sources of funding, whereas adjusted return on average capital employed is our measure of the level of return being generated by the asset base. The Group funds its operations from the following sources of capital: operating cash flow, borrowings, shareholders’ equity and, where appropriate, divestments of non-core businesses. The Group’s objective is to achieve a capital structure that results in an appropriate cost of capital whilst providing flexibility in short and medium-term funding so as to accommodate significant investments or acquisitions. The Group also aims to maintain a strong balance sheet and to provide continuity of financing by having borrowings with a range of maturities and from a variety of sources. The Group’s overall treasury objectives are to ensure sufficient funds are available for the Group to carry out its strategy and to manage certain financial risks to which the Group is exposed, as described elsewhere in this note. The Group’s treasury strategy is controlled through the Balance Sheet Committee which meets every two months and includes the Group Finance Director, the Group General Counsel and Company Secretary, the Group Financial Controller and the Corporate Finance Director. The Group Treasury function operates in accordance with policies and procedures approved by the Board and is controlled by the Corporate Finance Director. The function arranges funding for the Group, provides a service to operations and implements strategies for financial risk management.
(ii) Market risk Market risk is the risk that the fair value or future cash flows of a financial instrument fluctuate because of a change in market prices. The Group is exposed to changes in interest rates, foreign currency exchange rates and commodity prices. Interest rate risk The Group is exposed to interest rate risk as borrowings are arranged at fixed interest rates, exposing it to fair value risk, and at floating interest rates, exposing it to future cash flow risk. The risk is managed by maintaining a mix of fixed and floating rate borrowings. The Group’s exposure to interest rates on financial assets and financial liabilities is detailed in the liquidity risk management section of this note.
FINANCIAL STATEMENTS
Annual Report 2021 dssmith.com 157
Notes to the consolidated financial statements (continued)
156
21. Financial instruments continued (c) Cash flow and net investment hedges continued (i) Hedge reserves continued The amounts reclassified to the income statement from the cash flow hedging reserve during the year are reflected in the following items in the income statement:
2021
£m2020
£m
Operating costs (18) 9Finance costs 27 (10)Total pre-tax loss/(gain) reclassified from equity to the income statement during the year 9 (1)
There was £nil recognised ineffectiveness during the year ended 30 April 2021 (30 April 2020: £nil) in relation to the cross-currency swaps.
(ii) Hedges of net investments in foreign operations The Group utilises foreign currency borrowings, cross-currency swaps and forward foreign exchange contracts as hedges of long-term investments in foreign subsidiaries. The pre-tax losses on the hedges recognised in equity during the year was £2m (2019/20: gain of £23m). This loss is matched by a similar gain in equity on the retranslation of the hedged foreign subsidiary net assets resulting in a net gain of £nil (2019/20: net gain of £nil) treated as hedge ineffectiveness in the income statement.
(d) Risk identification and risk management (i) Capital management The Group defines its managed capital as the sum of equity, as presented in the consolidated statement of financial position, and net debt (note 18).
2021
£m2020
£m
Net debt 1,795 2,101Total equity 3,535 3,351Managed capital 5,330 5,452
There were no significant events leading to the change in managed capital levels during the year. The changes in the Group’s funding were the repayment of private placement borrowings of €59m and $10m in August 2020 and the conversion of a €60m term loan with an original maturity of November 2022 into a revolving credit facility with a maturity of June 2023, with a further two one-year extensions.
Managed capital is different from capital employed (defined as property, plant and equipment, right-of-use assets, goodwill and intangible assets, working capital, capital debtors/creditors, provisions, biological assets and assets/liabilities held for sale). Managed capital relates to our sources of funding, whereas adjusted return on average capital employed is our measure of the level of return being generated by the asset base. The Group funds its operations from the following sources of capital: operating cash flow, borrowings, shareholders’ equity and, where appropriate, divestments of non-core businesses. The Group’s objective is to achieve a capital structure that results in an appropriate cost of capital whilst providing flexibility in short and medium-term funding so as to accommodate significant investments or acquisitions. The Group also aims to maintain a strong balance sheet and to provide continuity of financing by having borrowings with a range of maturities and from a variety of sources. The Group’s overall treasury objectives are to ensure sufficient funds are available for the Group to carry out its strategy and to manage certain financial risks to which the Group is exposed, as described elsewhere in this note. The Group’s treasury strategy is controlled through the Balance Sheet Committee which meets every two months and includes the Group Finance Director, the Group General Counsel and Company Secretary, the Group Financial Controller and the Corporate Finance Director. The Group Treasury function operates in accordance with policies and procedures approved by the Board and is controlled by the Corporate Finance Director. The function arranges funding for the Group, provides a service to operations and implements strategies for financial risk management.
(ii) Market risk Market risk is the risk that the fair value or future cash flows of a financial instrument fluctuate because of a change in market prices. The Group is exposed to changes in interest rates, foreign currency exchange rates and commodity prices. Interest rate risk The Group is exposed to interest rate risk as borrowings are arranged at fixed interest rates, exposing it to fair value risk, and at floating interest rates, exposing it to future cash flow risk. The risk is managed by maintaining a mix of fixed and floating rate borrowings. The Group’s exposure to interest rates on financial assets and financial liabilities is detailed in the liquidity risk management section of this note.
Annual Report 2021 dssmith.com 157
21. Financial instruments continued (d) Risk identification and risk management continued (ii) Market risk continued Interest rate sensitivity At 30 April 2021, 99% of the Group’s borrowings were at fixed rates of interest (30 April 2020: 97%). The sensitivity analysis below shows the impact on profit of a 100 basis points rise in market interest rates (representing management’s assessment of the reasonably possible change in interest rates) in all currencies in which the Group had variable-rate borrowings at 30 April 2021. To calculate the impact on the income statement for the year, the interest rates on all variable-rate external borrowings and cash deposits have been increased by 100 basis points, and the resulting increase in the net interest charge has been adjusted for the effect of the Group’s interest rate derivatives. The impact on equity is equal to the impact on profit. The results are presented before non-controlling interests and tax.
2021
£m2020
£m
Impact on profit of increase in market interest rates of 100 basis points – (5)
Foreign exchange risk The Group’s exposure to foreign currency risk at the end of the reporting period, expressed in sterling, was as follows:
2021 2020EUR
£m USD
£m EUR
£mUSD
£m
Trade receivables 504 54 389 43Trade payables (1,177) (174) (880) (214)Net borrowings1 (1,411) (202) (1,451) (172)1. After taking into account the effect of cross-currency swaps and forward foreign exchange contracts.
Foreign exchange risk on investments The Group is exposed to foreign exchange risk arising from net investments in Group entities, the functional currencies of which differ from the Group’s presentational currency, sterling. The Group partly hedges this exposure through borrowings denominated in foreign currencies and through cross-currency swaps and forward foreign exchange contracts. Gains and losses arising from hedges of net investments are recognised in equity. Foreign exchange risk on borrowings The Group is exposed to foreign exchange risk on borrowings denominated in foreign currencies. The Group hedges some of this exposure through cross-currency swaps designated as cash flow hedges. Foreign exchange risk on transactions Foreign currency transaction risk arises where a business unit makes product sales or purchases in a currency other than its functional currency. Part of this risk is hedged using forward foreign exchange contracts which are designated as cash flow hedges. The Group only designates the forward rate of foreign currency forwards in hedge relationships. For the hedges of highly probable forecast sales and purchases, as the critical terms (i.e. the notional amount, life and underlying terms) of the foreign exchange forward contracts and their corresponding hedged items are the same, the Group performs a qualitative assessment of effectiveness and it is expected that the value of the forward contracts and the value of the corresponding hedged items will systematically change in opposite directions in response to movements in the underlying exchange rates. The Group’s main currency exposures are to the euro and US dollar. The following significant exchange rates applied during the year:
2021 2020Average Closing Average Closing
Euro 1.122 1.151 1.139 1.151US dollar 1.320 1.391 1.251 1.252

FINANCIAL STATEMENTS
158
Notes to the consolidated financial statements (continued)
158
21. Financial instruments continued (d) Risk identification and risk management continued (ii) Market risk continued Foreign exchange risk on transactions continued
The following sensitivity analysis shows the impact on the Group’s results of a 10% strengthening and weakening in the sterling exchange rate against all other currencies representing management’s assessment of the reasonably possible change in foreign exchange rates. The analysis is restricted to financial instruments denominated in a foreign currency and excludes the impact of financial instruments designated as net investment hedges. Net investment hedges are excluded as the impact of the foreign exchange movements on these are offset by equal and opposite movements in the hedged items. The results are presented before non-controlling interests and tax.
2021 2020Impact on
profit£m
Impact on total equity
£m
Impact onprofit
£m
Impact on total equity
£m
10% strengthening of sterling – 42 – 3110% weakening of sterling – (51) – (38)
Commodity risk The Group’s main commodity exposures are to changes in gas and electricity prices. The Group also hedges its exposure to fluctuations in the cost of carbon emission certificates. This commodity price risk is managed by a combination of physical supply agreements and derivative instruments. At 30 April 2021, £59m of gains (2019/20: losses of £26m) are deferred in equity in respect of cash flow hedges in accordance with IAS 39. Any gains or losses deferred in equity will be reclassified to the income statement in the period in which the hedged item also affects the income statement, which will occur within three years. The following table details the Group’s sensitivity to a 10% increase in these prices, which is management’s assessment of the reasonably possible change, on average, over any given year. A decrease of 10% in these prices would produce an opposite effect on equity. As all of the Group’s commodity financial instruments achieve hedge accounting under IAS 39, there is no impact on profit for either year. The results are presented before non-controlling interests and tax.
2021 2020Impact on
profit£m
Impact on total equity
£m
Impact onprofit
£m
Impact ontotal equity
£m
10% increase in electricity prices – 3 – 110% increase in gas prices – 22 – 910% increase in carbon certificate prices – 7 – (6)
(iii) Credit risk Credit risk is the risk that a customer or counterparty to a financial instrument will fail to perform or fail to pay amounts due, causing financial loss to the Group. In the current economic environment, the Group has placed increased emphasis on the management of credit risk. The carrying amount of financial assets at 30 April 2021 was £1,760m and is analysed in note 21(a). This represents the maximum credit risk exposure. Credit risk on financial instruments held with financial institutions is assessed and managed by reference to the long-term credit ratings assigned to that counterparty by Standard & Poor’s and Moody’s credit rating agencies. The short-term deposits are placed with seven financial institutions with a minimum Standard & Poor’s credit rating of BBB. Amounts deposited with counterparties are subject to limits based on their credit ratings. There are no significant concentrations of credit risk. See note 16 for information on credit risk with respect to trade receivables.
FINANCIAL STATEMENTS
Annual Report 2021 dssmith.com 159
Notes to the consolidated financial statements (continued)
158
21. Financial instruments continued (d) Risk identification and risk management continued (ii) Market risk continued Foreign exchange risk on transactions continued
The following sensitivity analysis shows the impact on the Group’s results of a 10% strengthening and weakening in the sterling exchange rate against all other currencies representing management’s assessment of the reasonably possible change in foreign exchange rates. The analysis is restricted to financial instruments denominated in a foreign currency and excludes the impact of financial instruments designated as net investment hedges. Net investment hedges are excluded as the impact of the foreign exchange movements on these are offset by equal and opposite movements in the hedged items. The results are presented before non-controlling interests and tax.
2021 2020Impact on
profit£m
Impact on total equity
£m
Impact onprofit
£m
Impact on total equity
£m
10% strengthening of sterling – 42 – 3110% weakening of sterling – (51) – (38)
Commodity risk The Group’s main commodity exposures are to changes in gas and electricity prices. The Group also hedges its exposure to fluctuations in the cost of carbon emission certificates. This commodity price risk is managed by a combination of physical supply agreements and derivative instruments. At 30 April 2021, £59m of gains (2019/20: losses of £26m) are deferred in equity in respect of cash flow hedges in accordance with IAS 39. Any gains or losses deferred in equity will be reclassified to the income statement in the period in which the hedged item also affects the income statement, which will occur within three years. The following table details the Group’s sensitivity to a 10% increase in these prices, which is management’s assessment of the reasonably possible change, on average, over any given year. A decrease of 10% in these prices would produce an opposite effect on equity. As all of the Group’s commodity financial instruments achieve hedge accounting under IAS 39, there is no impact on profit for either year. The results are presented before non-controlling interests and tax.
2021 2020Impact on
profit£m
Impact on total equity
£m
Impact onprofit
£m
Impact ontotal equity
£m
10% increase in electricity prices – 3 – 110% increase in gas prices – 22 – 910% increase in carbon certificate prices – 7 – (6)
(iii) Credit risk Credit risk is the risk that a customer or counterparty to a financial instrument will fail to perform or fail to pay amounts due, causing financial loss to the Group. In the current economic environment, the Group has placed increased emphasis on the management of credit risk. The carrying amount of financial assets at 30 April 2021 was £1,760m and is analysed in note 21(a). This represents the maximum credit risk exposure. Credit risk on financial instruments held with financial institutions is assessed and managed by reference to the long-term credit ratings assigned to that counterparty by Standard & Poor’s and Moody’s credit rating agencies. The short-term deposits are placed with seven financial institutions with a minimum Standard & Poor’s credit rating of BBB. Amounts deposited with counterparties are subject to limits based on their credit ratings. There are no significant concentrations of credit risk. See note 16 for information on credit risk with respect to trade receivables.
Annual Report 2021 dssmith.com 159
21. Financial instruments continued (d) Risk identification and risk management continued (iv) Liquidity risk Liquidity risk is the risk that the Group, although solvent, will have difficulty in meeting its obligations associated with its financial liabilities as they fall due. The Group manages its liquidity risk by maintaining a sufficient level of undrawn committed borrowing facilities. At 30 April 2021, the Group had £1,452m of undrawn committed borrowing facilities (30 April 2020: £1,400m), which comprises the revolving credit facilities. The Group mitigates its refinancing risk by raising its debt requirements from a number of different sources with a range of maturities. The following table is an analysis of the undiscounted contractual maturities of non-derivative financial liabilities.
Contractual repayments
At 30 April 2021 Total
£m
1 year or less
£m
1–5years
£m
More than5 years
£m
Non-derivative financial liabilities Trade and other payables 1,849 1,834 15 –Bank and other loans 36 32 4 –Commercial paper 43 43 – –Medium-term notes and other fixed-term debt 2,236 160 1,305 771Lease liabilities 276 74 144 58Bank overdrafts 94 94 – –Interest payments on borrowings 157 39 85 33
Total non-derivative financial liabilities 4,691 2,276 1,553 862
Contractual repayments
At 30 April 2020 Total
£m
1 year or less
£m
1–5years
£m
More than5 years
£m
Non-derivative financial liabilities Trade and other payables 1,723 1,708 15 –Bank and other loans 17 14 3 –Commercial paper 21 21 – –Medium-term notes and other fixed-term debt 2,375 63 1,537 775Lease liabilities 304 74 156 74Bank overdrafts 90 90 – –Interest payments on borrowings 210 45 120 45
Total non-derivative financial liabilities 4,740 2,015 1,831 894
Refer to note 29 for a summary of the Group’s capital commitments.

FINANCIAL STATEMENTS
160
Notes to the consolidated financial statements (continued)
160
21. Financial instruments continued (d) Risk identification and risk management continued (iv) Liquidity risk continued The following table is an analysis of the undiscounted contractual maturities of derivative financial liabilities. Where the payable and receivable legs of these derivatives are denominated in foreign currencies, the contractual payments or receipts have been calculated based on exchange rates prevailing at the respective year ends. The disclosure shows net cash flow amounts for derivatives that are net cash-settled and gross cash inflow and outflow amounts for derivatives that have simultaneous gross cash settlement. Where applicable, interest and foreign exchange rates prevailing at the reporting date are assumed to remain constant over the future contractual maturities.
Contractual payments/(receipts)
At 30 April 2021 Total
£m
1 year or less
£m
1–5 years
£m
More than5 years
£m
Derivative financial liabilities Energy derivatives 41 39 2 –Cross-currency swaps and forward foreign exchange contracts:
Payments 583 269 314 –Receipts (573) (269) (304) –
Total derivative financial liabilities 51 39 12 –
Contractual payments/(receipts)
At 30 April 2020 Total
£m
1 year or less
£m
1–5 years
£m
More than5 years
£m
Derivative financial liabilities Energy derivatives 83 43 40 –Cross-currency swaps and forward foreign exchange contracts:
Payments 373 266 107 –Receipts (376) (267) (109) –
Total derivative financial liabilities 80 42 38 –
FINANCIAL STATEMENTS
Annual Report 2021 dssmith.com 161
Notes to the consolidated financial statements (continued)
160
21. Financial instruments continued (d) Risk identification and risk management continued (iv) Liquidity risk continued The following table is an analysis of the undiscounted contractual maturities of derivative financial liabilities. Where the payable and receivable legs of these derivatives are denominated in foreign currencies, the contractual payments or receipts have been calculated based on exchange rates prevailing at the respective year ends. The disclosure shows net cash flow amounts for derivatives that are net cash-settled and gross cash inflow and outflow amounts for derivatives that have simultaneous gross cash settlement. Where applicable, interest and foreign exchange rates prevailing at the reporting date are assumed to remain constant over the future contractual maturities.
Contractual payments/(receipts)
At 30 April 2021 Total
£m
1 year or less
£m
1–5 years
£m
More than5 years
£m
Derivative financial liabilities Energy derivatives 41 39 2 –Cross-currency swaps and forward foreign exchange contracts:
Payments 583 269 314 –Receipts (573) (269) (304) –
Total derivative financial liabilities 51 39 12 –
Contractual payments/(receipts)
At 30 April 2020 Total
£m
1 year or less
£m
1–5 years
£m
More than5 years
£m
Derivative financial liabilities Energy derivatives 83 43 40 –Cross-currency swaps and forward foreign exchange contracts:
Payments 373 266 107 –Receipts (376) (267) (109) –
Total derivative financial liabilities 80 42 38 –
Annual Report 2021 dssmith.com 161
22. Deferred tax assets and liabilities Analysis of movements in recognised deferred tax assets and liabilities during the year
Property, plant and equipment and
intangible assets Employee benefits including pensions
Tax losses Other Total
2021
£m 2020
£m2021
£m2020
£m2021
£m2020
£m2021
£m 2020
£m 2021
£m2020
£m
At beginning of the year (352) (353) 50 46 65 55 9 1 (228) (251)Credit/(charge) for the year: – continuing 11 6 (1) (9) (12) 11 1 2 (1) 10– discontinued – – – – 9 – – – 9 –Recognised directly in equity – – (4) 12 – – (20) 6 (24) 18Currency translation 10 (5) – 1 – (1) – – 10 (5)At end of the year (331) (352) 45 50 62 65 (10) 9 (234) (228)
At 30 April 2021, deferred tax assets and liabilities were recognised for all taxable temporary differences: • except where the deferred tax liability arises on goodwill; • except on initial recognition of an asset or liability in a transaction that is not a business combination and, at the time of the transaction,
affects neither the accounting profit nor the taxable profit or loss; and • in respect of taxable temporary differences associated with investments in subsidiaries and associates, except where the timing of the
reversal of temporary differences can be controlled by the Group and it is probable that temporary differences will not reverse in the foreseeable future.
At 30 April 2021, no deferred tax liability has been recognised in respect of unremitted earnings of subsidiaries and associates because the Group is in a position to control the timing of the reversal of the temporary difference and it is probable that such differences will not reverse in the foreseeable future. It is not practicable to estimate the amount of temporary differences in respect of these unremitted earnings. As commented in note 7, in the March 2021 Budget the UK Government announced that legislation will be introduced in the Finance Bill 2021 to increase the main rate of UK corporation tax from 19% to 25%, effective 1 April 2023. As these changes had not been substantially enacted at the balance sheet date, the UK deferred tax balances as at 30 April 2021 continue to be measured at a rate of 19%. If the 25% tax rate had been used at the balance sheet date, the UK deferred tax asset would have been £7m higher.
Recognised deferred tax assets and liabilities Deferred tax assets and liabilities are offset where the Group has a legally enforceable right to do so. The following is the analysis of the deferred tax balances (after offset) for financial reporting purposes:
2021
£m2020
£m
Deferred tax liabilities (271) (305)Deferred tax assets 37 77Net deferred tax (234) (228)
The deferred tax asset in respect of tax losses at 30 April 2021 includes an asset in the UK of £19m (30 April 2020: £26m). The asset has been recognised based on net interest income that will arise in the UK from the financing of acquisitions. The asset is expected to be fully recovered over the foreseeable future.
The deferred tax asset in respect of tax losses at 30 April 2021 also includes an asset in Luxembourg of £11m (30 April 2020: £13m) and an asset in France of £14m (30 April 2020: £nil). The asset in Luxembourg is expected to be fully recovered in the next 12 months based on interest income that will arise. The asset in France has been recognised this year based on the future forecast profitability of the French business and is expected to be fully recovered over the next five years.
The Group has total unrecognised deferred tax assets relating to tax losses at 30 April 2021 of £10m (30 April 2020: £24m). These losses include £8m (30 April 2020:£24m) which do not expire and £2m (30 April 2020: £nil) which expire between 2026 and 2028 under current tax legislation. Deferred tax assets have not been recognised in respect of these items because it is not probable that future taxable profit will be available against which the Group can utilise these benefits.
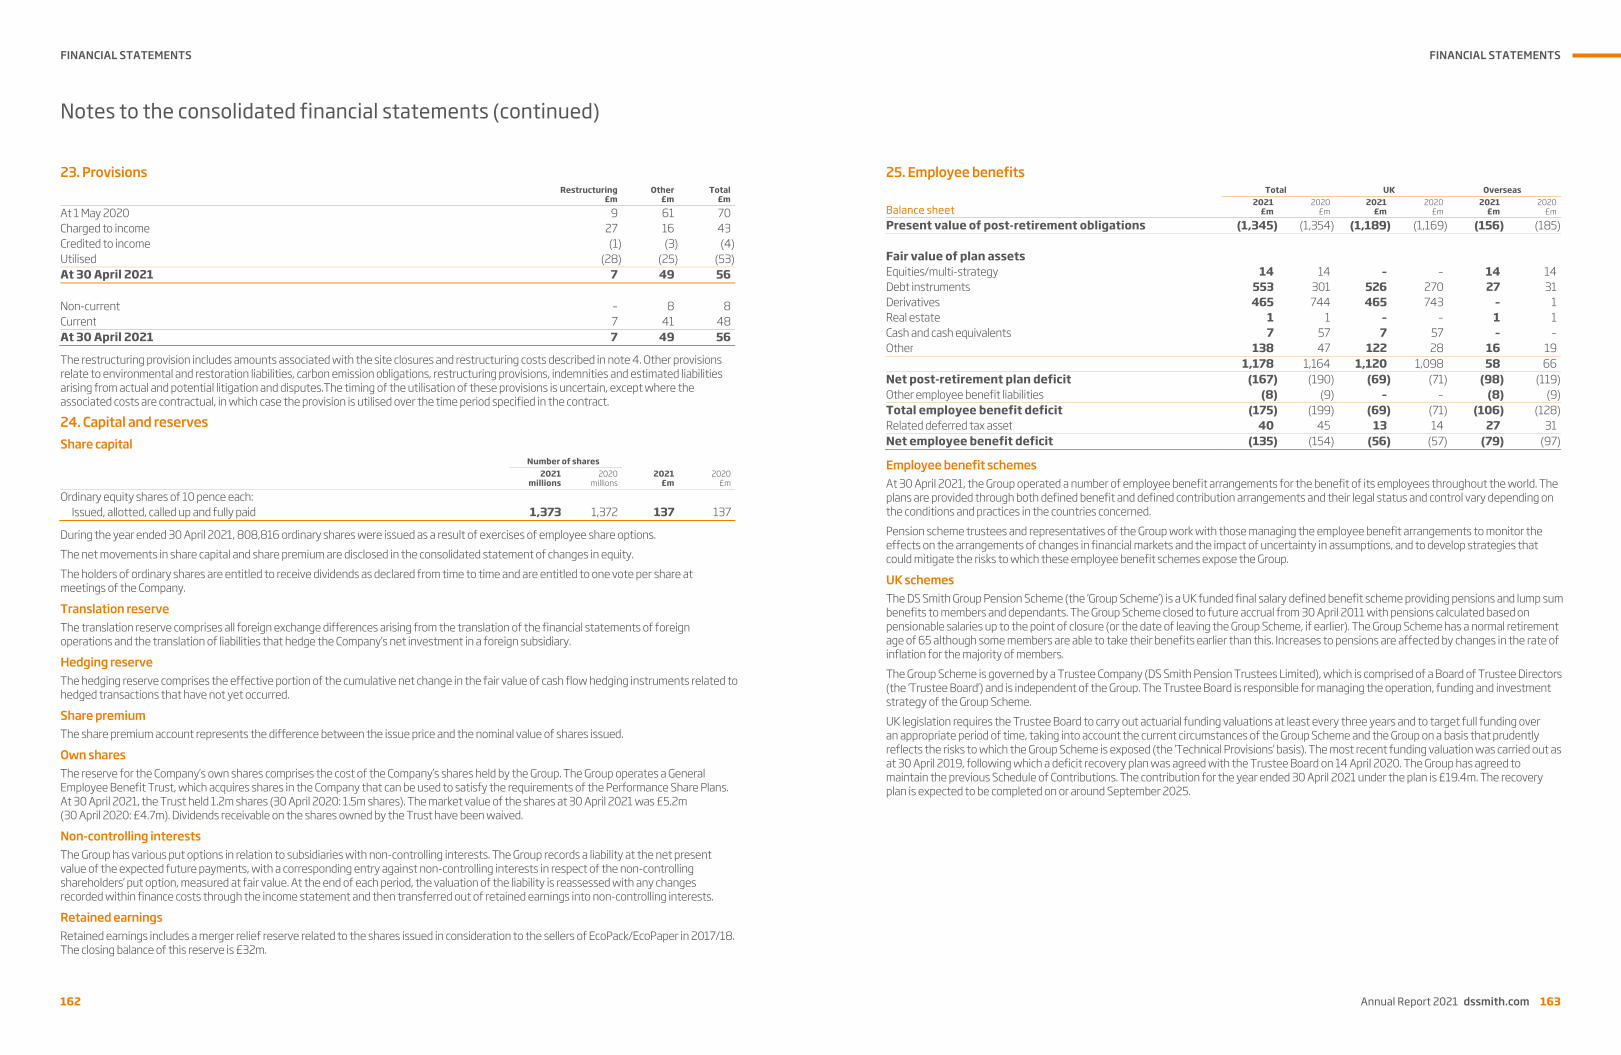
FINANCIAL STATEMENTS
162
Notes to the consolidated financial statements (continued)
162
23. Provisions Restructuring
£m Other
£mTotal
£m
At 1 May 2020 9 61 70Charged to income 27 16 43Credited to income (1) (3) (4)Utilised (28) (25) (53)At 30 April 2021 7 49 56 Non-current – 8 8Current 7 41 48At 30 April 2021 7 49 56
The restructuring provision includes amounts associated with the site closures and restructuring costs described in note 4. Other provisions relate to environmental and restoration liabilities, carbon emission obligations, restructuring provisions, indemnities and estimated liabilities arising from actual and potential litigation and disputes.The timing of the utilisation of these provisions is uncertain, except where the associated costs are contractual, in which case the provision is utilised over the time period specified in the contract.
24. Capital and reserves Share capital
Number of shares 2021
millions2020
millions 2021
£m2020
£m
Ordinary equity shares of 10 pence each: Issued, allotted, called up and fully paid 1,373 1,372 137 137
During the year ended 30 April 2021, 808,816 ordinary shares were issued as a result of exercises of employee share options. The net movements in share capital and share premium are disclosed in the consolidated statement of changes in equity. The holders of ordinary shares are entitled to receive dividends as declared from time to time and are entitled to one vote per share at meetings of the Company.
Translation reserve The translation reserve comprises all foreign exchange differences arising from the translation of the financial statements of foreign operations and the translation of liabilities that hedge the Company’s net investment in a foreign subsidiary.
Hedging reserve The hedging reserve comprises the effective portion of the cumulative net change in the fair value of cash flow hedging instruments related to hedged transactions that have not yet occurred.
Share premium The share premium account represents the difference between the issue price and the nominal value of shares issued.
Own shares The reserve for the Company’s own shares comprises the cost of the Company’s shares held by the Group. The Group operates a General Employee Benefit Trust, which acquires shares in the Company that can be used to satisfy the requirements of the Performance Share Plans. At 30 April 2021, the Trust held 1.2m shares (30 April 2020: 1.5m shares). The market value of the shares at 30 April 2021 was £5.2m (30 April 2020: £4.7m). Dividends receivable on the shares owned by the Trust have been waived.
Non-controlling interests The Group has various put options in relation to subsidiaries with non-controlling interests. The Group records a liability at the net present value of the expected future payments, with a corresponding entry against non-controlling interests in respect of the non-controlling shareholders’ put option, measured at fair value. At the end of each period, the valuation of the liability is reassessed with any changes recorded within finance costs through the income statement and then transferred out of retained earnings into non-controlling interests.
Retained earnings Retained earnings includes a merger relief reserve related to the shares issued in consideration to the sellers of EcoPack/EcoPaper in 2017/18. The closing balance of this reserve is £32m.
FINANCIAL STATEMENTS
Annual Report 2021 dssmith.com 163
Notes to the consolidated financial statements (continued)
162
23. Provisions Restructuring
£m Other
£mTotal
£m
At 1 May 2020 9 61 70Charged to income 27 16 43Credited to income (1) (3) (4)Utilised (28) (25) (53)At 30 April 2021 7 49 56 Non-current – 8 8Current 7 41 48At 30 April 2021 7 49 56
The restructuring provision includes amounts associated with the site closures and restructuring costs described in note 4. Other provisions relate to environmental and restoration liabilities, carbon emission obligations, restructuring provisions, indemnities and estimated liabilities arising from actual and potential litigation and disputes.The timing of the utilisation of these provisions is uncertain, except where the associated costs are contractual, in which case the provision is utilised over the time period specified in the contract.
24. Capital and reserves Share capital
Number of shares 2021
millions2020
millions 2021
£m2020
£m
Ordinary equity shares of 10 pence each: Issued, allotted, called up and fully paid 1,373 1,372 137 137
During the year ended 30 April 2021, 808,816 ordinary shares were issued as a result of exercises of employee share options. The net movements in share capital and share premium are disclosed in the consolidated statement of changes in equity. The holders of ordinary shares are entitled to receive dividends as declared from time to time and are entitled to one vote per share at meetings of the Company.
Translation reserve The translation reserve comprises all foreign exchange differences arising from the translation of the financial statements of foreign operations and the translation of liabilities that hedge the Company’s net investment in a foreign subsidiary.
Hedging reserve The hedging reserve comprises the effective portion of the cumulative net change in the fair value of cash flow hedging instruments related to hedged transactions that have not yet occurred.
Share premium The share premium account represents the difference between the issue price and the nominal value of shares issued.
Own shares The reserve for the Company’s own shares comprises the cost of the Company’s shares held by the Group. The Group operates a General Employee Benefit Trust, which acquires shares in the Company that can be used to satisfy the requirements of the Performance Share Plans. At 30 April 2021, the Trust held 1.2m shares (30 April 2020: 1.5m shares). The market value of the shares at 30 April 2021 was £5.2m (30 April 2020: £4.7m). Dividends receivable on the shares owned by the Trust have been waived.
Non-controlling interests The Group has various put options in relation to subsidiaries with non-controlling interests. The Group records a liability at the net present value of the expected future payments, with a corresponding entry against non-controlling interests in respect of the non-controlling shareholders’ put option, measured at fair value. At the end of each period, the valuation of the liability is reassessed with any changes recorded within finance costs through the income statement and then transferred out of retained earnings into non-controlling interests.
Retained earnings Retained earnings includes a merger relief reserve related to the shares issued in consideration to the sellers of EcoPack/EcoPaper in 2017/18. The closing balance of this reserve is £32m.
Annual Report 2021 dssmith.com 163
25. Employee benefits Total UK Overseas
Balance sheet 2021
£m2020
£m2021
£m 2020
£m 2021
£m2020
£m
Present value of post-retirement obligations (1,345) (1,354) (1,189) (1,169) (156) (185) Fair value of plan assets Equities/multi-strategy 14 14 – – 14 14Debt instruments 553 301 526 270 27 31Derivatives 465 744 465 743 – 1Real estate 1 1 – – 1 1Cash and cash equivalents 7 57 7 57 – –Other 138 47 122 28 16 19 1,178 1,164 1,120 1,098 58 66Net post-retirement plan deficit (167) (190) (69) (71) (98) (119)Other employee benefit liabilities (8) (9) – – (8) (9)Total employee benefit deficit (175) (199) (69) (71) (106) (128)Related deferred tax asset 40 45 13 14 27 31Net employee benefit deficit (135) (154) (56) (57) (79) (97)
Employee benefit schemes At 30 April 2021, the Group operated a number of employee benefit arrangements for the benefit of its employees throughout the world. The plans are provided through both defined benefit and defined contribution arrangements and their legal status and control vary depending on the conditions and practices in the countries concerned. Pension scheme trustees and representatives of the Group work with those managing the employee benefit arrangements to monitor the effects on the arrangements of changes in financial markets and the impact of uncertainty in assumptions, and to develop strategies that could mitigate the risks to which these employee benefit schemes expose the Group.
UK schemes The DS Smith Group Pension Scheme (the ‘Group Scheme’) is a UK funded final salary defined benefit scheme providing pensions and lump sum benefits to members and dependants. The Group Scheme closed to future accrual from 30 April 2011 with pensions calculated based on pensionable salaries up to the point of closure (or the date of leaving the Group Scheme, if earlier). The Group Scheme has a normal retirement age of 65 although some members are able to take their benefits earlier than this. Increases to pensions are affected by changes in the rate of inflation for the majority of members. The Group Scheme is governed by a Trustee Company (DS Smith Pension Trustees Limited), which is comprised of a Board of Trustee Directors (the ‘Trustee Board’) and is independent of the Group. The Trustee Board is responsible for managing the operation, funding and investment strategy of the Group Scheme. UK legislation requires the Trustee Board to carry out actuarial funding valuations at least every three years and to target full funding over an appropriate period of time, taking into account the current circumstances of the Group Scheme and the Group on a basis that prudently reflects the risks to which the Group Scheme is exposed (the ‘Technical Provisions’ basis). The most recent funding valuation was carried out as at 30 April 2019, following which a deficit recovery plan was agreed with the Trustee Board on 14 April 2020. The Group has agreed to maintain the previous Schedule of Contributions. The contribution for the year ended 30 April 2021 under the plan is £19.4m. The recovery plan is expected to be completed on or around September 2025.
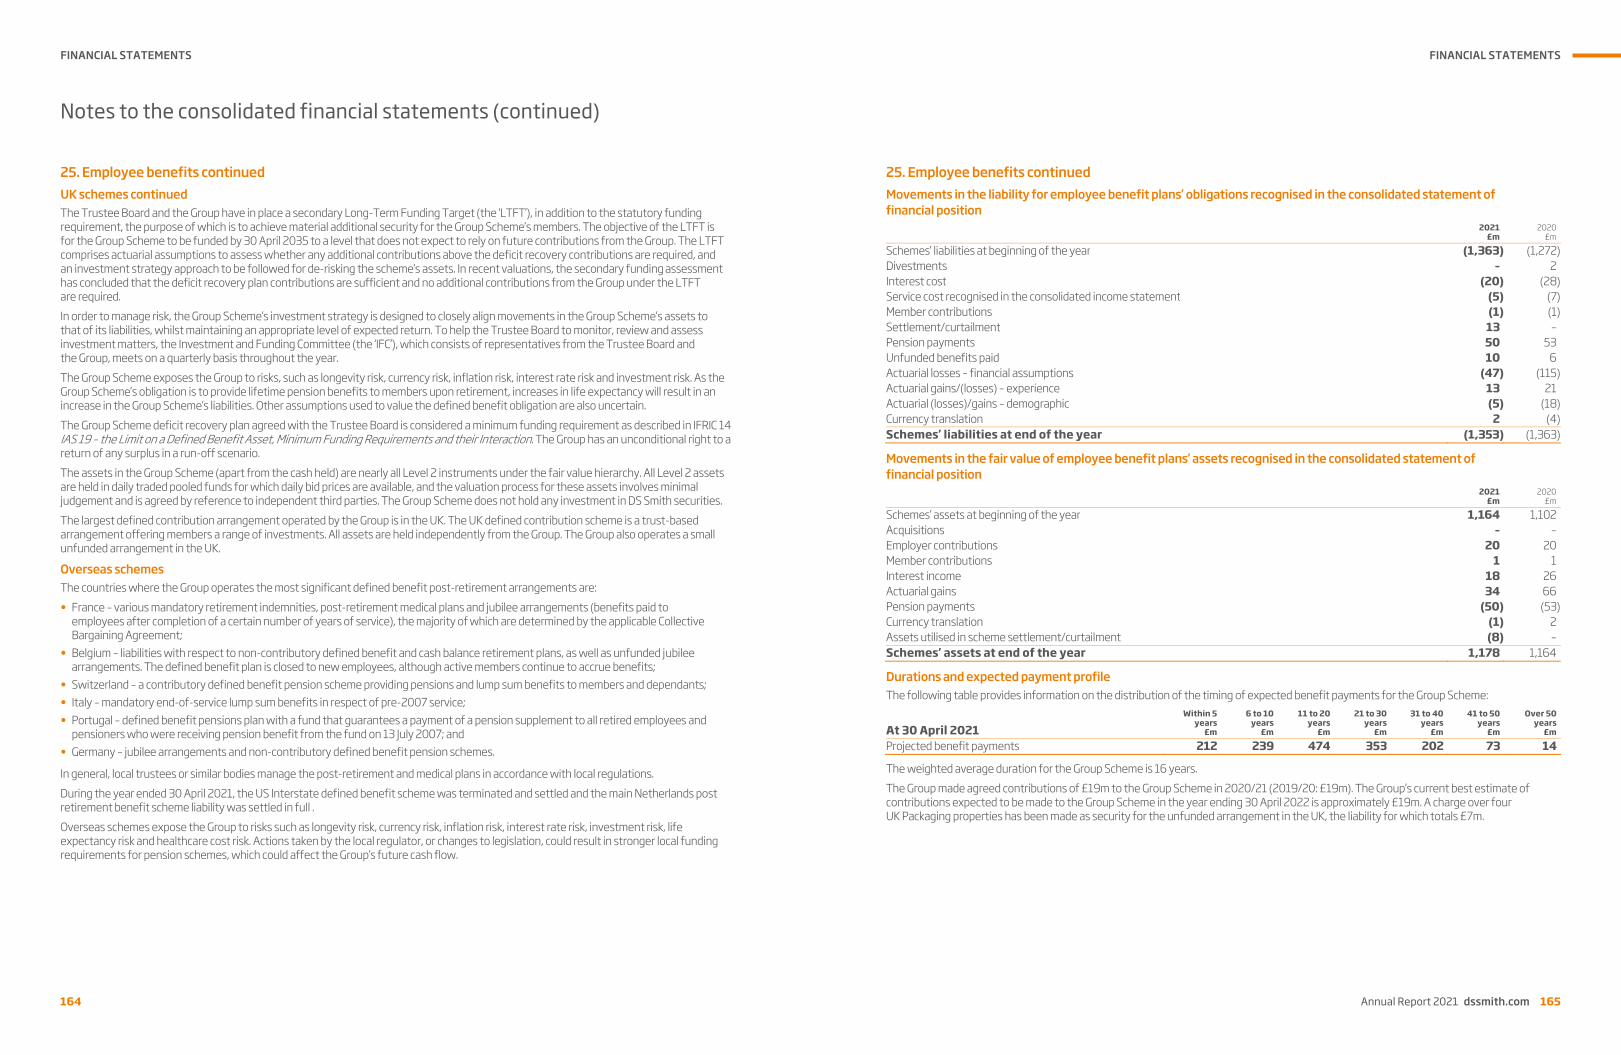
FINANCIAL STATEMENTS
164
Notes to the consolidated financial statements (continued)
164
25. Employee benefits continued UK schemes continued The Trustee Board and the Group have in place a secondary Long-Term Funding Target (the ‘LTFT’), in addition to the statutory funding requirement, the purpose of which is to achieve material additional security for the Group Scheme’s members. The objective of the LTFT is for the Group Scheme to be funded by 30 April 2035 to a level that does not expect to rely on future contributions from the Group. The LTFT comprises actuarial assumptions to assess whether any additional contributions above the deficit recovery contributions are required, and an investment strategy approach to be followed for de-risking the scheme’s assets. In recent valuations, the secondary funding assessment has concluded that the deficit recovery plan contributions are sufficient and no additional contributions from the Group under the LTFT are required. In order to manage risk, the Group Scheme’s investment strategy is designed to closely align movements in the Group Scheme’s assets to that of its liabilities, whilst maintaining an appropriate level of expected return. To help the Trustee Board to monitor, review and assess investment matters, the Investment and Funding Committee (the ‘IFC’), which consists of representatives from the Trustee Board and the Group, meets on a quarterly basis throughout the year. The Group Scheme exposes the Group to risks, such as longevity risk, currency risk, inflation risk, interest rate risk and investment risk. As the Group Scheme’s obligation is to provide lifetime pension benefits to members upon retirement, increases in life expectancy will result in an increase in the Group Scheme’s liabilities. Other assumptions used to value the defined benefit obligation are also uncertain. The Group Scheme deficit recovery plan agreed with the Trustee Board is considered a minimum funding requirement as described in IFRIC 14 IAS 19 – the Limit on a Defined Benefit Asset, Minimum Funding Requirements and their Interaction. The Group has an unconditional right to a return of any surplus in a run-off scenario. The assets in the Group Scheme (apart from the cash held) are nearly all Level 2 instruments under the fair value hierarchy. All Level 2 assets are held in daily traded pooled funds for which daily bid prices are available, and the valuation process for these assets involves minimal judgement and is agreed by reference to independent third parties. The Group Scheme does not hold any investment in DS Smith securities. The largest defined contribution arrangement operated by the Group is in the UK. The UK defined contribution scheme is a trust-based arrangement offering members a range of investments. All assets are held independently from the Group. The Group also operates a small unfunded arrangement in the UK.
Overseas schemes The countries where the Group operates the most significant defined benefit post-retirement arrangements are: • France – various mandatory retirement indemnities, post-retirement medical plans and jubilee arrangements (benefits paid to
employees after completion of a certain number of years of service), the majority of which are determined by the applicable Collective Bargaining Agreement;
• Belgium – liabilities with respect to non-contributory defined benefit and cash balance retirement plans, as well as unfunded jubilee arrangements. The defined benefit plan is closed to new employees, although active members continue to accrue benefits;
• Switzerland – a contributory defined benefit pension scheme providing pensions and lump sum benefits to members and dependants; • Italy – mandatory end-of-service lump sum benefits in respect of pre-2007 service; • Portugal – defined benefit pensions plan with a fund that guarantees a payment of a pension supplement to all retired employees and
pensioners who were receiving pension benefit from the fund on 13 July 2007; and • Germany – jubilee arrangements and non-contributory defined benefit pension schemes.
In general, local trustees or similar bodies manage the post-retirement and medical plans in accordance with local regulations. During the year ended 30 April 2021, the US Interstate defined benefit scheme was terminated and settled and the main Netherlands post retirement benefit scheme liability was settled in full . Overseas schemes expose the Group to risks such as longevity risk, currency risk, inflation risk, interest rate risk, investment risk, life expectancy risk and healthcare cost risk. Actions taken by the local regulator, or changes to legislation, could result in stronger local funding requirements for pension schemes, which could affect the Group’s future cash flow.
FINANCIAL STATEMENTS
Annual Report 2021 dssmith.com 165
Notes to the consolidated financial statements (continued)
164
25. Employee benefits continued UK schemes continued The Trustee Board and the Group have in place a secondary Long-Term Funding Target (the ‘LTFT’), in addition to the statutory funding requirement, the purpose of which is to achieve material additional security for the Group Scheme’s members. The objective of the LTFT is for the Group Scheme to be funded by 30 April 2035 to a level that does not expect to rely on future contributions from the Group. The LTFT comprises actuarial assumptions to assess whether any additional contributions above the deficit recovery contributions are required, and an investment strategy approach to be followed for de-risking the scheme’s assets. In recent valuations, the secondary funding assessment has concluded that the deficit recovery plan contributions are sufficient and no additional contributions from the Group under the LTFT are required. In order to manage risk, the Group Scheme’s investment strategy is designed to closely align movements in the Group Scheme’s assets to that of its liabilities, whilst maintaining an appropriate level of expected return. To help the Trustee Board to monitor, review and assess investment matters, the Investment and Funding Committee (the ‘IFC’), which consists of representatives from the Trustee Board and the Group, meets on a quarterly basis throughout the year. The Group Scheme exposes the Group to risks, such as longevity risk, currency risk, inflation risk, interest rate risk and investment risk. As the Group Scheme’s obligation is to provide lifetime pension benefits to members upon retirement, increases in life expectancy will result in an increase in the Group Scheme’s liabilities. Other assumptions used to value the defined benefit obligation are also uncertain. The Group Scheme deficit recovery plan agreed with the Trustee Board is considered a minimum funding requirement as described in IFRIC 14 IAS 19 – the Limit on a Defined Benefit Asset, Minimum Funding Requirements and their Interaction. The Group has an unconditional right to a return of any surplus in a run-off scenario. The assets in the Group Scheme (apart from the cash held) are nearly all Level 2 instruments under the fair value hierarchy. All Level 2 assets are held in daily traded pooled funds for which daily bid prices are available, and the valuation process for these assets involves minimal judgement and is agreed by reference to independent third parties. The Group Scheme does not hold any investment in DS Smith securities. The largest defined contribution arrangement operated by the Group is in the UK. The UK defined contribution scheme is a trust-based arrangement offering members a range of investments. All assets are held independently from the Group. The Group also operates a small unfunded arrangement in the UK.
Overseas schemes The countries where the Group operates the most significant defined benefit post-retirement arrangements are: • France – various mandatory retirement indemnities, post-retirement medical plans and jubilee arrangements (benefits paid to
employees after completion of a certain number of years of service), the majority of which are determined by the applicable Collective Bargaining Agreement;
• Belgium – liabilities with respect to non-contributory defined benefit and cash balance retirement plans, as well as unfunded jubilee arrangements. The defined benefit plan is closed to new employees, although active members continue to accrue benefits;
• Switzerland – a contributory defined benefit pension scheme providing pensions and lump sum benefits to members and dependants; • Italy – mandatory end-of-service lump sum benefits in respect of pre-2007 service; • Portugal – defined benefit pensions plan with a fund that guarantees a payment of a pension supplement to all retired employees and
pensioners who were receiving pension benefit from the fund on 13 July 2007; and • Germany – jubilee arrangements and non-contributory defined benefit pension schemes.
In general, local trustees or similar bodies manage the post-retirement and medical plans in accordance with local regulations. During the year ended 30 April 2021, the US Interstate defined benefit scheme was terminated and settled and the main Netherlands post retirement benefit scheme liability was settled in full . Overseas schemes expose the Group to risks such as longevity risk, currency risk, inflation risk, interest rate risk, investment risk, life expectancy risk and healthcare cost risk. Actions taken by the local regulator, or changes to legislation, could result in stronger local funding requirements for pension schemes, which could affect the Group’s future cash flow.
Annual Report 2021 dssmith.com 165
25. Employee benefits continued Movements in the liability for employee benefit plans’ obligations recognised in the consolidated statement of financial position
2021
£m2020
£m
Schemes’ liabilities at beginning of the year (1,363) (1,272)Divestments – 2Interest cost (20) (28)Service cost recognised in the consolidated income statement (5) (7)Member contributions (1) (1)Settlement/curtailment 13 –Pension payments 50 53Unfunded benefits paid 10 6Actuarial losses – financial assumptions (47) (115)Actuarial gains/(losses) – experience 13 21Actuarial (losses)/gains – demographic (5) (18)Currency translation 2 (4)Schemes’ liabilities at end of the year (1,353) (1,363)
Movements in the fair value of employee benefit plans’ assets recognised in the consolidated statement of financial position
2021
£m2020
£m
Schemes’ assets at beginning of the year 1,164 1,102Acquisitions – –Employer contributions 20 20Member contributions 1 1Interest income 18 26Actuarial gains 34 66Pension payments (50) (53)Currency translation (1) 2Assets utilised in scheme settlement/curtailment (8) –Schemes’ assets at end of the year 1,178 1,164
Durations and expected payment profile The following table provides information on the distribution of the timing of expected benefit payments for the Group Scheme:
At 30 April 2021 Within 5
years£m
6 to 10 years
£m
11 to 20 years
£m
21 to 30 years
£m
31 to 40 years
£m
41 to 50 years
£m
Over 50 years
£m
Projected benefit payments 212 239 474 353 202 73 14
The weighted average duration for the Group Scheme is 16 years. The Group made agreed contributions of £19m to the Group Scheme in 2020/21 (2019/20: £19m). The Group’s current best estimate of contributions expected to be made to the Group Scheme in the year ending 30 April 2022 is approximately £19m. A charge over four UK Packaging properties has been made as security for the unfunded arrangement in the UK, the liability for which totals £7m.
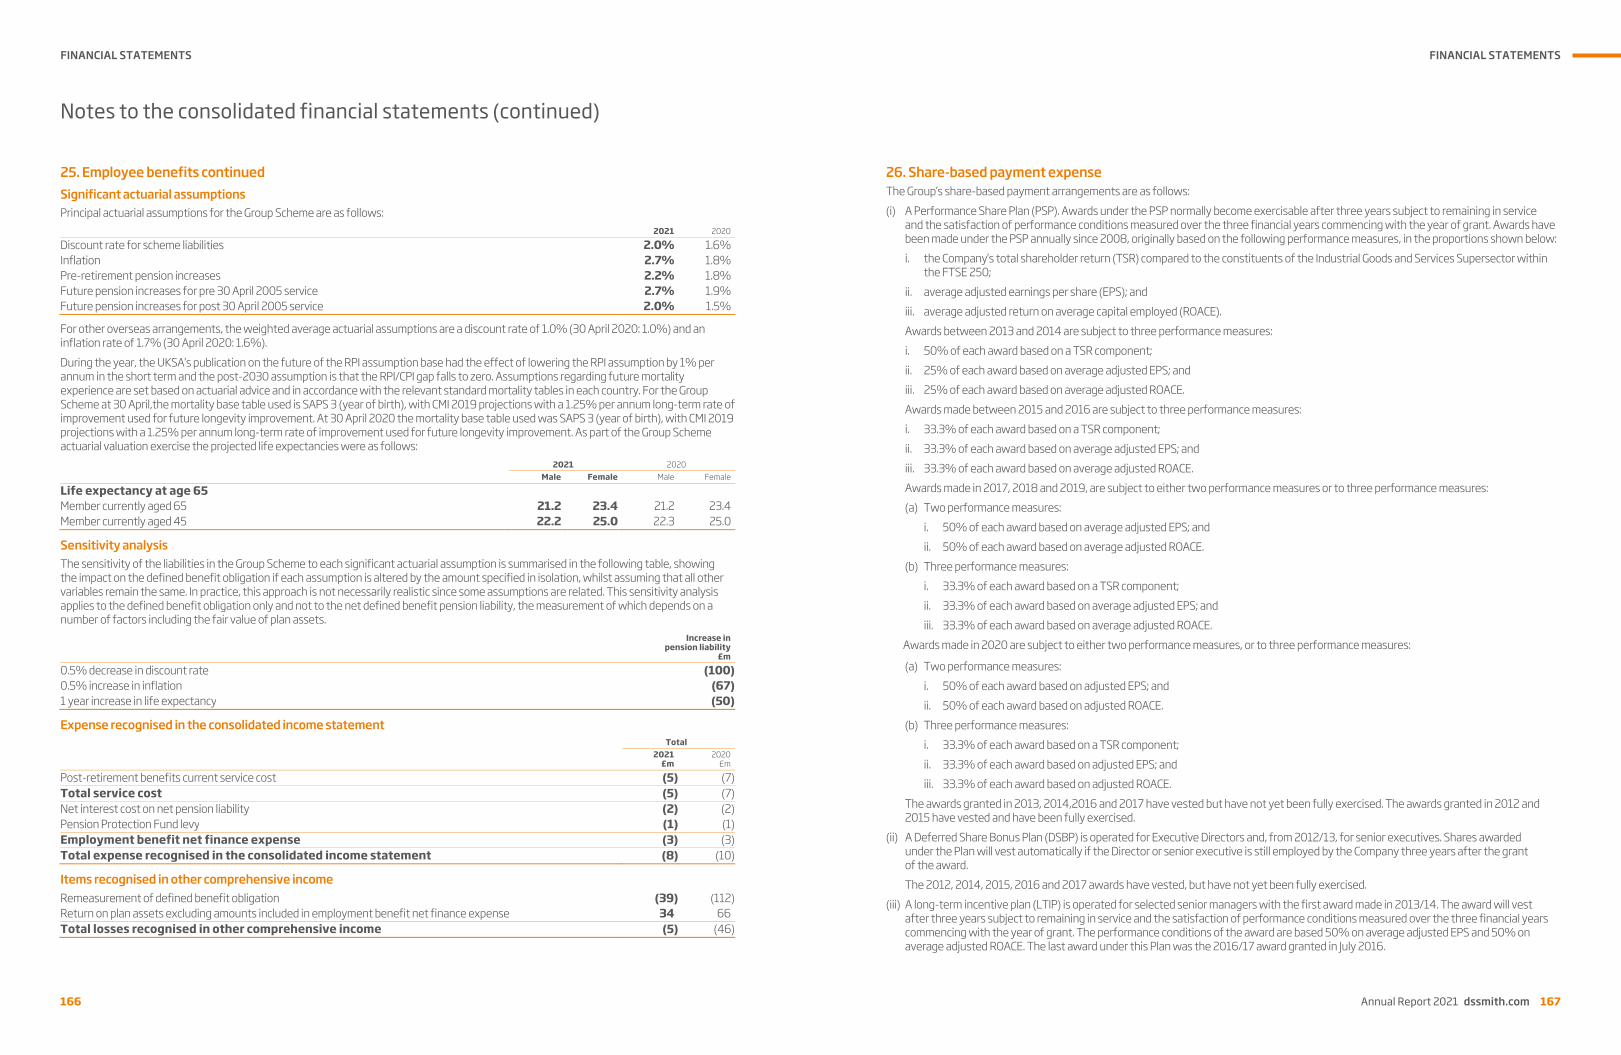
FINANCIAL STATEMENTS
166
Notes to the consolidated financial statements (continued)
166
25. Employee benefits continued Significant actuarial assumptions Principal actuarial assumptions for the Group Scheme are as follows:
2021 2020
Discount rate for scheme liabilities 2.0% 1.6%Inflation 2.7% 1.8%Pre-retirement pension increases 2.2% 1.8%Future pension increases for pre 30 April 2005 service 2.7% 1.9%Future pension increases for post 30 April 2005 service 2.0% 1.5%
For other overseas arrangements, the weighted average actuarial assumptions are a discount rate of 1.0% (30 April 2020: 1.0%) and an inflation rate of 1.7% (30 April 2020: 1.6%). During the year, the UKSA’s publication on the future of the RPI assumption base had the effect of lowering the RPI assumption by 1% per annum in the short term and the post-2030 assumption is that the RPI/CPI gap falls to zero. Assumptions regarding future mortality experience are set based on actuarial advice and in accordance with the relevant standard mortality tables in each country. For the Group Scheme at 30 April,the mortality base table used is SAPS 3 (year of birth), with CMI 2019 projections with a 1.25% per annum long-term rate of improvement used for future longevity improvement. At 30 April 2020 the mortality base table used was SAPS 3 (year of birth), with CMI 2019 projections with a 1.25% per annum long-term rate of improvement used for future longevity improvement. As part of the Group Scheme actuarial valuation exercise the projected life expectancies were as follows:
2021 2020Male Female Male Female
Life expectancy at age 65 Member currently aged 65 21.2 23.4 21.2 23.4Member currently aged 45 22.2 25.0 22.3 25.0
Sensitivity analysis The sensitivity of the liabilities in the Group Scheme to each significant actuarial assumption is summarised in the following table, showing the impact on the defined benefit obligation if each assumption is altered by the amount specified in isolation, whilst assuming that all other variables remain the same. In practice, this approach is not necessarily realistic since some assumptions are related. This sensitivity analysis applies to the defined benefit obligation only and not to the net defined benefit pension liability, the measurement of which depends on a number of factors including the fair value of plan assets.
Increase in pension liability
£m
0.5% decrease in discount rate (100)0.5% increase in inflation (67)1 year increase in life expectancy (50)
Expense recognised in the consolidated income statement Total
2021
£m2020
£m
Post-retirement benefits current service cost (5) (7)Total service cost (5) (7)Net interest cost on net pension liability (2) (2)Pension Protection Fund levy (1) (1)Employment benefit net finance expense (3) (3)Total expense recognised in the consolidated income statement (8) (10)
Items recognised in other comprehensive income Remeasurement of defined benefit obligation (39) (112)Return on plan assets excluding amounts included in employment benefit net finance expense 34 66Total losses recognised in other comprehensive income (5) (46)
FINANCIAL STATEMENTS
Annual Report 2021 dssmith.com 167
Notes to the consolidated financial statements (continued)
166
25. Employee benefits continued Significant actuarial assumptions Principal actuarial assumptions for the Group Scheme are as follows:
2021 2020
Discount rate for scheme liabilities 2.0% 1.6%Inflation 2.7% 1.8%Pre-retirement pension increases 2.2% 1.8%Future pension increases for pre 30 April 2005 service 2.7% 1.9%Future pension increases for post 30 April 2005 service 2.0% 1.5%
For other overseas arrangements, the weighted average actuarial assumptions are a discount rate of 1.0% (30 April 2020: 1.0%) and an inflation rate of 1.7% (30 April 2020: 1.6%). During the year, the UKSA’s publication on the future of the RPI assumption base had the effect of lowering the RPI assumption by 1% per annum in the short term and the post-2030 assumption is that the RPI/CPI gap falls to zero. Assumptions regarding future mortality experience are set based on actuarial advice and in accordance with the relevant standard mortality tables in each country. For the Group Scheme at 30 April,the mortality base table used is SAPS 3 (year of birth), with CMI 2019 projections with a 1.25% per annum long-term rate of improvement used for future longevity improvement. At 30 April 2020 the mortality base table used was SAPS 3 (year of birth), with CMI 2019 projections with a 1.25% per annum long-term rate of improvement used for future longevity improvement. As part of the Group Scheme actuarial valuation exercise the projected life expectancies were as follows:
2021 2020Male Female Male Female
Life expectancy at age 65 Member currently aged 65 21.2 23.4 21.2 23.4Member currently aged 45 22.2 25.0 22.3 25.0
Sensitivity analysis The sensitivity of the liabilities in the Group Scheme to each significant actuarial assumption is summarised in the following table, showing the impact on the defined benefit obligation if each assumption is altered by the amount specified in isolation, whilst assuming that all other variables remain the same. In practice, this approach is not necessarily realistic since some assumptions are related. This sensitivity analysis applies to the defined benefit obligation only and not to the net defined benefit pension liability, the measurement of which depends on a number of factors including the fair value of plan assets.
Increase in pension liability
£m
0.5% decrease in discount rate (100)0.5% increase in inflation (67)1 year increase in life expectancy (50)
Expense recognised in the consolidated income statement Total
2021
£m2020
£m
Post-retirement benefits current service cost (5) (7)Total service cost (5) (7)Net interest cost on net pension liability (2) (2)Pension Protection Fund levy (1) (1)Employment benefit net finance expense (3) (3)Total expense recognised in the consolidated income statement (8) (10)
Items recognised in other comprehensive income Remeasurement of defined benefit obligation (39) (112)Return on plan assets excluding amounts included in employment benefit net finance expense 34 66Total losses recognised in other comprehensive income (5) (46)
Annual Report 2021 dssmith.com 167
26. Share-based payment expense The Group’s share-based payment arrangements are as follows: (i) A Performance Share Plan (PSP). Awards under the PSP normally become exercisable after three years subject to remaining in service
and the satisfaction of performance conditions measured over the three financial years commencing with the year of grant. Awards have been made under the PSP annually since 2008, originally based on the following performance measures, in the proportions shown below: i. the Company’s total shareholder return (TSR) compared to the constituents of the Industrial Goods and Services Supersector within
the FTSE 250; ii. average adjusted earnings per share (EPS); and iii. average adjusted return on average capital employed (ROACE). Awards between 2013 and 2014 are subject to three performance measures: i. 50% of each award based on a TSR component; ii. 25% of each award based on average adjusted EPS; and iii. 25% of each award based on average adjusted ROACE. Awards made between 2015 and 2016 are subject to three performance measures: i. 33.3% of each award based on a TSR component; ii. 33.3% of each award based on average adjusted EPS; and iii. 33.3% of each award based on average adjusted ROACE. Awards made in 2017, 2018 and 2019, are subject to either two performance measures or to three performance measures: (a) Two performance measures:
i. 50% of each award based on average adjusted EPS; and ii. 50% of each award based on average adjusted ROACE.
(b) Three performance measures: i. 33.3% of each award based on a TSR component; ii. 33.3% of each award based on average adjusted EPS; and iii. 33.3% of each award based on average adjusted ROACE.
Awards made in 2020 are subject to either two performance measures, or to three performance measures:
(a) Two performance measures: i. 50% of each award based on adjusted EPS; and ii. 50% of each award based on adjusted ROACE.
(b) Three performance measures: i. 33.3% of each award based on a TSR component; ii. 33.3% of each award based on adjusted EPS; and iii. 33.3% of each award based on adjusted ROACE.
The awards granted in 2013, 2014,2016 and 2017 have vested but have not yet been fully exercised. The awards granted in 2012 and 2015 have vested and have been fully exercised.
(ii) A Deferred Share Bonus Plan (DSBP) is operated for Executive Directors and, from 2012/13, for senior executives. Shares awarded under the Plan will vest automatically if the Director or senior executive is still employed by the Company three years after the grant of the award. The 2012, 2014, 2015, 2016 and 2017 awards have vested, but have not yet been fully exercised.
(iii) A long-term incentive plan (LTIP) is operated for selected senior managers with the first award made in 2013/14. The award will vest after three years subject to remaining in service and the satisfaction of performance conditions measured over the three financial years commencing with the year of grant. The performance conditions of the award are based 50% on average adjusted EPS and 50% on average adjusted ROACE. The last award under this Plan was the 2016/17 award granted in July 2016.

FINANCIAL STATEMENTS
168
Notes to the consolidated financial statements (continued)
168
26. Share-based payment expense continued (iv) An international Sharesave Plan was introduced in January 2014 with further invitations being made in January 2016, January 2017, January
2018, January 2019.and February 2021. All employees of the Company and participating subsidiaries were eligible to participate in this Plan or an HMRC approved UK Sharesave Plan. Options are granted to participants who have contracted to save up to a maximum of £250 (or local currency equivalent) across all open invitations per month over a period of three years, at a discount of up to 20% to the average closing mid-market price of a DS Smith Plc ordinary share on the three dealing days prior to invitation. Options cannot normally be exercised until a minimum of three years has elapsed. In common with most plans of this type there are no performance conditions applicable to options granted under this Plan. The provisions of this Plan are subject to minor country specific variances. In France, the option price is discounted by up to 20% of the 20-day average up to the day before grant date. A standard US Stock Purchase Plan, which received shareholder approval at the 2014 AGM, was also introduced in January 2014 and subsequent invitations were made in 2016, 2017, 2018, 2019 and 2021. US employees of the Group are eligible to participate in this Plan. Options are granted to participants who have contracted to save up to the local currency equivalent of £250 per month over a period of two years at a discount of up to 15% to the average closing mid-market price of a DS Smith Plc ordinary share on the day before grant. Options cannot normally be exercised until a minimum of two years has elapsed.
Further details of the awards described in (i), (ii), and (iv) are set out in the Remuneration Committee report. Options outstanding and exercisable under share arrangements at 30 April 2021 were:
Options outstanding Options exercisable
Number
of sharesOption price
range (p)
Weighted average
remainingcontract life
(years)
Weighted average exercise price (p)
Numberexercisable
Weightedaverageexerciseprice (p)
Performance Share Plan 8,826,470 Nil 1.7 Nil 610,320 NilDeferred Share Bonus Plan 4,662,568 Nil 0.8 Nil 302,930 NilSharesave Plan 10,266,779 269–412 0.8 306.9 877,890 411.6
The effect on earnings per share of potentially dilutive shares issuable under share-based payment arrangements is shown in note 8. Movements in the number of share options outstanding and their related weighted average exercise prices are as follows:
Performance
Share Plan Deferred Share
Bonus Plan Sharesave
plan Long-term
incentive plan
2021
Weighted average exercise price (p)
Options(‘000s)
Weighted average exercise price (p)
Options(‘000s)
Weighted average exercise price (p)
Options (‘000s)
Weighted average exercise price (p)
Options(£‘000s)
At 1 May 2020 Nil 7,634 Nil 1,790 313.8 10,593 Nil –Granted Nil 3,757 Nil 3,267 325.0 4,972 Nil –Exercised Nil (525) Nil (151) 370.5 (808) Nil –Lapsed Nil (2,040) Nil (243) 331.8 (4,490) Nil –At 30 April 2021 Nil 8,826 Nil 4,663 306.9 10,267 Nil –Exercisable at 30 April 2021 Nil 610 Nil 303 411.6 878 Nil –
Performance
Share Plan Deferred Share
Bonus plan Sharesave
plan Long-term
incentive plan
2020
Weighted average exercise price (p)
Options(‘000s)
Weighted average exercise price (p)
Options(‘000s)
Weighted average exercise price (p)
Options (‘000s)
Weighted average exercise price (p)
Options(£‘000s)
At 1 May 2019 Nil 6,456 Nil 1,286 314.3 12,841 Nil 1,554Granted Nil 3,269 Nil 785 348.6 1 Nil –Exercised Nil (790) Nil (251) 303.7 (866) Nil (952)Lapsed Nil (1,301) Nil (30) 325.3 (1,383) Nil (602)At 30 April 2020 Nil 7,634 Nil 1,790 313.8 10,593 Nil –Exercisable at 30 April 2020 Nil 430 Nil 297 333.0 3,905 Nil –
FINANCIAL STATEMENTS
Annual Report 2021 dssmith.com 169
Notes to the consolidated financial statements (continued)
168
26. Share-based payment expense continued (iv) An international Sharesave Plan was introduced in January 2014 with further invitations being made in January 2016, January 2017, January
2018, January 2019.and February 2021. All employees of the Company and participating subsidiaries were eligible to participate in this Plan or an HMRC approved UK Sharesave Plan. Options are granted to participants who have contracted to save up to a maximum of £250 (or local currency equivalent) across all open invitations per month over a period of three years, at a discount of up to 20% to the average closing mid-market price of a DS Smith Plc ordinary share on the three dealing days prior to invitation. Options cannot normally be exercised until a minimum of three years has elapsed. In common with most plans of this type there are no performance conditions applicable to options granted under this Plan. The provisions of this Plan are subject to minor country specific variances. In France, the option price is discounted by up to 20% of the 20-day average up to the day before grant date. A standard US Stock Purchase Plan, which received shareholder approval at the 2014 AGM, was also introduced in January 2014 and subsequent invitations were made in 2016, 2017, 2018, 2019 and 2021. US employees of the Group are eligible to participate in this Plan. Options are granted to participants who have contracted to save up to the local currency equivalent of £250 per month over a period of two years at a discount of up to 15% to the average closing mid-market price of a DS Smith Plc ordinary share on the day before grant. Options cannot normally be exercised until a minimum of two years has elapsed.
Further details of the awards described in (i), (ii), and (iv) are set out in the Remuneration Committee report. Options outstanding and exercisable under share arrangements at 30 April 2021 were:
Options outstanding Options exercisable
Number
of sharesOption price
range (p)
Weighted average
remainingcontract life
(years)
Weighted average exercise price (p)
Numberexercisable
Weightedaverageexerciseprice (p)
Performance Share Plan 8,826,470 Nil 1.7 Nil 610,320 NilDeferred Share Bonus Plan 4,662,568 Nil 0.8 Nil 302,930 NilSharesave Plan 10,266,779 269–412 0.8 306.9 877,890 411.6
The effect on earnings per share of potentially dilutive shares issuable under share-based payment arrangements is shown in note 8. Movements in the number of share options outstanding and their related weighted average exercise prices are as follows:
Performance
Share Plan Deferred Share
Bonus Plan Sharesave
plan Long-term
incentive plan
2021
Weighted average exercise price (p)
Options(‘000s)
Weighted average exercise price (p)
Options(‘000s)
Weighted average exercise price (p)
Options (‘000s)
Weighted average exercise price (p)
Options(£‘000s)
At 1 May 2020 Nil 7,634 Nil 1,790 313.8 10,593 Nil –Granted Nil 3,757 Nil 3,267 325.0 4,972 Nil –Exercised Nil (525) Nil (151) 370.5 (808) Nil –Lapsed Nil (2,040) Nil (243) 331.8 (4,490) Nil –At 30 April 2021 Nil 8,826 Nil 4,663 306.9 10,267 Nil –Exercisable at 30 April 2021 Nil 610 Nil 303 411.6 878 Nil –
Performance
Share Plan Deferred Share
Bonus plan Sharesave
plan Long-term
incentive plan
2020
Weighted average exercise price (p)
Options(‘000s)
Weighted average exercise price (p)
Options(‘000s)
Weighted average exercise price (p)
Options (‘000s)
Weighted average exercise price (p)
Options(£‘000s)
At 1 May 2019 Nil 6,456 Nil 1,286 314.3 12,841 Nil 1,554Granted Nil 3,269 Nil 785 348.6 1 Nil –Exercised Nil (790) Nil (251) 303.7 (866) Nil (952)Lapsed Nil (1,301) Nil (30) 325.3 (1,383) Nil (602)At 30 April 2020 Nil 7,634 Nil 1,790 313.8 10,593 Nil –Exercisable at 30 April 2020 Nil 430 Nil 297 333.0 3,905 Nil –
Annual Report 2021 dssmith.com 169
26. Share-based payment expense continued The average share price of the Company during the financial year was 337.7 pence (2019/20: 344.5 pence). The fair value of awards granted in the period relates to the PSP and DSBP schemes. The fair value of the PSP award granted during the year, determined using the stochastic (Monte Carlo) valuation model, was £8.3m. The significant inputs into the model were: a share price of 273.0p for the PSP at the grant date; the exercise prices shown above; an expected volatility of the share price of 32.6%; the scheme life disclosed above; a risk-free interest rate of -0.10% and an expected dividend yield of nil. The volatility of share price returns is calculated over the period of time commensurate with the remainder of the performance period immediately prior to the date of grant. The total charge for the year relating to share-based payments recognised as personnel expenses was £9m (2019/20: £5m).
27. Cash generated from operations
Continuing operations 2021
£m2020
£m
Profit for the year 182 290 Adjustments for:
Pre-tax integration costs and other adjusting items 44 58 Amortisation of intangible assets; acquisitions and divestments 147 147 Cash outflow for adjusting items (48) (53)Depreciation 304 296 Loss/(profit) on sale of non-current assets 2 (2)Share of profit of equity accounted investments, net of tax (5) (7)Employment benefit net finance expense 3 3 Share-based payment expense 9 5 Finance income (1) (4)Finance costs 83 95 Other non-cash items (6) –Income tax expense 49 78 Change in provisions (9) (21)Change in employee benefits (32) (19)
Cash generation before working capital movement 722 866 Changes in:
Inventories (28) 45 Trade and other receivables (75) 86 Trade and other payables 276 (161)
Working capital movement 173 (30)Cash generated from continuing operations 895 836

FINANCIAL STATEMENTS
170
Notes to the consolidated financial statements (continued)
170
28. Reconciliation of net cash flow to movement in net debt
2021
£m2020
£m
Profit for the year 182 290 Income tax expense 49 78 Share of profit of equity accounted investments, net of tax (5) (7)Net financing costs 85 94 Amortisation of intangible assets; acquisitions and divestments 147 147 Pre-tax integration costs and other adjusting items 44 58 Adjusted operating profit 502 660 Depreciation 304 296 Adjusted EBITDA 806 956 Working capital movement 173 (30)Change in provisions (9) (21)Change in employee benefits (32) (19)Other 5 3 Cash generated from operations before adjusting cash items 943 889 Capital expenditure (331) (376)Proceeds from sale of property, plant and equipment and other investments 8 12 Tax paid (66) (94)Net interest paid (68) (77)Free cash flow 486 354 Cash outflow for adjusting items (48) (53)Dividends paid – (222)Acquisition of subsidiary businesses, net of cash and cash equivalents (90) (4)Divestment of discontinued operation, net of cash and cash equivalents – 422 Divestment of subsidiary businesses, net of cash and cash equivalents 16 62 Other 2 2 Net cash flow 366 561 Proceeds from issue of share capital 3 2 Borrowings and lease liabilities divested 3 2 Net movement on debt 372 565 Foreign exchange, fair value and other non-cash movements (note 18) (56) (118)Net debt movement – continuing operations 316 447 Net debt movement – discontinued operation (note 30(b)) (10) (29)Opening net debt (2,101) (2,277)Transition to IFRS 16 – (242)Closing net debt – reported basis (1,795) (2,101)
Adjusted operating profit, adjusted EBITDA, free cash flow, and net debt are non-GAAP measures not defined by IFRS. Further detail on the use of non-GAAP measures is included in note 32.
29. Capital commitments and contingencies At 30 April 2021, the Group had committed to incur capital expenditure of £61m (30 April 2020: £67m). The Group is not subject to material litigation, but has a number of contingent liabilities that arise in the ordinary course of business on behalf of trading subsidiaries including, inter alia, intellectual property disputes and regulatory enquiries in areas such as health and safety, environmental, and anti-trust. No losses are anticipated to arise on these contingent liabilities.
FINANCIAL STATEMENTS
Annual Report 2021 dssmith.com 171
Notes to the consolidated financial statements (continued)
170
28. Reconciliation of net cash flow to movement in net debt
2021
£m2020
£m
Profit for the year 182 290 Income tax expense 49 78 Share of profit of equity accounted investments, net of tax (5) (7)Net financing costs 85 94 Amortisation of intangible assets; acquisitions and divestments 147 147 Pre-tax integration costs and other adjusting items 44 58 Adjusted operating profit 502 660 Depreciation 304 296 Adjusted EBITDA 806 956 Working capital movement 173 (30)Change in provisions (9) (21)Change in employee benefits (32) (19)Other 5 3 Cash generated from operations before adjusting cash items 943 889 Capital expenditure (331) (376)Proceeds from sale of property, plant and equipment and other investments 8 12 Tax paid (66) (94)Net interest paid (68) (77)Free cash flow 486 354 Cash outflow for adjusting items (48) (53)Dividends paid – (222)Acquisition of subsidiary businesses, net of cash and cash equivalents (90) (4)Divestment of discontinued operation, net of cash and cash equivalents – 422 Divestment of subsidiary businesses, net of cash and cash equivalents 16 62 Other 2 2 Net cash flow 366 561 Proceeds from issue of share capital 3 2 Borrowings and lease liabilities divested 3 2 Net movement on debt 372 565 Foreign exchange, fair value and other non-cash movements (note 18) (56) (118)Net debt movement – continuing operations 316 447 Net debt movement – discontinued operation (note 30(b)) (10) (29)Opening net debt (2,101) (2,277)Transition to IFRS 16 – (242)Closing net debt – reported basis (1,795) (2,101)
Adjusted operating profit, adjusted EBITDA, free cash flow, and net debt are non-GAAP measures not defined by IFRS. Further detail on the use of non-GAAP measures is included in note 32.
29. Capital commitments and contingencies At 30 April 2021, the Group had committed to incur capital expenditure of £61m (30 April 2020: £67m). The Group is not subject to material litigation, but has a number of contingent liabilities that arise in the ordinary course of business on behalf of trading subsidiaries including, inter alia, intellectual property disputes and regulatory enquiries in areas such as health and safety, environmental, and anti-trust. No losses are anticipated to arise on these contingent liabilities.
Annual Report 2021 dssmith.com 171
30. Acquisitions and divestments (a) 2020/21 On 26 June 2020, the purchase of a further 10% stake in Interstate Resources was completed after the exercise of a portion of the put option held by the sellers. Of the £106m consideration, £82m was paid in cash, with, by agreement, the remainder deferred to October 2021. The final 10% stake remains subject to the put option. As a substantial shareholder of the Group, the seller met the definition of a related party (note 17). In total, during the year ended 30 April 2021, cash consideration for acquisition of subsidiary businesses, net of cash and cash equivalents, was £90m, and borrowings acquired, including deposits, were £nil. Apart from the acquisition of the 10% stake in Interstate Resources, the remaining acquisitions are not material to the Group individually or in aggregate. On 11 December 2020, the Group sold the New England sheets business in North America. Cash consideration, net of cash and cash equivalents, was £16m, and leases divested were £3m. A deferred tax asset of £9m arose in respect of tax losses on the disposal of the Plastics business and has been recognised in discontinued operations.
(b) Plastics division On 27 February 2020, the sale of the Group’s Plastics division to Olympus Partners and its affiliate Liqui-Box Holdings was completed. Plastics principally comprised flexible packaging and dispensing solutions, extruded and injection moulded products and foam products. The Plastics segment has been classified as a discontinued operation as disclosed in note 1(a)(ii). The consolidated income statement presents the Plastics segment as a discontinued operation with a single line amount of profit from discontinued operation, net of tax. The consolidated statement of cash flows presents a single amount of net cash flow from discontinued operations.
Consolidated income statement – discontinued operations
Year ended 30 April 2021
£m
Year ended 30 April 2020
£m
Revenue – 281Operating costs – (259)Operating profit before amortisation and adjusting items – 22Amortisation of intangible assets – (2)Profit on disposal before tax 3 232Other pre-tax adjusting items – (3)Net finance cost – (1)Profit before income tax 3 248Income tax credit/(expense) 9 (11)Profit for the year from discontinued operations 12 237
A deferred tax asset of £9m in respect of tax losses arising on the disposal of the Plastics business and £9m has been recognised in discontinued operations. The income tax credit/(expense) is net of a tax credit on adjusting items of £nil (30 April 2020: £2m) arising on the sale of the discontinued operation.
Basic earnings per share from discontinued operations 2021 2020
Profit from discontinued operations attributable to ordinary shareholders £12m £237mWeighted average number of ordinary shares 1,371m 1,371mBasic earnings per share 0.9p 17.3p
Diluted earnings per share from discontinued operations 2021 2020
Profit from discontinued operations attributable to ordinary shareholders £12m £237mWeighted average number of ordinary shares 1,371m 1,371mPotentially dilutive shares issuable under share-based payment arrangement 6m 7mWeighted average number of ordinary shares (diluted) 1,377m 1,378mDiluted earnings per share 0.9p 17.2p
The number of shares excludes the weighted average number of the Company’s own shares held as treasury shares during the year of 1m (2019/20: 1m).

FINANCIAL STATEMENTS
172
Notes to the consolidated financial statements (continued)
172
30. Acquisitions and divestments continued (b) Plastics division (continued) Adjusted earnings per share from discontinued operations Further detail about the use of non-GAAP performance measures is given in note 32. A reconciliation of basic to adjusted earnings per share from discontinued operations is as follows:
2021 2020
£m
Basic –pence
per share
Diluted –pence
per share £m
Basic –pence
per share
Diluted –pence
per share
Basic earnings from discontinued operations 12 0.9p 0.9p 237 17.3p 17.2pAdd back:
Amortisation of intangible assets, before tax of £nil – – – 2 0.1p 0.1pAdjusting items, before tax (3) (0.2p) (0.2p) (229) (16.6p) (16.6p)Tax on adjusting items and adjusting tax items (9) (0.7p) (0.7p) 2 0.1p 0.1p
Adjusted earnings from discontinued operations – – – 12 0.9p 0.8p
Cash flows used in discontinued operations
Year ended 30 April 2021
£m
Year ended 30 April 2020
£m
Net cash used in operating activities – (18)Net cash used in investing activities (10) (11)Net cash flows for the year (10) (29)
Effect of disposal on the financial position of the Group 2020
£m
Intangible assets 68Property, plant and equipment 74Right-of-use assets 18Deferred tax assets 4Inventories 33Income tax receivable 2Trade and other receivables 91Cash and cash equivalents 6Employee benefits (2)Trade and other payables (81)Lease liabilities (18)Deferred tax liabilities (5)Income tax liabilities (15)Net assets disposed 175Consideration received, satisfied in cash 436Reclassification from translation reserve to income statement arising on divestment 30Transaction and separation costs (59)Profit on disposal before tax 232Tax charge on profit on disposal (2)Profit on disposal after tax 230
Cash inflow on disposal 2020
£m
Consideration received, satisfied in cash 436Cash and cash equivalents divested (6)Transaction costs paid (8)Net cash inflow 422
FINANCIAL STATEMENTS
Annual Report 2021 dssmith.com 173
Notes to the consolidated financial statements (continued)
172
30. Acquisitions and divestments continued (b) Plastics division (continued) Adjusted earnings per share from discontinued operations Further detail about the use of non-GAAP performance measures is given in note 32. A reconciliation of basic to adjusted earnings per share from discontinued operations is as follows:
2021 2020
£m
Basic –pence
per share
Diluted –pence
per share £m
Basic –pence
per share
Diluted –pence
per share
Basic earnings from discontinued operations 12 0.9p 0.9p 237 17.3p 17.2pAdd back:
Amortisation of intangible assets, before tax of £nil – – – 2 0.1p 0.1pAdjusting items, before tax (3) (0.2p) (0.2p) (229) (16.6p) (16.6p)Tax on adjusting items and adjusting tax items (9) (0.7p) (0.7p) 2 0.1p 0.1p
Adjusted earnings from discontinued operations – – – 12 0.9p 0.8p
Cash flows used in discontinued operations
Year ended 30 April 2021
£m
Year ended 30 April 2020
£m
Net cash used in operating activities – (18)Net cash used in investing activities (10) (11)Net cash flows for the year (10) (29)
Effect of disposal on the financial position of the Group 2020
£m
Intangible assets 68Property, plant and equipment 74Right-of-use assets 18Deferred tax assets 4Inventories 33Income tax receivable 2Trade and other receivables 91Cash and cash equivalents 6Employee benefits (2)Trade and other payables (81)Lease liabilities (18)Deferred tax liabilities (5)Income tax liabilities (15)Net assets disposed 175Consideration received, satisfied in cash 436Reclassification from translation reserve to income statement arising on divestment 30Transaction and separation costs (59)Profit on disposal before tax 232Tax charge on profit on disposal (2)Profit on disposal after tax 230
Cash inflow on disposal 2020
£m
Consideration received, satisfied in cash 436Cash and cash equivalents divested (6)Transaction costs paid (8)Net cash inflow 422
Annual Report 2021 dssmith.com 173
30. Acquisitions and divestments continued (c) Other 2019/20 acquisitions and divestments In the year ended 30 April 2020, half of the put option was exercised by the sellers of Interstate Resources, for a further 10% stake in Interstate Resources for £106m. In June 2019, the Group completed the remedy disposals required as part of the acquisition of Europac for €73m. Cash consideration received, net of transaction costs, was £62m, and including net debt disposed of, the total impact on net debt from disposals was £64m. Acquisition of subsidiary businesses, net of cash and cash equivalents of £4m in the statement of cash flows relates to completion accounts adjustments on prior year acquisitions. Neither the disposals or the acquisition adjustments were material to the Group individually or in aggregate.
(c) Acquisition related costs The Group incurred acquisition related costs of £2m (2019/20: £10m), primarily related to professional advisory, legal and consultancy fees and contractual deferred consideration payments on prior year acquisitions.
31. Related parties Identity of related parties In the normal course of business, the Group undertakes a wide variety of transactions between its subsidiaries and equity accounted investments. The key management personnel of the Company comprise the Chairman, Executive Directors and non-Executive Directors. The compensation of key management personnel can be found in the single total figure remuneration table in the Remuneration Committee report. Certain key management personnel also participate in the Group’s share-based incentive programme (note 26). Included within the share-based payment expense, and detailed in the Remuneration Committee report, is a charge of £1m (2019/20: £1m) relating to key management personnel. Transactions with pension trustees are disclosed in note 25.
Other related party transactions
2021
£m2020
£m
Sales to equity accounted investees 16 6Sales to other investees 6 4Purchases from equity accounted investees 18 4Purchases from other investees 5 8
32. Non-GAAP performance measures The Group presents reported and adjusted financial information in order to provide shareholders with additional information to further understand the Group’s operational performance and financial position. The principal adjustments to financial information are made to exclude the effects of adjusting items (refer to note 4) and amortisation. Total reported financial information represents the Group’s overall performance and financial position, but can contain significant unusual or non-operational items that may obscure understanding of the key trends and position. These unusual or non-operational items include business disposals, restructuring and optimisation project costs, acquisition-related and integration costs, and impairments. Restructuring and optimisation items treated as adjusting items are major programmes usually spanning more than one year, with uneven impact on the profit and loss for those years affected. Other adjusting items, such as business disposals, impairments, integration and acquisition costs, are by nature either highly variable or can also have a similar distorting effect. Therefore, the Directors consider that presenting non-GAAP measures which exclude adjusting items enables comparability of the recurring core business, complementing the IFRS measures presented. Amortisation relates primarily to customer contracts and relationships and infrastructure optimisation projects arising from or as a result of business combinations. Significant costs are incurred in maintaining, developing and increasing the value of such intangibles, costs which are charged in determining adjusted profit. Exclusion of amortisation remedies this double count as well as, in the case of customer contracts and relationships, providing comparability over the accounting treatment of customer contracts and relationships arising from the acquisition of businesses and those generated internally. The Group’s key non-GAAP measures are used both internally and externally to evaluate business performance against the Group’s KPIs and banking and debt covenants, as a key constituent of the Group’s planning process, as well as comprising targets against which compensation is determined. Certain non-GAAP performance measures can be, and are, reconciled to information presented in the financial statements. Other financial key performance measures are calculated using information which is not presented in the financial statements and is based on, for example, average 12-month balances or average exchange rates.
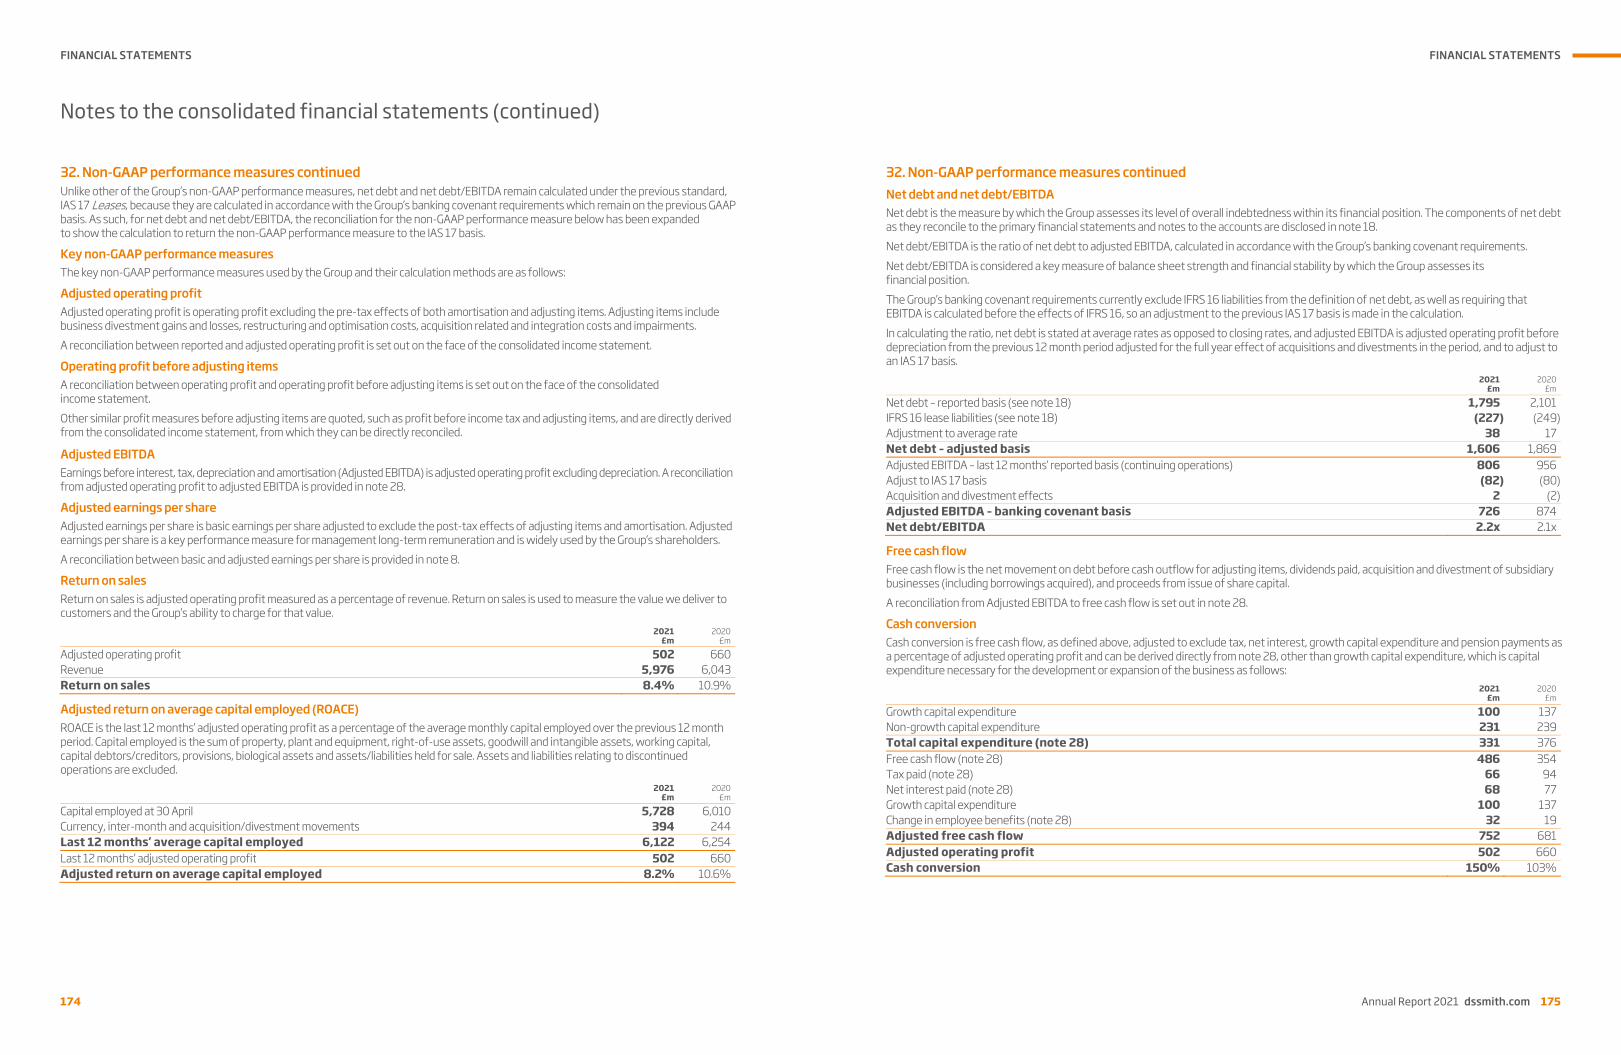
FINANCIAL STATEMENTS
174
Notes to the consolidated financial statements (continued)
174
32. Non-GAAP performance measures continued Unlike other of the Group’s non-GAAP performance measures, net debt and net debt/EBITDA remain calculated under the previous standard, IAS 17 Leases, because they are calculated in accordance with the Group’s banking covenant requirements which remain on the previous GAAP basis. As such, for net debt and net debt/EBITDA, the reconciliation for the non-GAAP performance measure below has been expanded to show the calculation to return the non-GAAP performance measure to the IAS 17 basis.
Key non-GAAP performance measures The key non-GAAP performance measures used by the Group and their calculation methods are as follows:
Adjusted operating profit Adjusted operating profit is operating profit excluding the pre-tax effects of both amortisation and adjusting items. Adjusting items include business divestment gains and losses, restructuring and optimisation costs, acquisition related and integration costs and impairments. A reconciliation between reported and adjusted operating profit is set out on the face of the consolidated income statement.
Operating profit before adjusting items A reconciliation between operating profit and operating profit before adjusting items is set out on the face of the consolidated income statement. Other similar profit measures before adjusting items are quoted, such as profit before income tax and adjusting items, and are directly derived from the consolidated income statement, from which they can be directly reconciled.
Adjusted EBITDA Earnings before interest, tax, depreciation and amortisation (Adjusted EBITDA) is adjusted operating profit excluding depreciation. A reconciliation from adjusted operating profit to adjusted EBITDA is provided in note 28.
Adjusted earnings per share Adjusted earnings per share is basic earnings per share adjusted to exclude the post-tax effects of adjusting items and amortisation. Adjusted earnings per share is a key performance measure for management long-term remuneration and is widely used by the Group’s shareholders. A reconciliation between basic and adjusted earnings per share is provided in note 8.
Return on sales Return on sales is adjusted operating profit measured as a percentage of revenue. Return on sales is used to measure the value we deliver to customers and the Group’s ability to charge for that value.
2021
£m2020
£m
Adjusted operating profit 502 660Revenue 5,976 6,043Return on sales 8.4% 10.9%
Adjusted return on average capital employed (ROACE) ROACE is the last 12 months’ adjusted operating profit as a percentage of the average monthly capital employed over the previous 12 month period. Capital employed is the sum of property, plant and equipment, right-of-use assets, goodwill and intangible assets, working capital, capital debtors/creditors, provisions, biological assets and assets/liabilities held for sale. Assets and liabilities relating to discontinued operations are excluded.
2021
£m2020
£m
Capital employed at 30 April 5,728 6,010Currency, inter-month and acquisition/divestment movements 394 244Last 12 months’ average capital employed 6,122 6,254Last 12 months’ adjusted operating profit 502 660Adjusted return on average capital employed 8.2% 10.6%
FINANCIAL STATEMENTS
Annual Report 2021 dssmith.com 175
Notes to the consolidated financial statements (continued)
174
32. Non-GAAP performance measures continued Unlike other of the Group’s non-GAAP performance measures, net debt and net debt/EBITDA remain calculated under the previous standard, IAS 17 Leases, because they are calculated in accordance with the Group’s banking covenant requirements which remain on the previous GAAP basis. As such, for net debt and net debt/EBITDA, the reconciliation for the non-GAAP performance measure below has been expanded to show the calculation to return the non-GAAP performance measure to the IAS 17 basis.
Key non-GAAP performance measures The key non-GAAP performance measures used by the Group and their calculation methods are as follows:
Adjusted operating profit Adjusted operating profit is operating profit excluding the pre-tax effects of both amortisation and adjusting items. Adjusting items include business divestment gains and losses, restructuring and optimisation costs, acquisition related and integration costs and impairments. A reconciliation between reported and adjusted operating profit is set out on the face of the consolidated income statement.
Operating profit before adjusting items A reconciliation between operating profit and operating profit before adjusting items is set out on the face of the consolidated income statement. Other similar profit measures before adjusting items are quoted, such as profit before income tax and adjusting items, and are directly derived from the consolidated income statement, from which they can be directly reconciled.
Adjusted EBITDA Earnings before interest, tax, depreciation and amortisation (Adjusted EBITDA) is adjusted operating profit excluding depreciation. A reconciliation from adjusted operating profit to adjusted EBITDA is provided in note 28.
Adjusted earnings per share Adjusted earnings per share is basic earnings per share adjusted to exclude the post-tax effects of adjusting items and amortisation. Adjusted earnings per share is a key performance measure for management long-term remuneration and is widely used by the Group’s shareholders. A reconciliation between basic and adjusted earnings per share is provided in note 8.
Return on sales Return on sales is adjusted operating profit measured as a percentage of revenue. Return on sales is used to measure the value we deliver to customers and the Group’s ability to charge for that value.
2021
£m2020
£m
Adjusted operating profit 502 660Revenue 5,976 6,043Return on sales 8.4% 10.9%
Adjusted return on average capital employed (ROACE) ROACE is the last 12 months’ adjusted operating profit as a percentage of the average monthly capital employed over the previous 12 month period. Capital employed is the sum of property, plant and equipment, right-of-use assets, goodwill and intangible assets, working capital, capital debtors/creditors, provisions, biological assets and assets/liabilities held for sale. Assets and liabilities relating to discontinued operations are excluded.
2021
£m2020
£m
Capital employed at 30 April 5,728 6,010Currency, inter-month and acquisition/divestment movements 394 244Last 12 months’ average capital employed 6,122 6,254Last 12 months’ adjusted operating profit 502 660Adjusted return on average capital employed 8.2% 10.6%
Annual Report 2021 dssmith.com 175
32. Non-GAAP performance measures continued Net debt and net debt/EBITDA Net debt is the measure by which the Group assesses its level of overall indebtedness within its financial position. The components of net debt as they reconcile to the primary financial statements and notes to the accounts are disclosed in note 18. Net debt/EBITDA is the ratio of net debt to adjusted EBITDA, calculated in accordance with the Group’s banking covenant requirements. Net debt/EBITDA is considered a key measure of balance sheet strength and financial stability by which the Group assesses its financial position. The Group’s banking covenant requirements currently exclude IFRS 16 liabilities from the definition of net debt, as well as requiring that EBITDA is calculated before the effects of IFRS 16, so an adjustment to the previous IAS 17 basis is made in the calculation. In calculating the ratio, net debt is stated at average rates as opposed to closing rates, and adjusted EBITDA is adjusted operating profit before depreciation from the previous 12 month period adjusted for the full year effect of acquisitions and divestments in the period, and to adjust to an IAS 17 basis.
2021
£m2020
£m
Net debt – reported basis (see note 18) 1,795 2,101IFRS 16 lease liabilities (see note 18) (227) (249)Adjustment to average rate 38 17Net debt – adjusted basis 1,606 1,869Adjusted EBITDA – last 12 months’ reported basis (continuing operations) 806 956Adjust to IAS 17 basis (82) (80)Acquisition and divestment effects 2 (2)Adjusted EBITDA – banking covenant basis 726 874Net debt/EBITDA 2.2x 2.1x
Free cash flow Free cash flow is the net movement on debt before cash outflow for adjusting items, dividends paid, acquisition and divestment of subsidiary businesses (including borrowings acquired), and proceeds from issue of share capital. A reconciliation from Adjusted EBITDA to free cash flow is set out in note 28.
Cash conversion Cash conversion is free cash flow, as defined above, adjusted to exclude tax, net interest, growth capital expenditure and pension payments as a percentage of adjusted operating profit and can be derived directly from note 28, other than growth capital expenditure, which is capital expenditure necessary for the development or expansion of the business as follows:
2021
£m2020
£m
Growth capital expenditure 100 137Non-growth capital expenditure 231 239Total capital expenditure (note 28) 331 376Free cash flow (note 28) 486 354Tax paid (note 28) 66 94Net interest paid (note 28) 68 77Growth capital expenditure 100 137Change in employee benefits (note 28) 32 19Adjusted free cash flow 752 681Adjusted operating profit 502 660Cash conversion 150% 103%

FINANCIAL STATEMENTS
176
Notes to the consolidated financial statements (continued)
176
32. Non-GAAP performance measures continued Average working capital to sales Average working capital to sales measures the level of investment the Group makes in working capital to conduct its operations. It is measured by comparing the monthly working capital balances for the previous 12 months as a percentage of revenue over the same period. Working capital is the sum of inventories, trade and other receivables, and trade and other payables, excluding capital and acquisition and divestment related debtors and creditors.
2021
£m2020
£m
Inventories (note 15) 537 518Trade and other receivables 786 736Trade and other payables (1,669) (1,419)Inter-month movements and exclusion of capital and acquisition and divestment related items 236 195Last 12 months’ average working capital (110) 30Last 12 months’ revenue 5,976 6,043Average working capital to sales (1.8%) 0.5%
Constant currency and organic growth The Group presents commentary on both reported and constant currency revenue and adjusted operating profit comparatives in order to explain the impact of exchange rates on the Group’s key income statement items. Constant currency comparatives recalculate the prior year revenue and adjusted operating profit as if they had been generated using the current year exchange rates. In addition, the Group then separates the incremental effects of acquisitions and disposals made in the current year, and the incremental effects of acquisitions and disposals made in the previous year, to determine underlying organic growth. The table below shows the calculations:
Revenue
£m
Adjusted operating
profit£m
Reported basis – comparative year ended 30 April 2020 6,043 660Currency effects 20 4Constant currency basis – comparative year ended 30 April 2020 6,063 664Prior year acquisitions (13) (1) 6,050 663Synergies – 21Organic growth (74) (182)Reported basis – year ended 30 April 2021 5,976 502
Dividend cover Dividend cover is adjusted earnings per share divided by the total dividend for the year.
2021 2020
Adjusted earnings per share 24.2p 33.2pTotal dividend 12.1p n/aDividend cover 2.0x n/a
FINANCIAL STATEMENTS
Annual Report 2021 dssmith.com 177
Notes to the consolidated financial statements (continued)
176
32. Non-GAAP performance measures continued Average working capital to sales Average working capital to sales measures the level of investment the Group makes in working capital to conduct its operations. It is measured by comparing the monthly working capital balances for the previous 12 months as a percentage of revenue over the same period. Working capital is the sum of inventories, trade and other receivables, and trade and other payables, excluding capital and acquisition and divestment related debtors and creditors.
2021
£m2020
£m
Inventories (note 15) 537 518Trade and other receivables 786 736Trade and other payables (1,669) (1,419)Inter-month movements and exclusion of capital and acquisition and divestment related items 236 195Last 12 months’ average working capital (110) 30Last 12 months’ revenue 5,976 6,043Average working capital to sales (1.8%) 0.5%
Constant currency and organic growth The Group presents commentary on both reported and constant currency revenue and adjusted operating profit comparatives in order to explain the impact of exchange rates on the Group’s key income statement items. Constant currency comparatives recalculate the prior year revenue and adjusted operating profit as if they had been generated using the current year exchange rates. In addition, the Group then separates the incremental effects of acquisitions and disposals made in the current year, and the incremental effects of acquisitions and disposals made in the previous year, to determine underlying organic growth. The table below shows the calculations:
Revenue
£m
Adjusted operating
profit£m
Reported basis – comparative year ended 30 April 2020 6,043 660Currency effects 20 4Constant currency basis – comparative year ended 30 April 2020 6,063 664Prior year acquisitions (13) (1) 6,050 663Synergies – 21Organic growth (74) (182)Reported basis – year ended 30 April 2021 5,976 502
Dividend cover Dividend cover is adjusted earnings per share divided by the total dividend for the year.
2021 2020
Adjusted earnings per share 24.2p 33.2pTotal dividend 12.1p n/aDividend cover 2.0x n/a
Annual Report 2021 dssmith.com 177
33. DS Smith Group companies The Group’s ultimate parent Company is DS Smith Plc. Group companies are grouped by the countries in which they are incorporated or registered. Unless otherwise noted, the undertakings below are wholly-owned and consolidated by DS Smith and the share capital held comprises ordinary or common shares which are held by Group subsidiaries. Principal companies are identified in orange. Fully owned subsidiaries Notes Argentina Total Marketing Support Argentina SA AR1 Australia Total Marketing Support Pacific Pty Ltd AU1 Austria DS Smith Austria Holdings GmbH AT1 DS Smith Packaging Austria Beteiligungsverwaltungs GmbH
AT1
DS Smith Packaging Austria GmbH AT2 DS Smith Packaging South East GmbH AT1 Belgium DS Smith Packaging Belgium N.V. BE1 DS Smith Packaging Marketing N.V. BE2 Bolivia Total MarketingSupport Bolivia S.A. BO1 Bosnia & Herzegovina DS Smith Packaging BH d.o.o. Sarajevo BA1 DS Smith Recycling Bosnia d.o.o. BA2 Brazil Total Marketing Support Brazil Ltda BR1 Bulgaria DS Smith Bulgaria S.A. BG1 Canada TMS Canada 360 Inc. CA1 Chile Total Marketing Support Chile SpA CL1 China DS Smith Shanghai Trading Ltd CN1 TMS Shanghai Trading Ltd CN2 Colombia Total Marketing Support Colombia S A S CO1 Croatia Bilokalnik-IPA d.d. h, HR1 DS Smith Belišće Croatia d.o.o. HR2 DS Smith Unijapapir Croatia d.o.o. HR3 Czech Republic DS Smith Packaging Czech Republic s.r.o.
CZ1
DS Smith Triss s.r.o. CZ2 Denmark DS Smith Packaging Denmark A/S DK1 Ecuador Total Marketing Support Ecuador TM-EC C.L. EC1 Egypt TMS Egypt LLC EG1 Estonia DS Smith Packaging Estonia AS EE1
NotesFinlandDS Smith Packaging Baltic Holding Oy FI1DS Smith Packaging Finland Oy FI1DS Smith Packaging Pakkausjaloste Oy FI2Eastpac Oy FI1FranceDS Smith France FR1DS Smith Hêtre Blanc FR2DS Smith Packaging Ales FR3DS Smith Packaging Anjou FR2DS Smith Packaging Atlantique FR2DS Smith Packaging Bretagne FR4DS Smith Packaging C.E.R.A. FR5DS Smith Packaging Consumer FR2DS Smith Packaging Contoire-Hamel FR6DS Smith Packaging Display and Services FR2DS Smith Packaging DPF FR7DS Smith Packaging Durtal FR8DS Smith Packaging Fegersheim FR9DS Smith Packaging France FR2DS Smith Packaging Kaypac FR10DS Smith Packaging Larousse FR11DS Smith Packaging Mehun-CIM FR12DS Smith Packaging Nord Est FR1DS Smith Packaging Premium FR13DS Smith Packaging Savoie FR14DS Smith Packaging Seine Normandie FR15DS Smith Packaging Sud Est FR16DS Smith Packaging Sud Ouest FR13DS Smith Packaging Systems FR17DS Smith Packaging Velin FR18DS Smith Packaging Vervins FR2DS Smith Paper Coullons FR19DS Smith Paper Kaysersberg FR20DS Smith Paper Rouen FR15DS Smith Recycling France FR21Rowlandson France FR1Tecnicartón France FR22GermanyBretschneider Verpackungen GmbH i, DE2Delta Packaging Services GmbH DE6DS Smith Hamburg Display GmbH DE8DS Smith Packaging Arenshausen Mivepa GmbH
DE3
DS Smith Packaging Arnstadt GmbH DE1DS Smith Packaging Beteiligungen GmbH DE9DS Smith Packaging Deutschland Stiftung DE5DS Smith Packaging Deutschland Stiftung & Co KG
DE9
DS Smith Paper Deutschland GmbH DE7
Notes
DS Smith Recycling Deutschland GmbH DE4DS Smith Stange B.V. & Co. KG DE9DS Smith Transport Services GmbH DE7Gibraltar DS Smith Finco (IRE) Limited GI1GreeceDS Smith Cretan Hellas S.A. GR1DS Smith Hellas S.A. GR2Guatemala TMS Global Guatemala, Sociedad Anonima GT1Honduras Total Marketing Support Honduras, S.A. HN1Hong Kong The Less Packaging Company (Asia) Limited HK1Hungary DS Smith Packaging Hungary Kft. HU2Merpas Hungary Kft. j, HU1IndiaDS Smith Products & Services India Private Limited
IN1
The Less Packaging Company (India) Private Limited
IN2
Total Marketing Support India Private Limited
IN3
Indonesia PT Total Marketing Support Indonesia ID1IrelandDavid S. Smith (Ireland) Unlimited Company IE1DS Smith Packaging Ireland Limited IE1ItalyDS Smith Holding Italia SpA IT3DS Smith Packaging Italia SpA IT3DS Smith Paper Italia Srl IT3DS Smith Recycling Italia Srl IT2Toscana Ondulati SpA IT1JapanTotal Marketing Support Japan Ltd JP1Kazakhstan Total Marketing Support Kazakhstan KZ1LatviaSIA DS Smith Packaging Latvia LV1Lithuania UAB DS Smith Packaging Lithuania LT1Luxembourg DS Smith (Luxembourg) S.à r.l. LU1DS Smith Perch Luxembourg S.à r.l. LU1DS Smith Re S.A. LU1Malaysia Total Marketing Support (360) Malaysia Sdn. Bhd.
MY1

FINANCIAL STATEMENTS
178
Notes to the consolidated financial statements (continued)
178
33. DS Smith Group companies continued Fully owned subsidiaries continued Notes Mexico Total Marketing Support 360 Mexico S.A de C.V MX1 Morocco Tecnicartón Tánger S.a.r.l. AU MA1 Netherlands David S. Smith (Netherlands) B.V. NL3 DS Smith (Holdings) B.V. NL3 DS Smith Baars B.V. DE9 DS Smith De Hoop B.V. NL3 DS Smith De Hoop Holding B.V. NL3 DS Smith Finance B.V. NL3 DS Smith Hellas Netherlands B.V. NL3 DS Smith Italy B.V. NL3 DS Smith Packaging Almelo B.V. NL1 DS Smith Packaging Barneveld B.V. NL4 DS Smith Packaging Belita B.V. NL3 DS Smith Packaging Holding B.V. NL3 DS Smith Packaging International B.V. NL3 DS Smith Packaging Netherlands B.V. NL2 DS Smith Packaging Tilburg B.V. NL6 DS Smith Recycling Benelux B.V. NL2 DS Smith Recycling Holding B.V. NL2 DS Smith Salm B.V. NL3 DS Smith Toppositie B.V. NL3 Nicaragua Total Marketing Support Nicaragua, Sociedad Anonima
NI1
Nigeria Total Marketing Support 360 Nigeria Limited NG1 North Macedonia DS Smith AD Skopje f, MK1 Pakistan TMS Pakistan (Private) Limited PK1 Philippines Total Marketing Support Philippines, Inc PH1 Poland DS Smith Packaging sp. z o.o. PL1 DS Smith Polska sp. z o.o. PL1 Portugal DS Smith Displays P&I, S.A. PT3 DS Smith Energia Viana, S.A. PT8 DS Smith Packaging Madeira, Lda PT6 DS Smith Packaging Portugal, S.A. PT4 DS Smith Paper Viana, S.A. PT8 DS Smith Portugal, SGPS, S.A. PT8 DS Smith Recycling Portugal, S.A. PT9 Lepe – Empresa Portuguesa de Embalagens, S.A.
PT2
Nova DS Smith Embalagem, S.A. PT7 Tecnicartón Portugal Unipessoal Lda PT1
NotesRomaniaDS Smith Packaging Ghimbav S.R.L. c, RO1DS Smith Packaging Romania S.R.L. RO3DS Smith Paper Zarnesti. S.R.L. b, RO2Russia Total Marketing Support Moscow RU1Serbia DS Smith Inos Papir Servis d.o.o. RS1DS Smith Packaging d.o.o. Kruševac RS2Papir Servis DP d.o.o. RS2SlovakiaDS Smith Packaging Slovakia s.r.o. SK1DS Smith Turpak Obaly a.s. d, SK2SloveniaDS Smith Slovenija d.o.o. SI1South AfricaTMS 360 SA (PTY) Ltd ZA1Spain Bertako S.L.U. ES9DS Smith Andorra S.A. ES3DS Smith Business Services S.L.U. ES3DS Smith Forestal Spain, S.L.U. ES4DS Smith Packaging Alcala S.L.U. ES6DS Smith Packaging Cartogal S.A. ES10DS Smith Packaging Dicesa S.A. g, ES5DS Smith Packaging Galicia S.A. ES11DS Smith Packaging Holding S.L.U. ES3DS Smith Packaging Lucena, S.L. ES7DS Smith Packaging Madrid S.L. ES3DS Smith Packaging Penedes S.A.U. ES5DS Smith Recycling Spain S.A. ES2DS Smith Spain, S.A. ES4DS Smith TCT S.A. ES3Tecnicartón, S.L. ES8SwedenDS Smith Packaging Sweden AB SE1DS Smith Packaging Sweden Holding AB SE1SwitzerlandDS Smith Packaging Switzerland AG CH1Turkey DS Smith Ambalaj A.Ş. TR1Total Marketing Support Turkey Baskı Yönetimi Hizmetleri A.Ş. TR2Ukraine Total Marketing Support Ukraine UA1United Arab EmiratesTotal Marketing Support Middle East DMCC AE1UK Abbey Corrugated Limited ERAshton Corrugated ERAshton Corrugated (Southern) Limited ERAvonbank Paper Disposal Limited ER
NotesBiber Paper Converting Limited ERCalara Holding Limited ERConew Limited ERCorrugated Products Limited ERDavid S. Smith Nominees Limited ERD.W. Plastics (UK) Limited ERDS Smith (UK) Limited ERDS Smith America (UK) LLP ERDS Smith Business Services Limited ERDS Smith Corrugated Packaging Limited
ER
DS Smith Display Holding Limited ERDS Smith Dormant Five Limited ERDS Smith Euro Finance Limited ERDS Smith Europe Limited ERDS Smith Finco Limited a, ERDS Smith Haddox Limited ERDS Smith Holdings Limited a, ERDS Smith International Limited ERDS Smith Italy Limited ERDS Smith Logistics Limited ERDS Smith Packaging Limited ERDS Smith Paper Limited ERDS Smith Pension Trustees Limited ERDS Smith Perch Limited ERDS Smith Recycling UK Limited ERDS Smith Roma Limited ERDS Smith Sudbrook Limited ERDS Smith Supplementary Life Cover Scheme Limited
ER
DS Smith Ukraine Limited ERDSS Eastern Europe Limited ERDSS Poznan Limited ERDSSH No. 1 Limited ERGrovehurst Energy Limited ERJDS Holding ERMiljoint Limited ERMultigraphics Holdings Limited ERMultigraphics Limited ERMultigraphics Services Limited ERPriory Packaging Limited ERReed & Smith Limited ERSt. Regis International Limited ERSt. Regis Kemsley Limited ERSt. Regis Paper Company Limited ERThe Brand Compliance Company Limited ERThe Less Packaging Company Limited ERTheBannerPeople.Com Limited ERTMS Global UK Limited ERTotal Marketing Support Global Limited ERTotal Marketing Support Limited ERTreforest Mill plc ERTRM Packaging Limited ERUnited Shopper Marketing Limited ER
FINANCIAL STATEMENTS
Annual Report 2021 dssmith.com 179
Notes to the consolidated financial statements (continued)
178
33. DS Smith Group companies continued Fully owned subsidiaries continued Notes Mexico Total Marketing Support 360 Mexico S.A de C.V MX1 Morocco Tecnicartón Tánger S.a.r.l. AU MA1 Netherlands David S. Smith (Netherlands) B.V. NL3 DS Smith (Holdings) B.V. NL3 DS Smith Baars B.V. DE9 DS Smith De Hoop B.V. NL3 DS Smith De Hoop Holding B.V. NL3 DS Smith Finance B.V. NL3 DS Smith Hellas Netherlands B.V. NL3 DS Smith Italy B.V. NL3 DS Smith Packaging Almelo B.V. NL1 DS Smith Packaging Barneveld B.V. NL4 DS Smith Packaging Belita B.V. NL3 DS Smith Packaging Holding B.V. NL3 DS Smith Packaging International B.V. NL3 DS Smith Packaging Netherlands B.V. NL2 DS Smith Packaging Tilburg B.V. NL6 DS Smith Recycling Benelux B.V. NL2 DS Smith Recycling Holding B.V. NL2 DS Smith Salm B.V. NL3 DS Smith Toppositie B.V. NL3 Nicaragua Total Marketing Support Nicaragua, Sociedad Anonima
NI1
Nigeria Total Marketing Support 360 Nigeria Limited NG1 North Macedonia DS Smith AD Skopje f, MK1 Pakistan TMS Pakistan (Private) Limited PK1 Philippines Total Marketing Support Philippines, Inc PH1 Poland DS Smith Packaging sp. z o.o. PL1 DS Smith Polska sp. z o.o. PL1 Portugal DS Smith Displays P&I, S.A. PT3 DS Smith Energia Viana, S.A. PT8 DS Smith Packaging Madeira, Lda PT6 DS Smith Packaging Portugal, S.A. PT4 DS Smith Paper Viana, S.A. PT8 DS Smith Portugal, SGPS, S.A. PT8 DS Smith Recycling Portugal, S.A. PT9 Lepe – Empresa Portuguesa de Embalagens, S.A.
PT2
Nova DS Smith Embalagem, S.A. PT7 Tecnicartón Portugal Unipessoal Lda PT1
NotesRomaniaDS Smith Packaging Ghimbav S.R.L. c, RO1DS Smith Packaging Romania S.R.L. RO3DS Smith Paper Zarnesti. S.R.L. b, RO2Russia Total Marketing Support Moscow RU1Serbia DS Smith Inos Papir Servis d.o.o. RS1DS Smith Packaging d.o.o. Kruševac RS2Papir Servis DP d.o.o. RS2SlovakiaDS Smith Packaging Slovakia s.r.o. SK1DS Smith Turpak Obaly a.s. d, SK2SloveniaDS Smith Slovenija d.o.o. SI1South AfricaTMS 360 SA (PTY) Ltd ZA1Spain Bertako S.L.U. ES9DS Smith Andorra S.A. ES3DS Smith Business Services S.L.U. ES3DS Smith Forestal Spain, S.L.U. ES4DS Smith Packaging Alcala S.L.U. ES6DS Smith Packaging Cartogal S.A. ES10DS Smith Packaging Dicesa S.A. g, ES5DS Smith Packaging Galicia S.A. ES11DS Smith Packaging Holding S.L.U. ES3DS Smith Packaging Lucena, S.L. ES7DS Smith Packaging Madrid S.L. ES3DS Smith Packaging Penedes S.A.U. ES5DS Smith Recycling Spain S.A. ES2DS Smith Spain, S.A. ES4DS Smith TCT S.A. ES3Tecnicartón, S.L. ES8SwedenDS Smith Packaging Sweden AB SE1DS Smith Packaging Sweden Holding AB SE1SwitzerlandDS Smith Packaging Switzerland AG CH1Turkey DS Smith Ambalaj A.Ş. TR1Total Marketing Support Turkey Baskı Yönetimi Hizmetleri A.Ş. TR2Ukraine Total Marketing Support Ukraine UA1United Arab EmiratesTotal Marketing Support Middle East DMCC AE1UK Abbey Corrugated Limited ERAshton Corrugated ERAshton Corrugated (Southern) Limited ERAvonbank Paper Disposal Limited ER
NotesBiber Paper Converting Limited ERCalara Holding Limited ERConew Limited ERCorrugated Products Limited ERDavid S. Smith Nominees Limited ERD.W. Plastics (UK) Limited ERDS Smith (UK) Limited ERDS Smith America (UK) LLP ERDS Smith Business Services Limited ERDS Smith Corrugated Packaging Limited
ER
DS Smith Display Holding Limited ERDS Smith Dormant Five Limited ERDS Smith Euro Finance Limited ERDS Smith Europe Limited ERDS Smith Finco Limited a, ERDS Smith Haddox Limited ERDS Smith Holdings Limited a, ERDS Smith International Limited ERDS Smith Italy Limited ERDS Smith Logistics Limited ERDS Smith Packaging Limited ERDS Smith Paper Limited ERDS Smith Pension Trustees Limited ERDS Smith Perch Limited ERDS Smith Recycling UK Limited ERDS Smith Roma Limited ERDS Smith Sudbrook Limited ERDS Smith Supplementary Life Cover Scheme Limited
ER
DS Smith Ukraine Limited ERDSS Eastern Europe Limited ERDSS Poznan Limited ERDSSH No. 1 Limited ERGrovehurst Energy Limited ERJDS Holding ERMiljoint Limited ERMultigraphics Holdings Limited ERMultigraphics Limited ERMultigraphics Services Limited ERPriory Packaging Limited ERReed & Smith Limited ERSt. Regis International Limited ERSt. Regis Kemsley Limited ERSt. Regis Paper Company Limited ERThe Brand Compliance Company Limited ERThe Less Packaging Company Limited ERTheBannerPeople.Com Limited ERTMS Global UK Limited ERTotal Marketing Support Global Limited ERTotal Marketing Support Limited ERTreforest Mill plc ERTRM Packaging Limited ERUnited Shopper Marketing Limited ER
Annual Report 2021 dssmith.com 179
33. DS Smith Group companies continuedFully owned subsidiaries continued Notes UK continued W. Rowlandson & Company Limited ER Waddington & Duval Limited ER USA Carolina Graphic Services LLC US1 Cedarpak LLC US3 CEMT Holdings Group LLC US4 Corrugated Container Corporation US13 Corrugated Container Corporation of Shenandoah Valley
US14
Corrugated Container Corporation of Tennessee
US15
Corrugated Supply, LLC US4 Corrugated Supply, L.P. US4 DS Smith Creative Solutions Inc. US16 DS Smith Holdings, Inc. US3 DS Smith Management Resources, Inc. e,US3 DS Smith North America Recycling, LLC US3 DS Smith North America Shared Services,LLC
US3
DS Smith Packaging-Holly Springs, LLC US18 DS Smith Packaging-Lebanon, LLC US17 DS Smith Packaging-Stream, LLC US3 Evergreen Community Power LLC US3 Interstate Container Columbia LLC US6 Interstate Container New Castle LLC US7 Interstate Container Reading LLC US8 Interstate Corrpack LLC US5 Interstate Holding, Inc. US3 Interstate Mechanical Packaging LLC US6 Interstate Paper LLC US9 Interstate Realty Hialeah LLC US3 Interstate Resources, Inc. US3 Interstate Southern Packaging LLC US10 Newport Timber LLC US9 Phoenix Technology Holdings USA, Inc. US3 RB Lumber Company LLC US9 RFC Container LLC US4 SouthCorr L.L.C. US11 St. George Timberland Holdings, Inc. US3 TMS America LLC US19 United Corrstack LLC US12 Uruguay Kozery S.A. UY1
Associate entities NotesNetherlandsIndustriewater Eerbeek B.V. m, NL5Stort Doonweg B.V. j, NL5PortugalCompanhia Termica Do Serrado A.c.e. o, PT5SerbiaPapir Pet d.o.o. j, RS3SpainCartonajes Cantabria, S.L. n, ES1Cartonajes Santander, S.L. n, ES1Euskocarton, S.L. n, ES1Industria Cartonera Asturiana, S.A. n, ES12UkrainePrivate Joint Stock Company “Rubizhanskiy Kartonno-Tarniy Kombinat”
k, UA2
USA Philcorr LLC l, US2PhilCorr Vineland LLC l, US2
Ownership interest at 30 April 2021a Directly held by DS Smith Plcb 99.927% ownership interest c 99.285% ownership interestd 98.89% ownership intereste 90% ownership interest f 81.39% ownership interestg 80% ownership interesth 69.788% ownership interest i 51% ownership interest j 50% ownership interest k 49.597% ownership interestl 40% ownership interestm 37.5% ownership interestn 39.58% ownership interesto 30% ownership interest
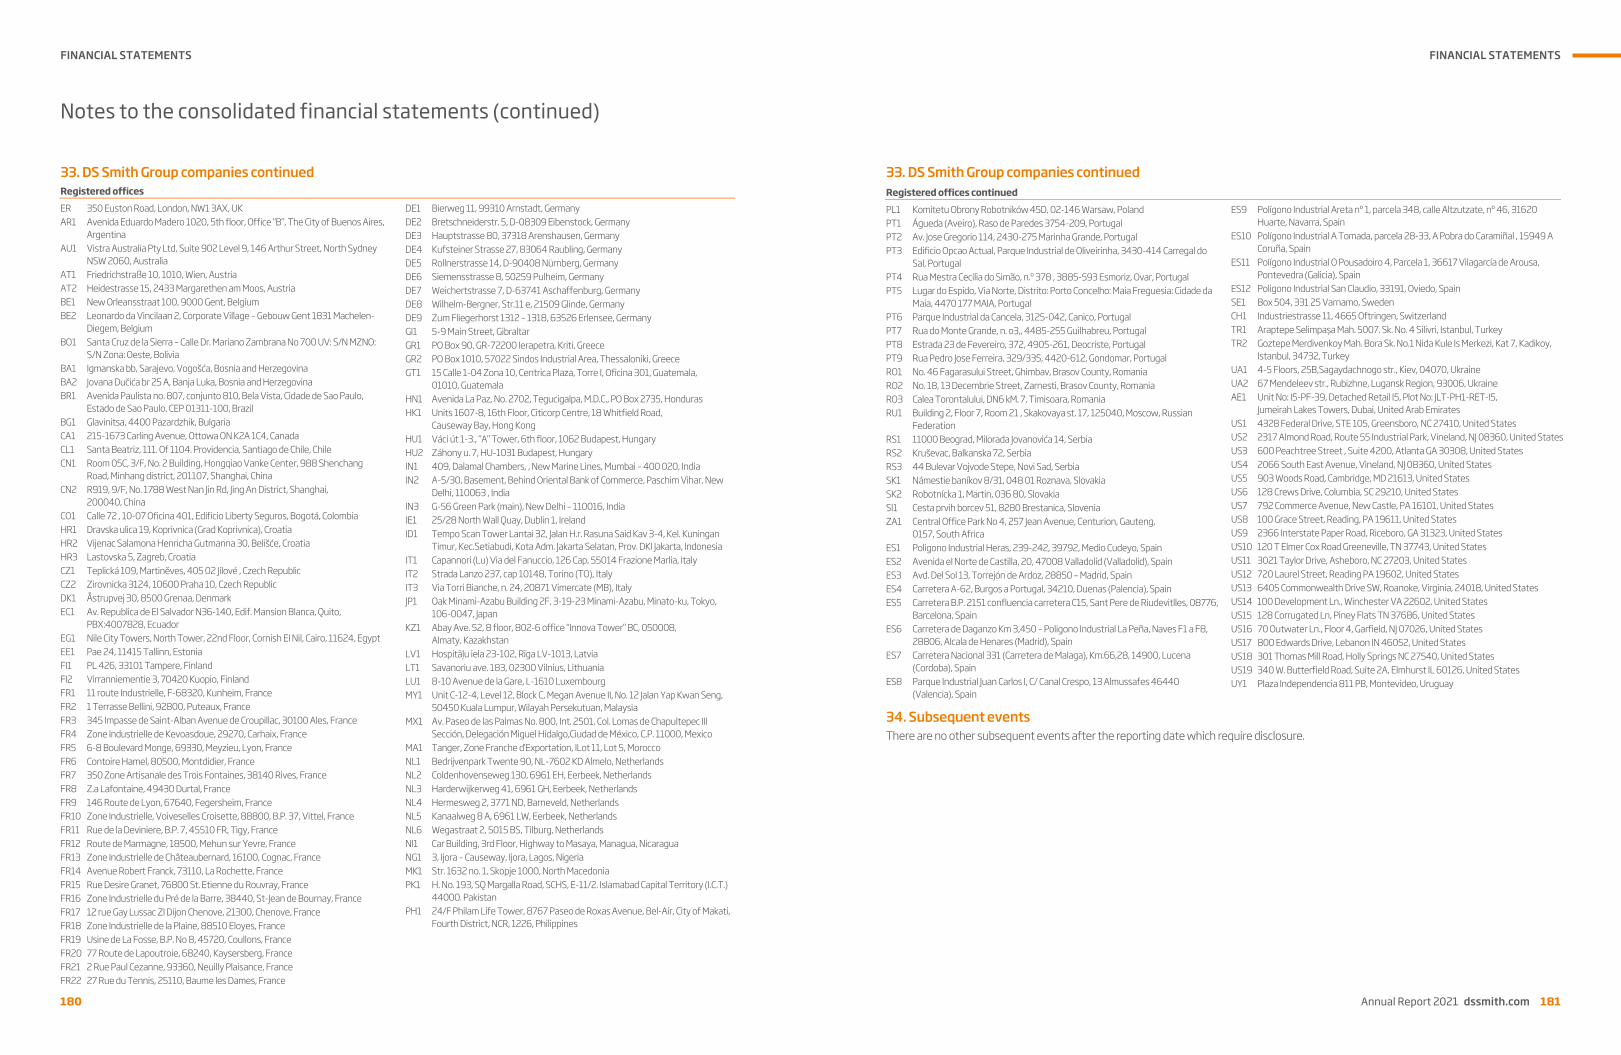
FINANCIAL STATEMENTS
180
Notes to the consolidated financial statements (continued)
180
33. DS Smith Group companies continued Registered offices
ER 350 Euston Road, London, NW1 3AX, UK AR1 Avenida Eduardo Madero 1020, 5th floor, Office “B”, The City of Buenos Aires,
Argentina AU1 Vistra Australia Pty Ltd, Suite 902 Level 9, 146 Arthur Street, North Sydney
NSW 2060, Australia AT1 Friedrichstraße 10, 1010, Wien, Austria AT2 Heidestrasse 15, 2433 Margarethen am Moos, Austria BE1 New Orleansstraat 100, 9000 Gent, Belgium BE2 Leonardo da Vincilaan 2, Corporate Village – Gebouw Gent 1831 Machelen-
Diegem, Belgium BO1 Santa Cruz de la Sierra – Calle Dr. Mariano Zambrana No 700 UV: S/N MZNO:
S/N Zona: Oeste, Bolivia BA1 Igmanska bb, Sarajevo, Vogošća, Bosnia and Herzegovina BA2 Jovana Dučića br 25 A, Banja Luka, Bosnia and Herzegovina BR1 Avenida Paulista no. 807, conjunto 810, Bela Vista, Cidade de Sao Paulo,
Estado de Sao Paulo, CEP 01311-100, Brazil BG1 Glavinitsa, 4400 Pazardzhik, Bulgaria CA1 215-1673 Carling Avenue, Ottowa ON K2A 1C4, Canada CL1 Santa Beatriz, 111. Of 1104. Providencia, Santiago de Chile, ChileCN1 Room 05C, 3/F, No. 2 Building, Hongqiao Vanke Center, 988 Shenchang
Road, Minhang district, 201107, Shanghai, China CN2 R919, 9/F, No. 1788 West Nan Jin Rd, Jing An District, Shanghai,
200040, China CO1 Calle 72 , 10-07 Oficina 401, Edificio Liberty Seguros, Bogotá, ColombiaHR1 Dravska ulica 19, Koprivnica (Grad Koprivnica), Croatia HR2 Vijenac Salamona Henricha Gutmanna 30, Belišće, Croatia HR3 Lastovska 5, Zagreb, Croatia CZ1 Teplická 109, Martiněves, 405 02 Jílové , Czech Republic CZ2 Zirovnicka 3124, 10600 Praha 10, Czech Republic DK1 Åstrupvej 30, 8500 Grenaa, Denmark EC1 Av. Republica de El Salvador N36-140, Edif. Mansion Blanca, Quito,
PBX:4007828, Ecuador EG1 Nile City Towers, North Tower, 22nd Floor, Cornish EI Nil, Cairo, 11624, EgyptEE1 Pae 24, 11415 Tallinn, Estonia FI1 PL 426, 33101 Tampere, Finland FI2 Virranniementie 3, 70420 Kuopio, Finland FR1 11 route Industrielle, F-68320, Kunheim, France FR2 1 Terrasse Bellini, 92800, Puteaux, France FR3 345 Impasse de Saint-Alban Avenue de Croupillac, 30100 Ales, France FR4 Zone Industrielle de Kevoasdoue, 29270, Carhaix, France FR5 6-8 Boulevard Monge, 69330, Meyzieu, Lyon, France FR6 Contoire Hamel, 80500, Montdidier, France FR7 350 Zone Artisanale des Trois Fontaines, 38140 Rives, France FR8 Z.a Lafontaine, 49430 Durtal, France FR9 146 Route de Lyon, 67640, Fegersheim, France FR10 Zone Industrielle, Voiveselles Croisette, 88800, B.P. 37, Vittel, FranceFR11 Rue de la Deviniere, B.P. 7, 45510 FR, Tigy, France FR12 Route de Marmagne, 18500, Mehun sur Yevre, France FR13 Zone Industrielle de Châteaubernard, 16100, Cognac, France FR14 Avenue Robert Franck, 73110, La Rochette, France FR15 Rue Desire Granet, 76800 St. Etienne du Rouvray, France FR16 Zone Industrielle du Pré de la Barre, 38440, St-Jean de Bournay, FranceFR17 12 rue Gay Lussac ZI Dijon Chenove, 21300, Chenove, France FR18 Zone Industrielle de la Plaine, 88510 Eloyes, France FR19 Usine de La Fosse, B.P. No 8, 45720, Coullons, France FR20 77 Route de Lapoutroie, 68240, Kaysersberg, France FR21 2 Rue Paul Cezanne, 93360, Neuilly Plaisance, France FR22 27 Rue du Tennis, 25110, Baume les Dames, France
DE1 Bierweg 11, 99310 Arnstadt, Germany DE2 Bretschneiderstr. 5, D-08309 Eibenstock, Germany DE3 Hauptstrasse 80, 37318 Arenshausen, Germany DE4 Kufsteiner Strasse 27, 83064 Raubling, Germany DE5 Rollnerstrasse 14, D-90408 Nürnberg, Germany DE6 Siemensstrasse 8, 50259 Pulheim, Germany DE7 Weichertstrasse 7, D-63741 Aschaffenburg, Germany DE8 Wilhelm-Bergner, Str.11 e, 21509 Glinde, Germany DE9 Zum Fliegerhorst 1312 – 1318, 63526 Erlensee, Germany GI1 5-9 Main Street, GibraltarGR1 PO Box 90, GR-72200 Ierapetra, Kriti, Greece GR2 PO Box 1010, 57022 Sindos Industrial Area, Thessaloniki, GreeceGT1 15 Calle 1-04 Zona 10, Centrica Plaza, Torre I, Oficina 301, Guatemala,
01010, Guatemala HN1 Avenida La Paz, No. 2702, Tegucigalpa, M.D.C., PO Box 2735, HondurasHK1 Units 1607-8, 16th Floor, Citicorp Centre, 18 Whitfield Road,
Causeway Bay, Hong Kong HU1 Váci út 1-3., “A” Tower, 6th floor, 1062 Budapest, HungaryHU2 Záhony u. 7, HU-1031 Budapest, Hungary IN1 409, Dalamal Chambers, , New Marine Lines, Mumbai – 400 020, IndiaIN2 A-5/30, Basement, Behind Oriental Bank of Commerce, Paschim Vihar, New
Delhi, 110063 , India IN3 G-56 Green Park (main), New Delhi – 110016, India IE1 25/28 North Wall Quay, Dublin 1, Ireland ID1 Tempo Scan Tower Lantai 32, Jalan H.r. Rasuna Said Kav 3-4, Kel. Kuningan
Timur, Kec.Setiabudi, Kota Adm. Jakarta Selatan, Prov. DKI Jakarta, Indonesia IT1 Capannori (Lu) Via del Fanuccio, 126 Cap, 55014 Frazione Marlia, ItalyIT2 Strada Lanzo 237, cap 10148, Torino (TO), Italy IT3 Via Torri Bianche, n. 24, 20871 Vimercate (MB), Italy JP1 Oak Minami-Azabu Building 2F, 3-19-23 Minami-Azabu, Minato-ku, Tokyo,
106-0047, Japan KZ1 Abay Ave. 52, 8 floor, 802-6 office “Innova Tower” BC, 050008,
Almaty, Kazakhstan LV1 Hospitāļu iela 23-102, Rīga LV-1013, Latvia LT1 Savanoriu ave. 183, 02300 Vilnius, Lithuania LU1 8-10 Avenue de la Gare, L-1610 Luxembourg MY1 Unit C-12-4, Level 12, Block C, Megan Avenue II, No. 12 Jalan Yap Kwan Seng,
50450 Kuala Lumpur, Wilayah Persekutuan, Malaysia MX1 Av. Paseo de las Palmas No. 800, Int. 2501, Col. Lomas de Chapultepec III
Sección, Delegación Miguel Hidalgo,Ciudad de México, C.P. 11000, Mexico MA1 Tanger, Zone Franche d’Exportation, ILot 11, Lot 5, MoroccoNL1 Bedrijvenpark Twente 90, NL-7602 KD Almelo, NetherlandsNL2 Coldenhovenseweg 130, 6961 EH, Eerbeek, Netherlands NL3 Harderwijkerweg 41, 6961 GH, Eerbeek, Netherlands NL4 Hermesweg 2, 3771 ND, Barneveld, Netherlands NL5 Kanaalweg 8 A, 6961 LW, Eerbeek, Netherlands NL6 Wegastraat 2, 5015 BS, Tilburg, Netherlands NI1 Car Building, 3rd Floor, Highway to Masaya, Managua, NicaraguaNG1 3, Ijora – Causeway, Ijora, Lagos, Nigeria MK1 Str. 1632 no. 1, Skopje 1000, North Macedonia PK1 H. No. 193, SQ Margalla Road, SCHS, E-11/2. Islamabad Capital Territory (I.C.T.)
44000. Pakistan PH1 24/F Philam Life Tower, 8767 Paseo de Roxas Avenue, Bel-Air, City of Makati,
Fourth District, NCR, 1226, Philippines
FINANCIAL STATEMENTS
Annual Report 2021 dssmith.com 181
Notes to the consolidated financial statements (continued)
180
33. DS Smith Group companies continued Registered offices
ER 350 Euston Road, London, NW1 3AX, UK AR1 Avenida Eduardo Madero 1020, 5th floor, Office “B”, The City of Buenos Aires,
Argentina AU1 Vistra Australia Pty Ltd, Suite 902 Level 9, 146 Arthur Street, North Sydney
NSW 2060, Australia AT1 Friedrichstraße 10, 1010, Wien, Austria AT2 Heidestrasse 15, 2433 Margarethen am Moos, Austria BE1 New Orleansstraat 100, 9000 Gent, Belgium BE2 Leonardo da Vincilaan 2, Corporate Village – Gebouw Gent 1831 Machelen-
Diegem, Belgium BO1 Santa Cruz de la Sierra – Calle Dr. Mariano Zambrana No 700 UV: S/N MZNO:
S/N Zona: Oeste, Bolivia BA1 Igmanska bb, Sarajevo, Vogošća, Bosnia and Herzegovina BA2 Jovana Dučića br 25 A, Banja Luka, Bosnia and Herzegovina BR1 Avenida Paulista no. 807, conjunto 810, Bela Vista, Cidade de Sao Paulo,
Estado de Sao Paulo, CEP 01311-100, Brazil BG1 Glavinitsa, 4400 Pazardzhik, Bulgaria CA1 215-1673 Carling Avenue, Ottowa ON K2A 1C4, Canada CL1 Santa Beatriz, 111. Of 1104. Providencia, Santiago de Chile, ChileCN1 Room 05C, 3/F, No. 2 Building, Hongqiao Vanke Center, 988 Shenchang
Road, Minhang district, 201107, Shanghai, China CN2 R919, 9/F, No. 1788 West Nan Jin Rd, Jing An District, Shanghai,
200040, China CO1 Calle 72 , 10-07 Oficina 401, Edificio Liberty Seguros, Bogotá, ColombiaHR1 Dravska ulica 19, Koprivnica (Grad Koprivnica), Croatia HR2 Vijenac Salamona Henricha Gutmanna 30, Belišće, Croatia HR3 Lastovska 5, Zagreb, Croatia CZ1 Teplická 109, Martiněves, 405 02 Jílové , Czech Republic CZ2 Zirovnicka 3124, 10600 Praha 10, Czech Republic DK1 Åstrupvej 30, 8500 Grenaa, Denmark EC1 Av. Republica de El Salvador N36-140, Edif. Mansion Blanca, Quito,
PBX:4007828, Ecuador EG1 Nile City Towers, North Tower, 22nd Floor, Cornish EI Nil, Cairo, 11624, EgyptEE1 Pae 24, 11415 Tallinn, Estonia FI1 PL 426, 33101 Tampere, Finland FI2 Virranniementie 3, 70420 Kuopio, Finland FR1 11 route Industrielle, F-68320, Kunheim, France FR2 1 Terrasse Bellini, 92800, Puteaux, France FR3 345 Impasse de Saint-Alban Avenue de Croupillac, 30100 Ales, France FR4 Zone Industrielle de Kevoasdoue, 29270, Carhaix, France FR5 6-8 Boulevard Monge, 69330, Meyzieu, Lyon, France FR6 Contoire Hamel, 80500, Montdidier, France FR7 350 Zone Artisanale des Trois Fontaines, 38140 Rives, France FR8 Z.a Lafontaine, 49430 Durtal, France FR9 146 Route de Lyon, 67640, Fegersheim, France FR10 Zone Industrielle, Voiveselles Croisette, 88800, B.P. 37, Vittel, FranceFR11 Rue de la Deviniere, B.P. 7, 45510 FR, Tigy, France FR12 Route de Marmagne, 18500, Mehun sur Yevre, France FR13 Zone Industrielle de Châteaubernard, 16100, Cognac, France FR14 Avenue Robert Franck, 73110, La Rochette, France FR15 Rue Desire Granet, 76800 St. Etienne du Rouvray, France FR16 Zone Industrielle du Pré de la Barre, 38440, St-Jean de Bournay, FranceFR17 12 rue Gay Lussac ZI Dijon Chenove, 21300, Chenove, France FR18 Zone Industrielle de la Plaine, 88510 Eloyes, France FR19 Usine de La Fosse, B.P. No 8, 45720, Coullons, France FR20 77 Route de Lapoutroie, 68240, Kaysersberg, France FR21 2 Rue Paul Cezanne, 93360, Neuilly Plaisance, France FR22 27 Rue du Tennis, 25110, Baume les Dames, France
DE1 Bierweg 11, 99310 Arnstadt, Germany DE2 Bretschneiderstr. 5, D-08309 Eibenstock, Germany DE3 Hauptstrasse 80, 37318 Arenshausen, Germany DE4 Kufsteiner Strasse 27, 83064 Raubling, Germany DE5 Rollnerstrasse 14, D-90408 Nürnberg, Germany DE6 Siemensstrasse 8, 50259 Pulheim, Germany DE7 Weichertstrasse 7, D-63741 Aschaffenburg, Germany DE8 Wilhelm-Bergner, Str.11 e, 21509 Glinde, Germany DE9 Zum Fliegerhorst 1312 – 1318, 63526 Erlensee, Germany GI1 5-9 Main Street, GibraltarGR1 PO Box 90, GR-72200 Ierapetra, Kriti, Greece GR2 PO Box 1010, 57022 Sindos Industrial Area, Thessaloniki, GreeceGT1 15 Calle 1-04 Zona 10, Centrica Plaza, Torre I, Oficina 301, Guatemala,
01010, Guatemala HN1 Avenida La Paz, No. 2702, Tegucigalpa, M.D.C., PO Box 2735, HondurasHK1 Units 1607-8, 16th Floor, Citicorp Centre, 18 Whitfield Road,
Causeway Bay, Hong Kong HU1 Váci út 1-3., “A” Tower, 6th floor, 1062 Budapest, HungaryHU2 Záhony u. 7, HU-1031 Budapest, Hungary IN1 409, Dalamal Chambers, , New Marine Lines, Mumbai – 400 020, IndiaIN2 A-5/30, Basement, Behind Oriental Bank of Commerce, Paschim Vihar, New
Delhi, 110063 , India IN3 G-56 Green Park (main), New Delhi – 110016, India IE1 25/28 North Wall Quay, Dublin 1, Ireland ID1 Tempo Scan Tower Lantai 32, Jalan H.r. Rasuna Said Kav 3-4, Kel. Kuningan
Timur, Kec.Setiabudi, Kota Adm. Jakarta Selatan, Prov. DKI Jakarta, Indonesia IT1 Capannori (Lu) Via del Fanuccio, 126 Cap, 55014 Frazione Marlia, ItalyIT2 Strada Lanzo 237, cap 10148, Torino (TO), Italy IT3 Via Torri Bianche, n. 24, 20871 Vimercate (MB), Italy JP1 Oak Minami-Azabu Building 2F, 3-19-23 Minami-Azabu, Minato-ku, Tokyo,
106-0047, Japan KZ1 Abay Ave. 52, 8 floor, 802-6 office “Innova Tower” BC, 050008,
Almaty, Kazakhstan LV1 Hospitāļu iela 23-102, Rīga LV-1013, Latvia LT1 Savanoriu ave. 183, 02300 Vilnius, Lithuania LU1 8-10 Avenue de la Gare, L-1610 Luxembourg MY1 Unit C-12-4, Level 12, Block C, Megan Avenue II, No. 12 Jalan Yap Kwan Seng,
50450 Kuala Lumpur, Wilayah Persekutuan, Malaysia MX1 Av. Paseo de las Palmas No. 800, Int. 2501, Col. Lomas de Chapultepec III
Sección, Delegación Miguel Hidalgo,Ciudad de México, C.P. 11000, Mexico MA1 Tanger, Zone Franche d’Exportation, ILot 11, Lot 5, MoroccoNL1 Bedrijvenpark Twente 90, NL-7602 KD Almelo, NetherlandsNL2 Coldenhovenseweg 130, 6961 EH, Eerbeek, Netherlands NL3 Harderwijkerweg 41, 6961 GH, Eerbeek, Netherlands NL4 Hermesweg 2, 3771 ND, Barneveld, Netherlands NL5 Kanaalweg 8 A, 6961 LW, Eerbeek, Netherlands NL6 Wegastraat 2, 5015 BS, Tilburg, Netherlands NI1 Car Building, 3rd Floor, Highway to Masaya, Managua, NicaraguaNG1 3, Ijora – Causeway, Ijora, Lagos, Nigeria MK1 Str. 1632 no. 1, Skopje 1000, North Macedonia PK1 H. No. 193, SQ Margalla Road, SCHS, E-11/2. Islamabad Capital Territory (I.C.T.)
44000. Pakistan PH1 24/F Philam Life Tower, 8767 Paseo de Roxas Avenue, Bel-Air, City of Makati,
Fourth District, NCR, 1226, Philippines
Annual Report 2021 dssmith.com 181
33. DS Smith Group companies continued
Registered offices continued
PL1 Komitetu Obrony Robotników 45D, 02-146 Warsaw, PolandPT1 Águeda (Aveiro), Raso de Paredes 3754-209, Portugal PT2 Av. Jose Gregorio 114, 2430-275 Marinha Grande, Portugal PT3 Edificio Opcao Actual, Parque Industrial de Oliveirinha, 3430-414 Carregal do
Sal, Portugal PT4 Rua Mestra Cecília do Simão, n.º 378 , 3885-593 Esmoriz, Ovar, PortugalPT5 Lugar do Espido, Via Norte, Distrito: Porto Concelho: Maia Freguesia: Cidade da
Maia, 4470 177 MAIA, Portugal PT6 Parque Industrial da Cancela, 3125-042, Canico, Portugal PT7 Rua do Monte Grande, n. o3,, 4485-255 Guilhabreu, PortugalPT8 Estrada 23 de Fevereiro, 372, 4905-261, Deocriste, PortugalPT9 Rua Pedro Jose Ferreira, 329/335, 4420-612, Gondomar, PortugalRO1 No. 46 Fagarasului Street, Ghimbav, Brasov County, RomaniaRO2 No. 18, 13 Decembrie Street, Zarnesti, Brasov County, RomaniaRO3 Calea Torontalului, DN6 kM. 7, Timisoara, Romania RU1 Building 2, Floor 7, Room 21 , Skakovaya st. 17, 125040, Moscow, Russian
Federation RS1 11000 Beograd, Milorada Jovanovića 14, Serbia RS2 Kruševac, Balkanska 72, Serbia RS3 44 Bulevar Vojvode Stepe, Novi Sad, Serbia SK1 Námestie baníkov 8/31, 048 01 Roznava, Slovakia SK2 Robotnícka 1, Martin, 036 80, Slovakia SI1 Cesta prvih borcev 51, 8280 Brestanica, Slovenia ZA1 Central Office Park No 4, 257 Jean Avenue, Centurion, Gauteng,
0157, South Africa ES1 Poligono Industrial Heras, 239-242, 39792, Medio Cudeyo, SpainES2 Avenida el Norte de Castilla, 20, 47008 Valladolid (Valladolid), SpainES3 Avd. Del Sol 13, Torrejón de Ardoz, 28850 – Madrid, Spain ES4 Carretera A-62, Burgos a Portugal, 34210, Duenas (Palencia), SpainES5 Carretera B.P. 2151 confluencia carretera C15, Sant Pere de Riudevitlles, 08776,
Barcelona, Spain ES6 Carretera de Daganzo Km 3,450 – Poligono Industrial La Peña, Naves F1 a F8,
28806, Alcala de Henares (Madrid), Spain ES7 Carretera Nacional 331 (Carretera de Malaga), Km.66,28, 14900, Lucena
(Cordoba), Spain ES8 Parque Industrial Juan Carlos I, C/ Canal Crespo, 13 Almussafes 46440
(Valencia), Spain
ES9 Polígono Industrial Areta nº 1, parcela 348, calle Altzutzate, nº 46, 31620 Huarte, Navarra, Spain
ES10 Polígono Industrial A Tomada, parcela 28-33, A Pobra do Caramiñal , 15949 A Coruña, Spain
ES11 Polígono Industrial O Pousadoiro 4, Parcela 1, 36617 Vilagarcía de Arousa, Pontevedra (Galicia), Spain
ES12 Poligono Industrial San Claudio, 33191, Oviedo, Spain SE1 Box 504, 331 25 Varnamo, Sweden CH1 Industriestrasse 11, 4665 Oftringen, Switzerland TR1 Araptepe Selimpaşa Mah. 5007. Sk. No. 4 Silivri, Istanbul, TurkeyTR2 Goztepe Merdivenkoy Mah. Bora Sk. No.1 Nida Kule Is Merkezi, Kat 7, Kadikoy,
Istanbul, 34732, Turkey UA1 4-5 Floors, 25B,Sagaydachnogo str., Kiev, 04070, UkraineUA2 67 Mendeleev str., Rubizhne, Lugansk Region, 93006, UkraineAE1 Unit No: I5-PF-39, Detached Retail I5, Plot No: JLT-PH1-RET-I5,
Jumeirah Lakes Towers, Dubai, United Arab Emirates US1 4328 Federal Drive, STE 105, Greensboro, NC 27410, United StatesUS2 2317 Almond Road, Route 55 Industrial Park, Vineland, NJ 08360, United StatesUS3 600 Peachtree Street , Suite 4200, Atlanta GA 30308, United StatesUS4 2066 South East Avenue, Vineland, NJ 08360, United StatesUS5 903 Woods Road, Cambridge, MD 21613, United StatesUS6 128 Crews Drive, Columbia, SC 29210, United States US7 792 Commerce Avenue, New Castle, PA 16101, United StatesUS8 100 Grace Street, Reading, PA 19611, United States US9 2366 Interstate Paper Road, Riceboro, GA 31323, United StatesUS10 120 T Elmer Cox Road Greeneville, TN 37743, United StatesUS11 3021 Taylor Drive, Asheboro, NC 27203, United StatesUS12 720 Laurel Street, Reading PA 19602, United States US13 6405 Commonwealth Drive SW, Roanoke, Virginia, 24018, United StatesUS14 100 Development Ln., Winchester VA 22602, United StatesUS15 128 Corrugated Ln, Piney Flats TN 37686, United StatesUS16 70 Outwater Ln., Floor 4, Garfield, NJ 07026, United StatesUS17 800 Edwards Drive, Lebanon IN 46052, United StatesUS18 301 Thomas Mill Road, Holly Springs NC 27540, United StatesUS19 340 W. Butterfield Road, Suite 2A, Elmhurst IL 60126, United StatesUY1 Plaza Independencia 811 PB, Montevideo, Uruguay
34. Subsequent events There are no other subsequent events after the reporting date which require disclosure.
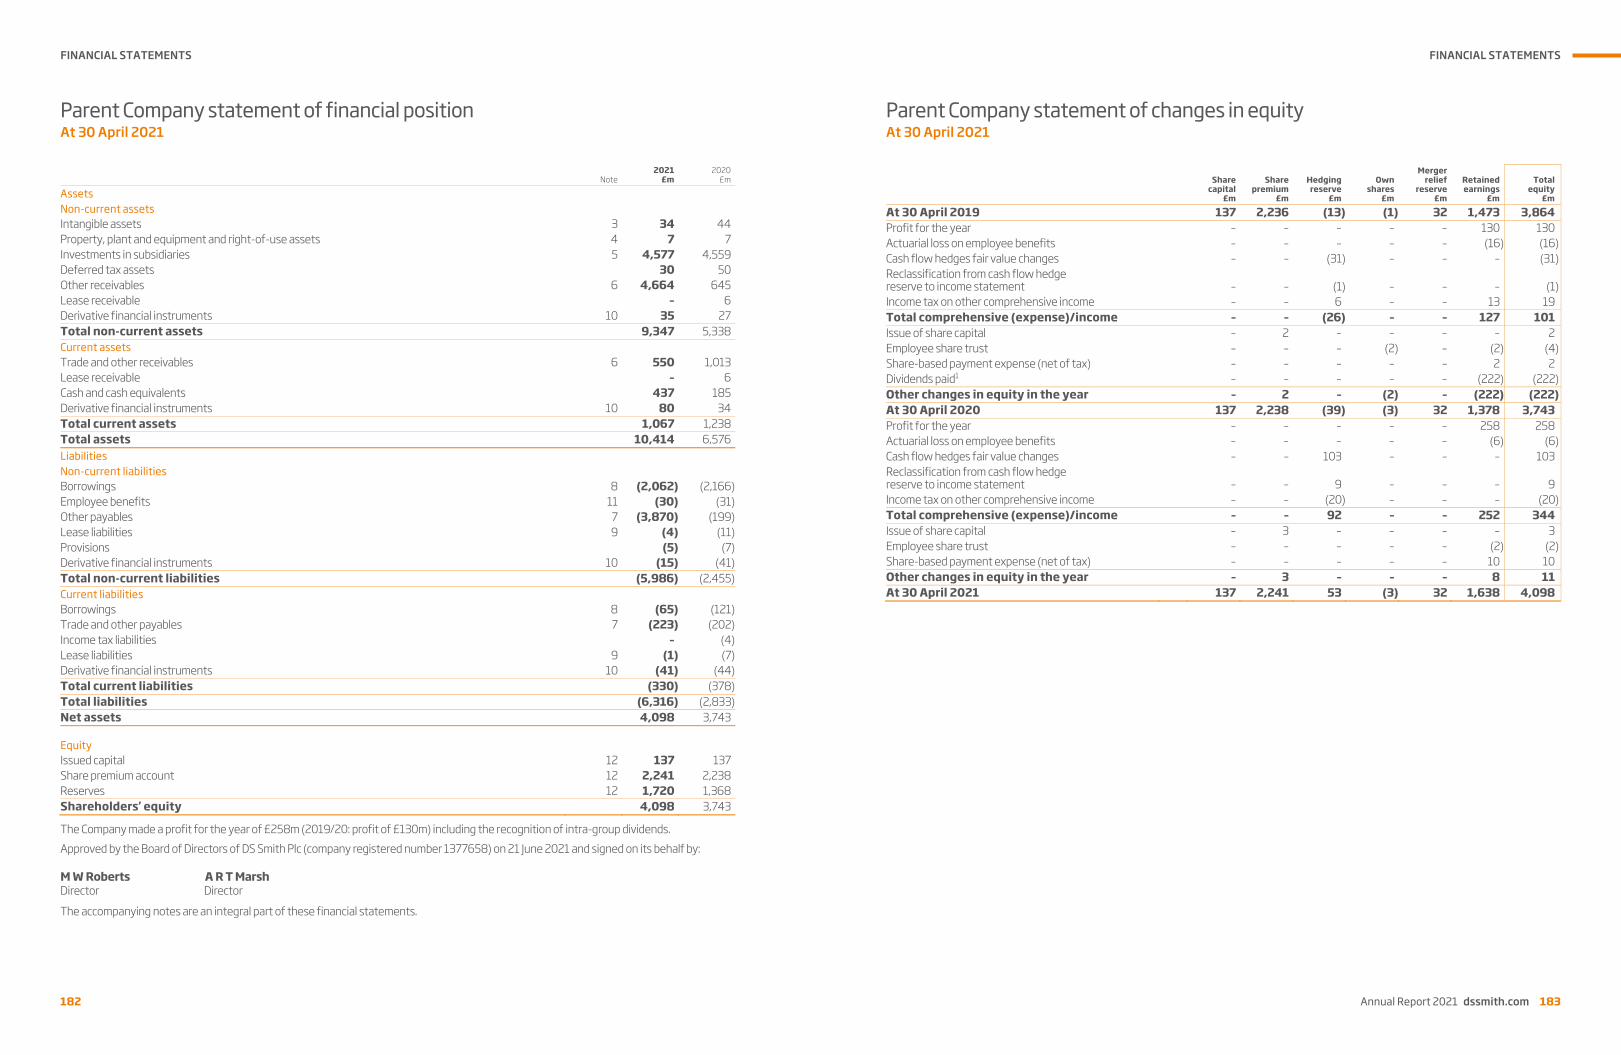
FINANCIAL STATEMENTS
182
Parent Company statement of financial position At 30 April 2021
182
Note 2021
£m2020
£m
Assets Non-current assets Intangible assets 3 34 44Property, plant and equipment and right-of-use assets 4 7 7Investments in subsidiaries 5 4,577 4,559Deferred tax assets 30 50Other receivables 6 4,664 645Lease receivable – 6Derivative financial instruments 10 35 27Total non-current assets 9,347 5,338Current assets Trade and other receivables 6 550 1,013Lease receivable – 6Cash and cash equivalents 437 185Derivative financial instruments 10 80 34Total current assets 1,067 1,238Total assets 10,414 6,576Liabilities Non-current liabilities Borrowings 8 (2,062) (2,166)Employee benefits 11 (30) (31)Other payables 7 (3,870) (199)Lease liabilities 9 (4) (11)Provisions (5) (7)Derivative financial instruments 10 (15) (41)Total non-current liabilities (5,986) (2,455)Current liabilities Borrowings 8 (65) (121)Trade and other payables 7 (223) (202)Income tax liabilities – (4)Lease liabilities 9 (1) (7)Derivative financial instruments 10 (41) (44)Total current liabilities (330) (378)Total liabilities (6,316) (2,833)Net assets 4,098 3,743 Equity Issued capital 12 137 137Share premium account 12 2,241 2,238Reserves 12 1,720 1,368Shareholders’ equity 4,098 3,743
The Company made a profit for the year of £258m (2019/20: profit of £130m) including the recognition of intra-group dividends. Approved by the Board of Directors of DS Smith Plc (company registered number 1377658) on 21 June 2021 and signed on its behalf by:
M W Roberts A R T Marsh Director Director
The accompanying notes are an integral part of these financial statements.
FINANCIAL STATEMENTS
Annual Report 2021 dssmith.com 183
Parent Company statement of financial position At 30 April 2021
182
Note 2021
£m2020
£m
Assets Non-current assets Intangible assets 3 34 44Property, plant and equipment and right-of-use assets 4 7 7Investments in subsidiaries 5 4,577 4,559Deferred tax assets 30 50Other receivables 6 4,664 645Lease receivable – 6Derivative financial instruments 10 35 27Total non-current assets 9,347 5,338Current assets Trade and other receivables 6 550 1,013Lease receivable – 6Cash and cash equivalents 437 185Derivative financial instruments 10 80 34Total current assets 1,067 1,238Total assets 10,414 6,576Liabilities Non-current liabilities Borrowings 8 (2,062) (2,166)Employee benefits 11 (30) (31)Other payables 7 (3,870) (199)Lease liabilities 9 (4) (11)Provisions (5) (7)Derivative financial instruments 10 (15) (41)Total non-current liabilities (5,986) (2,455)Current liabilities Borrowings 8 (65) (121)Trade and other payables 7 (223) (202)Income tax liabilities – (4)Lease liabilities 9 (1) (7)Derivative financial instruments 10 (41) (44)Total current liabilities (330) (378)Total liabilities (6,316) (2,833)Net assets 4,098 3,743 Equity Issued capital 12 137 137Share premium account 12 2,241 2,238Reserves 12 1,720 1,368Shareholders’ equity 4,098 3,743
The Company made a profit for the year of £258m (2019/20: profit of £130m) including the recognition of intra-group dividends. Approved by the Board of Directors of DS Smith Plc (company registered number 1377658) on 21 June 2021 and signed on its behalf by:
M W Roberts A R T Marsh Director Director
The accompanying notes are an integral part of these financial statements.
Parent Company statement of changes in equity At 30 April 2021
Annual Report 2021 dssmith.com 183
Sharecapital
£m
Sharepremium
£m
Hedgingreserve
£m
Own shares
£m
Merger relief
reserve £m
Retained earnings
£m
Total equity
£m
At 30 April 2019 137 2,236 (13) (1) 32 1,473 3,864Profit for the year – – – – – 130 130Actuarial loss on employee benefits – – – – – (16) (16)Cash flow hedges fair value changes – – (31) – – – (31)Reclassification from cash flow hedge reserve to income statement – – (1) – – – (1)Income tax on other comprehensive income – – 6 – – 13 19Total comprehensive (expense)/income – – (26) – – 127 101Issue of share capital – 2 – – – – 2Employee share trust – – – (2) – (2) (4)Share-based payment expense (net of tax) – – – – – 2 2Dividends paid1 – – – – – (222) (222)Other changes in equity in the year – 2 – (2) – (222) (222)At 30 April 2020 137 2,238 (39) (3) 32 1,378 3,743Profit for the year – – – – – 258 258Actuarial loss on employee benefits – – – – – (6) (6)Cash flow hedges fair value changes – – 103 – – – 103Reclassification from cash flow hedge reserve to income statement – – 9 – – – 9Income tax on other comprehensive income – – (20) – – – (20)Total comprehensive (expense)/income – – 92 – – 252 344Issue of share capital – 3 – – – – 3Employee share trust – – – – – (2) (2)Share-based payment expense (net of tax) – – – – – 10 10Other changes in equity in the year – 3 – – – 8 11At 30 April 2021 137 2,241 53 (3) 32 1,638 4,098
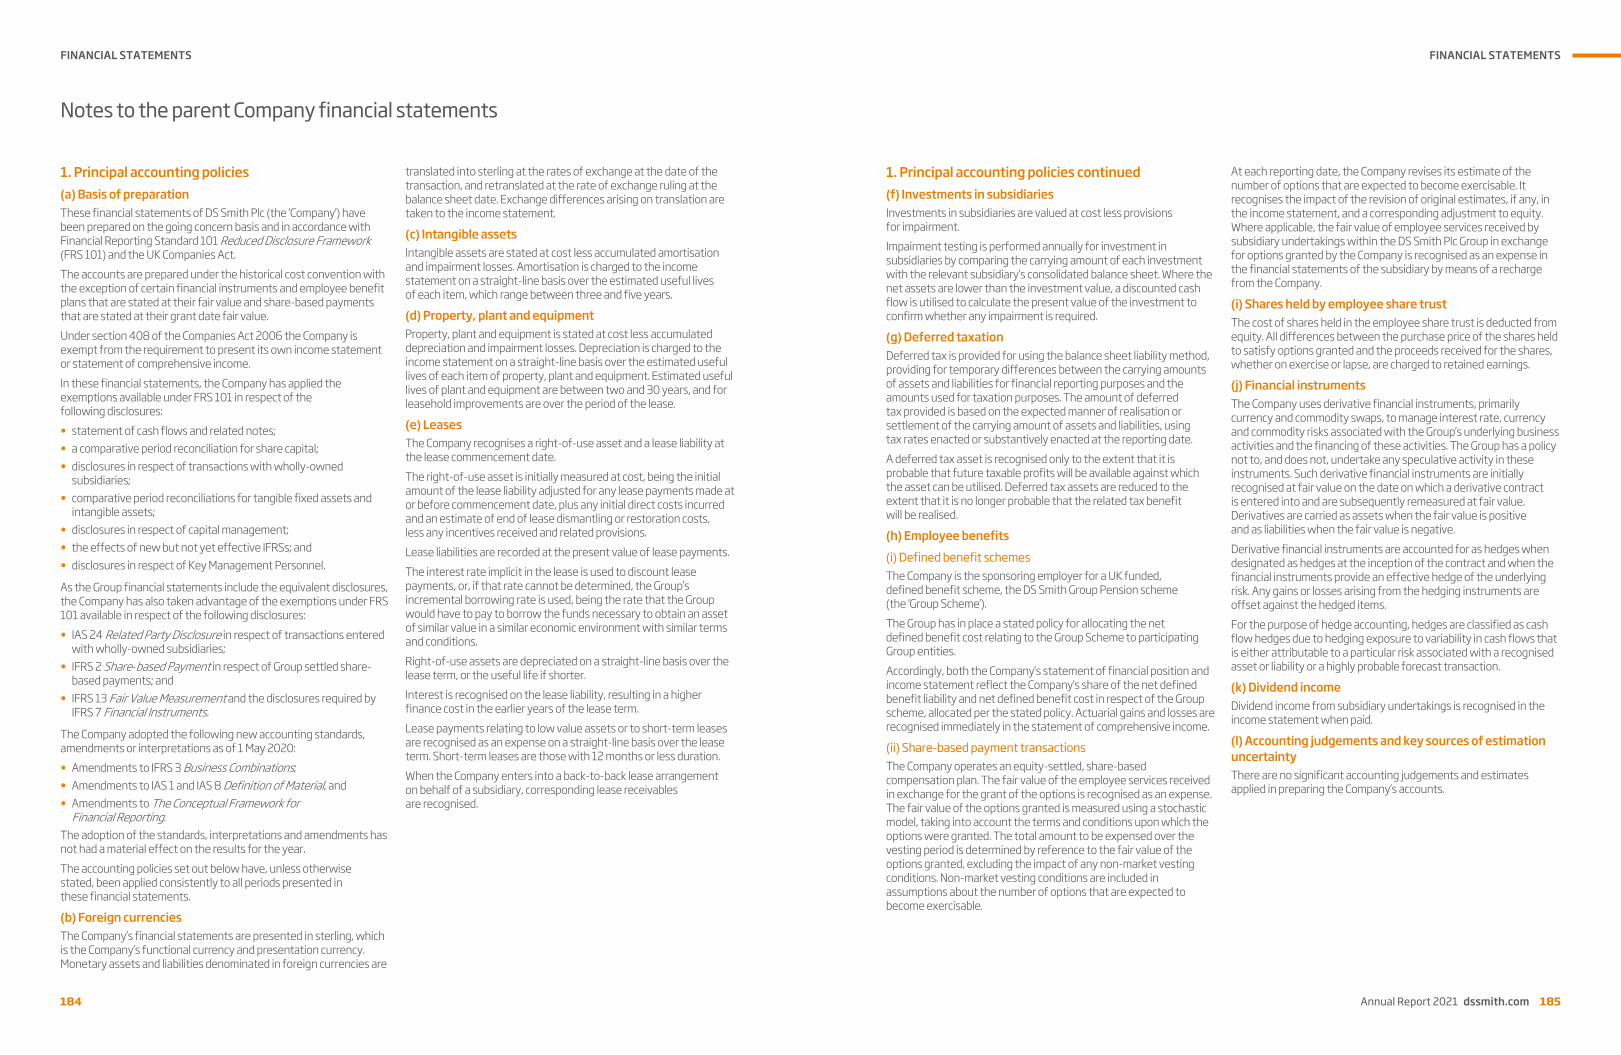
FINANCIAL STATEMENTS
184
Notes to the parent Company financial statements
184
1. Principal accounting policies (a) Basis of preparation These financial statements of DS Smith Plc (the ‘Company’) have been prepared on the going concern basis and in accordance with Financial Reporting Standard 101 Reduced Disclosure Framework (FRS 101) and the UK Companies Act. The accounts are prepared under the historical cost convention with the exception of certain financial instruments and employee benefit plans that are stated at their fair value and share-based payments that are stated at their grant date fair value. Under section 408 of the Companies Act 2006 the Company is exempt from the requirement to present its own income statement or statement of comprehensive income. In these financial statements, the Company has applied the exemptions available under FRS 101 in respect of the following disclosures: • statement of cash flows and related notes; • a comparative period reconciliation for share capital; • disclosures in respect of transactions with wholly-owned
subsidiaries; • comparative period reconciliations for tangible fixed assets and
intangible assets; • disclosures in respect of capital management; • the effects of new but not yet effective IFRSs; and • disclosures in respect of Key Management Personnel.
As the Group financial statements include the equivalent disclosures, the Company has also taken advantage of the exemptions under FRS 101 available in respect of the following disclosures: • IAS 24 Related Party Disclosure in respect of transactions entered
with wholly-owned subsidiaries; • IFRS 2 Share-based Payment in respect of Group settled share-
based payments; and • IFRS 13 Fair Value Measurement and the disclosures required by
IFRS 7 Financial Instruments.
The Company adopted the following new accounting standards, amendments or interpretations as of 1 May 2020: • Amendments to IFRS 3 Business Combinations; • Amendments to IAS 1 and IAS 8 Definition of Material, and • Amendments to The Conceptual Framework for
Financial Reporting. The adoption of the standards, interpretations and amendments has not had a material effect on the results for the year. The accounting policies set out below have, unless otherwise stated, been applied consistently to all periods presented in these financial statements.
(b) Foreign currencies The Company’s financial statements are presented in sterling, which is the Company’s functional currency and presentation currency. Monetary assets and liabilities denominated in foreign currencies are
translated into sterling at the rates of exchange at the date of the transaction, and retranslated at the rate of exchange ruling at the balance sheet date. Exchange differences arising on translation are taken to the income statement.
(c) Intangible assets Intangible assets are stated at cost less accumulated amortisation and impairment losses. Amortisation is charged to the income statement on a straight-line basis over the estimated useful lives of each item, which range between three and five years.
(d) Property, plant and equipment Property, plant and equipment is stated at cost less accumulated depreciation and impairment losses. Depreciation is charged to the income statement on a straight-line basis over the estimated useful lives of each item of property, plant and equipment. Estimated useful lives of plant and equipment are between two and 30 years, and for leasehold improvements are over the period of the lease.
(e) Leases The Company recognises a right-of-use asset and a lease liability at the lease commencement date. The right-of-use asset is initially measured at cost, being the initial amount of the lease liability adjusted for any lease payments made at or before commencement date, plus any initial direct costs incurred and an estimate of end of lease dismantling or restoration costs, less any incentives received and related provisions. Lease liabilities are recorded at the present value of lease payments. The interest rate implicit in the lease is used to discount lease payments, or, if that rate cannot be determined, the Group’s incremental borrowing rate is used, being the rate that the Group would have to pay to borrow the funds necessary to obtain an asset of similar value in a similar economic environment with similar terms and conditions. Right-of-use assets are depreciated on a straight-line basis over the lease term, or the useful life if shorter. Interest is recognised on the lease liability, resulting in a higher finance cost in the earlier years of the lease term. Lease payments relating to low value assets or to short-term leases are recognised as an expense on a straight-line basis over the lease term. Short-term leases are those with 12 months or less duration. When the Company enters into a back-to-back lease arrangement on behalf of a subsidiary, corresponding lease receivables are recognised.
FINANCIAL STATEMENTS
Annual Report 2021 dssmith.com 185
Notes to the parent Company financial statements
184
1. Principal accounting policies (a) Basis of preparation These financial statements of DS Smith Plc (the ‘Company’) have been prepared on the going concern basis and in accordance with Financial Reporting Standard 101 Reduced Disclosure Framework (FRS 101) and the UK Companies Act. The accounts are prepared under the historical cost convention with the exception of certain financial instruments and employee benefit plans that are stated at their fair value and share-based payments that are stated at their grant date fair value. Under section 408 of the Companies Act 2006 the Company is exempt from the requirement to present its own income statement or statement of comprehensive income. In these financial statements, the Company has applied the exemptions available under FRS 101 in respect of the following disclosures: • statement of cash flows and related notes; • a comparative period reconciliation for share capital; • disclosures in respect of transactions with wholly-owned
subsidiaries; • comparative period reconciliations for tangible fixed assets and
intangible assets; • disclosures in respect of capital management; • the effects of new but not yet effective IFRSs; and • disclosures in respect of Key Management Personnel.
As the Group financial statements include the equivalent disclosures, the Company has also taken advantage of the exemptions under FRS 101 available in respect of the following disclosures: • IAS 24 Related Party Disclosure in respect of transactions entered
with wholly-owned subsidiaries; • IFRS 2 Share-based Payment in respect of Group settled share-
based payments; and • IFRS 13 Fair Value Measurement and the disclosures required by
IFRS 7 Financial Instruments.
The Company adopted the following new accounting standards, amendments or interpretations as of 1 May 2020: • Amendments to IFRS 3 Business Combinations; • Amendments to IAS 1 and IAS 8 Definition of Material, and • Amendments to The Conceptual Framework for
Financial Reporting. The adoption of the standards, interpretations and amendments has not had a material effect on the results for the year. The accounting policies set out below have, unless otherwise stated, been applied consistently to all periods presented in these financial statements.
(b) Foreign currencies The Company’s financial statements are presented in sterling, which is the Company’s functional currency and presentation currency. Monetary assets and liabilities denominated in foreign currencies are
translated into sterling at the rates of exchange at the date of the transaction, and retranslated at the rate of exchange ruling at the balance sheet date. Exchange differences arising on translation are taken to the income statement.
(c) Intangible assets Intangible assets are stated at cost less accumulated amortisation and impairment losses. Amortisation is charged to the income statement on a straight-line basis over the estimated useful lives of each item, which range between three and five years.
(d) Property, plant and equipment Property, plant and equipment is stated at cost less accumulated depreciation and impairment losses. Depreciation is charged to the income statement on a straight-line basis over the estimated useful lives of each item of property, plant and equipment. Estimated useful lives of plant and equipment are between two and 30 years, and for leasehold improvements are over the period of the lease.
(e) Leases The Company recognises a right-of-use asset and a lease liability at the lease commencement date. The right-of-use asset is initially measured at cost, being the initial amount of the lease liability adjusted for any lease payments made at or before commencement date, plus any initial direct costs incurred and an estimate of end of lease dismantling or restoration costs, less any incentives received and related provisions. Lease liabilities are recorded at the present value of lease payments. The interest rate implicit in the lease is used to discount lease payments, or, if that rate cannot be determined, the Group’s incremental borrowing rate is used, being the rate that the Group would have to pay to borrow the funds necessary to obtain an asset of similar value in a similar economic environment with similar terms and conditions. Right-of-use assets are depreciated on a straight-line basis over the lease term, or the useful life if shorter. Interest is recognised on the lease liability, resulting in a higher finance cost in the earlier years of the lease term. Lease payments relating to low value assets or to short-term leases are recognised as an expense on a straight-line basis over the lease term. Short-term leases are those with 12 months or less duration. When the Company enters into a back-to-back lease arrangement on behalf of a subsidiary, corresponding lease receivables are recognised.
Annual Report 2021 dssmith.com 185
1. Principal accounting policies continued (f) Investments in subsidiaries Investments in subsidiaries are valued at cost less provisions for impairment. Impairment testing is performed annually for investment in subsidiaries by comparing the carrying amount of each investment with the relevant subsidiary’s consolidated balance sheet. Where the net assets are lower than the investment value, a discounted cash flow is utilised to calculate the present value of the investment to confirm whether any impairment is required.
(g) Deferred taxation Deferred tax is provided for using the balance sheet liability method, providing for temporary differences between the carrying amounts of assets and liabilities for financial reporting purposes and the amounts used for taxation purposes. The amount of deferred tax provided is based on the expected manner of realisation or settlement of the carrying amount of assets and liabilities, using tax rates enacted or substantively enacted at the reporting date. A deferred tax asset is recognised only to the extent that it is probable that future taxable profits will be available against which the asset can be utilised. Deferred tax assets are reduced to the extent that it is no longer probable that the related tax benefit will be realised.
(h) Employee benefits (i) Defined benefit schemes The Company is the sponsoring employer for a UK funded, defined benefit scheme, the DS Smith Group Pension scheme (the ‘Group Scheme’). The Group has in place a stated policy for allocating the net defined benefit cost relating to the Group Scheme to participating Group entities. Accordingly, both the Company’s statement of financial position and income statement reflect the Company’s share of the net defined benefit liability and net defined benefit cost in respect of the Group scheme, allocated per the stated policy. Actuarial gains and losses are recognised immediately in the statement of comprehensive income.
(ii) Share-based payment transactions The Company operates an equity-settled, share-based compensation plan. The fair value of the employee services received in exchange for the grant of the options is recognised as an expense. The fair value of the options granted is measured using a stochastic model, taking into account the terms and conditions upon which the options were granted. The total amount to be expensed over the vesting period is determined by reference to the fair value of the options granted, excluding the impact of any non-market vesting conditions. Non-market vesting conditions are included in assumptions about the number of options that are expected to become exercisable.
At each reporting date, the Company revises its estimate of the number of options that are expected to become exercisable. It recognises the impact of the revision of original estimates, if any, in the income statement, and a corresponding adjustment to equity. Where applicable, the fair value of employee services received by subsidiary undertakings within the DS Smith Plc Group in exchange for options granted by the Company is recognised as an expense in the financial statements of the subsidiary by means of a recharge from the Company.
(i) Shares held by employee share trust The cost of shares held in the employee share trust is deducted from equity. All differences between the purchase price of the shares held to satisfy options granted and the proceeds received for the shares, whether on exercise or lapse, are charged to retained earnings.
(j) Financial instruments The Company uses derivative financial instruments, primarily currency and commodity swaps, to manage interest rate, currency and commodity risks associated with the Group’s underlying business activities and the financing of these activities. The Group has a policy not to, and does not, undertake any speculative activity in these instruments. Such derivative financial instruments are initially recognised at fair value on the date on which a derivative contract is entered into and are subsequently remeasured at fair value. Derivatives are carried as assets when the fair value is positive and as liabilities when the fair value is negative. Derivative financial instruments are accounted for as hedges when designated as hedges at the inception of the contract and when the financial instruments provide an effective hedge of the underlying risk. Any gains or losses arising from the hedging instruments are offset against the hedged items. For the purpose of hedge accounting, hedges are classified as cash flow hedges due to hedging exposure to variability in cash flows that is either attributable to a particular risk associated with a recognised asset or liability or a highly probable forecast transaction.
(k) Dividend income Dividend income from subsidiary undertakings is recognised in the income statement when paid.
(l) Accounting judgements and key sources of estimation uncertainty There are no significant accounting judgements and estimates applied in preparing the Company’s accounts.
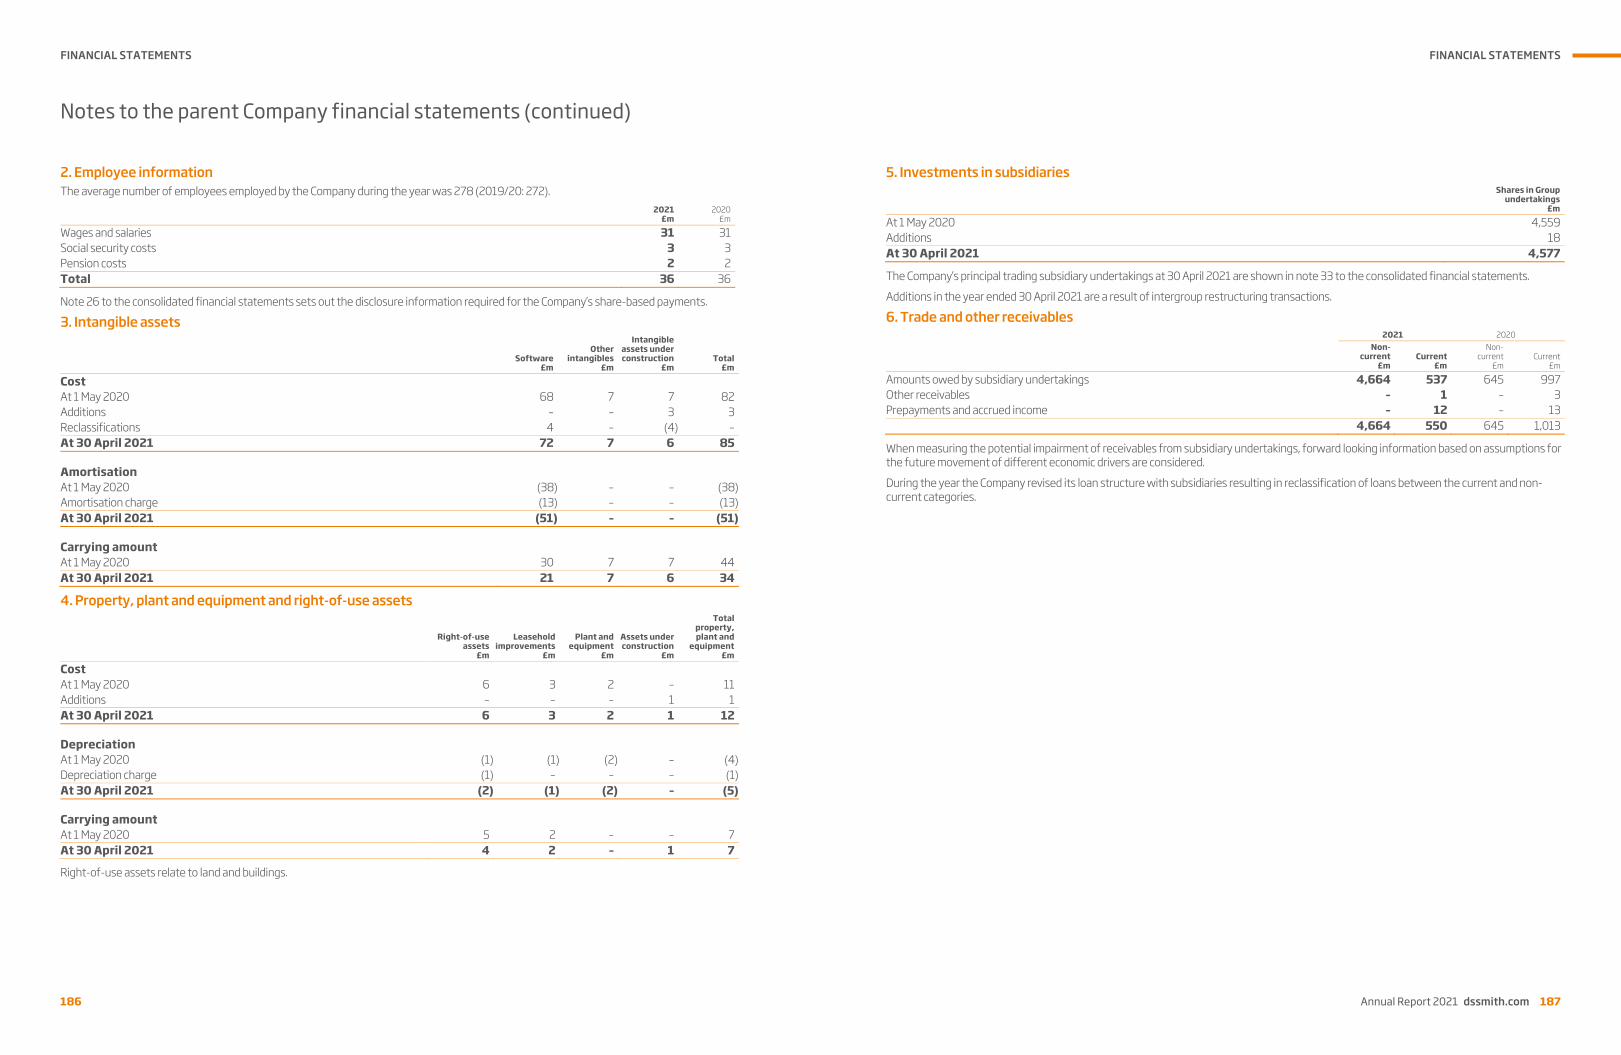
FINANCIAL STATEMENTS
186
Notes to the parent Company financial statements (continued)
186
2. Employee information The average number of employees employed by the Company during the year was 278 (2019/20: 272).
2021
£m2020
£m
Wages and salaries 31 31Social security costs 3 3Pension costs 2 2Total 36 36
Note 26 to the consolidated financial statements sets out the disclosure information required for the Company’s share-based payments.
3. Intangible assets
Software£m
Other intangibles
£m
Intangible assets under construction
£mTotal
£m
Cost At 1 May 2020 68 7 7 82Additions – – 3 3Reclassifications 4 – (4) –At 30 April 2021 72 7 6 85 Amortisation
At 1 May 2020 (38) – – (38)Amortisation charge (13) – – (13)At 30 April 2021 (51) – – (51) Carrying amount
At 1 May 2020 30 7 7 44At 30 April 2021 21 7 6 34
4. Property, plant and equipment and right-of-use assets
Right-of-use assets
£m
Leasehold improvements
£m
Plant and equipment
£m
Assets under construction
£m
Total property, plant and
equipment£m
Cost At 1 May 2020 6 3 2 – 11Additions – – – 1 1At 30 April 2021 6 3 2 1 12 Depreciation
At 1 May 2020 (1) (1) (2) – (4)Depreciation charge (1) – – – (1)At 30 April 2021 (2) (1) (2) – (5) Carrying amount
At 1 May 2020 5 2 – – 7At 30 April 2021 4 2 – 1 7
Right-of-use assets relate to land and buildings.
FINANCIAL STATEMENTS
Annual Report 2021 dssmith.com 187
Notes to the parent Company financial statements (continued)
186
2. Employee information The average number of employees employed by the Company during the year was 278 (2019/20: 272).
2021
£m2020
£m
Wages and salaries 31 31Social security costs 3 3Pension costs 2 2Total 36 36
Note 26 to the consolidated financial statements sets out the disclosure information required for the Company’s share-based payments.
3. Intangible assets
Software£m
Other intangibles
£m
Intangible assets under construction
£mTotal
£m
Cost At 1 May 2020 68 7 7 82Additions – – 3 3Reclassifications 4 – (4) –At 30 April 2021 72 7 6 85 Amortisation
At 1 May 2020 (38) – – (38)Amortisation charge (13) – – (13)At 30 April 2021 (51) – – (51) Carrying amount
At 1 May 2020 30 7 7 44At 30 April 2021 21 7 6 34
4. Property, plant and equipment and right-of-use assets
Right-of-use assets
£m
Leasehold improvements
£m
Plant and equipment
£m
Assets under construction
£m
Total property, plant and
equipment£m
Cost At 1 May 2020 6 3 2 – 11Additions – – – 1 1At 30 April 2021 6 3 2 1 12 Depreciation
At 1 May 2020 (1) (1) (2) – (4)Depreciation charge (1) – – – (1)At 30 April 2021 (2) (1) (2) – (5) Carrying amount
At 1 May 2020 5 2 – – 7At 30 April 2021 4 2 – 1 7
Right-of-use assets relate to land and buildings.
Annual Report 2021 dssmith.com 187
5. Investments in subsidiaries
Shares in Group undertakings
£m
At 1 May 2020 4,559Additions 18At 30 April 2021 4,577
The Company’s principal trading subsidiary undertakings at 30 April 2021 are shown in note 33 to the consolidated financial statements.
Additions in the year ended 30 April 2021 are a result of intergroup restructuring transactions.
6. Trade and other receivables 2021 2020
Non- current
£m Current
£m
Non-current
£mCurrent
£m
Amounts owed by subsidiary undertakings 4,664 537 645 997Other receivables – 1 – 3Prepayments and accrued income – 12 – 13 4,664 550 645 1,013
When measuring the potential impairment of receivables from subsidiary undertakings, forward looking information based on assumptions for the future movement of different economic drivers are considered.
During the year the Company revised its loan structure with subsidiaries resulting in reclassification of loans between the current and non-current categories.
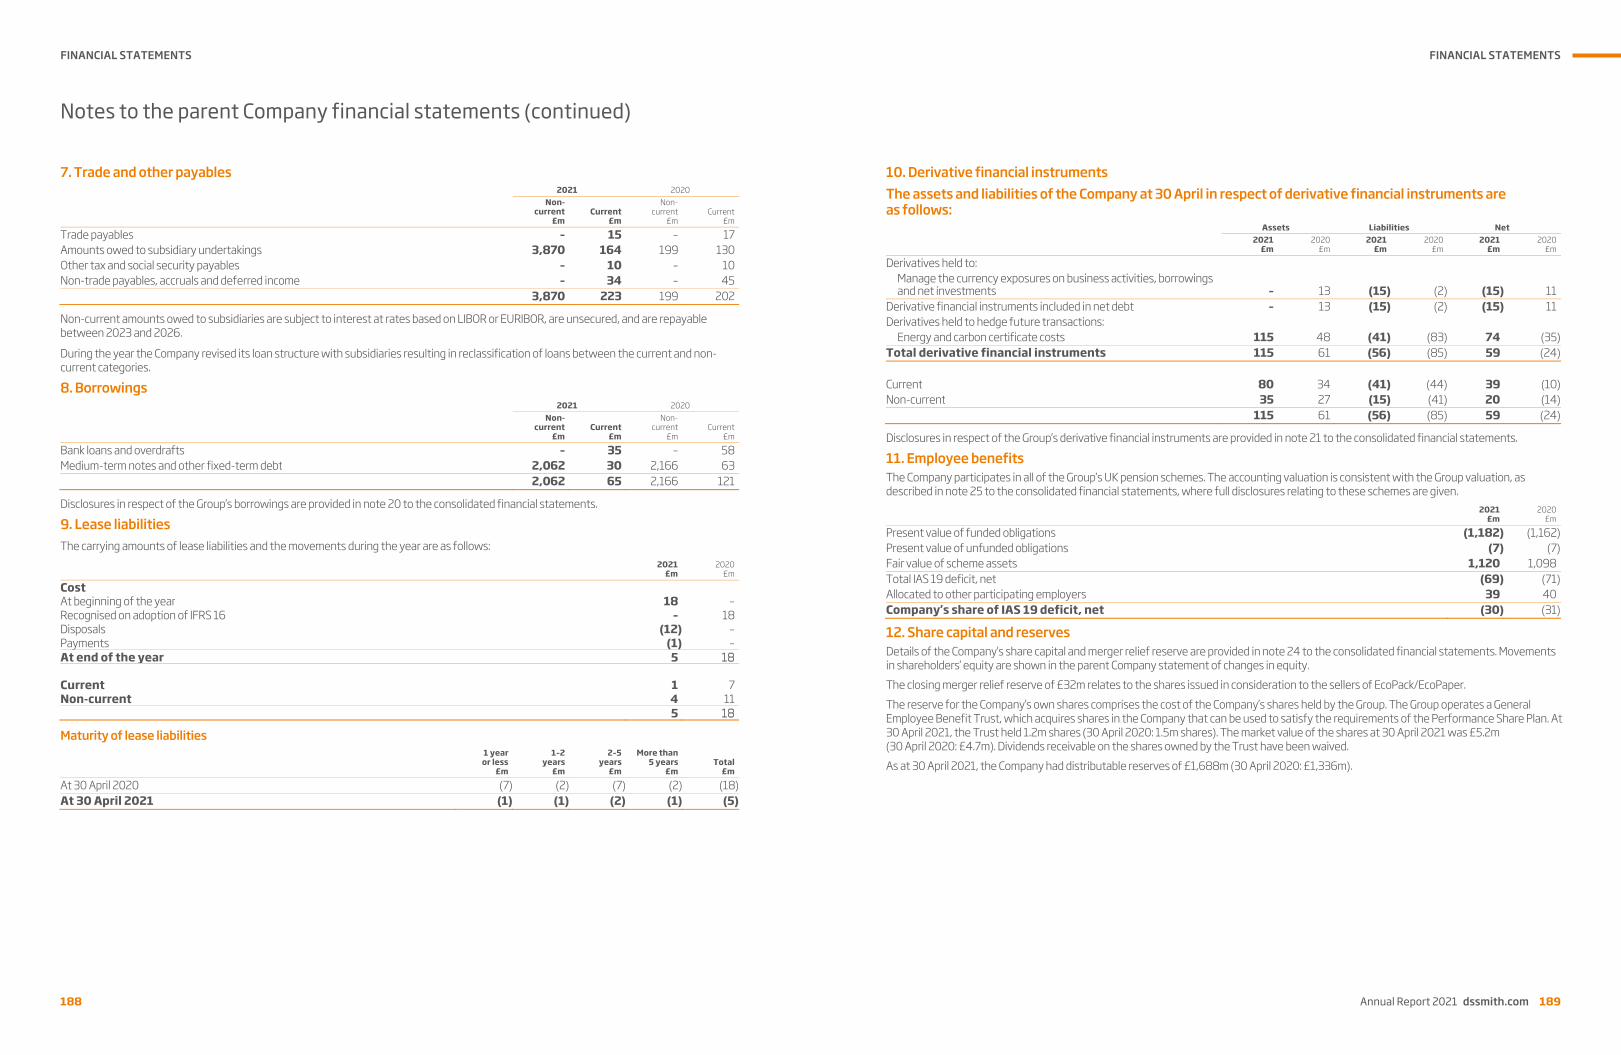
FINANCIAL STATEMENTS
188
Notes to the parent Company financial statements (continued)
188
7. Trade and other payables 2021 2020
Non-current
£mCurrent
£m
Non-current
£mCurrent
£m
Trade payables – 15 – 17Amounts owed to subsidiary undertakings 3,870 164 199 130Other tax and social security payables – 10 – 10Non-trade payables, accruals and deferred income – 34 – 45 3,870 223 199 202
Non-current amounts owed to subsidiaries are subject to interest at rates based on LIBOR or EURIBOR, are unsecured, and are repayable between 2023 and 2026.
During the year the Company revised its loan structure with subsidiaries resulting in reclassification of loans between the current and non-current categories.
8. Borrowings 2021 2020
Non-current
£mCurrent
£m
Non-current
£mCurrent
£m
Bank loans and overdrafts – 35 – 58Medium-term notes and other fixed-term debt 2,062 30 2,166 63 2,062 65 2,166 121
Disclosures in respect of the Group’s borrowings are provided in note 20 to the consolidated financial statements.
9. Lease liabilities The carrying amounts of lease liabilities and the movements during the year are as follows:
2021
£m2020
£m
Cost At beginning of the year 18 –Recognised on adoption of IFRS 16 – 18Disposals (12) –Payments (1) –At end of the year 5 18 Current 1 7Non-current 4 11 5 18
Maturity of lease liabilities 1 yearor less
£m
1–2years
£m
2–5 years
£m
More than5 years
£mTotal
£m
At 30 April 2020 (7) (2) (7) (2) (18)At 30 April 2021 (1) (1) (2) (1) (5)
FINANCIAL STATEMENTS
Annual Report 2021 dssmith.com 189
Notes to the parent Company financial statements (continued)
188
7. Trade and other payables 2021 2020
Non-current
£mCurrent
£m
Non-current
£mCurrent
£m
Trade payables – 15 – 17Amounts owed to subsidiary undertakings 3,870 164 199 130Other tax and social security payables – 10 – 10Non-trade payables, accruals and deferred income – 34 – 45 3,870 223 199 202
Non-current amounts owed to subsidiaries are subject to interest at rates based on LIBOR or EURIBOR, are unsecured, and are repayable between 2023 and 2026.
During the year the Company revised its loan structure with subsidiaries resulting in reclassification of loans between the current and non-current categories.
8. Borrowings 2021 2020
Non-current
£mCurrent
£m
Non-current
£mCurrent
£m
Bank loans and overdrafts – 35 – 58Medium-term notes and other fixed-term debt 2,062 30 2,166 63 2,062 65 2,166 121
Disclosures in respect of the Group’s borrowings are provided in note 20 to the consolidated financial statements.
9. Lease liabilities The carrying amounts of lease liabilities and the movements during the year are as follows:
2021
£m2020
£m
Cost At beginning of the year 18 –Recognised on adoption of IFRS 16 – 18Disposals (12) –Payments (1) –At end of the year 5 18 Current 1 7Non-current 4 11 5 18
Maturity of lease liabilities 1 yearor less
£m
1–2years
£m
2–5 years
£m
More than5 years
£mTotal
£m
At 30 April 2020 (7) (2) (7) (2) (18)At 30 April 2021 (1) (1) (2) (1) (5)
Annual Report 2021 dssmith.com 189
10. Derivative financial instruments The assets and liabilities of the Company at 30 April in respect of derivative financial instruments are as follows:
Assets Liabilities Net2021
£m2020
£m2021
£m 2020
£m 2021
£m2020
£m
Derivatives held to: Manage the currency exposures on business activities, borrowings and net investments – 13 (15) (2) (15) 11
Derivative financial instruments included in net debt – 13 (15) (2) (15) 11Derivatives held to hedge future transactions:
Energy and carbon certificate costs 115 48 (41) (83) 74 (35)Total derivative financial instruments 115 61 (56) (85) 59 (24) Current 80 34 (41) (44) 39 (10)Non-current 35 27 (15) (41) 20 (14) 115 61 (56) (85) 59 (24)
Disclosures in respect of the Group’s derivative financial instruments are provided in note 21 to the consolidated financial statements.
11. Employee benefits The Company participates in all of the Group’s UK pension schemes. The accounting valuation is consistent with the Group valuation, as described in note 25 to the consolidated financial statements, where full disclosures relating to these schemes are given.
2021
£m2020
£m
Present value of funded obligations (1,182) (1,162)Present value of unfunded obligations (7) (7)Fair value of scheme assets 1,120 1,098Total IAS 19 deficit, net (69) (71)Allocated to other participating employers 39 40Company’s share of IAS 19 deficit, net (30) (31)
12. Share capital and reserves Details of the Company’s share capital and merger relief reserve are provided in note 24 to the consolidated financial statements. Movements in shareholders’ equity are shown in the parent Company statement of changes in equity. The closing merger relief reserve of £32m relates to the shares issued in consideration to the sellers of EcoPack/EcoPaper. The reserve for the Company’s own shares comprises the cost of the Company’s shares held by the Group. The Group operates a General Employee Benefit Trust, which acquires shares in the Company that can be used to satisfy the requirements of the Performance Share Plan. At 30 April 2021, the Trust held 1.2m shares (30 April 2020: 1.5m shares). The market value of the shares at 30 April 2021 was £5.2m (30 April 2020: £4.7m). Dividends receivable on the shares owned by the Trust have been waived. As at 30 April 2021, the Company had distributable reserves of £1,688m (30 April 2020: £1,336m).
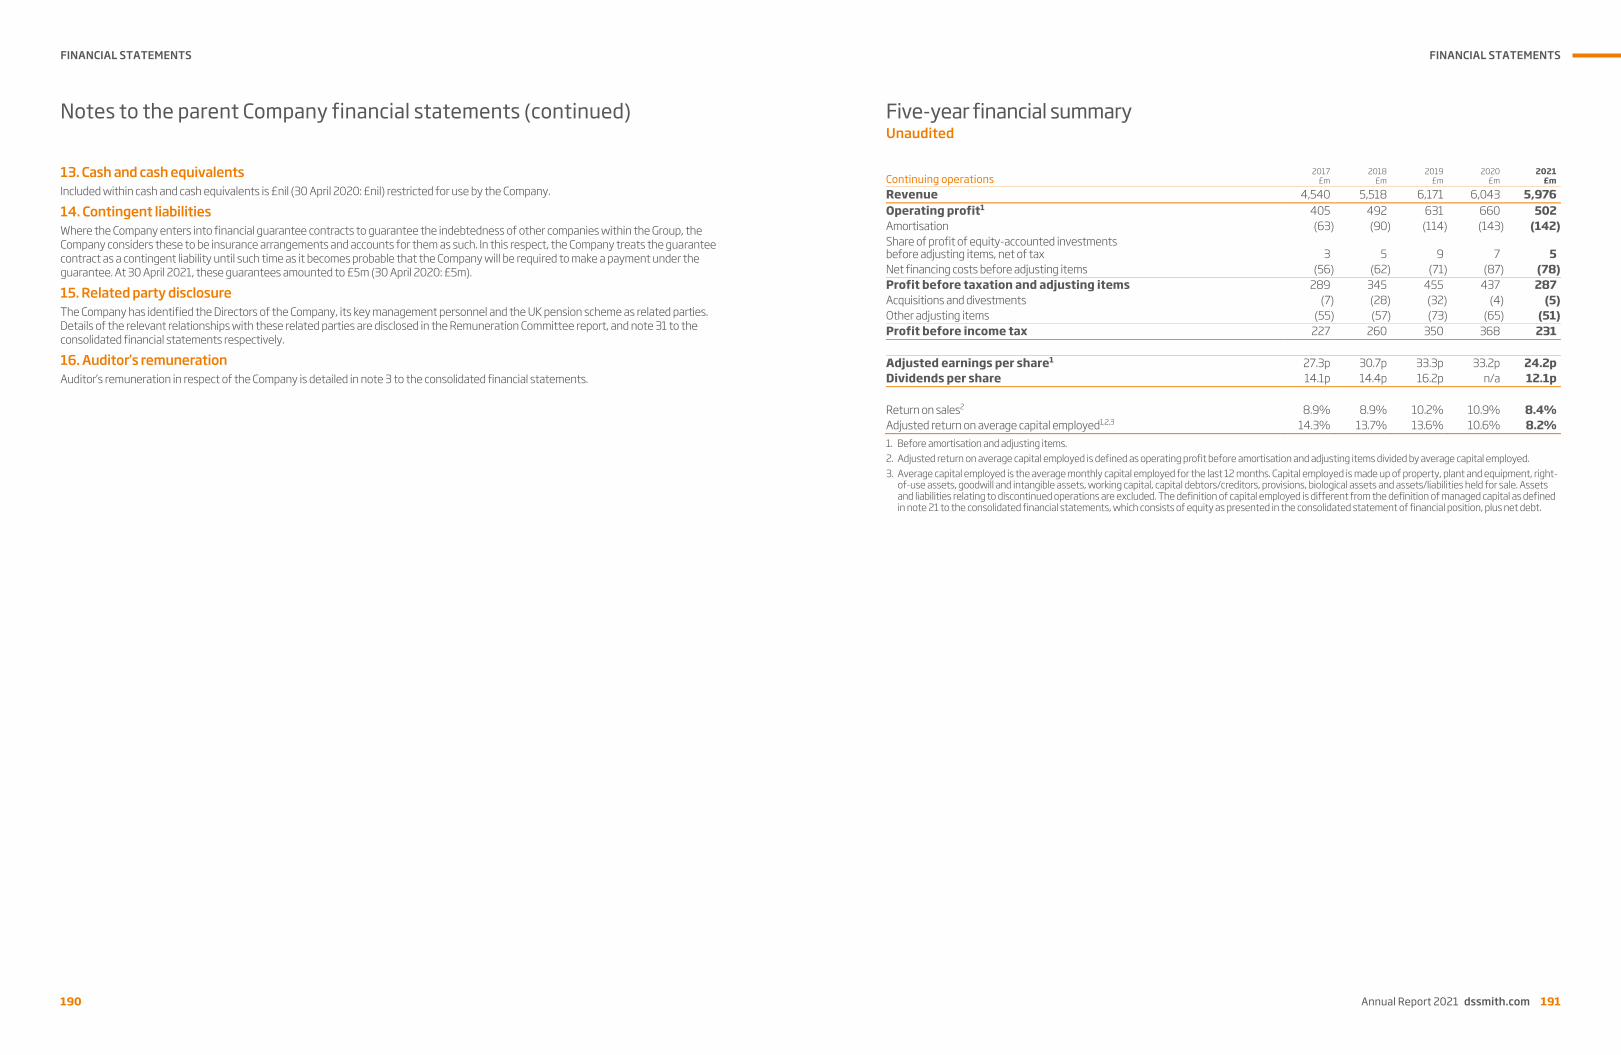
FINANCIAL STATEMENTS
190
Notes to the parent Company financial statements (continued)
190
13. Cash and cash equivalents Included within cash and cash equivalents is £nil (30 April 2020: £nil) restricted for use by the Company.
14. Contingent liabilities Where the Company enters into financial guarantee contracts to guarantee the indebtedness of other companies within the Group, the Company considers these to be insurance arrangements and accounts for them as such. In this respect, the Company treats the guarantee contract as a contingent liability until such time as it becomes probable that the Company will be required to make a payment under the guarantee. At 30 April 2021, these guarantees amounted to £5m (30 April 2020: £5m).
15. Related party disclosure The Company has identified the Directors of the Company, its key management personnel and the UK pension scheme as related parties. Details of the relevant relationships with these related parties are disclosed in the Remuneration Committee report, and note 31 to the consolidated financial statements respectively.
16. Auditor’s remuneration Auditor’s remuneration in respect of the Company is detailed in note 3 to the consolidated financial statements.
FINANCIAL STATEMENTS
Annual Report 2021 dssmith.com 191
Notes to the parent Company financial statements (continued)
190
13. Cash and cash equivalents Included within cash and cash equivalents is £nil (30 April 2020: £nil) restricted for use by the Company.
14. Contingent liabilities Where the Company enters into financial guarantee contracts to guarantee the indebtedness of other companies within the Group, the Company considers these to be insurance arrangements and accounts for them as such. In this respect, the Company treats the guarantee contract as a contingent liability until such time as it becomes probable that the Company will be required to make a payment under the guarantee. At 30 April 2021, these guarantees amounted to £5m (30 April 2020: £5m).
15. Related party disclosure The Company has identified the Directors of the Company, its key management personnel and the UK pension scheme as related parties. Details of the relevant relationships with these related parties are disclosed in the Remuneration Committee report, and note 31 to the consolidated financial statements respectively.
16. Auditor’s remuneration Auditor’s remuneration in respect of the Company is detailed in note 3 to the consolidated financial statements.
Five-year financial summary Unaudited
Annual Report 2021 dssmith.com 191
Continuing operations 2017
£m2018
£m 2019
£m 2020
£m2021
£m
Revenue 4,540 5,518 6,171 6,043 5,976Operating profit1 405 492 631 660 502Amortisation (63) (90) (114) (143) (142)Share of profit of equity-accounted investments before adjusting items, net of tax 3 5 9 7 5Net financing costs before adjusting items (56) (62) (71) (87) (78)Profit before taxation and adjusting items 289 345 455 437 287Acquisitions and divestments (7) (28) (32) (4) (5)Other adjusting items (55) (57) (73) (65) (51)Profit before income tax 227 260 350 368 231 Adjusted earnings per share1 27.3p 30.7p 33.3p 33.2p 24.2pDividends per share 14.1p 14.4p 16.2p n/a 12.1p Return on sales2 8.9% 8.9% 10.2% 10.9% 8.4%Adjusted return on average capital employed1,2,3 14.3% 13.7% 13.6% 10.6% 8.2%1. Before amortisation and adjusting items. 2. Adjusted return on average capital employed is defined as operating profit before amortisation and adjusting items divided by average capital employed. 3. Average capital employed is the average monthly capital employed for the last 12 months. Capital employed is made up of property, plant and equipment, right-
of-use assets, goodwill and intangible assets, working capital, capital debtors/creditors, provisions, biological assets and assets/liabilities held for sale. Assets and liabilities relating to discontinued operations are excluded. The definition of capital employed is different from the definition of managed capital as defined in note 21 to the consolidated financial statements, which consists of equity as presented in the consolidated statement of financial position, plus net debt.

FINANCIAL STATEMENTS
192
Shareholder information
Financial diary7 September 2021 Annual General Meeting9 December 2021* Announcement of half-year results for
the six months ended 31 October 20219 June 2022* Announcement of full-year results for
the year ended 30 April 2022 * Provisional date
Company websiteThe Company’s website at www.dssmith.com contains the latest information for shareholders, including press releases and an updated financial diary. Email alerts of the latest news, press releases and financial reports about the Company may be obtained by registering for the email news alert service on the website.
Share price informationThe latest price of the Company’s ordinary shares is available on www.londonstockexchange.com. DS Smith’s ticker symbol is SMDS. It is recommended that you consult your financial adviser and verify information obtained before making any investment decision.
RegistrarPlease contact the Registrar at the above right address to advise of a change of address or for any enquiries relating to dividend payments, lost share certificates or other share registration matters. The Registrar provides online facilities at www.shareview.co.uk. Once you have registered you will be able to access information on your DS Smith Plc shareholding, update your personal details and amend your dividend payment instructions online without having to call or write to the Registrar.
DividendsShareholders who wish to have their dividends paid directly into a bank or building society account should contact the Registrar. In addition, the Registrar is now able to pay dividends to over 90 different countries. This service enables the payment of your dividends directly into your bank account in your home currency. For international payments, a charge is deducted from each dividend payment to cover the costs involved. Please contact the Registrar to request further information.
Share dealing servicesThe Registrar offers a real-time telephone and internet dealing service for the UK. Further details including terms and rates can be obtained by logging on to the website at www.shareview.co.uk/dealing or by calling 0345 603 7037. Lines are open between 8am and 4.30pm, UK time, Monday to Friday.
Registered office and advisersSecretary and Registered OfficeIain Simm DS Smith Plc 350 Euston Road London NW1 3AX Registered in England No: 1377658
AuditorDeloitte LLPHill House 1 Little New Street London EC4A 3TR
SolicitorSlaughter and MayOne Bunhill Row London EC1Y 8YY
StockbrokerCitigroupCitigroup Centre 33 Canada Square Canary Wharf London E14 5LBJ.P. Morgan Cazenove25 Bank Street Canary Wharf London E14 5JP
RegistrarEquinitiAspect House Spencer Road Lancing West Sussex BN99 6DA
Other informationInformation on how to manage your shareholdings can be found at https://help.shareview.co.uk. The pages at this web address provide answers to commonly asked questions regarding shareholder registration, links to downloadable forms and guidance notes. If your question is not answered by the information provided, you can send your enquiry via secure email from these pages. You will be asked to complete a structured form and to provide your shareholder reference, name and address.You will also need to provide your email address if this is how you would like to receive your response. In the UK you can telephone 0371 384 2197. Lines are open 8.30am to 5.30pm Monday to Friday. For call charges, please check with your provider as costs may vary. For overseas, telephone +44 (0) 121 415 7047.This report contains certain forward-looking statements with respect to the operations, performance and financial condition of the Group. By their nature, these statements involve uncertainty since future events and circumstances can cause results and developments to differ materially from those anticipated. The forward-looking statements reflect knowledge and information available at the date of preparation of this report and DS Smith Plc undertakes no obligation to update these forward-looking statements. Nothing contained in this report should be construed as a profit forecast.Pages 1 to 109 consist of a Strategic Report and Directors’ report (including the Directors’ remuneration report) that have been drawn up and presented in accordance with and in reliance upon applicable English company law. The liability of the Directors in connection with such reports shall be subject to the limitation and restrictions provided by, and shall be no greater than is required by, applicable English company law.

DS Smith Plc
Annual Report 2021
Printed in the UK by Principal Colour Ltd on Revive 100% recycled offset and Revive 100% recycled silk.
Both manufactured at a mill certified to both ISO 14001 and FSC® accredited.
Principal Colour Ltd are certified to the ISO 14001 Environmental Management System and FSC® accredited.
Designed and produced by Black Sun Plc (London) +44 (0) 20 7736 0011
@dssmithgroup
DS Smith
DS Smith
@dssmith.group
DS Smith Plc 350 Euston Road London NW1 3AX
Telephone +44 (0) 20 7756 1800 www.dssmith.com
Keep in touch