reddick property rating: how to choose the best real estate investments
TRANSCRIPT

Reddick Property Rating
How to Choose the Best Real Estate Investments

Who has read the eBook?

How we came up with this
� Different Markets � Different Rental Properties � Different Investors

4 ways to profit with Real Estate 1. Cash flow 2. Appreciation 3. Principal Paydown 4. Tax benefits

Which one is most important?
Cash Flow
Tax Benefits Principal Paydown
Appreciation

5 Property Classes Luxury Class A Class B Class C Class D Class

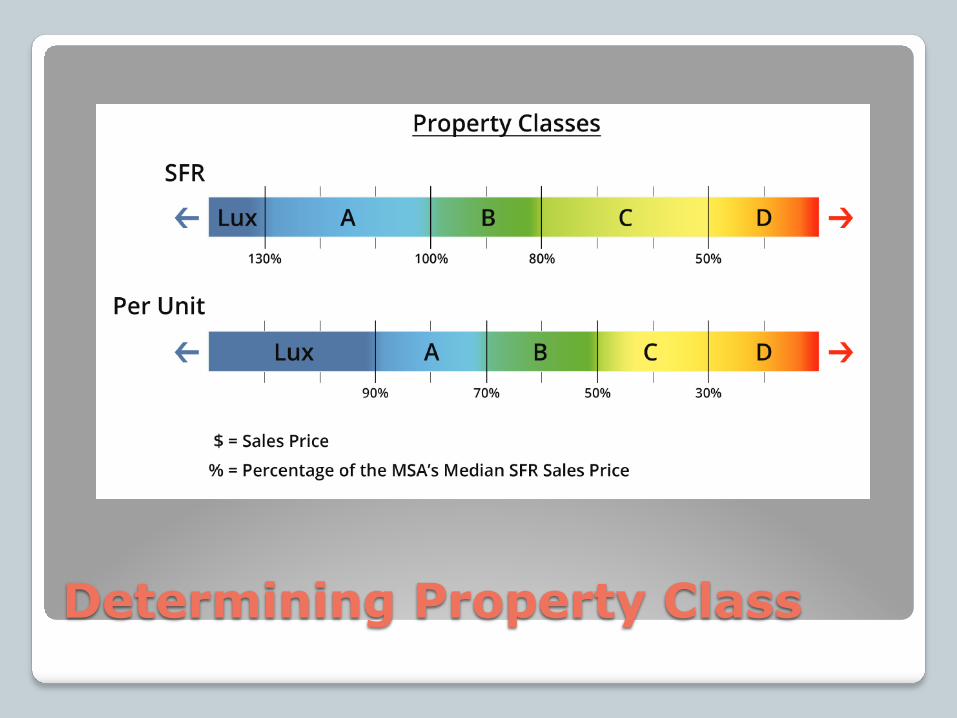
Determining Property Class


Orange County, CA
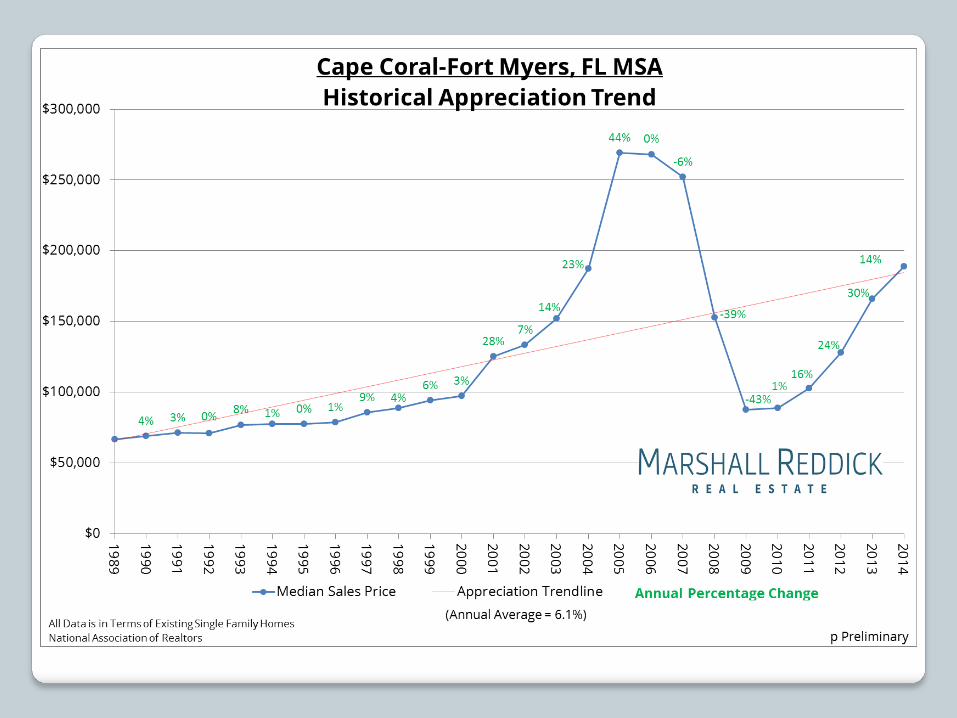
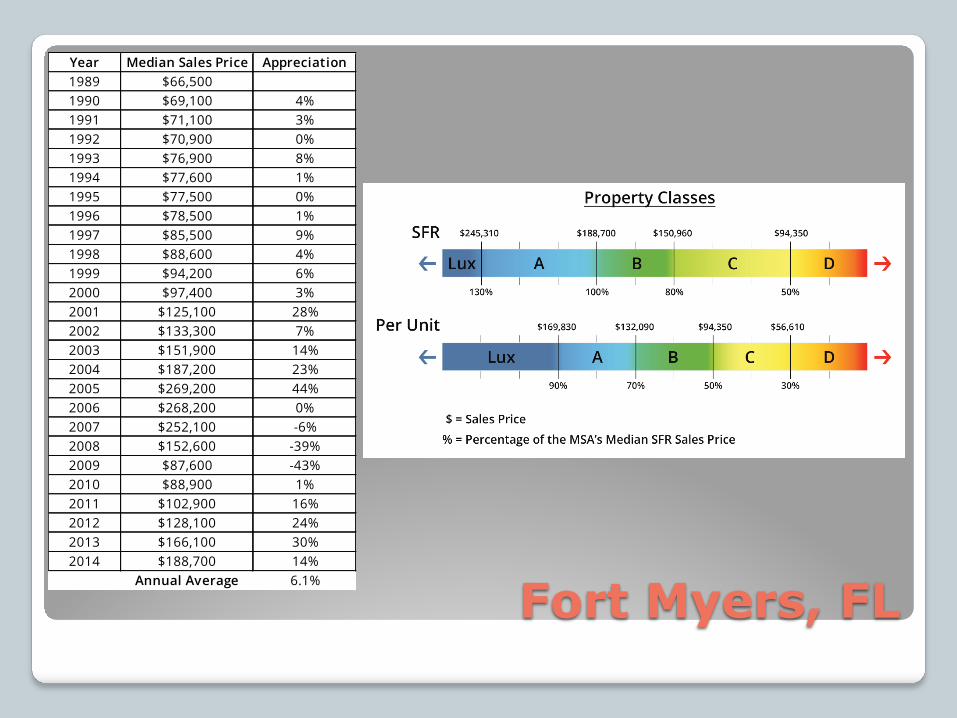
Fort Myers, FL
Year Median Sales Price Appreciation1989 $66,5001990 $69,100 4%1991 $71,100 3%1992 $70,900 0%1993 $76,900 8%1994 $77,600 1%1995 $77,500 0%1996 $78,500 1%1997 $85,500 9%1998 $88,600 4%1999 $94,200 6%2000 $97,400 3%2001 $125,100 28%2002 $133,300 7%2003 $151,900 14%2004 $187,200 23%2005 $269,200 44%2006 $268,200 0%2007 $252,100 -6%2008 $152,600 -39%2009 $87,600 -43%2010 $88,900 1%2011 $102,900 16%2012 $128,100 24%2013 $166,100 30%2014 $188,700 14%
Annual Average 6.1%
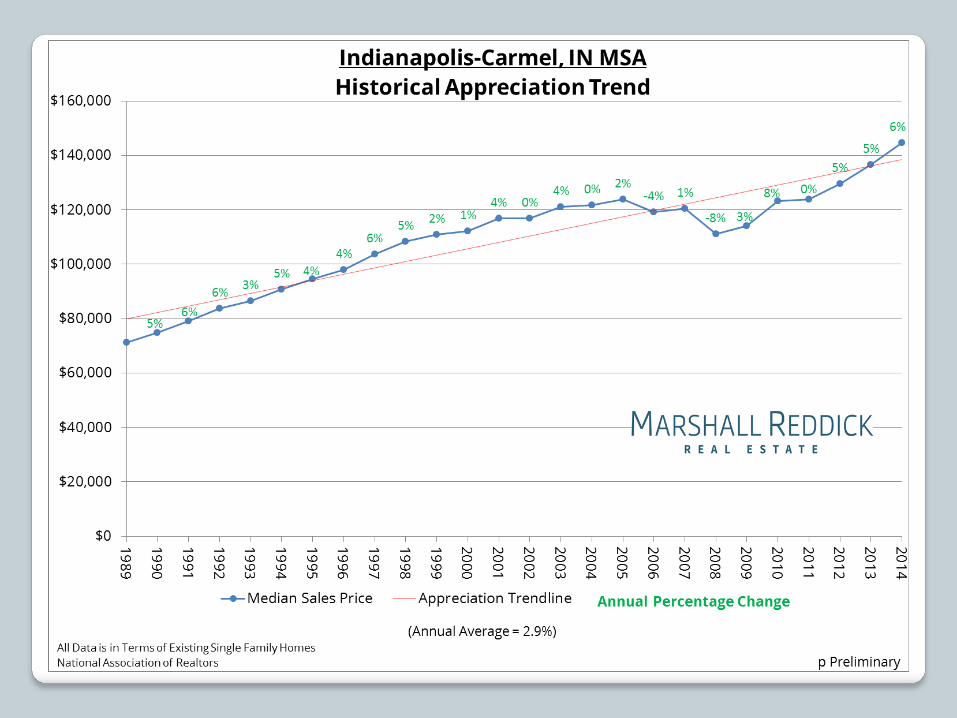
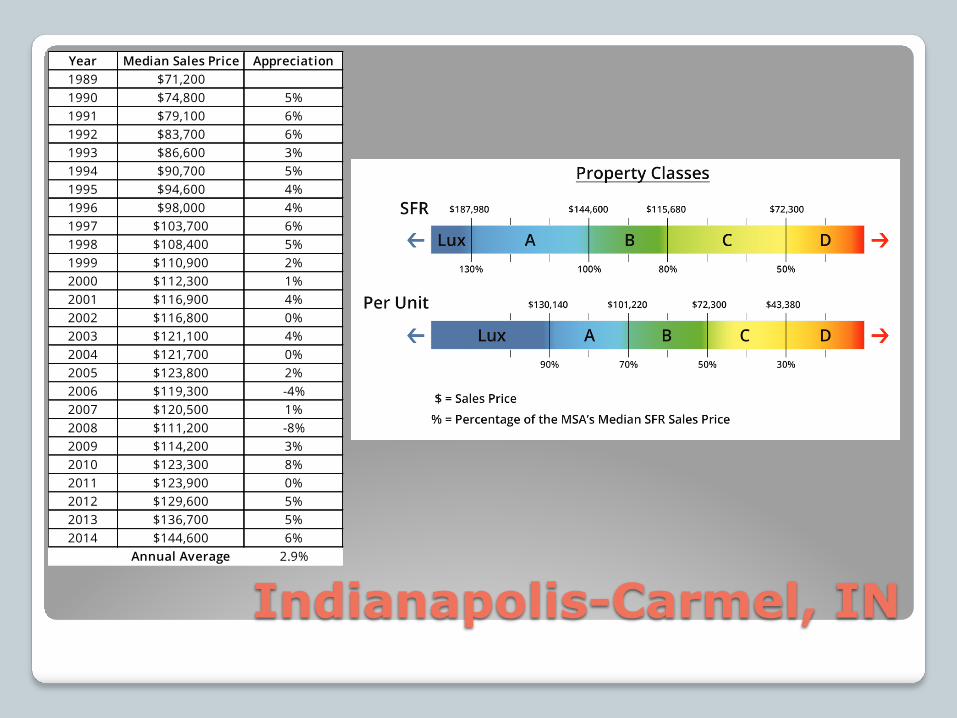
Indianapolis-Carmel, IN
Year Median Sales Price Appreciation1989 $71,2001990 $74,800 5%1991 $79,100 6%1992 $83,700 6%1993 $86,600 3%1994 $90,700 5%1995 $94,600 4%1996 $98,000 4%1997 $103,700 6%1998 $108,400 5%1999 $110,900 2%2000 $112,300 1%2001 $116,900 4%2002 $116,800 0%2003 $121,100 4%2004 $121,700 0%2005 $123,800 2%2006 $119,300 -4%2007 $120,500 1%2008 $111,200 -8%2009 $114,200 3%2010 $123,300 8%2011 $123,900 0%2012 $129,600 5%2013 $136,700 5%2014 $144,600 6%
Annual Average 2.9%
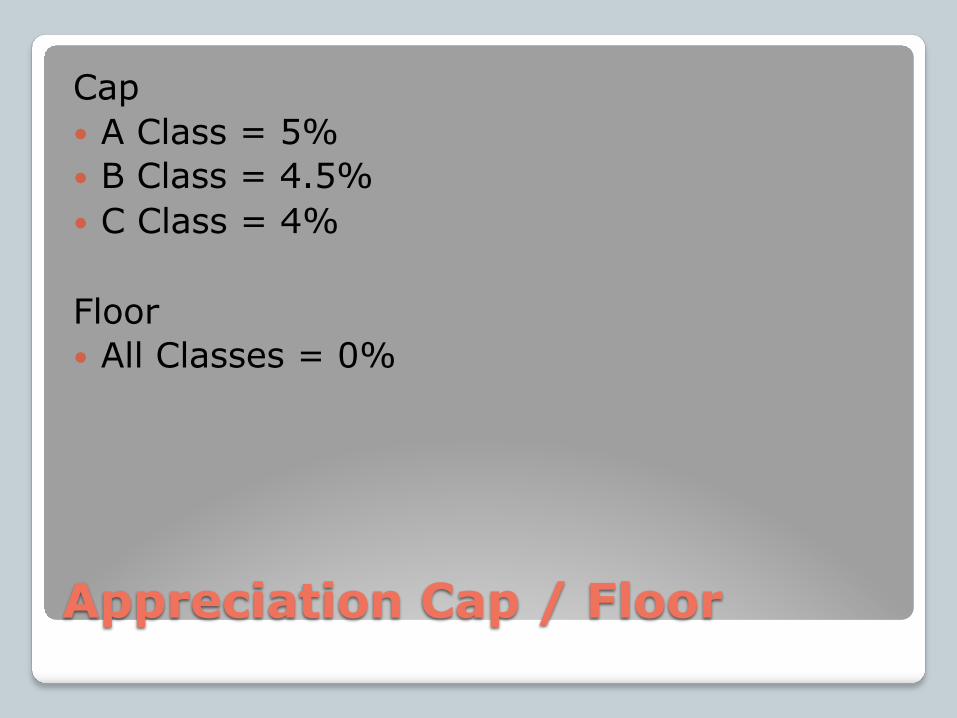
Appreciation Cap / Floor
Cap � A Class = 5% � B Class = 4.5% � C Class = 4%
Floor � All Classes = 0%
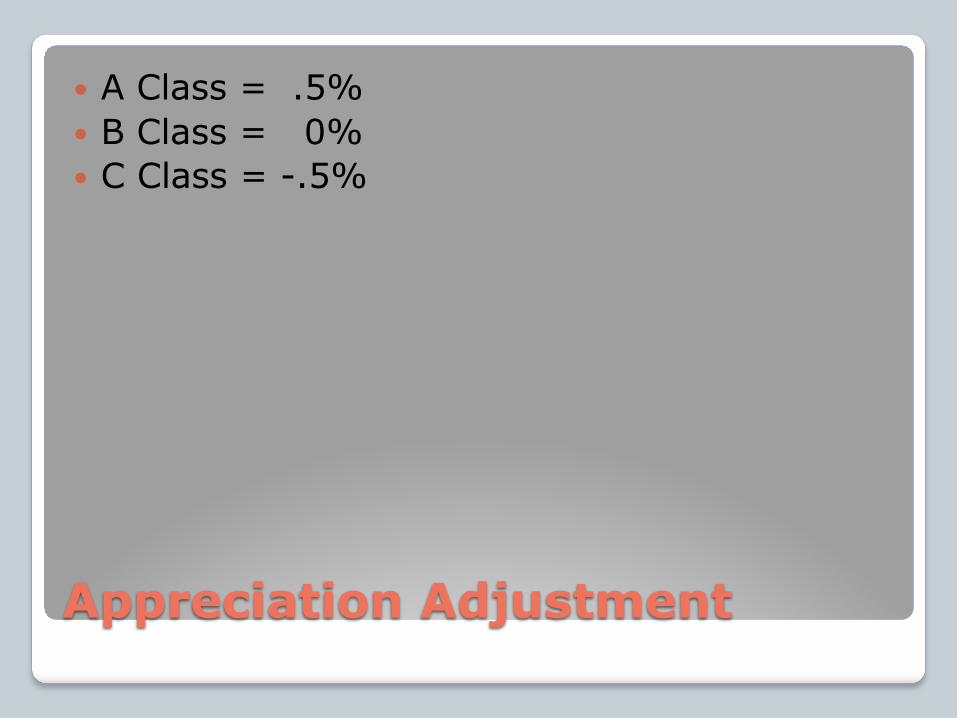
Appreciation Adjustment
� A Class = .5% � B Class = 0% � C Class = -.5%

Knowing What’s Important
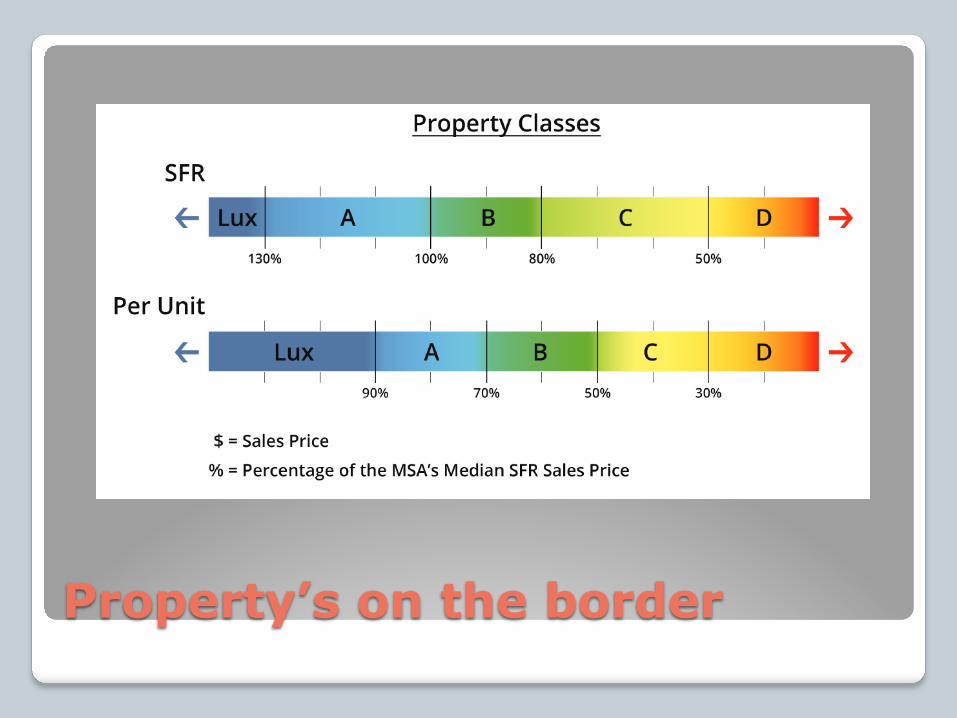
Property’s on the border
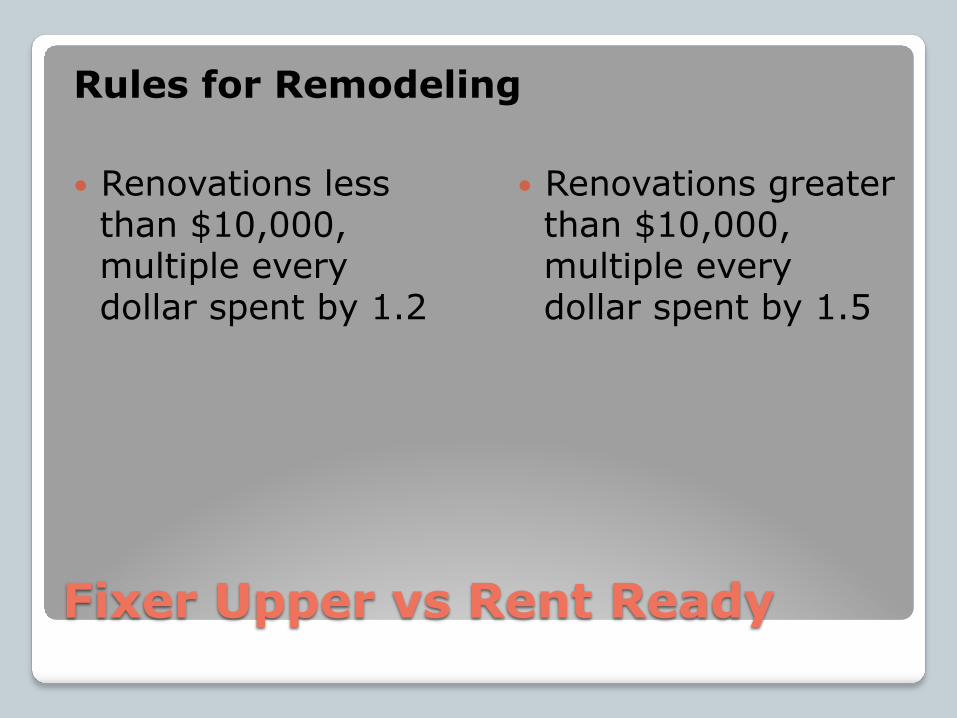
Fixer Upper vs Rent Ready
� Renovations less than $10,000, multiple every dollar spent by 1.2
� Renovations greater than $10,000, multiple every dollar spent by 1.5
Rules for Remodeling
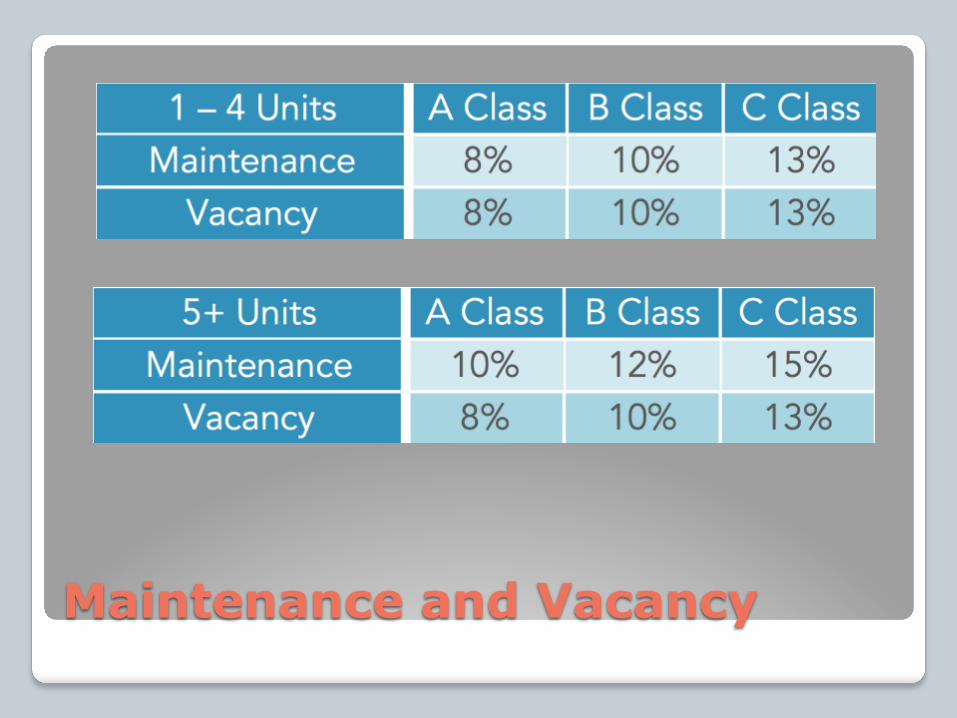
Maintenance and Vacancy

Vacancy Example
A Class 365 days a year x 8% = 29.2 days a year

New Construction Maintenance

Maintenance Example
A Class Monthly Gross Rent x 5% = Monthly Maintenance Cost $1,250 x 5% = $62.50 per month

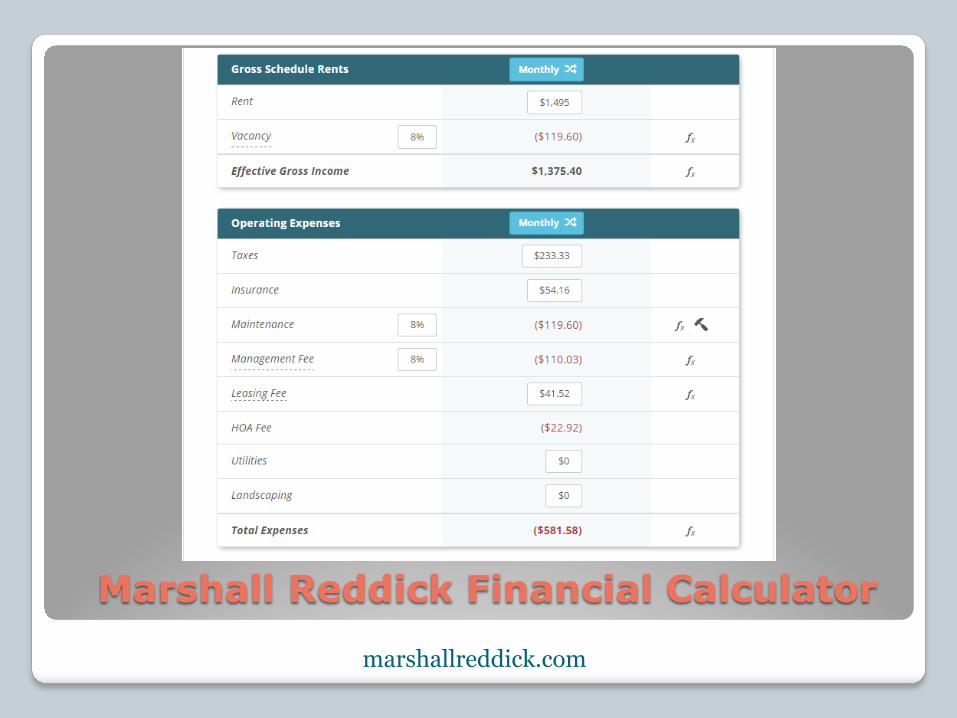
Marshall Reddick Financial Calculator
marshallreddick.com
Marshall Reddick Financial Calculator
marshallreddick.com

Marshall Reddick Financial Calculator
marshallreddick.com
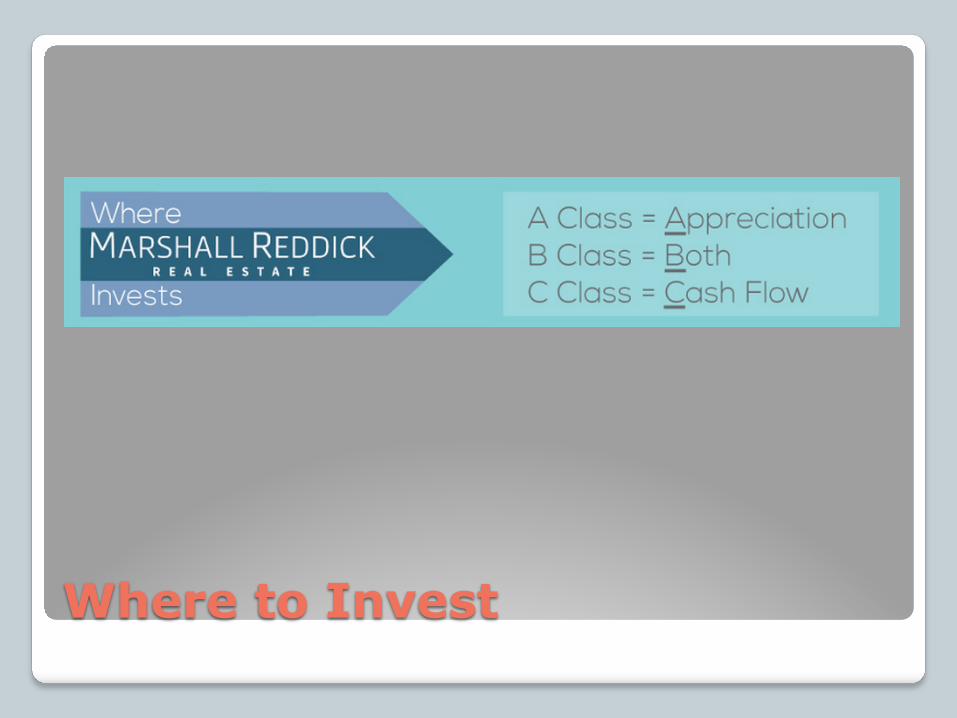
Where to Invest

Property Classes

Cash on Cash vs Return on Investment
Average Class Cash-on-Cash Annual ROI
A 3.55 19.61 B 3.98 18.19 C 4.39 16.60
Median Class Cash-on-Cash Annual ROI
A 3.22 19.83 B 3.47 18.08 C 5.32 16.03
(using Conventional Financing)

What Property Class is for you?

How do you mathematically measure the success of each
investment?
Appreciation: Highest Return-on-Investment
Cash Flow: Highest Cash-on-Cash Return

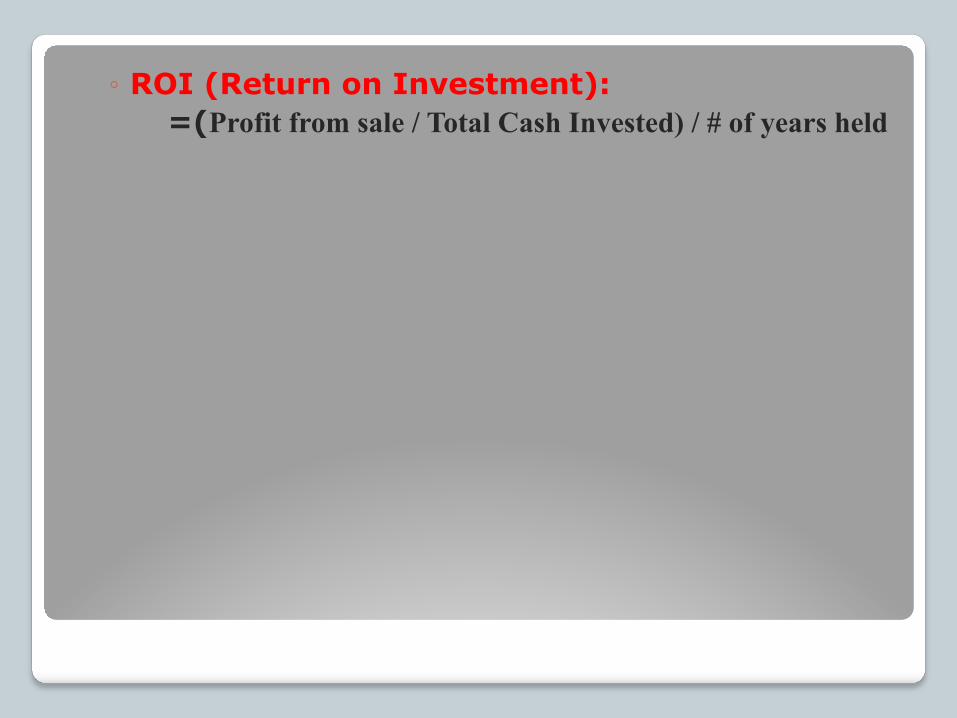
◦ ROI (Return on Investment): =(Profit from sale / Total Cash Invested) / # of years held
Marshall Reddick Website

◦ ROI (Return on Investment): =(Profit from sale / Total Cash Invested) / # of years held
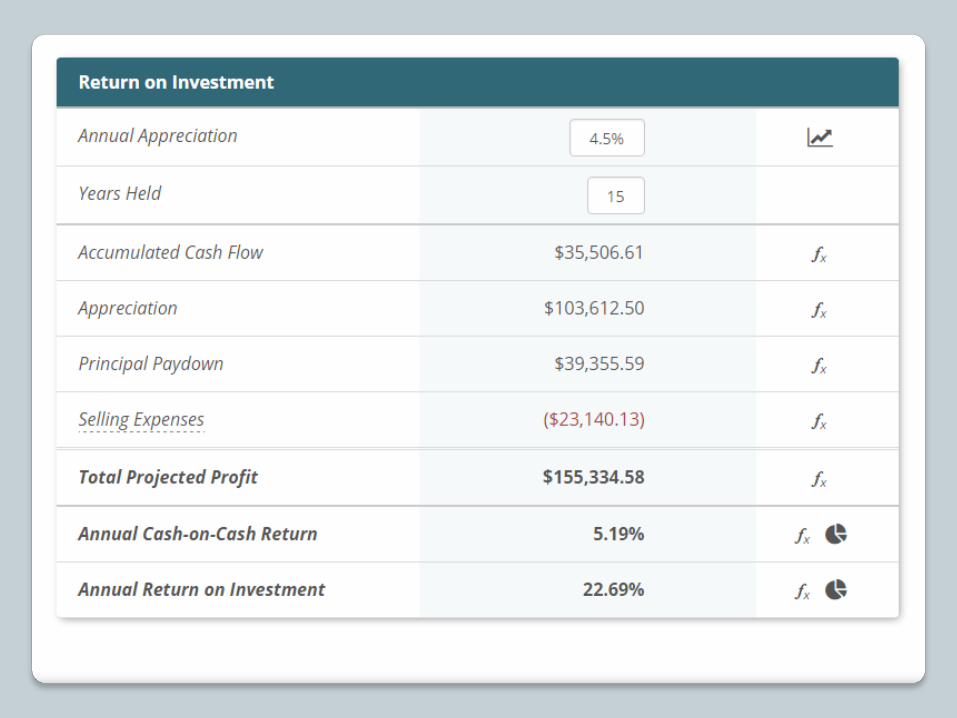
+ accumulated net cash flow $35,506.61 + equity from principle paydown $39,355.59 + equity from appreciation $103,612.50 - Selling expenses (typically 9%) ($23,140.13) = Profit from sale $155,334.58

◦ ROI (Return on Investment): =(Profit from sale / Total Cash Invested) / # of years held
+ accumulated net cash flow $35,506.61 + equity from principle paydown $39,355.59 + equity from appreciation $103,612.50 - Selling expenses (typically 9%) ($23,140.13) = Profit from sale $155,334.58
=(Profit from sale / Total Cash Invested) / # of years held $155,334.58 $45,631.25 15
ROI= 22.69%


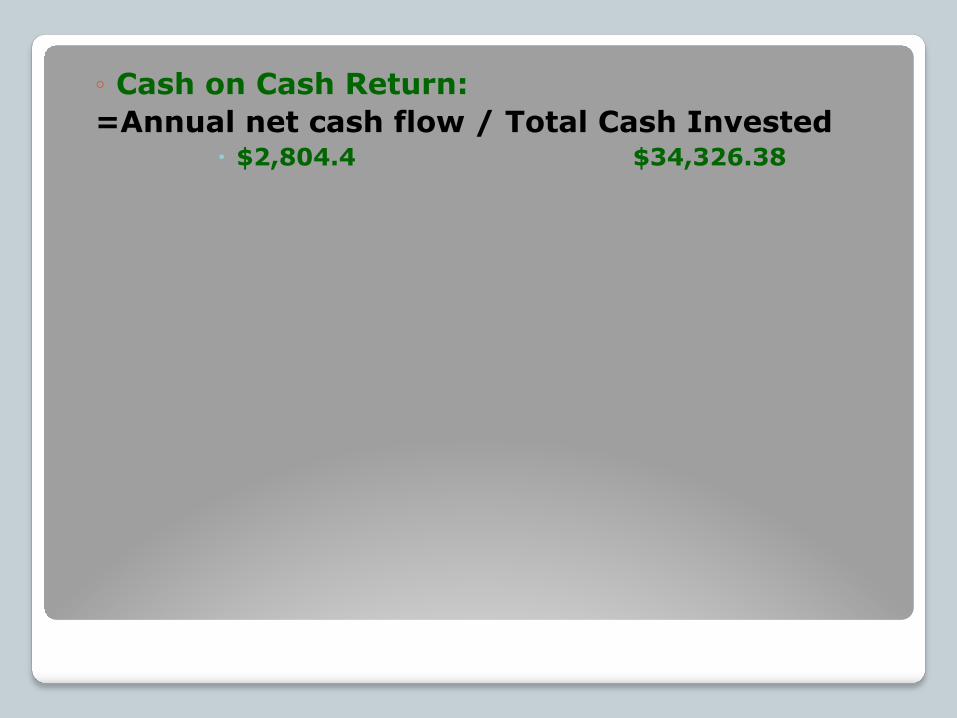
◦ Cash on Cash Return: =Annual net cash flow / Total Cash Invested
◦ Cash on Cash Return: =Annual net cash flow / Total Cash Invested
� $2,804.4 $34,326.38

Cash-on-Return: 8.16%
◦ Cash on Cash Return: =Annual net cash flow / Total Cash Invested
� $2,804.4 $34,326.38

42

Chris'n Tabar Real Estate Advisor/Realtor Phone: (949) 885-‐5162 Email: [email protected]
Sign up now for a complementary consultation!