red door interactive: contribution-attribution-mix, oh my! creating content for your customers
TRANSCRIPT
@APBATTEN
ANDY BATTENDIRECTOR, ANALYTICS & OPTIMIZATION
Contribution, Attribution,Mix, Oh My!

@APBATTEN
What is attribution? The process in which the value or credit for conversions is allocated across marketing touchpoints.
To best optimize spend across channels, we must first capture the relationshipsbetween channels and touchpoints, and quantify the impact of each.
Why it matters
+1
?
?
@APBATTEN
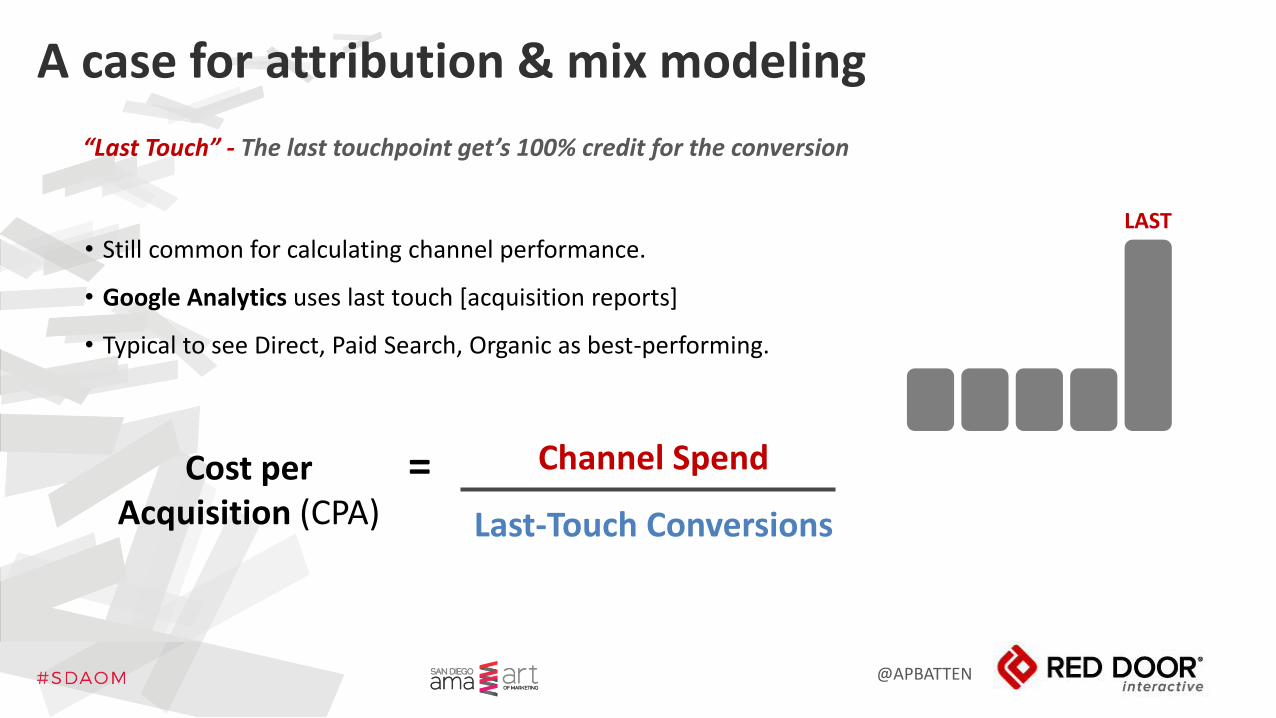
A case for attribution & mix modeling
“Last Touch” - The last touchpoint get’s 100% credit for the conversion
• Still common for calculating channel performance.
• Google Analytics uses last touch [acquisition reports]
• Typical to see Direct, Paid Search, Organic as best-performing.
Channel Spend
Last-Touch Conversions
Cost per Acquisition (CPA)
=
LAST
@APBATTEN
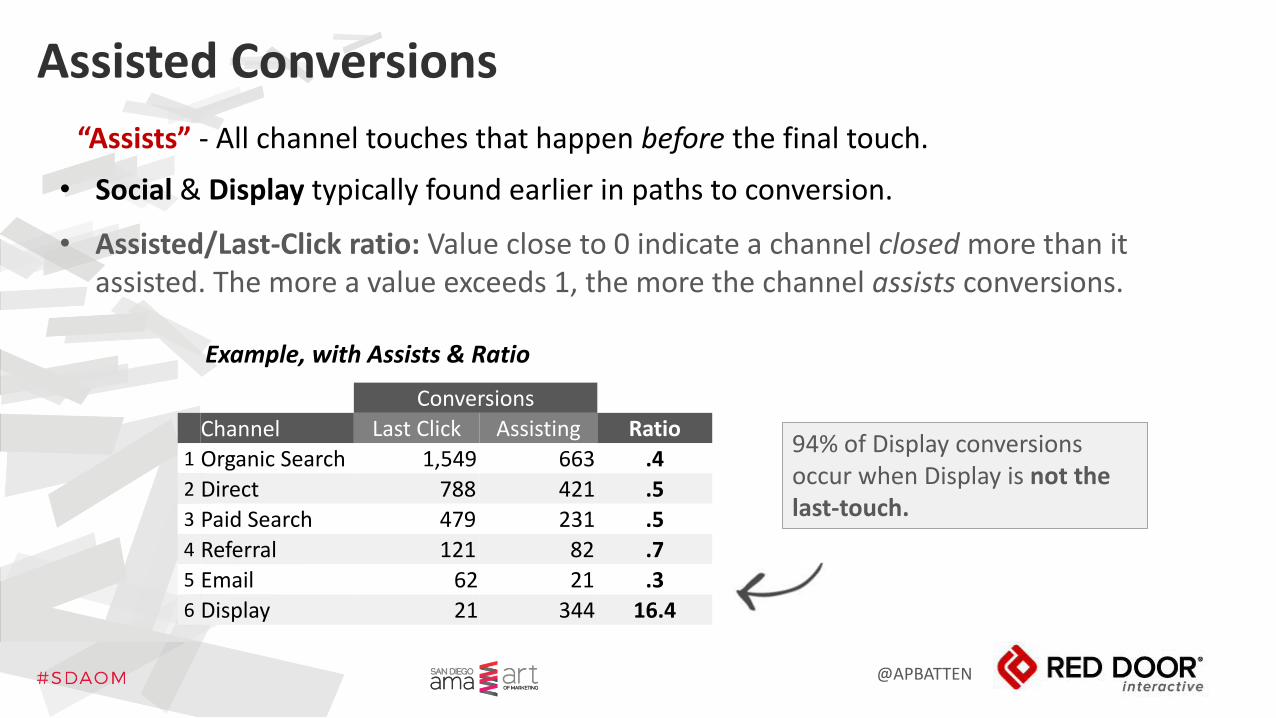
Assisted Conversions
• Social & Display typically found earlier in paths to conversion.
• Assisted/Last-Click ratio: Value close to 0 indicate a channel closed more than it assisted. The more a value exceeds 1, the more the channel assists conversions.
94% of Display conversions occur when Display is not the last-touch.
Example, with Assists & Ratio
“Assists” - All channel touches that happen before the final touch.
Conversions
Channel Last Click Assisting Ratio1 Organic Search 1,549 663 .42 Direct 788 421 .53 Paid Search 479 231 .54 Referral 121 82 .75 Email 62 21 .36 Display 21 344 16.4
@APBATTEN
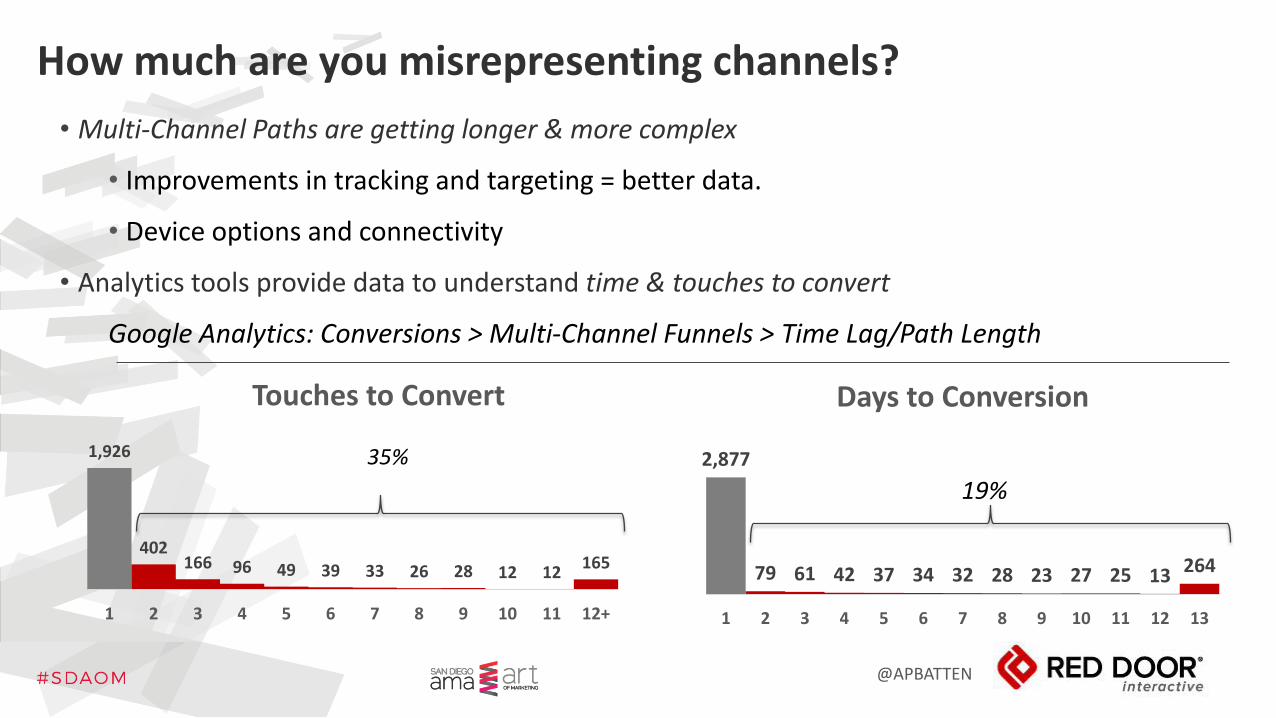
How much are you misrepresenting channels?
• Multi-Channel Paths are getting longer & more complex
• Improvements in tracking and targeting = better data.
• Device options and connectivity
• Analytics tools provide data to understand time & touches to convert
Google Analytics: Conversions > Multi-Channel Funnels > Time Lag/Path Length
1,926
402166 96 49 39 33 26 28 12 12
165
1 2 3 4 5 6 7 8 9 10 11 12+
Touches to Convert
2,877
79 61 42 37 34 32 28 23 27 25 13 264
1 2 3 4 5 6 7 8 9 10 11 12 13
Days to Conversion
35%
19%
@APBATTEN
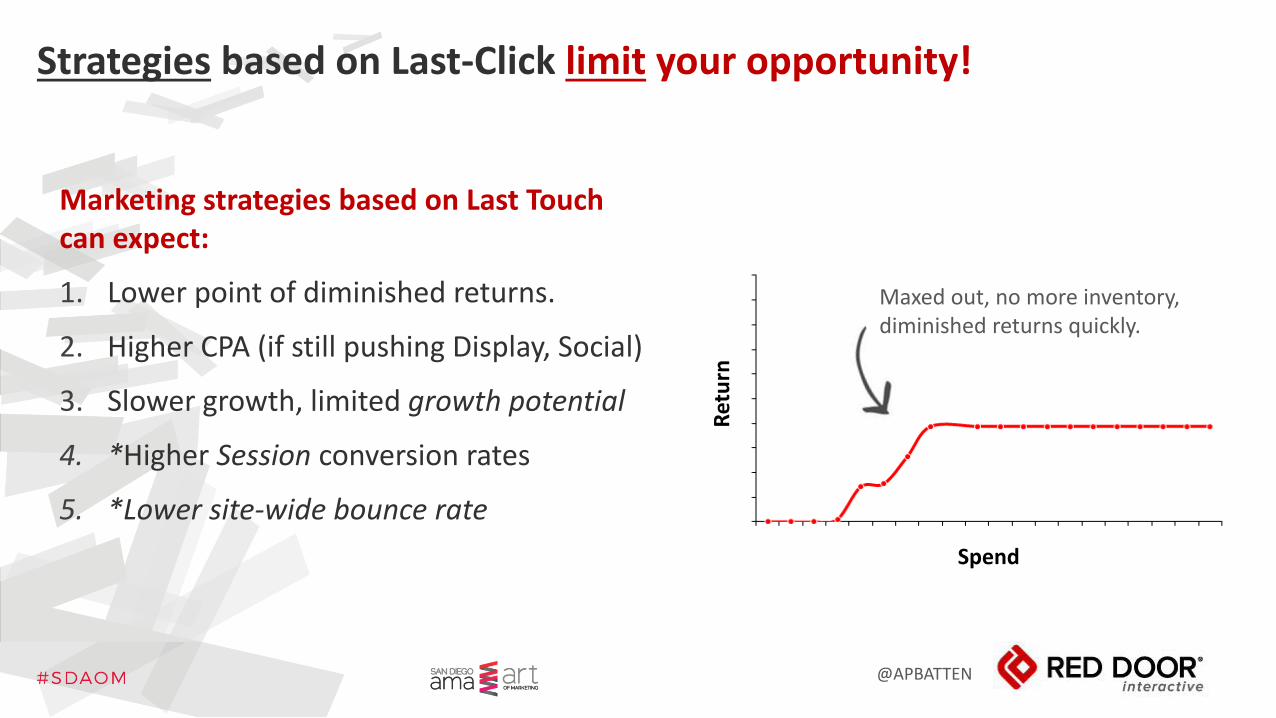
Strategies based on Last-Click limit your opportunity!
Marketing strategies based on Last Touch can expect:
1. Lower point of diminished returns.
2. Higher CPA (if still pushing Display, Social)
3. Slower growth, limited growth potential
4. *Higher Session conversion rates
5. *Lower site-wide bounce rate
Maxed out, no more inventory, diminished returns quickly.
Spend
Ret
urn
@APBATTEN
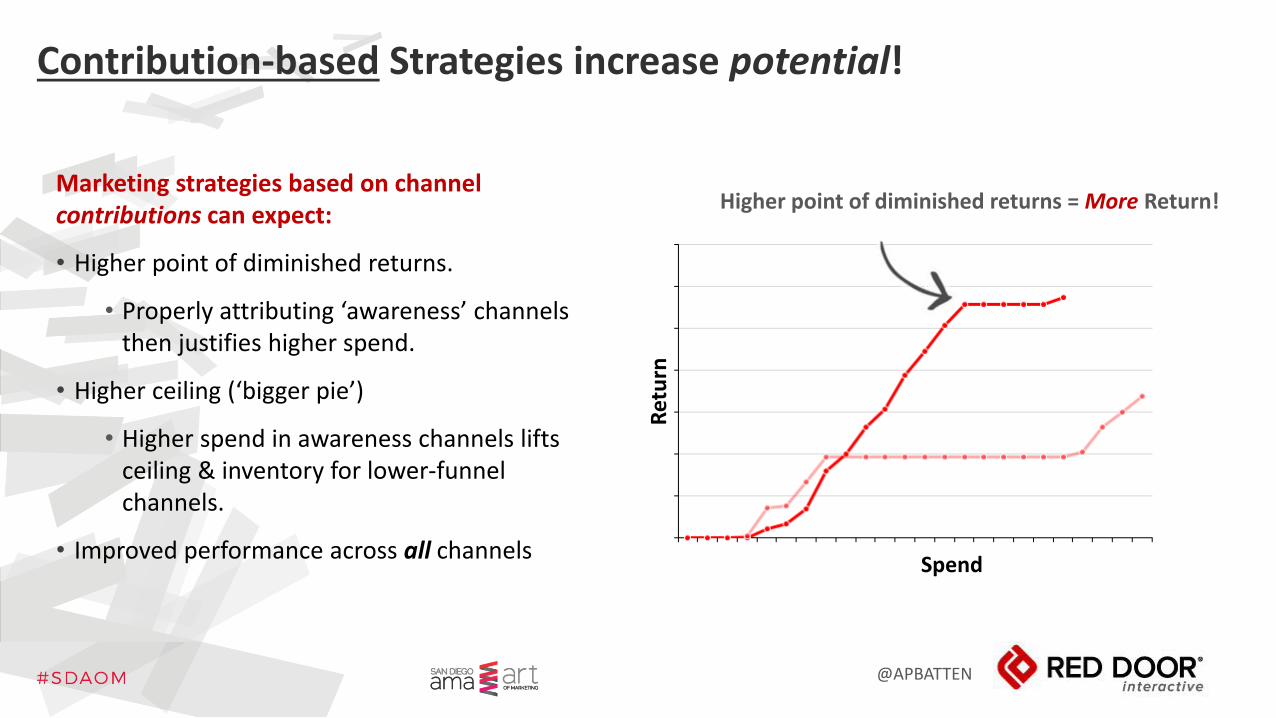
Contribution-based Strategies increase potential!
Marketing strategies based on channel contributions can expect:
• Higher point of diminished returns.
• Properly attributing ‘awareness’ channels then justifies higher spend.
• Higher ceiling (‘bigger pie’)
• Higher spend in awareness channels lifts ceiling & inventory for lower-funnel channels.
• Improved performance across all channelsSpend
Ret
urn
Higher point of diminished returns = More Return!

@APBATTEN
A new, linear approach[…courtesy of Red Door Interactive]
1. Contribution & Participation
2. Attribution
(assign credit, test approaches)
3. Marketing Mix Modeling
@APBATTEN
Understanding Channel Contribution
Which channels participate in paths to conversion?
1. Collect
2. Correlate

@APBATTEN
The foundation of accurate attribution and a profitable [+ predictive] mix model is correct and comprehensive data.
Collecting Good Data
Garbage
Garbage
Garbage
Garbage
• Cross Browser / Cross-Device• Capture Login ID [and push to Analytics platform]• Capture User ID in email destination paths.• Vanity URLs
• Offline Behaviors – CRM Integration, Data Upload• Cookie rejection – Use 1st Party Cookies• Untagged Campaigns – Turn on auto-tagging• Sales/CRM Practices – Promote benefit of accurate data to Sales • Campaign Stacking – ensure that the full sequence of interactions
are captured in some form
@APBATTEN
After good data, the next step towards attribution is understanding channel relationships and participation in conversion paths.
Interactions & Correlations
Techniques:
• Correlation Matrix
• ‘Participation’ Modeling
• Assists / Last Touch Analysis

@APBATTEN
Correlation matrix• First vs. Last, Assist vs. Last• Incremental Conversion Rate Lift• Watch for statistical significance
Techniques to Understand Interaction & Correlation
Campaign Stacking/ Channel Pathing• Delimited list of all ordered touches, to leverage
in analyzing data offline.
Participation /Assist vs. Last-Click Report
Social Paid Search Organic Referral
Social 0.90% 1.79% 1.25% 1.27%
Paid Search 1.27% 1.23% 1.72% 1.41%
Organic 1.38% 1.16% 1.26% 1.06%
Referral 1.11% 1.31% 1.65% 1.16%
Bing / cpc CLICK->yahoo / organic CLICKgoogle / display CLICK->google / display CLICK->google / display CLICKgoogle / display CLICK->Bing / cpc CLICK->google / display CLICKReferral CLICK->google / cpc CLICKgoogle / organic CLICK
ConversionsChannel Last Assisting Ratio
1 Organic 1,549 663 .42 Direct 788 421 .53 Paid 479 231 .54 Referral 121 82 .75 Email 62 21 .36 Display 21 344 16.4
@APBATTEN
Attribution“who get’s credit?”
How are my channels performing & interacting at current spend levels?

@APBATTEN
Common Attribution Models
“First Touch” - The First Interaction gets all credit.
• First-touch models are most impacted by cookie-deletion and cross-device behaviors
• First touch is not recommend for most analysis and Media optimization.
“Linear” - Credit divided evenly across all touches.
• Can dilute the value of the conversion, requiring higher volume for useful analysis.
• Makes no attempt to quantify the value of specific touches at specific lifecycle stages.
FIRST
EQUAL
@APBATTEN
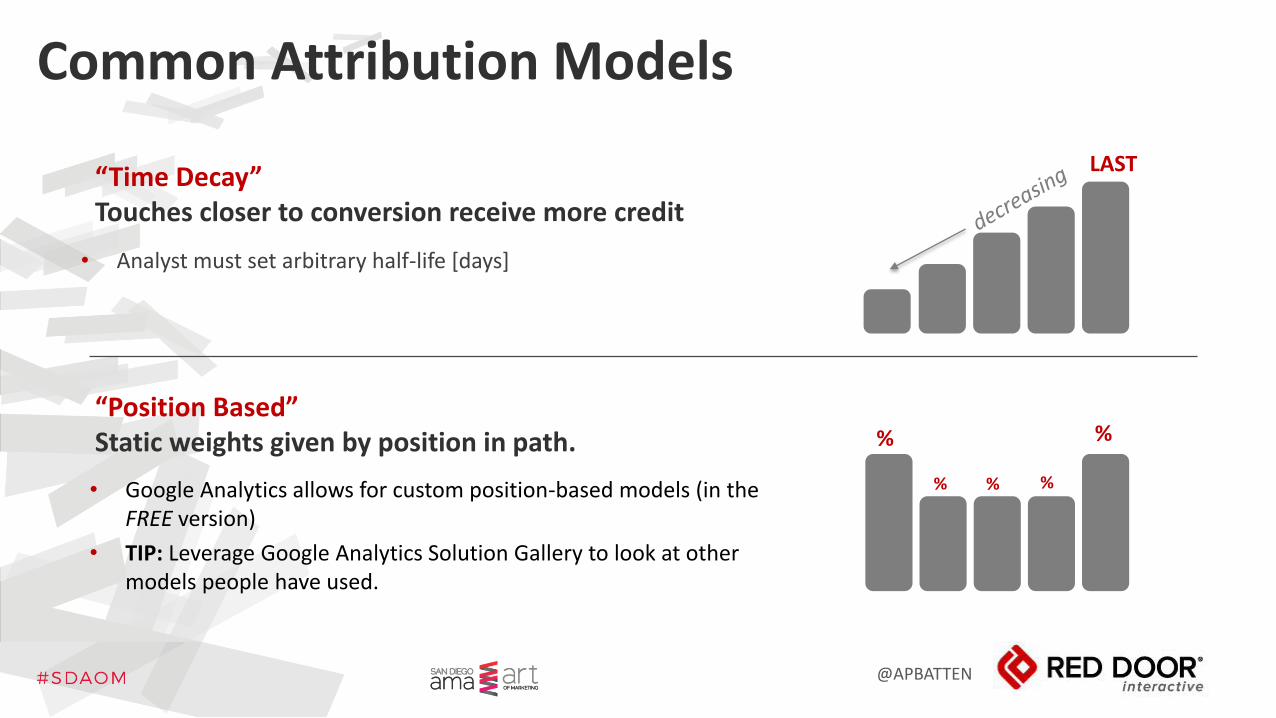
Common Attribution Models
“Time Decay”Touches closer to conversion receive more credit
• Analyst must set arbitrary half-life [days]
“Position Based”Static weights given by position in path.
LAST
%%
% % %• Google Analytics allows for custom position-based models (in the FREE version)
• TIP: Leverage Google Analytics Solution Gallery to look at other models people have used.
@APBATTEN
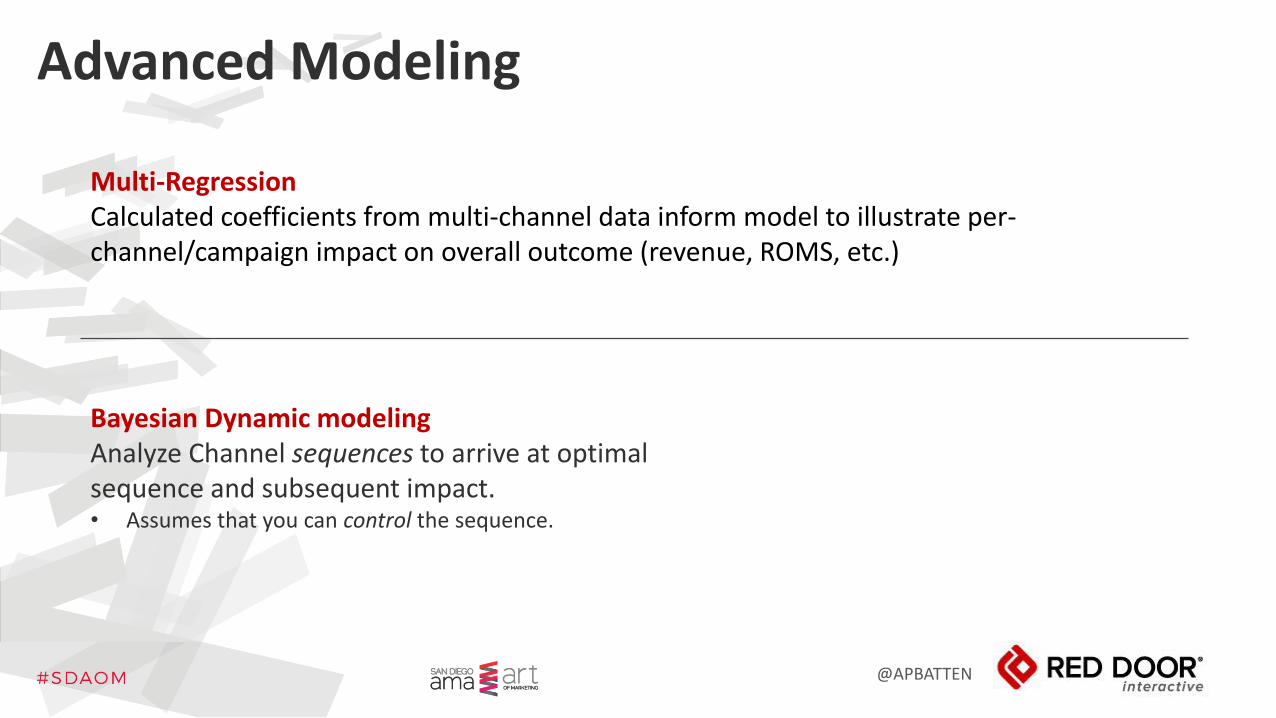
Advanced Modeling
Multi-RegressionCalculated coefficients from multi-channel data inform model to illustrate per-channel/campaign impact on overall outcome (revenue, ROMS, etc.)
Bayesian Dynamic modelingAnalyze Channel sequences to arrive at optimal sequence and subsequent impact.• Assumes that you can control the sequence.

@APBATTEN
What about SEO?
@APBATTEN
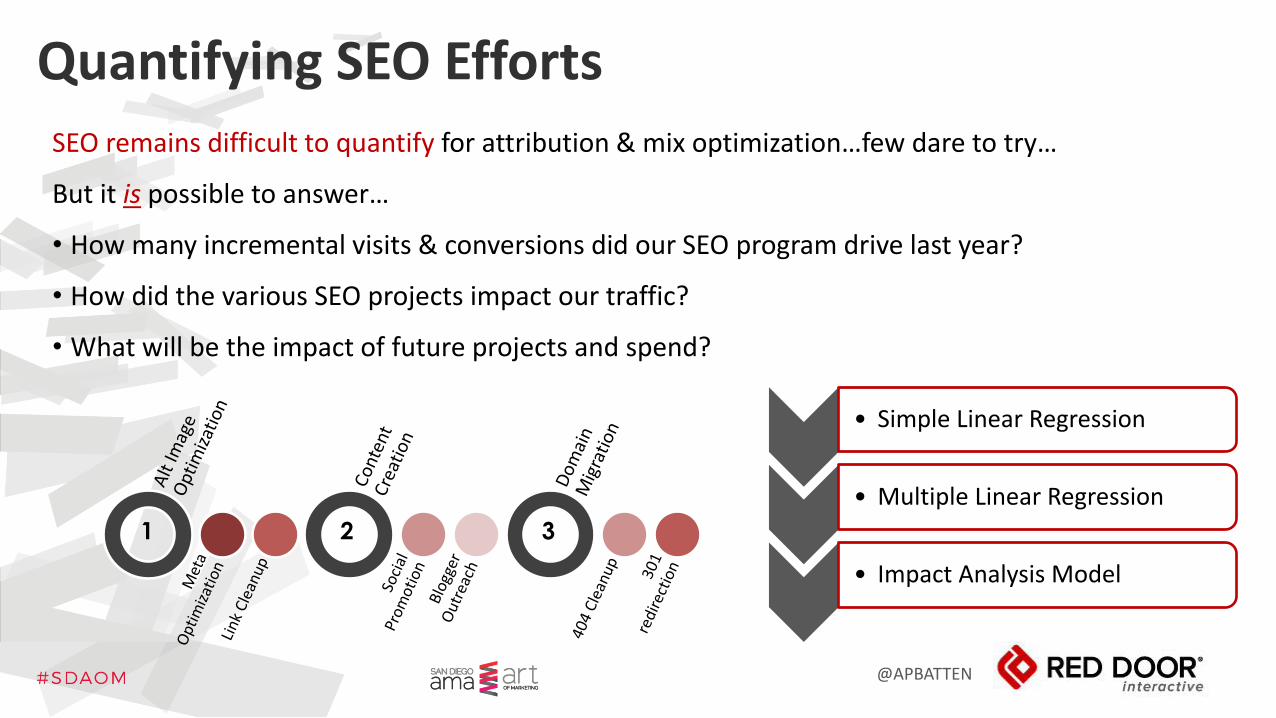
Quantifying SEO EffortsSEO remains difficult to quantify for attribution & mix optimization…few dare to try…
But it is possible to answer…
• How many incremental visits & conversions did our SEO program drive last year?
• How did the various SEO projects impact our traffic?
• What will be the impact of future projects and spend?
1 2 3
• Simple Linear Regression
• Multiple Linear Regression
• Impact Analysis Model
@APBATTEN
Marketing Mix Modeling (MMM)
What are my optimal spend levels per channel*?
*…and with changing marketing budget!

@APBATTEN
The Attribution ‘ROI’ ProblemWhat’s wrong with using ROI %?
• An ROI% calculation, by it’s nature, is a ‘point in time’ calculation.• Best used for comparing performance of 2 or more similar efforts with similar spend• Does not fully account for diminishing returns, and the differing and the different points of
diminishing returns per channel/tactic.
120%
105%
ROI? ROI? ROI? ROI? ROI? ROI? ROI?
@APBATTEN
Diminishing Returns & Econometric Modeling
Spend allocation can be determined, & expected outcomes modeled, using comprehensive diminishing returns analysis.
@APBATTEN
Calculate Diminishing Returns to Create MMM
•Based on incremental return, and net return to your entire program
•Critical that all channels are trended together
•Conventional Wisdom: “Maximize up to diminishing returns, then ‘stop’”..
But…
•Analysis inclusive of all channels will indicate when you should spend past the point of diminished returns.

@APBATTEN
SAMPLE: Diminishing Returns
Investment (Spend Levels)
Ret
urn
@APBATTEN
Econometric Modeling
While diminishing returns analysis is calculated on time-series data, and is a valid method to evaluate and set allocations…
…Advanced Econometric Modeling aims to separately predict both short & long-term performance per channel, and account for changes in customer demand base and other economic factors.
• For example: Price reduction promotions and direct response campaigns have high incremental revenue, but do nothing to lift long-term customer base.
Model Examples:
• Vector Auto Regression
• Demand Forecasting
@APBATTEN
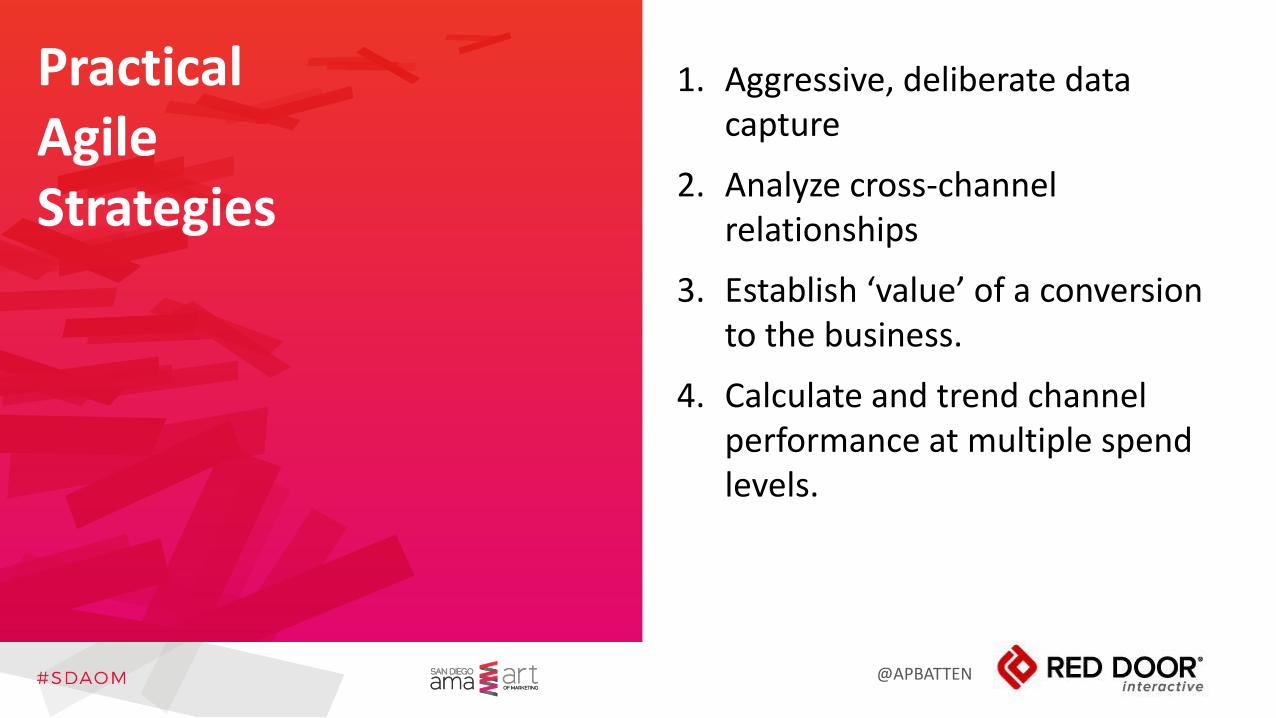
PracticalAgileStrategies
1. Aggressive, deliberate data capture
2. Analyze cross-channel relationships
3. Establish ‘value’ of a conversion to the business.
4. Calculate and trend channel performance at multiple spend levels.
@APBATTEN
QUESTIONS?
Thank You
Andy BattenDirector, Digital Analytics & OptimizationRed Door [email protected]