red bank school district - new jersey · expenditures of state financial assistance required by new...
TRANSCRIPT

COMPREHENSIVE ANNUAL FINANCIAL REPORT
County of Monmouth
Red Bank, New Jersey
RED BANK SCHOOL DISTRICT
FOR THE FISCAL YEAR ENDED JUNE 30, 2014


PAGE
Letter of Transmittal 1Organizational Chart 2Roster of Officials 3Consultants and Advisors 4
Independent Auditor's Report 7
REQUIRED SUPPLEMENTARY INFORMATION - PART I
Management's Discussion & Analysis 13
BASIC FINANCIAL STATEMENTS
A. District-Wide Financial Statements:A-1 Statement of Net Position 29A-2 Statement of Activities 30
B. Fund Financial Statements:Governmental Funds:
B-1 Balance Sheet 37B-2 Statement of Revenues, Expenditures & Changes in Fund Balance 38B-3 Reconciliation of the Statement of Revenues, Expenditures & Changes in Fund 39
Balance of Governmental Funds to the Statement of ActivitiesProprietary Funds:
B-4 Statement of Net Position 43B-5 Statement of Revenues, Expenditures & Changes in Fund Net Position 44B-6 Statement of Cash Flows 45
Fiduciary Funds:B-7 Statement of Fiduciary Net Position 49B-8 Statement of Changes in Fiduciary Net Position N/A
Notes to Financial Statements 53
REQUIRED SUPPLEMENTARY INFORMATION - PART II
C. Budgetary Comparison Schedules:C-1 Budgetary Comparison Schedule - General Fund 79C-1a Combining Schedule of Revenue, Expenditures & Changes in Fund Balance -
Budget & Actual N/AC-1b Education Jobs Fund Program - Budget & Actual N/AC-2 Budgetary Comparison Schedule - Special Revenue Fund 87
Notes to the Required Supplementary Information:C-3 Budget-to-GAAP Reconciliation 91
TABLE OF CONTENTS
INTRODUCTORY SECTION
FINANCIAL SECTION

PAGE
TABLE OF CONTENTS
D. School Based Budget Schedules Fund:D-1 Combining Balance Sheet N/AD-2 Blended Resource Fund - Schedule of Expenditures Allocated by Resource
Type - Actual N/AD-3 Blended Resource Fund - Schedule of Blended Expenditures - Budget & Actual N/A
E. Special Revenue Fund:E-1 Combining Schedule of Revenues & Expenditures - Special Revenue Fund -
Budgetary Basis 99E-2 Preschool Education Aid Schedule(s) of Expenditures - Budgetary Basis 103
F. Capital Projects Fund:F-1 Summary Statement of Project Expenditures 107F-2 Summary Schedule of Revenues, Expenditures and Changes in Fund Balance -
Budgetary Basis 108F-2a Schedule of Revenues, Expenditures, Project Balance & Project Status -
Budgetary Basis 109F-2bSchedule of Revenues, Expenditures, Project Balance & Project Status -
Budgetary Basis 110
G. Proprietary Funds:Enterprise Funds:
G-1 Combining Statement of Net Position 115G-2 Combining Statement of Revenues, Expenses & Changes in Fund Net Position 116G-3 Combining Statement of Cash Flows 117
Internal Service Funds:G-4 Combining Statement of Net Position N/AG-5 Combining Statement of Revenues, Expenses & Changes in Fund Net Position N/AG-6 Combining Statement of Cash Flows N/A
H. Fiduciary Funds:H-1 Combining Statement of Fiduciary Net Position 121H-2 Combining Statement of Changes in Fiduciary Net Position N/AH-3 Student Activity Agency Fund Schedule of Receipts & Disbursements 122H-4 Payroll Agency Fund Schedule of Receipts & Disbursements 123
I. Long-Term Debt:I-1 Schedule of Serial Bonds 127I-2 Schedule of Obligations Under Capital Leases N/AI-3 Debt Service Fund Budgetary Comparison Schedule 128I-4 Statement of Loans Payable - N.J.E.D.A. 129
Financial Trends:J-1 Net Position by Component 133J-2 Changes in Net Position 134J-3 Fund Balances - Governmental Funds 136J-4 Changes in Fund Balance - Governmental Funds 137J-5 Other Local Revenue by Source - General Fund 138
STATISTICAL SECTION (unaudited)

PAGE
TABLE OF CONTENTS
Revenue Capacity:J-6 Assessed Value & Estimated Actual Value of Taxable Property 139J-7 Direct & Overlapping Property Tax Rates 140J-8 Principal Property Taxpayers 141J-9 Property Tax Levies & Collections 142
Debt Capacity:J-10 Ratios of Outstanding Debt by Type 143J-11 Ratios of General Bonded Debt Outstanding 144J-12 Direct & Overlapping Governmental Activities Debt 145J-13 Legal Debt Margin Information 146
Demographic & Economic Information:J-14 Demographic & Economic Statistics 147J-15 Principal Employers 148
Operating Information:J-16 Full-Time Equivalent District Employees by Function/Program 149J-17 Operating Statistics 150J-18 School Building Information 151J-19 Schedule of Required Maintenance 152J-20 Insurance Schedule 153
K-1 Independent Auditors' Report on Compliance and on Internal Control Over Financial Reporting and Other Matters Based on an Audit of Financial Statements Performed in Accordance with Government Auditing Standards 157
K-2 Independent Auditors' Report on Compliance for Each Major State Program; Report on Internal Control Over Compliance; and Report on the Schedule of Expenditures of State Financial Assistance Required by New Jersey OMB Circular 04-04 159
K-3 Schedule of Expenditures of Federal Awards, Schedule A 162K-4 Schedule of Expenditures of State Financial Assistance, Schedule B 163K-5 Notes to Schedules of Awards and Financial Assistance 165K-6 Schedule of Findings & Questioned Costs 167K-7 Summary Schedule of Prior Audit Findings 170
SINGLE AUDIT SECTION


INTRODUCTORY SECTION

This page intentionally left blank.

1

2013
-201
4 O
RG
AN
IZA
TIO
NA
L C
HA
RT
.. l
l P
rim
ary
Sch
ool
Mid
dle
Sch
ool
Prin
cipa
l P
rinci
pal
+
+
Prim
ary
Sch
ool V
ice
Mid
dle
Sch
ool
Pri
ncip
al/S
uper
viso
r V
ice
Pri
ncip
al/
of
Med
ia
ES
UB
iling
uai/W
orld
S
uper
viso
r La
ngua
ges
Pro
gram
s t
t P
re-K
-Gra
de 3
G
rad
es4
-8
Tea
cher
s T
each
ers
t +
C
ertif
ied
Cer
tifie
d S
uppo
rt S
taff
S
uppo
rt S
taff
l l
Inst
ruct
iona
l In
stru
ctio
nal
Ass
ista
nts
Ass
ista
nts
J. J.
Non
-Ins
truc
tiona
l N
on-
Per
sonn
el
Inst
ruct
iona
l P
erso
nnel
wv•
··
OF
FIC
E O
F T
HE
SU
PE
RIN
TE
ND
EN
T
RE
D B
AN
K P
UB
LIC
SC
HO
OLS
R
ED
BA
NK
, N
EW
JE
RS
EY
Boa
rd o
f Edu
catio
n
t Sup~rintendent o
f Sch
ools
~
• S
uper
viso
r of
Sup
ervi
sor
of
Cur
ricul
um &
Inst
ruct
ion
Spe
cial
Edu
catio
n
+
+
Vis
ual T
ech
no
log
y S
peci
al E
duca
tion
Co
ord
ina
tor
Ma
ste
r Te
ach
er/
D
istr
ict S
yste
ms
Coa
ch
Tec
hnic
ian/
Web
mas
ter
t ~
Sec
reta
ry to
th
e
Chi
ld S
tud
y T
eam
S
uper
inte
nden
t
t +
S
ecre
tary
to t
he
S
ecre
tary
to t
he
Sup
ervi
sors
C
hild
Stu
dy
Te
am
/ T
echn
olog
y
•
l()J
.•
t S
uper
viso
r of
Pre
K
Pro
gram
s
! P
re-K
T
each
ers
+
Inst
ruct
iona
l A
ssis
tant
s
+
Non
-In
stru
ctio
nal
Per
sonn
el
I Spe
cial
Edu
catio
n I
Tea
cher
s l
Inst
ruct
iona
l A
ssis
tant
s
t ...
Bus
ines
s A
dm
inis
tra
tor/
B
oard
Sec
reta
ry
+
Bus
ines
s O
ffic
e D
ire
cto
r of
Fac
ilitie
s
t A
ssis
tan
t D
irec
tor
of F
acili
ties
+
Mai
nten
ance
C
usto
dian
s
2

MEMBERS OF THE BOARD OF EDUCATION
Ben Forest, President 2016
Carrie Ludwikowski, Vice President 2015
Marjorie Lowe 2016
Suzanne Viscomi 2016
Janet Jones 2014
Peter Noble 2014
Jill Burden 2014
Ann Roseman 2015
Fred Stone 2015
OTHER OFFICIALS
Harold Reid, Interim Superintendent of Schools
Debra Pappagallo, Business Administrator/Board Secretary
Frank Mason, Treasurer of School Monies
Richard McOmber, Esq., Board Attorney
TERM EXPIRES
RED BANK BOARD OF EDUCATIONRED BANK, NEW JERSEY
ROSTER OF OFFICIALS
June 30, 2014
3

912 Highway 33, Suite 2
RED BANK BOARD OF EDUCATIONRED BANK, NEW JERSEY
CONSULTANTS AND ADVISORS
AUDITOR/AUDIT FIRM
Robert W. Allison, CPA, RMAHolman Frenia Allison, P. C.
June 30, 2014
Red Bank, New Jersey 07701
OFFICIAL DEPOSITORIES
PNC Bank (primary depository)
State of New Jersey Cash Management Fund
Bank of New YorkBank of America
TD BankJP Morgan Chase
BOND & SPECIAL COUNSEL
Philip A. Norcross, Esq.Parker, McCay & Crisuolo, P.A.
Route 73 and Greentree RoadMarlton, New Jersey 08053
Three Greentree Centre
Freehold, New Jersey 07728
ATTORNEY
Richard McOmber, Esq.McOmber & McOmber54 Shrewsbury Avenue
4

FINANCIAL SECTION
5

This page intentionally left blank.
6

INDEPENDENT AUDITOR’S REPORT Honorable President and Members of the Board of Education Red Bank School District Red Bank, New Jersey Report on the Financial Statements We have audited the accompanying financial statements of the governmental activities, the business-type activities, each major fund and the aggregate remaining fund information of the Red Bank School District, County of Monmouth, State of New Jersey, as of and for the fiscal year ended June 30, 2014, and the related notes to the financial statements, which collectively comprise the District’s basic financial statements as listed in the table of contents. Management’s Responsibility for the Financial Statements Management is responsible for the preparation and fair presentation of these financial statements in accordance with accounting principles generally accepted in the United States of America; this includes the design, implementation, and maintenance of internal control relevant to the preparation and fair presentation of financial statements that are free from material misstatement, whether due to fraud or error. Auditor’s Responsibility Our responsibility is to express opinions on these financial statements based on our audit. We conducted our audit in accordance with auditing standards generally accepted in the United States of America; the standards applicable to financial audits contained in Governmental Auditing Standards, issued by the Comptroller General of the United States; and audit requirements as prescribed by the Office of School Finance, Department of Education, State of New Jersey. Those standards require that we plan and perform the audit to obtain reasonable assurance about whether the financial statements are free from material misstatement. An audit involves performing procedures to obtain audit evidence about the amounts and disclosures in the financial statements. The procedures selected depend on the auditor’s judgment, including the assessment of the risks of material misstatement of the financial statements, whether due to fraud or error. In making those risk assessments, the auditor considers internal control relevant to the District’s preparation and fair presentation of the financial statements in order to design audit procedures that are appropriate in the circumstances, but not for the purpose of expressing an opinion on the effectiveness of the District’s internal control. Accordingly, we express no such opinion. An audit also includes evaluating the appropriateness of accounting policies used and the reasonableness of significant accounting estimates made by management, as well as evaluating the overall presentation of the financial statements.
7

We believe that the audit evidence we have obtained is sufficient and appropriate to provide a basis for our audit opinions. Opinions In our opinion, the financial statements referred to above present fairly, in all material respects, the respective financial position of the governmental activities, the business-type activities, each major fund and the aggregate remaining fund information of the Red Bank School District, County of Monmouth, State of New Jersey, as of June 30, 2014, and the respective changes in financial position and, where applicable, cash flows thereof for the year then ended in accordance with accounting principles generally accepted in the United States of America. Change in Accounting Principle As discussed in Note 1 to the financial statements, during the fiscal year ended June 30, 2014 the District adopted new accounting guidance, GASB Statement No. 65, Items Previously Reported as Assets and Liabilities. Our opinion is not modified with respect to this matter. Other Matters Required Supplementary Information Accounting principles generally accepted in the United States of America require that the management’s discussion and analysis and budgetary comparison information as presented in the table of contents be presented to supplement the basic financial statements. Such information, although not a part of the basic financial statements, is required by the Governmental Accounting Standards Board who considers it to be an essential part of financial reporting for placing the basic financial statements in an appropriate operational, economic, or historical context. We have applied certain limited procedures to the required supplementary information in accordance with auditing standards generally accepted in the United States of America, which consisted of inquiries of management about the methods of preparing the information and comparing the information for consistency with management’s responses to our inquiries, the basic financial statements, and other knowledge we obtained during our audit of the basic financial statements. We do not express an opinion or provide any assurance on the information because the limited procedures do not provide us with sufficient evidence to express an opinion or provide any assurance. Other Information Our audit was conducted for the purpose of forming opinions on the financial statements that collectively comprise the Red Bank School District’s basic financial statements. The accompanying introductory section, comparative totals for June 30, 2013, and other supplementary information such as the combining and individual fund financial statements, long-term debt schedules and statistical information are presented for purposes of additional analysis and are not a required part of the financial statements. The accompanying Schedule of Expenditures of Federal Awards and State Financial Assistance are presented for purposes of additional analysis as required by U.S. Office of Management and Budget Circular A-133, Audits of States, Local Governments, and Non-Profit Organizations and New Jersey OMB’s Circular 04-04, Single Audit Policy for Recipients of Federal Grants, State Grants and State Aid respectively, and is also not a required part of the financial statements.
8

The combining and individual fund financial statements, long-term debt schedules and the accompanying Schedule of Expenditures of Federal Awards and State Financial Assistance is the responsibility of management and was derived from and relates directly to the underlying accounting and other records used to prepare the basic financial statements. Such information has been subjected to the auditing procedures applied in the audit of the basic financial statements and certain additional procedures, including comparing and reconciling such information directly to the underlying accounting other records used to prepare the basic financial statements or to the basic financial statements themselves, and other additional procedures in accordance with auditing standards generally accepted in the United States of America. In our opinion, the combining and individual fund financial statements, long-term debt schedules and the accompanying Schedule of Expenditures of Federal Awards and State Financial Assistance are fairly stated in all material respects in relation to the basic financial statements taken as a whole. The introductory section, comparative totals for June 30, 2013, and statistical information have not been subjected to the auditing procedures applied in the audit of the basic financial statements and, accordingly, we express no opinion or provide any assurance on them. Other Reporting Required by Government Auditing Standards In accordance with Government Auditing Standards, we have also issued our report dated October 16, 2014, on our consideration of the Red Bank School District’s internal control over financial reporting and on our tests of its compliance with certain provisions of laws, regulations, contracts, and grant agreements and other matters. The purpose of that report is to describe the scope of our testing of internal control over financial reporting and compliance and the results of that testing, and not to provide an opinion on internal control over financial reporting or on compliance. That report is an integral part of an audit performed in accordance with Government Auditing Standards in considering Red Bank School District’s internal control over financial reporting and compliance.
Respectfully Submitted,
HOLMAN FRENIA ALLISON, P.C.
Robert W. Allison Certified Public Accountant Public School Accountant, No. 897
Freehold, New Jersey October 16, 2014
9

This page intentionally left blank
10

REQUIRED SUPPLEMENTARY INFORMATION - PART I
Management's Discussion and Analysis
11

This page intentionally left blank.
12

RED BANK BOROUGH BOARD OF EDUCATION 76 BRANCH AVENUE, RED BANK, NJ 07701
MONMOUTH COUNTY
MANAGEMENT'S DISCUSSION AND ANALYSIS FOR THE FISCAL YEAR ENDED JUNE 30, 2014
(Unaudited)
Introduction Red Bank Borough School District (“District”) is an independent reporting entity within the criteria adopted by the GASB as established by NCGA Statement No. 3. All funds and account groups of the District are included in this report. The District provides a full range of educational services appropriate to grade levels PreKindergarten through 8. These include general and special education instruction for handicapped students. The District completed the 2013/14 school year with an average daily enrollment of 1362 students, an increase of 21.49% over the prior year’s average daily enrollment. An additional 9 District students were in private out-of-district special education placements. The Red Bank Charter School, also operating in Red Bank, had an enrollment of 195 Red Bank resident students at the end of June, 2014. Additional Red Bank residents attended various non-public elementary schools throughout the County. District schools, while located in an affluent area of Monmouth County, New Jersey, are classified as district factor group “CD.” The district factor group is a measure of local wealth and student economics on a scale of “A” (lowest) to “J” (highest), with Red Bank’s classification influenced by the high percentage of low-income students as measured by student eligibility for free or reduced-price school meals. The District continues its staff development and curriculum improvement initiatives, and in 2013/14 continued a curriculum alignment process that ensures focused instruction in grades preschool-8. Academic outcomes have shown improvements attributed, in part, to the success of alignment of standards and curriculum planning. With the learner as the focus, at the heart of staff development is continuation of a data-driven, comprehensive, and on-going professional development program that targets content, strategies, assessment, and skills identified to be in need of attention.
13

Basic Financial Statements The annual report consists of a series of financial statements and notes to those statements presented so the reader can gain an understanding of the Red Bank Borough School District as a financial operating entity. The overview statements then proceed to provide an increasingly detailed look at specific financial activities. These statements provide a “report card” of sorts on the District’s financial transactions, including data on all assets and liabilities using full accrual accounting in a manner similar to information presented by publicly-held companies. All of these activities are intended to advance the District’s mission as stated at the beginning of this analysis. The financial statements previously presented in the District’s Comprehensive Annual Financial Report remain unchanged: detailed and comparative exhibits of budgeted and actual revenue and expenses by General, Special Revenue, Proprietary and Debt Service funds. This disclosure has been expanded by the addition of the Statement of Net Position and the Statement of Activities using full accrual accounting similar to the statements used in reporting corporate financial results. Another feature is supplementary information that includes a comparison of the original and final budgets to the final expenditures for the General and Special Revenue Funds. The Statement of Net Position presents the District’s assets and liabilities in order of liquidity, except for liabilities with current and long-term elements that will be presented accordingly. Net position represents the difference between assets and liabilities, and will be presented in three categories: invested in capital assets net of related debt, restricted assets and unrestricted assets. Using this methodology requires depreciation of capital assets. The Statement of Activities provides an overview of the cost of providing educational services by major categories of expense and revenue. These two statements report the District’s net position and how they have changed year to year, reflecting a variety of influences such as the current change in educational philosophy (resulting in increased purchases of new materials, consultants, etc.), voter approval of tax levy, interest income, successful grant applications, etc. An additional factor influencing these results is the level of state funding received. In 2013/14, the District received $2,969,550.00 in General Operating Fund State Aid (SFRA). The District was obligated to transfer $1,643,367.00 to the Red Bank Charter School for their 195 students. In comparing the amount of State Aid the District received, and the amount of funds transferred to the Charter School, clearly the difference of $1,326,183.00 creates a fiscal challenge.
14

Financial Highlights Key financial highlights for 2013/2014 are as follows:
• General revenues accounted for $16,861,849.77 in revenue or 68.19% of all revenues. Program specific revenues in the form of charges for services, and operating grants and contributions, accounted for $7,864,429.13 or 31.81% of total revenues of $24,726,278.90.
• Total net position of governmental activities increased by $1,260,519.62.
• The School District had $23,465,759.28 in expenses; only $7,864,429.13 of these expenses
were offset by program specific charges for services, grants or contributions. General revenues of $16,861,849.77 were adequate to provide for these programs.
• The School District had $23,660,044.65 in General, Special Revenue and Debt Service Fund
expenses. Tax levies, state and federal aid, selected grants, and miscellaneous income covered these costs. Of the District’s total expenditures in 2013/14, 57.73% was funded by local revenue, with $13,174,691.04 in local taxes levied for the General Fund and another $544,861.00 levied for debt service.
• Of the 2013/14 General Fund expenditures, $1,643,367.00 represented a transfer to the Red
Bank Charter School.
• The State contributed Categorical Aid in the amount of $34,744.00 for transportation. • The General Fund had $17,454,410.10 in revenues and $17,289,002.48 in expenditures. The
General Fund’s balance increased by $165,407.62 over 2013/14.
15

Using this General Accepted Accounting Principles Report (GAAP) The Statement of Net Position provides the perspective of the School District as a whole. Table 1 provides a summary of the School District's net position as of June 30, 2014 compared to June 30, 2013.
Table 1
Net Position 2014 2013
Assets:Cash and Cash Equivalents 2,612,914.97$ 1,075,735.79$ Receivables, Net 582,152.70 1,310,965.06 Inventory 4,322.00 5,063.95 Capital Assets, Net 14,325,818.05 14,531,296.30
Total Assets 17,525,207.72 16,923,061.10
Liabilities:Accounts Payable - 104,269.56 Accrued Expenses 20,979.17 24,608.12 Intergovernmental Payable 54,649.96 40,190.85 Cash Deficit - 632,608.87 Unearned Revenue 339,295.80 452,818.12 Other Liabilities 681,962.75 9,080.03 Noncurrent Liabilities:
Due Within One Year 374,257.54 435,304.32 Due Beyond One Year 2,563,515.26 2,960,570.28
Total Liabilities 4,034,660.48 4,659,450.15
Net Position:Net Investment in Capital Assets 11,401,015.25 11,191,199.70 Restricted for:
Capital Projects 817,073.44 131,437.35 Debt Service (20,295.96) 683.21 General Fund 640,817.23 1,142,820.31
Unrestricted 651,937.28 (202,529.62)
Total Net Position 13,490,547.24$ 12,263,610.95$
16
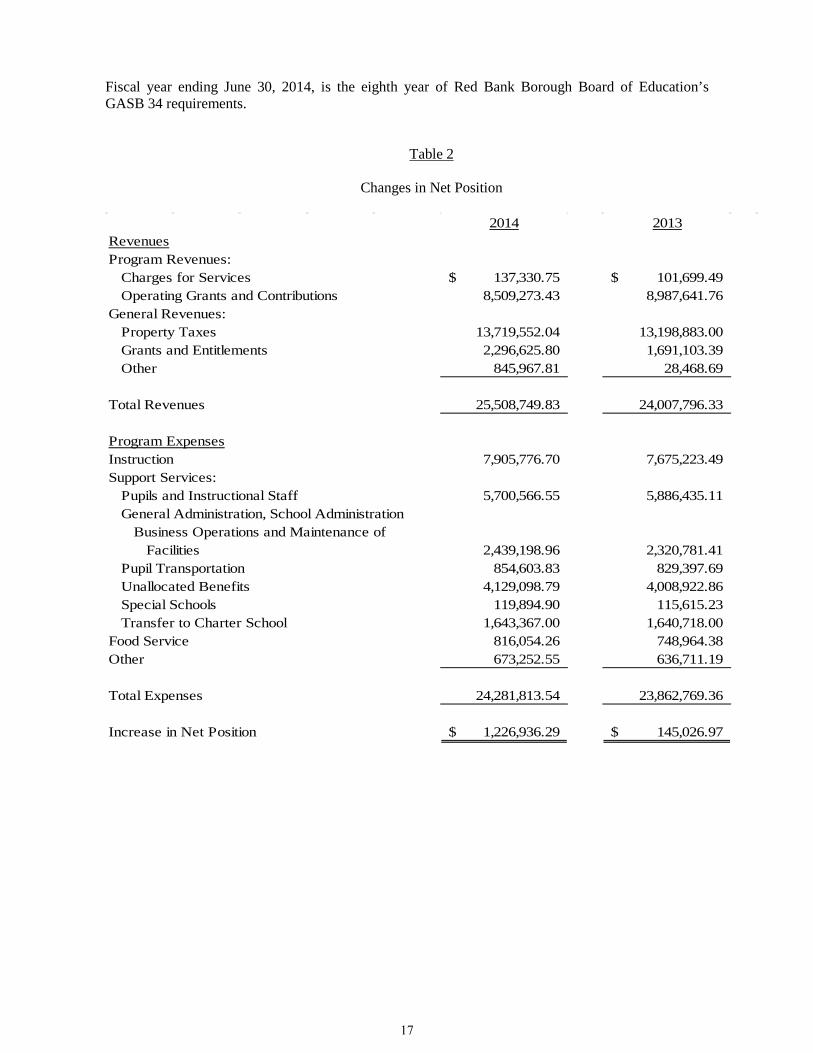
Fiscal year ending June 30, 2014, is the eighth year of Red Bank Borough Board of Education’s GASB 34 requirements.
Table 2
Changes in Net Position
2014 2013RevenuesProgram Revenues:
Charges for Services 137,330.75$ 101,699.49$ Operating Grants and Contributions 8,509,273.43 8,987,641.76
General Revenues:Property Taxes 13,719,552.04 13,198,883.00 Grants and Entitlements 2,296,625.80 1,691,103.39 Other 845,967.81 28,468.69
Total Revenues 25,508,749.83 24,007,796.33
Program ExpensesInstruction 7,905,776.70 7,675,223.49 Support Services:
Pupils and Instructional Staff 5,700,566.55 5,886,435.11 General Administration, School Administration
Business Operations and Maintenance of Facilities 2,439,198.96 2,320,781.41
Pupil Transportation 854,603.83 829,397.69 Unallocated Benefits 4,129,098.79 4,008,922.86 Special Schools 119,894.90 115,615.23 Transfer to Charter School 1,643,367.00 1,640,718.00
Food Service 816,054.26 748,964.38 Other 673,252.55 636,711.19
Total Expenses 24,281,813.54 23,862,769.36
Increase in Net Position 1,226,936.29$ 145,026.97$
17

Governmental Activities Historically, on the third Tuesday in April, the voters of New Jersey get an opportunity to voice their pleasure or displeasure on all things economic and/or political as they are asked to vote on their local school district’s annual tax levy developed as part of the annual school budget process. In January 2012 Governor Christie signed into law a bill that allowed school boards the option to eliminate the annual school budget vote if their annual budgets are within the 2% adjusted cap. Red Bank Board of Education was among the numerous New Jersey school districts who voted to eliminate the annual school budget vote that moves the election of school board members to the November general elections. The Statement of Activities shows the cost of program services and the charges for services and grants offsetting those services. Table 3 shows the total cost of services and the net cost of services, identifying the cost of these services supported by tax revenue and unrestricted State entitlements.
Table 3
Governmental Activities
Total Cost of Net Cost of Total Cost of Net Cost of Services Services Services Services
Instruction 7,905,776.70$ 5,141,255.88$ 7,675,223.49$ 4,827,881.65$ Support Services:
Pupils and Instructional Staff 5,700,566.55 1,788,157.20 5,886,435.11 1,726,745.68 General Administration, School
Administration 1,223,305.45 1,223,305.45 1,111,994.63 1,111,994.63 Operation and Maintenance
of Facilities 1,215,893.51 1,215,893.51 1,208,786.78 1,208,786.78 Pupil Transporation 854,603.83 817,878.83 829,397.69 798,803.89 Unallocated Benefits 4,129,098.79 2,978,324.83 4,008,922.86 2,636,747.98 Special Schools 119,894.90 119,894.90 115,615.23 115,615.23 Transfer to Charter School 1,643,367.00 1,643,367.00 1,640,718.00 1,640,718.00
Other 673,252.55 673,252.55 636,711.19 636,711.19
23,465,759.28$ 15,601,330.15$ 23,113,804.98$ 14,704,005.03$
20132014
Instruction expenses include activities directly dealing with the teaching of pupils and the interaction between teacher and pupil and these expenses are increasing due to changes in contractual obligations and changes in staff related to inclusion of special education and English language learners.
18

Pupils and instructional staff include the activities involved with assisting staff with the content and process of teaching to pupils including curriculum and staff development. Curriculum and staff development include expenses associated with research, planning, development and evaluation of educational materials and methodology intended to provide “Quality Learning by All…Whatever It Takes.” General administration, school administration and business include expenses associated with administrative and financial supervision of the District including various types of insurance coverage, professional fees for architects, attorneys and auditors, mandated membership in the New Jersey School Boards Association and other expenses. Operation and maintenance of plant activities involve keeping the school grounds, buildings, and equipment operating efficiently and effectively. The District’s in-house staff of custodians and maintenance workers is charged with keeping the District’s facilities functioning at peak efficiency at least cost. Pupil transportation includes activities involved with the conveyance of students to and from school, as well as to and from school activities, as provided by State law. In the Borough of Red Bank, this includes extensive busing for District students, Board of Education schools, the Charter School and also for those students attending out-of-district schools by either school or parent designation. Interest and fiscal charges involves the transactions associated with the payment of interest and other related charges to debt of the District. Other includes unallocated depreciation. The School District's Funds Information about the School District's major funds follows this report. These funds are accounted for using the modified accrual basis of accounting. All governmental funds had total revenues of $24,726,278.90 and expenditures of $23,732,044.65. As demonstrated by the various statements and schedules included in the financial section of this report, the District continues to meet its responsibility for sound financial management. The following schedules present a summary of the revenues of the governmental funds (excluding Capital Projects) for the fiscal year ended June 30, 2014, and the amount and percentage of increases and decreases in relation to prior-year revenues.
Increase/(Decrease) Percent of
Percent of From Increase/Revenues Amount Total 2012/13 (Decrease)
Local Sources 13,836,508.00$ 57.73% 607,767.00$ 4.39%State Sources 8,668,144.00 36.16% 551,948.00 6.37%Federal Sources 1,464,111.00 6.11% (509,005.00) -34.77%
Total 23,968,763.00$ 100.00% 650,710.00$ 2.71%
19

The increase in Local Sources is attributed to an increase in local tax levy. The increase in State Sources is attributed to an increase in State Grants as well as an increase of State Funding for the new Charter School PreK class that is passed through the District. The decrease in Federal Sources is attributed to the loss of the 21st Century Grant. The following schedule presents a summary of General Fund, Special Revenue Fund and Debt Service Fund expenditures for the fiscal year ended June 30, 2014:
Increase/(Decrease) Percent of
Percent of From Increase/Expenditures Amount Total 2012/13 (Decrease)
Current Expenses:Instruction 7,905,777.00$ 33.41% 239,969.00$ 3.04%Undistributed
Expenditures& Special Schools 13,286,171.00 56.15% 167,309.00 1.26%
Transfer to Charter School 1,643,367.00 6.95% 2,649.00 0.16%
Capital Outlay 279,869.00 1.18% 159,114.00 56.85%Debt Service:
Principal 401,036.00 1.69% 16,222.00 4.05%Interest 143,825.00 0.61% (18,054.00) -12.55%
Total 23,660,045.00$ 100.00% 567,209.00$ 2.40%
20
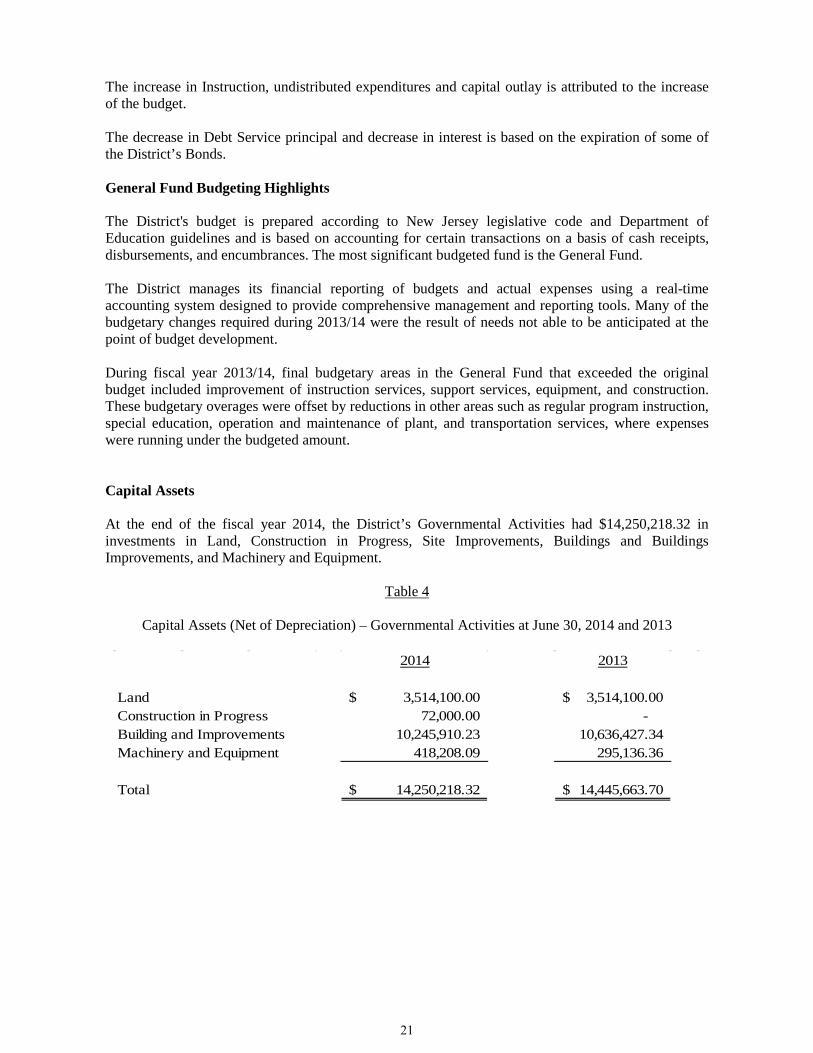
The increase in Instruction, undistributed expenditures and capital outlay is attributed to the increase of the budget. The decrease in Debt Service principal and decrease in interest is based on the expiration of some of the District’s Bonds. General Fund Budgeting Highlights The District's budget is prepared according to New Jersey legislative code and Department of Education guidelines and is based on accounting for certain transactions on a basis of cash receipts, disbursements, and encumbrances. The most significant budgeted fund is the General Fund. The District manages its financial reporting of budgets and actual expenses using a real-time accounting system designed to provide comprehensive management and reporting tools. Many of the budgetary changes required during 2013/14 were the result of needs not able to be anticipated at the point of budget development. During fiscal year 2013/14, final budgetary areas in the General Fund that exceeded the original budget included improvement of instruction services, support services, equipment, and construction. These budgetary overages were offset by reductions in other areas such as regular program instruction, special education, operation and maintenance of plant, and transportation services, where expenses were running under the budgeted amount. Capital Assets At the end of the fiscal year 2014, the District’s Governmental Activities had $14,250,218.32 in investments in Land, Construction in Progress, Site Improvements, Buildings and Buildings Improvements, and Machinery and Equipment.
Table 4
Capital Assets (Net of Depreciation) – Governmental Activities at June 30, 2014 and 2013
2014 2013
Land 3,514,100.00$ 3,514,100.00$ Construction in Progress 72,000.00 - Building and Improvements 10,245,910.23 10,636,427.34 Machinery and Equipment 418,208.09 295,136.36
Total 14,250,218.32$ 14,445,663.70$
21

Overall capital assets decreased minimally from fiscal year 2013 to fiscal year 2014 as the Middle School renovation was virtually completed. The renovation was a $11.275 million project of which 40% was funded by the state through the New Jersey Economic Development Authority, with the balance bonded following a public referendum. Increases in Capital Assets were offset by depreciation expense for the year. The District’s curriculum continued to emphasize the use of technology in education during 2013/14. The District is also implementing technology to accommodate the new State mandated PARCC testing requirement. The District continues as a Non-Abbott District for the Preschool Expansion Initiative through the award of a competitive grant. This allows the District to provide full-day preschool education to all Red Bank preschool age children. Debt Administration On July 1, 2005, the Red Bank Borough Board of Education refinanced its 5.15% fixed rate 20-year serial bond for the Middle School renovation. Although improved interest rates were investigated, at this time the refinanced rate of 5.15% is the best available.
Table 5 Outstanding Debt at June 30,
2014 2013
2005 Refunding Bonds 2,825,000.00$ 3,185,000.00$ 1993 Renovation NJEDA Bond - 41,036.32 Amortization of Bond
Premium 99,802.80 114,060.34 Compensated Absences
Payable 12,970.00 55,778.00
Total 2,937,772.80$ 3,395,874.66$
At June 30, 2014, the School District's overall legal debt margin was $178,845,606.00.
22
Current Financial Issues and Concerns As of June 30, 2014, the Red Bank Borough School District has several serious financial concerns. The District continues to be concerned about the financial burden that is created through funding a charter school in such a small community. Unanticipated Special Education costs and services that are driven by student’s Individual Education Plan requirements have increased considerably. The District continues to strive to “do more with less”. The design of a prudent budget that is based on a zero-based model, coupled with receiving funds through an aggressive grant submission process, the Red Bank Borough School District continues to focus on the enhancement of student learning. The Superintendent continues to aggressive seek competitive grants, collaborative partnerships for professional development, and various opportunities that increase student learning for the District that does not impact local budgets. Further cost savings through shared resources with the Borough and neighboring districts includes curriculum writing and professional development that supplement and support the District’s needs. An additional area of concern is the need for increased maintenance and probable renovations at each school. The Primary School was constructed in the early seventies. This building is situated on ecologically-sensitive property on the west side of the Borough. The Borough-owned access roadway has limitations that pose safety concerns, and the main entryway to the building is obscured, allowing no clear view of the building’s exterior for student safety purposes. The Board has worked with the Borough to address some of the issues of safety through Borough grants; however, exploring the work is at the very preliminary stages. Budgeting for these projects will be a financial challenge. In general, the Red Bank Borough Board of Education has consistently committed itself to sound, conservative fiscal management, providing the most efficient and effective education possible given the demands and challenges associated with the need to improve students’ academic performance. Contacting the School District's Financial Management This financial report is designed to provide citizens, taxpayers, investors and creditors with a general overview of the District's finances and to show the District's accountability for the money it receives. If you have questions on this report or need additional financial information, please contact Debra Pappagallo, School Business Administrator/Board Secretary at Red Bank Borough Board of Education, 76 Branch Avenue, Red Bank, NJ 07701.
23

This page intentionally left blank
24

BASIC FINANCIAL STATEMENTS
25

This page intentionally left blank.
26

A. District-Wide Financial Statements
27

This page intentionally left blank
28

EXHBIT A-1
TOTALSGovernmental Business -Type June 30,
Activities Activities 2014Assets:
Cash and Cash Equivalents 2,592,840.26$ 20,074.71$ 2,612,914.97$ Receivables, Net 507,147.63 75,005.07 582,152.70 Inventory - 4,322.00 4,322.00 Capital Assets, Net (Note 5) 14,250,218.32 75,599.73 14,325,818.05
Total Assets 17,350,206.21 175,001.51 17,525,207.72
Liabilities:Accrued Interest 20,979.17 - 20,979.17 Payable to State Government 54,649.96 - 54,649.96 Unearned Revenue 339,295.80 - 339,295.80 Other Liabilities 681,962.75 - 681,962.75 Noncurrent Liabilities (Note 6):
Due Within One Year 374,257.54 - 374,257.54 Due Beyond One Year 2,563,515.26 - 2,563,515.26
Total Liabilities 4,034,660.48 - 4,034,660.48
Net Position:Net Investment in Capital Assets 11,325,415.52 75,599.73 11,401,015.25 Restricted for:
Capital Projects 817,073.44 - 817,073.44 Debt Service (20,295.96) - (20,295.96) General Fund 640,817.23 - 640,817.23
Unrestricted 552,535.50 99,401.78 651,937.28
Total Net Position 13,315,545.73$ 175,001.51$ 13,490,547.24$
RED BANK SCHOOL DISTRICTSTATEMENT OF NET POSITION
June 30, 2014
The accompanying Notes to Basic Financial Statements are an integral part to this statement. 29

EX
HIB
IT A
-2
Ope
rati
ng
Cha
rges
for
Gra
nts
and
Gov
ernm
enta
lB
usin
ess-
Typ
eJu
ne 3
0,F
unct
ions
/Pro
gram
sE
xpen
ses
Ser
vice
sC
ontr
ibut
ions
Act
ivit
ies
Act
ivit
ies
2014
Inst
ruct
ion:
Reg
ular
6,18
0,77
9.17
$
-
$
2,09
8,77
1.82
$
(4
,082
,007
.35)
$
-$
(4
,082
,007
.35)
$
S
peci
al E
duca
tion
861,
555.
25
-
665,
749.
00
(1
95,8
06.2
5)
-
(1
95,8
06.2
5)
O
ther
Spe
cial
Ins
truc
tion
860,
302.
28
-
-
(860
,302
.28)
-
(860
,302
.28)
Oth
er I
nstr
ucti
on3,
140.
00
-
-
(3
,140
.00)
-
(3
,140
.00)
S
uppo
rt S
ervi
ces:
Tui
tion
624,
824.
22
-
-
(624
,824
.22)
-
(624
,824
.22)
Stu
dent
and
Ins
truc
tion
Rel
ated
-
Ser
vice
s5,
075,
742.
33
-
3,
912,
409.
35
(1,1
63,3
32.9
8)
-
(1,1
63,3
32.9
8)
Gen
eral
Adm
inis
trat
ion
368,
513.
07
-
-
(368
,513
.07)
-
(368
,513
.07)
Sch
ool A
dmin
istr
ativ
e S
ervi
ces
464,
140.
33
-
-
(464
,140
.33)
-
(464
,140
.33)
Cen
tral
Ser
vice
s23
7,58
1.69
-
-
(2
37,5
81.6
9)
-
(2
37,5
81.6
9)
A
dmin
istr
ativ
e In
form
atio
n T
echn
olog
y15
3,07
0.36
-
-
(1
53,0
70.3
6)
-
(1
53,0
70.3
6)
P
lant
Ope
rati
ons
and
Mai
nten
ance
1,21
5,89
3.51
-
-
(1,2
15,8
93.5
1)
-
(1,2
15,8
93.5
1)
Pup
il T
rans
port
atio
n85
4,60
3.83
-
36
,725
.00
(8
17,8
78.8
3)
-
(8
17,8
78.8
3)
U
nall
ocat
ed B
enef
its
4,12
9,09
8.79
-
1,15
0,77
3.96
(2
,978
,324
.83)
-
(2
,978
,324
.83)
S
peci
al S
choo
ls11
9,89
4.90
-
-
(1
19,8
94.9
0)
-
(1
19,8
94.9
0)
T
rans
fer
To
Cha
rter
Sch
ool
1,64
3,36
7.00
-
-
(1,6
43,3
67.0
0)
-
(1,6
43,3
67.0
0)
Inte
rest
and
Cha
rges
on
Lon
g-T
erm
Deb
t17
9,93
8.25
-
-
(1
79,9
38.2
5)
-
(1
79,9
38.2
5)
U
nall
ocat
ed D
epre
ciat
ion/
Am
orti
zati
on49
3,31
4.30
-
-
(4
93,3
14.3
0)
-
(4
93,3
14.3
0)
Tot
al G
over
nmen
t Act
ivit
ies
23,4
65,7
59.2
8
-
7,86
4,42
9.13
(1
5,60
1,33
0.15
)
-
(1
5,60
1,33
0.15
)
BU
SIN
ES
S-T
YP
E A
CT
IVIT
IES
Foo
d S
ervi
ce81
6,05
4.26
137,
330.
75
644,
844.
30
-
(33,
879.
21)
(33,
879.
21)
For
th
e F
isca
l Yea
r E
nd
ed J
un
e 30
, 201
4
RE
D B
AN
K S
CH
OO
L D
IST
RIC
TS
TA
TE
ME
NT
OF
AC
TIV
ITIE
S
GO
VE
RN
ME
NT
AL
AC
TIV
ITIE
S
PR
OG
RA
M R
EV
EN
UE
SC
HA
NG
ES
IN
NE
T P
OS
ITIO
NN
ET
(E
XP
EN
SE
) R
EV
EN
UE
AN
D
The
acc
ompa
nyin
g N
otes
to B
asic
Fin
anci
al S
tate
men
ts a
re a
n in
tegr
al p
art t
o th
is s
tate
men
t.
30

EX
HIB
IT A
-2
Ope
rati
ng
Cha
rges
for
Gra
nts
and
Gov
ernm
enta
lB
usin
ess-
Typ
eJu
ne 3
0,F
unct
ions
/Pro
gram
sE
xpen
ses
Ser
vice
sC
ontr
ibut
ions
Act
ivit
ies
Act
ivit
ies
2014
For
th
e F
isca
l Yea
r E
nd
ed J
un
e 30
, 201
4
RE
D B
AN
K S
CH
OO
L D
IST
RIC
TS
TA
TE
ME
NT
OF
AC
TIV
ITIE
S
PR
OG
RA
M R
EV
EN
UE
SC
HA
NG
ES
IN
NE
T P
OS
ITIO
NN
ET
(E
XP
EN
SE
) R
EV
EN
UE
AN
D
Tot
al B
usin
ess-
Typ
e A
ctiv
itie
s81
6,05
4.26
137,
330.
75
644,
844.
30
-
(33,
879.
21)
(33,
879.
21)
Tot
al P
rim
ary
Gov
ernm
ent
24,2
81,8
13.5
4$
13
7,33
0.75
$
8,
509,
273.
43$
(15,
601,
330.
15)
$
(3
3,87
9.21
)$
(1
5,63
5,20
9.36
)$
GE
NE
RA
L R
EV
EN
UE
SP
rope
rty
Tax
es L
evie
d fo
r:
P
rope
rty
Tax
es, L
evie
d fo
r G
ener
al P
urpo
ses,
13,1
74,6
91.0
4$
-
$
13,1
74,6
91.0
4$
N
et T
axes
Lev
ied
for
Deb
t Ser
vice
544,
861.
00
-
54
4,86
1.00
Fed
eral
and
Sta
te A
id N
ot R
estr
icte
d2,
296,
625.
80
-
2,29
6,62
5.80
In
vest
men
t Ear
ning
s-
295.
88
29
5.88
Mis
cell
aneo
us84
5,67
1.93
-
845,
671.
93
Tot
al G
ener
al R
even
ues
16,8
61,8
49.7
7
29
5.88
16,8
62,1
45.6
5
Cha
nge
in N
et P
osit
ion
1,26
0,51
9.62
(33,
583.
33)
1,22
6,93
6.29
N
et P
osit
ion
- B
egin
ning
(R
esta
ted)
12,0
55,0
26.1
1
20
8,58
4.84
12,2
63,6
10.9
5
Net
Pos
itio
n -
End
ing
13,3
15,5
45.7
3$
17
5,00
1.51
$
13,4
90,5
47.2
4$
The
acc
ompa
nyin
g N
otes
to B
asic
Fin
anci
al S
tate
men
ts a
re a
n in
tegr
al p
art t
o th
is s
tate
men
t.
31

This page intentionally left blank
32

B. Fund Financial Statements
33

This page intentionally left blank
34

Governmental Funds
35

This page intentionally left blank
36

EXHIBIT B-1
Special Capital Debt (Memorandum Only)General Revenue Projects Service June 30, June 30,
Fund Fund Fund Fund 2014 2013Assets:
Cash and Cash Equivalents 1,469,745.15$ -$ 728,487.25$ 683.21$ 2,198,915.61$ 1,003,104.31$ Interfunds Receivables 90,171.60 - - - 90,171.60 364,353.48 Receivables From Other Governments:
State 143,775.91 483.45 28,800.00 - 173,059.36 527,944.72 Federal - 314,233.20 - - 314,233.20 737,763.53
Other Receivables - 19,855.07 - - 19,855.07 39,710.14 Restricted Cash 508,975.08 - - - 508,975.08 -
Total Assets 2,212,667.74 334,571.72 757,287.25 683.21 3,305,209.92 2,672,876.18
Liabilities and Fund Balances:Liabilities:
Cash Deficit - 115,050.43 - - 115,050.43 632,608.87 Accounts Payable - - - - - 104,269.56 Interfunds Payable - 90,171.60 - - 90,171.60 364,353.48 Other Liabilities 681,962.75 - - - 681,962.75 9,080.03 Payable To State Government - 54,649.96 - - 54,649.96 40,190.85 Unearned Revenue - 339,295.80 - - 339,295.80 452,818.12
Total Liabilities 681,962.75 599,167.79 - - 1,281,130.54 1,603,320.91
Fund Balances:Restricted:
Reserved Excess Surplus:Designated for Subsequent Year's
Expenditures 49,605.61 - - - 49,605.61 158,456.78 Current Year Excess Surplus 142,022.73 - - - 142,022.73 49,605.61
Capital Reserve 59,786.19 - - - 59,786.19 59,666.10 Maintenance Reserve 449,188.89 - - - 449,188.89 249,188.89 Debt Service Fund - - - 683.21 683.21 683.21 Capital Projects Fund - - 757,287.25 - 757,287.25 71,771.25
Assigned:Year-End Encumbrances 405,223.41 - - - 405,223.41 383,558.57 Designated by the BOE for
Subsequent Year's Expenditures 346,039.39 - - - 346,039.39 338,652.22 Unassigned 78,838.77 (264,596.07) - - (185,757.30) (281,737.50)
Total Fund Balances 1,530,704.99 (264,596.07) 757,287.25 683.21 2,024,079.38 1,029,845.13
Total Liabilities and Fund Balances 2,212,667.74$ 334,571.72$ 757,287.25$ 683.21$
Amounts reported for governmental activities in thestatement of net assets (A-1) are different because:
Capital assets used in governmental activities are not financial resources and therefore are not reported in the governmental funds. The cost of the assets is $21,664,831.07 and theaccumulated depreciation is $7,414,612.75 (See Note 5). 14,250,218.32 14,445,663.70
Long-term liabilities, including bonds payable, are not due
and payable in the current period and therefore are notreported as liabilities in the fund (See Note 6). (2,937,772.80) (3,395,874.60)
Accrued interest on long-term liabilities is not reported asa liability in the Fund. (20,979.17) (24,608.12)
Net Position of Governmental Activities 13,315,545.73$ 12,055,026.11$
RED BANK SCHOOL DISTRICT
(With Comparative Totals to June 30, 2013)
Totals
June 30, 2014GOVERNMENTAL FUNDS
BALANCE SHEET
The accompanying Notes to Basic Financial Statements are an integral part to this statement. 37

EXHIBIT B-2
Special Capital Debt (Memorandum Only)
General Revenue Projects Service June 30, June 30,Fund Fund Fund Fund 2014 2013
Revenues:Local Sources:
Local Tax Levy 13,174,691.04$ -$ -$ 544,861.00$ 13,719,552.04$ 13,198,883.00$ Interest Earned on Capital Reserve - - - - - 118.72 Miscellaneous 103,061.11 13,894.82 728,716.00 - 845,671.93 29,739.22
Total - Local Sources 13,277,752.15 13,894.82 728,716.00 544,861.00 14,565,223.97 13,228,740.94
State Sources 4,172,268.46 4,495,875.97 28,800.00 - 8,696,944.43 8,127,786.99 Federal Sources 4,389.49 1,459,721.01 - - 1,464,110.50 1,973,116.35
Total Revenues 17,454,410.10 5,969,491.80 757,516.00 544,861.00 24,726,278.90 23,329,644.28
Expenditures:Current:
Regular Instruction 4,082,007.35 2,098,771.82 - - 6,180,779.17 6,109,655.91 Special Education Instruction 861,555.25 - - - 861,555.25 963,464.73 Other Special Instruction 860,302.28 - - - 860,302.28 585,767.68 Other Instruction 3,140.00 - - - 3,140.00 6,919.37 Support Services and Undistributed Costs:
Tuition 624,824.22 - - - 624,824.22 459,556.13 Student and Instruction Related Services 1,163,332.98 3,912,409.35 - - 5,075,742.33 5,426,878.98 General Administration 368,513.07 - - - 368,513.07 384,305.01 School Administrative Services 464,140.33 - - - 464,140.33 434,101.56 Central Services 237,581.69 - - - 237,581.69 178,755.54 Administrative Information Technology 153,070.36 - - - 153,070.36 100,025.14 Plant Operations and Maintenance 1,215,893.51 - - - 1,215,893.51 1,173,066.03 Pupil Transportation 854,603.83 - - - 854,603.83 829,397.69 Employee Benefits 4,171,906.79 - - - 4,171,906.79 4,017,161.10
Special Schools 119,894.90 - - - 119,894.90 115,615.23 Transfer To Charter School 1,643,367.00 - - - 1,643,367.00 1,640,718.00 Debt Service:
Principal - - - 401,036.26 401,036.26 384,814.35 Interest and Other Charges - - - 143,824.74 143,824.74 161,879.44
Capital Outlay 279,868.92 - 72,000.00 - 351,868.92 120,755.08
Total Expenditures 17,104,002.48 6,011,181.17 72,000.00 544,861.00 23,732,044.65 23,092,836.97
Excess/(Deficiency) of Revenues Over/(Under) Expenditures 350,407.62 (41,689.37) 685,516.00 - 994,234.25 236,807.31
Other Financing Sources/(Uses):General Fund Contribution to Preschool
Education Aid (185,000.00) 185,000.00 - - - - - -
Total Other Financing Sources/(Uses) (185,000.00) 185,000.00 - - - -
Net Change in Fund Balances 165,407.62 143,310.63 685,516.00 - 994,234.25 236,807.31
Fund Balance - July 1 1,365,297.37 (407,906.70) 71,771.25 683.21 1,029,845.13 793,037.82
Fund Balance - June 30 1,530,704.99$ (264,596.07)$ 757,287.25$ 683.21$ 2,024,079.38$ 1,029,845.13$
Totals
June 30, 2014GOVERNMENTAL FUNDS
STATEMENT OF REVENUES, EXPENDITURES, AND CHANGES IN FUND BALANCESRED BANK SCHOOL DISTRICT
(With Comparative Totals for June 30, 2013)
The accompanying Notes to Basic Financial Statements are an integral part to this statement. 38

EXHIBIT B-3
Total Net Change in Fund Balances - Governmental Funds (from B-2) 994,234.25$
Amounts reported for governmental activities in the Statementof Activities (A-2) are different because:
Capital outlays are reported in governmental funds as expenditures.However, on the Statement of Activities, the cost of those assets is allocated
over their estimated useful lives as depreciation expense. This is the amount by whichcapital outlays and donated assets exceeded depreciation in the current fiscal year.
Depreciation Expense (493,314.30)Capital Outlay 297,868.92
(195,445.38)
Repayment of bond, loans and capital lease principal is an expenditure in the
governmental funds, but the repayment reduces long-term liabilities in the Statement
of Net Position and is not reported in the Statement of Activities. 401,036.26
Bond premiums are amortized over the lives of the bonds in the Statement of ActivitiesThe net effect of the amortization is an increase to the reconciliation 14,257.54
In the Statement of Activities, certain operating expenses, e.g., compensatedabsences (vacation and sick pay) are measured by the amounts earned during
the year. In the governmental funds, however, expenditures for these items arereported in the amount of financial resources used (paid). When the earned
amount exceeds the paid amount, the difference is a reduction in the reconciliation;when the paid amount exceeds the earned amount, the difference is an
addition to the reconciliation.Prior Year 55,778.00Current Year (12,970.00)
42,808.00
In the Statement of Activities, interest on long-term debt is accrued, regardless
of when due. In the governmental funds, interest is reported when due. The increase
in accrued interest over the previous year is a reduction in the reconciliation.
Prior Year 24,608.12
Current Year (20,979.17)3,628.95
Change in Net Position of Governmental Activities 1,260,519.62$
RED BANK SCHOOL DISTRICTRECONCILIATION OF THE STATEMENT OF REVENUES, EXPENDITURES
AND CHANGES IN FUND BALANCES OF GOVERNMENTAL FUNDSTO THE STATEMENT OF ACTIVITIES
June 30, 2014
The accompanying Notes to Basic Financial Statements are an integral part to this statement.
39
This page intentionally left blank
40

Proprietary Funds
41

This page intentionally left blank
42
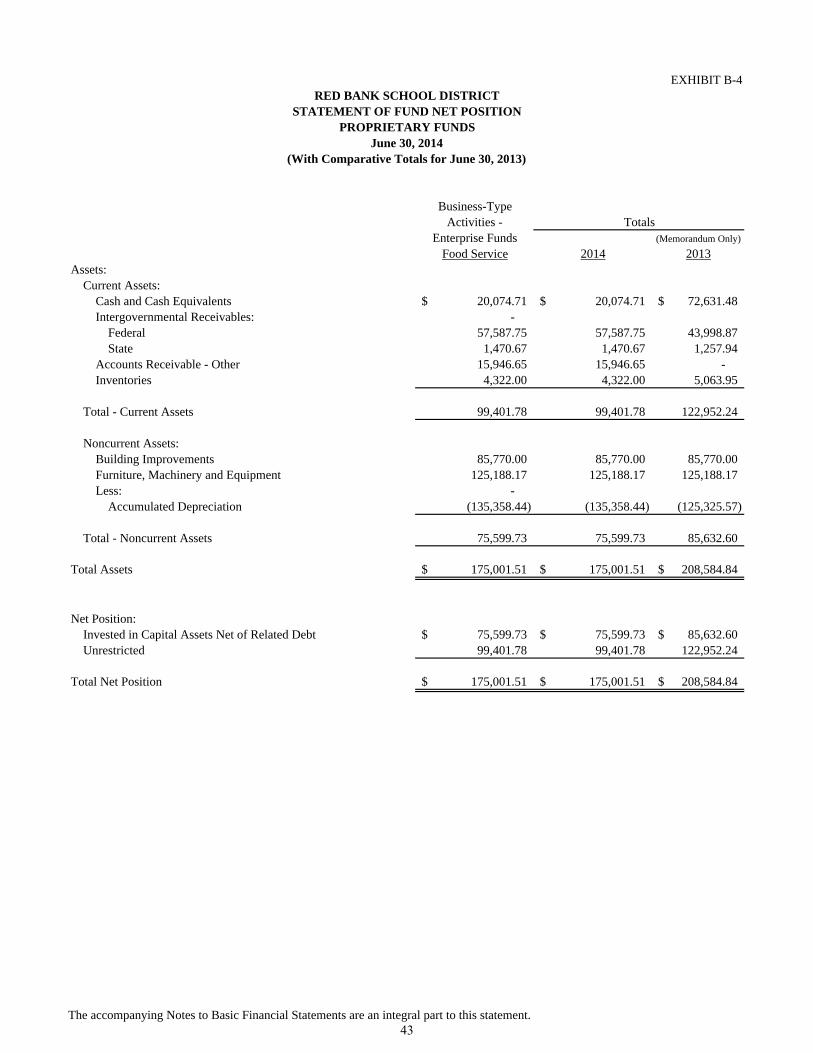
EXHIBIT B-4
Business-TypeActivities -
Enterprise Funds (Memorandum Only)
Food Service 2014 2013Assets:
Current Assets:Cash and Cash Equivalents 20,074.71$ 20,074.71$ 72,631.48$ Intergovernmental Receivables: -
Federal 57,587.75 57,587.75 43,998.87 State 1,470.67 1,470.67 1,257.94
Accounts Receivable - Other 15,946.65 15,946.65 - Inventories 4,322.00 4,322.00 5,063.95
Total - Current Assets 99,401.78 99,401.78 122,952.24
Noncurrent Assets:Building Improvements 85,770.00 85,770.00 85,770.00 Furniture, Machinery and Equipment 125,188.17 125,188.17 125,188.17 Less: -
Accumulated Depreciation (135,358.44) (135,358.44) (125,325.57)
Total - Noncurrent Assets 75,599.73 75,599.73 85,632.60
Total Assets 175,001.51$ 175,001.51$ 208,584.84$
Net Position:Invested in Capital Assets Net of Related Debt 75,599.73$ 75,599.73$ 85,632.60$ Unrestricted 99,401.78 99,401.78 122,952.24
Total Net Position 175,001.51$ 175,001.51$ 208,584.84$
PROPRIETARY FUNDSSTATEMENT OF FUND NET POSITION
RED BANK SCHOOL DISTRICT
Totals
June 30, 2014(With Comparative Totals for June 30, 2013)
The accompanying Notes to Basic Financial Statements are an integral part to this statement. 43

EXHIBIT B-5
Business-TypeActivities -
Enterprise Funds (Memorandum Only)
Food Service 2014 2013Operating Revenues:
Charges for Services:Daily Sales -$ -$ 80,005.19$ Daily Sales - Reimbursable Programs 31,388.98 31,388.98 - Daily Sales - Non-Reimbursable Programs 53,708.61 53,708.61 - Special Functions 52,233.16 52,233.16 21,694.30
Total Operating Revenues 137,330.75 137,330.75 101,699.49
Operating Expenses:Salaries - - 53,552.64 Support Services - Employee Benefits - - 25,775.51 Purchased Professional/Technical Services 402,855.52 402,855.52 267,520.67 Purchased Property Services 17,190.47 17,190.47 6,769.70 Supplies and Materials 29,728.54 29,728.54 19,251.13 Depreciation 10,032.87 10,032.87 13,338.33 Cost of Sales 352,382.91 352,382.91 362,756.40 Miscellaneous Expenditures 3,863.95 3,863.95 -
Total Operating Expenses 816,054.26 816,054.26 748,964.38
Operating Loss (678,723.51) (678,723.51) (647,264.89)
Nonoperating Revenues:State Sources:
State School Lunch Program 10,245.95 10,245.95 9,158.18 Federal Sources: -
National School Lunch Program 504,462.83 504,462.83 425,815.62 National School Breakfast Program 110,840.36 110,840.36 104,533.06 After School Snacks 3,528.80 3,528.80 2,886.78
Food Distribution Program 15,766.36 15,766.36 35,448.17 Interest and Investment Income 295.88 295.88 267.29
Total Nonoperating Revenues 645,140.18 645,140.18 578,109.10
Change in Net Position (33,583.33) (33,583.33) (69,155.79)
Total Net Position - Beginning 208,584.84 208,584.84 277,740.63
Total Net Position - Ending 175,001.51$ 175,001.51$ 208,584.84$
June 30, 2014PROPRIETARY FUNDS
STATEMENT OF REVENUES, EXPENSES, AND CHANGES IN NET POSITIONRED BANK SCHOOL DISTRICT
Totals
(With Comparative Totals for June 30, 2013)
The accompanying Notes to Basic Financial Statements are an integral part to this statement. 44

EXHIBIT B-6
Business-TypeActivities -
Enterprise Funds (Memorandum Only)
Food Service 2014 2013Cash Flows From Operating Activities:
Receipts From Customers 121,384.10$ 121,384.10$ 103,962.65$ Payments To Employees - - (53,552.64) Payments For Employee Benefits - - (25,775.51) Payments To Suppliers (789,513.08) (789,513.08) (636,172.35)
Net Cash Used For Operating Activities (668,128.98) (668,128.98) (611,537.85)
Cash Flows From Noncapital Financing Activities:State Sources 10,033.22 10,033.22 8,402.89 Federal Sources 605,243.11 605,243.11 527,785.80
Net Cash Provided By Noncapital Financing Activities 615,276.33 615,276.33 536,188.69
Cash Flows From Investing Activities:Interest 295.88 295.88 267.29
Net Cash Provided By Investing Activities 295.88 295.88 267.29
Net Increase in Cash and Cash Equivalents (52,556.77) (52,556.77) (75,081.87)
Balance - Beginning of Year 72,631.48 72,631.48 147,713.35
Balance - End of Year 20,074.71$ 20,074.71$ 72,631.48$
Reconciliation of Operating Loss To Net Cash Provided By/(Used For) Operating Activities:
Operating Loss: (678,723.51)$ (678,723.51)$ (647,264.89)$ Adjustments To Reconcile Operating Loss To Net Cash - -
Provided By/(Used For) Operating Activities: - - (Increase)/Decrease in Accounts Receivable (15,946.65) (15,946.65) 3,301.21 Increase/(Decrease) in Accounts Payable - - (27,336.65) Depreciation 10,032.87 10,032.87 13,338.33 Increase/(Decrease) in Deferred Revenue - - (1,038.05) Food Distribution Program 15,766.36 15,766.36 35,448.17 (Increase)/Decrease in Inventories 741.95 741.95 12,014.03
Total Adjustments 10,594.53 10,594.53 35,727.04
Net Cash Used For Operating Activities (668,128.98)$ (668,128.98)$ (611,537.85)$
June 30, 2014PROPRIETARY FUNDS
STATEMENT OF CASH FLOWSRED BANK SCHOOL DISTRICT
Totals
(With Comparative Totals to June 30, 2013)
The accompanying Notes to Basic Financial Statements are an integral part to this statement. 45

This page intentionally left blank
46

Fiduciary Fund
47

This page intentionally left blank
48

EXHIBIT B-7
Agency (Memorandum Only)
Fund 2014 2013
Assets:Cash and Cash Equivalents 111,805.58$ 111,805.58$ 120,788.44$
Total Assets 111,805.58$ 111,805.58$ 120,788.44$
Liabilities:Due To Student Groups 21,117.40$ 21,117.40$ 34,218.29$ Payroll Deductions and Withholdings 90,688.18 90,688.18 86,570.15
Total Liabilities 111,805.58$ 111,805.58$ 120,788.44$
STATEMENT OF FIDUCIARY NET POSITIONRED BANK SCHOOL DISTRICT
Totals
June 30, 2014FIDUCIARY FUNDS
(With Comparative Totals for June 30, 2013)
The accompanying Notes to Basic Financial Statements are an integral part to this statement. 49

This page intentionally left blank
50

RED BANK BOARD OF EDUCATION
NOTES TO THE FINANCIAL STATEMENTSJune 30, 2014
51

This page intentionally left blank
52

RED BANK SCHOOL DISTRICT
NOTES TO THE FINANCIAL STATEMENTS FOR THE YEAR ENDED JUNE 30, 2014
Note 1. Summary of Significant Accounting Policies The financial statements of the Red Bank School District (the ‘District”) have been prepared in conformity with generally accepted accounting principles (GAAP) as prescribed by the Governmental Accounting Standards Board (GASB). The following is a summary of more significant accounting policies. A. Reporting Entity The Red Bank School District is a Type II district located in the County of Monmouth, State of New Jersey. As a Type II district, the School District functions independently through a Board of Education. The Board consists of appointed officials by the County Freeholders and is responsible for the fiscal control of the District. A Superintendent is appointed by the Board and is responsible for the administrative control of the District. The District provides a full range of educational services appropriate to grade levels PreK through 8. The Red Bank School District has an approximate enrollment at June 30, 2014 of 1,207 students. B. Component Units The primary criterion for including activities within the District’s reporting entity as a component unit, as set forth in Section 2100 of the GASB Codification of Governmental Accounting and Financial Reporting Standards, is whether:
♦ the organization is legally separate (can sue or be sued in their own name) ♦ the District holds the corporate powers of the organization ♦ the District appoints a voting majority of the organization’s board ♦ the District is able to impose its will on the organization ♦ the organization has the potential to impose a financial benefit/burden on the District ♦ there is a fiscal dependency by the organization on the District
Based on the aforementioned criteria, the District has no component units. C. Measurement Focus, Basis of Accounting and Financial Statement Presentation District-Wide Financial Statements – The governmental fund financial statements are reported using the economic resources measurement focus and the accrual basis of accounting. Revenues are recorded when earned and expenses are recorded when a liability is incurred, regardless of the timing of related cash flows. Grants and similar items are recognized as revenue as soon as all eligibility requirements imposed by the provider have been met. Governmental Fund Financial Statements – The Governmental fund financial statements are reported using the current financial resources measurement focus and the modified accrual basis of accounting. Revenues are recognized as soon as they are both measurable and available. Revenues are considered to be available when they are collectible within the current period or soon enough thereafter to pay liabilities of the current period. For this purpose, the District considers revenues to be available if they are collected within 60 days of the end of the current fiscal year-end. Principal revenue sources considered susceptible to accrual include federal and state grants, interest on investments, tuition and
53
RED BANK SCHOOL DISTRICT
NOTES TO THE FINANCIAL STATEMENTS (continued): FOR THE YEAR ENDED JUNE 30, 2014
Note 1. Summary of Significant Accounting Policies (continued): transportation. Other revenues are considered to be measurable and available only when cash is received by the state. Expenditures generally are recorded when a liability is incurred, as under accrual accounting. D. District-Wide and Fund Financial Statements The district-wide financial statements (the statement of net assets and the statement of activities) report information of all of the non-fiduciary activities of the District. For the most part, the effect of interfund activity has been removed from these district-wide statements. District activities, which normally are supported by taxes and intergovernmental revenues, are reported separately from business-type activities, which rely to a significant extent on fees and charges for support. The statement of activities demonstrates the degree to which the direct expenses of a given function, segment or component unit are offset by program revenues. Direct expenses are those that are clearly identifiable with a specific function, segment, or component unit. Program revenues include charges to customers who purchase, use or directly benefit from goods or services provided by a given function, segment or component unit. Program revenues also include grants and contributions that are restricted to meeting the operational or capital requirements of a particular function, segment, or component unit. Taxes and other items not properly included among program revenues are reported instead as general revenues. The District does not allocate general government (indirect) expenses to other functions. Net position is restricted when constraints placed on them are either externally imposed or are imposed by constitutional provisions or enabling legislation. Internally imposed designations of resources are not presented as restricted net position. When both restricted and unrestricted resources are available for use, generally it is the District’s policy to use restricted resources first, and then unrestricted resources as they are needed. Separate financial statements are provided for governmental funds, proprietary funds and fiduciary funds. However, the fiduciary funds are not included in the district-wide statements. Major individual governmental funds and major individual enterprise funds are reported as separate columns in the fund financial statements. E. Fund Accounting The accounts of the Red Bank School District are maintained in accordance with the principles of fund accounting to ensure observance of limitations and restrictions on the resources available. The principles of fund accounting require that resources be classified for accounting and reporting purposes into funds or account groups in accordance with activities or objectives specified for the resources. The operations of each fund are accounted for with a separate set of self-balancing accounts that comprise its assets, liabilities, fund equity, revenues and expenditures or expenses, as appropriate. Government resources are allocated to and accounted for in individual funds based upon the purposes for which they are to be spent and the means by which spending activities are controlled. An account group, on the other hand, is a financial reporting device designed to provide accountability for certain assets and liabilities that are not recorded in the funds because they do not directly affect net expendable available financial resources. The various funds and accounts are grouped, in the financial statements in this report, into seven fund types within three broad fund categories and two account groups as follows:
54

RED BANK SCHOOL DISTRICT
NOTES TO THE FINANCIAL STATEMENTS (continued): FOR THE YEAR ENDED JUNE 30, 2014
Note 1. Summary of Significant Accounting Policies (continued): Governmental Funds
General Fund - The general fund is the general operating fund of Red Bank School District and is used to account for all financial resources except those required to be accounted for in another fund. Included are certain expenditures for vehicles and movable instructional or non-instructional equipment which are classified in the Capital Outlay sub-fund.
As required by the New Jersey Department of Education Red Bank School District includes budgeted Capital Outlay in this fund. Generally accepted accounting principles as they pertain to governmental entities state that General Fund resources may be used to directly finance capital outlays for long-lived improvements as long as the resources in such cases are derived exclusively from unrestricted revenues. Resources for budgeted capital outlay purposes are normally derived from State of New Jersey Aid, interest earnings and appropriated fund balance. Expenditures are those that result in the acquisition of or additions to capital assets for land, existing buildings, improvements of grounds, construction of buildings, additions to or remodeling of buildings and the purchase of built-in equipment. These resources can be transferred from and to Current Expense by board resolution. Special Revenue Fund - The Special Revenue Fund is used to account for the proceeds of specific revenue from State and Federal Government, (other than major capital projects, Debt Service or the Enterprise Funds) and local appropriations that are legally restricted to expenditures for specified purposes. Capital Projects Fund - The capital projects fund is used to account for all financial resources to be used for the acquisition or construction of major capital facilities (other than those financed by proprietary funds). Debt Service Fund - The debt service fund is used to account for and report financial resources that are restricted, committed, or assigned to expenditure for principal and interest.
Proprietary Funds
The focus of Proprietary Fund measurement is upon determination of net income, financial position and cash flows. The generally accepted accounting principles applicable are those similar to businesses in the private sector. The following is a description of the Proprietary Funds of the District:
Enterprise - The enterprise fund is used to account for the operations that are financed and operated in a manner similar to a private business enterprise. The costs of providing goods or services are financed primarily through user charges; or, where the District has decided that periodic determination of revenues earned, expenses incurred, and/or net income is appropriate for capital maintenance, public policy, management control, accountability or other purposes.
55

RED BANK SCHOOL DISTRICT
NOTES TO THE FINANCIAL STATEMENTS (continued): FOR THE YEAR ENDED JUNE 30, 2014
Note 1. Summary of Significant Accounting Policies (continued):
All Proprietary funds are accounted for on a cost of services or “capital maintenance” measurement focus. This means that all assets and all liabilities, whether current or noncurrent, associated with their activity are included on their balance sheets. Their reported fund equity (net total position) is segregated into contributed capital and unreserved net position, if applicable. Proprietary fund type operating statements present increases (revenues) and decreases (expenses) in total net position.
Depreciation of all exhaustive capital assets used by proprietary funds is charged as an expense against their operations. Accumulated depreciation is reported on proprietary fund balance sheets. Depreciation has been provided over the estimated useful lives using the straight-line-method. The estimated useful lives are as follows: Buildings & Improvements 10-50 years Equipment 12 years
Light Trucks & Vehicles 4 years Heavy Trucks & Vehicles 6 years
The District’s enterprise fund is comprised of the following: • Food Service Fund – This fund accounts for the revenues and expenses pertaining to
the District’s cafeteria operations. Fiduciary Fund
Fiduciary funds are used to account for assets held by a governmental entity for other parties (either as trustee or as an agent) and that cannot be used to finance the governmental entity’s own operating programs which includes private purpose trust funds and agency funds.
Agency Funds - assets held by a governmental entity (either as trustee or as an agent) for other parties that cannot be used to finance the governmental entity’s own operating programs. The District currently maintains Payroll and Student Activity Funds as Agency Funds.
F. Basis of Accounting The accounting and financial reporting treatment applied to a fund is determined by its measurement focus. All governmental funds and private purpose trust funds are accounted for using a current financial resources measurement focus. With this measurement focus, only current assets and current liabilities generally are included on the balance sheet. Operating statements of these funds present increases (i.e., revenues and other financing sources) and decreases (i.e., expenditures and other financing uses) in net current assets. All proprietary funds are accounted for on a flow of economic resources measurement focus. With this measurement focus, all assets and all liabilities associated with the operation of these funds are included on the balance sheet. Fund equity (i.e., net total position) is segregated into contributed capital and retained earnings components. Proprietary fund-type operating statements present increases (i.e., revenues) and decreases (i.e., expenses) in net total position.
56
RED BANK SCHOOL DISTRICT
NOTES TO THE FINANCIAL STATEMENTS (continued): FOR THE YEAR ENDED JUNE 30, 2014
Note 1. Summary of Significant Accounting Policies (continued): The modified accrual basis of accounting is used for measuring financial position and operating results of all governmental fund types, private purpose trust funds and agency funds. Under the modified accrual basis of accounting, revenues are recognized when they become both measurable and available. “Measurable” means the amount of the transaction can be determined and “available” means collectible within the current period or soon enough thereafter to be used to pay liabilities of the current period. State equalization monies are recognized as revenue during the period in which they are appropriated. A one-year availability period is used for revenue recognition for all other governmental fund revenues. Expenditures are recognized in the accounting period in which the fund liability is incurred, except for principal and interest on general long-term debt which are recorded when due. In its accounting and financial reporting, the Red Bank School District follows the pronouncements of the Governmental Accounting Standards Board (GASB) and the pronouncements of the Financial Accounting Standards Board (FASB) and its predecessor organizations issued on or before November 30, 1989, unless they conflict with or contradict GASB pronouncements. The Red Bank School District’s proprietary funds have elected not to apply the standards issued by FASB after November 30, 1989. The accrual basis of accounting is used for measuring financial position and operating results of proprietary fund types and private purpose trust funds. Under this method, revenues are recognized in the accounting period in which they are earned and expenses are recognized when they are incurred. G. Budgets/Budgetary Control Annual appropriated budgets are prepared in the spring of each year for the general, special revenue and debt service funds. The budgets are submitted to the county office and are approved by the County Superintendent. Budgets are prepared using the modified accrual basis of accounting. The legal level of budgetary control is established at line item accounts within each fund. Line item accounts are defined as the lowest (most specific) level of detail as established pursuant to the minimum chart of accounts referenced in N.J.A.C.6:20-2A(m)1. All budget amendments must be approved by School Board resolution. Formal budgetary integration into the accounting system is employed as a management control device during the year. For governmental funds there are no substantial differences between the budgetary basis of accounting and generally accepted accounting principles with the exception of the legally mandated revenue recognition of the last state aid payment for budgetary purposes only and the special revenue fund as noted below. Encumbrance accounting is also employed as an extension of formal budgetary integration in the governmental fund types. Unencumbered appropriations lapse at fiscal year-end. The accounting records of the special revenue fund are maintained on the grant accounting budgetary basis. The grant accounting budgetary basis differs from GAAP in that the grant accounting budgetary basis recognizes encumbrances as expenditures and also recognizes the related revenues, whereas the GAAP basis does not. Sufficient supplemental records are maintained to allow for the presentation of GAAP basis financial reports. The budget, as detailed on Exhibit C-1, includes all amendments to the adopted budget, if any. The following presents a reconciliation of the special revenue fund revenues and expenditures from the budgetary basis of accounting as presented in the Combined Statement of Revenues, Expenditures and
57

RED BANK SCHOOL DISTRICT
NOTES TO THE FINANCIAL STATEMENTS (continued): FOR THE YEAR ENDED JUNE 30, 2014
Note 1. Summary of Significant Accounting Policies (continued): Changes in Fund Balances - Budget and Actual – General, Special Revenues and Debt Service Funds to the GAAP basis of accounting as presented in the Combined Statement of Revenues, Expenditures and Changes in Fund Balances - All Governmental Fund Types: H. Encumbrances Under encumbrance accounting purchase orders, contracts and other commitments for the expenditure of resources are recorded to reserve a portion of the applicable appropriation. Open encumbrances in governmental funds other than the special revenue fund are reported as reservations of fund balances at fiscal year-end as they do not constitute expenditures or liabilities but rather commitments related to unperformed contracts for goods and services. Open encumbrances in the special revenue fund for which the Red Bank School District has received advances are reflected in the balance sheet as deferred revenues at fiscal year-end. The encumbered appropriation authority carries over into the next fiscal year. An entry will be made at the beginning of the next fiscal year to increase the appropriation reflected in the certified budget by the outstanding encumbrance amount as of the current fiscal year-end. I. Cash and Cash Equivalents Cash and Cash equivalents include petty cash, change funds, cash in banks and all highly liquid investments with a maturity of three months or less at the time of purchase and are stated at cost plus accrued interest. U.S. Treasury and agency obligations and certificates of deposit with maturities of one year or less when purchased are stated at cost. New Jersey School Districts are limited as to the types of investments and types of financial institutions they may invest in. N.J.S.18A:20-37 provides a list of permissible investments that may be purchased by New Jersey school districts. Additionally, the District has adopted a cash management plan that requires it to deposit public funds in public depositories protected from loss under the provisions of the Governmental Unit Deposit Protection Act (“GUDPA”). GUDPA was enacted in 1970 to protect Governmental Units from loss of funds on deposit with a failed banking institution in New Jersey. N.J.S.A.17:9-41 et. Seq. establishes the requirements for the security of deposits of governmental units. The statute requires that no governmental unit shall deposit public funds in a public depository unless such funds are secured in accordance with the Act. Public depositories include Savings and Loan institutions, banks (both state and national banks) and savings banks the deposits of which are federally insured. All public depositories must pledge collateral, having a market value at least equal to five percent of the average daily balance of collected public funds, to secure the deposits of Governmental Units. If a public depository fails, the collateral it has pledged, plus the collateral of all other public depositories, is available to pay the full amount of their deposits to the Governmental Units. J. Tuition Receivable/Payable Tuition charges were established by the Board of Education based on estimated costs. The charges are subject to adjustment when the final costs have been determined.
58

RED BANK SCHOOL DISTRICT
NOTES TO THE FINANCIAL STATEMENTS (continued): FOR THE YEAR ENDED JUNE 30, 2014
Note 1. Summary of Significant Accounting Policies (continued): These adjustments are recorded upon certification by the State Board of Education, which is normally two years following the contract year. The cumulative adjustments through June 30, 2014, which have not been recorded, are not determinable. The tuition rate adjustments for the years 2011-2012 have been established. According to the School District’s records, these amounts of adjustments are immaterial to the financial statements. K. Inventories Inventories are valued at cost, which approximates market. The costs are determined on a first-in, first-out method. The cost of inventories in governmental fund types is recorded as expenditures when purchased rather than when consumed. L. Prepaid Expenses Prepaid expenses, which benefit future periods, are only recorded in the government-wide financial statements and in the proprietary fund statements. Prepaid expenses in the proprietary fund represent payments made to vendors for services that will benefit periods beyond June 30, 2014. They are recorded as expenditure during the year of purchase. M. Short-Term Interfund Receivables/Payables Short-term interfund receivables/payables represent amounts that are owed, other than charges for goods or services rendered to/from a particular fund in the Red Bank School District and that are due within one year. N. Capital Assets General capital assets acquired or constructed during the year are reported in the applicable governmental or business-type activities columns in the district-wide financial statements. Capital assets are defined by the District as assets, which have a cost in excess of $2,000 at the date of acquisition and a useful life of one year or more. Donated capital assets are valued at their estimated fair market value on the date received. The general capital assets acquired or constructed were valued by an independent appraisal company. General capital assets, such as land and buildings, are valued at the historical cost basis and through estimated procedures performed by an independent appraisal company, respectively. General capital assets are reflected as expenditures in the applicable governmental funds. Depreciation expense is recorded in the district-wide financial statements as well as the proprietary fund. Capital assets are depreciated on the straight-line method over the assets’ estimated useful life. There is no depreciation recorded for land and construction in progress. Generally estimated useful lives are as follows: Buildings 20-50 Years Machinery and Equipment 5-10 Years Improvements 10-20 Years
59

RED BANK SCHOOL DISTRICT
NOTES TO THE FINANCIAL STATEMENTS (continued): FOR THE YEAR ENDED JUNE 30, 2014
Note 1. Summary of Significant Accounting Policies (continued): O. Accrued Salaries and Wages District employees, who provide services to the District over the ten-month academic year and extended eleven-month calendar, do not have the option to have their salaries disbursed during the entire twelve-month year. Therefore, there is no accrual as of June 30, 2014 for such salaries.
P. Compensated Absences Compensated absences are those absences for which employees will be paid, such as vacation, sick leave and sabbatical leave. A liability for compensated absences that are attributable to services already rendered, and that are not contingent on a specific event that is outside the control of the District and its employees, is accrued as the employees earn the rights to the benefits. Compensated absences that relate to future services, or that are contingent on a specific event that is outside the control of the District and its employees, are accounted for in the period in which such services are rendered or in which such events take place. In the District-Wide financial statements, under governmental activities, compensated absences are reported as an expenditure and noncurrent liabilities. Q. Unearned Revenue Unearned revenue arises when assets are recognized before revenue recognition criteria have been satisfied and is recorded as a liability until the revenue is both measureable and the District is eligible to realize the revenue. R. Long-Term Obligations In district-wide financial statements, under governmental activities, long-term debt is recognized as a liability in the general fund as debt is incurred. S. Fund Balance The Red Bank School District classifies governmental fund balances as follows:
• Non-spendable – includes fund balance amounts that cannot be spent either because it is not in spendable form or because legal or contractual constraints.
• Restricted – includes fund balance amounts that are constrained for specific purposes which are externally imposed by external parties, constitutional provision or enabling legislation.
• Committed – includes fund balance amounts that are constrained for specific purposes that are internally imposed by the government through formal action of the highest level of decision making authority and does not lapse at year-end.
• Assigned – includes fund balance amounts that are intended to be used for specific purposes that are neither considered restricted or committed. Fund Balance may be assigned by the Business Administrator.
• Unassigned – includes balance within the General Fund which has not been classified within the above mentioned categories and negative fund balances in other governmental funds.
60

RED BANK SCHOOL DISTRICT
NOTES TO THE FINANCIAL STATEMENTS (continued): FOR THE YEAR ENDED JUNE 30, 2014
Note 1. Summary of Significant Accounting Policies (continued):
The District uses restricted/committed amounts to be spent first when both restricted and unrestricted fund balance is available, unless prohibited by law or regulation. Additionally, the District would first use committed, then assigned and lastly unassigned amounts of unrestricted fund balance when expenditures are made.
T. Net Position Net position, represents the difference between summation of assets and deferred outflows of resources, and the summation of liabilities and deferred inflows of resources. Net position is classified in the following three components:
• Net Investment in Capital Assets – This component represents capital assets, net of accumulated depreciation, net of outstanding balances of borrowings used for acquisition, construction, or improvement of those assets.
• Restricted – Net position is reported as restricted when there are limitations imposed on their use either through the enabling legislation adopted by the District or through external restrictions imposed by creditors, grantors or laws or regulations of other governments.
• Unrestricted – Net position is reported as unrestricted when it does not meet the criteria of the other two components of net position.
U. Impact of Recently Issued Accounting Principles
Recently Issued and Adopted Accounting Pronouncements
In March 2012, the GASB issued Statement 66, Technical Corrections—2012—an amendment of GASB Statements No. 10 and No. 62. GASB 66 improves accounting and financial reporting for a governmental financial reporting entity by resolving conflicting guidance that resulted from the issuance of two pronouncements, Statements No. 54, Fund Balance Reporting and Governmental Fund Type Definitions, and No. 62, Codification of Accounting and Financial Reporting Guidance Contained in Pre-November 30, 1989 FASB and AICPA Pronouncements. This Statement is effective for periods beginning after December 15, 2012 although the District elected to early implement Statement 62 in fiscal year 2012. The adoption of GASB 66 does not have any impact on the District’s financial statements. In March 2012, the GASB issued Statement 65, Items Previously Reported as Assets and Liabilities. GASB 65 establishes accounting and financial reporting standards that reclassify, as deferred outflows of resources or deferred inflows of resources, certain items that were previously reported as assets and liabilities. This Statement is effective for periods beginning after December 15, 2012. Management has implemented this Statement in the District’s financial statements for the year ended June 30, 2014 with a prior period adjustment to beginning net position. See note 21 for more information. Recently Issued Accounting Pronouncements In June 2012, the GASB issued Statement 68, Accounting and Financial Reporting for Pensions—an amendment of GASB Statement 27. GASB 68 improves accounting and financial reporting by state and local governments for pensions. It also improves information provided by state and local governmental employers about financial support for pensions that is provided by other entities. This Statement results from a comprehensive review of the effectiveness of existing standards of accounting and financial
61

RED BANK SCHOOL DISTRICT
NOTES TO THE FINANCIAL STATEMENTS (continued): FOR THE YEAR ENDED JUNE 30, 2014
Note 1. Summary of Significant Accounting Policies (continued): reporting for pensions with regard to providing decision-useful information, supporting assessments of accountability and inter-period equity, and creating additional transparency. This Statement is effective for fiscal years beginning after June 15, 2014. Management is currently evaluating the impact of the adoption of this statement on the District’s financial statements. S. Subsequent Events The Red Bank School District has evaluated subsequent events occurring after June 30, 2014 through the date of October 16, 2014, which is the date the financial statements were available to be issued. Note 2. Cash and Cash Equivalents The District is governed by the deposit and investment limitations of New Jersey state law. The cash and cash equivalents held at June 30, 2014, are reported at carrying value as follows:
CarryingType Value
DepositsDemand Deposits 2,724,720.55$
Total Deposits 2,724,720.55$
The District's Cash and Cash Equivalents are Reported as Follows:Government Activities 2,592,840.26$ Business-Type Activities 20,074.71 Fiduciary Funds 111,805.58
Total Cash and Cash Equivalents 2,724,720.55$
Custodial Credit Risk – Custodial credit risk is the risk that, in the event of a bank failure, the Board’s deposits may not be recovered. Although the Board does not have a formal policy regarding custodial credit risk, NJSA 17:9-41 et seq. requires that the governmental units shall deposit public funds in public depositories protected from loss under the provisions of the Governmental Unit Deposit Protection Act (GUDPA). GUDPA is a supplemental insurance program set forth by the New Jersey Legislature to protect the deposits of local governmental agencies. The program is administered by the Commissioner of the New Jersey Department of Banking and Insurance. Under the Act, the first $250,000 of governmental deposits in each insured depository is protected by FDIC. Public fund owned by the Board in excess of FDIC insured amounts are protected by GUDPA. However, GUDPA does not protect intermingled trust funds such as salary withholdings, student activity funds or funds that may pass to the Board relative to the happening of a future condition. Such funds are shown as Uninsured and Uncollateralized in the schedule below. As of June 30, 2014, the District’s bank balance of $3,373,832.55 was exposed to custodial credit risk as follows:
62

RED BANK SCHOOL DISTRICT
NOTES TO THE FINANCIAL STATEMENTS (continued): FOR THE YEAR ENDED JUNE 30, 2014
Note 2. Cash and Cash Equivalents (continued): Insured Under FDIC $ 250,000.00 Uninsured and uncollateralized 200,636.82 Collateralized in the District’s Name Under GUDPA 2,923,195.73 Total $3,373,832.55 Note 3. Reserve Accounts A. Capital Reserve Account A capital reserve account was established by the Red Bank School District by inclusion of $100.00 on October 3, 2000, for the accumulation of funds for use as capital outlay expenditures in subsequent fiscal years. The capital reserve account is maintained in the general fund and its activity is included in the general fund annual budget. Funds placed in the capital reserve account are restricted to capital projects in the district’s approved Long Range Facilities Plan (LRFP). Upon submission of the LRFP to the department, a district may increase the balance in the capital reserve by appropriating funds in the annual general fund budget certified for taxes or by transfer by Board resolution at year-end of any unanticipated revenue or unexpended line-item appropriation amounts, or both. A district may also appropriated additional amounts when the express approval of the voters has been obtained either by a separate proposal at budget time or by a special question at one of the four special elections authorized pursuant to N.J.S.A.19:60-2. Pursuant to N.J.A.C.6:23A-14.1(g), the balance in the account cannot at any time exceed the local support costs of uncompleted capital projects in its approved LRFP The activity of the capital reserve for the July 1, 2013 to June 30, 2014 fiscal year is as follows:
Beginning Balance, July 1, 2013 59,666.10$
Interest Earnings 120.09
Ending Balance, June 30, 2014 59,786.19$
B. Maintenance Reserve Account A Maintenance Reserve Account was established by the Red Bank School District for the accumulation of funds for use as maintenance expenditures in subsequent fiscal years. The Maintenance Reserve Account is maintained in the General Fund and its activity is included in the General Fund annual budget.
63

RED BANK SCHOOL DISTRICT
NOTES TO THE FINANCIAL STATEMENTS (continued): FOR THE YEAR ENDED JUNE 30, 2014
Note 3. Reserve Accounts (continued): The maintenance reserve account is used to accumulate funds for the required maintenance of a facility in accordance with the EFCFA (N.J.S.A.18A:7G-9) as amended by P.L. 2004, c. 73 (S1701). Districts may only increase the balance in the maintenance reserve account by appropriating funds in the annual general fund budget certified for taxes (N.J.A.C. 6A:23A-14.2) or by deposit of any unanticipated revenue or unexpended line-item appropriation by board resolution at year end. The board resolution for deposit at year end into a maintenance reserve account must be made between June 1 and June 30 of the budget year (N.J.S.A 18A:7F-41, N.J.A.C. 6A:23A-14.3). EFCFA requires that upon District completion of a school facilities project, the district must submit a plan for the maintenance of that facility. The activity of the maintenance reserve account for the July 1, 2013 to June 30, 2014 fiscal year is as follows:
Beginning Balance, July 1, 2013 249,188.89$
Increased by:Board Resolution, June 17, 2014 200,000.00
Ending Balance, June 30, 2014 449,188.89$
Note 4. Accounts Receivable Accounts receivable at June 30, 2014 consisted of accounts and intergovernmental grants. All receivables are considered collectible in full due to the stable condition of state programs and the current fiscal year guarantee of federal funds. Accounts receivable as of fiscal year end for the School District’s individual major and fiduciary funds, in the aggregate, are as follows:
Special CapitalGeneral Revenue Projects Proprietary
Fund Fund Fund Funds Total
State Aid 143,775.91$ 483.45$ 28,800.00$ 1,470.67$ 174,530.03$ Federal Aid - 314,233.20 - 57,587.75 371,820.95 Other - 19,855.07 - 15,946.65 35,801.72
Total 143,775.91$ 334,571.72$ 28,800.00$ 75,005.07$ 582,152.70$
Note 5. Capital Assets The schedule on the following page is a summarization of the capital assets by source for the fiscal year ended June 30, 2014.
64

RED BANK SCHOOL DISTRICT
NOTES TO THE FINANCIAL STATEMENTS (continued): FOR THE YEAR ENDED JUNE 30, 2014
Note 5. Capital Assets (continued):
June 30, June 30,2013 Additions Deletions 2014
Governmental Activities:Capital assets that are not
being depreciated:Land 3,514,100.00$ -$ -$ 3,514,100.00$ Construction in progress - 72,000.00 - 72,000.00
Total capital assets not being depreciated 3,514,100.00 72,000.00 - 3,586,100.00
Buildings and improvements 17,052,937.04 - - 17,052,937.04 Machinery and equipment 799,925.12 225,868.91 - 1,025,794.03
Subtotal 17,852,862.16 225,868.91 - 18,078,731.07
Less: accumulated depreciation:Buildings and improvements (6,416,509.70) (390,517.11) - (6,807,026.81) Machinery and equipment (504,788.76) (102,797.18) - (607,585.94)
Total accumulated depreciation (6,921,298.46) (493,314.29) - (7,414,612.75)
Total capital assets being depreciated, net 10,931,563.70 (267,445.38) - 10,664,118.32
Governmental activities capital assets, net 14,445,663.70$ (195,445.38)$ -$ 14,250,218.32$
65

RED BANK SCHOOL DISTRICT
NOTES TO THE FINANCIAL STATEMENTS (continued): FOR THE YEAR ENDED JUNE 30, 2014
Note 5. Capital Assets (continued):
June 30, June 30,2013 Additions Deletions 2014
Business-Type Activities:Buildings and improvements 85,770.00$ -$ -$ 85,770.00$ Equipment 125,188.17 - - 125,188.17
Subtotal 210,958.17 - - 210,958.17
Less: accumulated depreciation:Buildings and improvements (47,891.93) (3,967.04) - (51,858.97) Equipment (77,433.64) (6,065.83) - (83,499.47)
Total accumulated depreciation (125,325.57) (10,032.87) - (135,358.44)
Total capital assets being depreciated, net 85,632.60 (10,032.87) - 75,599.73
Business-type activities capital assets, net 85,632.60$ (10,032.87)$ -$ 75,599.73$
Note 6. Long-Term Obligations A. Long-Term Obligation Activity During the fiscal year ended June 30, 2014 the following changes occurred in liabilities reported in the long-term obligations:
June 30, Accrued/ Retired/ June 30, Due Within2013 Increases Decreases 2014 One Year
Governmental Activities:General Obligation Bonds 3,185,000.00$ -$ (360,000.00)$ 2,825,000.00$ 360,000.00$ Amortization of Bond Premium 114,060.34 - (14,257.54) 99,802.80 14,257.54 Compensated Absences 55,778.00 - (42,808.00) 12,970.00 Loans Payable - NJDEA 41,036.32 - (41,036.32) -
Total 3,395,874.66$ -$ (458,101.86)$ 2,937,772.80$ 374,257.54$
B. Bonds Payable Bonds are authorized in accordance with State law by the voters of the District through referendums. All bonds are retired in serial installments within the statutory period of usefulness. Bonds issued by the District are general obligation bonds.
66

RED BANK SCHOOL DISTRICT
NOTES TO THE FINANCIAL STATEMENTS (continued): FOR THE YEAR ENDED JUNE 30, 2014
Note 6. Long-Term Obligations (continued): On July 20, 2005, the District issued General Obligation Bonds totaling $4,690,000.00 for the purpose of renovations to the schools. The Bonds bear interest of 5.15% per annum payable semi-annually on the first day of November and May of each year, until maturity. The principal is due annually on the first day of May through 2021, installments range from $340,000.00 to $430,000.00. Debt Service requirements on serial bonds payable at June 30, 2014 are as follows:
Year Prinicpal Interest Total
2015 360,000.00$ 125,875.00$ 485,875.00$ 2016 370,000.00 108,775.00 478,775.00 2017 410,000.00 92,125.00 502,125.00 2018 410,000.00 73,675.00 483,675.00 2019 405,000.00 55,225.00 460,225.00
2020-2021 870,000.00 54,200.00 924,200.00
2,825,000.00$ 509,875.00$ 3,334,875.00$
C. Bonds Authorized But Not Issued As of June 30, 2014, the District had no authorized but not issued bonds. D. Capital Leases As of June 30, 2014, the District had no capital leases. E. Loans Payable – N.J.E.D.A The loan payable is a school facilities loan which is administered by, and payable to, the New Jersey Economic Development Authority. The loan is for renovation and improvements to the primary and middle schools. As of June 30, 2014, the principal and interest due on loans outstanding is $0.00. Note 7. Interfund Receivables and Payables The following interfund balances remained on the balance sheet at June 30, 2014:
67

RED BANK SCHOOL DISTRICT
NOTES TO THE FINANCIAL STATEMENTS (continued): FOR THE YEAR ENDED JUNE 30, 2014
Note 7. Interfund Receivables and Payables (continued):
Interfund InterfundFund Receivable Payable
General Fund 90,171.60$ -$ Special Revenue Fund - 90,171.60
Total 90,171.60$ 90,171.60$
The purpose of interfunds are short-term borrowings. Note 8. Inventory Inventory recorded at June 30, 2014 in business-type activities on the government-wide statement of net position, and on the food service enterprise fund statement of net position, consisted of the following:
Food $1,920.36 Supplies 2,361.68 Total $4,322.00 Note 9. Pension Plans Plan Descriptions - All required employees of the District are covered by either the Public Employees’ Retirement System or the Teachers’ Pension and Annuity Fund which have been established by state statute and are administered by the New Jersey Division of Pension and Benefits (Division). According to the State of New Jersey Administrative Code, all obligations of both systems will be assumed by the State of New Jersey should the Systems terminate. The Division issues a publicly available financial report that includes the financial statements and required supplementary information for the Public Employees Retirement System and the Teachers’ Pension and Annuity Fund. These reports may be obtained by writing to the Division of Pensions and Benefits, P.O. Box 295, Trenton, New Jersey, 08625. Teachers' Pension and Annuity Fund (TPAF) - The Teachers' Pension and Annuity Fund was established in January 1955, under the provisions of N.J.S.A.18A:66 to provide retirement benefits, death, disability and medical benefits to certain qualified members. The Teachers’ Pension and Annuity Fund is considered a cost-sharing multiple-employer plan with a special funding situation, as under current statute, all employer contributions are made by the State of New Jersey on behalf of the District and the system’s other related noncontributing employers. Membership is mandatory for substantially all teachers or members of the professional staff certified by the State Board of Examiners and employees of the Department of Education who have titles that are unclassified, professional and certified. Public Employees' Retirement System (PERS) - The Public Employees' Retirement System (PERS) was established in January 1955 under the provisions of N.J.S.A.43:15A to provide retirement, death, disability and medical benefits to certain qualified members. The Public Employees’ Retirement System is a cost-sharing multiple-employer plan. Membership is mandatory for substantially all full-time
68

RED BANK SCHOOL DISTRICT
NOTES TO THE FINANCIAL STATEMENTS (continued): FOR THE YEAR ENDED JUNE 30, 2014
Note 9. Pension Plans (continued): employees of the State of New Jersey or any county, municipality, school district, or public agency, provided the employee is not required to be a member of another state-administered retirement system or other state or local jurisdiction. Vesting and Benefit Provisions - The vesting and benefit provisions of PERS are set by N.J.S.A.43:15A and 43.3B and N.J.S.A.18A:6C for TPAF. All benefits vest after eight to ten years of service, except for medical benefits that vest after 25 years of service. Retirement benefits for age and service are available at age 55 and are generally determined to be 1/55 of the final average salary for each year of service credit, as defined. Final average salary equals the average salary for the final three years of service prior to retirement (or highest three years’ compensation if other than the final three years). Members may seek early retirement after achieving 25 years of service credit or they may elect deferred retirement after achieving eight to ten years of service in which case benefits would begin the first day of the month after the member attains normal retirement age. The TPAF and PERS provides for specified medical benefits for members who retire after achieving 25 years of qualified service, as defined, or under the disability provisions of the System. Members are always fully vested for their own contributions and, after three years of service credit, become vested for 2% of related interest earned on the contributions. In the case of death before retirement, members’ beneficiaries are entitled to full interest credited to the members’ accounts. Chapter 78, P.L. 2011 changed this for employees enrolled after June 28, 2011. See Significant Legislation below. Significant Legislation – During the year ended June 30, 1997, legislation was enacted (Chapter 114, P.L. 1997) authorizing the New Jersey Economic Development Authority to issue bonds, notes or other obligations for the purpose of financing, in full or in part, the State of New Jersey’s portion of the unfunded accrued liability under the State of New Jersey retirement systems. Additional legislation enacted during the year ended June 30, 1997 (Chapter 115, P.L. 1997) changed the asset valuation method from market related value to full-market value. This legislation also contained a provision to reduce the employee contribution rate by ½ of 1% to 4.5% for calendar years 1998 and 1999, and to allow for a reduction in the employee’s rate after calendar year 1999, providing excess valuation assets are available. The legislation also provided that the District’s normal contributions to the Fund may be reduced based on the revaluation of assets. Due to recognition of the bond proceeds and the change in asset valuation method as a result of enactment of Chapters 114 and 115, all unfunded accrued liabilities were eliminated, except for the unfunded liability for local early retirement incentive benefits; accordingly, the pension costs for TPAF and PERS were reduced. New Legislation signed by the Acting Governor (Chapter 133, Public Laws 2001) changed the formula for calculating retirement benefits for all current and future non-veteran retirees from N/60 to N/55 (a 9.09% increase). This legislation, signed June 29, 2001, provides that all members of the TPAF and the PERS will have their pensions calculated on the basis of years of credit divided by 55. It also provides that all current retirees will have their original pension recalculated under the N/55 formula. Starting February 1, 2002, pension cost of living adjustments will be based on the new original pension. Effective June 28, 2011, Chapter 78, P.L. 2011 reformed various pension and health benefits provisions. Employees hired after June 28, 2011 and enrolled in PERS will be enrolled in a new tier, Tier 5. Full retirement for Tier 5 PERS members will be age 65 and 30 years of service.
69
RED BANK SCHOOL DISTRICT
NOTES TO THE FINANCIAL STATEMENTS (continued): FOR THE YEAR ENDED JUNE 30, 2014
Note 9. Pension Plans (continued): All cost of living adjustments are frozen until the pension fund reaches a “target funded ratio”. Chapter 78 also requires all covered employees to contribute a prescribed percentage towards their health costs. Contribution Requirements – The contribution policy is set by N.J.S.A.43:15A, Chapter 62, P.L. of 1994, Chapter 115, P.L. of 1997 and N.J.S.A.18:66, and requires contributions by active members and contributing employers. Plan member and employer contributions may be amended by State of New Jersey legislation. TPAF and PERS provide for employee contributions of 6.5%, effective October 1, 2011, of employees’ annual compensation, as defined. Employers are required to contribute at an actuarially determined rate in both TPAF and PERS. The actuarially determined contribution includes funding for both cost-of-living adjustments, noncontributory death benefits and post-retirement medical premiums. Under current statute the District is a noncontributing employer of the TPAF.
Annual Percentage Net Year Pension of APC Pension
Funded Cost (APC) Contributed Obligation
6/30/2014 252,504.00 100% -$ 6/30/2013 248,536.00 100% - 6/30/2012 247,745.00 100% -
Three-Year Trend Information for PERS
Annual Percentage Net Year Pension of APC Pension
Funded Cost (APC) Contributed Obligation
6/30/2014 703,075.00$ 100% -$ 6/30/2013 886,625.00 100% - 6/30/2012 579,988.00 100% -
Three-Year Trend Information for TPAF Normal & Post Retirement Medical Contributions(Paid on behalf of the District)
During the year ended June 30, 2014 the State of New Jersey contributed $703,075.00 to the TPAF for normal and post-retirement benefits on behalf of the District. Also in accordance with N.J.S.A.18A:66-66 the State of New Jersey reimbursed the District $447,698.96 for the year ended June 30, 2014 for the employer's share of social security contributions for TPAF members as calculated on their base salaries. This amount has been included in the basic financial statements, and the combining and individual fund and account group statements and schedules as a revenue and expenditure in accordance with GASB 27.
70

RED BANK SCHOOL DISTRICT
NOTES TO THE FINANCIAL STATEMENTS (continued): FOR THE YEAR ENDED JUNE 30, 2014
Note 10. Post-Retirement Benefits P.L. 1987, c. 384 and P.L. 1990, c.6 required Teachers’ Pensions and Annuity Fund (TPAF) and the Public Employees’ Retirement System (PERS), respectively, to fund post-retirement medical benefits for those State Employees who retire after accumulating 25 years of credited service or on a disability retirement. P.L. 2007, c.103 amended the law to eliminate the funding of post-retirement medical benefits through the TPAF and PERS. It created separate funds outside of the pension plans for the funding and payment of post-retirement medical benefits for retired State employees and retired educational employees. As of June 30, 2014, there were 100,134 retirees receiving post-retirement medical benefits, and the state contributed $1.07 billion on their behalf.. The cost of these benefits is funded through contributions by the State in accordance with P.L. 1994, c.62. Funding of post-retirement medical benefits changed from a pre-funding basis to a pay-as-you-go basis beginning in Fiscal Year 1994. The State is also responsible for the cost attributable to P.L. 1992, c.126, which provides employer paid health benefits to members of PERS and the Alternate Benefit Program who retired from a board of education or county college with 25 years of service. The State paid $173.8 million toward Chapter 126 benefits for 17,356 eligible retired members in Fiscal Year 2014.
Note 11. Risk Management The District is exposed to various risks of loss related to torts; theft of, damage to and destruction of assets; errors and omissions; injuries to employees; and natural disasters. Property and Liability Insurance – The District maintains commercial insurance coverage for property, liability, student accident and surety bonds. A complete schedule of insurance coverage can be found in the Statistical Section of this Comprehensive Annual Financial Report. New Jersey Unemployment Compensation Insurance – The District has elected to fund its New Jersey Unemployment Compensation Insurance under the “Contributory Method”. Note 12. Contingent Liabilities The District participates in numerous state and federal grant programs, which are governed by various rules and regulations of the grantor agencies; therefore, to the extent that the District has not complied with the rules and regulations governing the grants, refunds of any money received may be required and the collectability of any related receivable at June 30, 2014 may be impaired. In the opinion of the District, there are no significant contingent liabilities relating to compliance with the rules and regulations governing the respective grants; therefore, no provisions have been recorded in the accompanying combined financial statements for such contingencies. Note 13. Economic Dependency The District receives a substantial amount of its support from federal and state governments. A significant reduction in the level of support, if this were to occur, could have an effect on the District’s programs and activities.
71

RED BANK SCHOOL DISTRICT
NOTES TO THE FINANCIAL STATEMENTS (continued): FOR THE YEAR ENDED JUNE 30, 2014
Note 14. Deferred Compensation The Board offers its employees a choice of the following deferred compensation plans created in accordance with Internal Revenue Code Section 403(b). The plans, which are administered by the entities listed below, permits participants to defer a portion of their salary until future years. Amounts deferred under the plans are not available to employees until termination, retirement, death or unforeseeable emergency. The plan administrators are as follows: AXA Equitable MetLife VALIC Note 15. Compensated Absences The District accounts for compensated absences (e.g., unused vacation, sick leave) as directed by Governmental Accounting Standards Board Statement No. 16 (GASB 16), “Accounting for Compensated Absences”. A liability for compensated absences attributable to services already rendered and not contingent on a specific event that is outside the control of the employer and employee is accrued as employees earn the rights to the benefits. District employees are granted varying amounts of vacation and sick leave in accordance with the district’s school personnel policy. Upon termination, employees are paid for accrued vacation. The district’s school’s policy permits employees to accumulate unused sick leave and carry forward the full amount to subsequent years. Upon retirement employees shall be paid by the district school for the unused sick leave in accordance with district’s agreements with various employee unions. The liability for vested compensated absences of the governmental fund types is recorded in the statement of net position under governmental activities. The current portion of the compensated absence balance is not considered material to the applicable funds total liabilities, and is therefore not shown separately from the long-term liability balance of compensated absences. The amount at June 30, 2014 is $12,970.00. The liability for vested compensated absences of the proprietary fund types is recorded within those funds as the benefits accrue to employees. As of June 30, 2014 no liability existed for compensated absences in the proprietary fund types.
Note 16. Lease Obligations At June 30, 2014 the School District did not have any operating lease agreements. Note 17. Fund Balance Disclosure General Fund (Exhibit B-1) – Of the $1,530,704.99 General Fund fund balance at June 30, 2014, $59,786.19 has been restricted for the Capital Reserve Account; $449,188.89 has been restricted for the Maintenance Reserve; $142,022.73 has been restricted as current year excess surplus in accordance with N.J.S.A. 18A:7F-7 (See Note 18); $49,605.61 has been restricted for excess surplus – designated for subsequent year’s expenditures; $346,039.39 has been assigned for excess surplus – designated for subsequent year’s expenditures; and $78,838.77 has been assigned for other purposes.
72

RED BANK SCHOOL DISTRICT
NOTES TO THE FINANCIAL STATEMENTS (continued): FOR THE YEAR ENDED JUNE 30, 2014
Note 17. Fund Balance Disclosure (continued): Capital Projects Fund – The fund balance of $757,287.55 is restricted for future Capital Project expenditures. Debt Service Fund – The fund balance of $683.21 is restricted in accordance with N.J.S.A 7F-41c(2). Note 18. Calculation of Excess Surplus The designation for Reserved Fund Balance – Excess Surplus is a required calculation pursuant to N.J.S.A. 18A:7F-7, as amended. New Jersey school districts are required to reserve General Fund fund balance at the fiscal year-end of June 30 if they did not appropriate a required minimum amount as budgeted fund balance in their subsequent years’ budget. The excess fund balance at June 30, 2014 is $142,022.73. Note 19. Deficit in Net Position Restricted Net Position – The School District had a deficit in restricted net position for Debt Service in the amount of $20,295.96 at June 30, 2014. The deficit is caused by the accrual of bond interest in the government-wide financial statements. Unrestricted Net Position – The School District had a deficit in unrestricted net position in the amount of $198,727.30 at June 30, 2014. The deficit is caused by the accrual of compensated absences liability in the government-wide financial statements and the final state aid payment of $289,801.80 not recognized in the GAAP financial statements. Note 20. Transfers to Capital Outlay During the year ending June 30, 2014, the district transferred $27,305.00 to the capital outlay accounts. Note 21. Prior Period Restatement As discussed in Note 1, the District has implemented GASB Statement 65, Items Previously Reported as Assets and Liabilities in the District’s financial statements for the year ended June 30, 2014. As a result, net position as of July 1, 2013 has been restated as follows:
Original Net Restated Balance Adjustment Balance Unamortized Bond Issuance Costs (1) $ (40,141.72) $ 40,141.72 $ -0-
Net Position, July 1, 2013 $12,095,167.83 $ (40,141.72) $ 12,055,026.11 (1) Previously reported as an asset on the Statement of Net Position and amortized over the life of related debt.
73

This page intentionally left blank
74

REQUIRED SUPPLEMENTARY INFORMATION - PART II
75

This page intentionally left blank
76
C. Budgetary Comparison Schedules
77

This page intentionally left blank
78

EX
HIB
IT C
-1
Var
ianc
eV
aria
nce
Ori
gina
lB
udge
tF
inal
Fin
al T
oO
rigi
nal
Bud
get
Fin
alF
inal
To
Bud
get
Tra
nsfe
rsB
udge
tA
ctua
lA
ctua
lB
udge
tT
rans
fers
Bud
get
Act
ual
Act
ual
RE
VE
NU
ES
Loc
al S
ourc
es:
Loc
al T
ax L
evy
10-1
210
13,1
74,6
91.0
0$
-
$
13,1
74,6
91.0
0$
13
,174
,691
.04
$
0.04
$
12,6
52,1
88.0
0$
-
$
12,6
52,1
88.0
0$
12
,652
,188
.00
$
-$
In
tere
st E
arne
d on
Cap
ital
Res
erve
Fun
ds10
-15X
X12
0.00
-
12
0.00
(120
.00)
50.0
0
-
50
.00
11
8.72
68.7
2
Unr
estr
icte
d M
isce
llan
eous
Rev
enue
s10
-19X
X20
,000
.00
-
20,0
00.0
0
103,
061.
11
83
,061
.11
20
,000
.00
-
20,0
00.0
0
12,2
02.6
6
(7,7
97.3
4)
-
T
otal
Loc
al S
ourc
es13
,194
,811
.00
-
13
,194
,811
.00
13,2
77,7
52.1
5
82
,941
.15
12
,672
,238
.00
-
12
,672
,238
.00
12,6
64,5
09.3
8
(7
,728
.62)
Sta
te S
ourc
es:
Ext
raor
dina
ry A
id10
-313
176
,000
.00
-
76,0
00.0
0
119,
895.
00
43
,895
.00
17
,346
.00
-
17,3
46.0
0
62,1
66.0
0
44,8
20.0
0
Cat
egor
ical
Spe
cial
Edu
cati
on A
id10
-313
266
5,74
9.00
-
66
5,74
9.00
665,
749.
00
-
655,
621.
00
-
655,
621.
00
65
5,62
1.00
-
E
qual
izat
ion
Aid
10-3
176
1,39
9,21
5.00
-
1,39
9,21
5.00
1,
399,
215.
00
-
1,
430,
366.
00
-
1,
430,
366.
00
1,43
0,36
6.00
-
Cat
egor
ical
Sec
urit
y A
id10
-317
715
6,71
1.00
-
15
6,71
1.00
156,
711.
00
-
141,
592.
00
-
141,
592.
00
14
1,59
2.00
-
C
ateg
oric
al T
rans
port
atio
n A
id10
-312
134
,744
.00
-
34,7
44.0
0
34,7
44.0
0
-
28
,841
.00
-
28,8
41.0
0
28,8
41.0
0
-
U
nder
Ade
quac
y A
id10
-312
133
9,21
9.00
-
33
9,21
9.00
339,
219.
00
-
-
-
-
-
-
S
uppl
emen
tal E
nrol
lmen
t Gro
wth
Aid
10-3
197
373,
912.
00
-
373,
912.
00
37
3,91
2.00
-
-
373,
912.
00
37
3,91
2.00
373,
912.
00
-
Oth
er S
tate
Aid
10-3
190
-
-
-
1,
981.
00
1,98
1.00
-
-
-
1,75
2.80
1,
752.
80
TP
AF
Con
trib
utio
ns (
On-
Beh
alf
- N
on-B
udge
ted)
-
-
-
26
6,35
4.00
266,
354.
00
-
-
-
395,
311.
00
39
5,31
1.00
TP
AF
Pos
t Ret
irem
ent M
edic
al (
On-
Beh
alf
- N
on-B
udge
ted)
-
-
-
43
6,72
1.00
436,
721.
00
-
-
-
470,
515.
00
47
0,51
5.00
TP
AF
Soc
ial S
ecur
ity
(Rei
mbu
rsed
- N
on-B
udge
ted)
-
-
-
44
7,69
8.96
447,
698.
96
-
-
-
485,
549.
88
48
5,54
9.88
-
T
otal
Sta
te S
ourc
es3,
045,
550.
00
-
3,
045,
550.
00
4,24
2,19
9.96
1,
196,
649.
96
2,27
3,76
6.00
37
3,91
2.00
2,64
7,67
8.00
4,
045,
626.
68
1,39
7,94
8.68
Fed
eral
Sou
rces
:M
edic
aid
Rei
mbu
rsem
ent
10-4
200
22,0
72.0
0
-
22
,072
.00
4,
389.
49
(17,
682.
51)
19,8
65.0
0
-
19
,865
.00
8,
187.
93
(11,
677.
07)
Tot
al F
eder
al S
ourc
es22
,072
.00
-
22,0
72.0
0
4,38
9.49
(1
7,68
2.51
)
19
,865
.00
-
19,8
65.0
0
8,18
7.93
(1
1,67
7.07
)
Tot
al R
even
ues
16,2
62,4
33.0
0
-
16,2
62,4
33.0
0
17
,524
,341
.60
1,26
1,90
8.60
14
,965
,869
.00
373,
912.
00
15
,339
,781
.00
16,7
18,3
23.9
9
1,
378,
542.
99
GE
NE
RA
L F
UN
DB
UD
GE
TA
RY
CO
MP
AR
ISO
N S
CH
ED
UL
ER
ED
BA
NK
SC
HO
OL
DIS
TR
ICT
June
30,
201
4Ju
ne 3
0, 2
013
FO
R T
HE
FIS
CA
L Y
EA
RS
EN
DE
D J
UN
E 3
0, 2
014
AN
D 2
013
79

EX
HIB
IT C
-1
Var
ianc
eV
aria
nce
Ori
gina
lB
udge
tF
inal
Fin
al T
oO
rigi
nal
Bud
get
Fin
alF
inal
To
Bud
get
Tra
nsfe
rsB
udge
tA
ctua
lA
ctua
lB
udge
tT
rans
fers
Bud
get
Act
ual
Act
ual
GE
NE
RA
L F
UN
DB
UD
GE
TA
RY
CO
MP
AR
ISO
N S
CH
ED
UL
ER
ED
BA
NK
SC
HO
OL
DIS
TR
ICT
June
30,
201
4Ju
ne 3
0, 2
013
FO
R T
HE
FIS
CA
L Y
EA
RS
EN
DE
D J
UN
E 3
0, 2
014
AN
D 2
013
EX
PE
ND
ITU
RE
SC
urre
nt E
xpen
se:
Reg
ular
Pro
gram
s -
Inst
ruct
ion:
Sal
arie
s of
Tea
cher
s:K
inde
rgar
ten
11-1
10-1
00-1
0138
5,72
5.00
11,3
17.3
8
397,
042.
38
38
9,67
1.38
7,37
1.00
43
4,96
4.00
(22,
477.
72)
412,
486.
28
40
4,48
6.28
8,00
0.00
G
rade
s 1-
511
-120
-100
-101
1,99
7,20
1.00
(2
31,4
77.1
3)
1,76
5,72
3.87
1,
751,
439.
83
14,2
84.0
4
1,93
7,68
7.00
(1
97,7
21.5
2)
1,73
9,96
5.48
1,
734,
510.
48
5,45
5.00
G
rade
s 6-
811
-130
-100
-101
887,
529.
00
17
,098
.11
90
4,62
7.11
899,
523.
76
5,
103.
35
797,
029.
00
10
6,68
7.66
903,
716.
66
90
3,71
6.66
-
R
egul
ar P
rogr
ams
- H
ome
Inst
ruct
ion:
Sal
arie
s of
Tea
cher
s 11
-150
-100
-101
5,00
0.00
18
,776
.00
23
,776
.00
22
,784
.00
99
2.00
1,50
0.00
12
,420
.00
13
,920
.00
12
,928
.00
99
2.00
Pur
chas
ed P
rofe
ssio
nal -
Edu
cati
onal
Ser
vice
s11
-150
-100
-320
3,00
0.00
4,
931.
50
7,93
1.50
7,
931.
50
-
4,
500.
00
(1,9
05.0
0)
2,59
5.00
2,
595.
00
-
R
egul
ar P
rogr
ams
- U
ndis
trib
uted
Ins
truc
tion
:O
ther
Sal
arie
s fo
r In
stru
ctio
n11
-190
-100
-106
354,
425.
00
10
9,74
0.69
464,
165.
69
46
4,16
1.14
4.55
183,
366.
00
13
5,25
3.33
318,
619.
33
31
8,61
9.33
-
P
urch
ased
Pro
fess
iona
l - E
duca
tion
al S
ervi
ces
11-1
90-1
00-3
2055
,974
.00
(1
4,73
3.58
)
41
,240
.42
39
,921
.62
1,
318.
80
62,3
28.0
0
21,3
32.4
2
83,6
60.4
2
82,2
73.4
8
1,38
6.94
P
urch
ased
Tec
hnic
al S
ervi
ces
11-1
90-1
00-3
4019
,621
.00
(4
,575
.00)
15
,046
.00
13
,097
.62
1,
948.
38
25,7
08.0
0
(11,
749.
70)
13,9
58.3
0
13,9
58.3
0
-
O
ther
Pur
chas
ed S
ervi
ces
(400
- 5
00 s
erie
s)11
-190
-100
-500
77,1
52.0
0
(25,
108.
46)
52,0
43.5
4
40,3
01.3
2
11,7
42.2
2
44,3
96.0
0
(26,
476.
25)
17,9
19.7
5
16,0
40.8
9
1,87
8.86
G
ener
al S
uppl
ies
11-1
90-1
00-6
1035
9,42
2.00
28,3
89.1
9
387,
811.
19
35
8,88
6.67
28,9
24.5
2
327,
828.
00
15
0,43
1.31
478,
259.
31
39
2,66
2.90
85,5
96.4
1
Tex
tboo
ks11
-190
-100
-640
7,16
8.00
87
,121
.57
94
,289
.57
94
,288
.51
1.
06
36
,695
.00
50
,010
.65
86
,705
.65
36
,043
.75
50
,661
.90
O
ther
Obj
ects
11-1
90-1
00-8
003,
000.
00
(1,3
76.7
6)
1,62
3.24
-
1,62
3.24
3,
000.
00
(2,9
00.0
0)
100.
00
10
0.00
-
Tot
al R
egul
ar P
rogr
ams
- In
stru
ctio
n4,
155,
217.
00
103.
51
4,
155,
320.
51
4,08
2,00
7.35
73
,313
.16
3,
859,
001.
00
212,
905.
18
4,
071,
906.
18
3,91
7,93
5.07
15
3,97
1.11
Spe
cial
Edu
cati
on -
Ins
truc
tion
:L
earn
ing
and/
or L
angu
age
Dis
abil
itie
s:S
alar
ies
of T
each
ers
11-2
04-1
00-1
0112
5,01
5.00
57,0
04.0
0
182,
019.
00
18
2,01
9.00
-
15
9,98
5.00
(37,
535.
00)
122,
450.
00
12
2,45
0.00
-
O
ther
Sal
arie
s fo
r In
stru
ctio
n11
-204
-100
-106
26,5
55.0
0
51,8
72.2
5
78,4
27.2
5
78,4
27.2
5
-
74
,517
.00
23
,066
.50
97
,583
.50
97
,453
.23
13
0.27
Gen
eral
Sup
plie
s11
-204
-100
-610
2,74
2.00
2,
590.
83
5,33
2.83
5,
332.
83
-
2,
742.
00
(821
.00)
1,92
1.00
1,
921.
00
-
Tot
al L
earn
ing
and/
or L
angu
age
Dis
abil
itie
s15
4,31
2.00
111,
467.
08
26
5,77
9.08
265,
779.
08
-
237,
244.
00
(1
5,28
9.50
)
22
1,95
4.50
221,
824.
23
13
0.27
Beh
avio
ral D
isab
ilit
ies:
Sal
arie
s of
Tea
cher
s11
-209
-100
-101
-
-
-
-
-
-
7,86
2.25
7,
862.
25
7,86
2.25
-
Oth
er S
alar
ies
for
Inst
ruct
ion
11-2
09-1
00-1
06-
-
-
-
-
-
2,
500.
00
2,50
0.00
2,
500.
00
-
Tot
al B
ehav
iora
l Dis
abil
itie
s-
-
-
-
-
-
10
,362
.25
10
,362
.25
10
,362
.25
-
Mul
tipl
e D
isab
ilit
ies:
Sal
arie
s of
Tea
cher
s11
-212
-100
-101
131,
765.
00
(2
,000
.00)
12
9,76
5.00
129,
765.
00
-
133,
363.
00
(6
,231
.12)
12
7,13
1.88
127,
131.
88
-
Oth
er S
alar
ies
for
Inst
ruct
ion
11-2
12-1
00-1
0618
7,96
0.00
(92,
145.
00)
95,8
15.0
0
95,8
15.0
0
-
10
1,01
9.00
31,7
03.0
7
132,
722.
07
13
2,72
2.07
-
G
ener
al S
uppl
ies
11-2
12-1
00-6
101,
777.
00
1,01
7.62
2,
794.
62
2,67
1.79
12
2.83
1,77
7.00
(1
67.3
4)
1,
609.
66
1,60
9.66
-
Tot
al M
ulti
ple
Dis
abil
itie
s32
1,50
2.00
(93,
127.
38)
228,
374.
62
22
8,25
1.79
122.
83
23
6,15
9.00
25,3
04.6
1
261,
463.
61
26
1,46
3.61
-
Res
ourc
e R
oom
/Res
ourc
e C
ente
r:S
alar
ies
of T
each
ers
11-2
13-1
00-1
0125
8,83
5.00
20,2
28.2
6
279,
063.
26
27
9,06
3.26
-
28
8,43
5.00
19,8
78.2
6
308,
313.
26
30
7,90
5.00
408.
26
O
ther
Sal
arie
s fo
r In
stru
ctio
n11
-213
-100
-106
55,3
10.0
0
(16,
688.
00)
38,6
22.0
0
38,6
22.0
0
-
-
70
,348
.99
70
,348
.99
70
,348
.99
-
Gen
eral
Sup
plie
s11
-213
-100
-610
750.
00
37
.57
78
7.57
774.
78
12
.79
3,
457.
00
(1
,806
.97)
1,
650.
03
1,65
0.03
-
Tot
al R
esou
rce
Roo
m/R
esou
rce
Cen
ter
314,
895.
00
3,
577.
83
318,
472.
83
31
8,46
0.04
12.7
9
291,
892.
00
88
,420
.28
38
0,31
2.28
379,
904.
02
40
8.26
Pre
scho
ol D
isab
ilit
ies
- F
ull-
Tim
e:S
alar
ies
of T
each
ers
11-2
16-1
00-1
0149
,393
.00
(9
51.4
3)
48
,441
.57
48
,441
.57
-
68,6
77.0
0
(23,
647.
86)
45,0
29.1
4
45,0
29.1
4
-
O
ther
Sal
arie
s fo
r In
stru
ctio
n11
-216
-100
-106
56,1
10.0
0
(30,
235.
04)
25,8
74.9
6
302.
46
25
,572
.50
13
4,15
2.00
(91,
157.
08)
42,9
94.9
2
42,9
94.9
2
-
P
urch
ased
Pro
fess
iona
l - E
duca
tion
al S
ervi
ces
11-2
16-1
00-3
20-
-
-
-
-
2,00
0.00
(2
,000
.00)
-
-
-
Oth
er P
urch
ased
Ser
vice
s (4
00 -
500
ser
ies)
11-2
16-1
00-5
00-
-
-
-
-
-
-
-
-
-
G
ener
al S
uppl
ies
11-2
16-1
00-6
002,
000.
00
(1,6
79.6
9)
320.
31
32
0.31
-
2,
016.
00
(129
.44)
1,88
6.56
1,
886.
56
-
O
ther
Obj
ects
11-2
16-1
00-8
00-
-
-
-
-
1,00
0.00
(1
,000
.00)
-
-
-
80

EX
HIB
IT C
-1
Var
ianc
eV
aria
nce
Ori
gina
lB
udge
tF
inal
Fin
al T
oO
rigi
nal
Bud
get
Fin
alF
inal
To
Bud
get
Tra
nsfe
rsB
udge
tA
ctua
lA
ctua
lB
udge
tT
rans
fers
Bud
get
Act
ual
Act
ual
GE
NE
RA
L F
UN
DB
UD
GE
TA
RY
CO
MP
AR
ISO
N S
CH
ED
UL
ER
ED
BA
NK
SC
HO
OL
DIS
TR
ICT
June
30,
201
4Ju
ne 3
0, 2
013
FO
R T
HE
FIS
CA
L Y
EA
RS
EN
DE
D J
UN
E 3
0, 2
014
AN
D 2
013
Tot
al P
resc
hool
Dis
abil
itie
s -
Ful
l-T
ime
107,
503.
00
(3
2,86
6.16
)
74
,636
.84
49
,064
.34
25
,572
.50
20
7,84
5.00
(117
,934
.38)
89
,910
.62
89
,910
.62
-
Tot
al S
peci
al E
duca
tion
- I
nstr
ucti
on89
8,21
2.00
(10,
948.
63)
887,
263.
37
86
1,55
5.25
25,7
08.1
2
973,
140.
00
(9
,136
.74)
96
4,00
3.26
963,
464.
73
53
8.53
Bil
ingu
al E
duca
tion
- I
nstr
ucti
on:
Sal
arie
s of
Tea
cher
s11
-240
-100
-101
549,
419.
00
20
7,21
7.68
756,
636.
68
75
1,45
2.69
5,18
3.99
64
9,02
9.00
(117
,706
.75)
53
1,32
2.25
529,
912.
93
1,
409.
32
Oth
er S
alar
ies
for
Inst
ruct
ion
11-2
40-1
00-1
0627
,755
.00
-
27,7
55.0
0
27,7
55.0
0
-
26
,307
.00
3,
028.
00
29,3
35.0
0
29,3
35.0
0
-
P
urch
ased
Ser
vice
s (3
00-5
00 s
erie
s)11
-240
-100
-500
950.
00
(9
50.0
0)
-
-
-
-
-
-
-
-
G
ener
al S
uppl
ies
11-2
40-1
00-6
1033
,325
.00
3,
513.
74
36,8
38.7
4
33,7
23.7
4
3,11
5.00
32
,256
.00
(7
,215
.81)
25
,040
.19
24
,415
.29
62
4.90
Tex
tboo
ks11
-240
-100
-640
-
-
-
-
-
1,
970.
00
(837
.24)
1,13
2.76
1,
132.
76
-
O
ther
Obj
ects
11-2
40-1
00-8
00-
-
-
-
-
-
-
-
-
-
Tot
al B
ilin
gual
Edu
cati
on -
Ins
truc
tion
611,
449.
00
20
9,78
1.42
821,
230.
42
81
2,93
1.43
8,29
8.99
70
9,56
2.00
(122
,731
.80)
58
6,83
0.20
584,
795.
98
2,
034.
22
Sch
ool S
pons
ored
Co/
Ext
ra-C
urri
cula
r A
ctiv
itie
s -
Inst
ruct
ion:
Sal
arie
s11
-401
-100
-100
2,20
0.00
4,
640.
00
6,84
0.00
6,
807.
00
33.0
0
-
2,
739.
70
2,73
9.70
97
1.70
1,76
8.00
Tot
al S
choo
l Spo
nsor
ed C
o/E
xtra
-Cur
ricu
lar
Act
ivit
ies
- In
stru
ctio
n2,
200.
00
4,64
0.00
6,
840.
00
6,80
7.00
33
.00
-
2,73
9.70
2,
739.
70
971.
70
1,
768.
00
Sch
ool S
pons
ored
Ath
leti
cs -
Ins
truc
tion
:S
alar
ies
11-4
02-1
00-1
0024
,882
.00
5,
778.
00
30,6
60.0
0
28,2
34.0
0
2,42
6.00
22
,084
.00
(2
,631
.06)
19
,452
.94
-
19,4
52.9
4
Pur
chas
ed S
ervi
ces
(300
-500
ser
ies)
11-4
02-1
00-5
0013
,823
.00
(7
,050
.32)
6,
772.
68
6,46
8.68
30
4.00
5,58
0.00
1,
130.
86
6,71
0.86
-
6,71
0.86
S
uppl
ies
and
Mat
eria
ls11
-402
-100
-600
6,60
0.00
48
8.32
7,08
8.32
5,
861.
17
1,22
7.15
4,
641.
00
700.
30
5,
341.
30
-
5,
341.
30
.-
Tot
al S
choo
l Spo
nsor
ed A
thle
tics
- I
nstr
ucti
on45
,305
.00
(7
84.0
0)
44
,521
.00
40
,563
.85
3,
957.
15
32,3
05.0
0
(799
.90)
31,5
05.1
0
-
31
,505
.10
Com
mun
ity
Ser
v. P
rogr
ams/
Ope
rati
ons:
Sal
arie
s11
-800
-330
-100
-
4,
700.
00
4,70
0.00
94
0.00
3,76
0.00
97
5.00
-
97
5.00
975.
00
-
Pur
chas
ed S
ervi
ces
11-8
00-3
30-5
006,
900.
00
(4,7
00.0
0)
2,20
0.00
2,
200.
00
-
6,
300.
00
(3,5
03.0
0)
2,79
7.00
2,
797.
00
-
S
uppl
ies
and
Mat
eria
ls11
-800
-330
-600
-
-
-
-
-
-
3,14
7.37
3,
147.
37
3,14
7.37
-
Tot
al -
Com
mun
ity
Ser
v. P
rogr
ams/
Ope
rati
ons
6,90
0.00
-
6,90
0.00
3,
140.
00
3,76
0.00
7,
275.
00
(355
.63)
6,91
9.37
6,
919.
37
-
Tot
al -
Ins
truc
tion
5,71
9,28
3.00
20
2,79
2.30
5,92
2,07
5.30
5,
807,
004.
88
115,
070.
42
5,
581,
283.
00
82,6
20.8
1
5,66
3,90
3.81
5,
474,
086.
85
189,
816.
96
Und
ist.
Exp
end.
- I
nstr
ucti
on:
Tui
tion
To
Oth
er L
EA
s W
ithi
n th
e S
tate
- S
peci
al11
-000
-100
-562
-
18
,241
.64
18
,241
.64
16
,145
.64
2,
096.
00
54,0
82.0
0
(44,
912.
62)
9,16
9.38
9,
169.
38
-
T
uiti
on T
o P
riva
te S
choo
ls f
or th
e D
isab
led
Wit
hin
Sta
te11
-000
-100
-566
615,
792.
00
12
5,97
3.32
741,
765.
32
60
8,67
8.58
133,
086.
74
26
6,51
9.00
285,
148.
27
55
1,66
7.27
450,
386.
75
10
1,28
0.52
Tot
al U
ndis
t. E
xpen
d. -
Ins
truc
tion
615,
792.
00
14
4,21
4.96
760,
006.
96
62
4,82
4.22
135,
182.
74
32
0,60
1.00
240,
235.
65
56
0,83
6.65
459,
556.
13
10
1,28
0.52
Und
ist.
Exp
end.
- A
tten
danc
e an
d S
ocia
l Wor
k S
ervi
ces:
Sal
arie
s of
Fam
ily
Lia
sion
s/C
omm
Par
ent I
nv. S
pe11
-000
-211
-173
37,4
33.0
0
150.
00
37
,583
.00
37
,421
.56
16
1.44
45,1
94.0
0
(6,1
19.6
3)
39,0
74.3
7
38,3
09.5
5
764.
82
Tot
al U
ndis
t. E
xpen
d. -
Att
enda
nce
and
Soc
ial W
ork
Ser
vice
s37
,433
.00
15
0.00
37,5
83.0
0
37,4
21.5
6
161.
44
45
,194
.00
(6
,119
.63)
39
,074
.37
38
,309
.55
76
4.82
Und
ist.
Exp
end.
- H
ealt
h S
ervi
ces:
Sal
arie
s11
-000
-213
-100
100,
280.
00
(1
9,00
1.23
)
81
,278
.77
81
,278
.52
0.
25
16
6,46
4.00
(2,2
14.0
0)
164,
250.
00
16
4,25
0.00
-
P
urch
ased
Pro
fess
iona
l and
Tec
hnic
al S
ervi
ces
11-0
00-2
13-3
0068
,075
.00
(2
6,87
5.00
)
41
,200
.00
31
,685
.00
9,
515.
00
66,0
75.0
0
(25,
529.
72)
40,5
45.2
8
40,5
45.2
8
-
S
uppl
ies
and
Mat
eria
ls11
-000
-213
-600
1,74
6.00
11
8.67
1,86
4.67
1,
864.
67
-
1,
746.
00
(147
.20)
1,59
8.80
15
8.83
1,43
9.97
O
ther
Obj
ects
11-0
00-2
13-8
0017
5.00
(1.7
5)
173.
25
17
3.25
-
17
5.00
(1.7
5)
173.
25
17
3.25
-
Tot
al U
ndis
t. E
xpen
d. -
Hea
lth
Ser
vice
s17
0,27
6.00
(45,
759.
31)
124,
516.
69
11
5,00
1.44
9,51
5.25
23
4,46
0.00
(27,
892.
67)
206,
567.
33
20
5,12
7.36
1,43
9.97
Und
ist.
Exp
end.
- S
peec
h, O
T, P
T &
Rel
ated
Svc
:S
alar
ies
11-0
00-2
16-1
0014
0,48
5.00
(29,
650.
02)
110,
834.
98
98
,552
.98
12
,282
.00
14
0,60
9.00
(2,7
74.6
0)
137,
834.
40
13
7,83
4.40
-
P
urch
ased
Pro
fess
iona
l - E
duca
tion
al S
ervi
ces
11-0
00-2
16-3
2039
,600
.00
11
,483
.75
51
,083
.75
37
,409
.65
13
,674
.10
60
,400
.00
(4
3,18
0.58
)
17
,219
.42
12
,801
.46
4,
417.
96
81

EX
HIB
IT C
-1
Var
ianc
eV
aria
nce
Ori
gina
lB
udge
tF
inal
Fin
al T
oO
rigi
nal
Bud
get
Fin
alF
inal
To
Bud
get
Tra
nsfe
rsB
udge
tA
ctua
lA
ctua
lB
udge
tT
rans
fers
Bud
get
Act
ual
Act
ual
GE
NE
RA
L F
UN
DB
UD
GE
TA
RY
CO
MP
AR
ISO
N S
CH
ED
UL
ER
ED
BA
NK
SC
HO
OL
DIS
TR
ICT
June
30,
201
4Ju
ne 3
0, 2
013
FO
R T
HE
FIS
CA
L Y
EA
RS
EN
DE
D J
UN
E 3
0, 2
014
AN
D 2
013
Tra
vel
11-0
00-2
16-5
80-
73.3
2
73.3
2
73.3
2
-
-
205.
72
20
5.72
205.
72
-
Sup
plie
s an
d M
ater
ials
11-0
00-2
16-6
002,
647.
00
(353
.58)
2,29
3.42
2,
293.
42
-
2,
647.
00
(54.
56)
2,59
2.44
2,
592.
44
-
O
ther
Obj
ects
11-0
00-2
16-8
0065
0.00
(650
.00)
-
-
-
-
-
-
-
-
Tot
al U
ndis
t. E
xpen
d. -
Spe
ech,
OT
, PT
& R
elat
ed S
vc.
183,
382.
00
(1
9,09
6.53
)
16
4,28
5.47
138,
329.
37
25
,956
.10
20
3,65
6.00
(45,
804.
02)
157,
851.
98
15
3,43
4.02
4,41
7.96
Und
ist.
Exp
end.
- O
ther
Sup
port
Ser
v. S
tude
nts
- G
uida
nce:
Sal
arie
s of
Oth
er P
rofe
ssio
nal S
taff
11-0
00-2
18-1
0413
5,76
5.00
(26,
080.
00)
109,
685.
00
10
9,68
5.00
-
12
9,08
7.00
15,3
81.6
9
144,
468.
69
14
4,32
3.69
145.
00
O
ther
Pur
chas
ed S
ervi
ces
(400
-500
ser
ies)
11-0
00-2
18-5
00-
-
-
-
-
-
24
0.00
240.
00
24
0.00
-
S
uppl
ies
and
Mat
eria
ls11
-000
-218
-600
1,00
0.00
(2
10.7
8)
78
9.22
692.
82
96
.40
1,
344.
00
(141
.31)
1,20
2.69
1,
051.
17
151.
52
Tot
al U
ndis
t. -
Gui
danc
e13
6,76
5.00
(26,
290.
78)
110,
474.
22
11
0,37
7.82
96.4
0
130,
431.
00
15
,480
.38
14
5,91
1.38
145,
614.
86
29
6.52
Und
ist.
Exp
end.
- C
hild
Stu
dy T
eam
s:S
alar
ies
of O
ther
Pro
fess
iona
l Sta
ff11
-000
-219
-104
195,
126.
00
7,
406.
89
202,
532.
89
18
0,33
2.89
22,2
00.0
0
138,
700.
00
2,
699.
94
141,
399.
94
14
1,39
9.94
-
S
alar
ies
of S
ecre
tari
al a
nd C
leri
cal A
ssis
tant
s11
-000
-219
-105
40,0
00.0
0
1,32
7.80
41
,327
.80
41
,327
.80
-
54,5
04.0
0
694.
57
55
,198
.57
55
,198
.57
-
Oth
er S
alar
ies
11-0
00-2
19-1
10-
394.
00
39
4.00
394.
00
-
-
-
-
-
-
P
urch
ased
Pro
fess
iona
l - E
duca
tion
al S
ervi
ces
11-0
00-2
19-3
2038
,815
.00
(1
4,78
0.00
)
24
,035
.00
23
,937
.27
97
.73
29
,665
.00
(2
8,04
0.00
)
1,
625.
00
1,17
5.00
45
0.00
Oth
er P
urch
ased
Pro
f. a
nd T
ech.
Ser
vice
s11
-000
-219
-390
768.
00
(7
68.0
0)
-
-
-
768.
00
(7
68.0
0)
-
-
M
isc
Pur
chas
ed S
ervi
ces
(400
- 5
00 s
erie
s O
ther
Tha
n R
esid
. Co1
1-00
0-21
9-59
21,
500.
00
(1,2
20.9
0)
279.
10
27
8.56
0.54
1,95
0.00
(9
47.4
7)
1,
002.
53
1,00
2.53
-
Sup
plie
s an
d M
ater
ials
11-0
00-2
19-6
004,
309.
00
(797
.13)
3,51
1.87
2,
427.
52
1,08
4.35
4,
309.
00
(194
.85)
4,11
4.15
4,
044.
83
69.3
2
Tot
al U
ndis
t. E
xpen
d. -
Chi
ld S
tudy
Tea
ms
280,
518.
00
(8
,437
.34)
27
2,08
0.66
248,
698.
04
23
,382
.62
22
9,89
6.00
(26,
555.
81)
203,
340.
19
20
2,82
0.87
519.
32
Und
ist.
Exp
end.
- I
mpr
ovem
ent o
f In
stru
ctio
nal S
ervi
ces:
Sal
arie
s of
Sup
ervi
sors
of
Inst
ruct
ion
11-0
00-2
21-1
0219
9,24
0.00
42,5
78.5
4
241,
818.
54
23
4,81
8.54
7,00
0.00
24
5,13
0.00
(3,1
01.3
6)
242,
028.
64
24
2,02
8.64
-
S
alar
ies
of S
ecre
tari
al a
nd C
leri
cal A
ssis
tant
s11
-000
-221
-105
-
32
,609
.40
32
,609
.40
32
,609
.40
-
13,9
23.0
0
(1,3
50.5
2)
12,5
72.4
8
1,05
5.48
11
,517
.00
O
ther
Sal
arie
s11
-000
-221
-110
77,9
48.0
0
(53,
826.
91)
24,1
21.0
9
23,1
86.1
1
934.
98
4,
408.
00
21,7
88.7
6
26,1
96.7
6
25,1
32.7
6
1,06
4.00
S
alar
ies
of F
acil
itat
ors,
Mat
h &
Lit
erac
y C
oach
es11
-000
-221
-176
-
-
-
-
-
-
53,0
78.1
6
53,0
78.1
6
43,8
91.1
6
9,18
7.00
P
urch
ased
Pro
fess
iona
l - E
duca
tion
al S
ervi
ces
11-0
00-2
21-3
20-
-
-
-
-
-
1,
120.
00
1,12
0.00
-
1,12
0.00
O
ther
Pur
chas
ed P
rof.
and
Tec
h. S
ervi
ces
11-0
00-2
19-3
9013
,762
.00
1,
016.
00
14,7
78.0
0
14,7
78.0
0
-
-
-
-
-
O
ther
Pur
chas
ed S
ervi
ces
(400
- 5
00 s
erie
s)11
-000
-221
-500
6,50
0.00
(3
,940
.33)
2,
559.
67
2,52
9.26
30
.41
2,
300.
00
(488
.56)
1,81
1.44
72
3.90
1,08
7.54
S
uppl
ies
and
Mat
eria
ls11
-000
-221
-600
19,9
68.0
0
(16,
738.
58)
3,22
9.42
3,
227.
88
1.54
20,4
20.0
0
(12,
641.
78)
7,77
8.22
6,
582.
23
1,19
5.99
O
ther
Obj
ects
11-0
00-2
21-8
004,
308.
00
(782
.24)
3,52
5.76
3,
488.
00
37.7
6
3,08
5.00
(2
,328
.00)
75
7.00
757.
00
-
Tot
al U
ndis
t. E
xpen
d. -
Im
prov
emen
t of
Inst
ruct
iona
l Ser
vice
s32
1,72
6.00
915.
88
32
2,64
1.88
314,
637.
19
8,
004.
69
289,
266.
00
56
,076
.70
34
5,34
2.70
320,
171.
17
25
,171
.53
Und
ist.
Exp
end.
- E
duca
tion
al M
edia
/Sch
ool L
ibra
ry:
Sal
arie
s11
-000
-222
-100
60,0
45.0
0
-
60
,045
.00
60
,045
.00
-
58,8
35.0
0
(145
.00)
58,6
90.0
0
58,6
90.0
0
-
S
alar
ies
of T
echn
olog
y C
oord
inat
ors
11-0
00-2
22-1
7713
9,36
7.00
-
13
9,36
7.00
130,
691.
38
8,
675.
62
132,
238.
00
(1
,217
.61)
13
1,02
0.39
131,
020.
39
-
Sup
plie
s an
d M
ater
ials
11-0
00-2
22-6
007,
229.
00
(2,6
53.9
1)
4,57
5.09
4,
134.
37
440.
72
14
,965
.00
(3
,985
.82)
10
,979
.18
10
,770
.19
20
8.99
Tot
al U
ndis
t. E
xpen
d. -
Edu
cati
onal
Med
ia/S
choo
l Lib
rary
206,
641.
00
(2
,653
.91)
20
3,98
7.09
194,
870.
75
9,
116.
34
206,
038.
00
(5
,348
.43)
20
0,68
9.57
200,
480.
58
20
8.99
Und
ist.
Exp
end.
- I
nstr
ucti
onal
Sta
ff T
rain
ing
Ser
vice
s:S
alar
ies
of S
ecre
tari
al a
nd C
leri
cal A
ssis
tant
s11
-000
-223
-105
4,00
0.00
-
4,00
0.00
3,
800.
00
200.
00
13
,923
.00
(3
,311
.96)
10
,611
.04
61
1.04
10,0
00.0
0
Oth
er P
urch
ased
Ser
vice
s (4
00 -
500
ser
ies)
11-0
00-2
23-5
001,
000.
00
-
1,
000.
00
196.
81
80
3.19
900.
00
(2
79.9
0)
62
0.10
620.
10
-
Tot
al U
ndis
t. E
xpen
d. -
Ins
truc
tion
al S
taff
Tra
inin
g S
ervi
ces
5,00
0.00
-
5,00
0.00
3,
996.
81
1,00
3.19
14
,823
.00
(3
,591
.86)
11
,231
.14
1,
231.
14
10,0
00.0
0
Und
ist.
Exp
end.
- S
uppo
rt S
ervi
ces
- G
ener
al A
dmin
istr
atio
n:S
alar
ies
11-0
00-2
30-1
0023
4,67
5.00
(13,
668.
64)
221,
006.
36
20
6,11
7.39
14,8
88.9
7
227,
230.
00
26
,461
.04
25
3,69
1.04
253,
691.
04
-
Leg
al S
ervi
ces
11-0
00-2
30-3
3120
,000
.00
45
,917
.72
65
,917
.72
35
,565
.59
30
,352
.13
18
,000
.00
5,
644.
03
23,6
44.0
3
23,6
44.0
3
-
A
udit
Fee
s11
-000
-230
-332
32,0
00.0
0
-
32
,000
.00
31
,685
.00
31
5.00
31,0
75.0
0
-
31
,075
.00
31
,075
.00
-
Arc
hite
ctur
al/E
ngin
eeri
ng S
ervi
ces
11-0
00-2
30-3
3420
,000
.00
(1
4,87
6.07
)
5,
123.
93
4,60
8.93
51
5.00
15,0
00.0
0
(5,3
51.2
5)
9,64
8.75
4,
524.
82
5,12
3.93
O
ther
Pur
chas
ed P
rofe
ssio
nal S
ervi
ces
11-0
00-2
30-3
39-
10,6
83.5
3
10,6
83.5
3
9,50
0.00
1,
183.
53
-
3,
340.
35
3,34
0.35
1,
472.
00
1,86
8.35
P
urch
ased
Tec
h. S
ervi
ces
11-0
00-2
30-3
405,
000.
00
(5,0
00.0
0)
-
-
-
2,
500.
00
(1,2
92.4
0)
1,20
7.60
1,
207.
60
-
82

EX
HIB
IT C
-1
Var
ianc
eV
aria
nce
Ori
gina
lB
udge
tF
inal
Fin
al T
oO
rigi
nal
Bud
get
Fin
alF
inal
To
Bud
get
Tra
nsfe
rsB
udge
tA
ctua
lA
ctua
lB
udge
tT
rans
fers
Bud
get
Act
ual
Act
ual
GE
NE
RA
L F
UN
DB
UD
GE
TA
RY
CO
MP
AR
ISO
N S
CH
ED
UL
ER
ED
BA
NK
SC
HO
OL
DIS
TR
ICT
June
30,
201
4Ju
ne 3
0, 2
013
FO
R T
HE
FIS
CA
L Y
EA
RS
EN
DE
D J
UN
E 3
0, 2
014
AN
D 2
013
Com
mun
icat
ions
/Tel
epho
ne11
-000
-230
-530
57,8
70.0
0
3,26
7.00
61
,137
.00
52
,297
.31
8,
839.
69
55,6
75.0
0
(24,
197.
17)
31,4
77.8
3
30,9
77.8
3
500.
00
B
OE
Oth
er P
urch
ased
Ser
vice
s11
-000
-230
-585
8,50
0.00
12
,558
.56
21
,058
.56
14
,015
.22
7,
043.
34
3,00
0.00
14
,611
.50
17
,611
.50
17
,611
.50
-
Mis
cell
aneo
us P
urch
ased
Ser
vice
s11
-000
-230
-590
2,50
0.00
1,
334.
83
3,83
4.83
3,
834.
83
-
3,
120.
00
2,75
4.06
5,
874.
06
5,87
4.06
-
Gen
eral
Sup
plie
s 11
-000
-230
-610
6,00
0.00
(8
11.6
0)
5,
188.
40
4,33
7.91
85
0.49
1,70
0.00
1,
588.
34
3,28
8.34
3,
288.
30
0.04
Mis
cell
aneo
us E
xpen
ditu
res
11-0
00-2
30-8
903,
000.
00
(1,7
15.9
7)
1,28
4.03
45
4.50
829.
53
4,
500.
00
342.
44
4,
842.
44
4,84
2.44
-
BO
E M
embe
rshi
p an
d D
ues
11-0
00-2
30-8
957,
500.
00
(1,4
03.6
1)
6,09
6.39
6,
096.
39
-
6,
500.
00
(403
.61)
6,09
6.39
6,
096.
39
-
Tot
al U
ndis
t. E
xpen
d. -
Sup
port
Ser
vice
s -
Gen
eral
Adm
inis
trat
ion
397,
045.
00
36
,285
.75
43
3,33
0.75
368,
513.
07
64
,817
.68
36
8,30
0.00
23,4
97.3
3
391,
797.
33
38
4,30
5.01
7,49
2.32
-
Und
ist.
Exp
end.
- S
uppo
rt S
ervi
ces
- S
choo
l Adm
inis
trat
ion:
Sal
arie
s of
Pri
ncip
als/
Ass
ista
nt P
rinc
ipal
s11
-000
-240
-103
253,
770.
00
2,
861.
08
256,
631.
08
25
6,63
1.08
-
21
2,49
4.00
28,9
99.1
8
241,
493.
18
23
4,49
3.18
7,00
0.00
S
alar
ies
of S
ecre
tari
al a
nd C
leri
cal A
ssis
tant
s11
-000
-240
-105
194,
179.
00
31
,261
.75
22
5,44
0.75
197,
512.
33
27
,928
.42
20
3,66
4.00
(9,7
14.1
0)
193,
949.
90
19
1,46
5.90
2,48
4.00
O
ther
Pur
chas
ed S
ervi
ces
(400
- 5
00 s
erie
s)11
-000
-240
-500
3,60
4.00
5,
000.
00
8,60
4.00
4,
293.
33
4,31
0.67
3,
604.
00
(1,1
60.4
6)
2,44
3.54
2,
434.
26
9.28
Sup
plie
s an
d M
ater
ials
11-0
00-2
40-6
007,
655.
00
2,61
4.52
10
,269
.52
5,
703.
59
4,56
5.93
7,
768.
00
(1,9
96.1
7)
5,77
1.83
5,
708.
22
63.6
1
Tot
al U
ndis
t. E
xpen
d. -
Sup
port
Ser
vice
s -
Sch
ool A
dmin
istr
atio
n45
9,20
8.00
41,7
37.3
5
500,
945.
35
46
4,14
0.33
36,8
05.0
2
427,
530.
00
16
,128
.45
44
3,65
8.45
434,
101.
56
9,
556.
89
Und
ist.
Exp
end.
- C
entr
al S
ervi
ces:
Sal
arie
s11
-000
-251
-100
205,
950.
00
21
,390
.70
22
7,34
0.70
227,
340.
70
-
175,
433.
00
5,
263.
65
180,
696.
65
16
9,43
3.65
11,2
63.0
0
Pur
chas
ed P
rofe
ssio
nal S
ervi
ces
11-0
00-2
51-3
30-
-
-
-
-
1,20
0.00
(1
,200
.00)
-
-
-
Mis
c. P
urch
ased
Ser
vice
s (4
00 -
500
ser
ies)
11-0
00-2
51-5
922,
100.
00
(1,8
95.5
7)
204.
43
17
5.30
29.1
3
650.
00
(5
74.1
8)
75
.82
75
.82
-
Sup
plie
s an
d M
ater
ials
11-0
00-2
51-6
009,
300.
00
2,25
1.67
11
,551
.67
7,
375.
60
4,17
6.07
7,
000.
00
410.
37
7,
410.
37
6,98
2.53
42
7.84
Mis
cell
aneo
us E
xpen
ditu
res
11-0
00-2
51-8
901,
500.
00
2,90
4.02
4,
404.
02
2,69
0.09
1,
713.
93
1,08
2.00
1,
181.
54
2,26
3.54
2,
263.
54
-
Tot
al U
ndis
t. E
xpen
d. -
Cen
tral
Ser
vice
s21
8,85
0.00
24,6
50.8
2
243,
500.
82
23
7,58
1.69
5,91
9.13
18
5,36
5.00
5,08
1.38
19
0,44
6.38
178,
755.
54
11
,690
.84
Und
ist.
Exp
end.
- A
dmin
. Inf
o. T
echn
olog
y:P
urch
ased
Tec
hnic
al S
ervi
ces
11-0
00-2
52-3
4018
6,55
5.00
(22,
184.
00)
164,
371.
00
15
1,44
4.59
12,9
26.4
1
119,
076.
00
(2
0,10
7.58
)
98
,968
.42
95
,851
.42
3,
117.
00
Sup
plie
s an
d M
ater
ials
11-0
00-2
52-6
00-
4,40
4.28
4,
404.
28
971.
87
3,
432.
41
3,19
9.00
17
0.46
3,36
9.46
3,
369.
46
-
O
ther
Obj
ects
11-0
00-2
52-8
003,
650.
00
1,59
5.72
5,
245.
72
653.
90
4,
591.
82
1,13
4.00
(3
29.7
4)
80
4.26
804.
26
-
Tot
al U
ndis
t. E
xpen
d. -
Adm
in. I
nfo.
Tec
hnol
ogy
190,
205.
00
(1
6,18
4.00
)
17
4,02
1.00
153,
070.
36
16
,358
.82
12
3,40
9.00
(20,
266.
86)
103,
142.
14
10
0,02
5.14
3,11
7.00
Und
ist.
Exp
end.
- R
equi
red
Mai
nten
ance
for
Sch
ool F
acil
itie
s:S
alar
ies
11-0
00-2
61-1
0024
4,35
7.00
(24,
690.
40)
219,
666.
60
21
5,69
8.05
3,96
8.55
19
0,00
0.00
10,3
41.0
4
200,
341.
04
20
0,34
1.04
-
C
lean
ing,
Rep
air
and
Mai
nten
ance
Ser
vice
s11
-000
-261
-420
75,7
19.0
0
3,75
2.62
79
,471
.62
72
,087
.25
7,
384.
37
73,5
49.0
0
17,5
67.5
2
91,1
16.5
2
88,0
50.0
3
3,06
6.49
G
ener
al S
uppl
ies
11-0
00-2
61-6
1021
,585
.00
4,
583.
75
26,1
68.7
5
21,6
28.8
5
4,53
9.90
21
,963
.00
(1
,000
.00)
20
,963
.00
17
,791
.93
3,
171.
07
Oth
er O
bjec
ts11
-000
-261
-800
2,11
0.00
(0
.37)
2,
109.
63
1,48
5.68
62
3.95
920.
00
-
920.
00
53
0.00
390.
00
-
-
T
otal
Und
ist.
Exp
end.
- R
equi
red
Mai
nten
ance
for
Sch
ool F
acil
itie
s34
3,77
1.00
(16,
354.
40)
327,
416.
60
31
0,89
9.83
16,5
16.7
7
286,
432.
00
26
,908
.56
31
3,34
0.56
306,
713.
00
6,
627.
56
Und
ist.
Exp
end.
- C
usto
dial
Ser
vice
s:S
alar
ies
11-0
00-2
62-1
0036
1,38
7.00
(45,
995.
17)
315,
391.
83
29
8,03
1.04
17,3
60.7
9
391,
840.
00
(6
11.2
8)
39
1,22
8.72
357,
886.
55
33
,342
.17
S
alar
ies
of N
on-I
nstr
ucti
onal
Aid
s11
-000
-262
-107
47,2
00.0
0
496.
92
47
,696
.92
44
,309
.99
3,
386.
93
-
-
-
-
-
P
urch
ased
Pro
fess
iona
l and
Tec
hnic
al S
ervi
ces
11-0
00-2
62-3
0075
0.00
700.
00
1,
450.
00
1,45
0.00
-
600.
00
(4
21.0
8)
17
8.92
178.
92
-
Cle
anin
g, R
epai
r an
d M
aint
enan
ce S
ervi
ces
11-0
00-2
62-4
2014
,800
.00
46
,015
.95
60
,815
.95
15
,787
.95
45
,028
.00
14
,450
.00
56
,028
.04
70
,478
.04
53
,868
.04
16
,610
.00
R
enta
l of
Lan
d &
Bui
ldin
g O
ther
Tha
n L
ease
Pur
chas
e A
grm
t11
-000
-262
-441
750.
00
-
750.
00
-
750.
00
70
0.00
(382
.25)
317.
75
31
0.55
7.20
Oth
er P
urch
ased
Pro
pert
y S
ervi
ces
11-0
00-2
62-4
9032
,000
.00
-
32,0
00.0
0
30,7
81.0
3
1,21
8.97
32
,307
.00
(9
3.96
)
32
,213
.04
29
,713
.04
2,
500.
00
Insu
ranc
e11
-000
-262
-520
188,
500.
00
(3
2,30
4.50
)
15
6,19
5.50
155,
653.
07
54
2.43
157,
505.
00
8,
916.
50
166,
421.
50
14
1,72
6.00
24,6
95.5
0
Mis
cell
aneo
us P
urch
ased
Ser
vice
s11
-000
-262
-590
16,0
25.0
0
32,6
30.0
0
48,6
55.0
0
24,7
03.8
3
23,9
51.1
7
14,5
69.0
0
23,2
61.0
0
37,8
30.0
0
5,20
0.00
32
,630
.00
G
ener
al S
uppl
ies
11-0
00-2
62-6
1050
,335
.00
10
,160
.89
60
,495
.89
40
,416
.74
20
,079
.15
37
,274
.00
4,
399.
23
41,6
73.2
3
2,15
6.18
39
,517
.05
E
nerg
y (N
atur
al G
as)
11-0
00-2
62-6
2150
,000
.00
(4
,638
.30)
45
,361
.70
44
,283
.57
1,
078.
13
64,0
00.0
0
(10,
536.
59)
53,4
63.4
1
37,9
63.5
0
15,4
99.9
1
Ene
rgy
(Ele
ctri
city
)11
-000
-262
-622
218,
800.
00
1,
408.
50
220,
208.
50
20
6,43
8.13
13,7
70.3
7
315,
200.
00
(7
7,26
1.00
)
23
7,93
9.00
200,
258.
00
37
,681
.00
Tot
al U
ndis
t. E
xpen
d. -
Cus
todi
al S
ervi
ces
980,
547.
00
8,
474.
29
989,
021.
29
86
1,85
5.35
127,
165.
94
1,
028,
445.
00
3,29
8.61
1,
031,
743.
61
829,
260.
78
20
2,48
2.83
83

EX
HIB
IT C
-1
Var
ianc
eV
aria
nce
Ori
gina
lB
udge
tF
inal
Fin
al T
oO
rigi
nal
Bud
get
Fin
alF
inal
To
Bud
get
Tra
nsfe
rsB
udge
tA
ctua
lA
ctua
lB
udge
tT
rans
fers
Bud
get
Act
ual
Act
ual
GE
NE
RA
L F
UN
DB
UD
GE
TA
RY
CO
MP
AR
ISO
N S
CH
ED
UL
ER
ED
BA
NK
SC
HO
OL
DIS
TR
ICT
June
30,
201
4Ju
ne 3
0, 2
013
FO
R T
HE
FIS
CA
L Y
EA
RS
EN
DE
D J
UN
E 3
0, 2
014
AN
D 2
013
Und
ist.
Exp
end.
- C
are
& U
pkee
p of
Gro
unds
:C
lean
ing,
Rep
air
and
Mai
nten
ance
Ser
vice
s11
-000
-263
-420
17,8
78.0
0
580.
00
18
,458
.00
10
,349
.65
8,
108.
35
15,1
78.0
0
4,50
0.00
19
,678
.00
7,
522.
82
12,1
55.1
8
Tot
al C
are
& U
pkee
p of
Gro
unds
17,8
78.0
0
580.
00
18
,458
.00
10
,349
.65
8,
108.
35
15,1
78.0
0
4,50
0.00
19
,678
.00
7,
522.
82
12,1
55.1
8
Und
ist.
Exp
end.
- S
ecur
ity:
Sal
arie
s11
-000
-266
-100
13,8
00.0
0
3,83
4.60
17
,634
.60
15
,995
.35
1,
639.
25
31,4
78.0
0
(21,
186.
64)
10,2
91.3
6
10,2
91.3
6
-
C
lean
ing,
Rep
air,
and
Mai
nten
ance
Ser
vice
s11
-000
-266
-420
23,5
15.0
0
-
23
,515
.00
12
,699
.25
10
,815
.75
39
,117
.00
(1
9,00
2.44
)
20
,114
.56
14
,193
.24
5,
921.
32
Gen
eral
Sup
plie
s11
-000
-266
-610
6,09
0.00
-
6,09
0.00
4,
094.
08
1,99
5.92
5,
590.
00
27.5
9
5,61
7.59
5,
084.
83
532.
76
Tot
al S
ecui
rty
43,4
05.0
0
3,83
4.60
47
,239
.60
32
,788
.68
14
,450
.92
76
,185
.00
(4
0,16
1.49
)
36
,023
.51
29
,569
.43
6,
454.
08
Tot
al U
ndis
t. E
xpen
d. -
Ope
rati
ons
& M
aint
enan
ce o
f P
lant
1,38
5,60
1.00
(3
,465
.51)
1,
382,
135.
49
1,21
5,89
3.51
16
6,24
1.98
1,40
6,24
0.00
(5
,454
.32)
1,
400,
785.
68
1,17
3,06
6.03
22
7,71
9.65
Und
ist.
Exp
end.
- S
tude
nt T
rans
port
atio
n S
ervi
ces:
Sal
arie
s of
Non
-Ins
truc
tion
al A
ides
11-0
00-2
70-1
0748
,746
.00
(7
,314
.02)
41
,431
.98
32
,482
.57
8,
949.
41
94,4
15.0
0
(54,
469.
54)
39,9
45.4
6
39,9
45.4
6
-
S
alar
ies
for
Pup
il T
rans
p. (
Bet
. Hom
e &
Sch
ool)
- R
egul
ar11
-000
-270
-160
23,0
35.0
0
16,4
70.1
8
39,5
05.1
8
21,1
32.3
4
18,3
72.8
4
20,7
70.0
0
35,0
88.7
8
55,8
58.7
8
55,8
58.7
8
-
S
alar
ies
for
Pup
il T
rans
p. (
Bet
. Hom
e &
Sch
ool)
- S
pec.
Ed.
11-0
00-2
70-1
6117
,312
.00
(1
,228
.20)
16
,083
.80
16
,031
.79
52
.01
15
,409
.00
37
,766
.53
53
,175
.53
53
,175
.53
-
Con
trac
ted
Ser
vice
s (B
et. H
ome
& S
choo
l) -
Ven
dors
11-0
00-2
70-5
1149
4,67
0.00
(48,
407.
52)
446,
262.
48
43
0,50
4.49
15,7
57.9
9
502,
017.
00
(9
9,89
7.99
)
40
2,11
9.01
390,
420.
08
11
,698
.93
C
ontr
acte
d S
ervi
ces
(Oth
er T
han
Bet
. Hom
e &
Sch
ool)
- V
endo
11-0
00-2
70-5
121,
900.
00
(500
.00)
1,40
0.00
-
1,40
0.00
7,
500.
00
(2,2
33.9
6)
5,26
6.04
16
6.04
5,10
0.00
C
ontr
acte
d S
ervi
ces
(Bet
. Hom
e &
Sch
ool)
- J
oint
Agr
mnt
s11
-000
-270
-513
28,1
40.0
0
16,8
50.1
0
44,9
90.1
0
44,9
90.1
0
-
16
,539
.00
11
,302
.80
27
,841
.80
27
,841
.80
-
Con
trac
ted
Ser
vice
s (S
peci
al E
d. S
tude
nts)
- E
SC
s &
CT
SA
s11
-000
-270
-518
184,
431.
00
14
7,49
5.25
331,
926.
25
30
5,04
2.54
26,8
83.7
1
234,
049.
00
19
,454
.60
25
3,50
3.60
253,
503.
60
-
Con
trac
ted
Ser
vice
s -
Aid
in L
ieu
of P
aym
ents
- N
onP
ubli
c S
ch.1
1-00
0-27
0-50
317
,680
.00
(1
3,26
0.00
)
4,
420.
00
4,42
0.00
-
17,5
44.0
0
(8,9
74.0
0)
8,57
0.00
8,
486.
40
83.6
0
Tot
al U
ndis
t. E
xpen
d. -
Stu
dent
Tra
nspo
rtat
ion
Ser
vice
s81
5,91
4.00
110,
105.
79
92
6,01
9.79
854,
603.
83
71
,415
.96
90
8,24
3.00
(61,
962.
78)
846,
280.
22
82
9,39
7.69
16,8
82.5
3
Reg
ular
Pro
gram
s -
Inst
ruct
ion
- E
mpl
oyee
Ben
efit
s:H
ealt
h B
enef
its
11-1
XX
-100
-270
7,80
0.00
(7
,800
.00)
-
-
-
7,00
0.00
-
7,00
0.00
7,
000.
00
-
T
uiti
on R
eim
burs
emen
t11
-1X
X-1
00-2
8037
,750
.00
(3
7,75
0.00
)
-
-
-
35,8
50.0
0
(24,
975.
72)
10,8
74.2
8
9,22
4.28
1,
650.
00
Tot
al R
egul
ar P
rogr
ams
- In
stru
ctio
n -
Em
ploy
ee B
enef
its
45,5
50.0
0
(45,
550.
00)
-
-
-
42
,850
.00
(2
4,97
5.72
)
17
,874
.28
16
,224
.28
1,
650.
00
Impr
ovem
ent o
f In
stru
ctio
nal S
ervi
ces
- E
mpl
oyee
Ben
efit
s:T
uiti
on R
eim
burs
emen
t11
-000
-221
-280
-
-
-
-
-
-
922.
00
92
2.00
922.
00
-
-
-
Tot
al I
mpr
ovem
ent o
f In
stru
ctio
nal S
ervi
ces
- E
mpl
oyee
Ben
efit
s-
-
-
-
-
-
92
2.00
922.
00
92
2.00
-
Spe
cial
Pro
gram
s -
Inst
ruct
ion
- E
mpl
oyee
Ben
efit
s:H
ealt
h B
enef
its
11-2
XX
-100
-270
20,0
00.0
0
(20,
000.
00)
-
-
-
12
,000
.00
-
12,0
00.0
0
12,0
00.0
0
-
T
uiti
on R
eim
burs
emen
t11
-2X
X-1
00-2
801,
000.
00
(1,0
00.0
0)
-
-
-
-
-
-
-
-
Tot
al S
peci
al P
rogr
ams
- In
stru
ctio
n21
,000
.00
(2
1,00
0.00
)
-
-
-
12,0
00.0
0
-
12
,000
.00
12
,000
.00
-
Sup
port
Ser
vice
s -
Cen
tral
Ser
vice
s -
Em
ploy
ee B
enef
its:
Tui
tion
Rei
mbu
rsem
ent
11-0
00-2
51-2
801,
000.
00
(1,0
00.0
0)
-
-
-
1,
000.
00
(653
.50)
346.
50
34
6.50
-
-
-
T
otal
Sup
port
Ser
vice
s -
Cen
tral
Ser
vice
s -
Em
ploy
ee B
enef
its
1,00
0.00
(1
,000
.00)
-
-
-
1,00
0.00
(6
53.5
0)
34
6.50
346.
50
-
Tot
al A
lloc
ated
Ben
efit
s67
,550
.00
(6
7,55
0.00
)
-
-
-
55,8
50.0
0
(24,
707.
22)
31,1
42.7
8
29,4
92.7
8
1,65
0.00
Una
lloc
ated
Ben
efit
s -
Em
ploy
ee B
enef
its:
Soc
ial S
ecur
ity
Con
trib
utio
ns11
-000
-291
-220
250,
000.
00
(3
1,31
7.41
)
21
8,68
2.59
151,
575.
05
67
,107
.54
20
5,00
0.00
6,79
7.71
21
1,79
7.71
211,
797.
71
-
Oth
er R
etir
emen
t Con
trib
utio
ns -
Reg
ular
11-0
00-2
91-2
4131
5,00
0.00
(6,1
51.8
2)
308,
848.
18
25
2,50
4.00
56,3
44.1
8
285,
000.
00
(3
6,46
4.00
)
24
8,53
6.00
248,
536.
00
-
Oth
er R
etir
emen
t Con
trib
utio
ns -
ER
IP11
-000
-291
-242
35,7
70.0
0
2,28
9.27
38
,059
.27
35
,543
.26
2,
516.
01
3,52
0.00
1,
064.
66
4,58
4.66
4,
584.
66
-
U
nem
ploy
men
t Com
pens
atio
n11
-000
-291
-250
50,0
00.0
0
16,3
20.4
2
66,3
20.4
2
46,6
39.3
4
19,6
81.0
8
40,4
69.0
0
24,1
94.0
7
64,6
63.0
7
48,3
42.6
5
16,3
20.4
2
Wor
kmen
's C
ompe
nsat
ion
11-0
00-2
91-2
6012
6,50
0.00
(6,3
46.3
4)
120,
153.
66
12
0,15
3.66
-
11
0,00
0.00
(4,6
66.3
5)
105,
333.
65
10
5,33
3.65
-
H
ealt
h B
enef
its
11-0
00-2
91-2
702,
492,
381.
00
(100
,574
.83)
2,
391,
806.
17
2,27
6,16
5.69
11
5,64
0.48
1,69
9,02
1.00
30
6,85
9.09
2,00
5,88
0.09
1,
993,
108.
77
12,7
71.3
2
84

EX
HIB
IT C
-1
Var
ianc
eV
aria
nce
Ori
gina
lB
udge
tF
inal
Fin
al T
oO
rigi
nal
Bud
get
Fin
alF
inal
To
Bud
get
Tra
nsfe
rsB
udge
tA
ctua
lA
ctua
lB
udge
tT
rans
fers
Bud
get
Act
ual
Act
ual
GE
NE
RA
L F
UN
DB
UD
GE
TA
RY
CO
MP
AR
ISO
N S
CH
ED
UL
ER
ED
BA
NK
SC
HO
OL
DIS
TR
ICT
June
30,
201
4Ju
ne 3
0, 2
013
FO
R T
HE
FIS
CA
L Y
EA
RS
EN
DE
D J
UN
E 3
0, 2
014
AN
D 2
013
Tui
tion
Rei
mbu
rsem
ent
11-0
00-2
91-2
80-
35,6
50.0
5
35,6
50.0
5
25,3
55.1
7
10,2
94.8
8
-
-
-
-
Oth
er E
mpl
oyee
Ben
efit
s11
-000
-291
-290
81,3
00.0
0
36,5
57.7
1
117,
857.
71
11
3,19
6.66
4,66
1.05
-
3,79
0.00
3,
790.
00
3,79
0.00
-
Tot
al U
nall
ocat
ed B
enef
its
3,35
0,95
1.00
(5
3,57
2.95
)
3,
297,
378.
05
3,02
1,13
2.83
27
6,24
5.22
2,34
3,01
0.00
30
1,57
5.18
2,64
4,58
5.18
2,
615,
493.
44
29,0
91.7
4
TP
AF
Con
trib
utio
ns (
On-
Beh
alf
- N
on-B
udge
ted)
-
-
-
26
6,35
4.00
(266
,354
.00)
-
-
-
395,
311.
00
(3
95,3
11.0
0)
TP
AF
Pos
t Ret
irem
ent M
edic
al (
On-
Beh
alf
- N
on-B
udge
ted)
-
-
-
43
6,72
1.00
(436
,721
.00)
-
-
-
470,
515.
00
(4
70,5
15.0
0)
TP
AF
Soc
ial S
ecur
ity
(Rei
mbu
rsed
- N
on-B
udge
ted)
-
-
-
44
7,69
8.96
(447
,698
.96)
-
-
-
485,
549.
88
(4
85,5
49.8
8)
Tot
al O
n-B
ehal
f C
ontr
ibut
ions
-
-
-
1,
150,
773.
96
(1,1
50,7
73.9
6)
-
-
-
1,35
1,37
5.88
(1
,351
,375
.88)
Tot
al P
erso
nal S
ervi
ces
- E
mpl
oyee
Ben
efit
s3,
418,
501.
00
(121
,122
.95)
3,
297,
378.
05
4,17
1,90
6.79
(8
74,5
28.7
4)
2,39
8,86
0.00
27
6,86
7.96
2,67
5,72
7.96
3,
996,
362.
10
(1,3
20,6
34.1
4)
Tot
al U
ndis
trib
uted
Exp
endi
ture
s8,
842,
857.
00
115,
050.
22
8,
957,
907.
22
9,25
3,86
6.78
(3
00,5
51.3
8)
7,49
2,31
2.00
43
0,37
1.47
7,92
2,68
3.47
8,
822,
758.
75
(900
,075
.28)
Tot
al E
xpen
ditu
res
- C
urre
nt E
xpen
se14
,562
,140
.00
317,
842.
52
14
,879
,982
.52
15,0
60,8
71.6
6
(1
85,4
80.9
6)
13,0
73,5
95.0
0
51
2,99
2.28
13,5
86,5
87.2
8
14
,296
,845
.60
(710
,258
.32)
CA
PIT
AL
OU
TL
AY
:In
tere
st D
epos
it T
o C
apit
al R
eser
ve10
-604
120.
00
(1
20.0
0)
-
-
-
50.0
0
-
50
.00
-
50.0
0
Equ
ipm
ent:
Gra
des
1-5
12-1
20-1
00-7
30-
-
-
-
-
-
2,
482.
00
2,48
2.00
2,
482.
00
-
G
rade
s 6-
812
-130
-100
-730
-
-
-
-
-
-
38,1
13.0
0
38,1
13.0
0
38,1
13.0
0
-
U
ndis
trib
uted
Exp
endi
ture
s:In
stru
ctio
n12
-000
-100
-730
110,
000.
00
43
,427
.03
15
3,42
7.03
149,
740.
00
3,
687.
03
-
-
-
-
-
A
dmin
. Inf
o. T
echn
olog
y12
-000
-252
-730
96,4
22.0
0
(66,
209.
48)
30,2
12.5
2
27,3
83.5
2
2,82
9.00
-
-
-
-
-
Req
uire
d M
aint
enan
ce f
or S
choo
l Fac
ilit
ies
12-0
00-2
61-7
30-
22,6
57.0
0
22,6
57.0
0
21,6
57.0
0
1,00
0.00
25
,000
.00
8,
117.
00
33,1
17.0
0
10,4
60.0
0
22,6
57.0
0
Car
e an
d U
pkee
p of
Gro
unds
12-0
00-2
63-7
30-
26,4
80.6
0
26,4
80.6
0
12,7
68.0
0
13,7
12.6
0
-
30
,988
.00
30
,988
.00
10
,455
.90
20
,532
.10
S
ecur
ity
12-0
00-2
63-7
3027
,000
.00
1,
069.
85
28,0
69.8
5
14,3
20.4
0
13,7
49.4
5
-
-
-
-
-
-
-
-
-
T
otal
Equ
ipm
ent
233,
422.
00
27
,425
.00
26
0,84
7.00
225,
868.
92
34
,978
.08
25
,000
.00
79
,700
.00
10
4,70
0.00
61,5
10.9
0
43,1
89.1
0
Fac
ilit
ies
Acq
uisi
tion
and
Con
stru
ctio
n S
ervi
ces:
Ass
essm
ent f
or D
ebt S
ervi
ce o
n S
DA
Fun
ding
12-0
00-4
00-8
9654
,000
.00
-
54,0
00.0
0
54,0
00.0
0
-
35
,021
.00
-
35,0
21.0
0
35,0
21.0
0
-
Tot
al F
acil
itie
s A
cqui
siti
on a
nd C
onst
ruct
ion
Ser
vice
s54
,000
.00
-
54,0
00.0
0
54,0
00.0
0
-
35
,021
.00
-
35,0
21.0
0
35,0
21.0
0
-
Tot
al C
apit
al O
utla
y28
7,54
2.00
27,3
05.0
0
314,
847.
00
27
9,86
8.92
34,9
78.0
8
60,0
71.0
0
79,7
00.0
0
139,
771.
00
96
,531
.90
43
,239
.10
SP
EC
IAL
SC
HO
OL
S:
Sum
mer
Sch
ool -
Ins
truc
tion
Sal
arie
s of
Tea
cher
s13
-422
-100
-101
27,5
20.0
0
(23,
348.
88)
4,17
1.12
4,
171.
12
-
24
,505
.00
(7
,481
.00)
17
,024
.00
17
,024
.00
-
Oth
er S
alar
ies
for
Inst
ruct
ion
13-4
22-1
00-1
0635
,112
.00
(8
,166
.25)
26
,945
.75
26
,945
.75
-
36,8
29.0
0
(10,
014.
00)
26,8
15.0
0
26,8
15.0
0
-
P
urch
ased
Pro
fess
iona
l and
Tec
hnic
al S
ervi
ces
13-4
22-1
00-3
0027
,217
.00
(2
3,00
4.08
)
4,
212.
92
4,21
2.92
-
15,3
75.0
0
(11,
928.
20)
3,44
6.80
3,
446.
80
-
G
ener
al S
uppl
ies
13-4
22-1
00-6
102,
000.
00
(1,1
78.2
2)
821.
78
81
2.63
9.15
4,26
8.00
80
4.00
5,07
2.00
5,
072.
00
-
O
ther
Obj
ects
13-4
22-1
00-8
001,
600.
00
(1,6
00.0
0)
-
-
-
1,
600.
00
(780
.00)
820.
00
82
0.00
-
Tot
al S
umm
er S
choo
l - I
nstr
ucti
on93
,449
.00
(5
7,29
7.43
)
36
,151
.57
36
,142
.42
9.
15
82
,577
.00
(2
9,39
9.20
)
53
,177
.80
53
,177
.80
-
Sum
mer
Sch
ool -
Sup
port
Ser
vice
s:S
alar
ies
13-4
22-2
00-1
0030
,730
.00
20
,482
.44
51
,212
.44
51
,212
.44
-
27,7
54.0
0
15,8
97.5
0
43,6
51.5
0
43,6
51.5
0
-
O
ther
Pur
chas
ed S
ervi
ces
(400
- 5
00 s
erie
s)13
-422
-200
-500
26,0
25.0
0
6,51
5.04
32
,540
.04
32
,540
.04
-
24,7
86.0
0
-
24
,786
.00
18
,785
.93
6,
000.
07
-
T
otal
Sum
mer
Sch
ool -
Sup
port
Ser
vice
s56
,755
.00
26
,997
.48
83
,752
.48
83
,752
.48
-
52,5
40.0
0
15,8
97.5
0
68,4
37.5
0
62,4
37.4
3
6,00
0.07
Tot
al S
umm
er S
choo
l 15
0,20
4.00
(30,
299.
95)
119,
904.
05
11
9,89
4.90
9.15
135,
117.
00
(1
3,50
1.70
)
12
1,61
5.30
115,
615.
23
6,
000.
07
85

EX
HIB
IT C
-1
Var
ianc
eV
aria
nce
Ori
gina
lB
udge
tF
inal
Fin
al T
oO
rigi
nal
Bud
get
Fin
alF
inal
To
Bud
get
Tra
nsfe
rsB
udge
tA
ctua
lA
ctua
lB
udge
tT
rans
fers
Bud
get
Act
ual
Act
ual
GE
NE
RA
L F
UN
DB
UD
GE
TA
RY
CO
MP
AR
ISO
N S
CH
ED
UL
ER
ED
BA
NK
SC
HO
OL
DIS
TR
ICT
June
30,
201
4Ju
ne 3
0, 2
013
FO
R T
HE
FIS
CA
L Y
EA
RS
EN
DE
D J
UN
E 3
0, 2
014
AN
D 2
013
Tot
al S
peci
al S
choo
ls15
0,20
4.00
(30,
299.
95)
119,
904.
05
11
9,89
4.90
9.15
135,
117.
00
(1
3,50
1.70
)
12
1,61
5.30
115,
615.
23
6,
000.
07
Tra
nsfe
r of
Fun
ds to
Cha
rter
Sch
ool
10-0
00-1
00-5
6X1,
574,
656.
00
68,7
11.0
0
1,64
3,36
7.00
1,
643,
367.
00
-
1,
673,
456.
00
-
1,
673,
456.
00
1,64
0,71
8.00
32
,738
.00
Tot
al E
xpen
ditu
res
16,5
74,5
42.0
0
38
3,55
8.57
16,9
58,1
00.5
7
17
,104
,002
.48
(145
,901
.91)
14
,942
,239
.00
579,
190.
58
15
,521
,429
.58
16,1
49,7
10.7
3
(6
28,2
81.1
5)
Exc
ess/
(Def
icie
ncy)
of
Rev
enue
s O
ver/
(Und
er)
Exp
endi
ture
s(3
12,1
09.0
0)
(383
,558
.57)
(6
95,6
67.5
7)
420,
339.
12
1,
116,
006.
69
23,6
30.0
0
(205
,278
.58)
(1
81,6
48.5
8)
568,
613.
26
75
0,26
1.84
Oth
er F
inan
cing
Sou
rces
/(U
ses)
:O
pera
ting
Tra
nsfe
rs I
n/(O
ut):
Loc
al C
ontr
ibut
ion
- T
rans
fer
to S
peci
al R
even
ue R
egul
ar11
-105
-100
-935
(185
,000
.00)
-
(185
,000
.00)
(1
85,0
00.0
0)
-
(1
75,0
00.0
0)
-
(1
75,0
00.0
0)
(175
,000
.00)
-
-
-
Tot
al O
ther
Fin
anci
ng S
ourc
es/(
Use
s)(1
85,0
00.0
0)
-
(1
85,0
00.0
0)
(185
,000
.00)
-
(175
,000
.00)
-
(175
,000
.00)
(1
75,0
00.0
0)
-
Exc
ess/
(Def
icie
ncy)
of
Rev
enue
s an
dO
ther
Fin
anci
ng S
ourc
es O
ver/
(Und
er)
Exp
endi
ture
s an
d O
ther
Fin
anci
ng U
ses
(497
,109
.00)
(3
83,5
58.5
7)
(880
,667
.57)
23
5,33
9.12
1,11
6,00
6.69
(1
51,3
70.0
0)
(205
,278
.58)
(3
56,6
48.5
8)
393,
613.
26
75
0,26
1.84
Fun
d B
alan
ces,
Jul
y 1
1,58
5,16
7.67
-
1,58
5,16
7.67
1,
585,
167.
67
-
1,
191,
554.
41
-
1,
191,
554.
41
1,19
1,55
4.41
-
Fun
d B
alan
ces,
Jun
e 30
1,08
8,05
8.67
$
(3
83,5
58.5
7)$
704,
500.
10$
1,
820,
506.
79$
1,11
6,00
6.69
$
1,
040,
184.
41$
(205
,278
.58)
$
83
4,90
5.83
$
1,58
5,16
7.67
$
75
0,26
1.84
$
Pri
or Y
ear
Res
erve
for
Enc
umbr
ance
s38
3,55
8.57
Tot
al T
rans
fers
383,
558.
57$
Res
tric
ted:
Res
erve
d E
xces
s S
urpl
us:
Des
igna
ted
for
Sub
sequ
ent Y
ear's
Exp
endi
ture
s49
,605
.61
$
C
urre
nt E
xces
s S
urpl
us14
2,02
2.73
Cap
ital
Res
erve
59,7
86.1
9M
aint
enan
ce R
eser
ve44
9,18
8.89
Ass
igne
d:Y
ear-
End
Enc
umbr
ance
s40
5,22
3.41
Des
igna
ted
for
Sub
sequ
ent Y
ear's
Exp
endi
ture
s34
6,03
9.39
Una
ssig
ned
368,
640.
57
1,82
0,50
6.79
Rec
onci
liat
ion
To
Gov
ernm
enta
l Fun
ds S
tate
men
ts (
GA
AP
):L
ast S
tate
Aid
Pay
men
t Not
Rec
ogni
zed
on G
AA
P B
asis
(289
,801
.80)
Fun
d B
alan
ce p
er G
over
nmen
tal F
unds
(G
AA
P)
1,53
0,70
4.99
$
RE
CA
PIT
UL
AT
ION
OF
BU
DG
ET
TR
AN
SF
ER
S
RE
CA
PIT
UL
AT
ION
OF
FU
ND
BA
LA
NC
E
86

EX
HIB
IT C
-2
Var
ianc
eV
aria
nce
Ori
gina
lB
udge
tF
inal
Fin
al T
oO
rigi
nal
Bud
get
Fin
alF
inal
To
Bud
get
Tra
nsfe
rsB
udge
tA
ctua
lA
ctua
lB
udge
tT
rans
fers
Bud
get
Act
ual
Act
ual
RE
VE
NU
ES
:
Loc
al S
ourc
es-
$
51
,328
.11
$
51,3
28.1
1$
21,4
32.2
2$
(2
9,89
5.89
)$
-
$
35
,714
.92
$
35
,714
.92
$
12,4
18.9
6$
(2
3,29
5.96
)$
Sta
te S
ourc
es4,
714,
602.
00
(1
06,9
91.0
0)
4,60
7,61
1.00
4,46
9,08
6.64
(1
38,5
24.3
6)
4,
003,
403.
00
33
3,56
9.40
4,
336,
972.
40
4,31
1,26
4.08
(2
5,70
8.32
)
F
eder
al S
ourc
es81
3,86
5.00
82
8,98
3.98
1,
642,
848.
98
1,
443,
094.
17
(199
,754
.81)
-
2,25
8,32
4.51
2,25
8,32
4.51
1,
964,
629.
27
(293
,695
.24)
Tot
al R
even
ues
5,52
8,46
7.00
773,
321.
09
6,30
1,78
8.09
5,93
3,61
3.03
(3
68,1
75.0
6)
4,
003,
403.
00
2,
627,
608.
83
6,
631,
011.
83
6,28
8,31
2.31
(3
42,6
99.5
2)
EX
PE
ND
ITU
RE
S:
Inst
ruct
ion:
Sal
arie
s of
Tea
cher
s72
7,75
2.00
35
7,49
0.64
1,
085,
242.
64
1,
000,
669.
94
84,5
72.7
0
475,
688.
00
717,
692.
80
1,19
3,38
0.80
1,
113,
965.
55
79,4
15.2
5
O
ther
Sal
arie
s fo
r In
stru
ctio
n54
2,46
1.00
6,
908.
31
549,
369.
31
543,
098.
00
6,
271.
31
38
9,94
3.00
19
1,98
9.06
58
1,93
2.06
561,
914.
68
20
,017
.38
Pur
chas
ed S
ervi
ces
186,
687.
00
104,
575.
48
291,
262.
48
273,
941.
05
17
,321
.43
-
27
1,28
3.87
27
1,28
3.87
250,
908.
49
20
,375
.38
Oth
er P
urch
ased
Ser
vice
s22
3,27
0.00
36
8.47
223,
638.
47
219,
618.
46
4,
020.
01
-
78
,397
.16
78
,397
.16
78,3
97.1
6
-
Gen
eral
Sup
plie
s26
,625
.00
22
,066
.39
48,6
91.3
9
36
,619
.63
12,0
71.7
6
58,4
00.0
0
10
4,46
0.39
16
2,86
0.39
139,
819.
43
23
,040
.96
Tex
tboo
ks17
,600
.00
7,
302.
00
24,9
02.0
0
24
,890
.74
11.2
6
-
25,5
22.0
0
25,5
22.0
0
25
,321
.66
200.
34
O
ther
Obj
ects
6,75
0.00
(200
.00)
6,
550.
00
1,
754.
85
4,79
5.15
5,00
0.00
5,35
6.78
10,3
56.7
8
8,
054.
03
2,30
2.75
Tot
al I
nstr
ucti
on1,
731,
145.
00
49
8,51
1.29
2,
229,
656.
29
2,
100,
592.
67
129,
063.
62
92
9,03
1.00
1,
394,
702.
06
2,
323,
733.
06
2,17
8,38
1.00
14
5,35
2.06
Sup
port
Ser
vice
s:S
alar
ies
-
59,1
88.7
3
59
,188
.73
54,2
03.1
1
4,
985.
62
-
23
4,72
9.98
23
4,72
9.98
200,
129.
79
34
,600
.19
Sal
arie
s of
Sup
ervi
sors
of
Inst
ruct
ion
125,
520.
00
10,1
66.4
1
13
5,68
6.41
12
0,14
0.23
15,5
46.1
8
22,7
83.0
0
19
,609
.88
42
,392
.88
31,9
62.8
8
10
,430
.00
Sal
arie
s of
Pro
gram
Dir
ecto
rs52
,700
.00
(3
6,83
7.23
)
15,8
62.7
7
15
,345
.73
517.
04
38,6
25.0
0
43
,341
.54
81
,966
.54
81,9
66.5
4
-
Sal
arie
s of
Oth
er P
rofe
ssio
nal S
taff
148,
188.
00
(10,
991.
29)
13
7,19
6.71
13
7,17
3.02
23.6
9
134,
668.
00
3,85
6.00
138,
524.
00
13
8,52
4.00
-
S
alar
ies
of S
ecr.
And
Cle
rica
l Ass
ista
nts
65,8
08.0
0
1,90
3.00
67
,711
.00
49,0
19.2
2
18
,691
.78
46
,726
.00
39,3
09.2
3
86,0
35.2
3
86
,035
.23
-
O
ther
Sal
arie
s87
,078
.00
10
,000
.00
97,0
78.0
0
97
,078
.00
-
66
,650
.00
26,0
26.3
9
92,6
76.3
9
92
,419
.51
256.
88
S
alar
ies
of C
omm
unit
y P
aren
t Inv
olve
men
t Spe
c.56
,587
.00
11
,015
.12
67,6
02.1
2
67
,602
.12
-
45
,194
.00
(1,3
43.3
5)
43
,850
.65
43,8
50.5
5
0.
10
S
alar
ies
of M
aste
rs T
each
ers
102,
700.
00
8,65
5.00
11
1,35
5.00
11
1,35
5.00
-
11
6,37
9.00
(1
5,44
7.28
)
100,
931.
72
10
0,93
1.72
-
P
erso
nal S
ervi
ces
- E
mpl
oyee
Ben
efit
s63
2,60
9.00
90
,030
.94
722,
639.
94
713,
538.
21
9,
101.
73
44
9,03
2.00
37
4,95
6.14
82
3,98
8.14
797,
288.
99
26
,699
.15
Pro
fess
iona
l and
Tec
hnic
al S
ervi
ces
58,7
50.0
0
143,
140.
01
201,
890.
01
145,
908.
51
55
,981
.50
-
24
9,48
2.00
24
9,48
2.00
198,
303.
97
51
,178
.03
Pur
chas
ed E
duc.
Ser
vice
s -
Con
trac
ted
Pre
-K2,
016,
180.
00
-
2,
016,
180.
00
1,
915,
673.
00
100,
507.
00
1,
694,
715.
00
16
2,69
1.00
1,
857,
406.
00
1,85
7,40
6.00
-
Pur
chas
ed P
rofe
ssio
nal -
Edu
cati
onal
Ser
vice
s63
,000
.00
48
,011
.41
111,
011.
41
105,
244.
31
5,
767.
10
38
,000
.00
38,3
31.5
1
76,3
31.5
1
75
,124
.67
1,20
6.84
O
ther
Pur
chas
ed P
rofe
ssio
nal S
ervi
ces
10,0
00.0
0
7,17
1.88
17
,171
.88
16,5
48.8
8
62
3.00
22
,000
.00
(10,
199.
96)
11
,800
.04
11,8
00.0
0
0.
04
T
uiti
on R
eim
burs
emen
t-
27
,909
.84
27,9
09.8
4
27
,909
.84
-
-
6,
855.
98
6,
855.
98
6,81
7.71
38
.27
O
ther
Pur
chas
ed S
ervi
ces
8,50
0.00
22,9
45.6
2
31
,445
.62
22,3
06.4
5
9,
139.
17
-
13
8,36
4.12
13
8,36
4.12
97,5
98.0
6
40
,766
.06
Cle
anin
g, R
epai
r, &
Mai
nten
ance
Ser
vice
s9,
000.
00
14
,547
.55
23,5
47.5
5
16
,537
.40
7,01
0.15
4,20
0.00
-
4,20
0.00
4,
200.
00
-
Ren
tals
100,
400.
00
5,50
7.86
10
5,90
7.86
10
5,80
2.90
104.
96
128,
000.
00
(7,2
56.0
0)
12
0,74
4.00
96,5
00.2
3
24
,243
.77
Con
trac
ted
Tra
nspo
rtat
ion
Ser
v. (
Bet
. Hom
e &
Sch
)21
0,00
0.00
(9
,586
.03)
200,
413.
97
200,
413.
97
-
197,
000.
00
-
197,
000.
00
19
7,00
0.00
-
RE
D B
AN
K S
CH
OO
L D
IST
RIC
T
Fis
cal y
ear
end
ed J
un
e 30
, 201
4
SP
EC
IAL
RE
VE
NU
E F
UN
D
BU
DG
ET
AR
Y C
OM
PA
RIS
ON
SC
HE
DU
LE
June
30,
201
3
(Wit
h C
omp
arat
ive
Tot
als
for
Jun
e 30
, 201
3)
June
30,
201
4
87

EX
HIB
IT C
-2
Var
ianc
eV
aria
nce
Ori
gina
lB
udge
tF
inal
Fin
al T
oO
rigi
nal
Bud
get
Fin
alF
inal
To
Bud
get
Tra
nsfe
rsB
udge
tA
ctua
lA
ctua
lB
udge
tT
rans
fers
Bud
get
Act
ual
Act
ual
RE
D B
AN
K S
CH
OO
L D
IST
RIC
T
Fis
cal y
ear
end
ed J
un
e 30
, 201
4
SP
EC
IAL
RE
VE
NU
E F
UN
D
BU
DG
ET
AR
Y C
OM
PA
RIS
ON
SC
HE
DU
LE
June
30,
201
3
(Wit
h C
omp
arat
ive
Tot
als
for
Jun
e 30
, 201
3)
June
30,
201
4
Con
trac
ted
Tra
nspo
rtat
ion
Ser
v. (
Fie
ld T
rips
)10
,500
.00
(2
,801
.77)
7,69
8.23
2,48
3.50
5,
214.
73
11
,000
.00
(2,9
13.0
0)
8,
087.
00
8,08
7.00
-
Tra
vel
4,50
0.00
-
4,50
0.00
1,86
9.82
2,
630.
18
3,
600.
00
(9
93.1
7)
2,60
6.83
2,
600.
00
6.83
Sup
plie
s an
d M
ater
ials
21,5
02.0
0
39,8
06.0
6
61
,308
.06
59,0
92.6
2
2,
215.
44
35
,000
.00
77,5
25.6
3
112,
525.
63
10
6,99
3.64
5,53
1.99
Oth
er O
bjec
ts13
,800
.00
20
,026
.69
33,8
26.6
9
32
,774
.52
1,05
2.17
4,80
0.00
22,7
52.7
7
27,5
52.7
7
25
,167
.64
2,38
5.13
Tot
al S
uppo
rt S
ervi
ces
3,79
7,32
2.00
459,
809.
80
4,25
7,13
1.80
4,01
8,02
0.36
23
9,11
1.44
3,05
8,37
2.00
1,39
9,67
9.41
4,45
8,05
1.41
4,
260,
708.
13
197,
343.
28
Fac
ilit
ies
Acq
uisi
tion
and
Con
stru
ctio
n S
ervi
ces:
Inst
ruct
iona
l Equ
ipm
ent
-
-
-
-
9,41
9.00
9,41
9.00
9,
415.
80
3.20
Non
-Ins
truc
tion
al E
quip
men
t-
-
-
-
-
16
,000
.00
(1,1
91.6
4)
14
,808
.36
14,8
07.3
8
0.
98
Tot
al F
acil
itie
s A
cqui
siti
on a
nd
Con
stru
ctio
n S
ervi
ces
-
-
-
-
-
16,0
00.0
0
8,
227.
36
24
,227
.36
24,2
23.1
8
4.
18
Tot
al E
xpen
ditu
res
5,52
8,46
7.00
958,
321.
09
6,48
6,78
8.09
6,11
8,61
3.03
36
8,17
5.06
4,00
3,40
3.00
2,80
2,60
8.83
6,80
6,01
1.83
6,
463,
312.
31
342,
699.
52
Tot
al O
utfl
ows
5,52
8,46
7.00
958,
321.
09
6,48
6,78
8.09
6,11
8,61
3.03
36
8,17
5.06
4,00
3,40
3.00
2,80
2,60
8.83
6,80
6,01
1.83
6,
463,
312.
31
342,
699.
52
Exc
ess/
(Def
icie
ncy)
of
Rev
enue
s O
ver/
(Und
er)
Exp
endi
ture
s-
(1
85,0
00.0
0)
(185
,000
.00)
(185
,000
.00)
(0
.00)
-
(1
75,0
00.0
0)
(1
75,0
00.0
0)
(175
,000
.00)
-
Oth
er F
inan
cing
Sou
rces
/(U
ses)
:
Gen
eral
Fun
d C
ontr
ibut
ion
to P
resc
hool
Edu
cati
on A
id18
5,00
0.00
18
5,00
0.00
18
5,00
0.00
-
17
5,00
0.00
17
5,00
0.00
175,
000.
00
-
Tot
al O
ther
Fin
anci
ng S
ourc
es/(
Use
s)-
18
5,00
0.00
18
5,00
0.00
18
5,00
0.00
-
-
17
5,00
0.00
17
5,00
0.00
175,
000.
00
-
Exc
ess/
(Def
icie
ncy)
of
Rev
enue
s O
ver/
(Und
er)
Exp
endi
ture
s an
d O
ther
Fin
anci
ng S
ourc
es/(
Use
s)-
$
-
$
-
$
(0
.00)
$
(0
.00)
$
-
$
0.
00$
0.
00$
0.
00$
-
$
88

NOTES TO REQUIRED SUPPLEMENTARY INFORMATION
89

This page intentionally left blank
90

EXHIBIT C-3
General Special Revenue
Fund Fund
the Budgetary Comparison Schedules 17,524,341.60$ 5,933,613.03$
Grant accounting budgetary basis differs from GAAP in that
encumbrances are recognized as expenditures, and the
related revenue is recognized:
Less: Current Year Encumbrances (309,398.95)
Add: Prior Year Encumbrances 277,769.04
Less: Prior Year Encumbrances Cancelled (75,801.95)
State aid payment recognized for GAAP statements in the current
year, previously recognized for budgetary purposes. 219,870.30 407,906.70
recognized for GAAP statements until the subsequent year. (289,801.80) (264,596.07)
Total revenues as reported on the Statement of Revenues,
Expenditures and Changes in Fund Balances -Governmental Funds. 17,454,410.10$ 5,969,491.80$
from the Budgetary Comparison Schedule 17,104,002.48$ 6,118,613.03$
Encumbrances for supplies and equipment ordered but not
received are reported in the year the order is placed
for budgetary purposes, but in the year the supplies
are received for financial reporting purposes:
Less: Current Year Encumbrances - (309,398.95)
Add: Prior Year Encumbrances - 277,769.04
Less: Prior Year Encumbrances Cancelled - (75,801.95)
Total expenditures as reported on the Statement of Revenues,
Expenditures and Changes in Fund Balances - Governmental Funds. 17,104,002.48$ 6,011,181.17$
Actual amounts (budgetary basis) “total outflows”
Difference - budget to GAAP:
Expenditures
SOURCES/INFLOWS OF RESOURCES
Actual amounts (budgetary) “revenues” from
Difference - budget to GAAP:
State aid payment recognized for budgetary purposes, not
USES/OUTFLOWS OF RESOURCES
Explanation of Differences between Budgetary Inflows and Outflows and GAAP Revenues and
RED BANK SCHOOL DISTRICT
BUDGETARY COMPARISON SCHEDULE
Fiscal year ended June 30, 2014
REQUIRED SUPPLEMENTARY INFORMATION
NOTE TO RSI
91

This page intentionally left blank
92

OTHER SUPPLEMENTARY INFORMATION
93

This page intentionally left blank
94

D. School Based Budget Schedules
Not Applicable
95

This page intentionally left blank
96

E. Special Revenue Fund
97

This page intentionally left blank
98

RE
D B
AN
K S
CH
OO
L D
IST
RIC
TS
PE
CIA
L R
EV
EN
UE
FU
ND
CO
MB
ININ
G S
CH
ED
UL
E O
F R
EV
EN
UE
AN
D E
XP
EN
DIT
UR
ES
- B
UD
GE
TA
RY
BA
SIS
For
th
e fi
scal
yea
r en
din
g Ju
ne
30, 2
014
(Wit
h C
omp
arat
ive
Tot
als
for
Jun
e 30
, 201
3)
EX
HIB
IT E
-1
Rut
gers
For
mat
ive
Pre
scho
olT
extb
ooks
Nur
sing
Tec
hnol
ogy
Com
pens
ator
yH
ome
Exa
m. a
nd
Cor
rect
ive
Sup
plem
enta
ryR
ace
toA
sses
smen
tE
duca
tion
Rev
enue
sA
idA
idA
idE
duca
tion
Inst
ruct
ion
Cla
ssif
icat
ion
Spe
ech
Inst
ruct
ion
The
Top
Gra
ntA
id
-$
-
$
-$
-
$
-
$
-
$
-$
-
$
-
$
-
$
-
$
S
tate
Sou
rces
24,8
90.7
4
33
,049
.30
9,04
0.76
68,4
78.0
9
48
3.45
39
,021
.81
19
,530
.23
24,6
31.0
0
-
-
4,
249,
961.
26
F
eder
al S
ourc
es-
-
-
-
-
-
-
-
18,4
69.0
0
76
,544
.46
-
Tot
al R
even
ues
24,8
90.7
4$
33
,049
.30
$
9,04
0.76
$
68,4
78.0
9$
48
3.45
$
39
,021
.81
$
19
,530
.23
$
24,6
31.0
0$
18
,469
.00
$
76,5
44.4
6$
4,
249,
961.
26$
Exp
endi
ture
s
Inst
ruct
ion:
Sal
arie
s of
Tea
cher
s-
$
-$
-
$
-$
-$
-$
-
$
-$
-$
69,3
88.0
7$
51
0,31
2.03
$
O
ther
Sal
arie
s fo
r In
stru
ctio
n-
-
-
-
-
-
-
-
-
-
322,
852.
49
Pur
chas
ed S
ervi
ces
-
-
-
68
,478
.09
483.
45
39,0
21.8
1
19,5
30.2
3
24
,631
.00
-
-
-
Oth
er P
urch
ased
Ser
vice
s-
-
-
-
-
-
-
-
-
-
209,
710.
62
Gen
eral
Sup
plie
s-
-
-
-
-
-
-
-
-
1,84
8.20
21,2
49.6
9
T
extb
ooks
24,8
90.7
4
-
-
-
-
-
-
-
-
-
-
O
ther
Obj
ects
-
-
-
-
-
-
-
-
-
-
1,
754.
85
Tot
al I
nstr
ucti
on24
,890
.74
-
-
68,4
78.0
9
48
3.45
39
,021
.81
19
,530
.23
24,6
31.0
0
-
71
,236
.27
1,06
5,87
9.68
Sup
port
Ser
vice
s:S
alar
ies
-
-
-
-
-
-
-
-
17
,304
.00
-
-
Sal
arie
s of
Sup
ervi
sors
of
Inst
ruct
ion
-
-
-
-
-
-
-
-
-
-
11
0,85
2.23
S
alar
ies
of P
rogr
am D
irec
tors
-
-
-
-
-
-
-
-
-
-
15
,345
.73
Sal
arie
s of
Oth
er P
rofe
ssio
nal S
taff
-
-
-
-
-
-
-
-
-
-
13
7,17
3.02
S
alar
ies
of S
ecr.
And
Cle
rica
l Ass
ista
nts
-
-
-
-
-
-
-
-
-
-
37
,536
.00
Oth
er S
alar
ies
-
-
-
-
-
-
-
-
-
-
97
,078
.00
Sal
arie
s of
Com
mun
ity
Par
ent I
nvol
vem
ent S
pec.
-
-
-
-
-
-
-
-
-
-
67
,602
.12
Sal
arie
s of
Mas
ters
Tea
cher
s-
-
-
-
-
-
-
-
-
-
111,
355.
00
Per
sona
l Ser
vice
s -
Em
ploy
ee B
enef
its
-
-
-
-
-
-
-
-
1,
165.
00
5,
308.
19
40
0,18
8.47
P
rofe
ssio
nal a
nd T
echn
ical
Ser
vice
s-
-
-
-
-
-
-
-
-
-
-
Pur
chas
ed E
duc.
Ser
vice
s -
Con
trac
ted
Pre
-K-
-
-
-
-
-
-
-
-
-
1,91
5,67
3.00
Pur
chas
ed P
rofe
ssio
nal -
Edu
cati
onal
Ser
vice
s-
33,0
49.3
0
-
-
-
-
-
-
-
-
72,1
95.0
1
O
ther
Pur
chas
ed P
rofe
ssio
nal S
ervi
ces
-
-
-
-
-
-
-
-
-
-
16
,548
.88
Tui
tion
Rei
mbu
rsem
ent
-
-
-
-
-
-
-
-
-
-
27
,909
.84
Oth
er P
urch
ased
Ser
vice
s-
-
-
-
-
-
-
-
-
-
-
Cle
anin
g, R
epai
r, &
Mai
nten
ance
Ser
vice
s-
-
-
-
-
-
-
-
-
-
9,00
0.00
Ren
tals
-
-
-
-
-
-
-
-
-
-
10
5,80
2.90
C
ontr
acte
d T
rans
port
atio
n S
erv.
(B
et. H
ome
& S
ch)
-
-
-
-
-
-
-
-
-
-
20
0,41
3.97
C
ontr
acte
d T
rans
port
atio
n S
erv.
(F
ield
Tri
ps)
-
-
-
-
-
-
-
-
-
-
2,
483.
50
T
rave
l-
-
-
-
-
-
-
-
-
-
1,86
9.82
Sup
plie
s an
d M
ater
ials
-
-
9,04
0.76
-
-
-
-
-
-
-
33,6
44.4
1
O
ther
Obj
ects
-
-
-
-
-
-
-
-
-
-
6,
409.
68
Tot
al S
uppo
rt S
ervi
ces
-
33
,049
.30
9,04
0.76
-
-
-
-
-
18,4
69.0
0
5,
308.
19
3,
369,
081.
58
Fac
ilit
ies
Acq
uisi
tion
and
Con
stru
ctio
n S
ervi
ces:
Inst
ruct
iona
l Equ
ipm
ent
-
-
-
-
-
-
-
-
-
-
-
Non
-Ins
truc
tion
al E
quip
men
t-
-
-
-
-
-
-
-
-
-
-
Tot
al F
acil
itie
s A
cqui
siti
on a
nd C
onst
ruct
ion
Ser
vice
s-
-
-
-
-
-
-
-
-
-
-
Loc
al S
ourc
es
N.J
. Non
publ
icA
uxil
iary
Ser
vice
s C
h. 1
92H
andi
capp
ed S
ervi
ces
Ch.
193
99
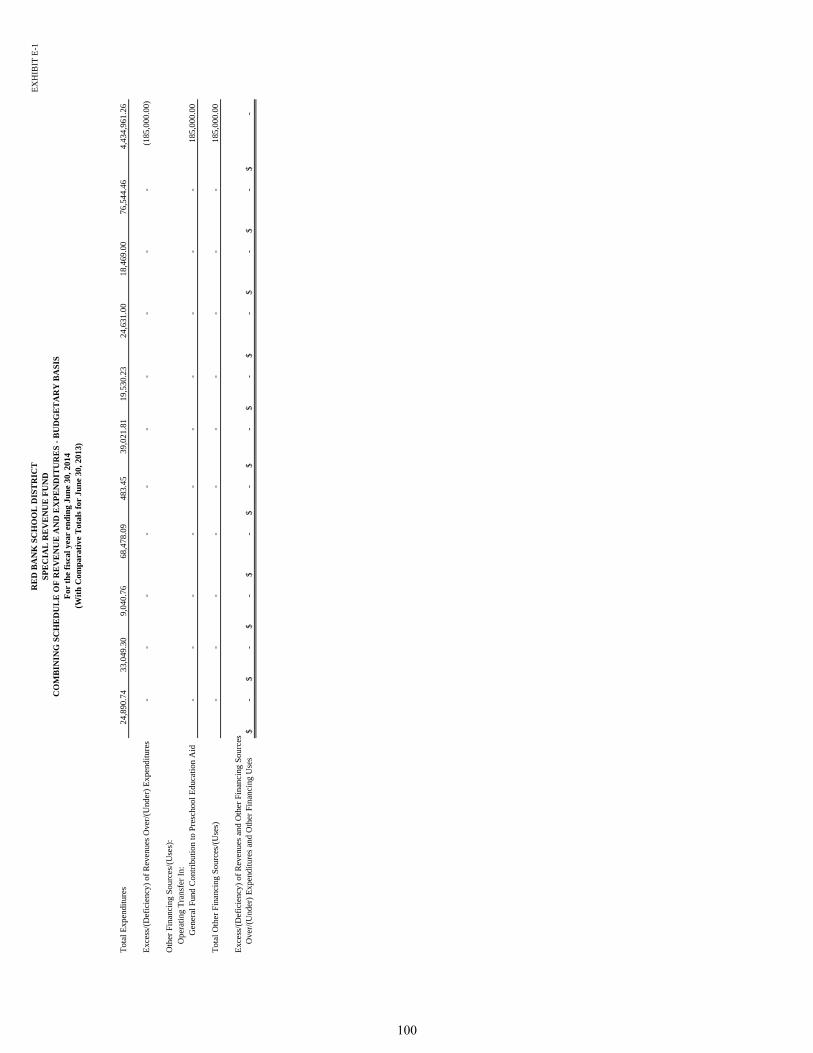
RE
D B
AN
K S
CH
OO
L D
IST
RIC
TS
PE
CIA
L R
EV
EN
UE
FU
ND
CO
MB
ININ
G S
CH
ED
UL
E O
F R
EV
EN
UE
AN
D E
XP
EN
DIT
UR
ES
- B
UD
GE
TA
RY
BA
SIS
For
th
e fi
scal
yea
r en
din
g Ju
ne
30, 2
014
(Wit
h C
omp
arat
ive
Tot
als
for
Jun
e 30
, 201
3)
EX
HIB
IT E
-1
Tot
al E
xpen
ditu
res
24,8
90.7
4
33
,049
.30
9,04
0.76
68,4
78.0
9
48
3.45
39
,021
.81
19
,530
.23
24,6
31.0
0
18
,469
.00
76,5
44.4
6
4,
434,
961.
26
Exc
ess/
(Def
icie
ncy)
of
Rev
enue
s O
ver/
(Und
er)
Exp
endi
ture
s-
-
-
-
-
-
-
-
-
-
(185
,000
.00)
Oth
er F
inan
cing
Sou
rces
/(U
ses)
:O
pera
ting
Tra
nsfe
r In
:G
ener
al F
und
Con
trib
utio
n to
Pre
scho
ol E
duca
tion
Aid
-
-
-
-
-
-
-
-
-
-
18
5,00
0.00
Tot
al O
ther
Fin
anci
ng S
ourc
es/(
Use
s)-
-
-
-
-
-
-
-
-
-
185,
000.
00
Exc
ess/
(Def
icie
ncy)
of
Rev
enue
s an
d O
ther
Fin
anci
ng S
ourc
esO
ver/
(Und
er)
Exp
endi
ture
s an
d O
ther
Fin
anci
ng U
ses
-$
-
$
-$
-
$
-
$
-
$
-$
-
$
-
$
-
$
-
$
100

RE
D B
AN
K S
CH
OO
L D
IST
RIC
TS
PE
CIA
L R
EV
EN
UE
FU
ND
CO
MB
ININ
G S
CH
ED
UL
E O
F R
EV
EN
UE
AN
D E
XP
EN
DIT
UR
ES
- B
UD
GE
TA
RY
BA
SIS
For
th
e fi
scal
yea
r en
din
g Ju
ne
30, 2
014
(Wit
h C
omp
arat
ive
Tot
als
for
Jun
e 30
, 201
3)
EX
HIB
IT E
-1
Rev
enue
s
Sta
te S
ourc
esF
eder
al S
ourc
es
Tot
al R
even
ues
Exp
endi
ture
s
Inst
ruct
ion:
Sal
arie
s of
Tea
cher
sO
ther
Sal
arie
s fo
r In
stru
ctio
nP
urch
ased
Ser
vice
sO
ther
Pur
chas
ed S
ervi
ces
Gen
eral
Sup
plie
sT
extb
ooks
Oth
er O
bjec
ts
Tot
al I
nstr
ucti
on
Sup
port
Ser
vice
s:S
alar
ies
Sal
arie
s of
Sup
ervi
sors
of
Inst
ruct
ion
Sal
arie
s of
Pro
gram
Dir
ecto
rsS
alar
ies
of O
ther
Pro
fess
iona
l Sta
ffS
alar
ies
of S
ecr.
And
Cle
rica
l Ass
ista
nts
Oth
er S
alar
ies
Sal
arie
s of
Com
mun
ity
Par
ent I
nvol
vem
ent S
pec.
Sal
arie
s of
Mas
ters
Tea
cher
sP
erso
nal S
ervi
ces
- E
mpl
oyee
Ben
efit
sP
rofe
ssio
nal a
nd T
echn
ical
Ser
vice
sP
urch
ased
Edu
c. S
ervi
ces
- C
ontr
acte
d P
re-K
Pur
chas
ed P
rofe
ssio
nal -
Edu
cati
onal
Ser
vice
sO
ther
Pur
chas
ed P
rofe
ssio
nal S
ervi
ces
Tui
tion
Rei
mbu
rsem
ent
Oth
er P
urch
ased
Ser
vice
sC
lean
ing,
Rep
air,
& M
aint
enan
ce S
ervi
ces
Ren
tals
Con
trac
ted
Tra
nspo
rtat
ion
Ser
v. (
Bet
. Hom
e &
Sch
)C
ontr
acte
d T
rans
port
atio
n S
erv.
(F
ield
Tri
ps)
Tra
vel
Sup
plie
s an
d M
ater
ials
Oth
er O
bjec
ts
Tot
al S
uppo
rt S
ervi
ces
Fac
ilit
ies
Acq
uisi
tion
and
Con
stru
ctio
n S
ervi
ces:
Inst
ruct
iona
l Equ
ipm
ent
Non
-Ins
truc
tion
al E
quip
men
t
Tot
al F
acil
itie
s A
cqui
siti
on a
nd C
onst
ruct
ion
Ser
vice
s
Loc
al S
ourc
es
21st
IDE
A(M
emor
andu
m O
nly)
Cen
tury
21st
Cen
tury
Loc
al
Tit
le I
IB
asic
Pre
scho
olG
rant
Gra
ntP
rogr
ams
Tit
le I
Par
t AT
itle
III
2014
2013
-$
-
$
-
$
-$
21,4
32.2
2$
-
$
-
$
-
$
21
,432
.22
$
12,4
18.9
6$
-
-
-
-
-
-
-
-
4,
469,
086.
64
4,31
1,26
4.08
305,
563.
17
11
,641
.00
76,8
97.7
3
23,0
44.5
4
-
781,
735.
94
62,1
59.3
3
87
,039
.00
1,44
3,09
4.17
1,
964,
629.
27
305,
563.
17$
11
,641
.00
$
76,8
97.7
3$
23,0
44.5
4$
21,4
32.2
2$
78
1,73
5.94
$
62
,159
.33
$
87,0
39.0
0$
5,
933,
613.
03$
6,28
8,31
2.31
$
-$
-
$
58
,923
.41
$
6,
213.
88$
1,
680.
00$
29
8,04
0.55
$
-
$
56
,112
.00
$
1,00
0,66
9.94
$
1,
113,
965.
55$
11
0,61
4.51
10,8
91.0
0
-
12,0
56.0
0
1,69
9.00
84,9
85.0
0
-
-
54
3,09
8.00
561,
914.
68
93,1
84.4
7
-
-
1,31
2.00
-
27,3
00.0
0
-
-
27
3,94
1.05
250,
908.
49
-
-
-
-
-
9,90
7.84
-
-
219,
618.
46
78
,397
.16
-
-
-
236.
75
8,09
8.82
5,18
6.17
-
-
36,6
19.6
3
13
9,81
9.43
-
-
-
-
-
-
-
-
24
,890
.74
25,3
21.6
6
-
-
-
-
-
-
-
-
1,
754.
85
8,05
4.03
203,
798.
98
10
,891
.00
58,9
23.4
1
19,8
18.6
3
11,4
77.8
2
42
5,41
9.56
-
56
,112
.00
2,10
0,59
2.67
2,
178,
381.
00
-
-
11
,699
.86
-
-
13
,746
.25
11,4
53.0
0
-
54
,203
.11
200,
129.
79
-
-
-
-
-
3,54
6.00
5,74
2.00
-
120,
140.
23
31
,962
.88
-
-
-
-
-
-
-
-
15,3
45.7
3
81
,966
.54
-
-
-
-
-
-
-
-
137,
173.
02
13
8,52
4.00
-
-
-
-
-
11
,483
.22
-
-
49,0
19.2
2
86
,035
.23
-
-
-
-
-
-
-
-
97,0
78.0
0
92
,419
.51
-
-
-
-
-
-
-
-
67,6
02.1
2
43
,850
.55
-
-
-
-
-
-
-
-
111,
355.
00
10
0,93
1.72
23
,573
.01
750.
00
5,55
4.46
1,39
7.65
-
243,
359.
27
1,31
5.16
30,9
27.0
0
71
3,53
8.21
797,
288.
99
78,1
91.1
8
-
-
-
-
62,5
12.3
3
5,
205.
00
-
14
5,90
8.51
198,
303.
97
-
-
-
-
-
-
-
-
1,91
5,67
3.00
1,
857,
406.
00
-
-
-
-
-
-
-
-
10
5,24
4.31
75,1
24.6
7
-
-
-
-
-
-
-
-
16
,548
.88
11,8
00.0
0
-
-
-
-
-
-
-
-
27
,909
.84
6,81
7.71
-
-
72
0.00
1,
828.
26
2,
417.
00
8,
790.
46
8,
550.
73
-
22
,306
.45
97,5
98.0
6
-
-
-
-
7,
537.
40
-
-
-
16
,537
.40
4,20
0.00
-
-
-
-
-
-
-
-
105,
802.
90
96
,500
.23
-
-
-
-
-
-
-
-
200,
413.
97
19
7,00
0.00
-
-
-
-
-
-
-
-
2,
483.
50
8,08
7.00
-
-
-
-
-
-
-
-
1,86
9.82
2,
600.
00
-
-
-
-
-
12
,878
.85
3,52
8.60
-
59,0
92.6
2
10
6,99
3.64
-
-
-
-
-
-
26
,364
.84
-
32,7
74.5
2
25
,167
.64
101,
764.
19
75
0.00
17
,974
.32
3,
225.
91
9,
954.
40
35
6,31
6.38
62
,159
.33
30,9
27.0
0
4,
018,
020.
36
4,26
0,70
8.13
-
-
-
-
-
-
-
-
-
9,
415.
80
-
-
-
-
-
-
-
-
-
14
,807
.38
-
-
-
-
-
-
-
-
-
24
,223
.18
Tot
als
I.D
.E.A
. Par
t BN
o C
hild
Lef
t Beh
ind
101

RE
D B
AN
K S
CH
OO
L D
IST
RIC
TS
PE
CIA
L R
EV
EN
UE
FU
ND
CO
MB
ININ
G S
CH
ED
UL
E O
F R
EV
EN
UE
AN
D E
XP
EN
DIT
UR
ES
- B
UD
GE
TA
RY
BA
SIS
For
th
e fi
scal
yea
r en
din
g Ju
ne
30, 2
014
(Wit
h C
omp
arat
ive
Tot
als
for
Jun
e 30
, 201
3)
EX
HIB
IT E
-1
Tot
al E
xpen
ditu
res
Exc
ess/
(Def
icie
ncy)
of
Rev
enue
s O
ver/
(Und
er)
Exp
endi
ture
s
Oth
er F
inan
cing
Sou
rces
/(U
ses)
:O
pera
ting
Tra
nsfe
r In
:G
ener
al F
und
Con
trib
utio
n to
Pre
scho
ol E
duca
tion
Aid
Tot
al O
ther
Fin
anci
ng S
ourc
es/(
Use
s)
Exc
ess/
(Def
icie
ncy)
of
Rev
enue
s an
d O
ther
Fin
anci
ng S
ourc
esO
ver/
(Und
er)
Exp
endi
ture
s an
d O
ther
Fin
anci
ng U
ses
305,
563.
17
11
,641
.00
76,8
97.7
3
23,0
44.5
4
21,4
32.2
2
78
1,73
5.94
62
,159
.33
87,0
39.0
0
6,
118,
613.
03
6,46
3,31
2.31
-
-
-
-
-
-
-
-
(185
,000
.00)
(1
75,0
00.0
0)
-
-
-
-
-
-
-
-
185,
000.
00
17
5,00
0.00
-
-
-
-
-
-
-
-
185,
000.
00
17
5,00
0.00
-$
-
$
-
$
-$
-$
-$
-$
-$
(0.0
0)$
0.00
$
102

EXHIBIT E-2
DISTRICT-WIDE TOTALS 2014 2014Budgeted Actual Variance
EXPENDITURES:Instruction:
Salaries of Teachers 510,312.03$ 510,312.03$ -$ Other Salaries for Instruction 323,231.76 322,852.49 379.27 Other Purchased Services 209,710.62 209,710.62 - General Supplies 21,249.69 21,249.69 - Other Objects 6,550.00 1,754.85 4,795.15
Total Instruction 1,071,054.10 1,065,879.68 5,174.42
Support Services:Salaries of Supervisors of Instruction 110,852.23 110,852.23 - Salaries of Program Directors 15,862.77 15,345.73 517.04 Salaries of Other Professional Staff 137,196.71 137,173.02 23.69 Salaries of Secr. And Clerical Assistants 37,536.00 37,536.00 - Other Salaries 97,078.00 97,078.00 - Salaries of Community Parent Involvement Spec. 67,602.12 67,602.12 - Salaries of Masters Teachers 111,355.00 111,355.00 - Personal Services - Employee Benefits 400,188.47 400,188.47 - Purchased Educ. Services - Contracted Pre-K 2,016,180.00 1,915,673.00 100,507.00 Purchased Professional - Educational Services 75,962.41 72,195.01 3,767.40 Other Purchased Professional Services 17,171.88 16,548.88 623.00 Tuition Reimbursement 27,909.84 27,909.84 - Cleaning, Repair, & Maintenance Services 9,000.00 9,000.00 - Rentals 105,907.86 105,802.90 104.96 Contracted Transportation Serv. (Bet. Home & Sch) 200,413.97 200,413.97 - Contracted Transportation Serv. (Field Trips) 7,698.23 2,483.50 5,214.73 Travel 4,500.00 1,869.82 2,630.18 Supplies and Materials 33,644.41 33,644.41 - Other Objects 7,000.00 6,409.68 590.32
Total Support Services 3,483,059.90 3,369,081.58 113,978.32
Total Expenditures 4,554,114.00$ 4,434,961.26$ 119,152.74$
Total revised 2013-14 Preschool Education Aid Allocation 4,279,702.00$ Add: Actual ECPA/PEA Carryover (June 30, 2013) 63,348.39 Add: Prior Year Cancelled Encumbrances 70,285.00 Add: Budgeted Transfer from the General Fund 2013-14 185,000.00
Total Preschool Education Aid Funds Available for 2013-14 Budget 4,598,335.39
Less:2013-14 Budgeted Preschool Education Aid (Including prior-year budget carryover) (4,554,114.00)
Available and Unbudgeted Preschool Education Aid Funds as of June 30, 2014 44,221.39
Add:June 30, 2014 Unexpended Preschool Education Aid 119,152.74
2013-14 Carryover - Preschool Education Aid Programs 163,374.13$
2013-14 Preschool Education Aid Carryover Budgeted for Preschool Programs 2014-15 85,000.00$
SUMMARY OF LOCATION TOTALS
RED BANK SCHOOL DISTRICTSPECIAL REVENUE FUND
SCHEDULE OF PRESCHOOL EDUCATION AIDBUDGETARY BASIS
For the fiscal year ended June 30, 2014(With Comparative Totals for June 30, 2013)
103

This page intentionally left blank
104

F. Capital Projects Fund
105

This page intentionally left blank
106

EXHIBIT F-1
Approval Prior Current UnexpendedDate Appropriations Years Year Balance
Renovations, Improvements andVarious Acquisitions for the
Middle School 08/24/00 11,248,520.66$ 11,176,749.41$ -$ 71,771.25$ HVAC Replacement throughtout
Building 03/31/14 1,214,526.00 - 72,000.00 1,142,526.00
Totals 12,463,046.66$ 11,176,749.41$ 72,000.00$ 1,214,297.25$
Less: Unearned SDA Revenue (457,010.00)$
Fund Balance 757,287.25$
Project Title/Issue
RED BANK SCHOOL DISTRICTCAPITAL PROJECTS FUND
SUMMARY STATEMENT OF PROJECT EXPENDITURESFor the year ended June 30, 2014
Expenditures to Date
107

EXHIBIT F-2
BUDGETARY BASIS
Revenues and Other Financing Sources:State Sources - SCC Grant 485,810.00$ Insurance Proceeds 728,716.00
Total Revenues 1,214,526.00
Expenditures and Other Financing Sources:Purchased Professional and Technical Services 72,000.00
Total Expenditures 72,000.00
Excess/(Deficiency) of Revenues Over/(Under) Expenditures 1,142,526.00
Net Change in Fund Balances 1,142,526.00 Fund Balance - July 1 71,771.25
Fund Balance - June 30 1,214,297.25$
RED BANK SCHOOL DISTRICTCAPITAL PROJECTS FUND
SUMMARY SCHEDULE OF REVENUES, EXPENDITURES, AND CHANGES IN FUND BALANCE -
For the year ended June 30, 2014
108

EXHIBIT F-2a
RevisedPrior Current Authorized
Periods Year Totals CostRevenues and Other Financing Sources:
State Sources - SCC Grant 4,483,520.66$ -$ 4,483,520.66$ 4,483,520.66$ Bond Proceeds and Transfers 6,765,000.00 - 6,765,000.00 6,765,000.00
Total Revenues 11,248,520.66 - 11,248,520.66 11,248,520.66
Expenditures and Other Financing Uses:Purchased Professional and Technical
Services 1,263,859.83 - 1,263,859.83 1,270,000.00 Construction Services 9,844,714.52 - 9,844,714.52 9,878,520.66 Supplies 68,175.06 - 68,175.06 100,000.00
Total Expenditures 11,176,749.41 - 11,176,749.41 11,248,520.66
Excess/(Deficiency) of Revenues Over/(Under) Expenditures 71,771.25$ -$ 71,771.25$ -$
Additional Project Information:Project Date 08/24/00Grant Date 08/31/00Bond Authorization Date 11/06/00Bonds Authorized 6,765,000.00 Bonds Issued 6,760,000.00 Original Authorization Cost 11,275,000.00 Additional Authorization Cost (26,479.34) Revised Authorization Cost 11,248,520.66
Percentage Increase over OriginalAuthorized Cost -0.23%
Percentage Completion 99.36%Original Target Completion Date 09/03Revised Target Completion Date N/A
From inception and for the year ended June 30, 2014
RED BANK SCHOOL DISTRICTCAPITAL PROJECTS FUND
SCHEDULE OF PROJECT REVENUES, EXPENDITURES, PROJECT BALANCE, AND PROJECT STATUS - BUDGETARY BASIS
RENOVATIONS, IMPROVEMENTS AND VARIOUS ACQUISITIONS FOR MIDDLE SCHOOL
109

EXHIBIT F-2b
RevisedPrior Current Authorized
Periods Year Totals CostRevenues and Other Financing Sources:
State Sources - SCC Grant -$ 485,810.00$ 485,810.00$ 485,810.00$ Insurance Proceeds - 728,716.00 728,716.00 728,716.00
Total Revenues - 1,214,526.00 1,214,526.00 1,214,526.00
Expenditures and Other Financing Uses:Purchased Professional and Technical
Services - 72,000.00 72,000.00 99,500.00 Construction Services - - - 1,115,026.00
Total Expenditures - 72,000.00 72,000.00 1,214,526.00
Excess/(Deficiency) of Revenues Over/(Under) Expenditures -$ 1,142,526.00$ 1,142,526.00$ -$
Additional Project Information:Project Number 4360-075-14-1001Grant Date/Letter of Notification 3/31/2014Bond Authorization Date N/ABonds Authorized N/ABonds Issued N/AOriginal Authorization Cost 1,214,526.00 Additional Authorization Cost - Revised Authorization Cost 1,214,526.00
Percentage Increase over OriginalAuthorized Cost 0.00%
Percentage Completion 5.93%Original Target Completion Date N/ARevised Target Completion Date N/A
From inception and for the year ended June 30, 2014
RED BANK SCHOOL DISTRICTCAPITAL PROJECTS FUND
SCHEDULE OF PROJECT REVENUES, EXPENDITURES, PROJECT BALANCE, AND PROJECT STATUS - BUDGETARY BASIS
HVAC REPLACEMENT THROUGHOUT BUILDING
110

G. Proprietary Funds
111

This page intentionally left blank
112

Enterprise Funds
113

This page intentionally left blank
114

EXHIBIT G-1
Business-TypeActivities -
Enterprise FundsFood Service 2014 2013
Assets:Current Assets:
Cash and Cash Equivalents 20,074.71$ 20,074.71$ 72,631.48$ Intergovernmental Receivables:
Federal 57,587.75 57,587.75 43,998.87 State 1,470.67 1,470.67 1,257.94
Accounts Receivable - Other 15,946.65 15,946.65 - Inventories 4,322.00 4,322.00 5,063.95
Total - Current Assets 99,401.78 99,401.78 122,952.24
Noncurrent Assets:Building Improvements 85,770.00 85,770.00 85,770.00 Furniture, Machinery and Equipment 125,188.17 125,188.17 125,188.17 Less: -
Accumulated Depreciation (135,358.44) (135,358.44) (125,325.57)
Total - Noncurrent Assets 75,599.73 75,599.73 85,632.60
Total Assets 175,001.51$ 175,001.51$ 208,584.84$
Net Position:Invested in Capital Assets Net of Related Debt 75,599.73$ 75,599.73$ 85,632.60$ Unrestricted 99,401.78 99,401.78 122,952.24
Total Net Position 175,001.51$ 175,001.51$ 208,584.84$
COMBINING SCHEDULE OF NET POSITIONJune 30, 2014
(With Comparative Totals for June 30, 2013)
RED BANK SCHOOL DISTRICTENTERPRISE FUND
115

EXHIBIT G-2
Business-TypeActivities -
Enterprise FundsFood Service 2014 2013
Operating Revenues:Charges for Services:
Daily Sales -$ -$ 80,005.19$ Daily Sales - Reimbursable Programs 31,388.98 31,388.98 - Daily Sales - Non-Reimbursable Programs 53,708.61 53,708.61 - Special Functions 52,233.16 52,233.16 21,694.30
Total Operating Revenues 137,330.75 137,330.75 101,699.49
Operating Expenses:Salaries - - 53,552.64 Support Services - Employee Benefits - - 25,775.51 Purchased Professional/Technical Services 402,855.52 402,855.52 267,520.67 Purchased Property Services 17,190.47 17,190.47 6,769.70 Supplies and Materials 29,728.54 29,728.54 19,251.13 Depreciation 10,032.87 10,032.87 13,338.33 Cost of Sales 352,382.91 352,382.91 362,756.40 Miscellaneous Expenditures 3,863.95 3,863.95 -
Total Operating Expenses 816,054.26 816,054.26 748,964.38
Operating Loss (678,723.51) (678,723.51) (647,264.89)
Nonoperating Revenues:State Sources:
State School Lunch Program 10,245.95 10,245.95 9,158.18 Federal Sources:
National School Lunch Program 504,462.83 504,462.83 425,815.62 National School Breakfast Program 110,840.36 110,840.36 104,533.06 After School Snacks 3,528.80 3,528.80 2,886.78
Food Distribution Program 15,766.36 15,766.36 35,448.17 Interest and Investment Income 295.88 295.88 267.29
Total Nonoperating Revenues 645,140.18 645,140.18 578,109.10
Change in Net Position (33,583.33) (33,583.33) (69,155.79)
Total Net Position - Beginning 208,584.84 208,584.84 277,740.63
Total Net Position - Ending 175,001.51$ 175,001.51$ 208,584.84$
(With Comparative Totals for June 30, 2013)June 30, 2014
ENTERPRISE FUNDSCHEDULE OF REVENUES, EXPENSES, AND CHANGES IN NET POSITION
RED BANK SCHOOL DISTRICT
116

EXHIBIT G-3
Business-Type Activities -Enterprise Funds
Food Service 2014 2013Cash Flows From Operating Activities:
Receipts From Customers 121,384.10$ 121,384.10$ 103,962.65$ Payments To Employees - - (53,552.64) Payments For Employee Benefits - - (25,775.51) Payments To Suppliers (789,513.08) (789,513.08) (636,172.35)
Net Cash Used For Operating Activities (668,128.98) (668,128.98) (611,537.85)
Cash Flows From Noncapital Financing Activities:State Sources 10,033.22 10,033.22 8,402.89 Federal Sources 605,243.11 605,243.11 527,785.80
Net Cash Provided By Noncapital Financing Activities 615,276.33 615,276.33 536,188.69
Cash Flows From Investing Activities:Interest 295.88 295.88 267.29
Net Cash Provided By Investing Activities 295.88 295.88 267.29
Net Increase in Cash and Cash Equivalents (52,556.77) (52,556.77) (75,081.87)
Balance - Beginning of Year 72,631.48 72,631.48 147,713.35
Balance - End of Year 20,074.71$ 20,074.71$ 72,631.48$
Reconciliation of Operating Loss To Net Cash Provided By/(Used For) Operating Activities:
Operating Loss: (678,723.51)$ (678,723.51)$ (647,264.89)$ Adjustments To Reconcile Operating Loss To Net Cash
Provided By/(Used For) Operating Activities:(Increase)/Decrease in Accounts Receivable (15,946.65) (15,946.65) 3,301.21 Increase/(Decrease) in Accounts Payable - - (27,336.65) Depreciation 10,032.87 10,032.87 13,338.33 Increase/(Decrease) in Deferred Revenue - - (1,038.05) Food Distribution 15,766.36 15,766.36 35,448.17 (Increase)/Decrease in Inventories 741.95 741.95 12,014.03
Total Adjustments 10,594.53 10,594.53 35,727.04
Net Cash Used For Operating Activities (668,128.98)$ (668,128.98)$ (611,537.85)$
(With Comparative Totals to June 30, 2013)June 30, 2014
COMBINING SCHEDULE OF CASH FLOWS
RED BANK SCHOOL DISTRICTENTERPRISE FUND
117

This page intentionally left blank
118
H. Fiduciary Fund
119

This page intentionally left blank
120
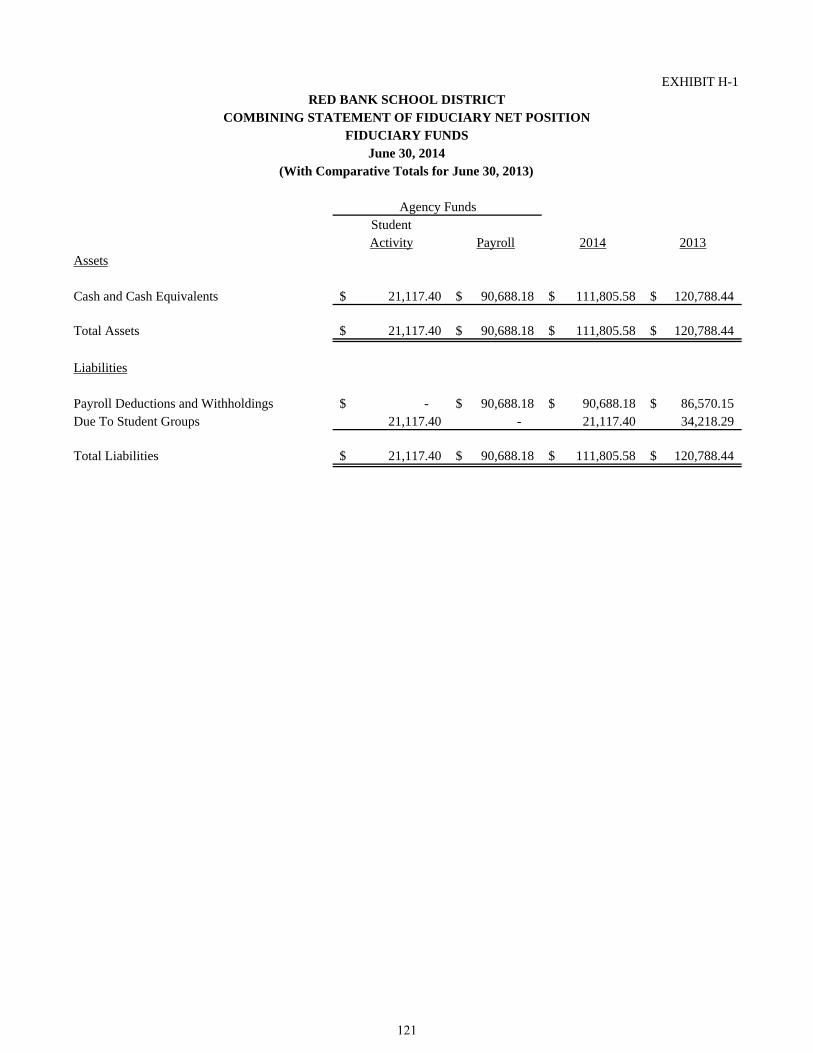
EXHIBIT H-1
StudentActivity Payroll 2014 2013
Assets
Cash and Cash Equivalents 21,117.40$ 90,688.18$ 111,805.58$ 120,788.44$
Total Assets 21,117.40$ 90,688.18$ 111,805.58$ 120,788.44$
Liabilities
Payroll Deductions and Withholdings -$ 90,688.18$ 90,688.18$ 86,570.15$ Due To Student Groups 21,117.40 - 21,117.40 34,218.29
Total Liabilities 21,117.40$ 90,688.18$ 111,805.58$ 120,788.44$
Agency Funds
June 30, 2014FIDUCIARY FUNDS
COMBINING STATEMENT OF FIDUCIARY NET POSITIONRED BANK SCHOOL DISTRICT
(With Comparative Totals for June 30, 2013)
121

EXHIBIT H-3
Balance BalanceJuly 1, Cash Cash June 30,2013 Receipts Disbursements 2014
Elementary Schools:Primary School 10,815.45$ 12,410.46$ 20,089.80$ 3,136.11$ Middle School 23,402.84 34,231.33 39,652.88 17,981.29
Total Assets 34,218.29$ 46,641.79$ 59,742.68$ 21,117.40$
RED BANK SCHOOL DISTRICTSCHEDULE OF RECEIPTS AND DISBURSEMENTS
STUDENT ACTIVITY AGENCY FUNDFor the fiscal year ended June 30, 2014
122

EXHIBIT H-4
Balance BalanceJuly 1, June 30,2013 Additions Deletions 2014
Assets
Cash 86,570.15$ 12,873,921.47$ 12,869,803.44$ 90,688.18$
Total Assets 86,570.15$ 12,873,921.47$ 12,869,803.44$ 90,688.18$
Liabilities
Payroll Deductions andWithholdings 86,570.15$ 5,547,470.10$ 5,544,065.28$ 89,974.97$
Net Payroll - 7,326,451.37 7,325,738.16 713.21
Total Liabilities 86,570.15$ 12,873,921.47$ 12,869,803.44$ 90,688.18$
RED BANK SCHOOL DISTRICTPAYROLL AGENCY FUND
SCHEDULE OF RECEIPTS AND DISBURSEMENTSFor the fiscal year ended June 30, 2014
123

This page intentionally left blank
124

I. Long-Term Debt
125

This page intentionally left blank
126

EXHIBIT I-1
Balance BalanceDate of Amount of Annual Maturities Interest July 1, June 30,
Issue Issue Issue Date Amount Rate 2013 Retired 2014
Refunding Bonds 07/01/05 4,690,000.00$ 05/01/15 360,000.00$ 4.750% 3,185,000.00$ 360,000.00$ 2,825,000.00$ 05/01/16 370,000.00 4.500%
05/01/17-18 410,000.00 4.500%05/01/19 405,000.00 4.500%05/01/20 440,000.00 4.500%05/01/21 430,000.00 4.000%
3,185,000.00$ 360,000.00$ 2,825,000.00$
RED BANK SCHOOL DISTRICTSTATEMENT OF SERIAL BONDS
June 30, 2014
127

EX
HIB
IT I
-3
Var
ianc
eV
aria
nce
Ori
gina
lB
udge
tF
inal
Pos
itiv
e/(N
egat
ive)
Ori
gina
lB
udge
tF
inal
Pos
itiv
e/(N
egat
ive)
Bud
get
Tra
nsfe
rsB
udge
tA
ctua
lF
inal
To
Act
ual
Bud
get
Tra
nsfe
rsB
udge
tA
ctua
lF
inal
To
Act
ual
Rev
enue
s
Loc
al S
ourc
es:
Loc
al T
ax L
evy
544,
861.
00$
-$
54
4,86
1.00
$ 54
4,86
1.00
$ -
$
546,
695.
00$
-$
54
6,69
5.00
$ 54
6,69
5.00
$ -
$
Tot
al R
even
ues
544,
861.
00
-
54
4,86
1.00
54
4,86
1.00
-
546,
695.
00
-
54
6,69
5.00
54
6,69
5.00
-
Exp
endi
ture
s-
-
Reg
ular
Deb
t Ser
vice
:-
-
Inte
rest
on
Bon
ds14
3,82
5.00
(0
.26)
14
3,82
4.74
14
3,82
4.74
-
161,
880.
00
-
16
1,88
0.00
16
1,87
9.44
0.
56
R
edem
ptio
n of
Pri
ncip
al40
1,03
6.00
0.
26
40
1,03
6.26
40
1,03
6.26
-
384,
815.
00
-
38
4,81
5.00
38
4,81
4.35
0.
65
Tot
al R
egul
ar D
ebt S
ervi
ce54
4,86
1.00
-
544,
861.
00
544,
861.
00
-
54
6,69
5.00
-
546,
695.
00
546,
693.
79
1.21
Tot
al E
xpen
ditu
res
544,
861.
00
-
54
4,86
1.00
54
4,86
1.00
-
546,
695.
00
-
54
6,69
5.00
54
6,69
3.79
1.
21
Exc
ess/
(Def
icie
ncy)
of
Rev
enue
O
ver/
(Und
er)
Exp
endi
ture
s-
-
-
-
-
-
-
-
1.
21
1.21
Fun
d B
alan
ce, J
uly
168
3.21
683.
21
68
3.21
-
68
2.00
682.
00
68
2.00
-
Fun
d B
alan
ce, J
une
3068
3.21
$
-$
68
3.21
$
683.
21$
-
$
682.
00$
-
$
682.
00$
68
3.21
$
1.21
$
RE
D B
AN
K S
CH
OO
L D
IST
RIC
T
June
30,
201
3Ju
ne 3
0, 2
014For
th
e fi
scal
yea
r en
ded
Ju
ne
30, 2
014
DE
BT
SE
RV
ICE
FU
ND
BU
DG
ET
AR
Y C
OM
PA
RIS
ON
SC
HE
DU
LE
(Wit
h C
omp
arat
ive
Tot
als
for
Jun
e 30
, 201
3)
128
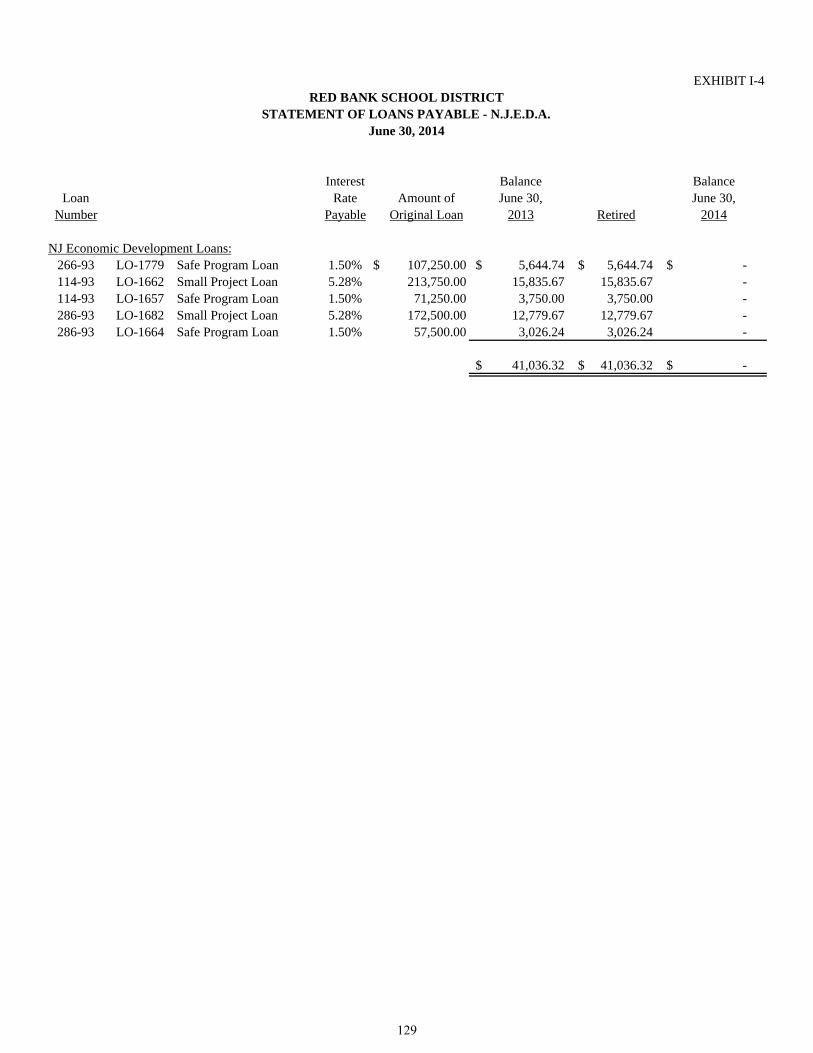
EXHIBIT I-4
Interest Balance BalanceLoan Rate Amount of June 30, June 30,
Number Payable Original Loan 2013 Retired 2014
NJ Economic Development Loans:266-93 LO-1779 Safe Program Loan 1.50% $ 107,250.00 5,644.74$ 5,644.74$ -$ 114-93 LO-1662 Small Project Loan 5.28% 213,750.00 15,835.67 15,835.67 - 114-93 LO-1657 Safe Program Loan 1.50% 71,250.00 3,750.00 3,750.00 - 286-93 LO-1682 Small Project Loan 5.28% 172,500.00 12,779.67 12,779.67 - 286-93 LO-1664 Safe Program Loan 1.50% 57,500.00 3,026.24 3,026.24 -
41,036.32$ 41,036.32$ -$
RED BANK SCHOOL DISTRICTSTATEMENT OF LOANS PAYABLE - N.J.E.D.A.
June 30, 2014
129

This page intentionally left blank
130

STATISTICAL SECTION (Unaudited)
131

This page intentionally left blank
132

EX
HIB
IT J
-1
2005
2006
2007
2008
2009
2010
2011
2012
2013
2014
Gov
ernm
ent A
ctiv
itie
s:
Net
Inv
estm
ent i
n C
apit
al A
sset
s10
,622
,026
.66
$
10,4
52,0
50.6
7$
10
,400
,190
.13
$
10,3
63,8
88.0
0$
10
,550
,530
.35
$
10,8
49,8
37.9
3$
10
,896
,274
.39
$
11,1
21,6
12.4
6$
11
,105
,567
.10
$
11,3
25,4
15.5
2$
Res
tric
ted
662,
349.
39
1,23
3,73
7.10
2,03
3,83
0.95
2,02
8,39
9.00
1,95
4,58
7.02
608,
027.
36
493,
220.
25
884,
704.
04
1,31
1,58
2.63
1,43
7,59
4.71
Unr
estr
icte
d38
9,11
0.82
31
5,06
4.90
91
,519
.48
262,
506.
00
230,
996.
58
(10,
136.
44)
114,
756.
08
(125
,331
.43)
(3
21,9
81.9
0)
552,
535.
50
Tot
al G
over
nmen
t Act
ivit
ies
Net
Pos
itio
n11
,673
,486
.87
$
12,0
00,8
52.6
7$
12
,525
,540
.56
$
12,6
54,7
93.0
0$
12
,736
,113
.95
$
11,4
47,7
28.8
5$
11
,504
,250
.72
$
11,8
80,9
85.0
7$
12
,095
,167
.83
$
13,3
15,5
45.7
3$
Bus
ines
s-T
ype
Act
ivit
ies:
Net
Inv
estm
ent i
n C
apit
al A
sset
s33
,496
.44
$
29,3
78.1
9$
32
,808
.99
$
34,2
23.0
0$
35
,631
.09
$
47,2
18.7
6$
39
,772
.62
$
98,9
70.9
3$
98
,970
.93
$
75,5
99.7
3$
Unr
estr
icte
d72
,511
.26
90,0
06.7
9
12
4,20
1.89
13
5,42
8.00
18
1,64
8.47
23
6,58
1.50
28
0,38
3.67
17
8,76
9.70
17
8,76
9.70
99
,401
.78
Tot
al B
usin
ess-
Typ
e A
ctiv
itie
s N
et P
osit
ion
106,
007.
70$
119,
384.
98$
157,
010.
88$
169,
651.
00$
217,
279.
56$
283,
800.
26$
320,
156.
29$
277,
740.
63$
277,
740.
63$
175,
001.
51$
Dis
tric
t-w
ide:
Net
Inv
estm
ent i
n C
apit
al A
sset
s10
,655
,523
.10
$
10,4
81,4
28.8
6$
10
,432
,999
.12
$
10,3
98,1
11.0
0$
10
,586
,161
.44
$
10,8
97,0
56.6
9$
10
,936
,047
.01
$
11,2
20,5
83.3
9$
11
,220
,583
.39
$
11,4
01,0
15.2
5$
Res
tric
ted
662,
349.
39
1,23
3,73
7.10
2,03
3,83
0.95
2,02
8,39
9.00
1,95
4,58
7.02
608,
027.
36
493,
220.
25
884,
704.
04
884,
704.
04
1,43
7,59
4.71
Unr
estr
icte
d46
1,62
2.08
40
5,07
1.69
21
5,72
1.37
39
7,93
4.00
41
2,64
5.05
22
6,44
5.06
39
5,13
9.75
53
,438
.27
53,4
38.2
7
65
1,93
7.28
Tot
al D
istr
ict N
et P
osit
ion
11,7
79,4
94.5
7$
12
,120
,237
.65
$
12,6
82,5
51.4
4$
12
,824
,444
.00
$
12,9
53,3
93.5
1$
11
,731
,529
.11
$
11,8
24,4
07.0
1$
12
,158
,725
.70
$
12,1
58,7
25.7
0$
13
,490
,547
.24
$
Bon
d Is
sue
Cas
h, w
hich
was
incl
uded
in th
e C
apit
al A
sset
line
of
Gov
ernm
enta
l Act
ivit
ies
in p
rior
yea
rs, i
s no
w in
clud
ed in
the
Res
tric
ted
Res
erve
line
.
RE
D B
AN
K S
CH
OO
L D
IST
RIC
T
NE
T P
OS
ITIO
N B
Y C
OM
PO
NE
NT
LA
ST
TE
N F
ISC
AL
YE
AR
S
(AC
CR
UA
L B
AS
IS O
F A
CC
OU
NT
ING
)
(UN
AU
DIT
ED
)
June
30,
133

EX
HIB
IT J
-2
2005
2006
2007
2008
2009
2010
2011
2012
2013
2014
Exp
ense
s:
Gov
ernm
enta
l Act
ivit
ies:
Inst
ruct
ion:
Reg
ular
(5,9
90,6
28.1
2)$
(6
,244
,257
.27)
$
(6,9
44,7
63.6
6)$
(7
,011
,619
.00)
$
(7,7
04,5
01.1
6)$
(8
,591
,174
.59)
$
(8,4
46,6
10.4
0)$
(8
,110
,220
.99)
$
(6,1
19,0
71.7
1)$
(6
,180
,779
.17)
$
Spec
ial E
duca
tion
(628
,118
.54)
(8
49,2
10.0
0)
(631
,071
.79)
(1
,047
,640
.00)
(918
,243
.45)
(1
,367
,417
.05)
(1,2
73,8
65.1
4)
(1
,182
,202
.41)
(963
,464
.73)
(8
61,5
55.2
5)
Oth
er S
peci
al E
duca
tion
(415
,084
.93)
(4
45,3
34.8
1)
(348
,361
.63)
(6
72,2
73.0
0)
(658
,315
.85)
(6
18,4
53.2
0)
(592
,289
.02)
(7
13,0
08.5
4)
(585
,767
.68)
(8
60,3
02.2
8)
Oth
er I
nstr
ucti
on(7
8,10
4.89
)
(5
9,35
9.83
)
(5
8,06
9.22
)
(5
2,05
3.00
)
(4
6,02
2.70
)
(3
28,2
20.0
1)
(244
,607
.19)
(2
17,8
74.9
7)
(6,9
19.3
7)
(3,1
40.0
0)
Supp
ort S
ervi
ces:
Tui
tion
(487
,248
.82)
(5
11,7
64.6
9)
(459
,593
.13)
(4
36,3
30.0
0)
(416
,493
.28)
(5
62,1
13.3
5)
(472
,193
.33)
(5
06,7
84.8
8)
(459
,556
.13)
(6
24,8
24.2
2)
Stud
ent a
nd I
nstr
ucti
on R
elat
ed S
ervi
ces
(2,2
34,1
29.1
1)
(2
,062
,912
.75)
(2,1
28,6
93.3
4)
(2
,392
,611
.00)
(2,5
90,2
91.6
0)
(3
,744
,417
.62)
(4,6
72,9
53.0
0)
(4
,617
,099
.67)
(5,4
26,8
78.9
8)
(5
,075
,742
.33)
Gen
eral
Adm
inis
trat
ion
(709
,862
.52)
(5
92,7
33.6
3)
(469
,149
.90)
(4
27,8
80.0
0)
(408
,150
.07)
(4
02,4
79.4
9)
(415
,876
.18)
(4
21,8
58.4
9)
(399
,112
.39)
(3
68,5
13.0
7)
Scho
ol A
dmin
istr
ativ
e Se
rvic
es(4
44,1
77.9
2)
(492
,491
.62)
(4
49,4
76.6
8)
(604
,092
.00)
(5
55,7
60.0
5)
(547
,087
.32)
20
8,27
2.99
(106
,576
.95)
(4
34,1
01.5
6)
(464
,140
.33)
Cen
tral
Ser
vice
s-
-
(2
08,9
93.7
3)
(247
,919
.00)
(2
00,5
78.1
9)
(212
,192
.37)
(2
01,4
06.1
7)
(263
,808
.03)
(1
78,7
55.5
4)
(237
,581
.69)
Adm
inis
trat
ive
Info
rmat
ion
Tec
hnol
ogy
-
-
(16,
558.
24)
(86,
672.
00)
(254
,104
.66)
(2
6,32
2.37
)
(1
14,4
09.5
4)
(94,
173.
93)
(100
,025
.14)
(1
53,0
70.3
6)
Pla
nt O
pera
tion
s an
d M
aint
enan
ce(1
,357
,465
.55)
(1,2
35,7
66.5
7)
(1
,297
,154
.30)
(1,2
92,5
36.0
0)
(1
,597
,577
.47)
(1,3
08,8
37.5
7)
(1
,585
,199
.23)
(1,3
02,6
32.7
7)
(1
,208
,786
.78)
(1,2
15,8
93.5
1)
Pup
il T
rans
port
atio
n(8
75,6
60.4
9)
(866
,535
.79)
(8
16,7
40.9
9)
(933
,035
.00)
(8
98,9
00.4
8)
(879
,177
.62)
(9
09,8
03.4
0)
(845
,459
.88)
(8
29,3
97.6
9)
(854
,603
.83)
Una
lloca
ted
Ben
efit
s-
-
-
-
-
-
-
-
(4
,008
,922
.86)
(4,1
29,0
98.7
9)
Spec
ial S
choo
ls(2
,650
.01)
(4
4,50
8.63
)
(4
2,98
1.00
)
(5
6,40
7.00
)
(4
1,00
8.78
)
(5
3,45
7.57
)
(7
,000
.00)
(6
5,19
9.68
)
(1
15,6
15.2
3)
(119
,894
.90)
Cha
rter
Sch
ools
(1,5
03,8
39.3
0)
(1
,568
,747
.00)
(1,7
10,1
47.0
0)
(1
,747
,016
.00)
(1,8
40,6
47.0
0)
(1
,799
,071
.00)
(1,6
90,5
04.0
0)
(1
,709
,733
.00)
(1,6
40,7
18.0
0)
(1
,643
,367
.00)
Inte
rest
on
Lon
g-T
erm
Deb
t(3
20,5
96.9
5)
(208
,705
.18)
(2
50,5
92.9
7)
(230
,951
.00)
(2
18,5
38.0
6)
(191
,453
.85)
(1
59,2
97.2
9)
(160
,234
.09)
(1
57,4
21.5
1)
(179
,938
.25)
Una
lloca
ted
Dep
reci
atio
n(3
94,4
02.0
0)
(394
,772
.52)
(4
06,3
89.0
0)
(8,7
86.0
0)
(36,
728.
81)
-
(5
,017
.72)
(5
,017
.72)
(4
79,2
89.6
8)
(493
,314
.30)
Tot
al G
over
nmen
tal A
ctiv
itie
s E
xpen
ses
(15,
441,
969.
15)
(15,
577,
100.
29)
(16,
238,
736.
58)
(17,
247,
820.
00)
(18,
385,
861.
61)
(20,
631,
874.
98)
(20,
582,
758.
62)
(20,
321,
886.
00)
(23,
113,
804.
98)
(23,
465,
759.
28)
Bus
ines
s-T
ype
Act
ivit
ies:
Food
Ser
vice
(344
,424
.54)
(3
63,6
76.9
4)
(363
,091
.98)
(4
42,7
21.0
0)
(467
,323
.28)
(5
15,1
70.4
2)
(575
,617
.07)
(7
15,7
74.0
6)
(748
,964
.38)
(8
16,0
54.2
6)
Tot
al B
usin
ess-
Typ
e A
ctiv
itie
s E
xpen
ses
(344
,424
.54)
(3
63,6
76.9
4)
(363
,091
.98)
(4
42,7
21.0
0)
(467
,323
.28)
(5
15,1
70.4
2)
(575
,617
.07)
(7
15,7
74.0
6)
(748
,964
.38)
(8
16,0
54.2
6)
Tot
al D
istr
ict E
xpen
ses
(15,
786,
393.
69)
$
(15,
940,
777.
23)
$
(16,
601,
828.
56)
$
(17,
690,
541.
00)
$
(18,
853,
184.
89)
$
(21,
147,
045.
40)
$
(21,
158,
375.
69)
$
(21,
037,
660.
06)
$
(23,
862,
769.
36)
$
(24,
281,
813.
54)
$
Pro
gram
Rev
enue
s:
Gov
ernm
enta
l Act
ivit
ies:
Cha
rges
for
Ser
vice
s:
Inst
ruct
ion
(Tui
tion
)6,
000.
00$
1,50
0.00
$
35
,880
.84
$
52
,589
.00
$
46
,735
.00
$
10
2,31
4.14
$
40,8
03.1
4$
10,2
27.0
0$
-$
-
$
Ope
rati
ng G
rant
s an
d C
ontr
ibut
ions
225,
338.
20
22
4,25
6.30
223,
155.
00
22
1,72
7.00
43,6
11.0
0
59,7
91.0
0
3,59
9.00
60
2,89
7.20
8,40
9,79
9.95
7,
864,
429.
13
Cap
ital
Gra
nts
and
Con
trib
utio
ns8,
705.
77
-
-
-
-
-
-
-
-
-
Tot
al G
over
nmen
tal A
ctiv
itie
s P
rogr
am R
even
ues
240,
043.
97
22
5,75
6.30
259,
035.
84
27
4,31
6.00
90,3
46.0
0
162,
105.
14
44
,402
.14
61
3,12
4.20
8,40
9,79
9.95
7,
864,
429.
13
RE
D B
AN
K S
CH
OO
L D
IST
RIC
T
CH
AN
GE
S IN
NE
T P
OSI
TIO
N
LA
ST T
EN
FIS
CA
L Y
EA
RS
(AC
CR
UA
L B
ASI
S O
F A
CC
OU
NT
ING
)
(UN
AU
DIT
ED
)
June
30,
134

EX
HIB
IT J
-2
2005
2006
2007
2008
2009
2010
2011
2012
2013
2014
RE
D B
AN
K S
CH
OO
L D
IST
RIC
T
CH
AN
GE
S IN
NE
T P
OSI
TIO
N
LA
ST T
EN
FIS
CA
L Y
EA
RS
(AC
CR
UA
L B
ASI
S O
F A
CC
OU
NT
ING
)
(UN
AU
DIT
ED
)
June
30,
Bus
ines
s-T
ype
Act
ivit
ies:
Cha
rges
for
Ser
vice
s:
Food
Ser
vice
73,3
66.9
3
71,9
07.7
4
77,1
22.1
2
92,4
67.0
0
102,
516.
67
12
6,46
3.04
129,
241.
77
12
5,18
7.78
101,
699.
49
13
7,33
0.75
Ope
rati
ng G
rant
s an
d C
ontr
ibut
ions
282,
929.
90
30
5,14
6.48
322,
198.
71
36
2,49
3.00
411,
041.
55
45
4,80
4.90
482,
508.
99
54
7,76
1.05
577,
841.
81
64
4,84
4.30
Tot
al B
usin
ess-
Typ
e A
ctiv
itie
s P
rogr
am R
even
ues
356,
296.
83
37
7,05
4.22
399,
320.
83
45
4,96
0.00
513,
558.
22
58
1,26
7.94
611,
750.
76
67
2,94
8.83
679,
541.
30
78
2,17
5.05
Tot
al D
istr
ict P
rogr
am R
even
ues
596,
340.
80$
60
2,81
0.52
$
658,
356.
67$
72
9,27
6.00
$
603,
904.
22$
74
3,37
3.08
$
656,
152.
90$
1,
286,
073.
03$
9,08
9,34
1.25
$
8,
646,
604.
18$
Net
(E
xpen
se)/
Rev
enue
:
Gov
ernm
enta
l Act
ivit
ies
(15,
201,
925.
18)
$
(15,
351,
343.
99)
$
(15,
979,
700.
74)
$
(16,
973,
504.
00)
$
(18,
295,
515.
61)
$
(20,
469,
769.
84)
$
(20,
538,
356.
48)
$
(19,
708,
761.
80)
$
(14,
704,
005.
03)
$
(15,
601,
330.
15)
$
Bus
ines
s-T
ype
Act
ivit
ies
11,8
72.2
9
13,3
77.2
8
36,2
28.8
5
12,2
39.0
0
46,2
34.9
4
66,0
97.5
2
36,1
33.6
9
(42,
825.
23)
(69,
423.
08)
(33,
879.
21)
Tot
al D
istr
ict-
wid
e N
et (
Exp
ense
)/R
even
ue(1
5,19
0,05
2.89
)$
(1
5,33
7,96
6.71
)$
(1
5,94
3,47
1.89
)$
(1
6,96
1,26
5.00
)$
(1
8,24
9,28
0.67
)$
(2
0,40
3,67
2.32
)$
(2
0,50
2,22
2.79
)$
(1
9,75
1,58
7.03
)$
(1
4,77
3,42
8.11
)$
(1
5,63
5,20
9.36
)$
Gen
eral
Rev
enue
s an
d O
ther
Cha
nges
in N
et A
sset
s:
Gov
ernm
enta
l Act
ivit
ies:
Pro
pert
y T
axes
Lev
ied
for
Gen
eral
Pur
pose
s, N
et10
,307
,884
.00
$
10,6
24,7
03.0
0$
11
,076
,997
.00
$
11,3
48,7
42.0
0$
11
,604
,290
.00
$
11,6
04,2
90.0
0$
12
,039
,451
.00
$
12,2
68,2
00.0
0$
12
,652
,188
.00
$
13,1
74,6
91.0
4$
Tax
es L
evie
d fo
r D
ebt S
ervi
ce63
2,04
5.00
617,
410.
00
60
3,89
1.00
606,
821.
00
60
4,98
4.00
523,
262.
00
57
8,28
0.00
577,
942.
00
54
6,69
5.00
544,
861.
00
Unr
estr
icte
d G
rant
s an
d C
ontr
ibut
ions
4,16
7,57
2.59
4,
456,
013.
68
4,64
1,03
4.85
4,
900,
158.
00
5,83
1,46
0.01
6,
943,
261.
79
7,86
4,19
1.59
7,
161,
823.
44
1,69
1,10
3.39
2,
296,
625.
80
Inve
stm
ent E
arni
ngs
26,4
44.1
7
58,4
75.7
6
131,
899.
25
12
5,69
3.00
31,1
24.1
0
5,92
1.35
2,
966.
95
3,32
8.23
11
8.72
-
Mis
cella
neou
s In
com
e13
,315
.73
(7
7,89
2.65
)
50
,566
.53
12
1,34
2.00
304,
978.
45
10
4,64
9.60
109,
988.
81
74
,202
.48
29
,739
.22
84
5,67
1.93
Spec
ial I
tem
- L
oss
on D
ispo
sal o
f A
sset
s-
-
-
-
-
-
-
-
(1
,656
.54)
-
Tra
nsfe
rs-
-
-
-
-
-
-
-
-
-
Tot
al G
over
nmen
tal A
ctiv
itie
s15
,147
,261
.49
15,6
78,7
09.7
9
16
,504
,388
.63
17,1
02,7
56.0
0
18
,376
,836
.56
19,1
81,3
84.7
4
20
,594
,878
.35
20,0
85,4
96.1
5
14
,918
,187
.79
16,8
61,8
49.7
7
Bus
ines
s-T
ype
Act
ivit
ies:
Inve
stm
ent E
arni
ngs
-
-
1,37
7.85
40
1.00
1,39
3.62
42
3.18
-
-
267.
29
29
5.88
Mis
cella
neou
s -
-
19
.20
-
-
-
222.
34
40
9.57
-
-
Tot
al B
usin
ess-
Typ
e A
ctiv
itie
s-
-
1,
397.
05
401.
00
1,
393.
62
423.
18
22
2.34
409.
57
26
7.29
295.
88
Tot
al D
istr
ict-
wid
e15
,147
,261
.49
$
15,6
78,7
09.7
9$
16
,505
,785
.68
$
17,1
03,1
57.0
0$
18
,378
,230
.18
$
19,1
81,8
07.9
2$
20
,595
,100
.69
$
20,0
85,9
05.7
2$
14
,918
,455
.08
$
16,8
62,1
45.6
5$
Cha
nges
in N
et P
osit
ion:
Gov
ernm
enta
l Act
ivit
ies
(54,
663.
69)
$
327,
365.
80$
52
4,68
7.89
$
129,
252.
00$
81
,320
.95
$
(1
,288
,385
.10)
$
56,5
21.8
7$
376,
734.
35$
21
4,18
2.76
$
1,26
0,51
9.62
$
Bus
ines
s-T
ype
Act
ivit
ies
11,8
72.2
9
13,3
77.2
8
37,6
25.9
0
12,6
40.0
0
47,6
28.5
6
66,5
20.7
0
36,3
56.0
3
(42,
415.
66)
(69,
155.
79)
(33,
583.
33)
Tot
al D
istr
ict
(42,
791.
40)
$
340,
743.
08$
56
2,31
3.79
$
141,
892.
00$
12
8,94
9.51
$
(1,2
21,8
64.4
0)$
92
,877
.90
$
33
4,31
8.69
$
145,
026.
97$
1,
226,
936.
29$
135

EX
HIB
IT J
-3
2005
2006
2007
2008
2009
2010
2011
2012
2013
2014
Gen
eral
Fun
d:
Res
erve
d48
0,29
5.61
$
1,
067,
668.
53$
1,
909,
075.
76$
1,
949,
747.
00$
1,
936,
013.
42$
56
1,40
5.23
$
-$
-
$
-$
-$
Unr
eser
ved
592,
044.
33
578,
066.
05
275,
334.
30
311,
795.
00
233,
720.
98
201,
808.
59
-
-
-
-
Res
tric
ted
-
-
-
-
-
-
43
3,03
9.84
467,
193.
05
51
6,91
7.38
70
0,60
3.42
Ass
igne
d-
-
-
-
-
-
448,
321.
06
35
6,64
8.58
722,
210.
79
751,
262.
80
Una
ssig
ned
-
-
-
-
-
-
-
175,
286.
65
12
6,16
9.20
78
,838
.77
Tot
al G
ener
al F
und
1,07
2,33
9.94
$
1,64
5,73
4.58
$
2,18
4,41
0.06
$
2,26
1,54
2.00
$
2,16
9,73
4.40
$
763,
213.
82$
88
1,36
0.90
$
999,
128.
28$
1,
365,
297.
37$
1,
530,
704.
99$
All
Oth
er G
over
nmen
tal F
unds
:
Res
erve
d26
,910
.59
$
16
,920
.00
$
16
,920
.00
$
-
$
-
$
-
$
-$
-
$
-$
-$
Unr
eser
ved,
Rep
orte
d In
:
Spe
cial
Rev
enue
Fun
d-
-
(2
0,72
0.23
)
(32,
435.
00)
(5
4,04
0.29
)
(174
,582
.69)
-
-
-
-
Cap
ital P
roje
cts
Fund
139,
093.
09
43,2
60.4
1
43,2
60.4
1
60,1
80.0
0
60,1
80.4
1
60,1
80.4
1
-
-
-
-
Deb
t Ser
vice
Fun
d16
,050
.10
30
,622
.35
14
,574
.58
18
,472
.00
37
,044
.60
(1
3,55
8.28
)
-
-
-
-
Res
tric
ted:
Cap
ital P
roje
cts
Fund
-
-
-
-
-
-
60
,180
.41
60
,180
.41
71
,771
.25
75
7,28
7.25
Deb
t Ser
vice
Fun
d-
-
-
-
-
-
(12,
375.
94)
682.
00
68
3.21
68
3.21
Una
ssig
ned:
Spe
cial
Rev
enue
Fun
d-
-
-
-
-
-
(278
,284
.64)
(266
,952
.87)
(407
,906
.70)
(264
,596
.07)
Tot
al A
ll O
ther
Gov
ernm
enta
l Fun
ds18
2,05
3.78
$
90
,802
.76
$
54
,034
.76
$
46
,217
.00
$
43
,184
.72
$
(1
27,9
60.5
6)$
(2
30,4
80.1
7)$
(2
06,0
90.4
6)$
(3
35,4
52.2
4)$
49
3,37
4.39
$
RE
D B
AN
K S
CH
OO
L D
IST
RIC
T
FU
ND
BA
LA
NC
ES
, GO
VE
RN
ME
NT
AL
FU
ND
S
LA
ST
TE
N F
ISC
AL
YE
AR
S
(MO
DIF
IED
AC
CR
UA
L B
AS
IS O
F A
CC
OU
NT
ING
)
(UN
AU
DIT
ED
)
June
30,
136

EX
HIB
IT J
-4
2005
2006
2007
2008
2009
2010
2011
2012
2013
2014
Tax
Lev
y10
,939
,929
.00
$
11,2
42,1
13.0
0$
11
,680
,888
.00
$
11,9
55,5
63.0
0$
12
,209
,274
.00
$
12,1
27,5
52.0
0$
12
,617
,731
.00
$
12,8
46,1
42.0
0$
13
,198
,883
.00
$
13,7
19,5
52.0
4$
T
uitio
n C
harg
es6,
000.
00
1,50
0.00
35
,880
.84
52,5
89.0
0
46
,735
.00
102,
314.
14
37,8
41.1
6
10
,227
.00
-
-
Inte
rest
Ear
ning
s19
,091
.96
58,4
75.7
6
13
1,89
9.25
12
5,69
3.00
31
,124
.10
5,92
1.35
3,
036.
92
3,32
8.23
11
8.72
-
M
isce
llane
ous
24,2
80.9
2
71
,192
.77
27,0
69.7
9
12
1,34
2.00
30
4,98
8.99
10
4,64
9.60
11
2,88
0.82
74
,202
.48
29,7
39.2
2
84
5,67
1.93
S
tate
Sou
rces
3,36
2,76
4.99
3,56
0,64
1.91
3,96
2,67
7.45
4,15
3,18
1.00
4,62
7,59
2.63
4,66
6,36
6.97
5,51
9,35
8.25
5,99
9,77
2.58
8,12
7,78
6.99
8,69
6,94
4.43
Fed
eral
Sou
rces
1,03
5,24
0.37
1,11
8,37
9.77
901,
512.
40
976,
525.
00
1,24
7,47
8.38
2,33
6,68
5.82
2,34
8,43
2.34
1,76
4,94
8.06
1,97
3,11
6.35
1,46
4,11
0.50
Tot
al R
even
ues
15,3
87,3
07.2
4
16
,052
,303
.21
16,7
39,9
27.7
3
17
,384
,893
.00
18,4
67,1
93.1
0
19
,343
,489
.88
20,6
39,2
80.4
9
20
,698
,620
.35
23,3
29,6
44.2
8
24
,726
,278
.90
Exp
endi
ture
s:In
stru
ctio
n:R
egul
ar4,
447,
222.
47
4,
461,
791.
20
4,
414,
668.
22
4,
505,
202.
00
5,
188,
677.
23
5,
875,
897.
58
5,
619,
464.
54
5,
275,
478.
23
6,
109,
655.
91
6,
180,
779.
17
S
peci
al38
5,70
7.65
34
6,36
1.59
52
3,90
1.83
82
4,13
2.00
86
7,69
0.31
1,
098,
535.
20
1,
029,
731.
37
93
4,18
6.81
96
3,46
4.73
86
1,55
5.25
O
ther
383,
820.
89
377,
317.
69
244,
328.
66
533,
964.
00
565,
852.
10
618,
453.
20
503,
489.
34
642,
630.
42
585,
767.
68
860,
302.
28
Sch
ool-
Spo
nsor
ed/O
ther
Ins
truc
tiona
l74
,757
.94
53,0
62.8
3
54
,399
.22
48,0
52.0
0
42
,252
.70
1,28
0.90
40
8.08
2,20
0.00
6,
919.
37
3,14
0.00
S
uppo
rt S
ervi
ces:
Tui
tion
487,
248.
82
511,
764.
69
459,
593.
13
436,
330.
00
416,
493.
28
562,
113.
35
428,
312.
88
506,
784.
88
459,
556.
13
624,
824.
22
Stu
dent
and
Ins
truc
tion
Rel
ated
Ser
vice
s2,
038,
386.
12
2,
063,
509.
25
2,
016,
910.
46
2,
180,
861.
00
2,
404,
022.
87
3,
833,
385.
74
4,
428,
764.
32
3,
970,
357.
20
5,
426,
878.
98
5,
075,
742.
33
G
ener
al A
dmin
istr
atio
n40
4,44
4.73
36
0,37
5.23
39
7,86
6.11
42
6,32
7.00
36
2,04
4.47
34
5,05
6.03
34
1,23
3.43
35
0,26
6.37
38
4,30
5.01
36
8,51
3.07
S
choo
l Adm
inis
trat
ive
Ser
vice
s32
2,47
4.96
34
3,67
7.93
34
6,61
6.61
36
3,52
1.00
38
7,11
9.54
40
7,15
7.57
39
3,09
1.71
39
1,87
4.40
43
4,10
1.56
46
4,14
0.33
C
entr
al S
ervi
ces
196,
554.
88
156,
339.
47
177,
019.
74
155,
548.
00
175,
850.
59
184,
220.
52
179,
206.
26
192,
147.
32
178,
755.
54
237,
581.
69
Adm
in. I
nfor
mat
ion
Tec
hnol
ogy
8,82
5.00
33
7.84
9,69
8.24
46
,060
.00
252,
284.
66
26,3
00.3
7
11
4,40
9.54
94
,173
.93
100,
025.
14
153,
070.
36
Pla
nt O
pera
tions
and
Mai
nten
ance
1,12
8,58
6.59
1,05
4,77
3.50
1,08
2,48
9.87
1,10
7,28
2.00
1,48
6,35
5.28
1,24
7,52
9.38
1,36
3,24
3.00
1,13
3,89
3.42
1,17
3,06
6.03
1,21
5,89
3.51
Pup
il T
rans
port
atio
n86
5,06
0.84
84
8,02
7.79
80
8,21
5.99
92
4,02
0.00
89
0,18
0.80
82
7,05
0.32
76
2,59
1.71
72
0,94
0.74
82
9,39
7.69
85
4,60
3.83
B
usin
ess
and
Oth
er S
uppo
rt S
ervi
ces:
Lea
se P
urch
ase
Inte
rest
Oth
erE
mpl
oyee
Ben
efits
2,43
1,05
6.69
2,58
7,59
0.96
3,27
1,71
2.40
3,30
4,82
6.00
2,73
4,35
7.87
3,11
0,71
8.15
3,05
6,29
4.12
3,77
9,29
9.37
4,01
7,16
1.10
4,17
1,90
6.79
Spe
cial
Sch
ools
2,65
0.01
44
,508
.63
42,9
81.0
0
56
,407
.00
41,0
08.7
8
53
,457
.57
7,00
0.00
65
,199
.68
115,
615.
23
119,
894.
90
Cha
rter
Sch
ools
1,50
3,83
9.30
1,56
8,74
7.00
1,71
0,14
7.00
1,74
7,01
6.00
1,84
0,64
7.00
1,79
9,07
1.00
1,69
0,50
4.00
1,70
9,73
3.00
1,64
0,71
8.00
1,64
3,36
7.00
Cap
ital O
utla
y53
,020
.67
189,
136.
24
57,5
33.0
0
53
,107
.00
320,
784.
51
357,
063.
98
128,
811.
06
222,
413.
43
120,
755.
08
351,
868.
92
Spe
cial
Rev
enue
Deb
t Ser
vice
:P
rinc
ipal
296,
222.
03
372,
905.
11
363,
759.
00
364,
647.
00
365,
586.
76
371,
541.
35
387,
569.
38
388,
650.
53
384,
814.
35
401,
036.
26
Inte
rest
and
Oth
er C
harg
es31
9,83
8.66
22
9,93
2.64
25
6,17
9.77
23
8,27
7.00
22
0,82
4.64
20
2,32
3.53
18
9,52
8.28
17
6,23
3.53
16
1,87
9.44
14
3,82
4.74
Tot
al E
xpen
ditu
res
15,3
49,7
18.2
5
15
,570
,159
.59
16,2
38,0
20.2
5
17
,315
,579
.00
18,5
62,0
33.3
9
20
,921
,155
.74
20,6
23,6
53.0
2
20
,556
,463
.26
23,0
92,8
36.9
7
23
,732
,044
.65
Exc
ess/
(Def
icie
ncy)
of
Rev
enue
sO
ver/
(Und
er)
Exp
endi
ture
s37
,588
.99
482,
143.
62
501,
907.
48
69,3
14.0
0
(9
4,84
0.29
)
(1
,577
,665
.86)
15,6
27.4
7
14
2,15
7.09
23
6,80
7.31
99
4,23
4.25
Oth
er F
inan
cing
Sou
rces
/(U
ses)
:**
***
*G
ener
al F
und
Con
trib
utio
n to
Pre
scho
ol
Edu
catio
n A
id-
-
-
-
-
-
-
-
-
-
T
rans
fers
In
-
27
,002
.35
-
-
-
-
-
-
-
-
Tra
nsfe
rs O
ut-
(27,
002.
35)
-
-
-
-
-
-
-
-
Tot
al O
ther
Fin
anci
ng S
ourc
es/(
Use
s)-
-
-
-
-
-
-
-
-
-
Net
Cha
nge
in F
und
Bal
ance
s37
,588
.99
$
482,
143.
62$
501,
907.
48$
69,3
14.0
0$
(9
4,84
0.29
)$
(1
,577
,665
.86)
$
15,6
27.4
7$
14
2,15
7.09
$
23
6,80
7.31
$
99
4,23
4.25
$
Deb
t Ser
vice
as
a P
erce
ntag
e of
Non
capi
tal E
xpen
ditu
res
4.03
%3.
92%
3.83
%3.
49%
3.21
%2.
79%
2.82
%2.
78%
2.38
%2.
33%
Sou
rce:
Dis
tric
t rec
ords
Not
e:
Non
capi
tal e
xpen
ditu
res
are
tota
l exp
endi
ture
s le
ss C
apita
l Out
lay.
Cen
tral
Ser
vice
and
Adm
inis
trat
ive
Info
rmat
ion
Tec
hnol
ogy
acco
unt c
lass
ific
atio
ns w
ere
adde
d be
ginn
ing
with
yea
r-en
d Ju
ne 3
0, 2
005.
Pri
or to
Jun
e 30
, 200
5, C
entr
al S
ervi
ce a
nd A
dmin
istr
ativ
e In
form
atio
n T
echn
olog
y w
ere
com
bine
d in
Oth
er S
uppo
rt S
ervi
ces
as B
usin
ess
and
Oth
er S
uppo
rt S
ervi
ces.
Spe
cial
Rev
enue
allo
catio
n no
t ava
ilabl
eD
ebt S
ervi
ce b
reak
dow
n no
t ava
ilabl
eO
ther
Fin
anci
ng S
ourc
es/(
Use
s) n
ot a
vaila
ble
***
Rev
enue
s:
RE
D B
AN
K S
CH
OO
L D
IST
RIC
TC
HA
NG
ES
IN
FU
ND
BA
LA
NC
ES
, GO
VE
RN
ME
NT
AL
FU
ND
SL
AS
T T
EN
FIS
CA
L Y
EA
RS
(MO
DIF
IED
AC
CR
UA
L B
AS
IS O
F A
CC
OU
NT
ING
)(U
NA
UD
ITE
D)
* **
137

EX
HIB
IT J
-5
Pri
or Y
ear
Inte
rest
Ear
ned
Acc
ount
sT
uiti
onon
Cap
ital
Fis
cal Y
ear
Inte
rest
on
Use
of
Pri
or Y
ear
Pay
able
Mis
cell
aneo
us -
Fro
mR
eser
veA
nnua
lE
ndin
g Ju
ne 3
0,In
vest
men
tsD
onat
ions
Fac
ilit
ies
Ref
unds
Can
cell
edO
ther
Tui
tion
Indi
vidu
als
Fun
dsT
otal
s
2005
19,0
91.9
6$
1,
750.
00$
-
$
3,84
9.52
$
684.
00$
7,
033.
99$
-$
6,
000.
00$
71
4.09
$
39
,123
.56
$
2006
47,3
36.1
6-
-
42
,260
.74
-
11
,057
.13
16,6
26.6
01,
500.
00-
118,
780.
63
2007
129,
640.
58-
-
16
,079
.16
1,76
2.00
169.
3635
,880
.84
-
2,25
8.67
185,
790.
61
2008
123,
666.
00-
9,74
4.00
16,4
40.0
0-
26,9
69.0
052
,589
.00
-
2,02
7.00
231,
435.
00
2009
30,5
32.8
4-
7,32
5.00
7,48
8.80
37,1
66.1
013
8,18
5.53
46,7
35.0
0-
59
1.26
268,
024.
53
2010
5,77
3.54
-
1,
946.
0016
,352
.40
-
7,
559.
7610
2,31
4.14
-
147.
8113
4,09
3.65
2011
2,89
2.01
-
7,
567.
50-
3,99
2.48
11,2
35.6
240
,803
.14
-
74.9
466
,565
.69
2012
3,22
6.27
-
21
,003
.00
-
-
40,4
05.9
910
,227
.00
-
101.
9674
,964
.22
2013
-
-
-
-
-
12
,202
.66
-
-
11
8.72
12,3
21.3
8
2014
7,13
0.97
-
64
1.50
1,97
4.00
-
93
,194
.55
-
-
12
0.09
103,
061.
11
Sou
rce:
Dis
tric
t rec
ords
RE
D B
AN
K S
CH
OO
L D
IST
RIC
TG
EN
ER
AL
FU
ND
- O
TH
ER
LO
CA
L R
EV
EN
UE
BY
SO
UR
CE
LA
ST
TE
N F
ISC
AL
YE
AR
S(M
OD
IFIE
D A
CC
RU
AL
BA
SIS
OF
AC
CO
UN
TIN
G)
(UN
AU
DIT
ED
)
138

EX
HIB
IT J
-6
Yea
r E
ndin
g
Dec
embe
r 31
,V
acan
t Lan
dR
esid
enti
alF
arm
Reg
.Q
farm
Com
mer
cial
Indu
stri
alA
part
men
t
2004
10,7
05,1
00$
59
5,66
5,00
0$
--
256,
157,
100
$
24
,464
,900
$
70,3
42,4
00$
2005
12,9
32,1
0059
5,63
8,80
0-
-25
6,37
9,90
023
,662
,400
71,1
81,8
00
2006
13,2
92,6
0060
2,33
1,30
0-
-26
0,83
9,60
022
,019
,300
70,3
57,5
00
2007
R20
,091
,700
1,34
6,96
6,10
0-
-65
9,39
3,50
054
,245
,000
147,
770,
000
2008
20,9
91,4
001,
353,
253,
700
--
685,
713,
600
54,2
93,5
0014
8,47
7,60
0
2009
27,0
96,4
001,
359,
504,
500
--
692,
196,
800
53,7
77,8
0014
5,83
5,60
0
2010
18,5
14,9
001,
369,
449,
500
--
676,
474,
300
52,0
48,7
0014
2,89
5,20
0
2011
19,7
43,7
001,
366,
109,
731
--
668,
896,
500
50,4
37,5
0014
3,14
8,40
0
2012
24,2
47,6
001,
355,
504,
971
--
663,
883,
700
49,8
73,8
0014
3,21
8,40
0
2013
27,4
56,5
001,
341,
471,
541
--
663,
668,
500
44,7
89,4
0014
2,41
2,00
0
Tot
al
Les
s:E
stim
ated
Act
ual
Dir
ect
Tot
al A
sses
sed
Tax
- E
xem
ptP
ubli
cN
et V
alua
tion
(Cou
nty
Sch
ool
Val
ueP
rope
rty
Uti
liti
esa
Tax
able
Equ
aliz
ed)
Val
ueT
ax R
ateb
2004
1,13
2,44
5,90
0$
175,
111,
400
$
6,
441,
734
$
963,
776,
234
$
1,32
9,99
3,99
4$
1.
135
2005
1,13
4,90
6,40
017
5,11
1,40
05,
309,
265
965,
104,
265
1,58
7,64
4,64
91.
165
2006
1,15
0,82
1,60
018
1,98
1,30
04,
333,
343
973,
173,
643
1,94
1,69
3,63
01.
200
2007
R2,
610,
186,
300
381,
720,
000
10,0
65,6
292,
238,
531,
929
2,20
6,28
8,32
20.
534
2008
2,64
4,11
3,80
038
1,38
4,00
08,
998,
871
2,27
1,72
8,67
12,
329,
032,
383
0.53
8
2009
2,65
1,65
9,80
037
3,24
8,70
09,
345,
276
2,28
7,75
6,37
62,
391,
494,
945
0.53
0
2010
2,63
3,66
2,80
037
4,28
0,20
09,
542,
164
2,26
8,92
4,76
42,
350,
735,
911
0.55
6
2011
2,62
2,77
2,33
137
4,43
6,50
010
,721
,303
2,25
9,05
7,13
42,
233,
687,
962
0.56
9
2012
2,61
0,84
9,77
137
4,12
1,30
010
,572
,944
2,24
7,30
1,41
52,
143,
209,
232
0.58
8
2013
2,59
8,05
8,44
137
8,26
0,50
08,
348,
145
2,22
8,14
6,08
62,
013,
589,
296
0.61
6
Sou
rce:
Mun
icip
al T
ax A
sses
sor
Not
e:R
eal p
rope
rty
is r
equi
red
to b
e as
sess
ed a
t som
e pe
rcen
tage
of
true
val
ue (
fair
or
mar
ket v
alue
) es
tabl
ishe
d by
eac
h C
ount
y B
oard
of
Tax
atio
n.
Rea
sses
smen
t (R
) oc
curs
whe
n th
e C
ount
y B
oard
of
Tax
atio
n re
ques
ts T
reas
ury
to o
rder
a r
eass
essm
ent.
aT
axab
le V
alue
of
Mac
hine
ry, I
mpl
emen
ts a
nd E
quip
men
t of
Tel
epho
ne, T
eleg
raph
and
Mes
seng
er S
yste
m C
ompa
nies
bT
ax r
ates
are
per
$10
0
(UN
AU
DIT
ED
)
LA
ST
TE
N F
ISC
AL
YE
AR
S
RE
D B
AN
K S
CH
OO
L D
IST
RIC
T
AS
SE
SS
ED
VA
LU
E A
ND
AC
TU
AL
VA
LU
E O
F T
AX
AB
LE
PR
OP
ER
TY
139

EX
HIB
IT J
-7
(Fro
m J
-6)
Tot
al
Gen
eral
Dir
ect
Reg
iona
lT
otal
Dir
ect a
nd
Yea
r E
ndin
gO
blig
atio
n D
ebt
Sch
ool T
axR
ed B
ank
Sch
ool
Mon
mou
thO
verl
appi
ng
Dec
embe
r 31
,B
asic
Rat
eaS
ervi
ceb
Rat
eB
orou
ghR
ate
Cou
nty
Tax
Rat
e
2004
1.07
40.
061
1.13
50.
749
0.70
40.
488
3.07
6
2005
1.10
50.
060
1.16
50.
792
0.74
50.
521
3.22
3
2006
1.14
00.
060
1.20
00.
836
0.83
40.
558
3.42
8
2007
0.50
60.
028
0.53
40.
384
0.37
10.
252
1.54
1
2008
0.51
10.
027
0.53
80.
445
0.36
50.
246
1.59
4
2009
0.50
40.
026
0.53
00.
462
0.36
70.
254
1.61
3
2010
0.53
20.
024
0.55
60.
484
0.37
40.
265
1.67
9
2011
0.54
30.
026
0.56
90.
509
0.37
70.
257
1.71
2
2012
0.56
20.
026
0.58
80.
523
0.38
50.
261
1.75
7
2013
0.59
00.
026
0.61
60.
555
0.38
40.
255
1.81
0
Sou
rce:
Mun
icip
al T
ax A
sses
sor
Not
e:N
.J.S
.A. 1
8A:7
F-5
d li
mit
s th
e am
ount
that
the
Dis
tric
t can
sub
mit
for
a g
ener
al f
und
tax
levy
. T
he le
vy, w
hen
adde
d to
oth
er c
ompo
nent
s of
the
Dis
tric
t's n
et b
udge
t, m
ay n
ot e
xcee
d th
e pr
ebud
get y
ear
net b
udge
t by
mor
e th
an th
e sp
endi
ng g
row
th li
mit
atio
n ca
lcul
ated
as
foll
ows:
the
pre
budg
et y
ear
net b
udge
t inc
reas
ed b
y
the
cost
of
livi
ng o
r 2.
5 pe
rcen
t, w
hich
ever
is g
reat
er, p
lus
any
spen
ding
gro
wth
adj
ustm
ents
.
aT
he D
istr
ict's
bas
ic ta
x ra
te is
cal
cula
ted
from
the
A4F
for
m w
hich
is s
ubm
itte
d w
ith
the
budg
et a
nd th
e N
et
Val
uati
on ta
xabl
e.
bR
ates
for
deb
t ser
vice
are
bas
ed o
n ea
ch y
ear's
req
uire
men
ts.
Red
Ban
k S
choo
l Dis
tric
t Dir
ect R
ate
Ove
rlap
ping
Rat
es
RE
D B
AN
K S
CH
OO
L D
IST
RIC
T
DIR
EC
T A
ND
OV
ER
LA
PP
ING
PR
OP
ER
TY
TA
X R
AT
ES
LA
ST
TE
N F
ISC
AL
YE
AR
S
(RA
TE
PE
R $
100
OF
AS
SE
SS
ED
VA
LU
E)
(UN
AU
DIT
ED
)
140
EX
HIB
IT J
-8
Tax
able
% o
f T
otal
Tax
able
% o
f T
otal
Ass
esse
dR
ank
Dis
tric
t Net
Ass
esse
dR
ank
Dis
tric
t Net
Val
ue(O
ptio
nal)
Ass
esse
d V
alue
Val
ue(O
ptio
nal)
Ass
esse
d V
alue
11
22
33
44
55
66
77
88
99
1010
Tot
al
Sou
rce:
Mun
icip
al T
ax A
sses
sor
DA
TA
NO
T A
VA
ILA
BL
E
RE
D B
AN
K S
CH
OO
L D
IST
RIC
T
PR
INC
IPA
L P
RO
PE
RT
Y T
AX
PA
YE
RS
CU
RR
EN
T Y
EA
R A
ND
NIN
E Y
EA
RS
AG
O
(UN
AU
DIT
ED
)
2014
2005
141

EXHIBIT J-9
Fiscal Year Collections in
Ended Taxes Levied for Percentage Subsequent
June 30, the Fiscal Year Amount of Levy Years
2005 10,939,929.00$ 10,939,929.00$ 100.00% -$
2006 11,242,113.00 11,242,113.00 100.00% -
2007 11,680,888.00 11,386,967.00 97.48% 293,921.00
2008 11,955,563.00 11,955,563.00 100.00% -
2009 12,209,274.00 12,209,274.00 100.00% -
2010 12,127,552.00 12,127,552.00 100.00% -
2011 12,617,731.00 12,617,731.00 100.00% -
2012 12,846,142.00 12,846,142.00 100.00% -
2013 13,198,883.00 13,198,883.00 100.00% -
2014 13,719,552.04 13,719,552.04 100.00% -
Source: District records including the Certificate and Report of School Taxes (A4F form)
a School taxes are collected by the Municipal Tax Collector. Under New Jersey
State Statute, a municipality is required to remit to the school district the entire
property tax balance, in the amount voted upon or certified prior to the end
of the school year.
of the Levya
RED BANK SCHOOL DISTRICT
PROPERTY TAX LEVIES AND COLLECTIONS
LAST TEN FISCAL YEARS
(UNAUDITED)
Collected Within the Fiscal Year
142

EX
HIB
IT J
-10
Bus
ines
s-T
ype
Act
ivit
ies
Gen
eral
N.J
.E.D
.A.
Per
cent
age
ofF
isca
l Yea
rO
blig
atio
nC
apit
alL
oans
Cap
ital
Tot
alP
erso
nal
Per
End
ing
June
30,
Bon
dsb
Lea
ses
Pay
able
Lea
ses
Dis
tric
tIn
com
eaC
apit
aa
2005
5,76
5,00
0.00
$
41,1
47.8
3$
33
0,50
9.59
$
-$
6,
136,
657.
42$
N
/A48
4.21
$
2006
5,55
5,00
0.00
28,1
75.5
029
7,60
4.48
-
5,
880,
779.
98N
/A46
6.94
2007
5,22
5,00
0.00
14,4
73.2
226
3,84
5.38
-
5,
503,
318.
60N
/A44
1.29
2008
4,89
5,00
0.00
-
229,
198.
00-
5,12
4,19
8.00
N/A
412.
77
2009
4,56
5,00
0.00
-
193,
611.
62-
4,75
8,61
1.62
0.70
%38
3.16
2010
4,23
0,00
0.00
-
157,
070.
58-
4,38
7,07
0.58
N/A
346.
27
2011
3,88
0,00
0.00
-
119,
501.
20-
3,99
9,50
1.20
0.60
%31
7.56
2012
3,53
0,00
0.00
-
80,8
50.6
7-
3,61
0,85
0.67
N/A
289.
65
2013
3,18
5,00
0.00
-
41,0
36.3
2-
3,22
6,03
6.32
N/A
N/A
2014
2,82
5,00
0.00
-
-
-
2,82
5,00
0.00
N/A
N/A
Not
e: D
etai
ls r
egar
ding
the
Dis
tric
t's o
utst
andi
ng d
ebt c
an b
e fo
und
in th
e N
otes
to th
e F
inan
cial
Sta
tem
ents
.
a S
ee E
xhib
it N
J J-
14 f
or p
erso
nal i
ncom
e an
d po
pula
tion
dat
a. T
hese
rat
ios
are
calc
ulat
ed u
sing
per
sona
l inc
ome
and
popu
lati
on f
or th
e pr
ior
cale
ndar
yea
r.b
Incl
udes
Ear
ly R
etir
emen
t Inc
enti
ve P
lan
("E
RIP
") r
efun
ding
and
Sta
te L
oans
N/A
A
t the
tim
e of
CA
FR
com
plet
ion,
this
dat
a w
as n
ot y
et a
vail
able
RE
D B
AN
K S
CH
OO
L D
IST
RIC
TR
AT
IOS
OF
OU
TS
TA
ND
ING
DE
BT
BY
TY
PE
LA
ST
TE
N F
ISC
AL
YE
AR
S(U
NA
UD
ITE
D)
Gov
ernm
enta
l Act
ivit
ies
143

EXHIBIT J-11
Net Percentage of
General General Actual Taxable
Fiscal Year Obligation Bonded Debt Valuea of Per
Ending June 30, Bonds Deductions Outstanding Property Capitab
2005 5,765,000.00$ -$ 5,765,000.00$ 0.60% 480.78$
2006 5,555,000.00 - 5,555,000.00 0.57% 464.58
2007 5,225,000.00 - 5,225,000.00 0.23% 440.07
2008 4,895,000.00 - 4,895,000.00 0.22% 412.77
2009 4,565,000.00 - 4,565,000.00 0.20% 383.16
2010 4,230,000.00 - 4,230,000.00 0.19% 346.27
2011 3,880,000.00 - 3,880,000.00 0.17% 317.56
2012 3,530,000.00 - 3,530,000.00 0.16% 289.65
2013 3,185,000.00 - 3,185,000.00 0.14% N/A
2014 2,825,000.00 - 2,825,000.00 N/A N/A
Note: Details regarding the District's outstanding debt can be found in the Notesto the Financial Statements.
a See Exhibit NJ J-6 for property tax data. b Population data can be found in Exhibit NJ J-14.
General Bonded Debt Outstanding
RED BANK SCHOOL DISTRICTRATIOS OF NET GENERAL BONDED DEBT OUTSTANDING
LAST TEN FISCAL YEARS(UNAUDITED)
144

EX
HIB
IT J
-12
Est
imat
edE
stim
ated
Sha
re o
fD
ebt
Per
cent
age
Ove
rlap
ping
Gov
ernm
enta
l Uni
tO
utst
andi
ngA
ppli
cabl
eaD
ebt
Deb
t Rep
aid
wit
h P
rope
rty
Tax
es:
Red
Ban
k B
orou
gh11
,116
,844
.50
$
100.
00%
11,1
16,8
45$
Red
Ban
k R
egio
nal H
igh
Sch
ool
4,78
0,00
0.00
44.1
5%2,
110,
370
Mon
mou
th C
ount
y G
ener
al O
blig
atio
n D
ebt
452,
960,
719.
951.
84%
8,33
0,80
7
Sub
tota
l, O
verl
appi
ng D
ebt
21,5
58,0
21
Red
Ban
k D
istr
ict D
irec
t Deb
t2,
825,
000
Tot
al D
irec
t and
Ove
rlap
ping
Deb
t24
,383
,021
$
Sou
rces
: A
sses
sed
valu
e da
ta u
sed
to e
stim
ate
appl
icab
le p
erce
ntag
es p
rovi
ded
by th
e M
onm
outh
Cou
nty
Boa
rd o
f T
axat
ion.
Deb
t Out
stan
ding
dat
a pr
ovid
ed b
y ea
ch g
over
nmen
tal u
nit.
Not
e:O
verl
appi
ng g
over
nmen
ts a
re th
ose
that
coi
ncid
e, a
t lea
st in
par
t, w
ith
the
geog
raph
ic b
ound
arie
s of
the
Dis
tric
t.T
his
sche
dule
est
imat
es th
e po
rtio
n of
the
outs
tand
ing
debt
of
thos
e ov
erla
ppin
g go
vern
men
ts th
at is
bor
ne b
y th
e re
side
nts
and
busi
ness
es o
f R
ed B
ank.
Thi
s pr
oces
s re
cogn
izes
that
, whe
n co
nsid
erin
g th
e D
istr
ict's
abi
lity
to is
sue
and
repa
y lo
ng-t
erm
deb
t, th
e en
tire
deb
t bur
den
born
e by
the
resi
dent
s an
d bu
sine
sses
sho
uld
be ta
ken
into
acc
ount
. H
owev
er,
this
doe
s no
t im
ply
that
eve
ry ta
xpay
er is
a r
esid
ent,
and
ther
efor
e re
spon
sibl
e fo
r re
payi
ng th
e de
bt, o
f ea
ch o
verl
appi
ng
paym
ent.
aF
or d
ebt r
epai
d w
ith
prop
erty
taxe
s, th
e pe
rcen
tage
of
over
lapp
ing
debt
app
lica
ble
is e
stim
ated
usi
ng ta
xabl
e as
sess
ed
prop
erty
val
ues.
App
lica
ble
perc
enta
ges
wer
e es
tim
ated
by
dete
rmin
ing
the
port
ion
of a
noth
er g
over
nmen
tal u
nit's
taxa
ble
valu
e th
at is
wit
hin
the
Dis
tric
t's b
ound
arie
s an
d di
vidi
ng it
by
each
uni
t's to
tal t
axab
le v
alue
.
RE
D B
AN
K S
CH
OO
L D
IST
RIC
TD
IRE
CT
AN
D O
VE
RL
AP
PIN
G G
OV
ER
NM
EN
TA
L A
CT
IVIT
IES
DE
BT
AS
OF
JU
NE
30,
201
4(U
NA
UD
ITE
D)
145

EX
HIB
IT J
-13
Leg
al D
ebt M
argi
n C
alcu
lati
on f
or F
isca
l Yea
r 20
14
Equ
aliz
ed V
alua
tion
Bas
is
2014
2,03
5,94
6,55
8$
20
132,
006,
366,
094
2012
2,01
3,37
4,22
5
(A)
6,05
5,68
6,87
7$
Ave
rage
Equ
aliz
ed V
alua
tion
of
Tax
able
Pro
pert
y(A
/3)
2,01
8,56
2,29
2$
Deb
t Lim
it (
3% o
f A
vera
ge E
qual
izat
ion
Val
ue)
(B)
181,
670,
606
Tot
al N
et D
ebt A
ppli
cabl
e T
o L
imit
(C)
2,82
5,00
0
Leg
al D
ebt M
argi
n(B
-C)
178,
845,
606
$
2005
2006
2007
2008
2009
Deb
t Lim
it47
,660
,793
$
56,0
76,8
96$
22
9,42
5,05
3$
19
4,31
0,43
0$
20
7,18
8,95
2$
Tot
al N
et D
ebt A
ppli
cabl
e T
o L
imit
6,09
5,51
05,
555,
000
5,22
5,00
04,
895,
000
4,56
5,00
0
Leg
al D
ebt M
argi
n41
,565
,283
$
50,5
21,8
96$
22
4,20
0,05
3$
18
9,41
5,43
0$
20
2,62
3,95
2$
Tot
al N
et D
ebt A
ppli
cabl
e to
the
Lim
itas
a P
erce
ntag
e of
Deb
t Lim
it12
.79%
9.91
%2.
28%
2.52
%2.
20%
2010
2011
2012
2013
2014
Deb
t Lim
it14
1,61
5,85
0$
20
9,27
7,59
5$
19
7,93
3,94
3$
18
7,60
2,84
8$
18
1,67
0,60
6$
Tot
al N
et D
ebt A
ppli
cabl
e T
o L
imit
4,23
0,00
03,
880,
000
3,53
0,00
03,
185,
000
2,82
5,00
0
Leg
al D
ebt M
argi
n13
7,38
5,85
0$
20
5,39
7,59
5$
19
4,40
3,94
3$
18
4,41
7,84
8$
17
8,84
5,60
6$
Tot
al N
et D
ebt A
ppli
cabl
e to
the
Lim
itas
a P
erce
ntag
e of
Deb
t Lim
it2.
99%
1.85
%1.
78%
1.70
%1.
56%
Sou
rce:
Equ
aliz
ed v
alua
tion
bas
es w
ere
obta
ined
fro
m th
e A
nnua
l Rep
ort o
f th
e S
tate
of
New
Jer
sey,
Dep
artm
ent o
f T
reas
ury,
Div
isio
n of
Tax
atio
n.
aL
imit
set
by
N.J
.S.A
. 18A
:24-
19 f
or a
K th
roug
h 8
Dis
tric
t; o
ther
per
cent
age
lim
its
wou
ld b
e ap
plic
able
for
oth
er D
istr
ict t
ypes
.
RE
D B
AN
K S
CH
OO
L D
IST
RIC
TL
EG
AL
DE
BT
MA
RG
IN I
NF
OR
MA
TIO
NL
AS
T T
EN
FIS
CA
L Y
EA
RS
(UN
AU
DIT
ED
)
Fis
cal Y
ear
146

EXHIBIT J-14
Per Capita Unemployment
Year Populationa Personal Incomeb Personal Incomec Rated
2005 11,991 N/A N/A 5.50%
2006 11,957 N/A N/A 5.40%
2007 11,873 N/A N/A 5.30%
2008 11,859 N/A N/A 5.10%
2009 11,914 652,899,114$ 54,801$ 6.50%
2010 12,216 N/A N/A 10.70%
2011 12,218 648,707,724 54,771 10.80%
2012 12,206 N/A N/A 11.30%
2013 12,206 N/A N/A N/A
2014 12,213 N/A N/A N/A
Source:a Population information provided by the NJ Department of Labor and Workforce Development.b Personal income has been estimated based upon the municipal population and per capita
personal income presented.c Per capita personal income by municipality estimated based upon the 2000 Census published
by the US Bureau of Economic Analysis.d Unemployment data provided by the NJ Department of Labor and Workforce Development.
RED BANK SCHOOL DISTRICTDEMOGRAPHIC AND ECONOMIC STATISTICS
LAST TEN FISCAL YEARS(UNAUDITED)
147

EX
HIB
IT J
-15
Per
cent
age
ofP
erce
ntag
e of
Tot
alT
otal
Ran
kM
unic
ipal
Ran
kM
unic
ipal
Em
ploy
erE
mpl
oyee
s(O
ptio
nal)
Em
ploy
men
tE
mpl
oyee
s(O
ptio
nal)
Em
ploy
men
t
11
22
33
44
55
66
77
88
99
1010
Tot
al
Sou
rce:
Bor
ough
of
Red
Ban
k, C
lerk
's O
ffic
e
DA
TA
NO
T A
VA
ILA
BL
E
RE
D B
AN
K S
CH
OO
L D
IST
RIC
T
PR
INC
IPA
L E
MP
LO
YE
RS
CU
RR
EN
T Y
EA
R A
ND
NIN
E Y
EA
RS
AG
O
(UN
AU
DIT
ED
)
2014
2005
148
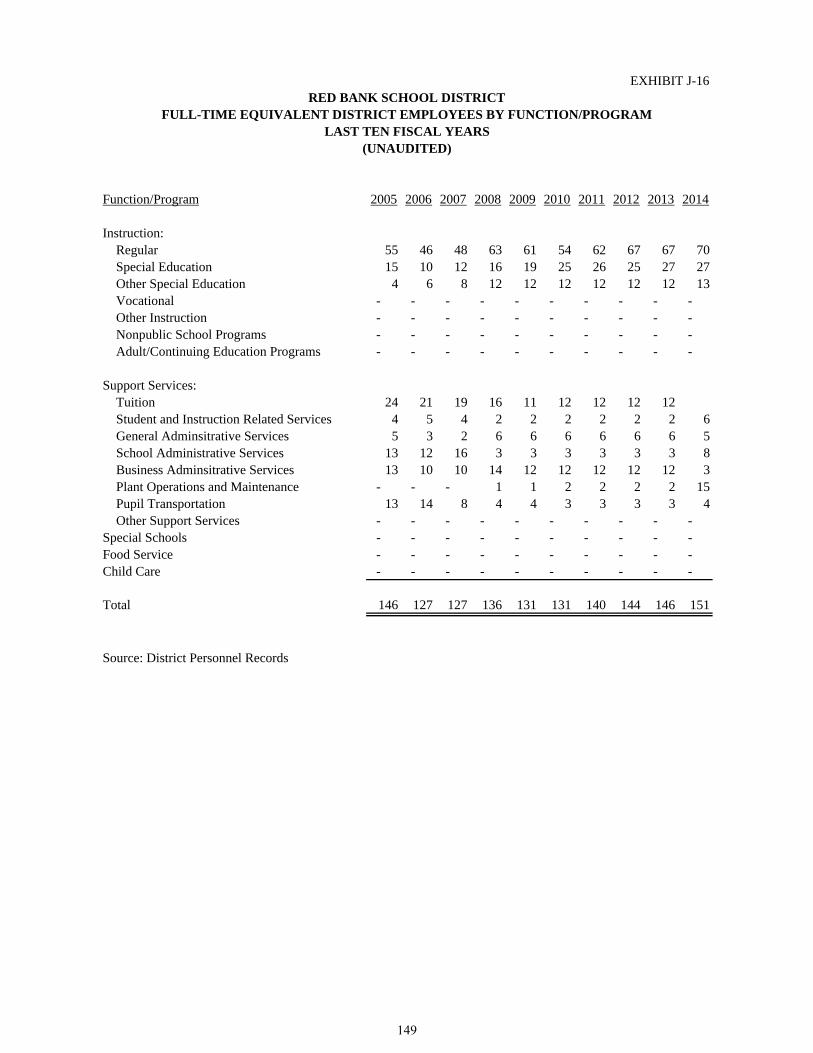
EXHIBIT J-16
2005 2006 2007 2008 2009 2010 2011 2012 2013 2014
Instruction:Regular 55 46 48 63 61 54 62 67 67 70Special Education 15 10 12 16 19 25 26 25 27 27Other Special Education 4 6 8 12 12 12 12 12 12 13Vocational - - - - - - - - - - Other Instruction - - - - - - - - - - Nonpublic School Programs - - - - - - - - - - Adult/Continuing Education Programs - - - - - - - - - -
Support Services:Tuition 24 21 19 16 11 12 12 12 12Student and Instruction Related Services 4 5 4 2 2 2 2 2 2 6General Adminsitrative Services 5 3 2 6 6 6 6 6 6 5School Administrative Services 13 12 16 3 3 3 3 3 3 8Business Adminsitrative Services 13 10 10 14 12 12 12 12 12 3Plant Operations and Maintenance - - - 1 1 2 2 2 2 15Pupil Transportation 13 14 8 4 4 3 3 3 3 4Other Support Services - - - - - - - - - -
Special Schools - - - - - - - - - - Food Service - - - - - - - - - - Child Care - - - - - - - - - -
Total 146 127 127 136 131 131 140 144 146 151
Source: District Personnel Records
Function/Program
RED BANK SCHOOL DISTRICTFULL-TIME EQUIVALENT DISTRICT EMPLOYEES BY FUNCTION/PROGRAM
(UNAUDITED)LAST TEN FISCAL YEARS
149

EX
HIB
IT J
-17
Ave
rage
Ave
rage
Per
cent
age
Dai
lyD
aily
Cha
nge
inS
tude
nt
Fis
cal
Ope
rati
ngC
ost P
erP
erce
ntag
eT
each
ing
Mid
dle
Enr
ollm
ent
Att
enda
nce
Ave
rage
Dai
lyA
tten
danc
e
Yea
rE
nrol
lmen
tE
xpen
ditu
resa
Pup
ilC
hang
eS
taff
bE
lem
enta
ryS
choo
l(A
DE
)c(A
DA
)dE
nrol
lmen
tP
erce
ntag
e
2005
793
14,6
90,1
28.7
2$
18
,525
$
-2.3
0%98
1:15
1:17
777.
176
24.
89%
98.0
6%
2006
760
14,8
19,1
15.8
019
,499
5.26
%98
1:15
1:17
744.
873
0-4
.16%
98.0
1%
2007
787
15,5
60,5
48.4
819
,772
1.40
%94
1:15
1:17
763.
572
82.
51%
95.3
0%
2008
886
14,8
92,3
38.0
016
,809
-14.
99%
941:
131:
1483
5.0
801
9.36
%95
.93%
2009
981
14,0
13,4
42.0
614
,285
-15.
01%
971:
150.
1689
5.1
859
7.20
%95
.97%
2010
995
14,7
85,5
9814
,860
4.03
%97
1:17
0.10
895.
285
80.
01%
95.8
4%
2011
995
13,7
37,5
1913
,807
-7.0
9%10
01:
171.
0997
7.8
943
9.23
%96
.44%
2012
1,05
514
,369
,509
13,6
20-1
.35%
100
1:18
1.1
1,03
0.0
985
5.34
%95
.63%
2013
1,32
022
,425
,388
.10
16,9
8924
.73%
102
1:20
1:19
1,12
1.1
1,07
48.
84%
95.8
0%
2014
1,36
822
,835
,314
.73
16,6
92-1
.74%
102
1:20
1:17
1,36
2.0
1,32
221
.49%
97.0
6%
Sou
rce:
Dis
tric
t rec
ords
Not
e:E
nrol
lmen
t bas
ed o
n an
nual
Oct
ober
Dis
tric
t cou
nt.
aO
pera
ting
exp
endi
ture
s eq
ual t
otal
exp
endi
ture
s le
ss d
ebt s
ervi
ce a
nd c
apit
al o
utla
y.
bT
each
ing
staf
f in
clud
es o
nly
full
-tim
e eq
uiva
lent
s of
cer
tifi
cate
d st
aff.
cA
vera
ge d
aily
enr
ollm
ent a
nd a
vera
ge d
aily
att
enda
nce
are
obta
ined
fro
m th
e S
choo
l Reg
iste
r S
umm
ary
(SR
S).
Pup
il/T
each
er R
atio
RE
D B
AN
K S
CH
OO
L D
IST
RIC
T
OP
ER
AT
ING
ST
AT
IST
ICS
LA
ST
TE
N F
ISC
AL
YE
AR
S
(UN
AU
DIT
ED
)
150

EXHIBIT J-18
2005 2006 2007 2008 2009 2010 2011 2012 2013 2014
Primary:Red Bank Primary
Square Feet 58,350 58,350 58,350 58,350 58,350 58,350 58,350 58,350 58,350 58,350Capacity (Students) 527 527 527 527 527 527 527 527 527 527Enrollment 486 450 480 513 510 513 576 596
Middle School:Red Bank Middle School
Square Feet 75,005 75,005 75,005 75,005 75,005 75,005 75,005 75,005 75,005 75,005Capacity (Students) 690 690 690 690 690 690 690 690 690 690Enrollment 307 310 382 373 385 389 463 497
Other:Administration Building
(1909) 3,650 3,650 3,650 3,650 3,650 3,650 3,650 3,650 3,650 3,650
Number of Schools at June 30, 2014Elementary = 1Middle School = 1
Source: District Facilities OfficeNote: Year of original construction is shown in parentheses. Increases in square footage and capacity
are the result of additions. Enrollment is based on the annual October District count.
District/Building
RED BANK SCHOOL DISTRICTSCHOOL BUILDING INFORMATION
LAST TEN FISCAL YEARS(UNAUDITED)
151

EXHIBIT J-19
UNDISTRIBUTED EXPENDITURES - REQUIREDMAINTENANCE FOR SCHOOL FACILITIES
11-000-261-xxx
*School Facilities Middle Primary OtherSchool School Facilities Total
Project # (s)
2005 N/A 113,637.59$ 123,255.00$ 9,192.00$ 246,084.59$ 2006 N/A 133,677.00 61,307.00 34,538.00 229,522.002007 N/A 104,856.12 85,870.00 21,000.00 211,726.122008 N/A 84,079.00 118,940.00 38,012.00 241,031.002009 N/A 328,480.52 182,819.67 16,379.45 527,679.642010 N/A 165,949.20 143,737.87 40,103.51 349,790.582011 N/A 123,175.70 132,369.08 36,463.72 292,008.502012 N/A 130,462.04 134,605.25 54,170.46 319,237.752013 N/A 113,069.87 143,589.77 50,053.36 306,713.002014 N/A 149,248.05 147,032.03 14,619.75 310,899.83
Total School Facilities 1,446,635.09$ 1,273,525.67$ 314,532.25$ 3,034,693.01$
* School facilities as defined under EFCFA.(N.J.A.C. 6A:26-1.2 and N.J.A.C. 6A:26-1.3)
Source: District records
RED BANK SCHOOL DISTRICTSCHEDULE OF REQUIRED MAINTENANCE
LAST TEN FISCAL YEARS(UNAUDITED)
152

Exhibit J-20
Company Type of Coverage Coverage Deductible
COMMERCIAL PACKAGE POLICYNew Jersey School Property Blanket Building & Contents 32,022,405$ 5,000$ Boards Association Blanket Extra Expense 50,000,000 5,000 Insurance Group Electronic Data Processing Equipment
and Software 435,000 1,000 Boiler & Machinery IncludedComprehensive General Liability Per Occurrence 6,000,000 General Aggregate 6,000,000 Employee Benefit Liabiltiy 6,000,000 1,000 Automotive Liability 6,000,000 Flood 500,000
Selective Insurance Flood Insurance 1,000,000 20,000
New Jersey School School Board Legal Liability 5,000,000 5,000 Boards AssociationInsurance Group
New Jersey School Worker's Compensation 2,000,000 Boards AssociationInsurance Group
AIG/New Jersey Excess Worker's Compensation 7-day waitingSchool Boards periodAssociation InsuranceGroup
Monumental Life/ Student Accident Insurance 500,000 Bollinger
Surety BondsSelective School Business Administrator/Board Secy. 100,000 Selective Treasurer of School Monies 275,000 New Jersey School Employee Dishonesty 500,000 1,000 Boards AssociationInsurance Group
RED BANK SCHOOL DISTRICTINSURANCE SCHEDULE
JUNE 30, 2014(UNAUDITED)
153

This page intentionally left blank
154

SINGLE AUDIT SECTION
155

This page intentionally left blank
156

EXHIBIT K-1
INDEPENDENT AUDITOR’S REPORT ON INTERNAL CONTROL OVER FINANCIAL
REPORTING AND ON COMPLIANCE AND OTHER MATTERS BASED ON AN AUDIT OF FINANCIAL STATEMENTS PERFORMED IN ACCORDANCE WITH
GOVERNMENT AUDITING STANDARDS
Honorable President and Members of the Board of Education Red Bank School District Red Bank, New Jersey We have audited, in accordance with the auditing standards generally accepted in the United States of America and the standards applicable to financial audits contained in Government Auditing Standards issued by the Comptroller General of the United States and audit requirements as prescribed by the Office of School Finance, Department of Education, State of New Jersey, the financial statements of the governmental and business-type activities, each major fund and the aggregate remaining fund information of the Red Bank School District, as of and for the year ended June 30, 2014 and the related notes to the financial statements, which collectively comprise the Red Bank School District’s basic financial statements, and have issued our report thereon dated October 16, 2014 Internal Control Over Financial Reporting In planning and performing our audit of the financial statements, we considered the Red Bank School District's internal control over financial reporting (internal control) to determine the audit procedures that are appropriate in the circumstances for the purpose of expressing our opinions on the financial statements, but not for the purpose of expressing an opinion on the effectiveness of the Red Bank School District’s internal control. Accordingly, we do not express an opinion on the effectiveness of the Red Bank School District’s internal control. A deficiency in internal control exists when the design or operation of a control does not allow management or employees, in the normal course of performing their assigned functions, to prevent, or detect and correct, misstatements on a timely basis. A material weakness is a deficiency, or a combination of deficiencies, in internal control, such that there is a reasonable possibility that a material misstatement of the District’s financial statements will not be prevented, or detected and corrected on a timely basis. A significant deficiency is a deficiency, or a combination of deficiencies, in internal control that is less severe than a material weakness, yet important enough to merit attention by those charged with governance.
157

Our consideration of internal control was for the limited purpose described in the first paragraph of this section and was not designed to identify all deficiencies in internal control that might be material weaknesses or significant deficiencies. Given these limitations, during our audit we did not identify any deficiencies in internal control that we consider to be material weaknesses. However, material weaknesses may exist that have not been identified. Compliance and Other Matters As part of obtaining reasonable assurance about whether the Red Bank School District's financial statements are free from material misstatement, we performed tests of its compliance with certain provisions of laws, regulations, contracts, and grant agreements, noncompliance with which could have a direct and material effect on the determination of financial statement amounts. However, providing an opinion on compliance with those provisions was not an objective of our audit, and accordingly, we do not express such an opinion. The results of our tests disclosed no instance of noncompliance or other matters that are required to be reported under Government Auditing Standards and audit requirements as prescribed by the Office of School Finance, Department of Education, State of New Jersey. Purpose of this Report The purpose of this report is solely to describe the scope of our testing of internal control and compliance and the results of that testing, and not to provide an opinion on the effectiveness of the District’s internal control or on compliance. This report is an integral part of an audit performed in accordance with Government Auditing Standards and audit requirements as prescribed by the Office of School Finance, Department of Education, State of New Jersey, and federal and state awarding agencies and pass-through entities, in considering the District’s internal control and compliance. Accordingly, this communication is not suitable for any other purpose.
Respectfully Submitted,
HOLMAN FRENIA ALLISON, P.C.
Robert W. Allison Certified Public Accountant Public School Accountant, No. 897
Freehold, New Jersey October 16, 2014
158
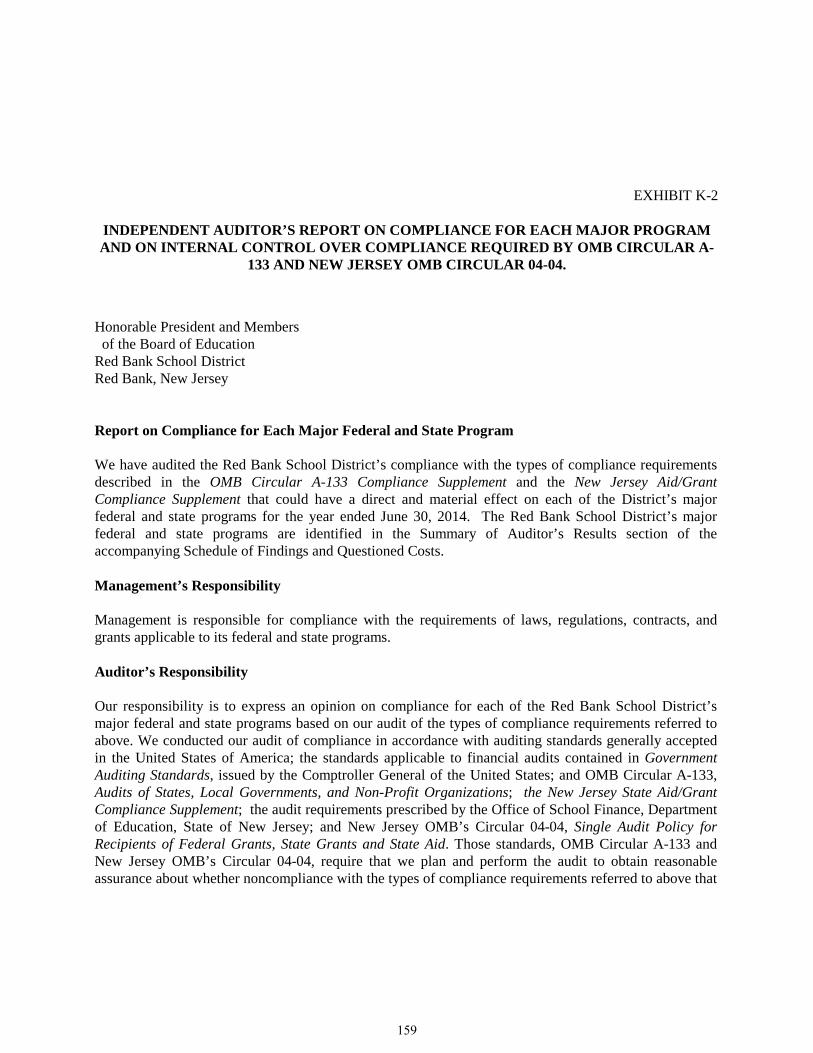
EXHIBIT K-2
INDEPENDENT AUDITOR’S REPORT ON COMPLIANCE FOR EACH MAJOR PROGRAM AND ON INTERNAL CONTROL OVER COMPLIANCE REQUIRED BY OMB CIRCULAR A-
133 AND NEW JERSEY OMB CIRCULAR 04-04.
Honorable President and Members of the Board of Education Red Bank School District Red Bank, New Jersey Report on Compliance for Each Major Federal and State Program We have audited the Red Bank School District’s compliance with the types of compliance requirements described in the OMB Circular A-133 Compliance Supplement and the New Jersey Aid/Grant Compliance Supplement that could have a direct and material effect on each of the District’s major federal and state programs for the year ended June 30, 2014. The Red Bank School District’s major federal and state programs are identified in the Summary of Auditor’s Results section of the accompanying Schedule of Findings and Questioned Costs. Management’s Responsibility Management is responsible for compliance with the requirements of laws, regulations, contracts, and grants applicable to its federal and state programs. Auditor’s Responsibility Our responsibility is to express an opinion on compliance for each of the Red Bank School District’s major federal and state programs based on our audit of the types of compliance requirements referred to above. We conducted our audit of compliance in accordance with auditing standards generally accepted in the United States of America; the standards applicable to financial audits contained in Government Auditing Standards, issued by the Comptroller General of the United States; and OMB Circular A-133, Audits of States, Local Governments, and Non-Profit Organizations; the New Jersey State Aid/Grant Compliance Supplement; the audit requirements prescribed by the Office of School Finance, Department of Education, State of New Jersey; and New Jersey OMB’s Circular 04-04, Single Audit Policy for Recipients of Federal Grants, State Grants and State Aid. Those standards, OMB Circular A-133 and New Jersey OMB’s Circular 04-04, require that we plan and perform the audit to obtain reasonable assurance about whether noncompliance with the types of compliance requirements referred to above that
159

could have a direct and material effect on a major federal or state program occurred. An audit includes examining, on a test basis, evidence about the Red Bank School District’s compliance with those requirements and performing such other procedures as we considered necessary in the circumstances. We believe that our audit provides a reasonable basis for our opinion on compliance for each major federal and state program. However, our audit does not provide a legal determination of the Red Bank School District’s compliance with those requirements. Opinion on Each Major Federal and State Program In our opinion, the Red Bank School District complied, in all material respects, with the types of compliance requirements referred to above that could have a direct and material effect on each of its major federal and state programs for the year ended June 30, 2014. Report on Internal Control Over Compliance Management of the Red Bank School District is responsible for establishing and maintaining effective internal control over compliance with the types of compliance requirements referred to above. In planning and performing our audit of compliance, we considered the Red Bank School District’s internal control over compliance with the types of requirements that could have a direct and material effect on each major federal or state program to determine the auditing procedures that are appropriate in the circumstances for the purpose of expressing an opinion on compliance for each major federal or state program and to test and report on internal control over compliance in accordance with OMB Circular A-133 and New Jersey OMB’s Circular 04-04, but not for the purpose of expressing an opinion on the effectiveness of internal control over compliance. Accordingly, we do not express an opinion on the effectiveness of the Red Bank School District’s internal control over compliance. A deficiency in internal control over compliance exists when the design or operation of a control over compliance does not allow management or employees, in the normal course of performing their assigned functions, to prevent, or detect and correct, noncompliance with a type of compliance requirement of a federal or state program on a timely basis. A material weakness in internal control over compliance is a deficiency, or combination of deficiencies, in internal control over compliance, such that there is a reasonable possibility that material noncompliance with a type of compliance requirement of a federal or state program will not be prevented, or detected and corrected, on a timely basis. A significant deficiency in internal control over compliance is a deficiency, or a combination of deficiencies, in internal control over compliance with a type of compliance requirement of a federal or state program that is less severe than a material weakness in internal control over compliance, yet important enough to merit attention by those charged with governance. Our consideration of internal control over compliance was for the limited purpose described in the first paragraph of this section and was not designed to identify all deficiencies in internal control over compliance that might be material weaknesses or significant deficiencies. We did not identify any deficiencies in internal control over compliance that we consider to be material weaknesses. However, material weaknesses may exist that have not been identified.
160

The purpose of this report on internal control over compliance is solely to describe the scope of our testing of internal control over compliance and the results of that testing based on the requirements of OMB Circular A-133 and New Jersey OMB’s Circular 04-04. Accordingly, this report is not suitable for any other purpose.
Respectfully Submitted,
HOLMAN FRENIA ALLISON, P.C.
Robert W. Allison Certified Public Accountant Public School Accountant, No. 897
Freehold, New Jersey October 16, 2014
161

EX
HIB
IT K
-3S
CH
ED
UL
E A
Fed
eral
Gra
nt o
rP
rogr
am o
rB
alan
ce a
tC
ance
lled
Fed
eral
Gra
ntor
/Pas
s-T
hrou
gh G
rant
or/
CF
DA
Sta
te P
roje
ctA
war
dG
rant
Per
iod
Jun
e 30
, C
ash
Bud
geta
ryE
ncum
bran
ces
(Acc
ount
sD
ue T
oP
rogr
am T
itle
Num
ber
Num
ber
Am
ount
Fro
mT
o20
13R
ecei
ved
Exp
endi
ture
s&
A/P
Adj
ustm
ents
Rec
eiva
ble)
Gra
ntor
Ent
erpr
ise
Fun
dU
.S. D
epar
tmen
t of
Agr
icul
ture
:P
asse
d-T
hrou
gh S
tate
Dep
artm
ent o
f E
duca
tion
:F
ood
Don
atio
n10
.565
N/A
15,7
66.3
6$
07
/01/
1306
/30/
14-
$
15
,766
.36
$
(1
5,76
6.36
)$
-$
-$
-
$
-
$
S
choo
l Bre
akfa
st P
rogr
am10
.553
N/A
110,
840.
3607
/01/
1306
/30/
14-
10
0,33
7.75
(1
10,8
40.3
6)
-
-
(1
0,50
2.61
)
-
S
choo
l Bre
akfa
st P
rogr
am10
.553
N/A
104,
533.
0607
/01/
1206
/30/
13(8
,309
.04)
8,
309.
04
-
-
-
-
-
N
atio
nal S
choo
l Lun
ch P
rogr
am10
.555
N/A
504,
462.
8307
/01/
1306
/30/
14-
45
7,69
1.29
(5
04,4
62.8
3)
-
-
(4
6,77
1.54
)
-
N
atio
nal S
choo
l Lun
ch P
rogr
am10
.555
N/A
425,
815.
6207
/01/
1206
/30/
13(3
5,35
1.31
)
35
,351
.31
-
-
-
-
C
hild
and
Adu
lt C
are
Foo
d P
rogr
am10
.558
N/A
3,52
8.80
07/0
1/13
06/3
0/14
-
3,21
5.20
(3,5
28.8
0)
-
-
(313
.60)
-
Chi
ld a
nd A
dult
Car
e F
ood
Pro
gram
10.5
58N
/A2,
886.
7807
/01/
1206
/30/
13(3
38.5
2)
33
8.52
-
-
-
-
-
Tot
al E
nter
pris
e F
und
(43,
998.
87)
621,
009.
47
(634
,598
.35)
-
-
(57,
587.
75)
-
Spe
cial
Rev
enue
Fun
dU
.S. D
epar
tmen
t of
Edu
cati
on:
Pas
sed-
Thr
ough
Sta
te D
epar
tmen
t of
Edu
cati
on:
Tit
le I
Par
t A84
.010
AN
CL
B43
6014
832,
183.
0009
/01/
1308
/31/
1459
0,85
3.00
(7
63,4
26.9
5)
-
-
(1
72,5
73.9
5)
-
T
itle
I P
art A
84.0
10A
NC
LB
4360
1371
2,87
7.00
09/0
1/12
08/3
1/13
(163
,333
.96)
180,
555.
00
(18,
308.
99)
1,
087.
95
-
-
-
Tit
le I
Par
t A84
.010
AN
CL
B43
6012
664,
223.
0009
/01/
1108
/31/
1213
2.57
-
-
-
(1
32.5
7)
-
-
T
itle
I P
art A
84.0
10A
NC
LB
4360
1169
1,32
5.00
09/0
1/10
08/3
1/11
27,0
29.9
7
-
-
-
(2
7,02
9.97
)
-
-
T
itle
I P
art A
84.0
10A
NC
LB
4360
1074
8,19
5.00
09/0
1/09
08/3
1/10
26,5
30.7
1
-
-
-
(2
6,53
0.71
)
-
-
T
itle
II
A, T
each
er T
rain
ing
& R
ecru
itin
g84
.367
AN
CL
B43
6014
69,9
87.0
009
/01/
1308
/31/
14-
32
,598
.00
(5
3,29
4.60
)
-
-
(2
0,69
6.60
)
-
T
itle
II
A, T
each
er T
rain
ing
& R
ecru
itin
g84
.367
AN
CL
B43
6013
82,9
15.0
009
/01/
1208
/31/
13(7
0,66
6.06
)
79
,478
.00
(8
,864
.73)
53.0
0
(0
.21)
-
-
T
itle
II
D, E
nhan
cing
Edu
cati
on -
Tec
hnol
ogy
84.3
18X
NC
LB
4360
113,
057.
0009
/01/
1008
/31/
112,
977.
00
-
-
-
(2
,977
.00)
-
-
T
itle
III
84.3
65A
NC
LB
4360
1487
,039
.00
09/0
1/13
08/3
1/14
-
63,8
60.0
0
(87,
039.
00)
-
-
(23,
179.
00)
-
Tit
le I
II84
.365
AN
CL
B43
6013
85,9
84.0
009
/01/
1208
/31/
13(3
6,64
1.00
)
36
,641
.00
-
-
-
-
-
T
itle
III
84.3
65A
NC
LB
4360
1289
,560
.00
09/0
1/11
08/3
1/12
(289
.00)
-
-
-
28
9.00
-
-
IDE
A 2
1st C
entu
ry G
rant
84.2
87C
N/A
34,4
82.0
009
/01/
1208
/31/
13(1
1,43
7.46
)
34
,482
.00
(2
3,04
4.54
)
-
-
-
-
21
st C
entu
ry G
rant
Com
mun
ity
Lea
rnin
g C
ente
rs
84.2
87C
N/A
495,
000.
0009
/01/
1208
/31/
13(2
50,5
44.1
5)
32
4,91
7.00
(7
6,89
7.73
)
-
2,52
4.88
-
-
ID
EA
21s
t Cen
tury
Gra
nt84
.287
CN
/A39
,840
.00
09/0
1/11
08/3
1/12
(22,
426.
00)
22,4
26.0
0
-
-
-
-
-
Exc
elle
nt E
duca
tors
for
NJ
84.3
67A
12-C
O01
-S01
11,5
20.0
010
/01/
1109
/30/
13(6
,237
.00)
-
-
-
-
(6
,237
.00)
-
R
ace
to th
e T
op84
.413
AN
/A54
,414
.00
07/0
1/12
11/3
0/15
-
14,0
93.0
0
(18,
469.
00)
4,
376.
00
-
-
-
Rut
gers
- F
orm
ativ
e A
sses
smen
t Gra
nt84
.367
AN
CL
B43
6014
116,
551.
0009
/01/
1308
/31/
14-
48
,713
.95
(7
6,54
4.46
)
-
-
(2
7,83
0.51
)
-
I.
D.E
.A. P
art B
Bas
ic R
egul
ar
84.0
27A
IDE
A43
6014
322,
374.
0009
/01/
1308
/31/
14-
24
3,51
1.00
(3
00,4
77.4
1)
-
-
(5
6,96
6.41
)
-
I.
D.E
.A. P
art B
Bas
ic R
egul
ar
84.0
27A
IDE
A43
6013
360,
879.
0009
/01/
1208
/31/
13(1
74,2
39.9
7)
17
4,24
0.00
(5
,085
.76)
-
-
(5
,085
.73)
-
I.
D.E
.A. P
art B
Bas
ic R
egul
ar
84.0
27A
IDE
A43
6012
320,
543.
0009
/01/
1108
/31/
12(1
,948
.93)
-
-
-
1,94
8.93
-
-
I.
D.E
.A. P
art B
Bas
ic R
egul
ar
84.0
27A
IDE
A43
6011
309,
891.
0009
/01/
1008
/31/
1132
,129
.48
-
-
-
(32,
129.
48)
-
-
I.D
.E.A
. Par
t B P
resc
hool
84.1
73ID
EA
4360
1312
,530
.00
09/0
1/13
08/3
1/14
-
9,97
7.00
(11,
641.
00)
-
-
(1,6
64.0
0)
-
Tot
al S
peci
al R
even
ue F
und
(648
,963
.80)
1,85
6,34
4.95
(1,4
43,0
94.1
7)
5,
516.
95
(8
4,03
7.13
)
(3
14,2
33.2
0)
-
Gen
eral
Fun
dU
.S. D
epar
tmen
t of
Edu
cati
on:
Med
ical
Ass
ista
nce
Pro
gram
93.7
78N
/A4,
389.
4907
/01/
1306
/30/
14-
4,
389.
49
(4
,389
.49)
-
-
-
-
Tot
al G
ener
al F
und
-
4,38
9.49
(4,3
89.4
9)
-
-
-
-
Tot
al F
eder
al A
war
ds(6
92,9
62.6
7)$
2,
481,
743.
91$
(2
,082
,082
.01)
$
5,51
6.95
$
(84,
037.
13)
$
(371
,820
.95)
$
-$
Bal
ance
at J
une
30, 2
014
RE
D B
AN
K S
CH
OO
L D
IST
RIC
TS
CH
ED
UL
E O
F E
XP
EN
DIT
UR
ES
OF
FE
DE
RA
L A
WA
RD
SF
or t
he
fisc
al y
ear
end
ed J
un
e 30
, 201
4
162

EX
HIB
IT K
-4
SC
HE
DU
LE
B
Adj
ustm
ents
/
Def
erre
dP
rior
Yea
rR
epay
men
t
Pro
gram
or
Rev
enue
s/C
ance
lled
of P
rior
Cum
ulat
ive
Gra
nt o
r S
tate
Aw
ard
Gra
nt P
erio
d(A
ccou
nts
Due
To
Cas
hB
udge
tary
Enc
umbr
ance
sY
ears
'(A
ccou
nts
Due
To
Bud
geta
ryT
otal
Sta
te G
rant
or/P
rogr
am T
itle
Pro
ject
Num
ber
Am
ount
Fro
mT
oR
ecei
vabl
e)G
rant
orR
ecei
ved
Exp
endi
ture
s&
A/P
Bal
ance
sR
ecei
vabl
e)G
rant
orR
ecei
vabl
eE
xpen
ditu
res
Gen
eral
Fun
d
Sta
te D
epar
tmen
t of
Edu
cati
on:
Equ
aliz
atio
n A
id14
-495
-034
-512
0-07
81,
399,
215.
00$
07
/01/
1306
/30/
14-
$
-$
1,39
9,21
5.00
$
(1,3
99,2
15.0
0)$
-
$
-$
-
$
-$
(136
,540
.82)
$
1,39
9,21
5.00
$
Tra
nspo
rtat
ion
Aid
14-4
95-0
34-5
120-
014
34,7
44.0
007
/01/
1306
/30/
14-
-
34,7
44.0
0
(34,
744.
00)
-
-
-
-
(3,4
40.1
2)
34,7
44.0
0
Spe
cial
Edu
cati
on A
id14
-495
-034
-512
0-08
966
5,74
9.00
07/0
1/13
06/3
0/14
-
-
66
5,74
9.00
(6
65,7
49.0
0)
-
-
-
-
(6
4,91
7.97
)
66
5,74
9.00
Sec
urit
y A
id14
-495
-034
-512
0-08
415
6,71
1.00
07/0
1/13
06/3
0/14
-
-
15
6,71
1.00
(1
56,7
11.0
0)
-
-
-
-
(1
5,51
6.47
)
15
6,71
1.00
Sup
plem
enta
l Enr
ollm
ent G
row
th A
id14
-495
-034
-512
0-09
437
3,91
2.00
07/0
1/13
06/3
0/14
-
-
37
3,91
2.00
(3
73,9
12.0
0)
-
-
-
-
(3
6,02
2.24
)
37
3,91
2.00
Und
er A
dequ
acy
Aid
14-4
95-0
34-5
120-
096
339,
219.
0007
/01/
1306
/30/
14-
-
339,
219.
00
(339
,219
.00)
-
-
-
-
(33,
364.
18)
339,
219.
00
Ext
raor
dina
ry S
peci
al E
duca
tion
Cos
ts A
id14
-100
-034
-512
0-47
311
9,89
5.00
07/0
1/13
06/3
0/14
-
-
(119
,895
.00)
-
-
(1
19,8
95.0
0)
-
-
119,
895.
00
Ext
raor
dina
ry S
peci
al E
duca
tion
Cos
ts A
id13
-100
-034
-512
0-47
362
,166
.00
07/0
1/12
06/3
0/13
(62,
166.
00)
-
-
-
-
-
(62,
166.
00)
-
-
-
Rei
mbu
rsem
ent o
f N
onpu
blic
Tra
nspo
rtat
ion
1410
3190
1,98
1.00
07/0
1/13
06/3
0/14
-
-
-
(1
,981
.00)
-
-
(1,9
81.0
0)
-
-
1,
981.
00
Rei
mbu
rsem
ent o
f N
onpu
blic
Tra
nspo
rtat
ion
1310
3190
1,75
2.80
07/0
1/12
06/3
0/13
(1,7
52.8
0)
-
-
-
-
-
(1,7
52.8
0)
-
-
-
O
n-B
ehal
f T
PA
F P
ensi
on S
yste
m C
ontr
ibut
ion
14-4
95-0
34-5
095-
006
266,
354.
0007
/01/
1306
/30/
14-
-
266,
354.
00
(266
,354
.00)
-
-
-
-
-
26
6,35
4.00
O
n-B
ehal
f T
PA
F P
ensi
on S
yste
m C
ontr
ibut
ion
--
P
ost R
etir
emen
t14
-495
-034
-509
5-00
143
6,72
1.00
07/0
1/13
06/3
0/14
-
-
43
6,72
1.00
(4
36,7
21.0
0)
-
-
-
-
-
436,
721.
00
Rei
mbu
rsed
TP
AF
Soc
ial S
ecur
ity
Con
trib
utio
ns14
-495
-034
-509
5-00
244
7,69
8.96
07/0
1/13
06/3
0/14
-
-
42
5,79
9.85
(4
47,6
98.9
6)
-
-
(21,
899.
11)
-
-
44
7,69
8.96
Rei
mbu
rsed
TP
AF
Soc
ial S
ecur
ity
Con
trib
utio
ns13
-495
-034
-509
5-00
248
5,54
9.88
07/0
1/12
06/3
0/13
(23,
556.
95)
-
23,5
56.9
5
-
-
-
-
-
-
-
Tot
al G
ener
al F
und
(87,
475.
75)
-
4,12
1,98
1.80
(4,2
42,1
99.9
6)
-
-
(2
07,6
93.9
1)
-
(2
89,8
01.8
0)
4,
242,
199.
96
Spe
cial
Rev
enue
Fun
d
Pre
scho
ol E
duca
tion
Aid
14-4
95-0
34-5
120-
025
4,27
9,70
2.00
07/0
1/13
06/3
0/14
-
-
3,
851,
731.
80
(4
,186
,612
.87)
70,2
85.0
0
-
(264
,596
.07)
-
(264
,596
.07)
4,18
6,61
2.87
Pre
scho
ol E
duca
tion
Aid
13-4
95-0
34-5
120-
025
4,07
9,05
7.00
07/0
1/12
06/3
0/13
63,3
48.3
9
-
-
(63,
348.
39)
-
-
-
-
-
63
,348
.39
CH
IPR
A O
utre
ach
76,0
00.0
06/
9/20
0612
/29/
2007
-
34
,794
.89
-
-
-
-
-
34
,794
.89
-
-
N.J
. Non
publ
ic A
id:
-
-
-
-
-
Tex
tboo
k14
-100
-034
-512
0-06
424
,902
.00
07/0
1/13
06/3
0/14
-
-
24
,902
.00
(2
4,89
0.74
)
-
-
-
11
.26
-
24
,890
.74
Nur
sing
14-1
00-0
34-5
120-
070
35,0
49.0
007
/01/
1306
/30/
14-
-
35,0
49.0
0
(33,
049.
30)
-
-
-
1,99
9.70
-
33
,049
.30
Tec
hnol
ogy
14-1
00-0
34-5
120-
373
9,08
0.00
07/0
1/13
06/3
0/14
-
-
9,
080.
00
(9
,040
.76)
-
-
-
39
.24
-
9,
040.
76
Tex
tboo
k13
-100
-034
-512
0-06
425
,522
.00
07/0
1/12
06/3
0/13
-
20
0.34
-
-
-
(200
.34)
-
-
-
-
Nur
sing
13-1
00-0
34-5
120-
070
35,4
23.0
007
/01/
1206
/30/
13-
186.
06
-
-
-
(1
86.0
6)
-
-
-
-
Tec
hnol
ogy
13-1
00-0
34-5
120-
373
9,41
9.00
07/0
1/12
06/3
0/13
-
3.
20
-
-
-
(3
.20)
-
-
-
-
Aux
ilia
ry S
ervi
ces
Aid
(C
hapt
er 1
92):
-
-
-
-
-
-
-
Com
pens
ator
y E
duca
tion
14
-100
-034
-512
0-06
771
,902
.00
07/0
1/13
06/3
0/14
-
-
71
,902
.00
(6
8,47
8.09
)
-
-
-
3,
423.
91
-
68,4
78.0
9
Hom
e In
stru
ctio
n14
-100
-034
-512
0-06
748
3.45
07/0
1/13
06/3
0/14
-
-
-
(4
83.4
5)
-
-
(483
.45)
-
-
48
3.45
Hom
e In
stru
ctio
n13
-100
-034
-512
0-06
74,
344.
2407
/01/
1206
/30/
13(4
,344
.24)
-
4,
344.
24
-
-
-
-
-
-
-
Han
dica
pped
Ser
vice
s A
id (
Cha
pter
193
):-
-
-
-
-
-
-
Exa
m a
nd C
lass
ific
atio
n14
-100
-034
-512
0-06
639
,341
.00
07/0
1/13
06/3
0/14
-
-
39
,341
.00
(3
9,02
1.81
)
-
-
-
31
9.19
-
39,0
21.8
1
Cor
rect
ive
Spe
ech
14
-100
-034
-512
0-06
633
,592
.00
07/0
1/13
06/3
0/14
-
-
33
,592
.00
(1
9,53
0.23
)
-
-
-
14
,061
.77
-
19
,530
.23
Sup
plem
enta
l Ins
truc
tion
14-1
00-0
34-5
120-
066
24,6
31.0
007
/01/
1306
/30/
14-
-
24,6
31.0
0
(24,
631.
00)
-
-
-
-
-
24
,631
.00
Exa
m a
nd C
lass
ific
atio
n13
-100
-034
-512
0-06
640
,774
.00
07/0
1/12
06/3
0/13
-
31
9.19
-
-
-
(319
.19)
-
-
-
-
Cor
rect
ive
Spe
ech
13
-100
-034
-512
0-06
632
,029
.00
07/0
1/12
06/3
0/13
-
4,
687.
17
-
-
-
(4,6
87.1
7)
-
-
-
-
Tot
al S
peci
al R
even
ue F
und
59,0
04.1
5
40,1
90.8
5
4,
094,
573.
04
(4
,469
,086
.64)
70,2
85.0
0
(5
,395
.96)
(2
65,0
79.5
2)
54
,649
.96
(264
,596
.07)
4,46
9,08
6.64
RE
D B
AN
K S
CH
OO
L D
IST
RIC
T
SC
HE
DU
LE
OF
EX
PE
ND
ITU
RE
S O
F S
TA
TE
FIN
AN
CIA
L A
SS
IST
AN
CE
For
th
e fi
scal
yea
r en
ded
Ju
ne
30, 2
014
Bal
ance
at J
une
30, 2
013
Bal
ance
at J
une
30, 2
014
Mem
o
163

EX
HIB
IT K
-4
SC
HE
DU
LE
B
Adj
ustm
ents
/
Def
erre
dP
rior
Yea
rR
epay
men
t
Pro
gram
or
Rev
enue
s/C
ance
lled
of P
rior
Cum
ulat
ive
Gra
nt o
r S
tate
Aw
ard
Gra
nt P
erio
d(A
ccou
nts
Due
To
Cas
hB
udge
tary
Enc
umbr
ance
sY
ears
'(A
ccou
nts
Due
To
Bud
geta
ryT
otal
Sta
te G
rant
or/P
rogr
am T
itle
Pro
ject
Num
ber
Am
ount
Fro
mT
oR
ecei
vabl
e)G
rant
orR
ecei
ved
Exp
endi
ture
s&
A/P
Bal
ance
sR
ecei
vabl
e)G
rant
orR
ecei
vabl
eE
xpen
ditu
res
RE
D B
AN
K S
CH
OO
L D
IST
RIC
T
SC
HE
DU
LE
OF
EX
PE
ND
ITU
RE
S O
F S
TA
TE
FIN
AN
CIA
L A
SS
IST
AN
CE
For
th
e fi
scal
yea
r en
ded
Ju
ne
30, 2
014
Bal
ance
at J
une
30, 2
013
Bal
ance
at J
une
30, 2
014
Mem
o
Cap
ital
Pro
ject
s F
und
NJ
Sch
ool D
evel
opm
ent A
utho
rity
:
SD
A G
rant
4360
-075
-14-
1001
485,
810.
0003
/31/
14-
-
-
(2
8,00
0.00
)
-
-
(28,
000.
00)
-
-
28
,000
.00
NJ
Eco
nom
ic D
evel
opm
ent A
utho
rity
:
ED
A G
rant
4360
-060
-01-
0219
-00
4,51
0,00
0.00
07/0
1/01
-(4
36,1
24.7
3)
43
6,12
4.73
-
-
-
-
-
-
-
-
-
Tot
al C
apit
al P
roje
cts
Fun
d(4
36,1
24.7
3)
-
43
6,12
4.73
(2
8,00
0.00
)
-
-
(28,
000.
00)
-
-
28
,000
.00
Ent
erpr
ise
Fun
d
Nat
iona
l Sch
ool L
unch
Pro
gram
(S
tate
Sha
re)
14-1
00-0
10-3
360-
023
10,2
45.9
507
/01/
1306
/30/
14-
8,77
5.28
(10,
245.
95)
-
(1,4
70.6
7)
-
10
,245
.95
Nat
iona
l Sch
ool L
unch
Pro
gram
(S
tate
Sha
re)
13-1
00-0
10-3
350-
023
9,15
8.18
07/0
1/12
06/3
0/13
(1,2
57.9
4)
1,25
7.94
-
-
-
-
-
-
Tot
al E
nter
pris
e F
und
(1,2
57.9
4)
-
10,0
33.2
2
(10,
245.
95)
-
-
(1
,470
.67)
-
-
10,2
45.9
5
Tot
al S
tate
Fin
anci
al A
ssis
tanc
e(4
65,8
54.2
7)$
40
,190
.85
$
8,66
2,71
2.79
$
(8,7
49,5
32.5
5)$
70
,285
.00
$
(5,3
95.9
6)$
(502
,244
.10)
$
54,6
49.9
6$
(5
54,3
97.8
7)$
8,
749,
532.
55$
Les
s: G
rant
s N
ot S
ubje
ct to
New
Jer
sey
OM
B C
ircu
lar
04-0
4:
On-
Beh
alf
TP
AF
Pen
sion
Sys
tem
Con
trib
utio
n14
-495
-034
-509
5-00
626
6,35
4.00
07/0
1/13
06/3
0/14
266,
354.
00$
On-
Beh
alf
TP
AF
Pen
sion
Sys
tem
Con
trib
utio
n -
Pos
t Ret
irem
ent
14-4
95-0
34-5
095-
001
436,
721.
0007
/01/
1306
/30/
1443
6,72
1.00
Tot
al S
tate
Fin
anci
al A
ssis
tanc
e su
bjec
t to
New
Jer
sey
OM
B C
ircu
lar
04-0
4(8
,046
,457
.55)
$
164

EXHIBIT K-5 (Page 1 of 2)
RED BANK SCHOOL DISTRICT
NOTES TO SCHEDULES OF FEDERAL AWARDS AND STATE FINANCIAL ASSISTANCE
June 30, 2014 Note 1. General The accompanying schedules of expenditures of federal awards and state financial assistance include federal and state award activity of the Red Bank School District. The Board of Education is defined in Note 1 to the Board’s basic financial statements. All federal and state awards received directly from federal and state agencies, as well as federal awards and state financial assistance passed through other government agencies is included on the schedule of expenditures of federal awards and state financial assistance. Note 2. Basis of Accounting The accompanying schedules of expenditures of awards and financial assistance are presented on the budgetary basis of accounting with the exception of programs recorded in the food service fund, which are presented using the accrual basis of accounting. The basis of accounting is described in Note 1 to the Board’s basic financial statements. Note 3. Relationship to Basic Financial Statements The basic financial statements present the General Fund and Special Revenue Fund on a GAAP basis. Budgetary comparison statements or schedules (“RSI”) are presented for the General Fund and Special Revenue Fund to demonstrate finance-related legal compliance in which certain revenue is permitted by law or grant agreement to be recognized in the audit year whereas, for GAAP reporting, revenue is not recognized until the subsequent year or when expenditures have been made. The General Fund is presented in the accompanying Schedules on the modified accrual basis, with the exception of the revenue recognition of the last state aid payment in the current budget year, which is mandated pursuant to P.L. 2003, c.97.(A3521). For GAAP purposes, that payment is not recognized until the subsequent budget year due to the State deferral and recording of the last state aid payment in the subsequent year. The Special Revenue Fund is presented in the accompanying Schedules on the grant accounting budgetary basis which recognizes encumbrances as expenditures and also recognizes the related revenues, whereas the GAAP basis does not. The Special Revenue Fund also recognizes the last state aid payment in the current budget year, consistent with N.J.S.A. 18A:22-4.2. The net adjustment to reconcile from the budgetary basis to the GAAP basis is $(69,931.50) for the General Fund and $(35,878.77) for the Special Revenue Fund. See the Notes to Required Supplementary Information (Exhibit C-3) for a reconciliation of the budgetary basis to the modified accrual basis of accounting for the General and Special Revenue Funds. Awards and financial assistance revenues are reported in the Board's basic financial statements on a GAAP basis as presented on the following page:
165
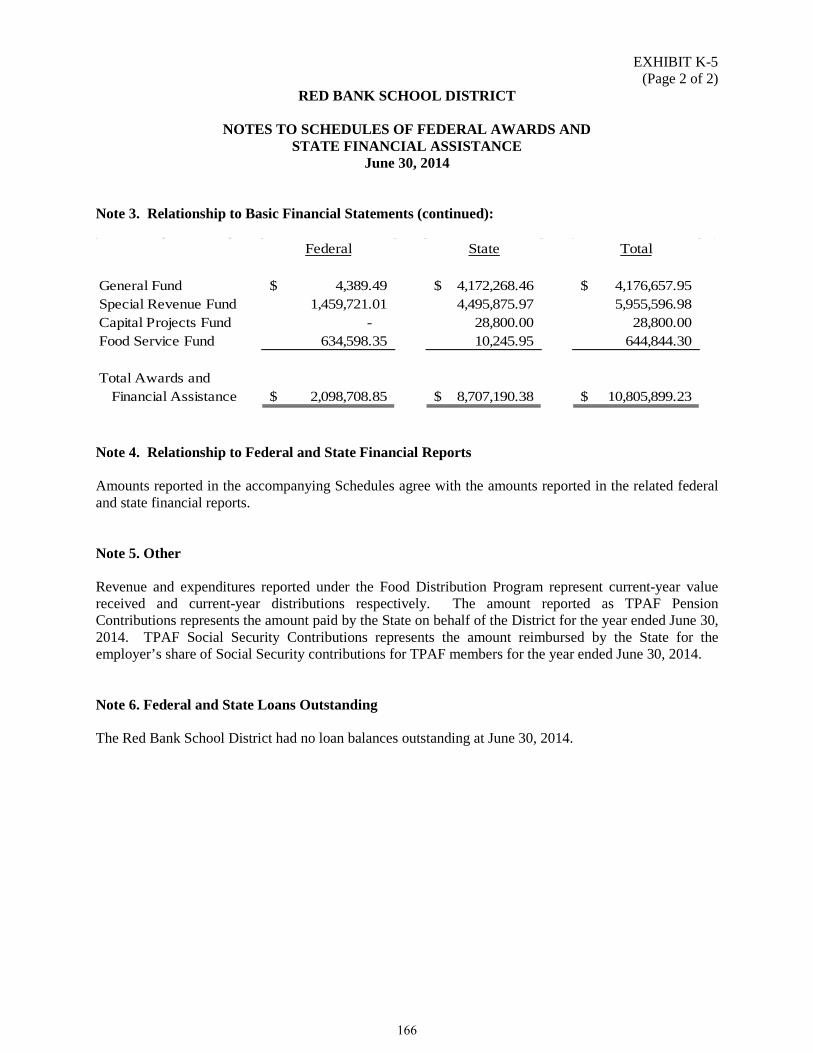
EXHIBIT K-5 (Page 2 of 2)
RED BANK SCHOOL DISTRICT
NOTES TO SCHEDULES OF FEDERAL AWARDS AND STATE FINANCIAL ASSISTANCE
June 30, 2014
Note 3. Relationship to Basic Financial Statements (continued):
Federal State Total
General Fund 4,389.49$ 4,172,268.46$ 4,176,657.95$ Special Revenue Fund 1,459,721.01 4,495,875.97 5,955,596.98 Capital Projects Fund - 28,800.00 28,800.00 Food Service Fund 634,598.35 10,245.95 644,844.30
Total Awards andFinancial Assistance 2,098,708.85$ 8,707,190.38$ 10,805,899.23$
Note 4. Relationship to Federal and State Financial Reports Amounts reported in the accompanying Schedules agree with the amounts reported in the related federal and state financial reports. Note 5. Other Revenue and expenditures reported under the Food Distribution Program represent current-year value received and current-year distributions respectively. The amount reported as TPAF Pension Contributions represents the amount paid by the State on behalf of the District for the year ended June 30, 2014. TPAF Social Security Contributions represents the amount reimbursed by the State for the employer’s share of Social Security contributions for TPAF members for the year ended June 30, 2014. Note 6. Federal and State Loans Outstanding The Red Bank School District had no loan balances outstanding at June 30, 2014.
166
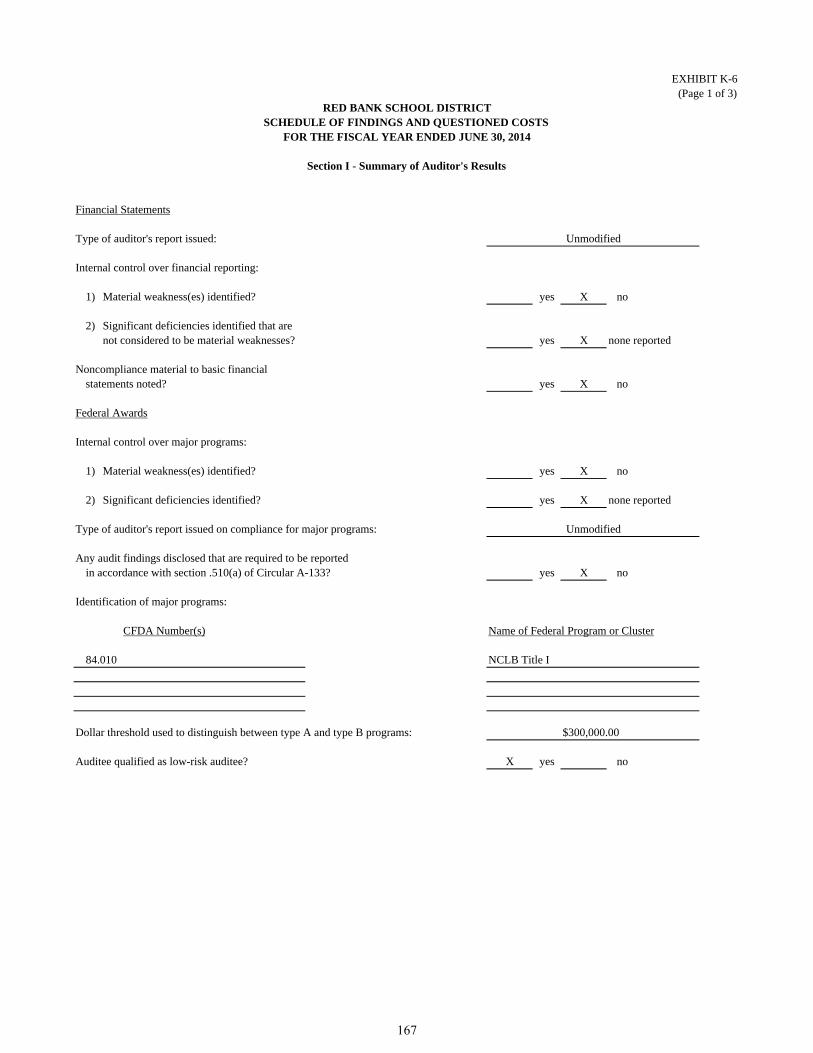
EXHIBIT K-6(Page 1 of 3)
Financial Statements
Type of auditor's report issued:
Internal control over financial reporting:
1) Material weakness(es) identified? yes X no
2) Significant deficiencies identified that arenot considered to be material weaknesses? yes X none reported
Noncompliance material to basic financial statements noted? yes X no
Federal Awards
Internal control over major programs:
1) Material weakness(es) identified? yes X no
2) Significant deficiencies identified? yes X none reported
Type of auditor's report issued on compliance for major programs:
Any audit findings disclosed that are required to be reportedin accordance with section .510(a) of Circular A-133? yes X no
Identification of major programs:
CFDA Number(s) Name of Federal Program or Cluster
84.010 NCLB Title I
Dollar threshold used to distinguish between type A and type B programs:
Auditee qualified as low-risk auditee? X yes no
$300,000.00
RED BANK SCHOOL DISTRICTSCHEDULE OF FINDINGS AND QUESTIONED COSTS
FOR THE FISCAL YEAR ENDED JUNE 30, 2014
Section I - Summary of Auditor's Results
Unmodified
Unmodified
167

EXHIBIT K-6(Page 2 of 3)
State Awards
Dollar threshold used to distinguish between type A and type B programs?
Auditee qualified as low-risk auditee? X yes no
Type of auditor's report issued in compliance for major programs:
Internal Control over major programs:
1) Material weakness(es) identified? yes X no
2) Significant deficiencies identified? yes X none reported
Any audit findings disclosed that are required to be reportedin accordance with NJOMB Circular 04-04? yes X no
Identification of major programs:
State Grant/Project Number(s) Name of State Program
State Aid Cluster:495-034-5120-078 Equalization Aid495-034-5120-089 Special Education Aid495-034-5120-084 Security Aid495-034-5120-094 Supplemental Enrollment Growth Aid495-034-5120-096 Under Adequacy Aid
Unmodified
RED BANK SCHOOL DISTRICTSCHEDULE OF FINDINGS AND QUESTIONED COSTS
FOR THE FISCAL YEAR ENDED JUNE 30, 2014
Section I - Summary of Auditor's Results (continued)
$300,000.00
168

EXHIBIT K-6 (Page 3 of 3)
RED BANK SCHOOL DISTRICT SCHEDULE OF FINDINGS & QUESTIONED COSTS
For the Fiscal Year Ended June 30, 2014
Section II – Financial Statement Findings This section identifies the significant deficiencies, material weaknesses, fraud, illegal acts, violations of provisions of contracts and grant agreements and abuse related to the financial statements for which Government Auditing Standards requires reporting in a Circular A-133 audit & New Jersey OMB’s Circular Letter 04-04 audit.
None Noted
Section III – Federal Awards and State Financial Assistance & Questioned Costs This section identifies audit findings required to be reported by section .510(a) of Circular A-133 and NJOMB Circular 04-04.
None Noted
169

EXHIBIT K-7 RED BANK SCHOOL DISTRICT
SUMMARY SCHEDULE OF PRIOR AUDIT FINDINGS AND QUESTIONED COSTS AS PREPARED BY MANAGEMENT
For the Fiscal Year Ended June 30, 2014 This section identifies the status of prior-year findings related to the basic financial statements and federal and state awards that are required to be reported in accordance with Chapter 6.12 of Government Auditing Standards, OMB Circular A-133 and New Jersey OMB Circular 04-04.
No Prior Year Findings
170