recycled paper research at the library of congress paper research at the library of congress...
TRANSCRIPT
Recycled Paper Research
at the
Library of Congress
Preservation Research and Testing Division
September 2014

2
Table of Contents
Executive Summary pg. 3
I. Introduction pg. 4
The Role of the LC in the Production and Retention of Federal Records pg. 4
Paper: The Standard Medium for Recordkeeping pg. 5
Research Objective pg. 6
II. Defining Permanence pg. 8
III. Accelerated Aging and Permanence pg. 10
IV. Recycling Process Literature pg. 12
V. Characterizing Paper Degradation through Physical and Optical Testing pg. 15
Physical Testing pg. 15
Optical Testing pg. 17
VI. Experimental pg. 19
Materials pg. 19
Physical Testing pg. 20
Optical Testing pg. 21
VII. Results and Discussion pg. 25
Physical Testing pg. 25
Optical Testing pg. 28
Chemical Testing pg. 31
Statistical Correlation pg. 32
Paper Morphology and Elemental Analysis (ESEM-EDS) pg. 34
VIII. Conclusions pg. 48
IX. Recommendations pg. 49
X. Bibliography pg. 50
3
Executive Summary
The aim of this research is to determine if copy papers composed of recycled
paper fibers can be considered permanent
Permanence is defined in terms of chemical stability and physical strength, per
national and international standards
A literature review of previously published research on recycled paper processes
is included as background
Physical, optical, and chemical analyses are performed to determine the relative
rates of degradation of experimental papers
Results indicate that papers consisting of 30% and 50% recycled fiber performed
mechanically similar to a general use copy paper that was not specified as to how
much, if any, recycled fiber content was included in its furnish
A paper consisting of 100% recycled paper performed significantly worse in all
testing than the other copy papers
Color change observed in the copy papers is not shown to be indicative of loss of
strength, contrary to previous research
pH values indicate high levels of alkaline reserve in all experimental copy papers;
the high pH values are due to the addition of calcium carbonate as a filler material
All experimental copy papers in this report showed significant loss of strength as
a function of accelerated aging; however, based on the definitions of permanence
outlined in this study, all of the copy papers can be considered permanent
Recommendations for further exploration include:
o Test papers from additional manufacturers
o Examine the role of optical brighteners in the color change of papers
o Additional chemical analyses such as the determination of molecular
weight and the degree of polymerization of the recycled fibers

4
This report outlines and presents results obtained from research conducted in the
laboratories of the Preservation Research and Testing Division (PRTD) at the Library of
Congress (LC). The research is concerned with the permanence of copy papers made
from postconsumer recycled fibers. The focus of this research is to gauge the relative
stability of the recycled papers through physical, chemical, and optical testing. The
subjects of this report are the type of copy papers or business printer papers used to
document the day to day operations at LC and other federal agencies. For the sake of
consistency the test papers will be referred to as copy papers in this report.
I. Introduction
The Library's mission is to support the Congress in fulfilling its constitutional
duties and to further the progress of knowledge and creativity for the benefit of
the American people.1
The mission of the Preservation Directorate at the Library of Congress is to
assure long-term, uninterrupted access to the intellectual content of the Library's
collections, either in original or reformatted form. This mission is accomplished
directly through the provision of conservation, binding and repair, reformatting,
materials testing, and staff and user education; and indirectly through
coordinating and overseeing all Library-wide activities relating to the
preservation and physical protection of Library material.2
Whenever possible, publications and other material of lasting value shall be
reproduced on permanent/durable paper. Material is considered to be of lasting
value if it is intended to be retained as a permanent record, or as part of the
collections of the Library or other institutions. Other materials which are likely to
be retained for 50 or more years also shall be reproduced on permanent/durable
paper. The originating office shall recommend the use of permanent/durable
paper on Form 28, Publication Proposal, when publication is proposed.3
The Role of the LC in the Production and Retention of Federal Records
LC is one of many federal libraries, archives, and museums that are responsible for
retaining our nation’s cultural heritage and official records for posterity. The array of
formats available for record keeping will provide many opportunities for the future
researcher to access our collective history. However, numerous challenges confront LC
and its fellow cultural institutions, especially as media evolve and technological
obsolescence render formats unreadable.
LC is unique in that it functions dually in the roles of producer and repository of federal
records, maintaining its own Records Management Section as part of its Office of
1 http://www.loc.gov
2 http://www.loc.gov/preservation/about/mission.html
3 Library of Congress Regulation (LCR) 1316, Section 2: Policy and Procedure
5
Support Operations. Records Management staff identify LC generated documents that are
designated for retirement (storage) or for final disposition. LC’s Printing Officer explains:
All federal records have a specific, corresponding lifecycle according to
whichever records series they fall under in the Library of Congress records
schedule (LRS). The LRS prescribes retention and disposition dates depending on
the type of record. Because NARA [National Archives and Records
Administration] charges us to process and store federal records created by the
Library—and because we are required to transfer most permanent Library
records to them after a specific time period—we generally keep any temporary
records in Library custody until their destruction date arrives. With the exception
of personnel medical files, most records that are transferred to NARA are
intended to be kept in perpetuity. Once transferred to NARA’s custody, they may
be recalled with a records request but they are owned and maintained
permanently by NARA at that point.4
Institutional records that are categorized for permanent storage are eventually transferred
to NARA for custody; however LC serves as the permanent storage location for other
documentation of national importance. For example, the Manuscript Division at LC
serves as a repository for portions of the accumulated office records and paperwork of
former members of Congress. LC’s Head of Reference and Reader Services in the
Manuscript Division, notes:
Although the Manuscript Division at LC serves as the repository for the personal
papers of many former members of Congress (a 1980 published checklist lists
almost 900 references), most of these collections date from the 19th
and early 20th
centuries. In recent years, the increasingly large volume of contemporary
congressional collections precludes the Library from collecting comprehensively
in this area.5
Paper: The Standard Medium for Recordkeeping
Emerging technologies continuously replace and render obsolete previous modes of data
management. However, the ancient standard medium for recordkeeping, paper, can
remain usable hundreds of years after its production. In a world of ubiquitous electronic
media, the need for paper has been reduced but not eliminated. At the time of the writing
of this report (2014), LC divisional offices on Capitol Hill use approximately 50 cartons
of copy paper per month.6
4 Email correspondence June 18, 2014. For more information on LC Records Management visit:
http://staff.loc/sites/iss/records-management-unit/ 5 Email correspondence June 18, 2014. For more information on LC’s Manuscript Division visit:
http://www.loc.gov/rr/mss/ 6 Conversation with Head of LC Printing and Duplication Services, May 22, 2014. Visit:
http://staff.loc.gov/sites/iss/about-iss/printing-and-grapics-services/printing-management/

6
Preservation efforts have aided institutions in their mission to successfully manage the
long-term custody of paper. Environmentally controlled storage, deacidification, and the
creation of standards for permanence of paper, are a few of the critical developments that
ensure paper records will remain usable generations after they are written.
Challenges to the longevity of records because of 19th
and 20th
century paper
manufacturing techniques compelled lawmakers to address the issues of paper quality
and stability. In 1990, a joint resolution of the U.S. Congress to encourage the use of
“acid free permanent papers” was signed into law by President G.H.W. Bush. Public Law
101-423, A Joint Resolution to Establish a National Policy on Permanent Papers
(Section 3) mandated the following:
The Librarian of Congress, the Archivist of the Unites States, and the Public
Printer [Government Printing Office] shall jointly monitor the Federal
Government’s progress in implementing the national policy […] regarding acid
free permanent papers and shall report to Congress regarding such progress on
December 31, 1991, December 31, 1993, and December 31, 1995.7
Commensurate with the issues of paper permanence winning lawmaker attention, public
awareness of environmental challenges increased; concerns such as landfill scarcity,
climate change, and natural resource depletion found their way into public policy. An
early example of such a law is the 1993 issuance of Executive Order 12873, Federal
Acquisition, Recycling, and Waste Prevention. The mandate required that all federal
agencies (LC, NARA, and the Government Printing Office (GPO) included) gradually
implement the purchase and use of printing and writing papers that include at least 30%
postconsumer recycled material. More recently, Executive Order 12873 was superseded
by Executive Order 13514, signed by President Barack Obama in 2009, which
“promote[s] pollution prevention and eliminate[s] waste by […] reducing printing paper
use and acquiring uncoated printing and writing paper containing at least 30%
postconsumer fiber.”8 The new mandate effectively left agency responsibility unchanged
but it reinforced the use of recycled paper a critical component in government efforts for
better environmental management.
Research Objective
The dichotomy of these two concerns-- paper permanence and the required inclusion of
recycled content-- led to the need for this research. It was undertaken to better understand
the impact of recycled content on permanence and the longevity of federal records. The
goal was to assess whether recycled paper records can be considered truly “permanent”
and meet required specifications for permanence. Additionally, this report includes
reviews of federal standards for paper permanence, the technical challenges that recycling
processes introduce to the paper matrix, and an overview of historical and recent research
studies about recycled paper composition and strength.
7 Public Law 101-423 can be viewed at:
http://www.gpo.gov/fdsys/pkg/STATUTE-104/pdf/STATUTE-104-Pg912.pdf 8 Federal Leadership in Environmental, Energy and Economic Performance—Executive Order 13514

7
The ultimate aim of the research was to determine whether papers comprised of recycled
paper fiber can fulfill requirements of permanence, given the mandate to include 30%
recycled component for all government agencies.
8
II. Defining Permanence
Before Public Law 101-423, various commercial definitions of paper quality had been
used somewhat interchangeably. Specifically, the terms acid free, alkaline, permanent,
and archival-quality were used in various combinations to describe paper that,
purportedly, would not yellow or become brittle—undesirable qualities associated with
many 19th
and 20th
century papers. The Final Report to Congress on the Joint Resolution
to Establish a National Policy on Permanent Papers uses the more technically precise
term alkaline, rather than acid-free and uses the term permanent paper rather than
archival-quality because it focuses on the required outcome—the longevity of the
product.9 Under The Final Report… an alkaline, permanent paper was defined as:
a fully bleached sheet with a pH of 7.5 or above
an alkaline reserve of two percent or more
a minimum folding endurance in either direction 30 double folds (tested with a
MIT folding endurance tester)
a minimum tearing strength in either direction of 25 grams for a 30 lb paper and
proportionately higher tearing strengths for heavier papers10
The Final Report… definition of alkaline permanent paper aligns with the first
specification for permanent paper, the American National Standards Institute (ANSI)
Z39.48-1984, Permanence of Paper for Publications and Documents in Libraries and
Archives. This specification was developed by National Information Standards
Organization (NISO) and gained strong support in the archival and library communities.
NISO works closely with the International Organization for Standardization (ISO) and
the requirements of the standard, ISO 9706, Information and Documentation – Paper for
Documents – Requirements for Permanence, are commensurate with ANSI standard
Z39.48- 1992 (R2009). ISO 9706 differs slightly from ANSI Z39.48-1992 (R2009) in
allowable fiber content (lignin, ground wood pulp, and unbleached pulp) and tear
resistance measurement but otherwise serves as the requirements for paper permanence.
One flaw to the Public Law definition is that a neutral paper such as 100% cotton rag
paper – long known for its high permanence value - cannot qualify as permanent since it
does not contain the required minimum of two percent alkaline reserve.11
A 2009 revision of ANSI Z39.48-1992 (R2009) included the following preface:
Publishers and paper manufacturers, take note! This standard sets the basic
criteria for coated and uncoated papers that will last several hundred years under
normal use. It covers pH value, tear resistance, alkaline reserve and lignin
threshold. Recycled papers will meet the criteria specified.12
This revision to the
original 1984 standard is based on testing conducted by the Institute of Paper
9 Author’s emphasis
10 Final Report to Congress on the Joint Resolution to Establish a National Policy on Permanent Papers,
December 31, 1995 11
Shahani, et al., Accelerated Aging of Paper (2000) 12
Author’s emphasis
9
Science and Technology and contributions from paper makers, publishers,
printers, and the preservation community.13
The statement above addresses one of the original questions posed in this report-- that
“recycled papers will meet the criteria specified.” However, other concerns immediately
follow. One question would be can all recycled copy papers meet the requirements for
permanence? The array of papers available commercially often includes options to
purchase copy papers that have different amounts of postconsumer recycled fibers. This
raises the question of whether the papers will age at a similar rate or whether the various
amounts and type of recycled fiber influence the rates of degradation. Finally, how do we
test for the permanence of papers now and how do we to predict if the paper will
maintain its permanence in two hundred years’ time?
It is important to consider how permanence is measured as much as how it is defined. In
their 1988 discussion Paper Testing and Strength Characteristics, Caulfield and
Gunderson wrote that the “mechanical and strength properties of paper reflect the
intrinsic chemistry, morphology and structure” of the material itself, and that those
properties “reflect the chemical changes that cause paper to lose its permanence with
time.”14
This suggests that the chemical composition of the paper matrix itself will be
responsible for the quality and usability of the material in the distant future. This report
will show that different test methods can reveal contradictory implications of measured
properties relating to how long the copy papers may be usable.
Caulfield and Gunderson built upon a concept first formulated in 1926,15
the earliest
found distinction between the terms permanence and durability; that permanence is a
measure of chemical stability and that durability is a measure of physical and
mechanical properties.16
Often, the color of a paper suggests to users that chemical
changes have taken place, but color may not be the truest measure of chemical stability.
The authors’ logic followed that the leading indicator of chemical permanence is the
paper’s physical durability and that only by testing the physical properties of the material
can information about the chemical makeup of the paper be discovered. They described
various test methods for the determination of physical strength, what the tests revealed
about paper fiber structure and bonding, and the role of accelerated aging tests in
determination of permanence. The authors concluded that the ultimate aim of laboratory
testing was to meet the desired end-use requirements.
13
ANSI Z39.48- 1992 (R2009), Permanence of Paper for Publications and Documents in Libraries and
Archives 14
Caulfield and Gunderson, Paper Testing and Strength Characteristics (1988) 15
Ibid. 16
Author’s emphasis

10
III. Accelerated Aging and Permanence
It has long been recognized that in order to predict lifetime and longevity of library and
archive materials, researchers need to be able to simulate natural aging through the use of
known environmental parameters that can accelerate and increase the rate of degradation.
Studies as far back as 1934 suggest that artificial aging of paper can be a good indicator
of the real effects of time.17
To effectively execute this process, there need to be
established links between the results of accelerated aging in relation to how materials age
naturally. Increased temperature, light and relative humidity (and pollutants) are
commonly used to accelerate aging of materials. While traditionally temperature has been
commonly used for aging studies, more recent research has shown that the results may
induce degradation mechanisms that are not common to natural aging. Most studies use
reasonable temperature and relative humidity to induce degradation without introducing
new degradation mechanisms, rather than the often extreme conditions used in earlier
studies.18
In his 2000 examination of the subject, Rate of Paper Degradation: The Predictive Value
of Artificial Aging Tests, Porck explains that accelerated or artificial aging is an
experimental technique in which a “material is subjected to extreme conditions in a
climate-chamber to try to speed up the natural aging process.19
The report summarized
the various techniques available and benefits of specific temperatures and humidity used
at that time for artificial aging experiments. The writer concluded that there were widely
diverging opinions amongst conservation scientists to the exact conditions under which
artificial aging takes place and that there was no single generally accepted standard
method. His analysis also stated that “artificial aging tests currently available do not
allow for a reliable determination of paper degradation in absolute terms.”20
This led to
the conclusion that findings from artificial aging were qualitative and relative to the
specific papers being studied.
Accelerated aging is also the most viable experimental method for analysis of recycled
papers. Doshi, Technical Editor of Progress in Paper Recycling, noted in 1994:
A satisfactory method for the quick simulation of the natural aging process lasting
for several hundred years has not yet been developed. Some work is continuing in
this area. In the meantime, the best way to test for permanence that we know of
today is the moist accelerated aging test. The test involves exposing the paper to a
specified temperature and relative humidity.21
Doshi conceded that accelerated aging was a far from perfect model for prediction of
paper longevity but that it was the best method to make some relative conclusions about
recycled papers.
17
Shahani, et al., Accelerated Aging of Paper (2000) 18
Porck, Rate of Paper Degradation: The Predictive Value of Artificial Aging Tests (2000) 19
Ibid. 20
Ibid. 21
Doshi, Recycled Paper Technology: An Anthology of Published Papers (1994)

11
A collaborative effort between the LC and the Canadian Conservation Institute (CCI) was
“undertaken to develop an accelerated aging test for paper that could be unequivocally
demonstrated to approximate the natural aging process.”22
The 2000 study examined the
Arrhenius relationship between increased heat and increased rate of degradation of
organic materials. The work investigated the degradation products of paper formed by
natural and accelerated aging.23
Additionally, a comparison between specific accelerated
aging methods (free hanging sheets, stacks, and sealed tubes) was undertaken. Initial
findings suggested that the tube method created degradation products similar to natural
aging. One benefit to the tube method was the control of water content in the tube;
appealing because only a dry oven is required, not a climate chamber. However, doubts
about the efficacy of the seals of the tubes raised concern that water loss could result in
different degradation mechanisms than those found in natural aging. For this research, the
free hanging method was used because it allowed known and consistent environmental
conditions to surround the samples, ensuring that the papers being aged and tested were
all equally exposed and aged.
In 1992 Van der Reyden reviewed specific chemical, physical, and optical properties
found with paper in Recent Scientific Research in Paper Conservation. Van der Reyden
attested to the interdependency of those properties—that measuring one set of parameter
can yield information about the others. The author noted that “optical properties are
physical properties which conservators often monitor as indications of chemical
changes.”24
Van der Reyden also emphasized that the “properties are in turn affected
individually and collectively by environmental parameters such as temperature, humidity,
and light; by aging; and by conservation treatments.”
Aging studies highlight the relationships between internal paper properties and the effects
of external environmental factors. This report used correlations of test results from
disparate parameters (i.e. physical, optical, and chemical testing) to measure paper
degradation. These properties change as a function of the effect of environment (i.e.
artificial aging) and allow for comparisons of strength between papers but are not used to
predict with any precision an exact life span of the papers.
22
Shahani, et al., Accelerated Aging of Paper (2000) 23
Ibid. 24
Van der Reyden, Recent Scientific Research in paper Conservation (1992)
12
IV. Recycling Process Literature
Howard noted in his 1990 paper, The Effects of Recycling on Paper Quality, that some
investigations into the effects of recycling began in the late 1960s.25
That research
focused on establishing the cause and effect relationships that lead to negative impacts of
recycling papers. The study posited that the major cause of the change in properties was
the reduced bonding ability of the fibers in the paper composite after recycling of the
pulp. While loss of intrinsic fiber strength had been expected, a range of results were
observed-- some indicating loss, no change, or even an initial increase in fiber strength.
The loss of flexibility in recycled papers was linked to the reduced swelling capacity of
the fiber in the paper assembly, and McKee (1971) measured this trend using the Water
Retention Value (WRV). In Effect of Repulping on Sheet Properties and Fiber
Characteristics it was noted that the first two cycles showed the most rapid decrease in
fiber swelling.26
However other researchers suggest that the loss of bonding ability could
be the result of two effects – changes occurring to the surface of the fibers and changes
mainly occurring in the bulk of the fiber. These effects may relate to the accessibility of
the fiber surface to enzyme attack and the rate of degradation of the bulk of the fiber.
Factors that control the recycle potential of pulp depend on the manufacturing history.
There seems to be general agreement that a greater initial degree of beating of virgin pulp
led to a greater loss of pulp quality in the corresponding recycled paper manufactured,
and that this was probably due to a loss of internal swelling in the fibers. The effect of
drying has an impact, where both high temperature and restrained drying can reduce the
swelling potential of recycled papers. Multiple recycling tends to lead to an increase in
cellulose crystallinity and decreased flexibility along with a reduced capacity for swelling
and inter-fiber bonding. Yamagishi and Oye (2007) observed a small increase in cellulose
crystallinity with recycling of commercial hardwood and softwood pulps.27
The effects of chemical additives impact recycling since virtually all commercial
papermaking utilizes additives. The presence of rosin/alum sizing in the original paper
causes a large increase in the loss of quality of recycled paper, possibly due to inhibited
bonding. Deinking of paper generally requires a range of processes, and research into the
impact of these processes on recycled paper still needs to be investigated further. Sodium
hydroxide has been used in recycling since 1800 for ink removal or to aid the breakdown
of heavily sized papers. More recently sodium hydroxide has been investigated as an
additive to recycled pulp since the inclusion of less than 1% led to improvements in
breaking length. Blending recycled with virgin pulp has been shown to improve recycled
paper properties, particularly if the added pulp was beaten. However further research is
needed in this area.
Nazhad (1994) demonstrated that the degradative effects of recycling result in the loss of
potential bonding of recycled fibers, a loss that translates into “hornification” – a series of
25
Howard, The Effects of Recycling on Paper (1990) 26
McKee, Effect of Repulping on Sheet Properties & Fiber Characteristics (1971) 27
Yamagishi and Oye, Influence of Recycling on Wood Pulp Fibers—Changes in Properties (2007)
13
irreversible changes that cellulose fibers undergo when exposed to cycles of wetting and
drying, and loss of fiber wet flexibility.28
The term hornification is a technical term used
in wood pulp and paper research literature that refers to the stiffening of the polymer
structure that takes place in ligno-cellulosic materials upon drying or water removal.29
When wood pulp fibers are dried, the internal fiber volume shrinks because of structural
changes in the fibers. If fibers are then again suspended in water, the original water-
swollen state is not regained.30
The effect of hornification can be identified seen in the
results from physically testing the paper such as burst or tensile testing. Nazhad’s
research showed that the overall result of drying and rewetting is a reduced swelling
ability of the fibers, with most of the change taking place in the first cycle. Repeated
cycling then further reduces the plasticity and therefore flexibility of the fibers.
Recycling should not be considered a modern phenomenon. A program for recycling was
established in Southern Africa in 1826.31
Research in this country noted increases in
strength properties after the first and or second cycles and then a sharp decrease in
mechanical performance. It was suggested that this reduction was due to the increase in
deformation of fibers in the paper assembly with these degraded fibers having reduced
surface accessibility for bonding. They found that the rate of tensile strength loss from
chemical (beaten) pulp was twice as high as that of unbeaten pulp with the recycled
process indicating a similar trend between bending stiffness and tear strength.
In his 2008 thesis, Effect of Progressive Recycling on Cellulose Fiber Surface Properties,
Brancato employed atomic force microscopy to assess the effects of hornification – the
irreversible changes in cellulose fibers exposed to cycles of wetting and drying.32
These
changes in the cellulose fiber surfaces indicated two separate effects; a) a decrease in the
water absorption and retention capacity of recycled pulp, and b) a change in surface
roughness of the recycled paper, resulting in a smoother surface. It was proposed that the
free microfibrils of the fiber surface formed intrafiber hydrogen bonds, essentially
laminating and presenting a more homogeneous surface on the recycled paper.
The reduced swelling capacity of recycled fibers is caused by irreversible hornification
and is the accepted morphological reason for strength loss in recycled papers.
Brancato also describes Jayme’s introduction of the water retention value (WRV)
measurement by centrifugation. The definition of irreversible hornification is described in
terms of decrease in WRV and expressed as a percentage of the original value. The
decrease in WRV was found to correlate well with fiber thickness measured in electron
microscopic images; though no change in fiber width was detected after multiple fiber
dryings.32
Repeated recyclings showed progressive variations in these properties.33
28
Nazhad, Fundamentals of Strength Loss in Recycled Paper (1994) 29
Diniz, Hornification—Its Origin and Interpretation in Wood Pulps (2004) 30
Ibid. 31
Sutjipto et al., Effect of Recycling on Paper Properties (2007) 32
Brancato, Effect of Progressive Recycling on Cellulose Fiber Surface Properties (2008) 33
Ibid.

14
Improvements to the quality of recycled papers have been in the interest of consumers,
producers, and scientists alike. McKee’s concern in 1955 for significant physical property
difference shown between “repulped or regenerated fibers (and papers made therefrom)”
and virgin fibers predate the term ‘recycled paper’ by years.34
At LC, efforts by McComb
and Williams (1981) suggested that recycled fiber from alkaline paper was more akin to
the properties of virgin fiber, and would produce recycled paper with better long-term
properties.35
Doshi compiled and edited Recycled Paper Technology: An Anthology of
Published Papers in 1994. The text includes a comprehensive examination of all aspects
of the paper recycling. The essays range from discussions of public policy, equipment
technology, paper chemistry, paper strength, quality control, and permanence and should
be referenced by any reader wishing to pursue this topic.36
McKinney, editor of Technology of Paper Recycling and another expert on the subject
wrote that “recycled pulp potential can be maximized by blending with virgin pulp…
[virgin pulp] had a disproportionately large effect in improving recycled pulp properties.”
It is important also to note that the “softwood to hardwood fibre mixture is within the
20/80% range normally utilized in the manufacture of printing and writing grades of
paper.”37
That is to say the type of virgin pulp also has an effect on the end product.
Additional fillers in the furnish of the paper have tremendous implications for chemical
stability as well. The addition of calcium carbonate as a filler, economically
advantageous to the paper producer also adds pigment for enhanced brightness and an
alkaline reserve which will be shown in this report to provide the chemical stability
required of permanent papers.38
34
McKee, Effect of Repulping on Sheet Properties & Fiber Characteristics (1971) 35
McComb et al., The Value of Alkaline Papers for Recycling (1981) 36
Doshi, M. (editor): Recycled Paper Technology: An Anthology of Published Papers (1994) 37
McKinney, Technology of Paper Recycling (1995) 38
McComb et al., The Value of Alkaline Papers for Recycling (1981)

15
V. Characterizing Paper Degradation through Physical and Optical Testing
Physical Testing
Tumosa, Erhardt, Hufford, and Quasney (2008) investigated the permanence and
durability of “ephemera”-- the magazines, newspapers, and paperback novels printed on
acidic papers that make it into our libraries and archives. The research was conducted to
better understand the mechanisms of degradation of these papers and to “provide
information to make more informed decisions regarding the necessity or urgency of
replicating or discarding acidic wood pulp based paper materials.”39
Clearly, the acidic
papers cannot be considered permanent by ANSI standards. The authors suggested that
the parameters measured offer the difference in interpretation of permanence (chemical
properties) and durability (physical properties). The investigation relied on the stress-
strain data collected from tensile testing to adequately provide results that are relevant to
the physical and mechanical effects of routine handling.
As suggested by Caulfield and Gunderson, Tumosa et al. also supported the notion that
defining what is being measured would yield the best information for evaluation of
permanence. For example, while traditional paper longevity studies have based predictive
models on fold endurance testing, this test was developed by industry for measurement of
durability, not permanence. Durability is the ability to resist change during use, while
permanence is the ability to resist change when not in use. In this report we will see from
tensile testing results that copy papers hold up after long term exposure to accelerated
aging. Conversely, we will also find that the degree of discoloration of the sheets does
not correlate well with the tensile testing results. Though at first glance this may suggest
a contradiction in results, when viewed from the perspective that the physical test is a
better evaluation of permanence, we can make some valid points about the nature of the
paper’s degradation.
Early research into paper tensile characteristics was thoroughly reviewed in 1970 by Van
Den Akker.40
Key concepts of the review include research into stress-strain relationships,
fiber orientation, polymer mechanics, and bond strength. Graminski (1970) investigated
the stress-strain behavior of aged papers and found an increase in stiffness (decrease of
flexibility) due to an increase in the degree of crystallinity or the formation of inter-
molecular cross-links.41
More recently, in 2006 Bonham and Rolniczac studied a range
(from 10% to 100%) of recycled fiber containing papers and examined how well they
conform to standards for permanence and longevity. Loss of strength and discoloration
were explored and longevity was ultimately attributed to the presence of sufficient
alkaline reserve.42
Correlation found between loss of brightness and loss of fluorescence.
Okayama et al. (2010) attempted to estimate degradation behavior of papers containing
recycled fibers by artificial aging and testing for fold endurance and brightness
39
Tumosa et al., The Deterioration of Newsprint and Implications for Its Preservation (2008) 40
Van den Akker, J.A. Structure and Tensile Characteristics of Paper (1970) 41
Graminski, Stress-Strain Behavior of accelerated and Naturally Aged Papers (1970) 42
Bonham and Rolniczac, Accelerated Ageing of Copy Papers Containing Recycled fiber (2006)

16
measurements. Research concluded that papers with recycled fibers perform less well that
virgin pulp papers on tests.43
Wu et al. (1999) assessed the permanence of paper in regards to fold endurance and color
(brightness) and found that the content of recycled fiber had a significant influence on
paper permanence since it reduced fold endurance by 50% with a recycled content of
25%.44
The initial fold endurance of 25% recycled paper was only 30% of the value of
virgin fiber (12 versus 42 folds respectively for an assessment of physical properties).
After 28 days accelerated aging (TAPPI test method T453: heating at 105C for
increasing periods of time) both showed a reduction in fold endurance of one-third from
their original. The fold endurance decreased with increasing recycled fiber content but
with a similar percent loss to that of virgin fiber. Brightness measurements indicated a
minimal reduction after 28 days accelerated (heat) aging. For increasing fiber recycled
fiber content from 0% to 100% the crystallinity of the papers after 28 days of heating
remained relatively constant while that of virgin fiber increased about 1.5%.
Zhang et al. (2003) investigated the mechanisms of paper strength loss that occurs in
recycled paper made from chemical pulps.45
It was noted that tensile strength and
compression strength both decrease with recycling. Drying reduced water retention
values, flexibility and accessible fiber surface resulting in lower strength and lower
density, with large effects for recycled papers made from virgin fibers that had been dried
in temperatures higher than 150C. An assessment of the efficacy of adding certain
chemicals to virgin fibers before drying showed that some strength loss of the
corresponding recycled papers could be prevented.
In Physical Properties of Textile Fibres (1975), Morton and Hearle offer comprehensive
discussions concerning the chemical structure; physical, electrical, and optical properties;
and test methods for experimentation on natural and synthetic fibers.46
This book was an
invaluable tool for the design of this experiment, a reference for defining and describing
the technical fundamentals observable in the tensile testing of paper. Because various test
methods call for specific tensile testing properties to be measured, many considerations
were accounted for in the design. For example, the Technical Association of the Pulp and
Paper Industry (TAPPI) method 494 states that “TEA [Tensile Energy Absorption] is a
measure of the ability of a paper to absorb energy… and indicates the durability47
of a
paper… it expresses the toughness of a sheet’.”48
Similarly, ‘Tensile Strength” is
indicative of fiber strength, fiber length, and bonding.” Other considerations in tensile
testing, specifically the information that that can be gleaned from stress/strain curves,
illustrate the test’s effect on the material itself. The plots show strain (deformation of
paper as a ratio) as a function of stress (the force or load per area). To relate changing
43
Okayama, T., Goto, T., Higashiyama, H., and Matsida, T.: Estimating Degradation Behavior of Recycled
Pulp-Containing Papers by Accelerated Aging Tests (2010) 44
Wu, et al., Effects of Recycled fiber on Paper Permanence (1999) 45
Zhang, et al., Preventing Strength Loss of Unbleached Kraft Fibers (2003) 46
Morton and Heale, Physical Properties of Textile Fibres (1975) 47
Author’s emphasis 48
TAPPI 494, Tensile Properties of Paper and Paperboard

17
terminology, the initial slope of the stress/strain curve is often referred to as Young’s
Modulus, modulus of elasticity, and “stiffness” in older literature. This parameter relates
to how much stress the material can take before permanent deformation occurs. For this
experiment multiple stress/strain curves were generated for each paper specimen tested.
Rather than presenting the collected data in the form of these plots, tensile testing results
are reported as “max load”, a single number taken from the moment the sample broke.
In the Handbook of Fiber Chemistry,edited by Lewin (2007), strength is defined as “the
power to resist force, [that] can best be stated as a breaking strength or the force or the
load necessary to break a fiber under certain conditions of strength.”49
Max load can be
used alone but to fall in line with the ISO standard for tensile testing of paper, the report
should include results reported as tensile strength. Tensile strength is defined as max load
divided by width of the sample. The graphs for these two parameters look the same but
the units that define the graph comprise the difference. Max load is a measurement of
force, defined in Newtons (N). Tensile strength is a measure of force per load area,
defined in Pascals (Pa). For this report, max load will be used as the parameter for
analysis.
In addition to the tensile testing presented in this report, fold endurance testing is used as
a second measure of physical strength characterization. PRTD uses fold endurance as a
measure of Quality Control in its specifications for materials used to rehouse collection
items at LC. Fold endurance has been used in past research at LC to measure paper
degradation as a function of accelerated aging and, noted above; several examinations of
recycled paper have used fold endurance as the primary indication of physical strength.
Optical Testing
Billmeyer and Saltzman’s Principles of Color Technology (2000) outlines technical
specifics of color science and was used a guide in the development of the experimental
plan described in this report. The CIE 1976 (L*a*b*) color system, also known as
CIELAB-- defined by the Commission Internationale de l’Éclairage-- was used to
describe the results of the color change of the copy papers, measured by a
spectrophotometer. Ruth Johnston-Feller’s Color Science in the Examination of Museum
Objects was used a guide in the selection of the specific geometry used for testing and as
to whether the effects of specular light was to be included or excluded.50
Johnston-Feller
found and suggested that diffuse measurements using sphere geometry mostly agree with
TAPPI brightness meter, the traditional method for measuring optical changes in paper.
The spectrophotometer was calibrated in the Reflective Specular Excluded (RSEX) mode.
Results from the spectrophotometer were reported in several ways. A spectral curve
showing the percent reflectance of the specimen at each wavelength illustrates the
changes each paper exhibited as it was aged; the plotted curve can be used to assess the
relative color change of a paper compared with a known standard. It is a graph of the
relative percent of electromagnetic measured at each wavelength. For this report results
49
Nissan, Retrospect and Prospect of Physical and Mechanical Testing of Paper and Paperboard (1983) 50
Johnston-Feller, Color Science in the Examination of Museum Objects: Nondestructive Procedures (2001)

18
were reported using the CIELAB color coordinates as a matter of convenience for
analysis. The CIELAB color space is a:
… three-dimensional approximately uniform color space, produced by
plotting…L*a*b* quantities defined as…L* a measure of lightness of a piece,
where L*= 0 corresponds to black and L*= 100 is defined by a perfect reflecting
diffuser…+a* a measure of redness…-a* a measure of greenness… +b* a
measure of yellowness…-b* a measure of blueness…51
Figure 1. CIELAB 1976 Color Space (Sphere Representation)52
51
ISO 5631-2: 2008(E), Paper and Board—Determination of Color by Diffuse Reflectance, Outdoor
Daylight Conditions (D65/ 10°) 52
Image courtesy of http://www.rpdms.com/cielch/

19
VI. Experimental
The ultimate aim of this study is to determine whether papers composed of recycled
paper fiber can fulfill requirements for permanence, given the mandate to purchase 30%
recycled component papers for all government agencies. The characterization of physical,
chemical and optical properties of known archival and recycled content papers is
undertaken to assess the interactions between these properties and to assess the ability of
optical measurements to predict paper permanence.
Materials
Given the immensity of the market for 8 ½” x 11” copy papers that are available for
purchase, materials for this examination were limited to a single manufacturer that
offered a variety of papers with various percentages of postconsumer recycled content.
Three multi-purpose copy papers available from the manufacturer were sold as to
including 30%, 50%, or 100% postconsumer recycled content. Information about a fourth
paper, the “general use” copy paper, did not specify whether or not recycled fibers were
included. These four papers, aside from percentage recycled content, were otherwise
featured as having identical physical characteristics. Specific qualities noted on the ream
wrappers included basis weight (20 lb.) and brightness values (92). The copy papers are
all lignin-free.
In addition to the four commercially available papers, two additional papers from the
Library of Congress Center for Library Analytical Scientific Samples (CLASS) were
chosen for comparison. The first was a bleached kraft wood pulp waterleaf (WPWL) (50
lb. basis weight) from a stock comprised of northern softwoods (60%) and Lake States
hard woods (40%). This paper was made from mechanically ground wood pulp, has no
additional fillers or sizing, is lignin-free, and served as an acidic reference paper. The
second reference paper is a 25% CC (cotton fiber content) copy paper that is often used
as a “permanent” paper for official LC administrative records. This permanent paper has
a high alkaline reserve, has a basis weight of 20 lb., and is lignin-free.
Single pages in one ream of each of the six papers were numbered from 1 to 500. An
Excel random number generator function was then used to create an experimental sample
set consisting of 120 sheets from each ream. Accelerated aging of the papers were
designated into twelve time intervals, ten sample sheets for each interval, making a total
of 720 sample sheets of paper comprising the test sample set.
Accelerated aging was used to assess the papers for changes in optical, physical, and
chemical characteristics. If a link between physical and optical testing could be
established the feasibility of non-destructive optical testing to reliably estimate the
condition of papers would be entirely possible.
The ASTM standard for moist accelerated aging of paper was used as the basis for this
experiment, ASTM D4714: Standard Test Method for Determination of Effect of Moist
Heat (50 % Relative Humidity and 90°C) on Properties of Paper and Board.

20
A Parameter Generation & Control (PGC) aging chamber (Model Number 1362-04) held
steady conditions of 90° +/- 0.1°C and 50% +/- 1% relative humidity (RH). The paper
samples were aged as loose sheets hung vertically on a rack which permitted the free
flow of the conditioned air around them. One set of ten papers was set aside in a ‘TAPPI’
chamber (23°C, 50% RH) to act as a “Day 0” control. The interval batches of ten sample
papers for each paper type were removed from the aging chamber after days 1, 3, 7, 10,
14, 21, 28, 35, 42, 49, and 56. Although many factors contribute to the degradation of
paper, for context in this study a perfect Arrhenius relationship will be assumed for the
accelerated aging. For each 10° C increase in temperature, a doubling of reaction rate will
be assumed. A rise in temperature from ambient (20° C) to experimental (90° C)
calculates to be 128 days of natural aging for each day of accelerated aging. Table 1
spells out the number of days of accelerated aging and the natural aging equivalents.
Days of
Accelerated
Aging
Day
0
Day
1
Day
3
Day
7
Day
10
Day
14
Day
21
Day
28
Day
35
Day
42
Day
49
Day
56
Natural
Aging
Equivalent
0
Days
128
Days
384
Days
2.5
Year
3.5
Year
4.9
Year
7.4
Year
9.8
Year
12.3
Year
14.7
Year
17.2
Year
19.6
Year
Table 1. Accelerated aging and approximate natural aging equivalents
Physical Testing
Tensile Testing
For tensile testing, ISO 1924-2:2008(E), Paper and Board—Determination of Tensile
Properties—Part 2: Constant Rate of Elongation Method was used. The test method
specifies directions for sample preparation, testing, and reporting results “for measuring
the Tensile Strength, Strain at Break, and Tensile Energy Absorption of paper…”53
Samples were cut to the specified width (15+/- 0.1 mm) using a parallel blade sample
cutter. To ensure an adequate number of test strips, six strips of paper were cut in the
machine direction from five different sheets per time interval for each paper. Cotton
gloves were worn when preparing the samples. The samples were all conditioned at
23°C/ 50% RH for at least 24 hours before testing.
The strips were individually loaded into the clamps of an Instron 5564 tensile tester. The
clamps were spaced 180+/- 1 mm apart, per the test method. Slack was removed from the
paper by alternating alignment of the strip and opening and closing the clamps. Ten
specimens of each time interval of each paper were tested; bad breaks and poor stress/
strain curves were discarded and retested.
53
ISO 1924-2:2008(E), Paper and Board—Determination of Tensile Properties—Part 2: Constant Rate of
Elongation Method

21
The strips were pulled apart at a constant rate of elongation (20 mm/min). The Bluehill
software used for analysis reported results in terms stress/ strain curves that additionally
show the maximum slope of the curve. The stress applied, on the Y-axis of the graph, is
the amount of force used to pull the material apart, expressed in Newtons (N). The strain
reported on the X-axis describes the amount of deformity of the material as a function of
the stress. The maximum slope is also referred to as the modulus of elasticity and
indicates how elastic a material is prior to breaking.
The conclusion drawn from each stress/ strain curve was recorded as the breaking point
of the material. The data collected and analyzed for this experiment used the maximum
“max load”, expressed in Newtons (N), to describe the physical strength of each paper
sample. Traditional reporting for tensile strength evaluates the force divided by initial
width of the sample (15+/- 0.1 mm), expressed in megaPascals (MPa). Data from ten
specimen strips were reported for each sample paper and used to calculate the mean and
standard deviation of each set.
Fold Endurance Testing
The traditional method for physical testing of paper was its fold endurance. This is a
practice common in the paper industry and has been used for paper testing in LC
laboratories since the inception of the Preservation Research and Testing Division.54
The
test is being included in this report to compare the two physical test methods. TAPPI Test
Method T 511 om-06: Folding Endurance of Paper (MIT Tester) uses the same sample
preparation method as noted above for the tensile test. The machine direction samples are
cut from the sheets using the parallel cutter and the samples are conditioned at 23° C/ 50%
RH.
Double-fold testing was performed using a Tinius Olsen Massachusetts Institute of
Technology (MIT) fold endurance tester. The fold endurance tester holds the specimen
under a constant tension load of 500 or 1000 grams. The paper is then folded to an angle
of 135° in either direction, at the rate of 175 double folds per minute until the specimen is
severed at the crease.55
For this study, the 500 gram load was used because it is a more
sensitive measure. The results are reported as log rhythmic (base 10) values of the
number of double folds each paper endured before breaking.
Optical Testing
Colorimetery
For measurement of color change, the standard test method ISO 5631-2: 2008(E), Paper
and Board—Determination of Color by Diffuse Reflectance—Part 2: Outdoor Daylight
Conditions (D65/ 10°) was used. The method calls for use of “an abridged
spectrophotometer, and the color coordinates are then calculated for D65 (daylight) and
54
Shahani, et al., Accelerated Aging of Paper (2000) 55
http://www.testingmachines.com/31-23-mit-folding-endurance-tester.html
22
10° (illumination incidence) conditions.”56
The instrument used to make the measurement
was a HunterLab UltraScan PRO. The UltraScan PRO is a dual beam xenon flash
spectrometer with a wavelength range from 350 nm to 1050 nm, wavelength intervals
reported at 5 nm. The diffuse/ 8° (d/8) viewing geometry of the instrument uses an
integrating sphere that is six inches in diameter.57
Ten specimens of each paper at each aging interval were conditioned for at least 24 hours
at TAPPI conditions and were handled with cotton gloves during testing. The specimens
were randomized and measured against a white tile standard provided with the instrument.
One reading from the “front” side of each leaf of paper was taken. Areas chosen for
measurement had no flaws to influence the measurements. The stack of ten specimens
served as its own “backing material,” ensuring methodical reproduction of results.
For this experiment, the specular excluded (RSEX) setting was chosen to negate the
effects of sheen created by optical brighteners present in some of the papers and to more
closely measure diffuse light interaction with the paper samples. In a HunterLab
Application Note, Reflectance Measurements: Specular Included versus Specular
Excluded, “to describe color in CIE terms, diffuse reflectance [RSEX] must be used.”58
Results of color testing for this project are reported in two forms: CIELAB Delta E*
values and CIELAB b* values. CIELAB color coordinates are represented by quantities
of:
Lightness (L*); on a scale that runs from perfect black (value 0) to perfect
reflecting diffuser (value 100)
+a* is a measure of the degree of redness
-a* is a measure of the degree of greenness
+b* is a measure of the degree of yellowness
-b* is a measure of the degree of blueness
Delta E is a simplified calculation used to give the Mean Color Difference
representative of the overall change of color of an object as a single value. It is
calculated by adding together the sums of Delta L* squared, Delta a* squared,
and Delta b* squared and then taking the square root of that sum. Mathematically,
Delta E is represented by the following equation:
∆𝐸𝑎𝑏 ∗= [(∆𝐿 ∗)2 + (∆𝑎 ∗)2 + (∆𝑏 ∗)2]1/2
As stated, the primary focus of optical properties testing for this research is color change
measurements, reported as CIELAB coordinates. However, traditional optical testing in
the PRTD laboratory included brightness measurements. Brightness measurements were
completed and will be reported and compared with the results from the color change
measurements.
56
ISO 5631-2: 2008(E), Paper and Board—Determination of Color by Diffuse Reflectance—Part 2:
Outdoor Daylight Conditions (D65/ 10°) 57
HunterLab UltraScan Pro User’s Manual (2006) 58
Ibid.

23
Brightness Measurements
In the previous description of physical testing, it was noted that fold endurance testing
was the traditional method of assessment. The traditional methodology for measuring
optical changes in paper was known as the brightness measurement. Brightness testing is
a paper industry standard that has also been used for paper testing in LC laboratories
since the inception of the Preservation Research and Testing Division.59
The test was
included in this report to compare the two optical measurement methods. TAPPI Test
Method T 452 om-08: Brightness of Pulp, Paper, and Paperboard (Directional
Reflectance at 457 nm) uses the same sample preparation method as noted above in the
color measurements section.
TAPPI brightness was measured using a Technidine Brightmeter S-5. The Brightimeter
instrument uses a 45° illumination and a 0° viewing geometry (45/0). The instrument is
calibrated with a standard white tile and each specimen is measured for the directional
reflectance at 457 nm of light.60
Brightness values are a expressed as unitless numbers
ranging from 0 (darkest) to 100 (brightest).
Chemical Testing
The LC method for pH determination (cold-extraction) was used to test the pH of each
paper at three different stages of accelerated aging. The method calls for 2.5 grams of
each specimen to test. Specimens from days 0, 28, and 56 were macerated into slurries
using 250 mL of deionized water each. End-point determinations of pH was recorded
after allowing five minutes for the electrode meter to stabilize. A phloroglucinol indicator
was used to test for the presence of lignin.
Environmental Scanning Electron Microscopy
A survey of paper surface morphology was conducted using an FEI Quanta 600
environmental scanning electron microscope (ESEM) and elemental analysis was
performed using Oxford X-max energy dispersive spectroscopy (EDS). Two samples
were prepared from each paper—a day 0 (control) sample and a day 56 (aged) sample.
The specimens were sputter coated with palladium to reduce the effects of charging. It
was hoped that some visible difference in the fibers would be apparent between the
before and after accelerated aging samples. Quantitative analysis with EDS was not
conducted because of a requirement for a polished sample. However, EDS was used
effectively as a semi-quantitative evaluation of these rough, fibrous materials.61
EDS
limitations for analysis of paper also include:
the spatial resolution of the paper additives [being] somewhat diffuse due to the
size of the interaction volume… the x-rays of a particular element are not
generated at the surface of the specimen but originate at various depths….
59
Shahani, et al., Accelerated Aging of Paper (2000) 60
TAPPI Test Method T 452 om-08: Brightness of Pulp, Paper, and Paperboard (Directional Reflectance
at 457 nm) 61
Conners, et al.: Surface Analysis of Paper (1995)

24
Secondary x-rays generated by BSE interacting w/ various particles closer to the
surface will also contribute to the mapping of these elements, giving them a
diffuse outline, further decreasing resolution.62
62
Ibid.
25
VII. Results and Discussion
Physical Testing
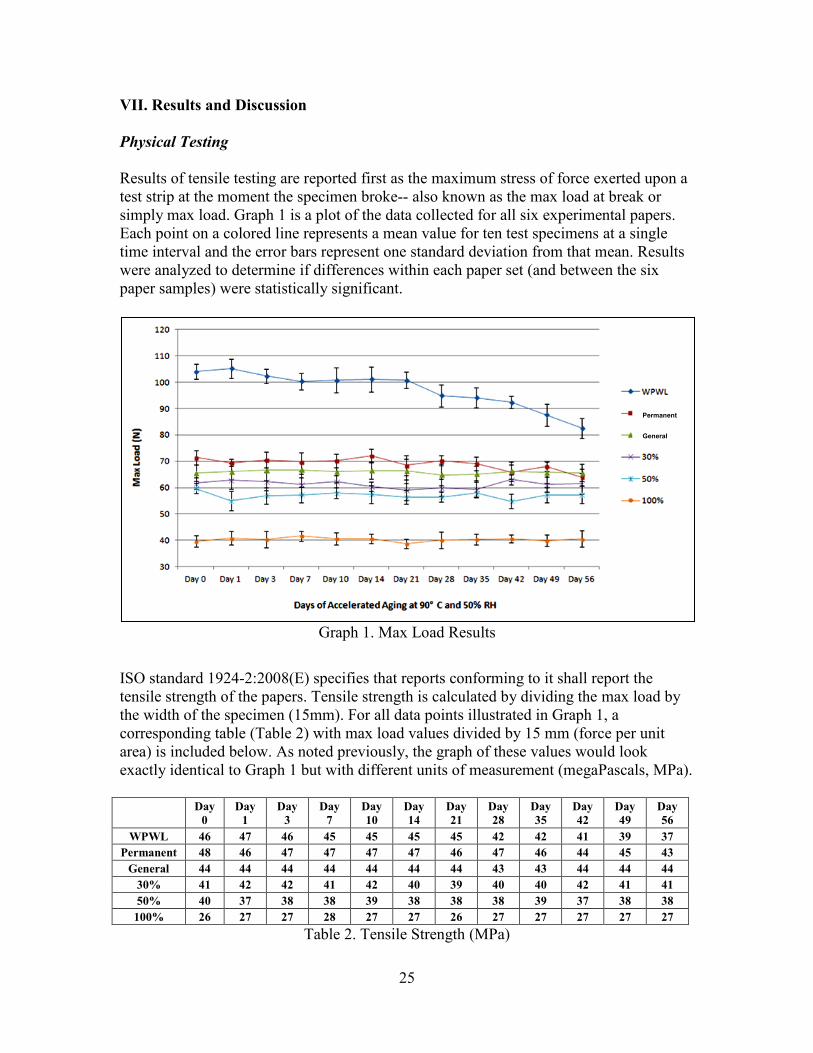
Results of tensile testing are reported first as the maximum stress of force exerted upon a
test strip at the moment the specimen broke-- also known as the max load at break or
simply max load. Graph 1 is a plot of the data collected for all six experimental papers.
Each point on a colored line represents a mean value for ten test specimens at a single
time interval and the error bars represent one standard deviation from that mean. Results
were analyzed to determine if differences within each paper set (and between the six
paper samples) were statistically significant.
Graph 1. Max Load Results
ISO standard 1924-2:2008(E) specifies that reports conforming to it shall report the
tensile strength of the papers. Tensile strength is calculated by dividing the max load by
the width of the specimen (15mm). For all data points illustrated in Graph 1, a
corresponding table (Table 2) with max load values divided by 15 mm (force per unit
area) is included below. As noted previously, the graph of these values would look
exactly identical to Graph 1 but with different units of measurement (megaPascals, MPa).
Day
0
Day
1
Day
3
Day
7
Day
10
Day
14
Day
21
Day
28
Day
35
Day
42
Day
49
Day
56
WPWL 46 47 46 45 45 45 45 42 42 41 39 37
Permanent 48 46 47 47 47 47 46 47 46 44 45 43
General 44 44 44 44 44 44 44 43 43 44 44 44
30% 41 42 42 41 42 40 39 40 40 42 41 41
50% 40 37 38 38 39 38 38 38 39 37 38 38
100% 26 27 27 28 27 27 26 27 27 27 27 27
Table 2. Tensile Strength (MPa)
Permanent
General

26
WPWL is a heavier paper (50 lb. basis weight) than the copy papers (20 lb. basis weight)
analyzed in this study and is composed of longer fibers (See ESEM photomicrograph,
Image 1). These two factors contribute to the overall higher max load the WPWL paper
samples were able to withstand. The max load decreases significantly for WPWL over
the course of accelerated aging (day 0 - day 56). However, as observed in the Graph 1,
there is no significant difference from original strength until day 28 of aging.
The measure of max load for the commercially manufactured copy papers tested indicate
that they can be ranked in terms of decreasing strength in the following order: the
permanent paper, the general use paper, the 30% recycled fiber paper, the 50% recycled
fiber paper, and finally the 100% recycled fiber paper. The max load does not decrease
significantly for any of these papers over the 56 days of accelerated aging. While it is
difficult to show any significant difference between the data sets of the permanent paper
and the 30 % recycled fiber paper, and similarly between the 30 % recycled fiber and 50%
recycled fiber papers, the difference between max load for the permanent paper and the
50% recycled fiber paper is significant.
The copy paper composed of 100% recycled fiber had the lowest mean max load of all
papers. The difference in mean max load for 100% recycled fiber is significantly different
than the mean max loads for all other papers. However, like the other copy papers, the
mean max load for 100% recycled fiber does not decrease significantly from day 0 to day
56 of accelerated aging.
To place the tensile testing results of this experiment in the context of other recycled
paper research presented in this report, it should be noted that other researchers relied
solely on fold endurance data to evaluate paper performance.63, 64,
65
It will be
remembered, though, that tensile testing is perhaps the best indicator of fiber strength,
fiber length, and bonding. To determine if the tensile testing data collected in this report
more accurately describe a sample’s material properties and permanence, it is necessary
to review the results of fold endurance testing.
Fold endurance results for this report are plotted as the logarithm (base 10) values of the
number of double folds that each paper withstood before breaking. The logarithmic
reporting follows TAPPI Test Method T 511 om-06 and allows more immediate visual
interpretation of the data, compared with graphing of the raw number of double folds. A
table of the actual number of double fold is reported below (Table 3). Graph 2 illustrates
fold endurance data for all six experimental papers, where each point on the colored line
represents a mean value for ten test specimens at a single time interval and the error bars
represent one standard deviation from that mean.
63
Okayama, T., Goto, T., Higashiyama, H., and Matsida, T.: Estimating Degradation Behavior of Recycled
Pulp-Containing Papers by Accelerated Aging Tests (2010) 64
Wu, Effects of Recycled fiber on Paper Permanence (1999) 65
Zhang, Preventing Strength Loss of Unbleached Kraft Fibers (2003)

27
Graph 2. Log10 Double Fold Endurance
Day
0
Day
1
Day
3
Day
7
Day
10
Day
14
Day
21
Day
28
Day
35
Day
42
Day
49
Day
56
WPWL 2302 1810 1527 1396 1286 1107 966 493 173 48 19 5
Permanent 1967 1300 1280 1476 1310 1360 1177 1323 1004 1038 941 906
General 956 848 673 631 567 705 732 620 827 663 563 594
30% 673 739 660 624 814 784 652 599 620 509 517 601
50% 922 768 856 842 581 534 674 620 608 605 564 524
100% 457 288 252 322 251 258 271 238 221 252 276 187
Table 3. Average Number of Double Folds (Raw Data)
As stated above in the tensile test results, WPWL is a heavier paper with longer fibers
than the copy papers used in this study. These two factors contribute to the initial higher
number of double folds WPWL was able to withstand. In Graph 2, WPWL shows the
most dramatic decrease in fold endurance between day 0 and day 56 of accelerated aging.
Significant decreases in WPWL values are seen between each interval after 21 days of
accelerated aging, suggesting initial stability and resistance to accelerated aging but a
steady decline in strength thereafter.
The permanent paper shows significant decreases in fold endurance between day 0 and
day 56 of accelerated aging. However, the error bars overlap between sequential intervals
(i.e. between day 0 and day 1, day 14 and day 21, etc.) suggesting there is not a
significant decrease in fold endurance from interval to interval.
The general use copy paper, 30% recycled fiber paper, and 50% recycled fiber paper do
not show a significant decline in fold endurance between day 0 and day 56 of accelerated
aging. The mean double folds of these papers alternate the relative ranking of each paper
between intervals. The graph illustrates no significant difference in fold endurance
between these general, 30%, and 50% recycled papers. This data is in contrast to the
results obtained from tensile testing, which indicate that significant differences exists
between mean max load for general use and 50% recycled fiber.
Permanent
General

28
The 100% recycled fiber paper has the lowest mean fold endurance of all of the copy
papers. There is no significant decrease in fold endurance between day 0 and day 56 of
accelerated aging. However, one interesting observation made was that by day 35 the fold
endurance of 100% recycled fiber was better than that of WPWL.
It is not possible at this time to determine which method of physical testing is more
accurate concerning the permanence of these papers. However, the similarities and
differences between tensile testing and fold endurance can lead to at least two general
conclusions. First, both methods reveal very clear differences in the physical properties
between a) WPWL, b) the permanent paper, c) 100% recycled fiber paper, and d) all of
the other copy papers tested. Tensile testing may be the most sensitive measure, though,
because of the significant differences seen between the general use paper and the 50%
recycled fiber paper. The difference is not seen in the fold endurance results and should
be a consideration in evaluating of the success of the tests. Secondly, both methods reveal
how very stable the copy papers are in their resistance to the effects of accelerated aging.
As noted above, no significant differences could be measured by tensile testing between
day 0 and day 56 for any of the copy papers. WPWL, lacking the alkaline reserve present
in the other samples, showed significant difference in the results of both methods after 21
days of accelerated aging. For fold endurance results, the 100% recycled fiber paper,
WPWL, and the permanent paper show significant differences between day 0 and day 56.
Optical Testing
Graph 3 represents the Delta E* color change (L*, a*, b*) data collected for all six
experimental papers, with each point on the colored line representing a mean value for
ten test specimens at a single time interval and the error bars represent one standard
deviation from that mean.
The standard deviations for the optical test means are less than those reported for the
physical tests. This could be attributed to either a) the inhomogeneous nature of the
physical structure of paper giving less than consistent physical testing results or b) that
consistent color and finish of the papers are due to optical enhancing additives. The color
and brightness of the papers are key features used by the manufacturers to promote their
products.
WPWL shows the greatest change in Delta E* values, each consecutive time interval
significantly differing from the previous. WPWL and the permanent paper both show an
increase in Delta E* values while all four of the copy papers show decreasing values as a
function of days of accelerated aging. The greater losses in L* values (darkening) of the
two reference papers and the change in b* values (yellowing) of the copy papers can
account for the differing trends of the Delta E* values.

29
Graph 3. CIELAB Delta E* Values
Delta E* values show an overall decrease for all of the copy papers until about Day 28
when significant change in values do not occur for the remaining intervals of aging. The
Delta E* values can be used to rank the greatest change in optical properties between the
copy papers in the following order (from most change to least): 100%, general use, 50%,
and 30% papers. There doesn’t appear to be a significant difference in values between the
general, 30%, and 50% papers although they do significantly differ from the values of the
100% paper. This could be related to the fact that 100% recycled papers has no virgin
pulp and therefore the optical properties are determined more by its homogeneous
composition of all recycled fibers and filler materials.
To further separate and analyze the optical data, a second graph was created to examine
the changes in CIELAB b* values. Graph 4 plots the data for all changes in the yellow-
blue axis of the CIELAB color space. Each plotted point on the graph represents a mean
value for ten test specimens and the error bars represent one standard deviation.
CIELAB b* values increase for all six papers, showing a trend from the blue region of
the spectrum, resulting in an increasing yellowness of the paper. All four of the copy
papers start with very blue (-9 or lower) b* values and with accelerated aging increase
and finally cross the yellow threshold at 0 only toward the end of the experiment. The
yellowing levels off for a number of the papers towards the latter part of the accelerated
aging. This could be suggested to relate to the addition of optical brighteners or
whitening agents to papers with recycled content to make them appear whiter. A separate
study to measure the specific effect of accelerated aging of optical brighteners leading to
increased yellowing of the substrates, could be a useful addition to this area of research.
Only the WPWL paper samples illustrate significant increases in yellowness between
increments at the end of aging.
In addition to the tensile testing, fold endurance testing was conducted to add a link to the
traditional measurements of physical strength. To compare traditional methods with more
Permanent
General

30
Graph 4. CIELAB b* Values
recent optical measurements, brightness was measured using the traditional industry
standard test method for paper. Brightness measurements are read as the reflectance of a
single wave length (457 nm) on a unit-less scale that ranges from 0 (darkest) to 100
(brightest). Figure 5 is a graph of the TAPPI brightness data collected for all six
experimental papers; each plotted point on the graph represents a mean value for ten test
specimens and the error bars represent one standard deviation.
Graph 5. Brightness at 457 nm Values
Similar to the observation made for CIE color space measurements; the standard
deviations of brightness measurements were much less than those observed for the
Permanent
General
Permanent
General

31
physical testing. The greatest change in brightness values was exhibited by WPWL, with
each time interval differing significantly from the previous. All papers show a nearly
linear decline in brightness values as a function of days of accelerated aging. This
contrasts with the results of Delta E* values which showed no significant changes in
values of the copy papers after 28 days of aging. The 100% recycled paper has the
greatest brightness value of all the copy papers but also loses the most brightness over the
course of aging. The general paper appears significantly brighter than the 30% and 50%
recycled content papers and remains so throughout the entire aging period.
As noted by Johnston-Feller, the diffuse measurements offered by the sphere geometry of
the spectrophotometer mostly agree with TAPPI brightness measurements. The data
collected for this report indicate that CIELAB b* values align well with brightness
measurement trends of the copy papers but that some differences exist, most notably for
WPWL.
Chemical Testing
Table 4 displays initial experimental results for pH determination of the test papers. All
papers except WPWL have very high pH levels due to the addition of calcium carbonate
as a filler material. All papers but WPWL remain chemically stable under accelerated
aging conditions. All papers tested free of lignin using the phloroglucinol indicator.
Though lignin-free, WPWL has no buffer additives to help stabilize the paper matrix. The
pH results correlate well with the physical testing results that suggest all of the copy
papers maintain strength and stability while WPWL is significantly affected by
accelerated aging.
Day
0
Day
28
Day
56
WPWL 7.38 6.90 5.10
Permanent 9.41 9.28 9.24
General 9.64 9.24 9.26
30% 9.61 9.08 9.46
50% 9.60 9.45 9.35
100% 9.46 9.33 9.20
Table 4. pH Results
As noted by McComb and Williams, recycled paper from alkaline paper were more akin
to the properties of virgin fiber papers. The data collected for this report indicate that
beyond just a furnish consisting of alkaline paper, an adequate alkaline reserve can
equally add to the chemical stability, and therefore the permanence, of a paper.

32
Statistical Correlation Between Properties
Hsu and Peruggia reviewed Tukey’s method for multiple comparisons used in statistical
packages such as Statistical Analysis Software 9.2 (SAS). Mean-mean scatter plots and
notched box-plots are described. This method was used to create Figure 2, which shows
five of the measured parameters plotted against one another.66
The clearest correlations
between physical and optical testing are between the data of CIE b* (blue-yellow) and
load at break (maximum load). Four individual groups are designated in Figure 3. Each
grouping includes a population of specimens that are not significantly different. WPWL
(Group 1), the permanent paper (Group 2), and 100% recycled content paper (Group 4)
are each very much their own species, defined by correlation of load at break with CIE b*
values. However, it is clear that the general paper, 30% recycled content, and 50%
recycled content copy papers (Group 3) are very similar in strength and color and should
not be read as being statistically separable given these parameters.
As previously stated, one of the goals of this research is to determine if a less invasive
method of analysis such as optical testing can be used to determine physical
characteristics. Although a strong correlation does exist between the CIE b* values and
the load at break values for the three copy papers of Group 3, optical testing results are
not sufficient to determine physical characteristics.
66
Hsu, J.C. and M. Perguggia, Graphical Representations of Tukey’s Multiple Comparison (1994)

33
Figure 2. SAS Scatter Plot Matrix

34
Figure 3. SAS Scatter Plot Correlating Data from Load at Break Values with CIE b*
Values
Figure 3 illustrates the correlation between b* values and load at break values for the six
papers. Four distinct groupings can be pulled from the data. Group 3 includes the general
paper, the 30% recycled content, and the 50% recycled content copy papers. The results
for optical and physical testing are not significantly different between the general paper
and 30% recycled content papers, nor are the results between the 30% recycled content
and 50% recycled content papers. The four groups are distinct from one another, and the
results of the individual tests support the conclusion illustrated by Figure 3.
Paper Morphology and Elemental Analysis (ESEM-EDS)
An FEI Quanta 600 Environmental Scanning Electron Microscopy (ESEM) was used to
image and observe paper morphology and structural differences for all six papers before
(control) and after 56 days of accelerated aging. The following photomicrographs show
the images of each paper before and after the experiment. Although the images offer a
good contrast between the reference and copy papers, it is difficult to discern any visual
change in the papers as a result of accelerated aging. In addition to the images, EDS
spectra of the elemental composition and mapping of elemental distribution of the papers
are included.
Loa
d a
t B
rea
k (
N)
CIE b* Values
Wood Pulp
Waterleaf
Permanent Copy Papers
100% Recycled
fiber Copy Paper
High
Tensile
Strength
Low
Tensile
Strength
More Blue More Yellow
Gen
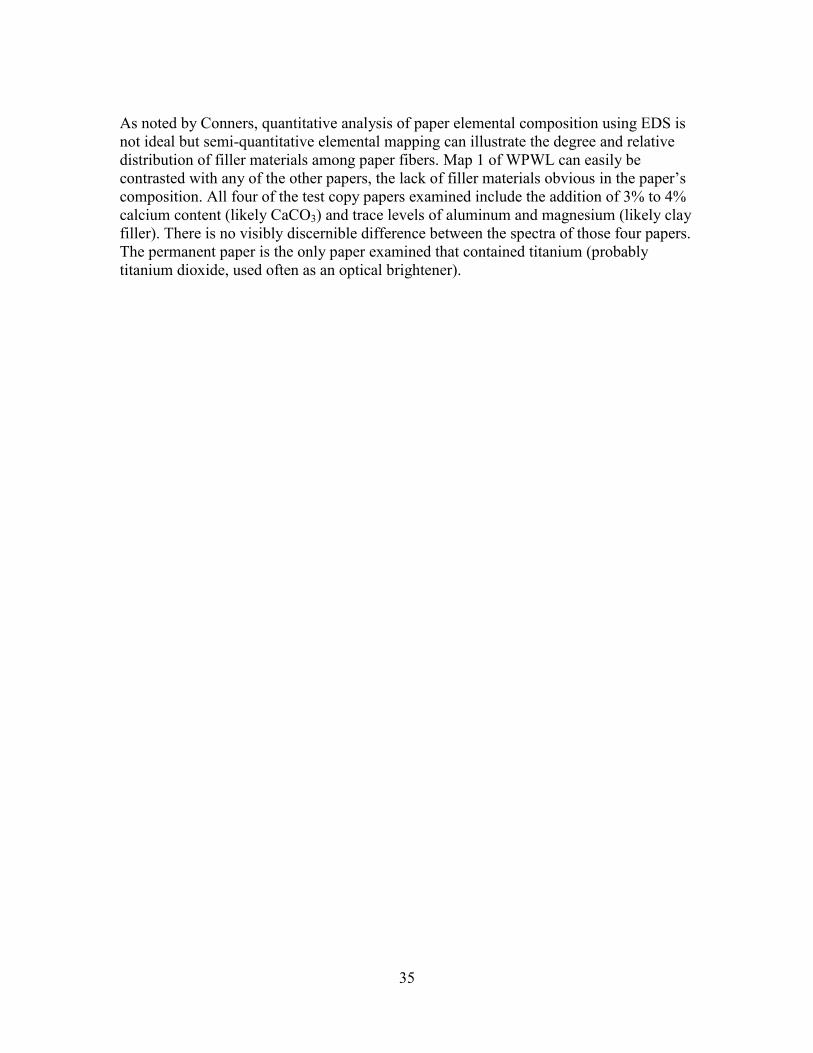
35
As noted by Conners, quantitative analysis of paper elemental composition using EDS is
not ideal but semi-quantitative elemental mapping can illustrate the degree and relative
distribution of filler materials among paper fibers. Map 1 of WPWL can easily be
contrasted with any of the other papers, the lack of filler materials obvious in the paper’s
composition. All four of the test copy papers examined include the addition of 3% to 4%
calcium content (likely CaCO3) and trace levels of aluminum and magnesium (likely clay
filler). There is no visibly discernible difference between the spectra of those four papers.
The permanent paper is the only paper examined that contained titanium (probably
titanium dioxide, used often as an optical brightener).

36
Image 1. ESEM micrographs of WPWL at 500x; unaged (top) and aged (botom)
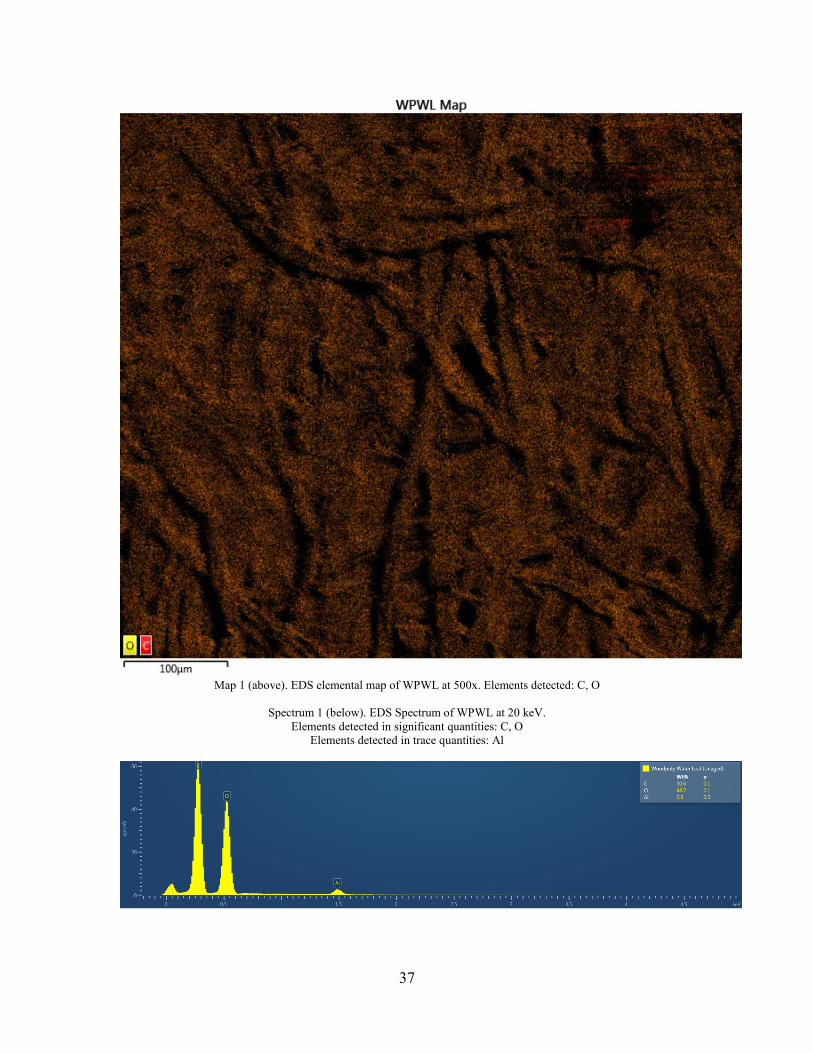
37
Map 1 (above). EDS elemental map of WPWL at 500x. Elements detected: C, O
Spectrum 1 (below). EDS Spectrum of WPWL at 20 keV.
Elements detected in significant quantities: C, O
Elements detected in trace quantities: Al

38
Image 2. ESEM micrographs of the permanent paper at 500x; unaged (top) and aged (botom)
Permanent
Permanent

39
Map 2 (above). EDS elemental map of the permanent paper at 500x. Elements detected: C, O, Al, Ca, Ti
Spectrum 2 (Below). EDS spectrum of the permanent paper at 20 keV.
Elements detected in significant quantities: O,C
Elements detected in trace quantities: Al, Ti, Si, Ca, Mg, Na
Permanent
Permanent

40
Image 3. ESEM micrographs of the general use copy paper at 500x; unaged (top) and aged (botom)
General
General

41
Map 3 (above). EDS elemental map of the general use copy paper at 500x. Elements detected: C, O, Ca
Spectrum 3 (below). EDS spectrum of the general use copy paper at 20 keV.
Elements detected in significant quantities: O, C, Ca
Elements detected in trace quantities: Al, Na, Mg, Cl, Si, S
General
General

42
Image 4. ESEM micrographs of 30% recycled paper at 500x; unaged (top) and aged (botom)

43
Map 4 (above). EDS elemental map of 30% recycled paper at 500x. Elements detected: C, O, Ca
Spectrum 4 (below). EDS spectrum of 30% recycled paper at 20 keV.
Elements detected in significant quantities: O, C,Ca
Elements detected in trace quantities: Na, Al, Mg, Cl, Si

44
Image 5. ESEM micrographs of 50% recycled paper at 500x; unaged (top) and aged (botom)
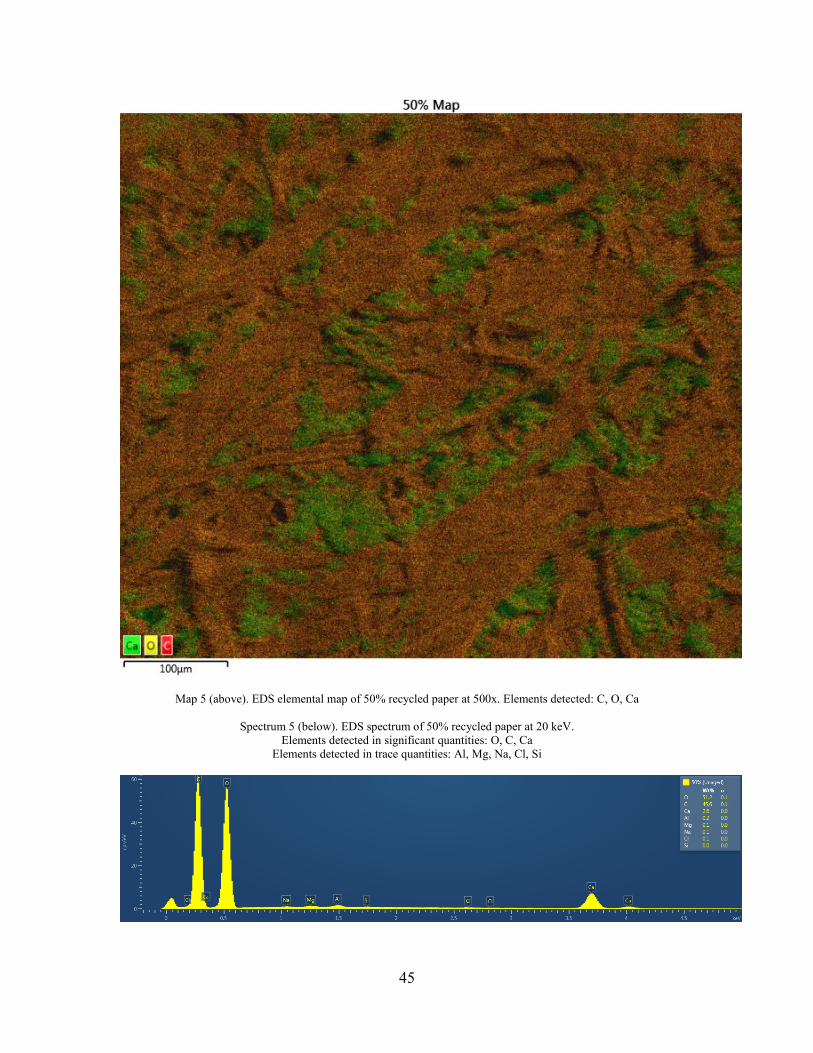
45
Map 5 (above). EDS elemental map of 50% recycled paper at 500x. Elements detected: C, O, Ca
Spectrum 5 (below). EDS spectrum of 50% recycled paper at 20 keV.
Elements detected in significant quantities: O, C, Ca
Elements detected in trace quantities: Al, Mg, Na, Cl, Si

46
Image 6. ESEM micrographs of 100% recycled paper at 500x; unaged (top) and aged (bottom)

47
Map 6 (above). EDS elemental map of 100% recycled paper at 500x. Elements Detected: C, O, Ca
Spectrum 6 (below). EDS spectrum of 100% at 20 keV.
Elements detected in significant quantities: O, C, Ca
Elements detected in trace quantities: Al, Na, Mg, Si, Cl, S

48
VIII. Conclusions
The primary requirements for paper permanence, as specified by ANSI/NISO, were
evaluated by PRTD staff using a number of laboratory techniques. As stated in the review
characterizing degradation in this report, durability is the ability to resist change during
use while permanence is focused on the required outcome. Accelerated aging was used in
the experimental design to rate the performance of four test papers and two reference
papers in terms of observable physical, optical, and chemical changes. Several observed
phenomena support the notion that papers made with recycled fibers can and should be
considered permanent. All copy papers in this report passed the criteria outlined by
ANSI/NISO. Only the reference paper WPWL failed the double fold test, and failed only
after 49 days of accelerated aging. WPWL was the only test paper in this report that
contained no additives or fillers, suggesting that the addition of fillers such as calcium
carbonate increased pH levels (reducing acidity) and aided the strengthening of the
chemical stability of the paper matrix.
There was no statistically significant difference between the test results for the general
use paper and 30% recycled content papers, nor was there a significant difference
between the results for 30% recycled content and 50% recycled content papers in terms
of the physical, optical, or chemical parameters. There was a statistically significant
difference between 100% recycled content paper and all other copy papers looked at in
this study for all parameters. Similarly, there was a statistically significant difference
between the permanent paper and WPWL. A correlation plot of the data from CIELAB
*b values versus load at break values clearly illustrated that the papers fell into four
distinct groups: WPWL (Group 1), permanent (Group 2), and 100% recycled content
paper (Group 4), all being distinctly different from the other three copy papers tested
(Group 3).
Accelerated aging caused significant difference in all properties of these papers between
day 0 and day 56 but did not result in significant difference between each interim interval
for the copy papers. Changes in paper performance over the course of 56 days of
accelerated aging, was not as significant as color change results may suggest. All papers
in this report showed a tendency to increase in the yellow direction of CIELAB color
space as a result of accelerated aging. The data from both color testing and brightness
measurements showed initial changes in optical properties but exhibited a “leveling off”
trend as the aging proceeded. This could be contrasted with tensile testing results that
suggested the papers were somewhat chemically stable and maintained tensile strength
throughout the course of the aging period tested.
Testing for pH of the papers in this study over the period tested, indicated that the copy
papers did not change chemically, despite the optical changes. This showed that for these
papers tested, paper yellowing was not necessarily an indication of chemical change and
did not result in increased brittleness for these papers. Surface examination of the papers
showed very little change to the physical composition of the fibers and fillers that
comprise the samples.

49
Alkaline? Lignin?
Tensile
Strength
Loss?
Color
Change?
Morphology
Change? Permanent?
WPWL No No Yes Yes No No
Permanent Yes No No Yes No Yes
General Yes No No Yes No Yes
30% Yes No No Yes No Yes
50% Yes No No Yes No Yes
100% Yes No No Yes No Yes
Table 5. Summary of results after 49 days of accelerated aging
IX. Recommendations
The research was restricted to papers of various recycled fiber content from one
manufacturer. Results can only be implied across the spectrum of recycled papers that are
commercially available. It is recommended that future research on this topic include the
examination of papers available from multiple manufacturers. Measurements of optical
properties revealed some interesting results and the role of the degradation rates of
optical brighteners should be studied to determine if that is the cause of the observed
color change. Additional pH testing and chemical analyses of molecular weight and
degree of polymerization will be useful in describing the differences among recycled
papers at the molecular level, providing a more direct measure of physical degradation to
the cellulose structure.

50
X. Bibliography
Bansa, H.: Accelerated Ageing of Paper: Some Ideas on its Practical Benefits.
Restaurator 23 (2002): 106-117.
Barbaric-Mikocevic, Z. et al: Office Papers Stability. DAAAM International Scientific
Book (2009): 333-340.
http://dx.doi.org/10.2507/daaam.scibook.2009.35
Batterham, I. and R. Rajani: A Comparison of Artificial Ageing with 27 years of Natural
Ageing. AICCM Book, Paper and Photographic Materials Symposium (2008).
Bell, N., J. Kolar & D. van der Reyden: Preservation in the Digital Age: A Discussion
about Conservation in Libraries and Archives. Getty Conservation Institute Newsletter,
Fall (2007).
Berns, R.S.: Billmeyer and Saltzman’s Principles of Color Technology (3rd
ed.). John
Wiley & Sons (2000).
Berndt, H. A Reexamination of Paper Yellowing and the Kubelka-Munk Theory. Historic
Textile and Paper Materials. American Chemical Society Symposium Series 410.
Washington, D.C. (1989).
Billington, James H. – The Librarian of Congress, Trudy Huskamp Peterson – Acting
Archivist of the United States, Michael F. Dimario – Public Printer: Final report to
Congress on the Joint Resolution to Establish a National Policy on Permanent Papers,
December 31(1995).
http://www.loc.gov/preservation/resources/care/perm/index.html
Bonham, J.S. and B. Rolniczak: Accelerated Ageing of Copy Papers Containing Recycled
fiber. APPITA Journal: Journal of the Technical Association of the Australian and New
Zealand Pulp and Paper Industry 59, Issue 5 (Sept 2006).
Brancato, A. A. Effect of Progressive Recycling on Cellulose Fiber Surface Properties.
Thesis for School of Chemical and Biomolecular Engineering, Georgia Institute of
Technology, December (2008).
Carter, H. A. The Chemistry of Paper Preservation Part 2. The Yellowing of Paper and
Conservation Bleaching. Journal of Chemical Education. Vol. 73, No. 11, November
(1996).
Caulfield, D.F. and D.E. Gunderson: Paper Testing and Strength Characteristics. TAPPI
proceedings of the 1988 Paper Preservation Symposium (1988): 31-40.
Conners, T.E. and S. Banerjee (editors): Surface Analysis of Papers. CRC Press, Boca
Raton, FL (1995).
51
Diniz, J.M.B. Fernandes, M.H. Gil, and J.A.A.M. Castro: Hornification—Its Origin and
Interpretation in Wood Pulps. Wood Science Technology, 37 (2004) 489-494.
Doshi, M. (editor): Recycled Paper Technology: An Anthology of Published Papers.
TAPPI Press, Atlanta (1994).
Feller, R.L. Accelerated Aging: Photochemical and Thermal Aspects. The J. Paul Getty
Trust, (1994).
Feller, R.L.: Comments on the Measurement of “Yellowness” in Pulp and Paper. Based
on remarks made at a special morning session of the Book and Paper Group at the AIC
Annual Meeting , Vancouver, May (1987).
http://cool.conservation-us.org/coolaic/sg/bpg/annual/v06/bp06-04.html
France, F. and M. Kullman: Recycled Paper Research at the Library of Congress.
International Preservation News (2009), 48: 10-15.
Graminski, E.L. Stress-Strain Behavior of accelerated and Naturally Aged Papers.
TAPPI (1970), 53 (3): 406-410.
Hsu, J.C. and M. Perguggia: Graphical Representations of Tukey’s Multiple Comparison
Method. Journal of Computational and Graphical Statistics 3 (1994): 143-161.
Huten, I.M.: Recycle Paper—An Overview. IPST Technical Paper Series Number 603
(1996).
Howard, R.C.: The Effects of Recycling on Paper. Journal of Pulp and Paper Science 16
(5): J 143- 149 1990.
Johnston-Feller, R.: Color Science in the Examination of Musum Objects: Nondestructive
Procedures. The Getty Conservation Institute, Los Angeles (2001)
Letnar, .C. and J. Vodopivec: Influence of Paper Raw Materials and Technological
Conditions of Paper Manufacture on Paper Ageing. Restaurator 18 (1997): 73-91.
Lewin, M. (editor): Handbook of Fiber Chemistry.Taylor & Francis Group, Boca Raton,
FL (2007).
McComb, R.E. and J. C. Williams: The Value of Alkaline Papers for Recycling. TAPPI
(1981) 93-96.
McKee, R.C.: Effect of Repulping on Sheet Properties & Fiber Characteristics. Paper
Trade Journal, 155 (21): (1971) 34-40.

52
McKee, R.C.: A Study of the Effect of Repulping on Fiber Properties and Sheet Strengths.
Project 1850-3, Report to the Jute Research Group of the Institute of Paper Chemistry,
November (1955).
McKinney, R.W.J (editor): Technology of Paper Recycling. Blackie Academic and
Professional, Glagow (1995).
Merlani, A.L., M. Missori, P.F. Munafo, M. Righini, S. Selci & M.S. Storace: Optical
Spectroscopy Results on the Discoloration of Paper Samples. Paper as a Medium of
Cultural Heritage (2002).
Morton, W. E. & Hearle, J. W. S.: Physical Properties of Textile Fibres. The Textile
Institute, Manchester, UK (1975).
Nazhad, M. M.: Fundamentals of Strength Loss in Recycled Paper. Thesis for the
Department of Forestry, University of British Columbia, December (1994).
Nissan, A.H.: Retrospect and Prospect of Physical and Mechanical Testing of Paper and
Paperboard. Handbook of Physical and Mechanical Testing of Paper and Paerboard, vol.
1. Richard E. Mark, editor. New York and Basel, MarcelDekker Inc. (1983).
Okayama, T., Goto, T., Higashiyama, H., Matsida, T.: Estimating Degradation Behavior
of Recycled Pulp-Containing Papers by Accelerated Aging Tests. TAPPI Peers
Conference (2010).
Porck, H.J.: Rate of Paper Degradation: The Predictive Value of Artificial Aging Tests.
Report for European Commission on Preservation and Access, Amsterdam (2000).
Rosato, D.V. Nonwoven Fibers in Reinforced Plastics. Industrial and Engineering
Chemistry Vol. 54, No. 8 (1962).
Schanda, J. (editor): Colorimetry. John Wiley & Sons, Hoboken, N.J. (2007).
Shahani, C.J.; Lee, S.B.; Hengemihle, F.H.; Harrison, G; Song, P.; Sierra, M.L.; Ryan,
C.C.; Weberg, N. Accelerated aging of paper: I: Chemical analysis of degradation
products, II: Application of Arrhenius relationship, III: Proposal for a new accelerated
aging test. Preservation Research and Testing Division, Library of Congress, Washington,
DC; June 2000. Available from the American Society for Testing and Materials (ASTM).
Sutjipto, E.R., K. Li, S. Pongpattanasuegsa & M.M. Nazhad: Effect of Recycling on
Paper Properties. Technical Association of the Pulp and Paper Mill of Southern Africa
(TAPPSA) (2007).
http://www.tappsa.co.za/archive3/Journal_papers/Effect_of_recycling_on_paper_p/effect
_of_recycling_on_paper_p.html

53
Thompson, C.G. Recycled Papers: The Essential Guide. The MIT Press, Boston, M.A.
(1992).
Tumosa, C.S., D. Erhardt, K. Hufford, and E. Quasney: The Deterioration of Newsprint
and Implications for Its Preservation. WAAC Newsletter, Vol. 30, No. 3 September 2008.
Van den Akker, J.A. Structure and Tensile Characteristics of Paper. TAPPI (1970) 388-
400.
Van der Reyden, D. Recent Scientific Research in paper Conservation. Journal of the
Ameri.can Institute for Conservation. American Institute for Conservation of Historic and
Artistic Works, Washington D.C. (1992).
Wu, Z., S. Chen & H. Tanaka: Effects of Recycled fiber on Paper Permanence. J Fac
Agric Kyushu Univ 44 (1999): 111-117.
Wu, Z. & H. Tanaka. Permanence of Wood-Free Paper I: Paper-Making Additives in
Naturally Degraded Wood-Free Fibers. J Wood Sci (1998) 44: 111-115
Yamagishi, Y. and R. Oye, Influence of recycling on Wood Pulp Fibers—Changes in
Properties of Wood Pulp Fibers with Recycling, Japan TAPPI 35(9) (1981) 33-43.
Zou, X., T. Uesaka & N. Gurnagul: Prediction of Paper Permanence by Accelerated
Aging I. Kinetic Analysis of the Aging Process. Cellulose (1996) 3, 243-267.
Zou, X., T. Uesaka & N. Gurnagul: Prediction of Paper Permanence by Accelerated
Aging II. Comparison of the Predictions with Natural Aging Results. Cellulose (1996) 3,
269-279.