recurrent subgraph prediction
TRANSCRIPT
Recurrent Subgraph PredictionSaurabh Nagrecha
Dept. of Computer Science and Engg.,iCeNSA
University of Notre Dame,Notre Dame, IN, USA.
email: [email protected]
Nitesh V. ChawlaDept. of Computer Science and Engg.,
iCeNSAUniversity of Notre Dame,
Notre Dame, IN, USA.email: [email protected]
Horst BunkeInstitute of Computer Science
and Applied Mathematics,University of Bern,Neubruckstrasse 10,
CH-3012 Bern, Switzerland.email: [email protected]
Abstract—Interactions in dynamic networks often transcendthe dyadic barrier and emerge as subgraphs. The evolution ofthese subgraphs cannot be completely predicted using a pairwiselink prediction analysis. We propose a novel solution to theproblem—“Prediction of Recurrent Subgraphs (PReSub)” whichtreats subgraphs as individual entities in their own right. PReSubpredicts re-occurring subgraphs using the network’s vector spaceembedding and a set of “early warning subgraphs” which actas global and local descriptors of the subgraph’s behavior.PReSub can be used as an out-of-the-box pipeline methodwith user-provided subgraphs or even to discover interestingsubgraphs in an unsupervised manner. It can handle missingnetwork information and is parallelizable. We show that PReSuboutperforms traditional pairwise link prediction for a varietyof evolving network datasets. The goal of this framework isto improve our understanding of subgraphs and provide analternative representation in order to characterize their behavior.
Index Terms—Network Science, Methods and Algorithms,Frequent Pattern Mining, Mining Graphs
I. INTRODUCTION
In many cases—like modeling influence within socialnetworks [1], inferring attacks on anonymized social net-works [2], functional discovery in biological networks [3]—it is of interest to find whether certain repeatedly observedinteraction patterns between multiple network elements willreoccur or not in a given future network. It could be assimple as a friend sending out texts to multiple people to havebrunch every Saturday morning, or a complicated hierarchicalinteraction nexus within a corporation occurring before everyquarterly meeting. It is important to predict the occurrence ofsuch key subgraphs within a given time window in the futureand not just predicting individual links.
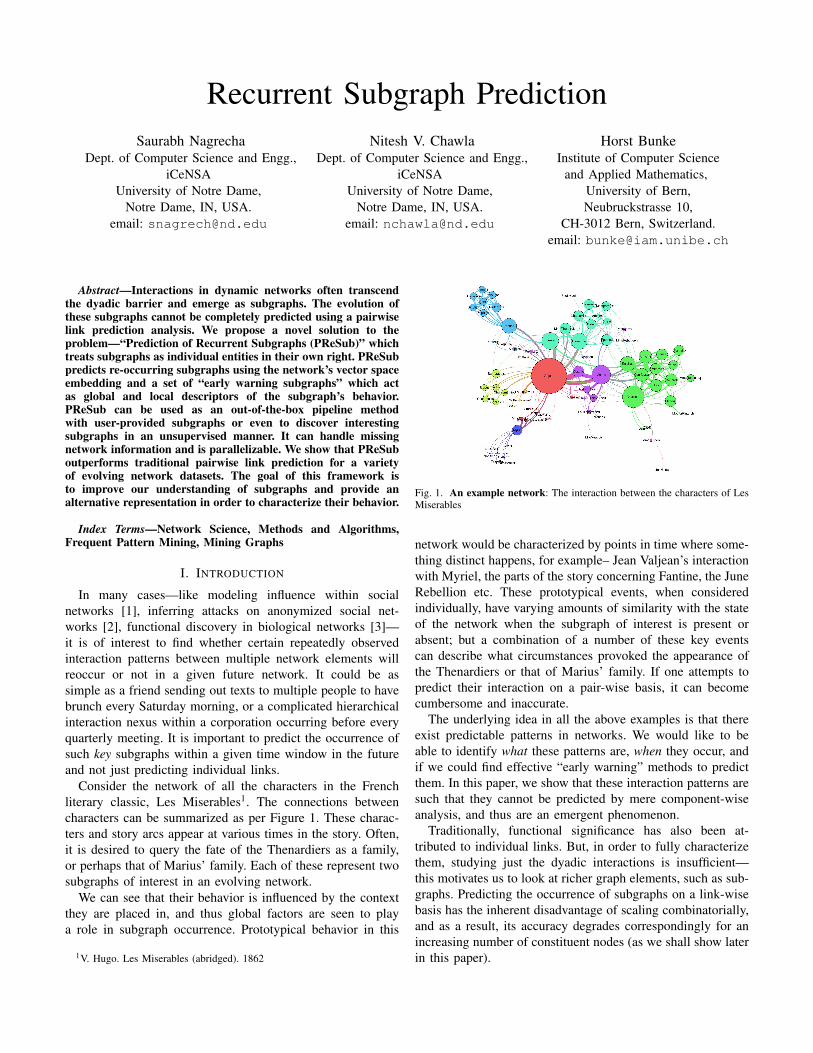
Consider the network of all the characters in the Frenchliterary classic, Les Miserables1. The connections betweencharacters can be summarized as per Figure 1. These charac-ters and story arcs appear at various times in the story. Often,it is desired to query the fate of the Thenardiers as a family,or perhaps that of Marius’ family. Each of these represent twosubgraphs of interest in an evolving network.
We can see that their behavior is influenced by the contextthey are placed in, and thus global factors are seen to playa role in subgraph occurrence. Prototypical behavior in this
1V. Hugo. Les Miserables (abridged). 1862
Fig. 1. An example network: The interaction between the characters of LesMiserables
network would be characterized by points in time where some-thing distinct happens, for example– Jean Valjean’s interactionwith Myriel, the parts of the story concerning Fantine, the JuneRebellion etc. These prototypical events, when consideredindividually, have varying amounts of similarity with the stateof the network when the subgraph of interest is present orabsent; but a combination of a number of these key eventscan describe what circumstances provoked the appearance ofthe Thenardiers or that of Marius’ family. If one attempts topredict their interaction on a pair-wise basis, it can becomecumbersome and inaccurate.
The underlying idea in all the above examples is that thereexist predictable patterns in networks. We would like to beable to identify what these patterns are, when they occur, andif we could find effective “early warning” methods to predictthem. In this paper, we show that these interaction patterns aresuch that they cannot be predicted by mere component-wiseanalysis, and thus are an emergent phenomenon.
Traditionally, functional significance has also been at-tributed to individual links. But, in order to fully characterizethem, studying just the dyadic interactions is insufficient—this motivates us to look at richer graph elements, such as sub-graphs. Predicting the occurrence of subgraphs on a link-wisebasis has the inherent disadvantage of scaling combinatorially,and as a result, its accuracy degrades correspondingly for anincreasing number of constituent nodes (as we shall show laterin this paper).
Predictions
TargetSubgraph
t2t1 t3
B
A
C
D
B
A
C
D
B
A
C
D
B
A
C
D
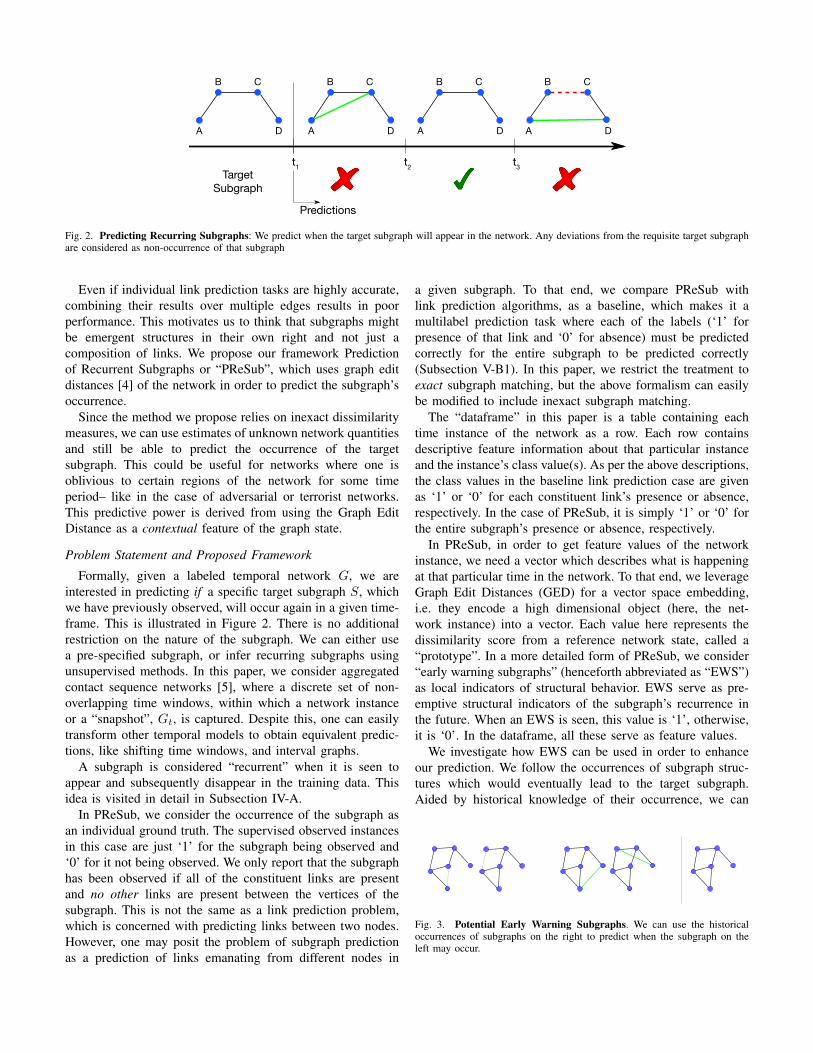
Fig. 2. Predicting Recurring Subgraphs: We predict when the target subgraph will appear in the network. Any deviations from the requisite target subgraphare considered as non-occurrence of that subgraph
Even if individual link prediction tasks are highly accurate,combining their results over multiple edges results in poorperformance. This motivates us to think that subgraphs mightbe emergent structures in their own right and not just acomposition of links. We propose our framework Predictionof Recurrent Subgraphs or “PReSub”, which uses graph editdistances [4] of the network in order to predict the subgraph’soccurrence.
Since the method we propose relies on inexact dissimilaritymeasures, we can use estimates of unknown network quantitiesand still be able to predict the occurrence of the targetsubgraph. This could be useful for networks where one isoblivious to certain regions of the network for some timeperiod– like in the case of adversarial or terrorist networks.This predictive power is derived from using the Graph EditDistance as a contextual feature of the graph state.
Problem Statement and Proposed Framework
Formally, given a labeled temporal network G, we areinterested in predicting if a specific target subgraph S, whichwe have previously observed, will occur again in a given time-frame. This is illustrated in Figure 2. There is no additionalrestriction on the nature of the subgraph. We can either usea pre-specified subgraph, or infer recurring subgraphs usingunsupervised methods. In this paper, we consider aggregatedcontact sequence networks [5], where a discrete set of non-overlapping time windows, within which a network instanceor a “snapshot”, Gt, is captured. Despite this, one can easilytransform other temporal models to obtain equivalent predic-tions, like shifting time windows, and interval graphs.
A subgraph is considered “recurrent” when it is seen toappear and subsequently disappear in the training data. Thisidea is visited in detail in Subsection IV-A.
In PReSub, we consider the occurrence of the subgraph asan individual ground truth. The supervised observed instancesin this case are just ‘1’ for the subgraph being observed and‘0’ for it not being observed. We only report that the subgraphhas been observed if all of the constituent links are presentand no other links are present between the vertices of thesubgraph. This is not the same as a link prediction problem,which is concerned with predicting links between two nodes.However, one may posit the problem of subgraph predictionas a prediction of links emanating from different nodes in
a given subgraph. To that end, we compare PReSub withlink prediction algorithms, as a baseline, which makes it amultilabel prediction task where each of the labels (‘1’ forpresence of that link and ‘0’ for absence) must be predictedcorrectly for the entire subgraph to be predicted correctly(Subsection V-B1). In this paper, we restrict the treatment toexact subgraph matching, but the above formalism can easilybe modified to include inexact subgraph matching.
The “dataframe” in this paper is a table containing eachtime instance of the network as a row. Each row containsdescriptive feature information about that particular instanceand the instance’s class value(s). As per the above descriptions,the class values in the baseline link prediction case are givenas ‘1’ or ‘0’ for each constituent link’s presence or absence,respectively. In the case of PReSub, it is simply ‘1’ or ‘0’ forthe entire subgraph’s presence or absence, respectively.
In PReSub, in order to get feature values of the networkinstance, we need a vector which describes what is happeningat that particular time in the network. To that end, we leverageGraph Edit Distances (GED) for a vector space embedding,i.e. they encode a high dimensional object (here, the net-work instance) into a vector. Each value here represents thedissimilarity score from a reference network state, called a“prototype”. In a more detailed form of PReSub, we consider“early warning subgraphs” (henceforth abbreviated as “EWS”)as local indicators of structural behavior. EWS serve as pre-emptive structural indicators of the subgraph’s recurrence inthe future. When an EWS is seen, this value is ‘1’, otherwise,it is ‘0’. In the dataframe, all these serve as feature values.
We investigate how EWS can be used in order to enhanceour prediction. We follow the occurrences of subgraph struc-tures which would eventually lead to the target subgraph.Aided by historical knowledge of their occurrence, we can
Fig. 3. Potential Early Warning Subgraphs. We can use the historicaloccurrences of subgraphs on the right to predict when the subgraph on theleft may occur.
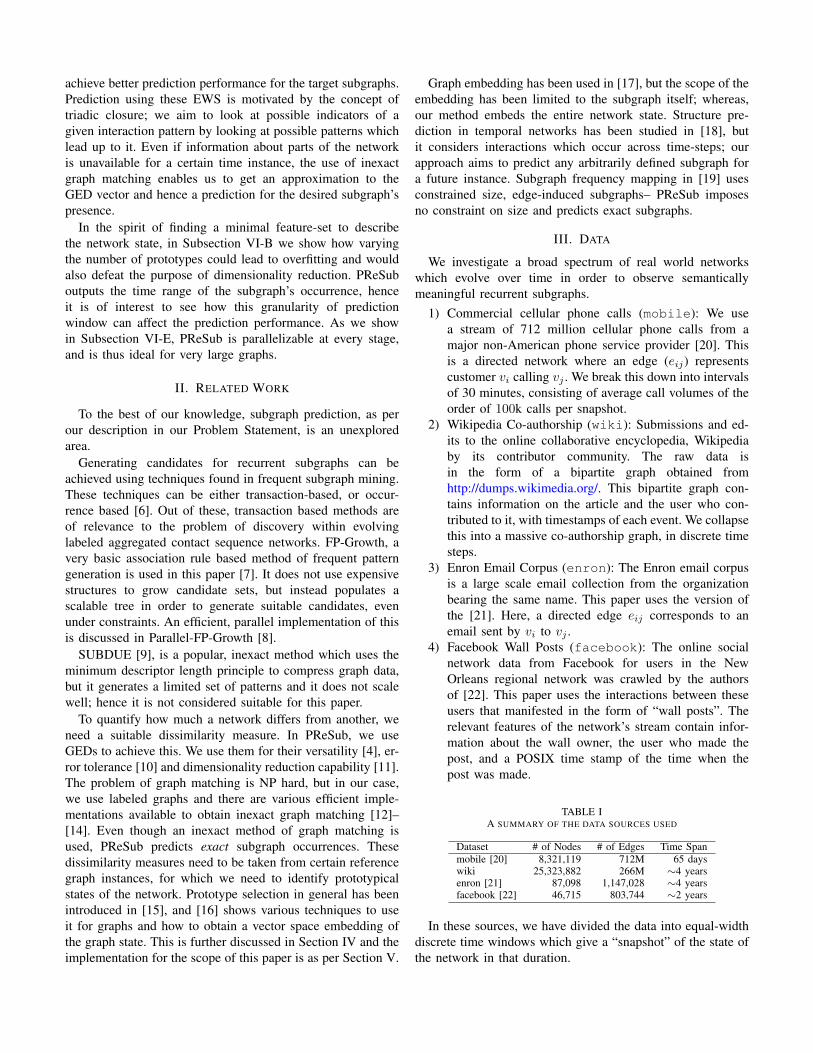
achieve better prediction performance for the target subgraphs.Prediction using these EWS is motivated by the concept oftriadic closure; we aim to look at possible indicators of agiven interaction pattern by looking at possible patterns whichlead up to it. Even if information about parts of the networkis unavailable for a certain time instance, the use of inexactgraph matching enables us to get an approximation to theGED vector and hence a prediction for the desired subgraph’spresence.
In the spirit of finding a minimal feature-set to describethe network state, in Subsection VI-B we show how varyingthe number of prototypes could lead to overfitting and wouldalso defeat the purpose of dimensionality reduction. PReSuboutputs the time range of the subgraph’s occurrence, henceit is of interest to see how this granularity of predictionwindow can affect the prediction performance. As we showin Subsection VI-E, PReSub is parallelizable at every stage,and is thus ideal for very large graphs.
II. RELATED WORK
To the best of our knowledge, subgraph prediction, as perour description in our Problem Statement, is an unexploredarea.
Generating candidates for recurrent subgraphs can beachieved using techniques found in frequent subgraph mining.These techniques can be either transaction-based, or occur-rence based [6]. Out of these, transaction based methods areof relevance to the problem of discovery within evolvinglabeled aggregated contact sequence networks. FP-Growth, avery basic association rule based method of frequent patterngeneration is used in this paper [7]. It does not use expensivestructures to grow candidate sets, but instead populates ascalable tree in order to generate suitable candidates, evenunder constraints. An efficient, parallel implementation of thisis discussed in Parallel-FP-Growth [8].
SUBDUE [9], is a popular, inexact method which uses theminimum descriptor length principle to compress graph data,but it generates a limited set of patterns and it does not scalewell; hence it is not considered suitable for this paper.
To quantify how much a network differs from another, weneed a suitable dissimilarity measure. In PReSub, we useGEDs to achieve this. We use them for their versatility [4], er-ror tolerance [10] and dimensionality reduction capability [11].The problem of graph matching is NP hard, but in our case,we use labeled graphs and there are various efficient imple-mentations available to obtain inexact graph matching [12]–[14]. Even though an inexact method of graph matching isused, PReSub predicts exact subgraph occurrences. Thesedissimilarity measures need to be taken from certain referencegraph instances, for which we need to identify prototypicalstates of the network. Prototype selection in general has beenintroduced in [15], and [16] shows various techniques to useit for graphs and how to obtain a vector space embedding ofthe graph state. This is further discussed in Section IV and theimplementation for the scope of this paper is as per Section V.
Graph embedding has been used in [17], but the scope of theembedding has been limited to the subgraph itself; whereas,our method embeds the entire network state. Structure pre-diction in temporal networks has been studied in [18], butit considers interactions which occur across time-steps; ourapproach aims to predict any arbitrarily defined subgraph fora future instance. Subgraph frequency mapping in [19] usesconstrained size, edge-induced subgraphs– PReSub imposesno constraint on size and predicts exact subgraphs.
III. DATA
We investigate a broad spectrum of real world networkswhich evolve over time in order to observe semanticallymeaningful recurrent subgraphs.
1) Commercial cellular phone calls (mobile): We usea stream of 712 million cellular phone calls from amajor non-American phone service provider [20]. Thisis a directed network where an edge (eij) representscustomer vi calling vj . We break this down into intervalsof 30 minutes, consisting of average call volumes of theorder of 100k calls per snapshot.
2) Wikipedia Co-authorship (wiki): Submissions and ed-its to the online collaborative encyclopedia, Wikipediaby its contributor community. The raw data isin the form of a bipartite graph obtained fromhttp://dumps.wikimedia.org/. This bipartite graph con-tains information on the article and the user who con-tributed to it, with timestamps of each event. We collapsethis into a massive co-authorship graph, in discrete timesteps.
3) Enron Email Corpus (enron): The Enron email corpusis a large scale email collection from the organizationbearing the same name. This paper uses the version ofthe [21]. Here, a directed edge eij corresponds to anemail sent by vi to vj .
4) Facebook Wall Posts (facebook): The online socialnetwork data from Facebook for users in the NewOrleans regional network was crawled by the authorsof [22]. This paper uses the interactions between theseusers that manifested in the form of “wall posts”. Therelevant features of the network’s stream contain infor-mation about the wall owner, the user who made thepost, and a POSIX time stamp of the time when thepost was made.
TABLE IA SUMMARY OF THE DATA SOURCES USED
Dataset # of Nodes # of Edges Time Spanmobile [20] 8,321,119 712M 65 dayswiki 25,323,882 266M ∼4 yearsenron [21] 87,098 1,147,028 ∼4 yearsfacebook [22] 46,715 803,744 ∼2 years
In these sources, we have divided the data into equal-widthdiscrete time windows which give a “snapshot” of the state ofthe network in that duration.

IV. METHODS
PReSub addresses the problem of subgraph prediction asper the modules defined in Subsection I. A preliminary step isto identify a subgraph of interest. If such a subgraph is alreadyprovided, then we can safely ignore this step. To build a con-textual “story” around the evolution of the network over time,we identify several key prototypical graph instances usingunsupervised methods [4]. We obtain the feature values usingthe techniques mentioned below and populate the dataframe.Each instance is labeled by occurrence or non-occurrence ofthe target subgraph. Using this calculated dataframe, we trainon past data and predict whether a subgraph will reappear ornot in the given test instance.
A. From “Frequent” Subgraphs to “Recurrent” SubgraphsFrequent subgraph mining aims to discover subgraphs in a
given dataset, whose occurrence exceeds a specified thresh-old [6]. We use FP Growth [7] in order to identify frequentlyoccurring subgraphs.
It is to be noted that the most frequent links in the networkneed not be the most informative. These may as well becharacterized as “background noise”. We posit that the keyto considering a particular link as background noise is not inthe occurrence frequency, but in the recurrence frequency.
In order to obtain interesting subgraphs in an unsupervisedmanner, we propose a transformation of the frequent subgraphprediction problem. Instead of counting each item’s occur-rence, we count the item’s “re-occurrence”. We do this withthe below example in mind:
Say we observe the network over various edge-list snapshotsas below:
G1 = {l1, l2, l3} G2 = {l2, l3, l4}G3 = {l1, l2, l4} G4 = {l1, l2, l3}
We see that l1 disappears in time instance 2 and reappearsin time instance 3. Similarly, l3 disappears in instance 3and reappears in instance 4. Since these re-occurrences arewhat interest us, we transform the itemsets to only containthose items which are reoccurring after deletion – i.e. convertthe network snapshots to display only the links which arereoccurring after prior deletion. So, for the above toy example,we get
G′1 = {} G′2 = {}G′3 = {l1} G′4 = {l3}
Notice that we have itemsets which are now smaller andmore relevant to the problem of recurrence. We can nowperform association rule mining on the links that we have nowobtained. The most frequent itemsets that we get as a solutionof this problem are really just the most “recurrent” subgraphs.
A subgraph’s recurrence frequency is the recurrence fre-quency of the least frequent link in it. By this argument, fromthe distribution of link recurrence thus obtained in Figure 4,we extract three subgraphs with varying amounts of recurrenceto demonstrate the power of PReSub. As we can see, very fewlinks, and as a result subgraphs, reoccur frequently.
Fig. 4. Distribution displaying the recurrence frequency of links. Theminimum support of a constituent link in a subgraph dictates the entiresubgraph’s recurrence frequency. We extract three such subgraphs fromextreme values of minimum support. Since these subgraphs are diverse intheir recurrence frequency, we see how our framework performs in terms ofpredicting their recurrence in Subsection VI-C.
B. Graph Edit Distance and Prototypes
In order to obtain a reduced dimensional picture of thegraph, we use a graph kernel to implement vector space em-bedding [4]. Borrowing from the field of pattern recognition,Graph Edit Distances (GED) [10] from a selection of prototypegraphs to the graph’s state are used in order to characterizeeach graph’s state in time. The GEDs thus obtained are thenused as features to predict subgraph occurrence.
C. Graph Dissimilarity Measures for Embedding
To achieve a representation of the changing graph structure,in the domain of graphs, the notion of proximity is more funda-mental than that of a feature or a class [15]. When dealing withstructural data, like graphs, it is difficult and unmanageable toextract numerical features, whereas proximity measures can beevaluated from the data using dissimilarity measures. GED is aflexible, error tolerant mechanism to measure the dissimilaritybetween two graphs. Here we use it in the context of labeleddirected graphs.
We consider a labeled set of sample graphs T ={g1, ..., gn}, and a graph dissimilarity measure d : G×G→ R.In this problem, we use GED as the dissimilarity measureas motivated by the previous section. From the set of nlabeled graphs, we select a set P = {p1, ...pm} of m ≤ nprototype graphs. This leads to m dissimilarities of the formdi = d(g, pi), which can be arranged in an m-dimensionalvector [d1, ..., dm]. So, in this way, an entire graph can betransformed into a vector of real numbers.
Calculating GED requires us to find the minimal commonsubgraph (MCS) between two networks. Finding an MCS is aknown NP-hard problem; but in our case, we can make somesimplifications based on the network having non-empty (V 6=φ) instances with statically-labeled nodes and edges. Since

tn-1 tn tn+1
P1
dn-1,1
dn-1,2
dn-1,3
dn-1,m
...
GED feature vectors for each network instance
dn+1,1
dn+1,2
dn-1,3
dn-1,m
...
dn,1
dn,2
dn,3
dn,m
...
tn-1 tn tn+1
Observed network instances
Prototype networks
Networks defining convex hull
P3
P2tn
dn,1
dn,2
dn,3
Fig. 5. A pictorial summary of the vector space embedding. Networks areextracted at consecutive time windows. The training set defines the convexhull of all possible graphs that the system can predict. “m” prototype graphs(denoted as Pi) are selected from within this space. At each instance, t =tn, Graph Edit Distances (GEDs) of each of these networks from the set ofprototype graphs are calculated and considered as features in the vector spaceembedding. The states represented by the GEDs can be used to predict thenext state of the subgraph.
the set of nodes and node labels does not change, we have arelatively simplified problem.
We could also use a Levenshtein distance based implemen-tation of finding GED [14]. This treats the edit distance asan equivalent problem to finding the dissimilarity betweenpairwise strings. This would be an inexact measure, but itoperates in near-linear time and would thus be computationallyfavorable.
D. Prototype selection
For the purposes of PReSub, we use Border, Random orTargetsphere prototype selection.
Intuitively one can imagine the measures obtained againstthese prototypes to be “location triangulations” of the graph’s(dynamic) state in the space of all graphs G. The space ofall graphs is the space defined in the R|V |×|E| domain whichencompasses all the possible states the graph can attain. Theprototypes are graphs within this space, against which thedistance of the graph’s state is measured so as to ascertainits state in the domain. A simple two dimensional analogue ofthis is as depicted in Figure 5.
V. PREDICTING SUBGRAPHS ON REAL WORLDNETWORKS
We demonstrate the effectiveness of PReSub on a varietyof real world social networks as described in Section III.These networks are diverse in terms of origin, task size2, andtemporal activity.
A. Features Used
a) PReSub: We see that GEDs are vector space embed-dings of the entire network’s state, which means they canprovide global contextual information about the network’sstate. The specific components of the GEDs attempt to providea minimum descriptor of the particular graph’s state usingdistances from the prototypes. Each of these GEDs is usedas a feature under PReSub.
b) PReSub + Early Warning Subgraphs: In addition tothe above “vanilla” version, we can use the occurrence of“early warning” subgraphs (EWS) in order to predict thatof the target subgraph. In the same spirit as that of “triadicclosure”, we suggest that we use the historic occurrences ofthose recurrent subgraphs which are a few edges short ofthe target structure. Here, we consider those subgraphs whichdiffer from the original subgraph by one edge as candidatesfor being EWS. Whenever the target subgraph is present, theEWS’ will be considered as ‘present’, since they are edgeinduced subgraphs of the target subgraph. For the instanceswhere it is not present, these EWS’ indicate a build-up leadingto the appearance of the target subgraph. This is displayed inFigure 3. We use the historic occurrence of these EWS’ inconjunction with the GEDs as the feature set.
B. Prediction Evaluation
The task is to predict whether a target subgraph occurs in atime-frame. We have three comparative approaches – baselinelink prediction, PReSub, and PReSub+EWS.
1) Using Baseline Link Prediction: For the baseline ap-proach, we use conventional link prediction methods with theentire target subgraph S = (VS , ES) in mind. Consider theclique Gcl = (VS , Ecl) formed by all of the vertices in S,this contains two types of links– those which occur in S, andthose which do not. If we are to predict the occurrence of S,we have to predict not only the occurrence of ES , but alsothe non-occurrence of the links in E′S = Ecl − ES . For this,we have a ground truth observation for each individual link.If any one link is misclassified, then the prediction is deemedto have been misclassified.
At each time instance, we perform a link prediction on eachof the constituent links in ES and E′S . We now have the scorespertaining to both of these sub-problems over all the observedexamples, henceforth referred to as training instances. Foreach of them, we only consider the subgraph to be predicted tooccur if and only if all the links in ES are present and those inE′S are absent. In a correctly predicted case, we would expect
2Here, the task size of the subgraph refers to the number of link predictiontasks associated with it. This is equal to the number of edges in the cliqueformed by the constituent nodes of the subgraph.

Fig. 6. Triadic Closure as a special case. Triadic closure could be explainedusing early warning subgraphs as features.
all the links in ES to be predicted as present and those in E′Sas absent.
We use the comprehensive solution LPmade [23] in orderto perform all the baseline experiments required for this paper.The LPmade paper also contains detailed information onparticular link prediction techniques.
2) PReSub: We train on the initial instances in order toinfer the prototypes. Each of the training instances contributesto defining the convex hull, from within which the prototypesare selected. Prototype selection is done using any of thevarious methods listed in Subsection IV-D. Using these proto-types, the GEDs to all the graphs at various time instances areevaluated. It is to be noted that GEDs to all the graphs withinthe training data all confirm to locations within the convexhull, by definition; but the test instances are not subject tothis constraint. We treat these GEDs from the training datain conjunction with the historical subgraph information assupervised instances of time series data.
Along the lines of High Performance Link Prediction(HPLP) [20], we use random forests as our classificationtechnique. It can be effectively parallelized and mitigates theproblem of feature selection upfront.
C. PReSub + EWS
Leaning on the triadic closure theory, we choose our EWSas those which occur in a ‘V’-shaped configuration betweenthe three constituent nodes. Thus, our EWS features are theoccurrences of these V-shaped subgraphs.
VI. RESULTS
We report our results using ROC curves and AUROC. Inaddition to the breadth of datasets we cover, we explore theeffects of varying the task size of the subgraph, prototypeselection methods, and the number of prototypes used.
A. AUROC Performance
We see that when pitted against the best performing con-ventional link prediction method, PReSub shows a markedimprovement overall which is reflected in the AUROCs. Theaddition of Early Warning Subgraphs makes the performanceeven better, since we now have a richer blend of local (EWS)and global (GEDs) features to learn on.
Our method, which relies on GEDs, is relatively immune tothe effects of such degradation. As can be seen in comparisonwith the conventional link prediction method in Figure 7, itconfirms that the degradation of performance for link predic-tion methods is markedly significant. This is due to the factthat as the subgraph increases in task size, the performancefor the baseline pair-wise prediction plummets. Since the tasksize increases as O(Nnodes
2), where Nnodes is the number ofnodes in the target subgraph, this is to be expected.
If our target subgraph is a triad, like in the case of theenron network, one can use various EWS in order to predictits occurrence. We use PReSub, equipped with EWS’ whichare these particular V-shaped subgraphs. These subgraphsshould be able to predict when the triangle between the threenodes should close. We obtain an AUROC of 0.880 usingPReSub, whereas PReSub+EWS results in an AUROC of0.943 for the same subgraphs.
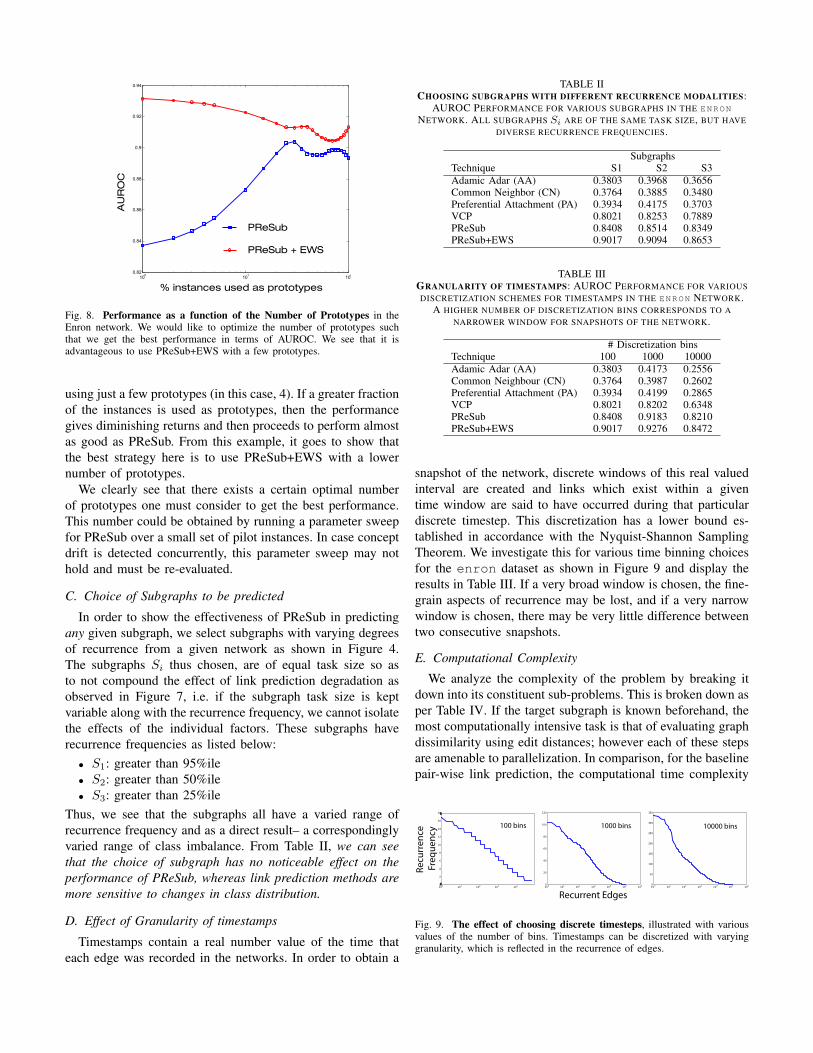
B. Choice of Number of Prototypes
Using a range of prototypes, we plot the AUROC perfor-mance obtained in the case of PReSub and PReSub+EWSwith the goal of finding how the number of prototypes affectsprediction performance and what is the number of prototypesone should consider. The latter is important to evaluate sinceour entire theme is motivated by finding a minimum set ofGED features which best describes the network state. The“best” feature set to describe the network state is the onewhich gives us the best AUROC performance, since that isour end-goal.
From Figure 8 we see that for PReSub, the performancegives diminishing returns upon increasing the number ofprototypes beyond 10 until a prohibitively high number ofprototypes is used (in this case, 70). If one were to use 70graphs out of 100 instances as prototype graphs, it woulddefeat the purpose of exploring subgraph evolution using justan initial prototype discovery phase. From the same figure,we also see that PReSub+EWS gives us the best performance
AURO
CPe
rform
ance
SubgraphSize
AACNVCP
PAPReSubPReSub + EWS
Fig. 7. Performance of the proposed methods versus baseline techniques.Only a representative set of baseline techniques has been displayed for clarity.The techniques are as per Tables II and III. Notably, VCP [24] comes closestto our performance.
PReSub
PReSub + EWS
% instances used as prototypes
AU
RO
C
Fig. 8. Performance as a function of the Number of Prototypes in theEnron network. We would like to optimize the number of prototypes suchthat we get the best performance in terms of AUROC. We see that it isadvantageous to use PReSub+EWS with a few prototypes.
using just a few prototypes (in this case, 4). If a greater fractionof the instances is used as prototypes, then the performancegives diminishing returns and then proceeds to perform almostas good as PReSub. From this example, it goes to show thatthe best strategy here is to use PReSub+EWS with a lowernumber of prototypes.
We clearly see that there exists a certain optimal numberof prototypes one must consider to get the best performance.This number could be obtained by running a parameter sweepfor PReSub over a small set of pilot instances. In case conceptdrift is detected concurrently, this parameter sweep may nothold and must be re-evaluated.
C. Choice of Subgraphs to be predicted
In order to show the effectiveness of PReSub in predictingany given subgraph, we select subgraphs with varying degreesof recurrence from a given network as shown in Figure 4.The subgraphs Si thus chosen, are of equal task size so asto not compound the effect of link prediction degradation asobserved in Figure 7, i.e. if the subgraph task size is keptvariable along with the recurrence frequency, we cannot isolatethe effects of the individual factors. These subgraphs haverecurrence frequencies as listed below:• S1: greater than 95%ile• S2: greater than 50%ile• S3: greater than 25%ile
Thus, we see that the subgraphs all have a varied range ofrecurrence frequency and as a direct result– a correspondinglyvaried range of class imbalance. From Table II, we can seethat the choice of subgraph has no noticeable effect on theperformance of PReSub, whereas link prediction methods aremore sensitive to changes in class distribution.
D. Effect of Granularity of timestamps
Timestamps contain a real number value of the time thateach edge was recorded in the networks. In order to obtain a
TABLE IICHOOSING SUBGRAPHS WITH DIFFERENT RECURRENCE MODALITIES:
AUROC PERFORMANCE FOR VARIOUS SUBGRAPHS IN THE ENRON
NETWORK. ALL SUBGRAPHS Si ARE OF THE SAME TASK SIZE, BUT HAVEDIVERSE RECURRENCE FREQUENCIES.
SubgraphsTechnique S1 S2 S3Adamic Adar (AA) 0.3803 0.3968 0.3656Common Neighbor (CN) 0.3764 0.3885 0.3480Preferential Attachment (PA) 0.3934 0.4175 0.3703VCP 0.8021 0.8253 0.7889PReSub 0.8408 0.8514 0.8349PReSub+EWS 0.9017 0.9094 0.8653
TABLE IIIGRANULARITY OF TIMESTAMPS: AUROC PERFORMANCE FOR VARIOUSDISCRETIZATION SCHEMES FOR TIMESTAMPS IN THE ENRON NETWORK.
A HIGHER NUMBER OF DISCRETIZATION BINS CORRESPONDS TO ANARROWER WINDOW FOR SNAPSHOTS OF THE NETWORK.
# Discretization binsTechnique 100 1000 10000Adamic Adar (AA) 0.3803 0.4173 0.2556Common Neighbour (CN) 0.3764 0.3987 0.2602Preferential Attachment (PA) 0.3934 0.4199 0.2865VCP 0.8021 0.8202 0.6348PReSub 0.8408 0.9183 0.8210PReSub+EWS 0.9017 0.9276 0.8472
snapshot of the network, discrete windows of this real valuedinterval are created and links which exist within a giventime window are said to have occurred during that particulardiscrete timestep. This discretization has a lower bound es-tablished in accordance with the Nyquist-Shannon SamplingTheorem. We investigate this for various time binning choicesfor the enron dataset as shown in Figure 9 and display theresults in Table III. If a very broad window is chosen, the fine-grain aspects of recurrence may be lost, and if a very narrowwindow is chosen, there may be very little difference betweentwo consecutive snapshots.
E. Computational Complexity
We analyze the complexity of the problem by breaking itdown into its constituent sub-problems. This is broken down asper Table IV. If the target subgraph is known beforehand, themost computationally intensive task is that of evaluating graphdissimilarity using edit distances; however each of these stepsare amenable to parallelization. In comparison, for the baselinepair-wise link prediction, the computational time complexity
100 bins 1000 bins 10000 bins
Recurrent Edges
Recu
rren
ce F
requ
ency
Fig. 9. The effect of choosing discrete timesteps, illustrated with variousvalues of the number of bins. Timestamps can be discretized with varyinggranularity, which is reflected in the recurrence of edges.
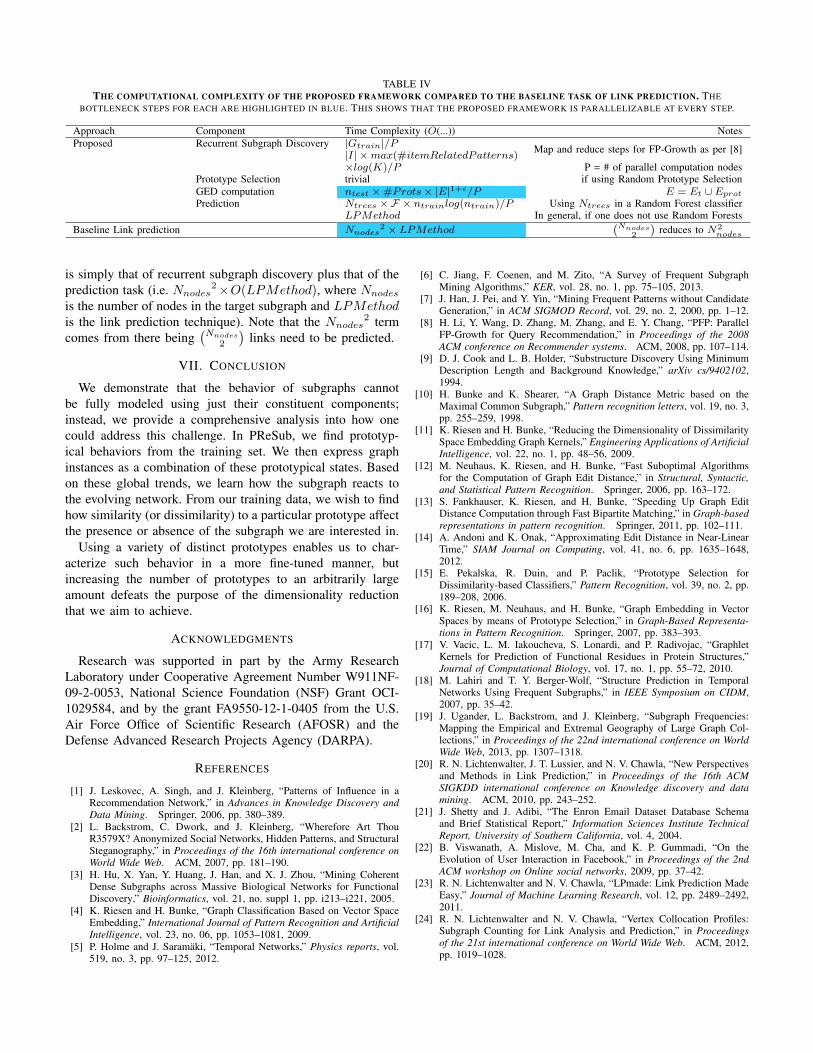
TABLE IVTHE COMPUTATIONAL COMPLEXITY OF THE PROPOSED FRAMEWORK COMPARED TO THE BASELINE TASK OF LINK PREDICTION. THE
BOTTLENECK STEPS FOR EACH ARE HIGHLIGHTED IN BLUE. THIS SHOWS THAT THE PROPOSED FRAMEWORK IS PARALLELIZABLE AT EVERY STEP.
Approach Component Time Complexity (O(...)) NotesProposed Recurrent Subgraph Discovery |Gtrain|/P
|I| ×max(#itemRelatedPatterns)Map and reduce steps for FP-Growth as per [8]
×log(K)/P P = # of parallel computation nodesPrototype Selection trivial if using Random Prototype SelectionGED computation ntest ×#Prots× |E|1+ε/P E = Et ∪ EprotPrediction Ntrees ×F × ntrainlog(ntrain)/P Using Ntrees in a Random Forest classifier
LPMethod In general, if one does not use Random ForestsBaseline Link prediction Nnodes
2 × LPMethod(Nnodes
2
)reduces to N2
nodes
is simply that of recurrent subgraph discovery plus that of theprediction task (i.e. Nnodes
2×O(LPMethod), where Nnodes
is the number of nodes in the target subgraph and LPMethodis the link prediction technique). Note that the Nnodes
2 termcomes from there being
(Nnodes
2
)links need to be predicted.
VII. CONCLUSION
We demonstrate that the behavior of subgraphs cannotbe fully modeled using just their constituent components;instead, we provide a comprehensive analysis into how onecould address this challenge. In PReSub, we find prototyp-ical behaviors from the training set. We then express graphinstances as a combination of these prototypical states. Basedon these global trends, we learn how the subgraph reacts tothe evolving network. From our training data, we wish to findhow similarity (or dissimilarity) to a particular prototype affectthe presence or absence of the subgraph we are interested in.
Using a variety of distinct prototypes enables us to char-acterize such behavior in a more fine-tuned manner, butincreasing the number of prototypes to an arbitrarily largeamount defeats the purpose of the dimensionality reductionthat we aim to achieve.
ACKNOWLEDGMENTS
Research was supported in part by the Army ResearchLaboratory under Cooperative Agreement Number W911NF-09-2-0053, National Science Foundation (NSF) Grant OCI-1029584, and by the grant FA9550-12-1-0405 from the U.S.Air Force Office of Scientific Research (AFOSR) and theDefense Advanced Research Projects Agency (DARPA).
REFERENCES
[1] J. Leskovec, A. Singh, and J. Kleinberg, “Patterns of Influence in aRecommendation Network,” in Advances in Knowledge Discovery andData Mining. Springer, 2006, pp. 380–389.
[2] L. Backstrom, C. Dwork, and J. Kleinberg, “Wherefore Art ThouR3579X? Anonymized Social Networks, Hidden Patterns, and StructuralSteganography,” in Proceedings of the 16th international conference onWorld Wide Web. ACM, 2007, pp. 181–190.
[3] H. Hu, X. Yan, Y. Huang, J. Han, and X. J. Zhou, “Mining CoherentDense Subgraphs across Massive Biological Networks for FunctionalDiscovery,” Bioinformatics, vol. 21, no. suppl 1, pp. i213–i221, 2005.
[4] K. Riesen and H. Bunke, “Graph Classification Based on Vector SpaceEmbedding,” International Journal of Pattern Recognition and ArtificialIntelligence, vol. 23, no. 06, pp. 1053–1081, 2009.
[5] P. Holme and J. Saramaki, “Temporal Networks,” Physics reports, vol.519, no. 3, pp. 97–125, 2012.
[6] C. Jiang, F. Coenen, and M. Zito, “A Survey of Frequent SubgraphMining Algorithms,” KER, vol. 28, no. 1, pp. 75–105, 2013.
[7] J. Han, J. Pei, and Y. Yin, “Mining Frequent Patterns without CandidateGeneration,” in ACM SIGMOD Record, vol. 29, no. 2, 2000, pp. 1–12.
[8] H. Li, Y. Wang, D. Zhang, M. Zhang, and E. Y. Chang, “PFP: ParallelFP-Growth for Query Recommendation,” in Proceedings of the 2008ACM conference on Recommender systems. ACM, 2008, pp. 107–114.
[9] D. J. Cook and L. B. Holder, “Substructure Discovery Using MinimumDescription Length and Background Knowledge,” arXiv cs/9402102,1994.
[10] H. Bunke and K. Shearer, “A Graph Distance Metric based on theMaximal Common Subgraph,” Pattern recognition letters, vol. 19, no. 3,pp. 255–259, 1998.
[11] K. Riesen and H. Bunke, “Reducing the Dimensionality of DissimilaritySpace Embedding Graph Kernels,” Engineering Applications of ArtificialIntelligence, vol. 22, no. 1, pp. 48–56, 2009.
[12] M. Neuhaus, K. Riesen, and H. Bunke, “Fast Suboptimal Algorithmsfor the Computation of Graph Edit Distance,” in Structural, Syntactic,and Statistical Pattern Recognition. Springer, 2006, pp. 163–172.
[13] S. Fankhauser, K. Riesen, and H. Bunke, “Speeding Up Graph EditDistance Computation through Fast Bipartite Matching,” in Graph-basedrepresentations in pattern recognition. Springer, 2011, pp. 102–111.
[14] A. Andoni and K. Onak, “Approximating Edit Distance in Near-LinearTime,” SIAM Journal on Computing, vol. 41, no. 6, pp. 1635–1648,2012.
[15] E. Pekalska, R. Duin, and P. Paclik, “Prototype Selection forDissimilarity-based Classifiers,” Pattern Recognition, vol. 39, no. 2, pp.189–208, 2006.
[16] K. Riesen, M. Neuhaus, and H. Bunke, “Graph Embedding in VectorSpaces by means of Prototype Selection,” in Graph-Based Representa-tions in Pattern Recognition. Springer, 2007, pp. 383–393.
[17] V. Vacic, L. M. Iakoucheva, S. Lonardi, and P. Radivojac, “GraphletKernels for Prediction of Functional Residues in Protein Structures,”Journal of Computational Biology, vol. 17, no. 1, pp. 55–72, 2010.
[18] M. Lahiri and T. Y. Berger-Wolf, “Structure Prediction in TemporalNetworks Using Frequent Subgraphs,” in IEEE Symposium on CIDM,2007, pp. 35–42.
[19] J. Ugander, L. Backstrom, and J. Kleinberg, “Subgraph Frequencies:Mapping the Empirical and Extremal Geography of Large Graph Col-lections,” in Proceedings of the 22nd international conference on WorldWide Web, 2013, pp. 1307–1318.
[20] R. N. Lichtenwalter, J. T. Lussier, and N. V. Chawla, “New Perspectivesand Methods in Link Prediction,” in Proceedings of the 16th ACMSIGKDD international conference on Knowledge discovery and datamining. ACM, 2010, pp. 243–252.
[21] J. Shetty and J. Adibi, “The Enron Email Dataset Database Schemaand Brief Statistical Report,” Information Sciences Institute TechnicalReport, University of Southern California, vol. 4, 2004.
[22] B. Viswanath, A. Mislove, M. Cha, and K. P. Gummadi, “On theEvolution of User Interaction in Facebook,” in Proceedings of the 2ndACM workshop on Online social networks, 2009, pp. 37–42.
[23] R. N. Lichtenwalter and N. V. Chawla, “LPmade: Link Prediction MadeEasy,” Journal of Machine Learning Research, vol. 12, pp. 2489–2492,2011.
[24] R. N. Lichtenwalter and N. V. Chawla, “Vertex Collocation Profiles:Subgraph Counting for Link Analysis and Prediction,” in Proceedingsof the 21st international conference on World Wide Web. ACM, 2012,pp. 1019–1028.