rectification and azeotropic distillation - eth...
TRANSCRIPT

Distillation
Rectification and azeotropic distillation
Nicole Schai Assisted by Christoph Murer and Simon Zollinger
Report
ETH Zürich
29th of November 2011

TABLE OF CONTENT
Page 2 / 12
TABLE OF CONTENTS
1 ABSTRACT ........................................................................................................................................................... 3 2 INTRODUCTION ................................................................................................................................................... 4
2.1 PHASE DIAGRAMS ....................................................................................................................................................... 4 2.2 RECTIFICATION ........................................................................................................................................................... 4 2.3 PYCNOMETER ............................................................................................................................................................ 5 2.4 HYPOTHESIS .............................................................................................................................................................. 5
3 MATERIALS AND METHODS ................................................................................................................................. 6 3.1 MATERIALS ............................................................................................................................................................... 6 3.2 RECTIFICATION ........................................................................................................................................................... 6 3.3 AZEOTROPIC DISTILLATION ............................................................................................................................................ 7 3.4 CALCULATIONS ........................................................................................................................................................... 7
4 RESULTS .............................................................................................................................................................. 8 4.1 RECTIFICATION ........................................................................................................................................................... 8 4.2 AZETROPIC DISTILLATION .............................................................................................................................................. 8 4.3 ERROR CALCULATIONS ................................................................................................................................................. 9
5 DISCUSSION ....................................................................................................................................................... 10 5.1 RECTIFICATION ......................................................................................................................................................... 10 5.2 AZEOTROPIC DISTILLATION .......................................................................................................................................... 10 5.3 SOURCES OF ERROR ................................................................................................................................................... 10
6 REFERENCES ....................................................................................................................................................... 11 6.1 LITERATURE ............................................................................................................................................................. 11 6.2 WEBSITES ............................................................................................................................................................... 11
7 ANNEX ............................................................................................................................................................... 12

1. ABSTRACT
Page 3 / 12
1 ABSTRACT
Distillation is a widely used method to separate substances with different vapour pressures. The experiment was made in order to improve the understanding of the process. In a first part, a mixture of two substances was distilled. Form a refractive index of 1.363 and density of 0.7774 g/cm3, the distillate was identified to be ethanol. In a second part, the volume concentration of alcohol present in passoa and tequila was measured and compared to the values given by the manufacturer. The values of 18.38% (passoa) and 40.89% (tequila) were close to the official 17% and 38%. Errors occurred possibly due to over-distillation, unclean glass ware and difficulties concerning exact volume determination in an Erlenmeyer (not tempered). All in all, the results confirmed the hypothesises.

2. INTRODUCTION
Page 4 / 12
2 INTRODUCTION
The effect of distillation as a method to separate substances physically lies in the different vapour pressures of different substances. Todays industry is highly taking use of distillation. It is an easy way to separate and purify different chemicals. One example is Polyethylen. For the synthesis of this often used plastic, ethen is used. Ethen is gained from petroleum by distillation in connection to some other steps.
2.1 Phase diagrams
Different substances have different boiling points. Mixtures of substances have another boiling point depending on the concentration of the mixed substances. Distillation only works because the concentration in the vapour is not the same as the concentration in the liquid phase. The substance with lower boiling temperature evaporates faster. Consequently, its concentration in the liquid is decreasing while the concentration in the vapour in increasing. The phase diagram in Figure 1 shows the concentrations of ethanol – water mixtures in the liquid and the gas phase.
Fig. 1 Phase diagram of ethanol-water mixture. C1 gives a certain concentration of ethanol in the liquid whereas C2 is the corresponding concentration of ethanol in the vapour. [2]
Figure 1 shows also a clear minimum of boiling temperature. This minimum is called azeotropic minimum. At this point, the attraction between ethanol and water is less strong than the attraction between the chemicals themselves. Additionally, the concentration in the gas phase is the same as the concentration in the liquid phase. There is no more separation by distillation possible.
2.2 Rectification
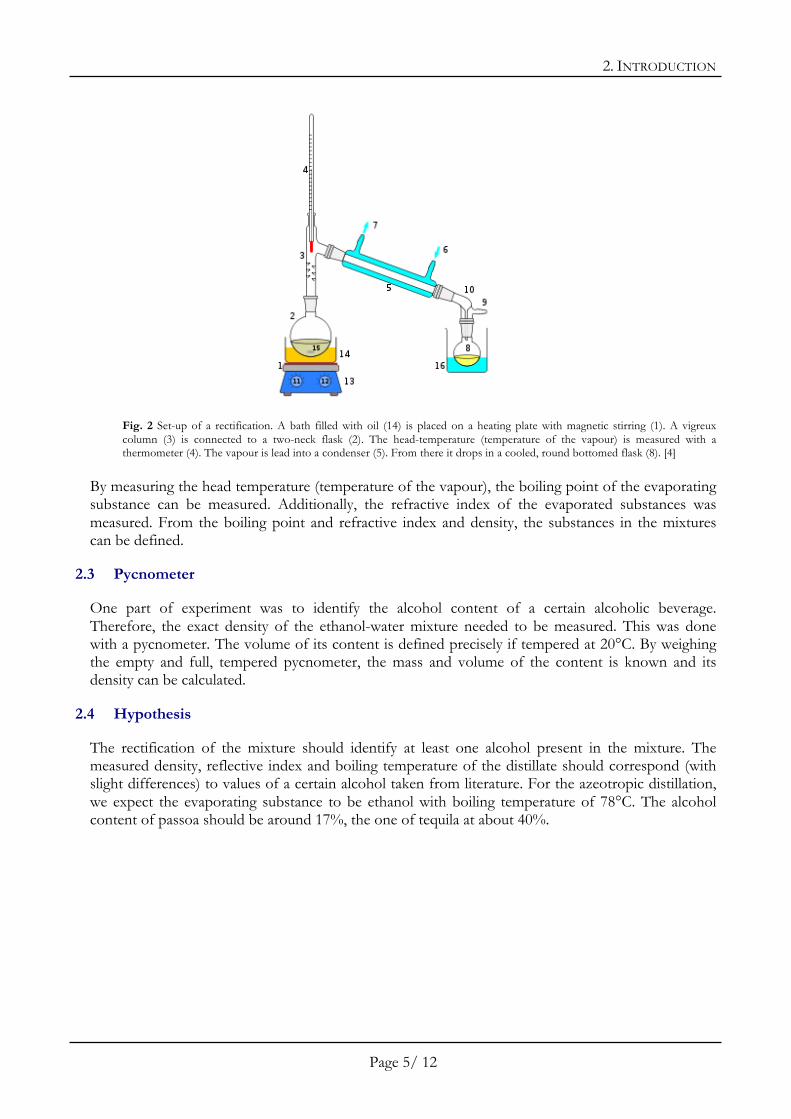
In a normal distillation, a liquid is brought to a boil, the arising vapour is collected, and cooled down again so it becomes a liquid as well. However, as Figure 1 shows clearly, The ethanol concentration in C2 is still far away from the azeotopic minimum. In other words, the concentration of water in C2 is still fairly high. In order to decrease the water content, another distillation can be made. In a rectification, several normal distillations are lined up. This is normally done by using a vigreux column. The quality of separation is highly improved. All of the following experiments are based on rectification. Figure 2 shows the different elements used for rectification.
2. INTRODUCTION
Page 5/ 12
Fig. 2 Set-up of a rectification. A bath filled with oil (14) is placed on a heating plate with magnetic stirring (1). A vigreux column (3) is connected to a two-neck flask (2). The head-temperature (temperature of the vapour) is measured with a thermometer (4). The vapour is lead into a condenser (5). From there it drops in a cooled, round bottomed flask (8). [4]
By measuring the head temperature (temperature of the vapour), the boiling point of the evaporating substance can be measured. Additionally, the refractive index of the evaporated substances was measured. From the boiling point and refractive index and density, the substances in the mixtures can be defined.
2.3 Pycnometer
One part of experiment was to identify the alcohol content of a certain alcoholic beverage. Therefore, the exact density of the ethanol-water mixture needed to be measured. This was done with a pycnometer. The volume of its content is defined precisely if tempered at 20°C. By weighing the empty and full, tempered pycnometer, the mass and volume of the content is known and its density can be calculated.
2.4 Hypothesis
The rectification of the mixture should identify at least one alcohol present in the mixture. The measured density, reflective index and boiling temperature of the distillate should correspond (with slight differences) to values of a certain alcohol taken from literature. For the azeotropic distillation, we expect the evaporating substance to be ethanol with boiling temperature of 78°C. The alcohol content of passoa should be around 17%, the one of tequila at about 40%.

3. MATERIALS AND METHODS
Page 6 / 12
3 MATERIALS AND METHODS
There were two different experiments made. A mixture of two unknown alcohols was separated with rectification and afterwards identified. Secondly, the alcohol content of passoa and tequila was measured. For both of the experiments, a rectification set-up as shown in figure 2 was used.
3.1 Materials
The rectification set up was used for both experiments:
- heating plate, lab boy - two-neck flask (round bottom) - magnetic stirrer - pot with silica oil - 2 thermometers - condenser - vigreux column - vacuum receiver adapter - 4 round bottom flasks - ice bath - distilling receiver to Bredt (Spinne) - 25 ml volumetric pipette - contact thermometer - clamps - funnel
The oil bath was placed directly onto the heating plate. The two-neck flask was insert into the bath so the bath level was equal to the level of the distillate. The distillate as well as the oil bath was stirred at any time using a magnetic stirrer. The vigreux column was placed on the flask (using a connecting piece). Through the second neck, a thermometer was insert in order to measure the temperature of the solution. On top of the vigreux column, a condenser was placed. Additionally, a thermometer was insert in order to measure the head temperature. Finally, the condenser was connected to the collecting round bottom flasks with a vacuum receiver adapter and distilling receiver to Bredt. The cooling bath was placed underneath the flasks. Every connection was fixed with a clamp. The collecting flasks were weighed.
3.2 Rectification
- 50 ml of mixture E - Erlenmeyer flask - Refractometer
For the separation of two unknown alcohols, 50 ml of mixture E were filled into the round bottom two-neck flask. The oil bath was heated up and the liquid and head temperature were measured regularly. As soon as the head temperature dropped clearly and the liquid stopped boiling, the temperature of the oil bath was increased and the new distillate collected in another flask. Therefore, a separation of the different alcohols should be guaranteed. The collecting flasks were weighed again and the mass of the alcohol was determined. Now the distilled alcohol was filled in an Erlenmeyer flask which was weighed previously. Again the weight of the alcohol was determined and the density was calculated. Finally, the refractive index was measured using a refractometer.

3. MATERIALS AND METHODS
Page 7 / 12
3.3 Azeotropic distillation
- 50 ml Passoa (17%), 50 ml Tequilla (40%) - Pycnometer - Refractometer - Erlenmeyer flask (50 ml)
In order to determine the alcohol content of passoa and tequila, 50 ml of each beverage were filled (with a volumetric pipette) into the tow-neck flask. The oil bath was heated up and the liquid was brought to a boil. The distillation was finished as soon as the temperature of the liquid reached 100°C. The alcohol collected in the collecting flask was filled in a 50 ml Erlenmeyer flask. Only 2 drops were used in order to determine whether the distillate was ethanol. This was done with the refractometer. All glass parts which were in touch with the alcohol (condenser, funnel, distilling receiver to Bredt and collecting flask) were cleaned with distilled water. The cleaning water was also added to the distillate in the Erlenmeyer. Finally, the Erlenmeyer was filled up to 50 ml with distilled water. The content was filled into a previously weighed pycnometer and tempered at 20°C. The pycnometer was weighed again and the mass of its content determined. As the exact volume of the pycnometer was known, the density of the ethanol-water mixture could be determined.
3.4 Calculations
Density. The density 𝜌 was calculated from the volume of the pycnometer and mass of the mixture it contained. The calculation used is shown in equation 1.
𝜌 =𝑀𝑎𝑠𝑠 (𝐻!𝑂 + 𝐷𝑖𝑠𝑡𝑖𝑙𝑙𝑎𝑡𝑒)𝑉𝑜𝑙𝑢𝑚𝑒𝑛 𝑃𝑦𝑐𝑛𝑜𝑚𝑒𝑡𝑒𝑟 =
𝑚!"#
𝑉!"#$%&'(') (1)
Additionally, an error calculation for the density was made, as shown in equation 2.
∆𝜌 = (𝜕𝜌𝜕𝑚 ∗ ∆𝑚)! + (
𝜕𝜌𝜕𝑉 ∗ ∆𝑉)
! (2)
The error of the scale used (Mettler) is estimated at 0.005g, the error of the pycnometer is set at 0.025 cm3.

4. RESULTS
Page 8 / 12
4 RESULTS
4.1 Rectification
In order to recognize any change in head and bath temperature, the temperatures were noted regularly, as shown in figure 3.
Fig. 3 Change in temperature of head and liquid temperature. The head or gas temperature is lower than the liquid temperature at any time. The distillation starts after about 1h 30 minutes.
The distillate was tested. Table 1 shows the measured values.
Tab. 1 Measured values of distillate and corresponding values taken from literature [3]. The matching values let assume that the distillate was ethanol.
density ρ [g/cm3] refractive index Identification Component 0.77774 1.363 Ethanol Literature [3] 0.789 1.36 Ethanol
4.2 Azetropic distillation
The experiment was done twice, once with passoa (low alcohol content) and once with tequilla (high alcohol content). Table 2 shows average bath, head and liquid temperature during distillation.
Tab. 2 Parameters measured during distillation. bath temperature [°C] head temperature [°C]
liquid boiling temperature [°C]
Passoa 110 76 88 - 100 Tequilla 80 - 115 78 80 - 100
0
20
40
60
80
100
120
140
00:00:00 00:28:48 00:57:36 01:26:24 01:55:12 02:24:00 02:52:48
temperature [°C]
duration of heating [h:min:sec]
Liquid temperature
Gas temperature
4. RESULTS
Page 9 / 12
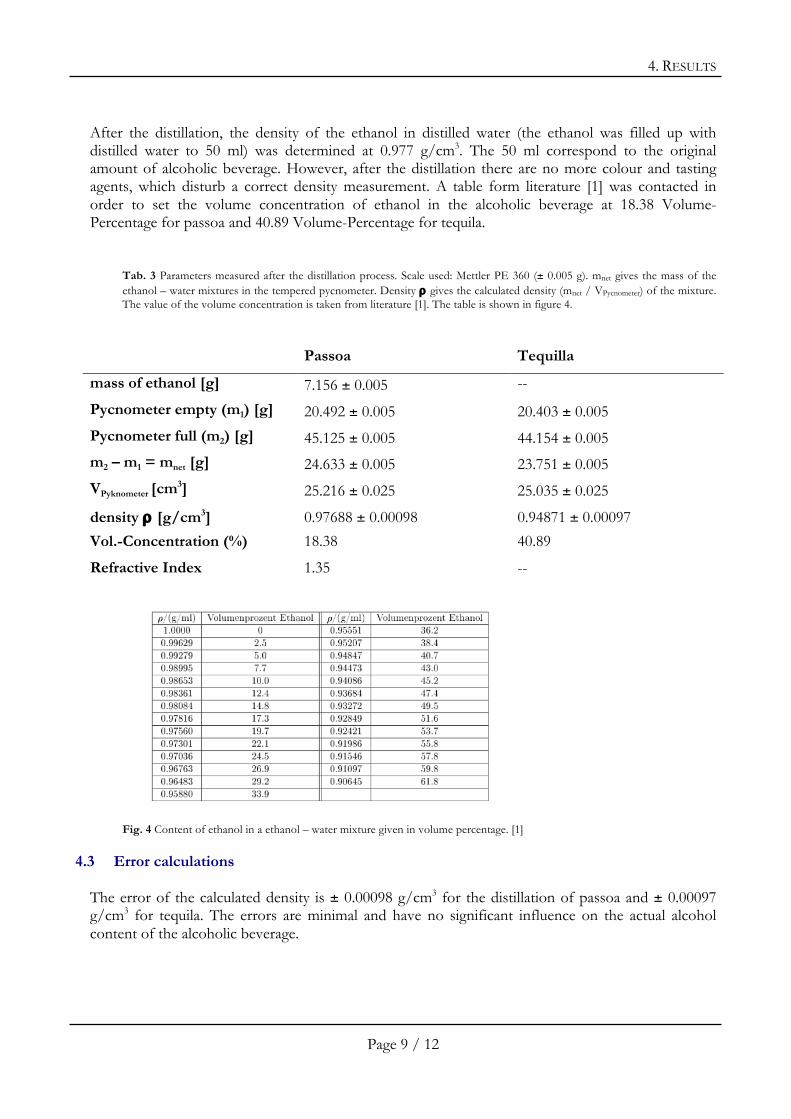
After the distillation, the density of the ethanol in distilled water (the ethanol was filled up with distilled water to 50 ml) was determined at 0.977 g/cm3. The 50 ml correspond to the original amount of alcoholic beverage. However, after the distillation there are no more colour and tasting agents, which disturb a correct density measurement. A table form literature [1] was contacted in order to set the volume concentration of ethanol in the alcoholic beverage at 18.38 Volume-Percentage for passoa and 40.89 Volume-Percentage for tequila.
Tab. 3 Parameters measured after the distillation process. Scale used: Mettler PE 360 (± 0.005 g). mnet gives the mass of the ethanol – water mixtures in the tempered pycnometer. Density ρ gives the calculated density (mnet / VPycnometer) of the mixture. The value of the volume concentration is taken from literature [1]. The table is shown in figure 4.
Passoa Tequilla
mass of ethanol [g] 7.156 ± 0.005 --
Pycnometer empty (m1) [g] 20.492 ± 0.005 20.403 ± 0.005
Pycnometer full (m2) [g] 45.125 ± 0.005 44.154 ± 0.005
m2 – m1 = mnet [g] 24.633 ± 0.005 23.751 ± 0.005
VPyknometer [cm3] 25.216 ± 0.025 25.035 ± 0.025
density ρ [g/cm3] 0.97688 ± 0.00098 0.94871 ± 0.00097
Vol.-Concentration (%) 18.38 40.89
Refractive Index 1.35 --
Fig. 4 Content of ethanol in a ethanol – water mixture given in volume percentage. [1]
4.3 Error calculations
The error of the calculated density is ± 0.00098 g/cm3 for the distillation of passoa and ± 0.00097 g/cm3 for tequila. The errors are minimal and have no significant influence on the actual alcohol content of the alcoholic beverage.

5. DISCUSSION
Page 10 / 12
5 DISCUSSION
5.1 Rectification
The head temperature during the distillation was around 70°C. The boiling point of ethanol, however, is 78°C. The deviation could have occurred due to a ethanol drop on the thermometer. Additionally, the chapel was air-conditioned. Therefore, a slight under pressure was present throughout the whole distillation. The measured refractive index of 1.36 as well as the density of 0.77774 correspond well to values listed in literature [3]. We assume the distillate to be ethanol. It was also noticed that the velocity of stirring had an influence on the distillation. As the velocity was increased,, the surface at which evaporation and condensing took place was increased. Consequently the whole process was sped up.
5.2 Azeotropic distillation
The distillation of passoa was successful. The calculated value of volume percentage is 18.38. The manufacturer claims a alcohol content of 17%. Therefore, the calculated value deviates from the official value by 8.11% (absolute deviation is 1.38%). The measured refractive index was 1.35. This approves the assumption that only or at least mainly ethanol was present in the alcoholic beverage. However, values of literature [3| give refractive indices for ethanol at 1.36. The deviation could have raised from improper determination or because the ethanol was impurified with water. Water has a refractive index of 1.333 [3]. As ethanol – water is an azeotropic mixture - it was not possible to separate the two components completely. The minimum concentration of water left in the distillate is therefore 4.4%. The distillation of tequila showed clearly that not only alcoholic beverages with low alcohol content can be distilled exactly, but also beverages with alcohol content of 40%. As the tequila was industrially produced, we assumed the evaporating substance to be ethanol. The measured head temperature approved this assumption. The refractive index was not measured additionally. The calculated volume percentage of ethanol present in tequila was 40.89%. The percentage given on the bottle is 38%. Again, the measured value is slightly higher than the value given by the manufacturer. The calculated error of the density calculation was ± 0.00097 (tequila) and ± 0.00098 (passoa). As these values are far smaller than the difference in the final alcohol concentration (between given and measured values), the errors can be ignored. Other sources of error had a bigger influence. In addition to the alcohol content determination, the volume contraction of ethanol – water mixtures was measured. The approximate contraction of a 40% EtOH – 60% H2O mixture is 3.748%, for a mixture of 20% EtOH – 80% H2O only 1.28%. However, the volume contraction is already included in the alcohol content given by the manufacturer and must not be taken into the made calculations.
5.3 Sources of error
The deviation of the alcohol content can have several reasons. The glass ware was not cleaned out properly before usage. We assumed them to be clean, but there could have been some impurities left. Secondly, the water added to the distillate was measured in an Erlenmeyer. The mixture was not tempered at 20°C. As room temperature was about 23°C and the mixing of ethanol and water is exothermal, the content of the Erlenmeyer was probably slightly warmer than 20°C. Therefore, less water was added and the ethanol concentration was consequently higher.

6. REFERENCES
Page 11 / 12
6 REFERENCES
6.1 Literature
[1] STUDIENGANG MATERIALWISSENSCHAFT ETH ZÜRICH SKRIPT VERSUCH 1: DESTILLATION
6.2 Websites
[2] CHEMIE GUIDE, JIM CLARK, 2005 WWW.CHEMGUIDE.CO.UK
[3] WOLFRAM ALPHA, WOLFRAM ALPHA LLC-A RESEARCH COMPANY, 2011 WWW.WOLFRAMALPHA.COM [4] DISTILLATION, AUTHOR UNKNOWN, 24.11.2011
WWW.EN.WIKIPEDIA.ORG/WIKI/DISTILLATION

7. ANNEX
Page 12 / 12
7 ANNEX
Quest ion 1.1: Verbrennung von PE -(CH2-CH2)n- + 3 O2 à 2 CO2 + H2O Quest ion 1.3: Welche Verdampfungsenthalpie ist mit der Faustregel bei T = 300°K verträglich?
H2O: ∆𝐻 =!" ( !.!!".!)
( !!""!
!!"#)
∗ 𝑅 = 43.108𝑘𝐽/𝑚𝑜𝑙
Quest ion 1.4: Im Labor lassen sich mit modernen Pumpen leicht Drücke von 10 Pa erzeugen. Wie stark ändern sich nach der Faustregel in etwa die Siedetemperatur (p = 1 atm), wenn man bei p=10 Pa destilliert? Um rund 200°C. Quest ion 1.6: Wie verändert sich die Zusammensetzung des Dampfes und der Flüssigkeit von Toluen und Benzen, wenn sich die Destillation von a (xtoluen = 0.8) nach f „bewegt“, dies entspricht also einer Destillation mit n = 3? Geben Sie für jeden Schritt die Zusammensetzung und die Siedetemperatur an. a: Flüssigkeit à 0.8 Toluen, 0.2 Benzen b: Dampf à 0.5 Toluen, 0.5 Benzen c: Flüssigkeit à 0.5 Toluen, 0.5 Benzen d: Dampf à 0.35 Toluen, 0.65 Benzen e: Flüssigkeit à 0.35 Toluen, 0.65 Benzen f: Dampf à 0.15 Toluen, 0.85 Benzen