recovery mechanisms of sericite in microcrystalline … · 2016-05-19 · of some microcrystalline...
TRANSCRIPT

http://dx.doi.org/10.5277/ppmp150202
Physicochem. Probl. Miner. Process. 51(2), 2015, 387−400 Physicochemical Problems
of Mineral Processing
www.minproc.pwr.wroc.pl/journal/ ISSN 1643-1049 (print)
ISSN 2084-4735 (online)
Received June 9, 2014; reviewed; accepted September 21, 2014
RECOVERY MECHANISMS OF SERICITE IN
MICROCRYSTALLINE GRAPHITE FLOTATION
Hongqiang LI*, Leming OU
**, Qiming FENG
**, Ziyong CHANG
**
* College of Resource and Environmental Engineering, Wuhan University of Technology, Wuhan 430070, PR
China **
School of Mineral Processing and Bioengineering, Central South University, Changsha 410083, PR China,
Abstract: Sericite is the main contaminant of concentrate in commercial microcrystalline graphite ore
flotation. It was necessary to identify its recovery mechanisms so that the appropriate solution can be
selected. In this study, the influence of sericite on flotation selectivity of microcrystalline graphite ore and
its recovery mechanisms were investigated. Artificial mixtures flotation test suggested that sericite
seriously reported into concentrate leading to poor flotation selectivity of microcrystalline graphite ore.
However, the aggregation/dispersion behavior of artificial mixtures indicated that a large repulsive energy
existed between sericite and microcrystalline graphite particles at pH 7.4, and sericite was not likely to
report into graphite concentrate by slime coating. The results obtained from contact angle measurements
and a technique of Warren showed that the floated sericite reached the froth via a combination of both
entrainment and entrapment mechanisms, not via true flotation.
Keywords: microcrystalline graphite, sericite, flotation, entrainment, entrapment
Introduction
Natural graphite forms from the metamorphism of organic carbon or carbonaceous
rocks and is found in three commercial varieties: crystalline flake, microcrystalline,
and crystalline vein (Crossley, 1999). Some microcrystalline graphite deposits usually
have a high air dried basis fixed carbon content (FCad) (FCad>80 wt.%), and can be
marketed after selective mining and a minimum processing. However, the average
FCad of some European deposits is as low as 55 wt.% (Simandl and Kenanl, 1997)
while in China the FCad of some microcrystalline graphite deposits is 50-70 wt.%. So
far, a number of research projects have been undertaken to purify those low-grade
microcrystalline graphite ores, flotation and chemical purification are commonly used.
Chemical purification is an effective beneficiation method, including alkali roasting,

H. Li, L. Ou, Q. Feng, Z. Chang 388
hydrofluoric acid treatment and chlorination roasting, but it easily leads to
environment pollution while flotation is a low cost and environment friendly method
compared with chemical purification (Dong, 1997).
For commercial microcrystalline graphite ore with FCad of 60-70wt.%, it can only
be upgraded to 80-88wt.% (FCad) by flotation (Ji, 1991; Xia et al., 1996; Dong, 1997),
and the primary contaminant of concentrate is sericite, which is a fine grained
muscovite mica. Sericite also occurs in many base metal ore bodies, and it is often
recovered strongly into the final flotation concentrate (Silvester, 2011). It has been
hypothesized that liberated sericite may be collected in the froth product by true
flotation due to surface hydrophobicity (Blaskett, 1960) or slime coating (He, 2009).
A wide range of sericite depressants or dispersants has been tried over the years, but it
does not appear to respond readily to those conventional reagents, and mostly ends up
as a significant diluent in the final concentrate, which suggests that the mechanism of
sericite recovery is not properly understood. Before the best mean for preventing
liberated sericite recovery can be selected, it is necessary to determine how the sericite
is actually being recovered.
In this study, in order to simulate the flotation process of microcrystalline graphite
ore, batch flotation test of artificial mixtures in -30 μm size fraction was carried out.
To demonstrate how sericite particles were reaching the froth phase, and determine
which class of sericite particles (floating particles due to hydrophobicity, hetero-
coagulation particles or entrained particles) was the most important contributor to
sericite recovery in froth flotation, contact angle measurements, zeta potential
measurements, and a technique of assessment of true flotation and entrainment of
mineral have been applied (George et al., 2004).
Materials and methods
Materials
The sericite used for all experiments was obtained from Xiangyang, Hubei Province,
China. The sample was dry ground and screened, and the -97 μm size fraction was
collected and used in the experiments. X-ray fluorescence (XRF) analysis indicated
that it contains 8.877 wt.% K2O, 0.69 wt.% Na2O, 36.59 wt.% Al2O3, and 47.11 wt.%
SiO2. The software Jade 5.0 was used to analysis X-ray diffraction pattern. Figure 1(a)
is the X-ray diffraction pattern of sericite, which indicated that the purity of the
sericite is 92 wt.%.
The microcrystalline graphite was obtained from the Hunan Lutang Graphite Mine
located in the Beihu district of the Chenzhou city. It was processed using the same
method as sericite. The results of proximate analysis (volatile matter, fixed carbon,
and ash) of microcrystalline graphite revealed that the air dried basis volatile matter
(Vad) was 3.25 wt.%, the air dried basis ash content (Aad) was 6.63wt.%, and the FCad
was 90.12 wt.%. Figure 1(b) shows the X-ray diffraction pattern of the
microcrystalline graphite sample. Based on the results of proximate analysis and X-ray

Recovery mechanisms of sericite in microcrystalline graphite flotation 389
diffraction, it can be concluded that the purity of graphite sample obtained was 93
wt.%.
10 20 30 40 50 60 700
200
400
600
800
1000
1200
1.3
7479 Q
1.3
5562 S
1.4
9807 S
1.5
4191 Q
1.6
4794 S
1.6
8885 S
1.8
1806 Q
2.0
0518 S
2.1
2837 S
2.2
4574 S
2.3
7751 S
2.4
5800 Q
2.5
5762 S
2.7
9853 S
2.8
6427 S
10.0
4637 S
2.9
9274 S
3.2
0163 S
3.3
4355 Q
3.4
9768 S
3.7
2898 S
3.8
7742 S
4.2
5811 Q
4.4
5282 S
5.0
1315 S
Inte
nsi
ty (
Counts
)
2θ( degree)
Q:quartzS:sericite
(a)
10 20 30 40 50 60 70
0
3000
6000
9000
12000
15000
18000
21000
4.9
97
04
S
M:Montmorillonite
C:chlorite
S:sericite
1.6
79
87
G
2.1
30
51
G
3.3
61
73
G
2.5
61
95
S;C
4.4
68
38
S
7.0
73
68
C
10
.00
69
7 S
Intensity (Counts)
2θ( degree)
15
.09
96
1 M
G:graphite
(b)
Fig. 1. XRD patterns of single minerals (a) sericite (b) microcrystalline graphite
Particle size distributions of test samples were determined by a Mastersizer 2000
particle size analyzer, and the results are seen in Table 1 and Fig. 2. kerosene used as a
collector was emulsified in a high-speed blender at a concentration of 1 g/dm3. The
median size of the kerosene droplets emulsified with addition of surfactants was below
4 μm and the droplet size was also determined by Mastersizer 2000 particle size
analyzer. Additionally, methyl isobutyl carbinol (MIBC) was used as a frother.
Table 1. Particle size distribution of single minerals
Single mineral D10 (μm) D50 (μm) D90 (μm) Average diameter (μm)
Microcrystalline graphite (-97 µm) 2.729 34.375 90.207 46.736
Sericite (-97 µm) 2.016 20.379 76.296 30.739
1 10 1000
1
2
3
4
5
6
Particles size distribution of single minerals (μm)
Sericite
Microcrystalline graphite
Fre
quen
cy (
%)
Fig. 2. Particle size distribution of single minerals

H. Li, L. Ou, Q. Feng, Z. Chang 390
Methods
Contact angle measurements
These experiments were implemented to determine the hydrophobicity of sericite at
different kerosene dosages. The assessments of hydrophobicity of sericite powder
were carried out on GBX MiniLab ILMS using the Washburn technique (Chibowski
and Perea-Carpio, 2002). The flotation tests were conducted in water, thus the
reference liquid was water. The results were checked by the sessile drop on polished
surface of sericite block. The data were the average value of five separate
determinations. The experimental error of the contact angle measurements was within
±10%.
Batch flotation tests of artificial mixtures of microcrystalline graphite–sericite
These tests were carried out to assess the influence of sericite recovery on flotation
selectivity of microcrystalline graphite. Based on the vast difference of floatability
between hydrophobic graphite and hydrophilic sericite, the recovery of sericite was
determined when all of the microcrystalline graphite was recovered into the
concentrate. The tests were conducted in an XFD-type laboratory flotation machine (1
dm3), and the flotation experimental error was within ±5%. The artificial mixtures
slurry was composed of 2.5wt.% sericite and 15 wt.% graphite. Both sericite and
microcrystalline graphite were in the same size fraction (-30 µm).
Firstly, the original weight of tap water (W0) was recorded, the slurry in flotation
cell was prepared by adding artificial mixtures of microcrystalline graphite (Wg)–
sericite (Ws) to tap water followed by adding the collector kerosene (1.3 kg/Mg) and
frother MIBC (100 g/Mg) to the slurry. Then, the flotation froth was scraped into the
plastic basin every 10 s for 12 min, all of the graphite was scraped out at this point, the
froth depth was controlled at about 20 mm through adding tap water, and the plastic
basin with concentrate (Wc1), and tap water left (W1) should be weighed. Finally, the
tailing left in flotation cell was collected and filtrated, the filtrated tailing and the
plastic basin with concentrate were dried at 80 oC in an oven, weighed and recorded as
(Wt) and (Wc2). The recovery of water and sericite can be calculated by Eqs. 1 and 2
1 2
0 1
100%C Cw
W WR
W W
(1)
where
Rw – recovery of water (%)
W0 – original weight of tap water (g)
W1 – weight of tap water left (g)
Wc1 – wet weight of plastic basin with concentrate (g)
Wc2 – dry weight of plastic basin with concentrate (g)

Recovery mechanisms of sericite in microcrystalline graphite flotation 391
1 100%ts
s
WR
W
. (2)
Rs – recovery of sericite in graphite concentrate (%)
Wt – dry weight of tailing (g)
Ws – dry weight of sericite in feed (g).
Zeta potential measurements
The zeta potential measurements were performed using a ZetaPALS zeta potential
analyzer, the experimental error of zeta potential measurement was within ±10%. To
prepare the stock suspension, 1 g of the mineral (- 4 μm) was added to a 1 dm3
volumetric flask containing 10-2
mol/dm3 KNO3 solution. For each zeta potential
measurement, 10 cm3 of the stock mineral slurry was withdrawn and diluted with 90
cm3 of 10
-2 mol/dm
3 KNO3 solution, adjusted to appropriate pH using NaOH or HCl,
and then treated by desired reagents. A very small amount (about 2 cm3) of this
conditioned particle slurry was transferred to the plastic sample cell of the ZetaPALS
for zeta potential measurement. The zeta potential measurement was carried out from
low pH upwards, when a test was finished, another 10 cm3 of the stock mineral slurry
was withdrawn for zeta potential of a higher pH.
Assessment of true flotation and entrainment of sericite
These tests were used for determination of true flotation and entrainment of sericite in
the presence of microcrystalline graphite. This technique, proposed by Warren,
assumes that particle entrainment does not take place in a dry froth (Warren 1985). A
series of experiments were conducted, and the rate of water recovery was varied by
changing the rate of froth removal or froth depth. A regression line for the relationship
between total solids recovery and water recovery was extrapolated to a zero water
recovery. The mass of solids recovered at this point is the recovery by true flotation
alone. This technique could be summarized as seen in Eq. 3:
)()( tReFRFtR wEm (3)
Rm(t) – total recovery of solids by true flotation and entrainment (%)
F – recovery of solids due to true flotation (%)
RE – recovery of solids due to entrainment (%)
Rw(t) – recovery of water (%)
e – degree of entrainment
where, e is equal to the slope of Rm(t) versus Rw(t). A schematic representation of this
technique is shown in Fig. 3.
The tests were conducted, and the rate of water recovery was varied by changing
froth depth as 10 mm, 20 mm, and 30 mm, and the Jg was fixed at 3.3 dm3/min for
each test. The artificial mixtures slurry was composed of 6.6 wt.% sericite and 13.4
wt.% graphite. The dosages of kerosene and MIBC were chosen as 1300 g/Mg and

H. Li, L. Ou, Q. Feng, Z. Chang 392
100 g/Mg, respectively. The impeller speed was kept constant at 1080 rpm. Time t=0
was taken as the instant the froth overflowed into the first froth collecting tray, the
froth was removed at a constant, controlled rate of 6 scrapes per minute. Timed
samples were obtained at cumulative flotation times of 0.5, 1, 1.5, 2, 3, 4, and 8 min,
and the flotation experimental error was within ±5%.
Fig. 3. Determination of true flotation by the Warren method
Theoretical background
Hetero-coagulation, which leads to slime coating between valuable mineral and
gangue, is usually described by the DLVO theory (Adamczyk, 1999), the colloidal
forces considered include the electrostatic double-layer force and the Van der Waals
force.
Electrostatic double-layer (EDL) interaction
The model used to describe the Electrostatic Double-Layer (EDL) interaction energy
is based on the Poisson–Boltzmann equation, which describes the electrostatic
potential in an ionic solution as a function of position relative to the particle surface,
and has been found to be accurate down to separations of a few nanometers (Mitchell
et al., 2005). The interaction energy at constant surface potentials is often used, and
can be described by Eq. 4:
)2exp(1ln
)exp(1
)exp(1ln
)(
2)(
)( 2
2
2
1
212
2
2
1
21
210 HH
H
RR
RRV r
E
(4)
where the average radius of sericite particle R1 was 15.37 µm (Table 1), the average
radius of microcrystalline graphite particle R2 was 23.37 µm (Table 1); 1/κ is the
electrical double layer thickness in which κ = 0.10 nm-1 (Wan, 1997); ε0, εr represent
the vacuum dielectric constant and the relative dielectric constant of continuous phase,
respectively. The given value of ε0•εr was 6.9510-10
C-2
·(J·m)-1
, H represents the
Recovery mechanisms of sericite in microcrystalline graphite flotation 393
distance between particles, ψ1 and ψ2 are the surface potential. When contact time
between the particles is very short, the assumption of constant surface charge is
appropriate (Nguyen, 2002).
Van der Waals interaction
The Van der Waals interaction energy is calculated using Eq. 5:
)(6 21
21
RR
RR
H
AVw
. (5)
The Hamaker constant (A) for sericite/water/graphite is not available in literature.
For mica, the value of the Hamaker constant acting through vacuum was 9.8610-20
J
(Bergstrom 1997). Sericite is fine grained mica, thus the Hamaker constant of sericite
(A11) could be chosen as 9.8610-20
J. The Hamaker constant of graphite in vacuum is
23.810-20
J (Maurer et al., 2001), because microcrystalline graphite is fine grain
graphite, the Hamaker Constant of microcrystalline graphite (A22) could be chosen as
23.810-20
J. The Hamaker constant (A123) for two different materials (1 and 2)
interacting through medium 3 is (Eq. 6):
))(( 33223311132 AAAAA . (6)
When medium 3 is water (A33 = 3.7×10⁻²⁰
J), a value of the Hamaker constant of
4.4510-20
J was calculated for the sericite/ water/ microcrystalline graphite system on
the basis of Eq. 6, and this value was used in this study.
Results and discussion
Influence of sericite recovery on flotation selectivity of microcrystalline graphite
ore
During the multistage cleaning processes of commercial microcrystalline graphite ore,
the enrichment ratio (Er) decreased sharply, especially when the FCad of feed was
above 85 wt.%, it was difficult to upgrade further by flotation. This was illustrated in
previous literature clearly (Li, 2014). To simulate flotation process of commercial
microcrystalline graphite ore, artificial mixtures with the same FCad (85 wt.%) should
be selected.
For the purpose of assess the effect of sericite recovery on the enrichment ratio in
artificial mixtures flotation and it was supposed that FCad of microcrystalline graphite
single mineral was 100 wt.%, the equivalent FCad (FCad*) of artificial mixtures feed
could be calculated by Eq. 7:
* 100%g
ad
g s
CFC
C C
(7)
H. Li, L. Ou, Q. Feng, Z. Chang 394
FCad* – equivalent FCad of artificial mixtures, ignoring the ash and volatile of
graphite, wt.%
Cg – sub-concentrate of microcrystalline graphite in slurry, wt.%
Cs – sub-concentrate of sericite in slurry, wt. %.
In this section, artificial mixtures (FCad*=85.72 wt.%) was selected. The artificial
mixtures slurry was composed of 2.5 wt.% sericite and 15 wt.% graphite.
Er could be calculated with Eq. 8, (100-FCad*) was the content of sericite in feed,
(100-Rs) represented the amount of sericite that was rejected as tailing:
* (100 *)(100 ) /100 (100 *)(100 )
1* 100 *
ad ad s ad sr
ad ad
FC FC R FC RE
FC FC
(8)
β – grade of concentrate, wt.%
α – grade of feed, wt.%
FCad* – equivalent FCad of feed, wt.%
Er – enrichment ratio
Rs – recovery of sericite, %.
The commercial microcrystalline graphite ore was usually ground to more than
90% or even 100% pass through -30 µm sieve to liberate graphite from gangue
minerals, thus, artificial mixtures in -30 µm size fraction was selected.
The FCad* of feed after one stage flotation was 85.70%. FCad
* of the concentrate
was only 87.5% due to 88.02% of sericite recovered in graphite concentrate, and the
enrichment ratio was only 1.02. These results suggested that the serious misreport of
sericite led to poor flotation selectivity when microcrystalline graphite ore was fine
ground.
There are several mechanisms which have been proposed by which liberated
gangue particles may be collected in the concentrate:
via true flotation if the conditioning step applied makes the minerals hydrophobic,
via aggregation with the valuable mineral,
via entrainment or entrapment.
In order to determine mechanisms by which liberated sericite may be collected into
the concentrate in artificial mixtures flotation, three sets of experiments were carried
out.
Effect of kerosene dosage on wettability of sericite
Kerosene is widely used as a collector in graphite flotation (Salgado, 2001). In order
to assess the effect of kerosene dosage on the hydrophobicity of sericite, the contact
angle of sericite powder at different kerosene dosages was measured. The results are
presented in Table 2.
It can be seen from Table 2 that the contact angle of sericite powder was 16.78° in
the absence of kerosene, indicating that sericite was almost a hydrophilic mineral,

Recovery mechanisms of sericite in microcrystalline graphite flotation 395
which was in agreement with earlier observation (Gao et al., 2007). As the kerosene
dosage increased from 0 to 2000 g/Mg, the average contact angle of sericite powder
was not changed. The result indicated that kerosene did not improve the surface
hydrophobicity of sericite, and sericite would not report into concentrate by true
flotation when kerosene was used as the collector.
Table 2. Contact angle of sericite powder at different kerosene dosages
Kerosene dosage (g/Mg) Contact angle (°)
0 16.78
250 17.20
500 16.55
750 16.05
1000 17.09
1500 16.85
2000 17.05
Aggregation/dispersion behaviors of microcrystalline graphite and sericite
particles
The aggregation/dispersion behaviors of gangue mineral and valuable mineral
particles were usually evaluated from particle interaction energy, particle interaction
energy in aqueous solution is commonly described through application of DLVO
theory, which allows quantitative prediction of the interaction energy. If particle
interaction energy was negative, hetero-coagulation (slime coating) was unavoidable.
The zeta potential values of the sericite and microcrystalline graphite are shown in
Figs. 4(a) and (b), respectively.
a)0 2 4 6 8 10 12 14
-70
-60
-50
-40
-30
-20
-10
0
10
20
30
40
zeta potential(
mv)
pH
sericite+1500g/Mg kerosene
sericite
(a)
b)0 2 4 6 8 10 12 14
-70
-60
-50
-40
-30
-20
-10
0
10
20
30
40
zeta potential(
mv)
pH
microcrystalline graphite+1500g/Mg kerosene
microcrystalline graphite
(b)
Fig. 4. Zeta potential of (a) sericite (b) microcrystalline graphite as a function of pH
in the absence and presence of kerosene
In the absence of kerosene, the zeta potential value of sericite at pH 7.4 was -44.38
mV, and that of the microcrystalline graphite was -34.32 mV. When kerosene dosage
H. Li, L. Ou, Q. Feng, Z. Chang 396
was 1300 g/Mg, the zeta potential of sericite was -45.45 mV, that is almost the same
as that of original sericite. The results indicated that kerosene did not adsorb on
sericite surface, which agreed with the results of the contact angle measurements.
Different from sericite, when kerosene dosage was 1300 g/Mg, the zeta potential of
microcrystalline graphite changed to -30.83 mV from -34.32 mV. The absolute value
of the zeta potential of microcrystalline graphite decreased in the pH value range of 0-
12 because of the adsorption of kerosene on the mineral surface.
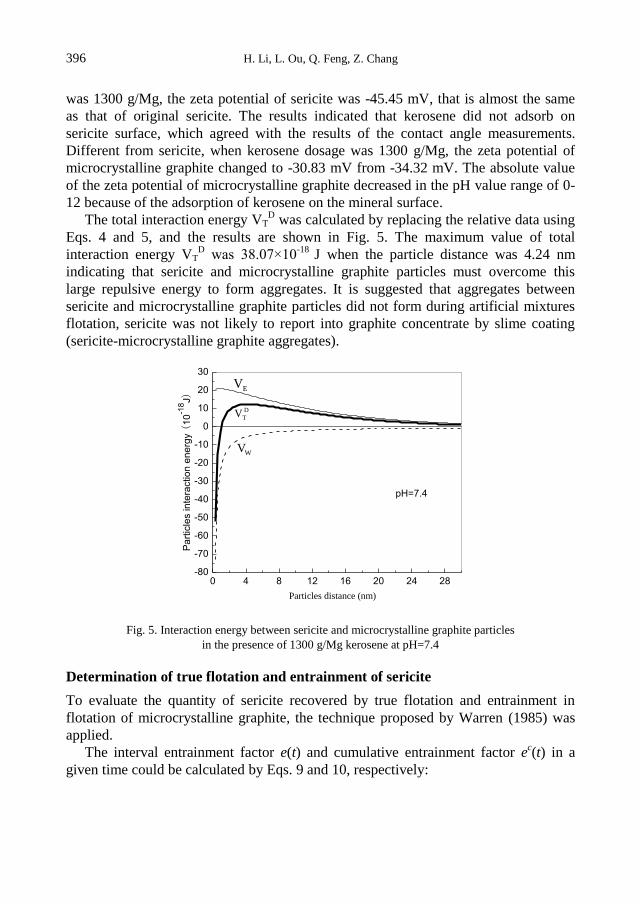
The total interaction energy VTD was calculated by replacing the relative data using
Eqs. 4 and 5, and the results are shown in Fig. 5. The maximum value of total
interaction energy VTD was 38.07×10
-18 J when the particle distance was 4.24 nm
indicating that sericite and microcrystalline graphite particles must overcome this
large repulsive energy to form aggregates. It is suggested that aggregates between
sericite and microcrystalline graphite particles did not form during artificial mixtures
flotation, sericite was not likely to report into graphite concentrate by slime coating
(sericite-microcrystalline graphite aggregates).
0 4 8 12 16 20 24 28-80
-70
-60
-50
-40
-30
-20
-10
0
10
20
30
WV
EV
D
TV
Pa
rtic
les in
tera
ctio
n e
ne
rgy (
10
-18J)
Particles distance (nm)
pH=7.4
Fig. 5. Interaction energy between sericite and microcrystalline graphite particles
in the presence of 1300 g/Mg kerosene at pH=7.4
Determination of true flotation and entrainment of sericite
To evaluate the quantity of sericite recovered by true flotation and entrainment in
flotation of microcrystalline graphite, the technique proposed by Warren (1985) was
applied.
The interval entrainment factor e(t) and cumulative entrainment factor ec(t) in a
given time could be calculated by Eqs. 9 and 10, respectively:

Recovery mechanisms of sericite in microcrystalline graphite flotation 397
( )
( )( )
S
W
R te t
R t (9)
Rs(t) – recovery of sericite in a given time (%)
Rw(t) – recovery of water in a given time (%)
e(t) – interval entrainment factor in a given time
( )
( )( )
cc s
cw
R te t
R t (10)
Rsc(t) – cumulative recovery of sericite in a given time (%)
Rwc(t) – cumulative recovery of water in a given time (%)
ec(t) – cumulative entrainment factor in a given time.
Table 3. Correlation (e) between solid recovery and water recovery during the batch flotation tests
Froth depth(mm) Time interval (min) Rwc(t)(%) Rs
c(t)(%) e(t) ec(t)
10
0~0.5 9.32 10.29 1.10 1.10
0.5~1.0 20.30 20.12 0.90 0.99
1~1.5 27.87 25.23 0.67 0.91
1.5~2 32.85 29.31 0.82 0.89
2~3 36.44 29.77 0.13 0.82
3~4 38.31 30.31 0.29 0.79
4~8 40.70 30.79 0.20 0.76
20
0~0.5 4.31 5.07 1.18 1.18
0.5~1.0 10.59 12.49 1.18 1.18
1~1.5 15.83 17.23 0.90 1.09
1.5~2 21.06 20.84 0.69 0.99
2~3 27.86 24.16 0.49 0.87
3~4 35.28 24.97 0.11 0.71
4~8 41.03 26.49 0.26 0.65
30
0~0.5 7.38 9.52 1.29 1.29
0.5~1.0 12.97 16.12 1.18 1.24
1~1.5 19.86 22.53 0.93 1.13
1.5~2 27.04 27.11 0.64 1.00
2~3 33.99 29.82 0.39 0.88
3~4 40.13 31.51 0.28 0.79
4~8 43.75 31.93 0.12 0.73

H. Li, L. Ou, Q. Feng, Z. Chang 398
Fig. 6. Recovery of sericite versus water recovery obtained using the technique of Warren
Warren (1985) found that the correlation (entrainment factor) between solid
recovery and water recovery normally deteriorated with time. As shown in Table 3, e
of sericite decreased with the increase of the flotation time. When the froth depth was
30 mm, e of sericite was 1.29 over the first 0.5 min and it decreased to 0.12 over the
last 4 min. Therefore, this method should ideally be applied over a flotation time that
is just long enough for the recovery of most, but not all, of the easily floatable solids.
In this section, the proper time interval was chosen between 0 and 4 min.
A plot of the recovery of sericite versus water recovery is seen in Fig. 6. The
procedure of Warren assumes that entrainment occurs when particles are transported
in the interstitial liquid. When the line of best fit was extrapolated to zero water
recovery, the intercept was about 5.5%, the overall recovery of sericite was about
32%, indicating that around 17% of all recovered sericite was captured by true
flotation, and about 83% of all floated sericite was recovered by entrainment.
However, as the kerosene dosage increased from 0 to 2000 g/Mg, the average contact
angle of sericite powder ranged from 16.05° to 17.20° and it was impossible for
sericite to be recovered by true flotation. In all of the tests, e(t) of sericite was greater
than one over the first 0.5 min, as shown in Table 3, similar results was found in
literature of (Wang and Peng, 2013). Zheng et al. (2006) claimed that if the
entrapment was an additional mechanism for the recovery of liberated silica particles,
it was possible in practice for the calculated entrainment factor (e) value to be greater
than 1. It is suggested that entrapment may be an additional mechanism for sericite
recovery.
In well-drained froths, entrained particles and water drain from the froth rapidly
near the pulp-froth interface, but the entrained particles become entrapped between the
bubble films at increased heights in the froth. It is therefore reasonable to postulate
that as the bubble films grow thinner with increasing height in the froth (as a result of
drainage), the probability of entrained particles becoming trapped in these films will

Recovery mechanisms of sericite in microcrystalline graphite flotation 399
increase. Over the first 0.5 min, e of sericite was 1.10 when the froth depth was 10
mm, e of sericite increased to 1.29 with the increasing of the froth depth to 30 mm. It
was shown that the quantity of sericite reporting to concentrate by entrapment
increased with the increase of the froth depth.
The results obtained by the technique of Warren and the contact angle measurements
showed that while the majority of sericite was recovered into the concentrate as a result
of entrainment, part of sericite was recovered into the concentrate by entrapment, and no
sericite was recovered via true flotation.
Conclusions
In this study, the recovery mechanisms of sericite and their effect on microcrystalline
graphite flotation were investigated. The following conclusions were drawn from the
above observations.
The batch flotation tests of artificial mixtures indicated that the poor flotation
selectivity of commercial microcrystalline graphite ore was attributed to the serious
misreport of sericite into concentrate.
The aggregation/dispersion behaviors of microcrystalline graphite and sericite
particles suggested that sericite was not likely to report into graphite concentrate by
slime coating.
Sericite was a hydrophilic mineral, and kerosene did not change its surface
hydrophobicity therefore it was impossible for sericite to be recovered by true
flotation in microcrystalline graphite flotation.
From the results obtained by the technique of Warren and the contact angle
measurements it can be concluded that the majority of sericite was recovered into the
concentrate as a result of entrainment and a part of sericite was recovered by
entrapment.
Acknowledgements
The authors gratefully acknowledge financial support from the National Natural Science Foundation of
China (No. 51174229) and South Graphite CO., LTD.
References
ADAMCZYK Z., WERONKI P., 1999, Application of the DLVO theory for particle deposition problems,
Advances in Colloid and Interface Science, 83(1-3), 137-226.
BERGSTROM L., 1997, Hamaker constants of inorganic materials, Advances in Colloid and Interface
Science, (70), 125-169.
BLASKETT K.S., 1960, Some effects of depressants in the flotation of a lead ore, Proc. 5th Int. Mineral
Processing Cong., 409-429.
CROSSLEY P., 1999, Graphite—High-tech supply sharpens up, Industrial Minerals, (386), 31-47.
DONG F.Z., 1997, A study on flotation of a cryptocrystalline graphite ore, Conservation and Utilization
of Mineral Resources, (1), 15-17.
H. Li, L. Ou, Q. Feng, Z. Chang 400
CHIBOWSKI E., PEREA-CARPIO R., 2002, Problems of contact angle and solid surface free energy
determination, Advances in Colloid and Interface Science, 98(2), 245-264.
GAO H.M., YUAN J.Z., WANG X., GUAN J., ZHANG L., JING Z., MAO Y.L., 2007, Mechanism of
surface modification for sericite, Journal of Wuhan University of Technology--Materials Science
Edition, 22(3), 470-472.
GEORGE P., NGUYEN A.V., JAMESON G.J., 2004, Assessment of true flotation and entrainment in the
flotation of submicron particles by fine bubbles, Minerals Engineering, 17(7-8), 847-853.
HE M., 2009, The influence of adsorbed polymer on clay and copper mineral particles' interactions,
Doctoral Dissertation, Applied Science, University of South Australia, Brisbane, 2-3.
JI G.C., 1991, Continuous flotation experiment of microcrystalline graphite, Non-metallic Mines, (2), 16-
18.
LI H.Q., FENG Q.M., YANG S.Y., OU L.M., LU Y., 2014, The entrainment behaviour of sericite in
microcrystalline graphite flotation, International Journal of Mineral Processing, (127), 1-9.
MITCHELL T.K., NGUYEN A.V., EVANS G.M., 2005, Heterocoagulation of chalcopyrite and pyrite
minerals in flotation separation, Advances in Colloid and Interface Science, 114–115227–237.
NGUYEN A.V., EVANS G.M., JAMESON G.J., 2002, Approximate calculations of electrical double-
layer interaction between spheres. Encyclopedia of surface and colloid science. H. AT. New York,
Marcel Dekker.
MAURER S., MERSMANN A., PEUKERT W., 2001, Henry coefficients of adsorption predicted from
solid Hamaker constants, Chemical Engineering Science, 56(11), 3443–3453.
SALGADO M.R., 2001, Upgrading the graphite by flotation at Bogala Mines in Sri Lanka, J. Cent.
South Univ. Technol., 8(3), 193-196.
SILVESTER E., 2011, The recovery of sericite in flotation concentrates, Mineral Processing and
Extractive Metallurgy, 120(1), 10-14.
SIMANDL G.J., KENANL W.M., 1997, Microcrystalline graphite, British Columbia Geological Survey
Geological Fieldwork, 240-241 240-244.
WAN Q.H., 1997, Effect of electrical double-layer overlap on the electroosmotic flow in packed-capillary
columns, Analytical Chemistry, 69(3), 361-363.
WANG B., PENG Y., 2013, The behaviour of mineral matter in fine coal flotation using saline water,
Fuel, 109309-315.
WARREN L.J., 1985, Determination of the contributions of true flotation and entrainment in batch
flotation tests, International Journal of Mineral Processing, 14(1), 33-44.
XIA Y.K., REN Z.M., CHEN H.X., GUAN F.T., 1996, A noval flotation flowsheet of microcrystalline
graphite and its industrial application, Non-metallic Mines, 19963.
ZHENG X., JOHNSON N.W., FRANZIDIS J.P., 2006, Modelling of entrainment in industrial flotation
cells: Water recovery and degree of entrainment, Minerals Engineering, 19(11), 1191-1203.