recovering aspen follow changing elk dynamics in yellowstone
TRANSCRIPT

Ecology, 96(1), 2015, pp. 252–263� 2015 by the Ecological Society of America
Recovering aspen follow changing elk dynamics in Yellowstone:evidence of a trophic cascade?
LUKE E. PAINTER,1,4 ROBERT L. BESCHTA,2 ERIC J. LARSEN,3 AND WILLIAM J. RIPPLE2
1Department of Fisheries and Wildlife, Oregon State University, Corvallis, Oregon 97331 USA2Department of Forest Ecosystems and Society, Oregon State University, Corvallis, Oregon 97331 USA
3Department of Geography and Geology, University of Wisconsin, Stevens Point, Wisconsin 54481-3897 USA
Abstract. To investigate the extent and causes of recent quaking aspen (Populustremuloides) recruitment in northern Yellowstone National Park, we measured browsingintensity and height of young aspen in 87 randomly selected aspen stands in 2012, andcompared our results to similar data collected in 1997–1998. We also examined therelationship between aspen recovery and the distribution of Rocky Mountain elk (Cervuselaphus) and bison (Bison bison) on the Yellowstone northern ungulate winter range, usingungulate fecal pile densities and annual elk count data. In 1998, 90% of young aspen werebrowsed and none were taller than 200 cm, the height at which aspen begin to escape from elkbrowsing. In 2012, only 37% in the east and 63% in the west portions of the winter range werebrowsed, and 65% of stands in the east had young aspen taller than 200 cm. Heights of youngaspen were inversely related to browsing intensity, with the least browsing and greatest heightsin the eastern portion of the range, corresponding with recent changes in elk density anddistribution. In contrast with historical elk distribution (1930s–1990s), the greatest densities ofelk recently (2006–2012) have been north of the park boundary (;5 elk/km2), and in thewestern part of the range (2–4 elk/km2), with relatively few elk in the eastern portion of therange (,2 elk/km2), even in mild winters. This redistribution of elk and decrease in densityinside the park, and overall reduction in elk numbers, explain why many aspen stands havebegun to recover. Increased predation pressure following the reintroduction of gray wolves(Canis lupus) in 1995–1996 played a role in these changing elk population dynamics,interacting with other influences including increased predation by bears (Ursus spp.),competition with an expanding bison population, and shifting patterns of human land use andhunting outside the park. The resulting new aspen recruitment is evidence of a landscape-scaletrophic cascade in which a resurgent large carnivore community, combined with otherecological changes, has benefited aspen through effects on ungulate prey.
Key words: Bison; browsing effects; Canis lupus; Cervus elaphus; gray wolves; large carnivorerestoration; Populus tremuloides; predation risk; quaking aspen; Rocky Mountain elk; trophic cascade;Yellowstone National Park.
INTRODUCTION
Quaking aspen (Populus tremuloides) stands declined
in northern Yellowstone National Park (YNP) during
the 20th century, as aging trees died but were not
replaced. This decline was primarily due to intensive
browsing of young aspen by Rocky Mountain elk
(Cervus elaphus) in winter (White et al. 1998, NRC
2002, Barmore 2003, Larsen and Ripple 2005). The
extirpation of gray wolves (Canis lupus) in the 1920s may
have contributed to suppression of aspen, through
effects on elk population dynamics and behavior (White
et al. 1998, Ripple and Larsen 2000) and a resulting
trophic cascade (Terborgh and Estes 2010, Ripple et al.
2014b).
In 1995–1996, wolves were reintroduced in YNP,
restoring the native community of large carnivores
(Smith et al. 2003), and elk numbers subsequently
declined (White and Garrott 2005a, Eberhardt et al.
2007, White et al. 2013). In 2006 and 2010, young aspen
in the eastern portion of the northern ungulate winter
range (northern range) were found to be significantly
taller in association with reduced browsing, an impor-
tant change from past conditions (Ripple and Beschta
2007, 2012b). Much of the browsing reduction occurred
in riparian (streamside) stands, while many non-riparian
stands were still suppressed by browsing. Riparian areas
were often in complex terrain that could discourage
ungulate access and increase predation risk (Kauffman
et al. 2007). Aspen stands with many fallen trees also
showed signs of recovery, suggesting that downed logs
might be avoided by ungulates as impediments to access
or escape (Kuijper et al. 2013). Ripple and Beschta
(2007) hypothesized that, in addition to reduced elk
density, behavioral responses by elk to predation risk
Manuscript received 15 April 2014; revised 3 July 2014;accepted 3 July 2014. Corresponding Editor: C. C. Wilmers.
4 E-mail: [email protected]
252
may have contributed to a trophic cascade benefiting
aspen (White et al. 2003). Other plant species browsed
by elk, including cottonwood (Populus spp.), willow
(Salix spp.), serviceberry (Amelanchier alnifolia), and
other palatable shrubs, have also shown signs of release
from suppression by browsing following wolf reintro-
duction (Ripple and Beschta 2006, 2012b, Beyer et al.
2007, Tercek et al. 2010, Beschta and Ripple 2014,
Ripple et al. 2014a).
Not all researchers agreed that aspen were recovering
on the northern range. Kauffman et al. (2010:2742),
sampling aspen during 2004–2006 on the northern
range, reported that ‘‘aspen are not currently recovering
in Yellowstone, even in the presence of a large wolf
population.’’ Browsing rates were high, and young aspen
in sampling plots were short, with no saplings taller than
200 cm, the height at which saplings begin to escape
from elk browsing. Kauffman et al. (2010) concluded
that elk herbivory was still limiting the growth and
survival of young aspen in northern YNP, as it had in
previous decades.
The studies by Kauffman et al. (2010) and Ripple and
Beschta (2007, 2012) differed in both timing and design,
and this may explain their divergent conclusions
regarding aspen recovery (Beschta and Ripple 2013).
Kauffman et al. (2010) randomly selected 16 aspen
stands across the northern range, and measured
browsing and height of young aspen in random
sampling plots in these stands. This method had the
potential to detect a strong, widespread recovery of
aspen stands, but might have missed a patchy recovery,
or a recovery just beginning. Ripple and Beschta (2007,
2012) selected the five tallest young aspen in a stand, as
an indication of new sapling recruitment, in 98 aspen
stands located in the eastern portion of the northern
range. Intensive sampling by Ripple and Beschta of a
limited area ensured that riparian stands, some of the
first to show signs of new recruitment, were included.
The disparate findings from these studies raised ques-
tions about the extent and timing of a beginning aspen
recovery on the northern range.
To update and expand information about the
condition of aspen stands on the northern range, we
sampled 87 randomly selected aspen stands in 2012, and
compared these measurements to data collected from the
same stands in 1997–1998 (Larsen 2001). We used two
different sampling methods for young aspen: randomly
located sampling plots within stands, and selecting the
five tallest stems in a stand, methods comparable to
those of previous studies. We analyzed variations in
browsing intensity, young aspen height, and ungulate
distribution to investigate the following questions:
1) How have browsing intensity and height of young
aspen changed since 1998? What was the spatial
extent and timing of new aspen recruitment, if any
has occurred?
2) What factors explain variation in browsing rates and
heights of young aspen among stands in 2012?
Browsing intensity may be related to the large-scale
distribution of elk, and perhaps bison (Bison bison),
and may also vary in response to site characteristics.
3) How have bison affected aspen? We expected more
browsing at sapling heights accessible to bison (,100
cm) in areas of high bison concentration in the
eastern part of the range.
4) How are elk and bison distributed in northern YNP?
We mapped the distribution of elk and bison scat in
2012, and calculated trends in elk density.
METHODS
Study area
The climate, topography, and vegetation of the
northern Yellowstone ungulate winter range and the
history of the northern Yellowstone elk herd have been
described by Houston (1982) and others (YNP 1997,
Lemke et al. 1998, White and Garrott 2005b, Wagner
2006, Eberhardt et al. 2007, White et al. 2012, 2013). In
northern YNP and extending north along the Yellow-
stone River, open valleys at a relatively low elevation
provide winter range (;1500 km2) for elk and other
ungulates, including bison, deer (Odocoileus spp.), and
small numbers of pronghorn (Antilocapra americana)
and moose (Alces alces). Aspen is a preferred browse
species for elk, and important for habitat diversity in the
Rocky Mountains (White et al. 1998). Aspen occupy
only a small percentage of the landscape on the northern
range, persisting for centuries in scattered stands in
moist locations. In the absence of fire, almost all aspen
regeneration is from root sprouts, the trees in a stand
sharing a common root system. Our study area included
that portion of the northern range (;1000 km2) inside
the park boundary (Fig. 1a). Elk share the range with
bison, deer (Odocoileus spp.), and small numbers of
pronghorn (Antilocapra americana) and moose (Alces
alces).
White et al. (2012) examined changes in elk density in
four sectors of the northern range (Coughenour and
Singer 1996), which we have called east, central, west,
and northwest (Fig. 1a). The elk herd using this range
was composed of two herd segments: the Lamar River
segment spending winter in the upper-elevation Lamar
River valley and surrounding area (east and central
sectors), and the Yellowstone River segment wintering
in the lower-elevation Gardiner River and Yellowstone
River valleys (central, west, and northwest sectors) both
in and out of the park. Some elk varied their migration
strategy over time, and there has been mixing between
herd segments (White et al. 2010). Prior to the return of
wolves, winter elk densities were usually greatest inside
the park boundary including the east sector (Houston
1982, White et al. 2012), even when elk numbers were
kept low (;5000 elk) by culling in the park in the 1960s.
Severe winters drove elk out of the park to the northwest
January 2015 253RECOVERING ASPEN FOLLOW ELK DYNAMICS
sector, but the shift of range was temporary. After
culling ended in 1969, elk counts increased to ;17 000þand the herd’s winter range expanded northward outside
the park, despite increased hunting (Lemke et al. 1998).
Since wolf reintroduction in 1995–1996, elk numbers
have steadily decreased and were recently the lowest that
they have been since the 1960s, with ;4200 counted in
2012 (Wyman and Smith 2012). Corresponding with this
decrease, elk density declined in the park, but in the
northwest sector outside the park, elk density remained
about the same despite significant removals by human
hunters (White and Garrott 2005a, Eberhardt et al.
2007, White et al. 2012). After 2005, winter harvests
were much reduced; nevertheless, elk density continued
to decrease within the park, with the greatest reduction
in the east sector (White et al. 2012). Wolves and bears
were the primary causes of elk mortality in the park, and
these predator densities were higher inside than outside
the park (Barber-Meyer et al. 2008, Hamlin and
Cunningham 2009, White et al. 2010, White and Garrott
2013). This differential pattern of predation pressure
provides a compelling hypothesis to explain the decline
of the elk population within, but not outside of, the
park. Bottom-up factors also may have affected elk
distribution and density. Bison have greatly increased
within the park and compete with elk for forage (White
and Garrott 2005b, Plumb et al. 2009, Ripple et al. 2010,
Wallen 2012, Frank et al. 2013). Outside the park in the
northwest sector, irrigated pastures and reduced cattle
densities may have benefited elk, particularly during
times of drought (Haggerty and Travis 2006, Wilmers
and Levi 2013). Drought between 1999 and 2006 could
have reduced elk recruitment in the park and has been
suggested as a reason for elk decline (Cook et al. 2004,
Vucetich et al. 2005), but there was no evidence of a
strong effect on elk pregnancy rates (White et al. 2011)
or survival as a result of this drought (Cook et al. 2004,
Barber-Meyer et al. 2008, White and Garrott 2013).
Data collection
In 1997–1998, Larsen (2001) marked with GPS the
locations of 87 randomly selected aspen stands on the
northern range within YNP (i.e., west, central, and east
sectors) and measured browsing intensity and heights of
young aspen in 79 stands. We used these data as a
baseline for measuring change over time. In 2012, we
revisited the 87 marked stands and again measured
browsing and height of young aspen (Painter 2013). In
each stand, young aspen were sampled with a randomly
placed 2 3 30 m belt transect plot, replicating the
methods of Larsen (2001). An aspen ‘‘tree’’ was defined
as .5 cm dbh (diameter at breast height); ‘‘young
aspen’’ included all aspen with dbh � 5 cm, including
‘‘saplings’’ (i.e., young aspen � 200 cm in height and �5cm dbh). For young aspen in the sampling plots, we
recorded the height and browsing status (browsed or
not) of the tallest leader for fall 2012 (top height), spring
2012, and spring 2011, as indicated by bud scars and
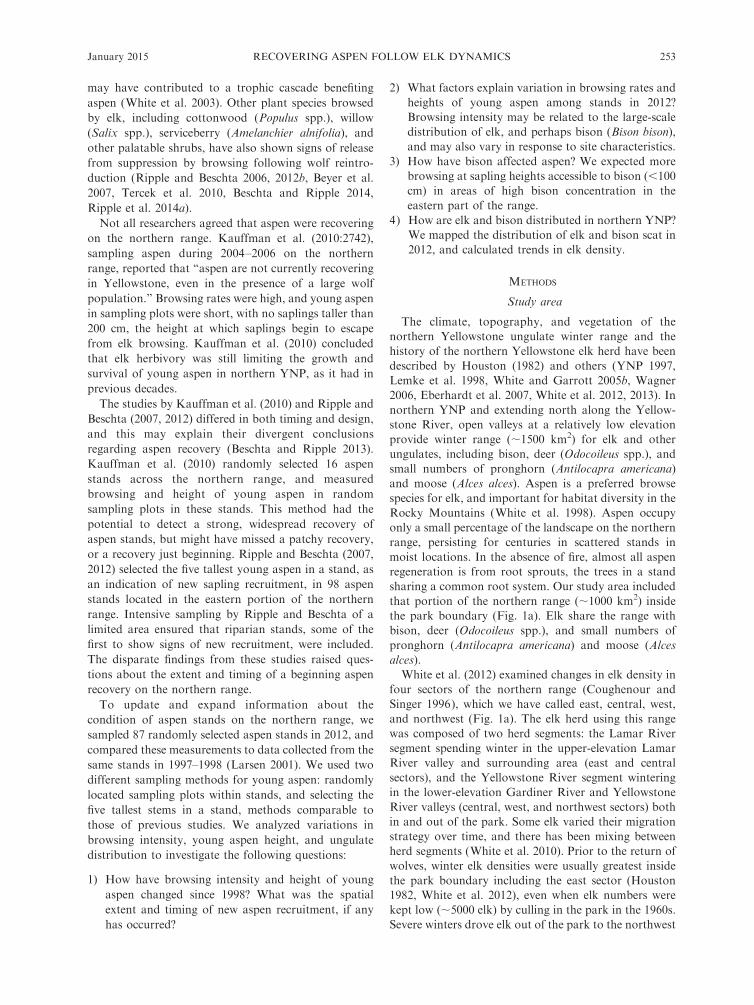
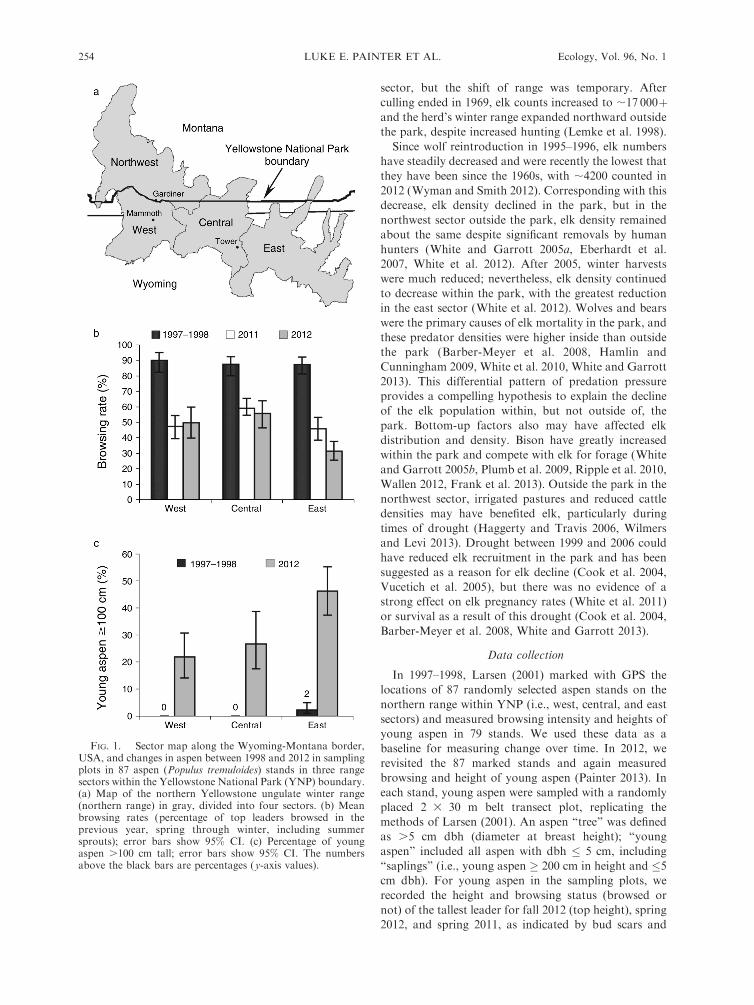
FIG. 1. Sector map along the Wyoming-Montana border,USA, and changes in aspen between 1998 and 2012 in samplingplots in 87 aspen (Populus tremuloides) stands in three rangesectors within the Yellowstone National Park (YNP) boundary.(a) Map of the northern Yellowstone ungulate winter range(northern range) in gray, divided into four sectors. (b) Meanbrowsing rates (percentage of top leaders browsed in theprevious year, spring through winter, including summersprouts); error bars show 95% CI. (c) Percentage of youngaspen .100 cm tall; error bars show 95% CI. The numbersabove the black bars are percentages (y-axis values).
LUKE E. PAINTER ET AL.254 Ecology, Vol. 96, No. 1

browsing scars (Ripple and Beschta 2007). We also
located the five tallest young aspen in each stand and
used plant architecture to assess height and browsing
status during previous years (Ripple and Beschta 2007).
Because we were interested in the effects of herbivory,
young aspen that were protected by a physical barrier
and had no evidence of past browsing were not included,
although these were rare. For each stand, we recorded
slope, aspect, and topographic position (riparian if
associated with a stream, or not riparian). We counted
the number of fallen trees and boulders .30 cm above
the ground within 3 m of sampling plots, and within 3 m
of the five tallest young aspen (Ripple and Beschta
2007).
As an index of ungulate use (Ripple et al. 2001, White
et al. 2003), we counted ungulate fecal piles, including
those of elk, bison, deer, and pronghorn, in four parallel
23 50 m belt transects spaced 7 m apart, placed outside
of the stand perimeter in the nearest open area within 10
m of the stand. These plots were not placed within aspen
stands because many stands were wet or mesic, with very
dense ground cover and standing water for part of the
spring and summer. Scat piles were unlikely to persist
and difficult to detect in these conditions. Placing the
scat plots in the adjacent grassland resulted in more
consistent scat persistence and detection. Scat densities
are likely to be higher in these locations compared to the
stand interior (White et al. 2003). This method provided
an index of relative ungulate densities in association
with aspen stands in recent years, but scat densities were
partially decoupled from some small-scale site factors
such as the number of logs or complexity of terrain in
the interior of stands. Elk pellets may persist for five
years or more in xeric grassland (E. J. Larsen and W. J.
Ripple, unpublished data), and all piles were counted
regardless of age. An index for openness of view was
calculated from the average distance (to 900 m, the
rangefinder limit) at which view was obstructed (.50%)
in the four directional quadrants (Ripple and Beschta
2006), viewed from the ungulate scat plots.
Analysis
Mean annual browsing rate (percentage of top leaders
browsed in the previous year, spring through winter)
and mean height of young aspen were calculated first
within each stand and then averaged across all stands
within a sector. Heights in 1997–1998 were categorical,
so the percentage �100 cm was used for comparison
with 2012. Browsing rate calculations did not include
saplings (i.e., �200 cm tall). We compared browsing
rates and heights between 1997–1998 and 2012 using
bias-corrected 95% confidence intervals (CI) calculated
by the adjusted bootstrap percentile method (Davison
and Hinkley 1997) with 10 000 iterations, using the
function ‘‘boot.ci’’ in the software R (R Development
Core Team 2008). Bootstrapping was used because data
from 1997–1998 had much greater skew than data from
2012. In the 1997–1998 data, new aspen sprouts of the
summer were not distinguished from older young aspen,
so the calculated browsing rate underestimated the
actual browsing rate for the previous year in stands
with new sprouts. Although we used this method for
comparison with the 1997–1998 baseline (Fig. 1b), for
further analysis of 2012 data we removed new sprouts,
resulting in a slightly higher estimate of the percentage
browsed. Using t statistics, we calculated 95% CI for
mean browsing rate, spring height, and elk or bison scat
density in 2012 for each sector. Confidence intervals
showed that significant differences between sectors were
primarily between the east and west sectors, so t tests
(unequal variance) were used to analyze differences
between these sectors.
We compared explanatory models for the following
response variables: browsing rate in 2012, young aspen
spring height in 2012 (in random plots and of the five
tallest), and elk or bison scat density in 2012 (Appendix:
Table A1). Models included variables hypothesized to
influence these response variables, and were compared
using the corrected Akaike information criterion, AICc
(Burnham and Anderson 2002). Models with an AIC
score within 2 units of the lowest score were considered
equivalent. A natural logarithm transformation was
used where needed for constant variance. Explanatory
variables are shown in the Appendix (Table A1), and
include range sector (East, Central, West), slope, aspect
(South or not, where south includes southwest and
southeast), Leader length, Browsing rate (for sampling
plots), number of logs and boulders (Logs), topographic
position (Riparian or not), openness of view (View), and
distance to coniferous forest (Conifer distance). Not all
explanatory variables were used for each response
variable; see Table A1. We expected an inverse
relationship between height and browsing. We expected
gentle slopes, southerly aspect, and location in the west
sector to be positively related to ungulate scat density
and browsing rate. Browsing was expected to decrease
and height to increase with number of logs, greater
distance from conifers, and riparian position. We
expected both height and browsing to be positively
related to leader length, because greater growth could
result in greater height after release from browsing, and
elk may prefer browsing on more vigorous plants.
We calculated scat densities by sector, and used
kriging (ArcMap v.10, Spatial Analyst; cell size and
search distance 3 km; ESRI 2010) for an interpolated
map of elk and bison scat density. To assess the
possibility that bison may affect aspen recruitment, we
calculated browsing rates for young aspen in sampling
plots pooled in two groups by height, ,100 cm (spring
height) and 100–200 cm. Most browsing by bison occurs
at heights ,100 cm (Painter and Ripple 2012). Second,
we hypothesized that high densities of bison in the east
sector have resulted in more browsing of aspen in
summer, and tested this by comparing summer browsing
rates between east and west sectors. We also calculated
an average browsing rate for nine stands with high bison
January 2015 255RECOVERING ASPEN FOLLOW ELK DYNAMICS
scat densities but very low elk scat densities, where
browsing probably would be from bison.
Elk population density
We calculated elk population density by sector (Fig.
1a) (White et al. 2012) for all years for which count unitdata were available, 1987–2012 (except 1989, 1995–1997,
and 2001). Winter elk count data were collected by theNorthern Yellowstone Cooperative Wildlife WorkingGroup (unpublished data), including the area of each
count unit. Total counts for each sector were divided bythe area of that sector to estimate density. We mapped
average elk density by count unit for the years 1987–1994 and 2005–2011. A sightability correction (count/
0.75) is often applied to elk counts (Wagner 2006,Eberhardt et al. 2007), but having no data on how this
factor might vary by sector or unit, we did not adjust forsightability, consistent with similar previously published
estimates (White et al. 2012; P. J. White, personalcommunication). We also summed the elk counts for
units inside the park, and calculated the ratio of elkinside/outside the park annually. To test for a shift in
distribution to the northwest sector outside the park, theratio of elk inside/outside was averaged for the years
1987–1994 (n¼ 7, one year missing), and was comparedwith the average for 2005–2012 (n ¼ 8 years), using a t
test with unequal variance (Welch’s).
SWE and precipitation
As an index to winter severity, we combined SWE(snow-water equivalent) data from two snow course
monitoring stations (NRCS 2012), Lupine Creek (Sta-tion 10e01) in the west-central part of the northern
range, and Northeast Entrance (Station 10d07s) near theeastern edge. Measurements for the first day of each
month (January–April for Lupine Creek, January–Mayfor Northeast Entrance) were averaged for the years
1985–2012, and the yearly averages used to calculate amean SWE for this period.
RESULTS
Aspen
In 1997–1998, browsing rates were near 90% (Fig. 1b)
and young aspen were consistently short (Fig. 1c), as inearlier studies that found young aspen on the northern
range to be generally , 50 cm tall (Barmore 1967, 2003,Kay 1990). In 2011 and 2012, browsing rates were lower
and more variable compared with 1997–1998 (Fig. 1b).Although there was wide variation within sectors in 2012
(Appendix: Fig. A1), stands with the lowest browsingrates and tallest young aspen were mostly in the east. In
2012, browsing rates (not counting new sprouts)averaged 37% (95% CI: 30–45%) in the east, 62%(95% CI: 53–71%) in the central, and 63% (95% CI: 53–74%) in the west sector. Comparing the east and west
sectors in 2012, browsing rates in the east weresignificantly lower (t58 ¼ 3.9, P , 0.001) and spring
heights significantly taller (t58 ¼ 4.0, P , 0.001).
Variance in young aspen height was also greater in the
east (F36,22 ¼ 2.84, P ¼ 0.006). The summer browsing
rate in 2012 was 15 points higher (t26¼ 2.1, P¼ 0.001) in
the west (20% of leaders browsed in summer) compared
to the east (5% browsed in summer), despite high bison
densities in the east in summer. Browsing rates by height
were: east sector, 48% below 100 cm and 14% at 100–200
cm; central sector 66% and 21%; and west sector 62%and 25%, respectively. The five tallest young aspen in
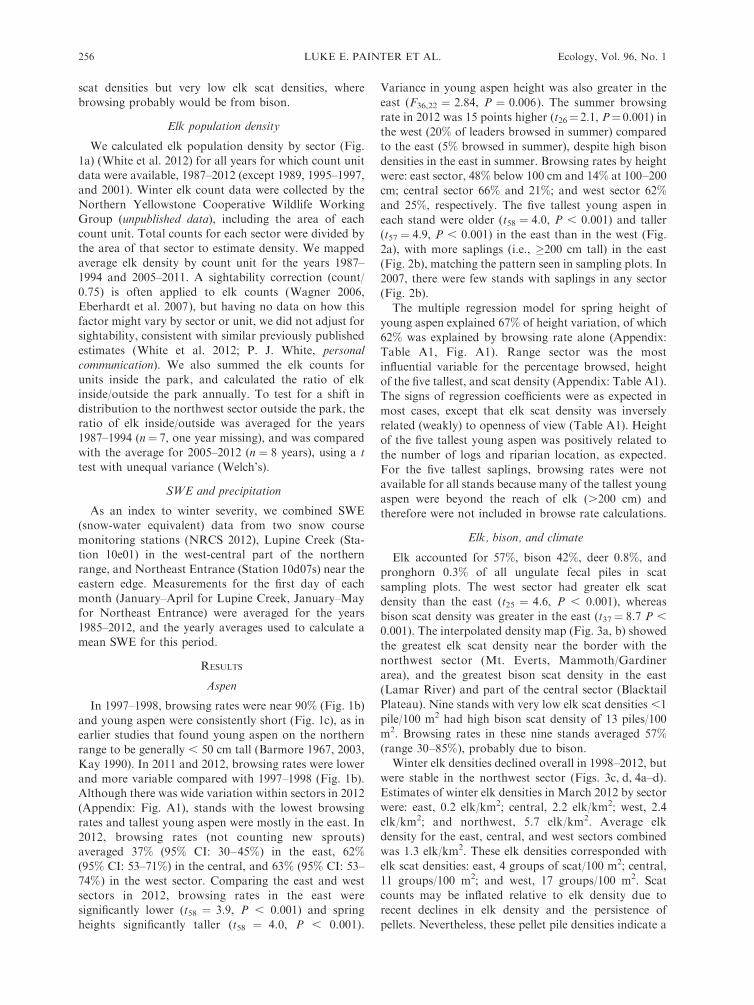
each stand were older (t58 ¼ 4.0, P , 0.001) and taller
(t57 ¼ 4.9, P , 0.001) in the east than in the west (Fig.
2a), with more saplings (i.e., �200 cm tall) in the east
(Fig. 2b), matching the pattern seen in sampling plots. In
2007, there were few stands with saplings in any sector
(Fig. 2b).
The multiple regression model for spring height of
young aspen explained 67% of height variation, of which
62% was explained by browsing rate alone (Appendix:
Table A1, Fig. A1). Range sector was the most
influential variable for the percentage browsed, height
of the five tallest, and scat density (Appendix: Table A1).
The signs of regression coefficients were as expected in
most cases, except that elk scat density was inversely
related (weakly) to openness of view (Table A1). Height
of the five tallest young aspen was positively related to
the number of logs and riparian location, as expected.
For the five tallest saplings, browsing rates were not
available for all stands because many of the tallest young
aspen were beyond the reach of elk (.200 cm) and
therefore were not included in browse rate calculations.
Elk, bison, and climate
Elk accounted for 57%, bison 42%, deer 0.8%, and
pronghorn 0.3% of all ungulate fecal piles in scat
sampling plots. The west sector had greater elk scat
density than the east (t25 ¼ 4.6, P , 0.001), whereas
bison scat density was greater in the east (t37¼ 8.7 P ,
0.001). The interpolated density map (Fig. 3a, b) showed
the greatest elk scat density near the border with the
northwest sector (Mt. Everts, Mammoth/Gardiner
area), and the greatest bison scat density in the east
(Lamar River) and part of the central sector (Blacktail
Plateau). Nine stands with very low elk scat densities ,1
pile/100 m2 had high bison scat density of 13 piles/100
m2. Browsing rates in these nine stands averaged 57%(range 30–85%), probably due to bison.
Winter elk densities declined overall in 1998–2012, but
were stable in the northwest sector (Figs. 3c, d, 4a–d).
Estimates of winter elk densities in March 2012 by sector
were: east, 0.2 elk/km2; central, 2.2 elk/km2; west, 2.4
elk/km2; and northwest, 5.7 elk/km2. Average elk
density for the east, central, and west sectors combined
was 1.3 elk/km2. These elk densities corresponded with
elk scat densities: east, 4 groups of scat/100 m2; central,
11 groups/100 m2; and west, 17 groups/100 m2. Scat
counts may be inflated relative to elk density due to
recent declines in elk density and the persistence of
pellets. Nevertheless, these pellet pile densities indicate a
LUKE E. PAINTER ET AL.256 Ecology, Vol. 96, No. 1
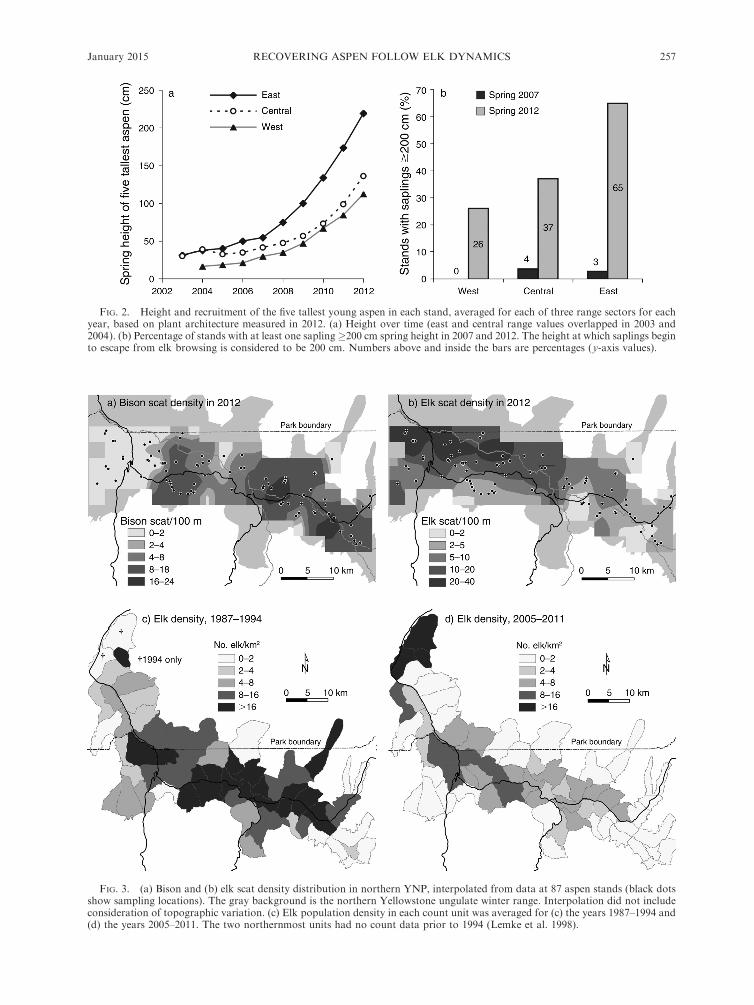
FIG. 2. Height and recruitment of the five tallest young aspen in each stand, averaged for each of three range sectors for eachyear, based on plant architecture measured in 2012. (a) Height over time (east and central range values overlapped in 2003 and2004). (b) Percentage of stands with at least one sapling�200 cm spring height in 2007 and 2012. The height at which saplings beginto escape from elk browsing is considered to be 200 cm. Numbers above and inside the bars are percentages (y-axis values).
FIG. 3. (a) Bison and (b) elk scat density distribution in northern YNP, interpolated from data at 87 aspen stands (black dotsshow sampling locations). The gray background is the northern Yellowstone ungulate winter range. Interpolation did not includeconsideration of topographic variation. (c) Elk population density in each count unit was averaged for (c) the years 1987–1994 and(d) the years 2005–2011. The two northernmost units had no count data prior to 1994 (Lemke et al. 1998).
January 2015 257RECOVERING ASPEN FOLLOW ELK DYNAMICS
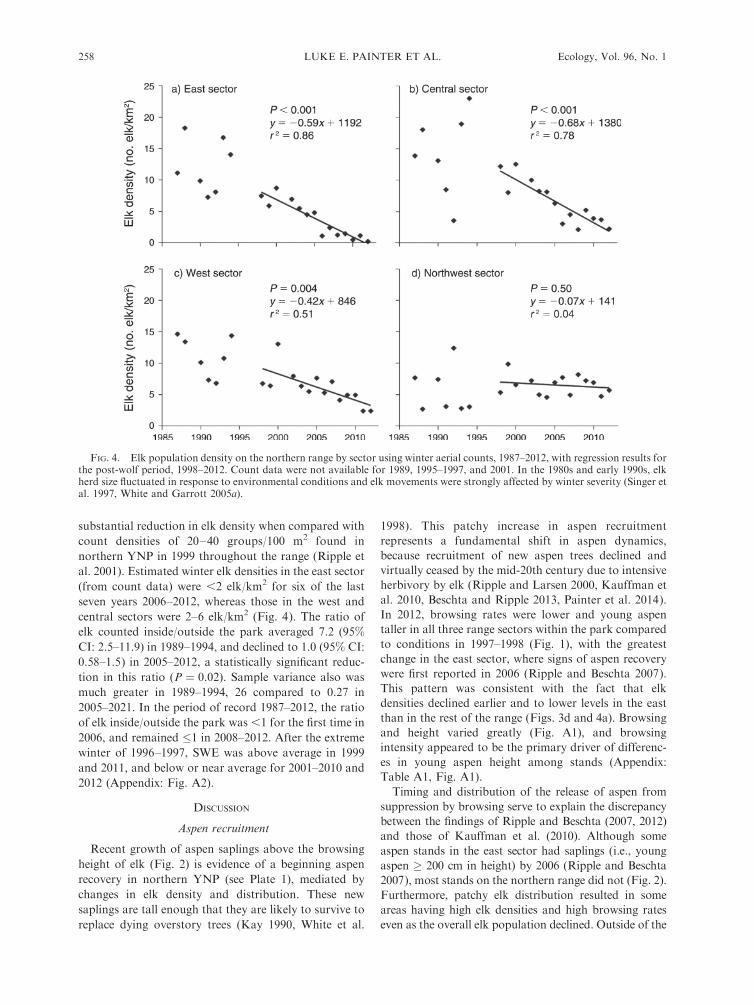
substantial reduction in elk density when compared with
count densities of 20–40 groups/100 m2 found in
northern YNP in 1999 throughout the range (Ripple et
al. 2001). Estimated winter elk densities in the east sector
(from count data) were ,2 elk/km2 for six of the last
seven years 2006–2012, whereas those in the west and
central sectors were 2–6 elk/km2 (Fig. 4). The ratio of
elk counted inside/outside the park averaged 7.2 (95%
CI: 2.5–11.9) in 1989–1994, and declined to 1.0 (95% CI:
0.58–1.5) in 2005–2012, a statistically significant reduc-
tion in this ratio (P ¼ 0.02). Sample variance also was
much greater in 1989–1994, 26 compared to 0.27 in
2005–2021. In the period of record 1987–2012, the ratio
of elk inside/outside the park was ,1 for the first time in
2006, and remained �1 in 2008–2012. After the extreme
winter of 1996–1997, SWE was above average in 1999
and 2011, and below or near average for 2001–2010 and
2012 (Appendix: Fig. A2).
DISCUSSION
Aspen recruitment
Recent growth of aspen saplings above the browsing
height of elk (Fig. 2) is evidence of a beginning aspen
recovery in northern YNP (see Plate 1), mediated by
changes in elk density and distribution. These new
saplings are tall enough that they are likely to survive to
replace dying overstory trees (Kay 1990, White et al.
1998). This patchy increase in aspen recruitment
represents a fundamental shift in aspen dynamics,
because recruitment of new aspen trees declined and
virtually ceased by the mid-20th century due to intensive
herbivory by elk (Ripple and Larsen 2000, Kauffman et
al. 2010, Beschta and Ripple 2013, Painter et al. 2014).
In 2012, browsing rates were lower and young aspen
taller in all three range sectors within the park compared
to conditions in 1997–1998 (Fig. 1), with the greatest
change in the east sector, where signs of aspen recovery
were first reported in 2006 (Ripple and Beschta 2007).
This pattern was consistent with the fact that elk
densities declined earlier and to lower levels in the east
than in the rest of the range (Figs. 3d and 4a). Browsing
and height varied greatly (Fig. A1), and browsing
intensity appeared to be the primary driver of differenc-
es in young aspen height among stands (Appendix:
Table A1, Fig. A1).
Timing and distribution of the release of aspen from
suppression by browsing serve to explain the discrepancy
between the findings of Ripple and Beschta (2007, 2012)
and those of Kauffman et al. (2010). Although some
aspen stands in the east sector had saplings (i.e., young
aspen � 200 cm in height) by 2006 (Ripple and Beschta
2007), most stands on the northern range did not (Fig. 2).
Furthermore, patchy elk distribution resulted in some
areas having high elk densities and high browsing rates
even as the overall elk population declined. Outside of the
FIG. 4. Elk population density on the northern range by sector using winter aerial counts, 1987–2012, with regression results forthe post-wolf period, 1998–2012. Count data were not available for 1989, 1995–1997, and 2001. In the 1980s and early 1990s, elkherd size fluctuated in response to environmental conditions and elk movements were strongly affected by winter severity (Singer etal. 1997, White and Garrott 2005a).
LUKE E. PAINTER ET AL.258 Ecology, Vol. 96, No. 1

park in 2006, in the northwest sector of the range, Kimble
et al. (2011) found some new aspen saplings, but most
stands were still suppressed by herbivory from elk and
cattle, consistent with continued high elk densities in the
northwest sector (Fig. 4d). More recently, aspen recruit-
ment increased in a portion of the northwest sector as a
result of decreased browsing (Runyon et al. 2014).
Similarly, our data inside the park show that the
percentage of stands with saplings has increased since
about 2005 as browsing rates have declined (Fig. 2). If elk
densities continue to decline, browsing rates may be
further reduced. Alternatively, if densities stabilize at
recent levels of 2–4 elk/km2 on the west side of the range,
aspen may be partially suppressed as in some other elk–
wolf systems with similar elk densities (White et al. 1998,
2003). A more complete aspen recovery may require
lower elk densities, ,2 elk/km2, as recently occurred in
the east sector.
Changes in elk density and distribution
From 1950 to 1970, northern Yellowstone elk
numbers were similar to the low numbers of the last
decade, due to culling by the park service that ended in
1969, yet aspen herbivory remained intensive in the
park, preventing significant aspen recruitment (Barmore
1967, 2003, Houston 1982, YNP 1997). In the 1960s,
and for most of 20th century, most of the elk herd
wintered within the park boundary, maintaining high
densities (.4 elk/km2) even when overall numbers were
low (Houston 1982). The difference in the last decade, in
which a similar elk population size has been associated
with reduced herbivory, appears to be due to changes in
the distribution of elk, resulting in a large proportion of
the herd spending winter outside the park (Fig. 3d).
Without this departure from historical patterns, elk
densities would likely have remained high enough to
suppress aspen recruitment, even with a reduction in
overall elk numbers. For example, elk density inside the
park in 2012 was 1.3 elk/km2, but most of the herd
wintered outside the park in the northwest sector. If 90%of the total herd had wintered in the park, as happened
in the 1960s, elk density in the park would have been
nearly three times greater (3.6 elk/km2). The number of
elk killed annually by wolves in the park (Smith et al.
2004, White and Garrott 2005a) has been comparable to
rates of culling in the park in the 1960s (Houston 1982),
but the outcome has been very different, with a large-
scale shift in distribution of elk to the northwest sector
of the range, even before the winter hunt was reduced in
2006 (Fig. 4).
Despite the near elimination of winter elk hunting
after 2005 (White et al. 2012), lower wolf numbers after
2007 (Smith et al. 2013), mild winters after 1999
(Appendix: Fig. A2), and the end of the regional
drought by 2007 (McMenamin et al. 2008, White and
Garrott 2013, Painter et al. 2014), the trend of declining
elk density inside the park continued through 2012 (Fig.
4). Other elk populations in the region experiencing a
similar climate regime did not decline except where
wolves and grizzly bears (Ursus arctos) were relatively
abundant (Hamlin and Cunningham 2009, Creel et al.
2013, White and Garrott 2013), pointing to predation as
a likely cause. Furthermore, suppression of elk recruit-
ment due to drought or predation cannot explain the
steady decline in elk numbers inside the park after 1997
without the additional factors of (1) a strong shift in elk
winter range selection, or (2) increased mortality of
adult elk wintering in the park, of which wolves have
been the leading cause (White and Garrott 2005a, White
et al. 2010). Although bears take many elk calves in
spring (Barber-Meyer et al. 2008), they rarely take
adults and do not prey on elk in winter.
In addition to higher mortality and lower recruitment
of elk in the Lamar River herd segment (White et al.
2012), there is some evidence for changes in habitat
selection by elk in response to wolves (Proffitt et al.
2009, White et al. 2009). After wolf reintroduction, elk
home ranges increased in size and elk movements were
more dynamic, with some elk dispersing to new areas
(Gower et al. 2009, White et al. 2010). Although most
cow elk tracked on the northern range between 2000 and
2008 showed a high degree of fidelity to their winter
range, 39% changed their winter range toward the west
and northwest (White et al. 2010). These changes
suggest that some of the shift in distribution of the elk
herd may have been behavioral. The factors most
different now inside the park compared to the past
century are the presence of wolves, increased predation
by bears, and a larger bison population. Outside the
park, elk have benefited from reductions in hunting and
hunting access, fewer predators than in the park, and
access to irrigated fields with high-quality forage, human
influences that may contribute to a shift in elk
distribution (Haggerty and Travis 2006, Berger 2007,
Proffitt et al. 2009, 2013, Wilmers and Levi 2013). In a
similar pattern, after wolves recolonized Banff National
Park, Canada, elk distribution shifted toward areas of
high human activity and low predator density (human
shielding), reducing browsing on aspen and willow in
remote areas (White et al. 2003, Hebblewhite et al. 2005,
Hebblewhite and Merrill 2011). Regardless of the
mechanism, the result has been a reduction in elk
density in some areas of the northern range and an
associated reduction in herbivory of aspen. Elk densities
also became less variable as the population declined
(Fig. 4), and since 1997, mortality inside the park has
been primarily due to predation (Barber-Meyer et al.
2008, White et al. 2010), suggesting that top-down
limitation of elk has been occurring without additional
culling for probably the first time since elk counts began
in the 1930s (Houston 1982, White and Garrott 2005a).
Behavioral responses to predation and the importance
of scale
Trophic cascades involving wolves, elk, and plants are
usually discussed as either density mediated at a
January 2015 259RECOVERING ASPEN FOLLOW ELK DYNAMICS

landscape scale (White et al. 2012), or behaviorally
mediated at the small scale of topographic features, or
piles of logs (Ripple and Beschta 2007, Kauffman et al.
2010, Winnie 2012). This paradigm, however, may be
inadequate to describe recent changes on the northern
range, where large-scale changes in elk density and
distribution may have a behavioral component in
response to predators as well as human hunters.
Furthermore, behavioral responses by elk at an inter-
mediate scale could also affect plants, such as changes in
movements, grouping behavior, range size, and habitat
use that occurred when wolves returned to Yellowstone
(Mao et al. 2005, Gude et al. 2006, Gower et al. 2009,
White et al. 2009, 2012). A more complete understand-
ing of the interactions of predators, ungulates, and
woody browse plants may result from consideration of
responses to predation at multiple scales (White et al.
2003).
Our results suggest that widespread aspen recovery
required a substantial reduction in elk density. Small-
scale behavioral responses to risk may have had local
effects on browsing (e.g., Ripple and Beschta 2007), but
were not sufficient to relieve suppression of aspen on a
broad scale. With elk densities reduced, behavioral
effects of predation may explain some of the variation in
browsing among stands in the same area (Appendix:
Fig. A1). White et al. (2003) found evidence of small-
scale effects of predation risk on aspen recruitment in
Canadian national parks, but only in areas of low-to-
moderate elk density (,4 elk/km2). We found that
young aspen were taller in riparian stands and stands
with more logs (Appendix: Table A1), as did Ripple and
Beschta (2012b) These variables could be related to the
risk of predation (Ripple and Beschta 2007, Eisenberg
2012, Kuijper et al. 2013), but also to the convenience of
accessing young aspen by elk or bison. Both factors may
be operating, and would be difficult to distinguish as elk
densities decline and bison increase. Also, predation risk
effects may be temporally variable (Creel and Winnie
2005), and even a short period of browsing can prevent
aspen growth (Fitzgerald and Bailey 1984), reducing the
potential for behavioral responses to benefit aspen. For
example, much browsing of aspen occurs in late fall
(Barmore 1967, 2003) when predation risk may be less
than later in winter, when elk are weak and snow is deep.
Bison distribution and browsing
Distributions of bison and elk on the northern range
differed, as evidenced by scat densities and annual
counts (Fig. 3). Timing of range use was different as
well, with bison remaining year-round in places that elk
use primarily in winter (Painter and Ripple 2012, Frank
PLATE 1. Tall young aspen saplings in the eastern sector of the Yellowstone northern range. Recently recruited saplings wereabout 4 m tall when this photo was taken in September 2010, well above the height of most elk browsing. Photo credit: W. J.Ripple. Additional aspen photos from the study area in 2010 (Ripple and Bescheta 2012b) are available online at: http://hdl.handle.net/1957/25603
LUKE E. PAINTER ET AL.260 Ecology, Vol. 96, No. 1
et al. 2013). Bison may have been limited by competition
with elk in the past (Houston 1982, Coughenour 2005,
White and Garrott 2005b), but bison on the northern
range increased threefold between 1998 and 2012
(Plumb et al. 2009, Ripple et al. 2010, Wallen 2012),
expanding into range vacated by elk, or perhaps
displacing elk. The extent to which bison may have
affected elk distribution is unknown, but the situation is
clearly different from the past, with intensive range use
by bison in some places removing forage that otherwise
would be available for elk.
In recent years, bison have intensively browsed willow
and cottonwood in portions of the east sector (Painter
and Ripple 2012, Rose 2012), and we have observed
bison browsing on aspen. High browsing rates in stands
with very low elk density but high bison density suggest
that bison may reduce or prevent aspen recruitment in
some stands; however, bison have not prevented a
general trend toward aspen recovery. Browsing rates on
young aspen were generally low in the east sector,
despite high bison density. Browsing rates of aspen on
the northern range were very low (,25%) at heights
above the reach of bison (.100 cm), suggesting that
aspen taller than 100 cm may no longer be strongly
suppressed by herbivory from either elk or bison.
CONCLUSIONS
The complex relationship of aspen and elk in YNP’s
northern range will continue to unfold, interacting with
large predators (Hamlin et al. 2009, Creel et al. 2013), an
increasing bison population (Painter and Ripple 2012),
changing climate and fire regimes (Wilmers and Getz
2005, Wilmers et al. 2012), changes in land use and
hunting outside the park (Haggerty and Travis 2006,
Proffitt et al. 2013, Wilmers and Levi 2013), and other
facets of the Yellowstone ecosystem (White and Garrott
2013). In 1997–1998, young aspen on the northern range
remained suppressed by browsing, as had been the case
for decades. By 2006 there was an important shift in
aspen dynamics beginning in the east sector, following
reductions in rates of browsing (Fig. 4), and by 2012, all
three sectors of the range in the park had stands with
saplings taller than the browse height of elk (Fig. 2b).
Where herbivory has been reduced, bottom-up factors
such as site productivity may become more important
drivers of young aspen height, as has happened with
willow (Salix spp.) in some places on the northern range
(Tercek et al. 2010, Marshall et al. 2013).
Although elk mortality, recruitment, and habitat use
may be affected by various factors, it is likely that
predation in the park, especially from wolves, played a
substantial role in declining elk numbers and shifting elk
distribution (White and Garrott 2013). The resulting
increase in aspen recruitment is evidence of a trophic
cascade at a landscape scale. Changing elk dynamics and
the beginning aspen recovery in Yellowstone are
consistent with top-down control of large ungulate prey
by large carnivores (Ripple and Beschta 2012a, Creel et
al. 2013, White and Garrott 2013), with cascading effects
in the ecosystem.
ACKNOWLEDGMENTS
We received financial support from the University ofWyoming-National Park Service Research Station. YNPbiologists P. J. White, Doug Smith, and Rick Wallen providedungulate count data and other helpful information. Commentsby P. J. White, Christopher Wilmers, and two anonymousreviewers greatly improved the manuscript. We thank fieldtechnicians Jeff Stephens and Jonathan Batchelor. ArielMuldoon assisted with statistical analysis. Our thanks also toHenry Finkbeiner and Doug McLaughlin of Silver GateLodging for their support.
LITERATURE CITED
Barber-Meyer, S. M., L. D. Mech, and P. J. White. 2008. Elkcalf survival and mortality following wolf restoration toYellowstone National Park. Wildlife Monographs 169:1–30.
Barmore, W. J. 1967. Conflicts in recreation: elk versus aspen inYellowstone National Park. Paper presented at the 20thAnnual Meeting, American Society of Range Management.Office of Natural Sciences, National Park Service, Wash-ington, D.C., USA.
Barmore, W. J. 2003. Ecology of ungulates and their winterrange in northern Yellowstone National Park. Research andsynthesis 1962–1970. U.S. Department of the Interior,National Park Service, Yellowstone Center for Resources,Research Library, Yellowstone National Park, MammothHot Springs, Wyoming, USA.
Berger, J. 2007. Fear, human shields and the redistribution ofprey and predators in protected areas. Biology Letters 3:620–623.
Beschta, R. L., and W. J. Ripple. 2013. Are wolves savingYellowstone’s aspen? A landscape-level test of a behaviorallymediated trophic cascade: comment. Ecology 94:1420–1425.
Beschta, R. L., and W. J. Ripple. 2014. Divergent patterns ofriparian cottonwood recovery after the return of wolves inYellowstone, USA. Ecohydrology. http://dx.doi.org/10.1002/eco.1487
Beyer, H. L., E. H. Merrill, N. Varley, and M. S. Boyce. 2007.Willow on Yellowstone’s northern range: evidence for atrophic cascade? Ecological Applications 17:1563–1571.
Burnham, K. P., and D. R. Anderson. 2002. Model selectionand multimodel inference: a practical information-theoreticapproach. Second edition. Springer, New York, New York,USA.
Cook, R. C., J. G. Cook, and L. D. Mech. 2004. Nutritionalcondition of northern Yellowstone elk. Journal of Mammal-ogy 85:714–722.
Coughenour, M. B. 2005. Bison and elk in YellowstoneNational Park—Linking ecosystem, animal nutrition, andpopulation processes. Part 2. Final Report to U.S. Geolog-ical Survey, Biological Resources Division, Bozeman, Mon-tana, USA.
Coughenour, M. B., and F. J. Singer. 1996. Elk populationprocesses in Yellowstone National Park under the policy ofnatural regulation. Ecological Applications 6:573–593.
Creel, S., and J. A. Winnie, Jr. 2005. Responses of elk herd sizeto fine-scale spatial and temporal variation in the risk ofpredation by wolves. Animal Behaviour 69:1181–1189.
Creel, S., J. A. Winnie, Jr., and D. Christianson. 2013.Underestimating the frequency, strength and cost of anti-predator responses with data from GPS collars: an examplewith wolves and elk. Ecology and Evolution 3:5189–5200.
Davison, A. C., and D. V. Hinkley. 1997. Bootstrap methodsand their application. Cambridge University Press, NewYork, New York, USA.
Eberhardt, L. L., P. J. White, R. A. Garrott, and D. B.Houston. 2007. A seventy-year history of trends in Yellow-
January 2015 261RECOVERING ASPEN FOLLOW ELK DYNAMICS

stone’s northern elk herd. Journal of Wildlife Management71:594–602.
Eisenberg, C. 2012. Complexity of food web interactions in alarge mammal system. Dissertation. Oregon State University,Corvallis, Oregon, USA.
ESRI. 2010. ArcMap v. 10. Environmental Systems ResearchInstitute, Redlands, California, USA.
Fitzgerald, R. D., and A. W. Bailey. 1984. Control of aspenregrowth by grazing with cattle. Journal of Range Manage-ment 37:156–158.
Frank, D. A., R. L. Wallen, and P. J. White. 2013. Assessingthe effects of climate and wolf restoration on grasslandprocesses. Pages 195–208 in P. J. White, R. A. Garrott, andG. E. Plumb, editors. Yellowstone’s wildlife in transition.Harvard University Press, Cambridge, Massachusetts, USA.
Gower, C. N., R. A. Garrott, P. J. White, F. G. R. Watson,S. S. Cornish, and M. S. Becker. 2009. Spatial responses ofelk to wolf predation risk: using the landscape to balancemultiple demands. Pages 373–399 in R. A. Garrott, P. J.White, and F. G. R. Watson, editors. The ecology of largemammals in central Yellowstone. Academic Press/Elsevier,Cambridge, Massachusetts, USA.
Gude, J. A., R. A. Garrott, J. J. Borkowski, and F. King. 2006.Prey risk allocation in a grazing ecosystem. EcologicalApplications 16:285–298.
Haggerty, J. H., and W. R. Travis. 2006. Out of administrativecontrol: Absentee owners, resident elk and the shifting natureof wildlife management in southwestern Montana. Geoforum37:816–830.
Hamlin, K. L., and J. A. Cunningham. 2009. Monitoring andassessment of wolf–ungulate interactions and populationtrends within the Greater Yellowstone Area, southwesternMontana, and Montana statewide: Final Report. MontanaDepartment of Fish, Wildlife, and Parks, Wildlife Division,Helena, Montana, USA.
Hamlin, K. L., R. A. Garrott, P. J. White, and J. A.Cunningham. 2009. Contrasting wolf–ungulate interactionsin the Greater Yellowstone Ecosystem. Pages 541–577 inR. A. Garrott, P. J. White, and F. G. R. Watson, editors. TheEcology of Large Mammals in Central Yellowstone. Aca-demic Press/Elsevier, Cambridge, Massachusetts, USA.
Hebblewhite, M., and E. H. Merrill. 2011. Demographicbalancing of migrant and resident elk in a partially migratorypopulation through forage–predation tradeoffs. Oikos 120:1860–1870.
Hebblewhite, M., C. A. White, C. G. Nietvelt, J. A. McKenzie,T. E. Hurd, J. M. Fryxell, S. E. Bayley, and P. C. Paquet.2005. Human activity mediates a trophic cascade caused bywolves. Ecology 86:2135–2144.
Houston, D. B. 1982. The northern Yellowstone elk: ecologyand management. Macmillan, New York, New York, USA.
Kauffman, M. J., J. F. Brodie, and E. S. Jules. 2010. Are wolvessaving Yellowstone’s aspen? A landscape-level test of abehaviorally mediated trophic cascade. Ecology 91:2742–2755.
Kauffman, M. J., N. Varley, D. W. Smith, D. R. Stahler, D. R.MacNulty, and M. S. Boyce. 2007. Landscape heterogeneityshapes predation in a newly restored predator–prey system.Ecology Letters 10:690–700.
Kay, C. E. 1990. Yellowstone’s northern elk herd: a criticalevaluation of the ‘‘natural regulation’’ paradigm. Disserta-tion. Utah State University, Logan, Utah, USA.
Kimble, D. S., D. B. Tyers, J. Robison-Cox, and B. F. Sowell.2011. Aspen recovery since wolf reintroduction on thenorthern Yellowstone winter range. Rangeland Ecologyand Management 64:119–130.
Kuijper, D. P. J., C. de Kleine, M. Churski, P. van Hooft, J.Bubnicki, and B. Jedrzejewska. 2013. Landscape of fear inEurope: wolves affect spatial patterns of ungulate browsingin Białowieza Primeval Forest, Poland. Ecography 36:1263–1275.
Larsen, E. J. 2001. Aspen age structure and stand conditions onelk winter range in the northern Yellowstone ecosystem.Dissertation. Oregon State University, Corvallis, Oregon,USA.
Larsen, E. J., and W. J. Ripple. 2005. Aspen stand conditionson elk winter ranges in the northern Yellowstone ecosystem,USA. Natural Areas Journal 25:326–338.
Lemke, T. O., J. A. Mack, and D. B. Houston. 1998. Winterrange expansion by the northern Yellowstone elk herd.Intermountain Journal of Sciences 4:1–9.
Mao, J. S., M. S. Boyce, D. W. Smith, F. J. Singer, D. J. Vales,J. M. Vore, and E. H. Merrill. 2005. Habitat selection by elkbefore and after wolf reintroduction in Yellowstone NationalPark. Journal of Wildlife Management 69:1691–1707.
Marshall, K. N., N. T. Hobbs, and D. J. Cooper. 2013. Streamhydrology limits recovery of riparian ecosystems after wolfreintroduction. Proceedings of the Royal Society B 280:20122977.
McMenamin, S. K., E. A. Hadly, and C. K. Wright. 2008.Climatic change and wetland desiccation cause amphibiandecline in Yellowstone National Park. Proceedings of theNational Academy of Sciences USA 105:16988–16993.
NRC (National Research Council). 2002. Ecological dynamicson Yellowstone’s northern range. National Academy Press,Washington, D.C., USA.
NRCS (National Resource Conservation Service). 2012.SNOTEL data and products. USDA, National Water andClimate Center. http://www.wcc.nrcs.usda.gov/snow/
Painter, L. E. 2013. Trophic cascades and large mammals in theYellowstone ecosystem. Dissertation. Oregon State Univer-sity, Corvallis, Oregon, USA.
Painter, L. E., R. L. Beschta, E. J. Larsen, and W. J. Ripple.2014. After long-term decline, are aspen recovering innorthern Yellowstone? Forest Ecology and Management329:108–117.
Painter, L. E., and W. J. Ripple. 2012. Effects of bison onwillow and cottonwood in northern Yellowstone NationalPark. Forest Ecology and Management 264:150–158.
Plumb, G. E., P. J. White, M. B. Coughenour, and R. L.Wallen. 2009. Carrying capacity, migration, and dispersal inYellowstone bison. Biological Conservation 142:2377–2387.
Proffitt, K. M., J. L. Grigg, K. L. Hamlin, and R. A. Garrott.2009. Contrasting effects of wolves and human hunters on elkbehavioral responses to predation risk. Journal of WildlifeManagement 73:345–356.
Proffitt, K. M., J. A. Gude, K. L. Hamlin, and M. A. Messer.2013. Effects of hunter access and habitat security on elkhabitat selection in landscapes with a public and private landmatrix. Journal of Wildlife Management 77:514–524.
R Development Core Team. 2008. R: A language andenvironment for statistical computing. R Foundation forStatistical Computing, Vienna, Austria.
Ripple, W. J., and R. L. Beschta. 2006. Linking wolves towillows via risk-sensitive foraging by ungulates in thenorthern Yellowstone ecosystem. Forest Ecology and Man-agement 230:96–106.
Ripple, W. J., and R. L. Beschta. 2007. Restoring Yellowstone’saspen with wolves. Biological Conservation 138:514–519.
Ripple, W. J., and R. L. Beschta. 2012a. Large predators limitherbivore densities in northern forest ecosystems. EuropeanJournal of Wildlife Research 58:733–742.
Ripple, W. J., and R. L. Beschta. 2012b. Trophic cascades inYellowstone: the first 15 years after wolf reintroduction.Biological Conservation 145:205–213.
Ripple, W. J., R. L. Beschta, J. K. Fortin, and C. T. Robbins.2014a. Trophic cascades from wolves to grizzly bears inYellowstone. Journal of Animal Ecology 83:223–233.
Ripple, W. J., et al. 2014b. Status and ecological effects of theWorld’s largest carnivores. Science 343:1241484. http://dx.doi.org/10.1126/science.1241484
LUKE E. PAINTER ET AL.262 Ecology, Vol. 96, No. 1
Ripple, W. J., and E. J. Larsen. 2000. Historic aspenrecruitment, elk, and wolves in northern YellowstoneNational Park, USA. Biological Conservation 95:361–370.
Ripple, W. J., E. J. Larsen, R. A. Renkin, and D. W. Smith.2001. Trophic cascades among wolves, elk and aspen onYellowstone National Park’s northern range. BiologicalConservation 102:227–234.
Ripple, W. J., L. E. Painter, R. L. Beschta, and C. C. Gates.2010. Wolves, elk, bison, and secondary trophic cascades inYellowstone National Park. Open Ecology Journal 3:31–37.
Rose, J. R. 2012. Barriers to establishment and growth ofcottonwoods in Yellowstone National Park’s northern range.Thesis. Colorado State University, Fort Collins, Colorado,USA.
Runyon, M. J., D. B. Tyers, B. F. Sowell, and C. N. Gower.2014. Aspen restoration using beaver on the northernYellowstone winter range under reduced ungulate herbivory.Restoration Ecology 22:555–561.
Singer, F. J., A. Harting, K. K. Symonds, and M. B.Coughenour. 1997. Density dependence, compensation, andenvironmental effects on elk calf mortality in YellowstoneNational Park. Journal of Wildlife Management 61:12–25.
Smith, D. W., T. D. Drummer, K. M. Murphy, D. S. Guernsey,and S. B. Evans. 2004. Winter prey selection and estimationof wolf kill rates in Yellowstone National Park, 1995–2000.Journal of Wildlife Management 68:153–166.
Smith, D. W., R. O. Peterson, and D. B. Houston. 2003.Yellowstone after wolves. BioScience 53:330–340.
Smith, D. W., et al. 2013. Yellowstone Wolf Project: AnnualReport, 2012. YCR-2013-02. U.S. Department of theInterior, National Park Service, Yellowstone Center forResources, Yellowstone National Park, Mammoth HotSprings, Wyoming, USA.
Terborgh, J., and J. A. Estes, editors. 2010. Trophic cascades:predators, prey, and the changing dynamics of nature. IslandPress, Washington, D.C., USA.
Tercek, M. T., R. Stottlemyer, and R. Renkin. 2010. Bottom-upfactors influencing riparian willow recovery in YellowstoneNational Park. Western North American Naturalist 70:387–399.
Vucetich, J. A., D. W. Smith, and D. R. Stahler. 2005. Influenceof harvest, climate and wolf predation on Yellowstone elk,1961–2004. Oikos 111:259–270.
Wagner, F. H. 2006. Yellowstone’s destabilized ecosystem: elkeffects, science, and policy conflict. Oxford University Press,New York, New York, USA.
Wallen, R. L. 2012. Abundance and distribution of Yellow-stone bison, July 2012. U.S. Department of the Interior,National Park Service, Yellowstone Center for Resources,Yellowstone National Park, Mammoth Hot Springs, Wyo-ming, USA.
White, C. A., M. C. Feller, and S. Bayley. 2003. Predation riskand the functional response of elk–aspen herbivory. ForestEcology and Management 181:77–97.
White, C. A., C. E. Olmsted, and C. E. Kay. 1998. Aspen, elk,and fire in the Rocky Mountain national parks of NorthAmerica. Wildlife Society Bulletin 26:449–462.
White, P. J., and R. A. Garrott. 2005a. Northern Yellowstoneelk after wolf restoration. Wildlife Society Bulletin 33:942–955.
White, P. J., and R. A. Garrott. 2005b. Yellowstone’s ungulatesafter wolves—expectations, realizations, and predictions.Biological Conservation 125:141–152.
White, P. J., and R. A. Garrott. 2013. Predation: wolfrestoration and the transition of Yellowstone elk. Pages 69–93 in P. J. White, R. A. Garrott, and G. E. Plumb, editors.Yellowstone’s wildlife in transition. Harvard UniversityPress, Cambridge, Massachusetts, USA.
White, P. J., R. A. Garrott, S. Cherry, F. G. R. Watson, C. N.Gower, M. S. Becker, and E. Meredith. 2009. Changes in elkresource selection and distribution with the reestablishmentof wolf predation risk. Pages 451–476 in R. A. Garrott, P. J.White, and F. G. R. Watson, editors. The ecology of largemammals in central Yellowstone. Academic Press/Elsevier,Cambridge, Massachusetts, USA.
White, P. J., R. A. Garrott, K. L. Hamlin, R. C. Cook, J. G.Cook, and J. A. Cunningham. 2011. Body condition andpregnancy in northern Yellowstone elk: Evidence forpredation risk effects? Ecological Applications 21:3–8.
White, P. J., R. A. Garrott, and G. E. Plumb, editors. 2013.Yellowstone’s wildlife in transition. Harvard UniversityPress, Cambridge, Massachusetts, USA.
White, P. J., K. M. Proffitt, and T. O. Lemke. 2012. Changes inelk distribution and group sizes after wolf restoration.American Midland Naturalist 167:174–187.
White, P. J., K. M. Proffitt, L. D. Mech, S. B. Evans, J. A.Cunningham, and K. L. Hamlin. 2010. Migration ofnorthern Yellowstone elk: implications of spatial structuring.Journal of Mammalogy 91:827–837.
Wilmers, C. C., C. T. Dairmont, and M. Hebblewhite. 2012.Restoring predators as a hedge against climate change. Pages330–346 in J. F. Brodie, E. S. Post, and D. F. Doak, editors.Wildlife conservation in a changing climate. University ofChicago Press, Chicago, Illinois, USA.
Wilmers, C. C., and W. M. Getz. 2005. Gray wolves as climatechange buffers in Yellowstone. PLoS Biology 3:e92.
Wilmers, C. C., and T. Levi. 2013. Do irrigation and predatorcontrol reduce the productivity of migratory ungulate herds?Ecology 94:1264–1270.
Winnie, J. A. 2012. Predation risk, elk, and aspen: tests of abehaviorally mediated trophic cascade in the GreaterYellowstone Ecosystem. Ecology 93:2600–2614.
Wyman, T., and D. W. Smith. 2012. 2011–2012 Annual wintertrend count of northern Yellowstone elk. U.S. Department ofthe Interior, National Park Service, Yellowstone Center forResources, Yellowstone National Park, Mammoth HotSprings, Wyoming, USA.
YNP (Yellowstone National Park). 1997. Yellowstone’s north-ern range: complexity and change in a wildland ecosystem.U.S. Department of the Interior, National Park Service,Yellowstone Center for Resources, Yellowstone NationalPark, Mammoth Hot Springs, Wyoming, USA.
SUPPLEMENTAL MATERIAL
Ecological Archives
The Appendix is available online: http://dx.doi.org/10.1890/14-0712.1.sm
January 2015 263RECOVERING ASPEN FOLLOW ELK DYNAMICS