reconstruction and analysis of metabolic...
TRANSCRIPT

1
Reconstruction and Analysis of Metabolic
Networks

2
Outline
• What is a Reconstruction?• Data Collection• Interactions Between Network
Components• Special Considerations• Applications

3Genome-scale Metabolic Model Reconstruction
ORGANISM
Genome Annotation
Genome Annotation- by homology, location
Network ReconstructionInferred Reactions- indirect, inferred from
biomass requirements
Inferred Reactions
Metabolic Model
BiochemistryBiochemical Data- protein characterized
CellPhysiology
Physiological Data- indirect, pathway known
New PredictionsEmergent Properties
QuantitativeAnalyticalMethods
Quantitative Analysis- simulate cell behavior - drive experimental studies

4
Model Development:an iterative process
Computational,Biochemical Investigation
- Biochemical data- Revised ORF assignments
ORGANISM
Network Reconstruction
Metabolic Model
New PredictionsEmergent Properties
QuantitativeAnalyticalMethods
Genome Annotation
Inferred Reactions
BiochemistryCell
Physiology
Genome-scale Metabolic Model Reconstruction

5
What is in a reconstruction?
Genome:Genome:Annotated genesGene locationRegulatory regionsWobble base pairs
Biochemistry:Biochemistry:StereochemistrypH and pKa (charge)Elemental balanceCharge balanceMultiple reactions/enzymeMultiple enzymes/reaction
Transcription/translation:Transcription/translation:Gene to transcript to protein
to reaction associationTranscript half-livestRNA abundancesRibosomal capacities
Physiology:Physiology:Flux dataKnock-outsBalanced functionsOverall phenotypic behaviorLocation of gene product
compartmentalization
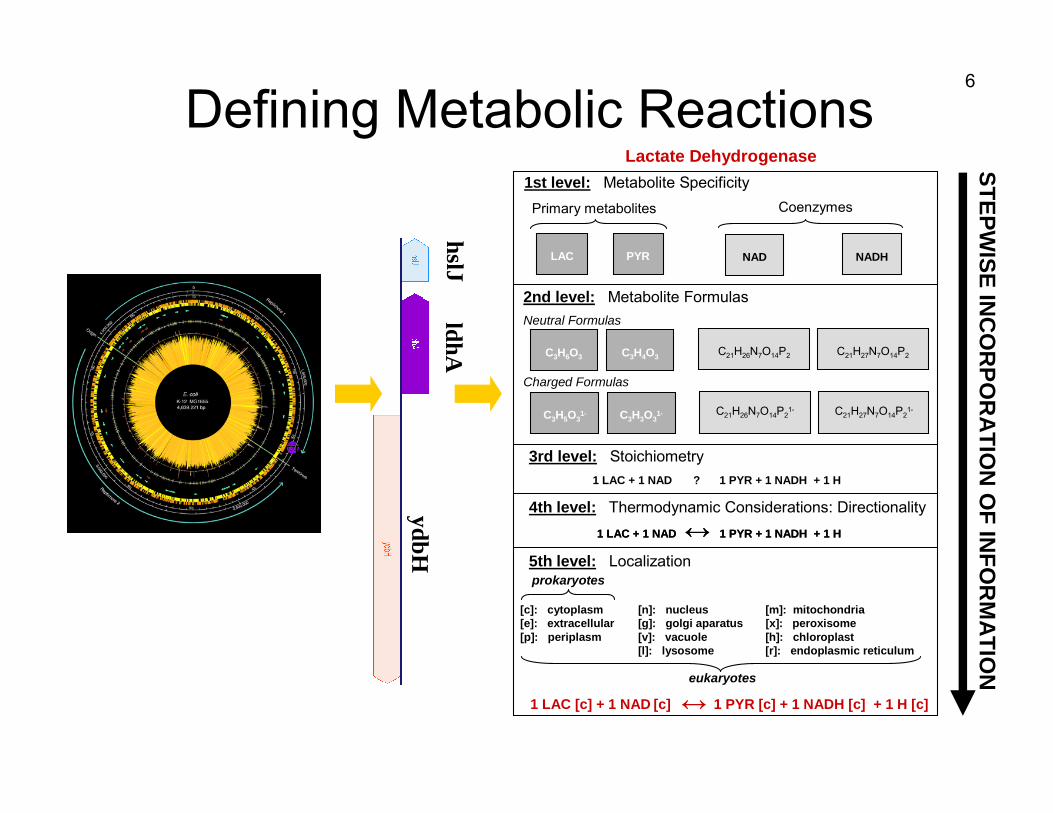
6
Defining Metabolic Reactions
ldhAhslJ
ydbH
3rd level: Stoichiometry
4th level: Thermodynamic Considerations: Directionality
1 LAC + 1 NAD ? 1 PYR + 1 NADH + 1 H
LAC
Lactate Dehydrogenase
prokaryotes
eukaryotes
Primary metabolites Coenzymes
PYR
Charged Formulas
C3H6O3
C3H5O31-
C3H4O3
C3H3O31-
C21H26N7O14P2
NADH
5th level: Localization
1 LAC [c] + 1 NAD [c] 1 PYR [c] + 1 NADH [c] + 1 H [c]↔
1 LAC + 1 NAD 1 PYR + 1 NADH + 1 H↔1 LAC + 1 NAD 1 PYR + 1 NADH + 1 H↔
NAD
[c]: cytoplasm [n]: nucleus [m]: mitochondria[e]: extracellular [g]: golgi aparatus [x]: peroxisome[p]: periplasm [v]: vacuole [h]: chloroplast
[l]: lysosome [r]: endoplasmic reticulum
2nd level: Metabolite FormulasNeutral Formulas
C21H26N7O14P21-
C21H27N7O14P2
C21H27N7O14P21-
1st level: Metabolite Specificity
STEPWISE IN
CO
RPO
RA
TION
OF IN
FOR
MA
TION

7
Genome Sequence & Annotation
Genome Sequence & Annotation
LocalizationAvailable LiteratureAvailable Literature
DatabasesDatabases
Phylogenetic Data
Bacteria Archaea Eukarya
Phylogenetic Data
Bacteria Archaea EukaryaBacteria Archaea Eukarya
Physiological Data
Growth Measurements
00.10.20.30.4
0 4 9 14 19 24Time (Hours)
OD
600
Physiological Data
Growth Measurements
00.10.20.30.4
0 4 9 14 19 24Time (Hours)
OD
600
Signal sequences...PLLLLPISGSALP...
Sources of Information

8
HEX1 PGI PFK FBA TPI GAPD PGK PGM ENO PYKatp -1 0 -1 0 0 0 1 0 0 1glc -1 0 0 0 0 0 0 0 0 0adp 1 0 1 0 0 0 -1 0 0 -1g6p 1 -1 0 0 0 0 0 0 0 0h 1 0 1 0 0 1 0 0 0 -1
f6p 0 1 -1 0 0 0 0 0 0 0fdp 0 0 1 -1 0 0 0 0 0 0
dhap 0 0 0 1 -1 0 0 0 0 0g3p 0 0 0 1 1 -1 0 0 0 0nad 0 0 0 0 0 -1 0 0 0 0pi 0 0 0 0 0 -1 0 0 0 0
13dpg 0 0 0 0 0 1 -1 0 0 0nadh 0 0 0 0 0 1 0 0 0 03pg 0 0 0 0 0 0 1 -1 0 02pg 0 0 0 0 0 0 0 1 -1 0pep 0 0 0 0 0 0 0 0 1 -1h2o 0 0 0 0 0 0 0 0 1 0pyr 0 0 0 0 0 0 0 0 0 1
fbaA,fbaB[c]fdp ↔ dhap + g3pFBA
pykA,pykF[c]adp + h + pep → atp + pyrPYKeno[c]2pg ↔ h2o + pepENOgpmA,gpmB[c]3pg ↔ 2pgPGMpgk[c]13dpg + adp ↔ 3pg + atpPGKgapA,gapC_1,gapC_2[c]g3p + nad + pi ↔ 13dpg + h + nadhGAPDtpiA[c]dhap ↔ g3pTPI
pfkA,pfkB[c]atp + f6p → adp + fdp + hPFKpgi[c]g6p ↔ f6pPGIglk[c]glc +atp → g6p + adpHEX1GenesGlycolytic ReactionsAbbr.
PYK: IF pykA OR pykFENO: IF enoGAPD: IF gapA OR (gapC_1
AND gapC_2)
Reconstruction of Glycolytic Pathway
Network Assembly and Representation

9
• Incorporating Biomass Composition• Incorporating Biomass Composition
• ATP Maintenance Calculation
ATP
(mm
ol/g
DW
/h)
D (1/h)
ATPm
ATPbiomass
• ATP Maintenance Calculation
ATP
(mm
ol/g
DW
/h)
D (1/h)
ATPm
ATPbiomass
• Physiological Data Comparison
qCO
2(m
mol
/gD
W/h
)
D (1/h)
qO2
(mm
ol/g
DW
/h)
D (1/h)
ExperimentModel
ExperimentModel
• Physiological Data Comparison
qCO
2(m
mol
/gD
W/h
)
D (1/h)
qO2
(mm
ol/g
DW
/h)
D (1/h)
ExperimentModel
ExperimentModel
• Filling Network Gaps• Filling Network Gaps
• Knockout Data Comparison• Knockout Data Comparison
IIIII IVI
ATPase
1.5 H+ 3 H+
3 H+
Inner Membrane
Outer Membrane
• P/O Ratio Calculation
ETSII
III IVIATPase
1.5 H+ 3 H+
3 H+
Inner Membrane
Outer Membrane
• P/O Ratio Calculation
ETS
• Precursor Metabolite Formation
Network Evaluation

10
Data Collection
I. Genome AnnotationII. BiochemistryIII. Physiology

11
I. Genome Annotation• 433,238 protein
sequences derived from whole genomes (expected to reach 1 million by 2005)
• 101,602 entries in Swiss Prot
• High-quality annotation requires substantial effort

12
Genome Annotation: how to• Open Reading Frame (ORF) Identification
- Start & Stop codons, GLIMMER.• “Traditional” Annotation Methods
- Experimental (direct)- Sequence homology- Generally covers 40-70% of new genomes
• New Annotation Methods- Protein-protein interactions- Correlated mRNA expression levels- Phylogenetic profile clustering- Protein fusion- Gene neighbors (operon clustering)

13
Genome Databases: TIGR
The Comprehensive Microbial Resource (CMR)• 353 completed bacterial genomes • 28 completed archaeal genomes• Single-genome analysis:
– Genome overview, – list by role category (eg amino acid biosynthesis)– analysis methods, searches
• Multi-genome analysis also available
http://cmr.tigr.org/tigr-scripts/CMR/CmrHomePage.cgi

14
Genome Databases: TIGR

15
Genome Databases: NCBIMicrobial Genomes Resources • 595 completed microbial genomes (47 archael)• FTP sites for Protein Annotations (ptt files)

16
Reaction:
ATP + D-Glucose –>
ADP + D-Glucose 6-phosphate
Enzyme: Glucokinase
Gene: glk
II. Biochemical Data: Reactions
E.C.: 2.7.1.1 Human ß-cell glk http://www.rcsb.org/pdb/
stoichiometry and reversibility

17
Trust the E.C. Nomenclature!
• Not widely availablefor other types of gene products (T.C. numbers are being developed)
• Kudos to enzymologists
• Make sure to balance elements when writing reaction
EC 1 Oxidoreductases
EC 1.1 Acting on the CH-OH group of donorsEC 1.1.1 With NAD or NADP as acceptorEC 1.1.2 With a cytochrome as acceptorEC 1.1.3 With oxygen as acceptorEC 1.1.4 With a disulfide as acceptorEC 1.1.5 With a quinone or similar compound as acceptorEC 1.1.99 With other acceptors
EC 1.2 Acting on the aldehyde or oxo group of donorsEC 1.2.1 With NAD or NADP as acceptorEC 1.2.2 With a cytochrome as acceptorEC 1.2.3 With oxygen as acceptorEC 1.2.4 With a disulfide as acceptorEC 1.2.7 With an iron-sulfur protein acceptorEC 1.2.99 With other acceptors
EC 1.3 Acting on the CH-CH group of donorsEC 1.3.1 With NAD or NADP as acceptorEC 1.3.2 With a cytochrome as acceptorEC 1.3.3 With oxygen as acceptorEC 1.3.5 With a quinone or related compound as acceptorEC 1.3.7 With an iron-sulfur protein as acceptor

18KEGGhttp://www.genome.jp/kegg/kegg2.html

19
How are these reconstructions different than KEGG?
Network Maps
Reaction Entries
Compound Entries
Don’t show which compounds participate in the reactions
Don’t show localization infoDon’t include
details on ionization state
Not elementally or charge balanced
http://www.genome.jp/ligand/

20Charge Determination on Metabolite at neutral pH
Identify compound & look up in KEGGhttp://www.genome.ad.jp/dbget-bin/www_bfind?compound
Determine and identify ionizable group
Determine acid and base forms
Determine pKa values based on the identifiable group (in the Table)
•If pKa > pH, acid form dominant•If pKa < pH, base form dominant

21
Ionizable Groups 1GROUP ACID BASE + H+ pKa
Terminal Carboxyl -COOH –COO- ~4
Primary(Secondary,
Tertiary)Amine
-NH3+ –NH2 > 9
Thiol -SH –S- + H+ ~8.5
O-
Phenol + H+ ~10
+ H+
+ H+

22
Ionizable Groups 2GROUP ACID BASE + H+ pKa
Primary Alcohol -CH2OH –CH2O- + H+ ~15
Acetamide(Amide)
+ H+OH+
~0
Urea(Carbamide) + H+
OH+
~1
GuanidoGroup
H-N-C-NH2
NH2+
H-N-C-NH2
NH
+ H+ ~12

23
Ionizable Groups 3GROUP ACID BASE + H+ pKa
PyridineH+
+ H+ ~5
Pyrimidine
H+
+ H+ ~0
ImidazoleH+
+ H+ ~7
Pyrole + H+ ~ -1H2
+

24
Ionizable Groups 4GROUP ACID BASE + H+ pKa
Pyrrolidine(Like Sec Amine)
+ H+ ~10
Aniline + H+ ~5
H+
H+
-O
Benzoic Acid + H+ ~4

25
Ionizable Groups 5: Purines & Pyrimidines
CytosineUracilThymine
Adenine Guanine
Net Charge = 0 !

26
Example : Arginosuccinate
Example: Argininosuccinate
Neutral MF: C10H18N4OpKa: 1.62, 2.70, 4.26, 9.58, >12
Net Charge: -1Charged MF: C10H17N4O6
GuanidopKa ~ 12
Primary AminepKa ~ 9

27
Biochemical Data:Curation and Expansion of the
Network
Glucose G-6-P F-6-P FDP
H. pylori Glycolysis according to KEGG:
H. pylori Glycolysis according to Hoffman et al.(1996):
Glucose G-6-P F-6-P FDP

28
Organism-specific Textbooks
• Great starting point• Broad view of the organism’s metabolism,
biochemistry, physiology, uses, etc.

29
III. Physiological Information and Inferred Reactions:
Filling in the Gaps based on indirect
evidence

30Filling in the Gaps – an Example• Experiments determine
which amino acids are taken up by H. pylori vs. which can be produced in vivo
• Missing steps of amino acid biosynthesis are added if necessary on the basis of this physiological evidence
AA Reynolds ModelAla - -Arg - -Asn + +Asp + +Cys + +Gln + +Glu + +Gly + +His - -Ile - -Leu - -Lys + +Met - -Phe - -Pro + +Ser + +Thr + +Trp + +Tyr + +Val - -
Amino Acid Requirements
in vivo in silico

31
Inferred Reactions
• Some reactions are included based on indirect physiological evidence (by inference)– Assumption: the cell must be able to produce
all biomass components to grow – Reactions are added if necessary– Generally transporters, etc.– Most tentative; should be examined more
carefully

32
Reaction Confidence: Sources of Evidence
•• BiochemicalBiochemicalEnzyme has been tested biochemically.
•• GeneticGeneticGene overexpression and purification, gene deletions.
•• SequenceSequenceThere is significant sequence similarity to another gene with known function.
•• PhysiologicalPhysiologicalThere is physiological data to support inclusion in the model.
•• ModelingModelingReaction is included to improve simulation results.
Incr
easi
ng C
onfid
ence
Kinetic AssayOverexpression86% HomologyGrows on Ascorbate

33
Gene to Reaction Connections

34Escherichia coli Metabolism
http://gcrg.ucsd.edu/organisms/ecoli_maps.html

35
One gene, many reactions: tktA
Many genes, one reaction: frdABCD
From Genes to Reactions
Four subunits combine to form fumarate reductase enzyme, catalyzing
FUM + FADH2 SUCC + FAD
E. coli frdABCD http://www.rcsb.org/pdb/
One gene encodes transketolase I enzyme, catalyzingR5P + X5P T3P1 + S7PE4P + X5P T3P1 + F6P
Not all genes have a one-to-one relationship with their corresponding enzymes or reactions

36
Integrating “-omics” Data
Genomics ORF annotation
TranscriptomicsmRNA levels
Proteomicsprotein levels
“Fluxomics”flux measurements
ORF
gene
protein
reactions

37
Example of Isozymesfructose-1,6-bisphosphate aldolase

38
A More Complex ExamplePyruvate Metabolism

39
Succinate Dehydrogenase
Xylose ABC Transporter
Pyruvate Kinase
Enolase
4 subunits2 reactions
(135/904 Genes interact as Subunits)
2 isozymes1 reaction
(149/931 Reactionshave multiple isozymes)
Protein complex(3 proteins)1 reaction
(153/904 Genes interact as PCs)
1 gene1 reaction
(342/904 Genesare one-to-one)
http://gcrg.ucsd.edu/organisms/ecoli_GPR.html

40
Special Considerations

41Biomass Composition• Indicates demands of
the system (more detail in modeling section of class)
• Precursors may also be used for smaller networks
• Approximation of Biomass composition for less-characterized organisms (H. pylori, H. influenzae)
(trace)SUCCOA1.1AKG1.8OXA3.7ACCOA2.8PYR0.5PEP1.53PG0.1GA3P0.4E4P0.9R5P0.1F6P0.2G6P18.2NADPH3.5NAD+
41.3ATPDemand (mmol)Metabolite

42
Generally: ↑Nutrient uptake↑Growth rate

43
Charge Considerations
• An underappreciated aspect of building reaction networks—electrical charge should be conserved in all reactions
• Phosphofructokinase (from KEGG):ATP + F6P => ADP + FDP
-4 -2 -3 -4charges + += -6 = -7
+ H+
+ 1= -6

44
Finding Compound Charges• Consult diagram and look at each chemical
group independently• Determine if H’s are attached or dissociated at
cellular pH (attached if pKa<pH)—can find pKavalues
• F6P:
Both H’s dissociateat cellular pH, leaving a charge of -2

45
pyr acald + co2
Balancing Reactions: An Example
pyruvate decarboxylase
C3H3O3 C2H4O CO2 ELEMENTALLY IMBALANCED (H and O)ELEMENTALLY IMBALANCED (H and O)(0)(-1) (0) CHARGE IMBALANCEDCHARGE IMBALANCED
Solution # 1:
h2o + pyr acald + co2 + ½ o2 + h+
H2O O2 HC3H3O3 C2H4O CO2 ELEMENTALLY BALANCED(0) (0) (+1)(0)(-1) (0) CHARGE IMBALANCED
Solution # 2:
H C3H3O3 C2H4O CO2 ELEMENTALLY BALANCED(+1) (0)(-1) (0) CHARGE BALANCED
Solution # 3:h+ + pyr acald + co2

46
mitochondria
vacuolenucleus
endoplasmic reticulum Golgi
apparatus
peroxisome
cytosol
extracellular space
Compartmentalization
There are 8 compartments included in our yeast model
May need to infer transport reactions between compartments
H+, ATP, NADH, NADPH must be balanced within each compartment

47
Protein Localization• Compartmentalization is a key part
of network reconstruction• Both a component (static
localization) and state (dynamic localization) data type
• Techniques typically based on GFP-tagging of proteins or isolation of specific organelles
• Potential problems:– Effect of the GFP tag on localization– Usually human assistance is required in
image analysis– Condition dependence: e.g. mitochondrial
localization agrees only in 30% of cases in yeast between three different data sets
Huh et al. Nature 425:686 (2003)
nucleus nucl. per. ER
bud neck mitochon. lip. ves

48
Mitochondrial Isolation: Protein Identification
• 657 distinct proteins• 498 (81%) functionally
classified into 15 cellular processes.
• 153 unique enzymatic activities– Glycolysis, TCA cycle,
oxidative phosphorylation, urea cycle, fatty acid oxidation, lipid and heme biosynthesis. Taylor S. et al, Nature Biotech (21), 2003

49
Metabolic Databases

50
Gen
ome-
Sca
le
Rec
onst
ruct
ions