reconstructing population dynamics of yellow-cedar in declining stands: baseline information from...
TRANSCRIPT

BioOne sees sustainable scholarly publishing as an inherently collaborative enterprise connecting authors, nonprofitpublishers, academic institutions, research libraries, and research funders in the common goal of maximizing access tocritical research.
Reconstructing Population Dynamics of Yellow-Cedar inDeclining Stands: Baseline Information from Tree RingsAuthor(s): Amanda B. Stan, Thomas B. Maertens, Lori D. Daniels, and StefanZeglenSource: Tree-Ring Research, 67(1):13-25. 2011.Published By: Tree-Ring SocietyDOI: http://dx.doi.org/10.3959/2009-7.1URL: http://www.bioone.org/doi/full/10.3959/2009-7.1
BioOne (www.bioone.org) is a nonprofit, online aggregation of core research in thebiological, ecological, and environmental sciences. BioOne provides a sustainable onlineplatform for over 170 journals and books published by nonprofit societies, associations,museums, institutions, and presses.
Your use of this PDF, the BioOne Web site, and all posted and associated contentindicates your acceptance of BioOne’s Terms of Use, available at www.bioone.org/page/terms_of_use.
Usage of BioOne content is strictly limited to personal, educational, and non-commercialuse. Commercial inquiries or rights and permissions requests should be directed to theindividual publisher as copyright holder.

RECONSTRUCTING POPULATION DYNAMICS OF YELLOW-CEDAR INDECLINING STANDS: BASELINE INFORMATION FROM TREE RINGS
AMANDA B. STAN1*, THOMAS B. MAERTENS1, LORI D. DANIELS1, and STEFAN ZEGLEN2
1Department of Geography, University of British Columbia, Vancouver, British Columbia V6T 1Z2, Canada
2British Columbia Ministry of Forests and Range, Nanaimo, British Columbia V9T 6E9, Canada
ABSTRACT
Yellow-cedar (Chamaecyparis nootkatensis (D. Don) Spach) forests of coastal British Columbia
are apparently experiencing decline in a manner similar to that observed in southeastern Alaska. In this
pilot study, we collect tree-ring data from live and standing dead yellow-cedar trees from four declining
sites on the North Coast of British Columbia. We use this data to compare growth patterns at our sites
to those of yellow-cedar trees at non-declining and declining sites in southwestern British Columbia
and southeastern Alaska and, in addition, to assess the possibility of reconstructing yellow-cedar
population dynamics in declining stands using dendrochronology. We found coherent growth patterns
(i.e. marker years and periods of suppression) among yellow-cedar chronologies from non-declining
and declining sites across a broad geographic range as well as unique growth patterns between our
chronologies from declining sites and those from declining sites in nearby Alaska. Using outer-ring
dates of increment cores, we were able to estimate time since death of decade- to century-old standing
dead yellow-cedar trees, although the precision of the estimates was influenced by partial cambial
mortality and erosion of outer rings. Our results provide baseline dendrochronological information
that will be useful for planning future studies that assess growth-climate relations and reconstruct the
long-term population dynamics of yellow-cedar in declining stands.
Keywords: Dendrochronology, forest decline, tree mortality, decay class, partial cambial
mortality, Chamaecyparis nootkatensis, coastal British Columbia.
INTRODUCTION
In British Columbia, elevated mortality of
yellow-cedar (Chamaecyparis nootkatensis (D.
Don) Spach) occurs on more than 47,000 ha of
coastal forests (Westfall and Ebata 2009). Land-
scape-, stand-, and tree-level patterns of mortality
in British Columbia appear similar to those
documented in southeastern Alaska (Hennon et
al. 2005), where widespread mortality of yellow-
cedar, referred to as yellow-cedar decline, occurs
on more than 200,000 ha of coastal forests (Lamb
and Wurtz 2009). Throughout southeastern
Alaska, dying and dead yellow-cedar trees occur
at lower elevations (,300 m a.s.l.) in more
northerly latitudes and slightly higher elevations
in more southerly latitudes and are most common
on south-facing slopes (Lamb and Wurtz 2009).
Stands often show a radiating pattern of tree
mortality, starting from a nucleus of trees that
died decades ago in open bogs and scrubs and
continuing in trees that died more recently in
adjacent closed-canopy forests (D’Amore and
Hennon 2006). Trees exhibit dieback symptoms
that progress from initial root injury, to subse-
quent crown death as a unit, to eventual tree death
(Hennon and Shaw 1997). Past research in Alaska
suggested that biotic agents were not the primary
cause of death of yellow-cedar (Hennon et al.
1990a, 1990b). More recent hypotheses implicate
factors related to climate change. In particular,
increasing late-winter temperatures are leading to
reduced snowpack and early dehardening of
yellow-cedar, leaving this species susceptible to
late-winter freeze events (Hennon and Shaw 1994;
Hennon et al. 2008; D’Amore et al. 2009). Similar
climate-induced increases in tree mortality have
been postulated as being associated with the
dieback of forests worldwide (Allen et al. 2010).*Corresponding author: [email protected]
TREE-RING RESEARCH, Vol. 67(1), 2011, pp. 13–25
Copyright ’ 2011 by The Tree-Ring Society 13

Given the climate change hypothesis and
immense ecological, cultural, and economic value
of yellow-cedar, understanding the population
dynamics associated with the decline of this
species is of paramount importance. To our
knowledge, the only study on the population
dynamics of yellow-cedar in declining stands is
that of Hennon et al. (1990a), who assessed
temporal changes in populations of standing dead
trees. In that study, the authors applied a decay-
class system for standing dead yellow-cedar (i.e.
Hennon et al. 1990c) in which time-since-death
estimates of trees in different decay classes were
determined indirectly using dates of radial-growth
releases of nearby living hemlock trees.
A dendrochronological approach that in-
cludes directly assessing dead as well as live trees
offers potential to further assess the population
dynamics of yellow-cedar and the decline phe-
nomenon, as it can provide a means to reconstruct
long-term trends in age structure, growth patterns,
as well as recruitment and mortality rates. Because
of yellow-cedar’s great longevity (.1,000 years)
and high resistance to decay following death
(Barton 1976), it may be possible to reconstruct
the dynamics of this species far back in time using
dendrochronology. Parish and Antos (2004, 2006)
used dendrochronological techniques to success-
fully reconstruct the population dynamics of two,
non-declining old-growth stands in southwestern
British Columbia of which yellow-cedar was a
canopy dominant. Although standing dead yel-
low-cedar trees were included in those studies,
they constituted only a small proportion of each
stand. In declining stands in Alaska and British
Columbia, standing dead yellow-cedar trees occur
in higher numbers (Hennon et al. 1990a; Hennon
et al. 2005; D’Amore and Hennon 2006; Westfall
and Ebata 2009). Estimating death dates of
individual yellow-cedar trees may facilitate recon-
structing long-term population dynamics in these
stands. However, limited information exists on the
ability to estimate time since death of yellow-cedar
trees using dendrochronological techniques.
Dendrochronology may also be useful for
evaluating additional aspects of yellow-cedar
mortality and population dynamics in declining
stands. For example, trees in declining stands may
experience partial death of their cambiums at
different points in time (e.g. Amoroso and Daniels
2010). By removing multiple increment cores from
individual yellow-cedar trees, it is possible to
assess the presence of partial cambial mortality
and to quantify the error in estimating death dates
using a single core per tree. This information will
be valuable for developing practical sampling
procedures for evaluating mortality rates in
declining stands.
In this paper, we present a pilot study that
explores the potential of dendrochronological
techniques to reconstruct yellow-cedar population
dynamics and decline. We use tree-ring data from
live and standing dead yellow-cedar trees from
four declining sites on the North Coast of British
Columbia to address three objectives: (1) to
crossdate ring-width series from live, asymptom-
atic trees for the purpose of (i) constructing site-
specific ring-width chronologies for assessing
growth patterns and (ii) crossdating ring-width
series from standing dead trees for estimating time
since death, (2) to evaluate time since death of
standing dead trees relative to their decay classes,
and (3) to investigate the presence of partial
cambial mortality in yellow-cedar. We compare
our findings on crossdating quality, growth
patterns, time since death, and partial cambial
mortality of yellow-cedar to those of other studies
in British Columbia and Alaska. Following our
analyses, we compile baseline information on
yellow-cedar’s growth patterns at our sites relative
to its growth patterns at sites across a broad
geographic range and assess some of the benefits
and limitations of using tree rings to reconstruct
the population dynamics of this species. Together,
this information will help inform and direct future
studies that aim to better understand causes and
effects of yellow-cedar decline.
STUDY SITES
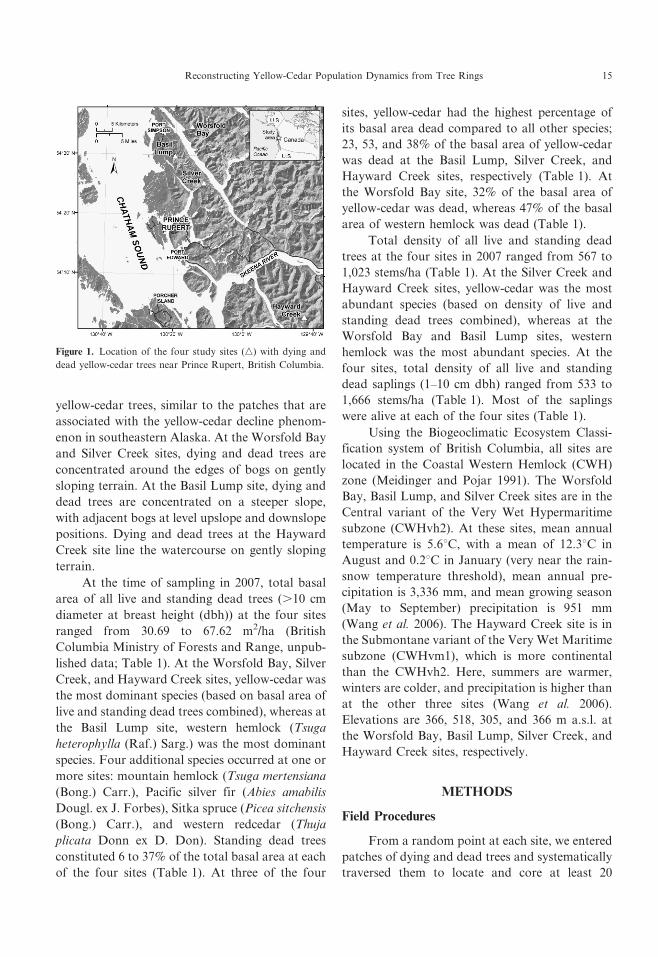
We conducted this research at four sites
within the North Coast Forest District of British
Columbia (Figure 1), each of which were located
in 2004 during an aerial survey near the city of
Prince Rupert (Hennon et al. 2005). All sites
consist of concentrated patches of dying and dead
14 STAN, MAERTENS, DANIELS, and ZEGLEN
yellow-cedar trees, similar to the patches that are
associated with the yellow-cedar decline phenom-
enon in southeastern Alaska. At the Worsfold Bay
and Silver Creek sites, dying and dead trees are
concentrated around the edges of bogs on gently
sloping terrain. At the Basil Lump site, dying and
dead trees are concentrated on a steeper slope,
with adjacent bogs at level upslope and downslope
positions. Dying and dead trees at the Hayward
Creek site line the watercourse on gently sloping
terrain.
At the time of sampling in 2007, total basal
area of all live and standing dead trees (.10 cm
diameter at breast height (dbh)) at the four sites
ranged from 30.69 to 67.62 m2/ha (British
Columbia Ministry of Forests and Range, unpub-
lished data; Table 1). At the Worsfold Bay, Silver
Creek, and Hayward Creek sites, yellow-cedar was
the most dominant species (based on basal area of
live and standing dead trees combined), whereas at
the Basil Lump site, western hemlock (Tsuga
heterophylla (Raf.) Sarg.) was the most dominant
species. Four additional species occurred at one or
more sites: mountain hemlock (Tsuga mertensiana
(Bong.) Carr.), Pacific silver fir (Abies amabilis
Dougl. ex J. Forbes), Sitka spruce (Picea sitchensis
(Bong.) Carr.), and western redcedar (Thuja
plicata Donn ex D. Don). Standing dead trees
constituted 6 to 37% of the total basal area at each
of the four sites (Table 1). At three of the four
sites, yellow-cedar had the highest percentage of
its basal area dead compared to all other species;
23, 53, and 38% of the basal area of yellow-cedar
was dead at the Basil Lump, Silver Creek, and
Hayward Creek sites, respectively (Table 1). At
the Worsfold Bay site, 32% of the basal area of
yellow-cedar was dead, whereas 47% of the basal
area of western hemlock was dead (Table 1).
Total density of all live and standing dead
trees at the four sites in 2007 ranged from 567 to
1,023 stems/ha (Table 1). At the Silver Creek and
Hayward Creek sites, yellow-cedar was the most
abundant species (based on density of live and
standing dead trees combined), whereas at the
Worsfold Bay and Basil Lump sites, western
hemlock was the most abundant species. At the
four sites, total density of all live and standing
dead saplings (1–10 cm dbh) ranged from 533 to
1,666 stems/ha (Table 1). Most of the saplings
were alive at each of the four sites (Table 1).
Using the Biogeoclimatic Ecosystem Classi-
fication system of British Columbia, all sites are
located in the Coastal Western Hemlock (CWH)
zone (Meidinger and Pojar 1991). The Worsfold
Bay, Basil Lump, and Silver Creek sites are in the
Central variant of the Very Wet Hypermaritime
subzone (CWHvh2). At these sites, mean annual
temperature is 5.6uC, with a mean of 12.3uC in
August and 0.2uC in January (very near the rain-
snow temperature threshold), mean annual pre-
cipitation is 3,336 mm, and mean growing season
(May to September) precipitation is 951 mm
(Wang et al. 2006). The Hayward Creek site is in
the Submontane variant of the Very Wet Maritime
subzone (CWHvm1), which is more continental
than the CWHvh2. Here, summers are warmer,
winters are colder, and precipitation is higher than
at the other three sites (Wang et al. 2006).
Elevations are 366, 518, 305, and 366 m a.s.l. at
the Worsfold Bay, Basil Lump, Silver Creek, and
Hayward Creek sites, respectively.
METHODS
Field Procedures
From a random point at each site, we entered
patches of dying and dead trees and systematically
traversed them to locate and core at least 20
Figure 1. Location of the four study sites (n) with dying and
dead yellow-cedar trees near Prince Rupert, British Columbia.
Reconstructing Yellow-Cedar Population Dynamics from Tree Rings 15

yellow-cedar trees in each of two status classes:
live, asymptomatic trees and standing dead trees.
We visually assessed the crowns and boles of trees
(dbh $10 cm) to separate healthy from declining
and dead. Asymptomatic trees were those that had
live and ‘‘healthy’’ crowns (i.e. green) and no
obvious bole damage. We sampled large, and
presumably old, asymptomatic trees to construct
long, robust site chronologies. Standing dead trees
were assessed according to the six-class decay
system for yellow-cedar described by Hennon et
al. (1990c). Nearly all of the sampled trees were in
the most recent decay classes I (at least 10% of the
total foliage retained) to III (at least 10% of the
total secondary branches retained and most twigs
missing), as it was difficult to obtain sound
increment cores with intact sapwood and outer
rings from trees in more advanced stages of decay.
From each tree, we extracted two increment
cores at a height of approximately 30 cm above the
ground. In most instances, the second core was
taken at a location $90u from the first core.
However, for standing dead trees, we took the
second core through the face of scars located at
the base of trees that likely formed prior to the
death of other parts of the bole and did not appear
to be the result of abrasion. By coring through
these scars, we attempted to obtain data that
maximized the difference in outer-ring dates
between cores from the same tree to use in our
analyses of partial cambial mortality. It is
important to note that in using this sampling
approach we did not intend to capture cambial
mortality in yellow-cedar trees with explicit ‘‘strip-
bark morphologies’’. In live individuals with such
growth forms, strips of dead cambium alternate
with strips of live cambium along the length of the
bole, and the parts of the crown that are
associated with the dead cambium are dead as
well. Instead, our sampling approach was aimed at
capturing damage potentially associated with root
death caused by freezing injury.
Table 1. Basal area and density of live and standing dead saplings (1–10 cm dbh) and trees (.10 cm dbh) at four sites near Prince
Rupert, British Columbia (British Columbia Ministry of Forests and Range, unpublished data). For basal area, the percentage dead
of yellow-cedar, western hemlock, and additional species along with the percentage dead of the total are given. Values are means for
three 0.01 ha circular plots (5.64 m radius) that were established within the patch of dying and dead trees at each site where we
collected increment cores from live, asymptomatic and standing dead yellow-cedar trees.
Site1 Species
Basal Area (m2/ha) Density (stems/ha)
Trees Saplings Trees
Live Dead % Dead Live Dead Live Dead
WB yellow-cedar 15.40 7.34 32 167 0 167 100
western hemlock 4.23 3.72 47 700 33 200 100
additional species 0 0 - 33 0 0 0
Total 19.63 11.06 36 900 33 367 200
BL yellow-cedar 6.97 2.12 23 333 0 167 67
western hemlock 28.50 0 - 167 0 433 0
additional species 0 0 - 33 0 0 0
Total 35.47 2.12 6 533 0 600 67
SC yellow-cedar 13.01 14.38 53 433 100 333 400
western hemlock 4.41 1.93 30 933 67 100 67
additional species 10.10 0 - 133 0 133 0
Total 27.52 16.31 37 1,499 167 566 467
HC yellow-cedar 21.32 12.81 38 133 0 300 100
western hemlock 5.42 0.44 8 333 0 133 33
additional species 24.95 2.68 10 533 0 167 67
Total 51.69 15.93 24 999 0 600 200
1 WB 5 Worsfold Bay, BL 5 Basil Lump, SC 5 Silver Creek, and HC 5 Hayward Creek. Note: Additional species include
mountain hemlock (Tsuga mertensiana (Bong.) Carr.), Pacific silver fir (Abies amabilis Dougl. ex J. Forbes), Sitka spruce (Picea
sitchensis (Bong.) Carr.), and western redcedar (Thuja plicata Donn ex D. Don).
16 STAN, MAERTENS, DANIELS, and ZEGLEN
Laboratory Procedures
We prepared all cores from each of the four
sites following the procedures of Stokes and
Smiley (1968). Ring-width series from live, asymp-
tomatic trees were visually crossdated (Yamaguchi
1991), first within individual trees and then among
all trees from a single site. We measured the ring
widths of all series from asymptomatic trees to the
nearest 0.001 mm using a stereozoom microscope
and a Velmex sliding-stage micrometer interfaced
with MeasureJ2X software. We used the program
COFECHA (Holmes 1983; Grissino-Mayer 2001)
to detect crossdating errors and to calculate
average mean sensitivity and average interseries
correlation values, which we used to describe the
crossdating quality of the ring-width series from
each site. Average mean sensitivity measures the
strength of the year-to-year variability in all series,
and average interseries correlation measures the
strength of the signal common to all series. Ring-
width series that could not be confidently cross-
dated were removed from the data set.
We used the program ARSTAN (version 41d
for Windows XP; Cook 1985) to detrend and
standardize ring-width series from asymptomatic
trees and to create a mean chronology for each
site. Prior to detrending, we averaged the two ring-
width series per tree, using only those years that
were accurately dated and common to both series.
To detrend each series, we first fitted a negative
exponential curve, line with a negative slope, or
horizontal line, and subsequently fitted an 80-year
cubic spline with a 50% frequency response. The
first detrending was intended to remove trends
associated with tree age and size, whereas the
second was intended to remove trends associated
with stand dynamics. After each detrending, each
series was standardized to obtain a tree-ring index
value for each year by dividing the actual ring-
width measurements by the values of the fitted
curve, line, or spline. Finally, we created standard
chronologies for the individual sites by averaging
the index values of each series using a bi-weight
robust mean (Cook et al. 1990).
Following the protocols for the asympto-
matic trees, we measured the ring widths of all
standing dead trees. We used COFECHA to
statistically crossdate individual ring-width series
from standing dead trees against the correspond-
ing set of site-specific, dated ring-width series from
asymptomatic trees, which allowed us to assign a
calendar year to each tree ring and thus estimate
the year a tree died. After statistical crossdating,
we visually examined the ring-width series from
each standing dead tree to ensure that all were
accurately dated and had intact outer rings. Ring-
width series that could not be crossdated or that
had broken or indiscernible outer rings were
removed from the data set. For each standing
dead tree remaining in the data set, we first
estimated its year of death using the most recent
outer-ring date of the two ring-width series per
tree and then calculated its time since death (i.e.
2007 – year of death).
Data Analyses
We compared the crossdating quality of the
ring-width series from asymptomatic trees among
the four sites. In addition, we assessed growth
patterns of asymptomatic trees both graphically, by
comparing negative and positive marker rings (i.e.
rings that differed from the mean tree-ring index by
61 standard deviation or more) and suppressions
(i.e. multi-year periods of below-average growth)
among the site-specific chronologies, as well as
quantitatively, by calculating Pearson’s (r) correla-
tion coefficients between individual chronologies.
For standing dead trees, we combined individuals
from all sites and used ANOVA to test for
differences in time since death among decay classes.
To meet the assumptions of normality and homo-
geneity of variance of ANOVA, time-since-death
estimates were transformed using a natural loga-
rithm. We used Tukey’s HSD test to contrast means
among decay classes. To estimate the frequency and
minimum duration of partial cambial mortality in
yellow-cedar, we compared the outer-ring dates of
the two ring-width series from the same standing
dead tree. Finally, we assessed whether the differ-
ence in outer-ring dates between individual ring-
width series from the same standing dead tree
showed an increasing trend with increasing time
since death by calculating Spearman’s (r) correla-
tion coefficient. Statistical analyses were done using
R, version 2.5.0 (R Development Core Team 2007).
Reconstructing Yellow-Cedar Population Dynamics from Tree Rings 17
RESULTS
Live, Asymptomatic Trees
Crossdating quality of the ring-width series
from live, asymptomatic trees was similar among
the four sites (Table 2). Average mean sensitivity
values were 0.24 6 0.01 (mean 6 SD here and
throughout the text). Average interseries correla-
tion values were 0.48 6 0.02.
Growth patterns of live, asymptomatic trees
were similar among the four sites (Figure 2;
Table 3). The site chronologies ranged from 410
to 488 years (Figure 2). Between 1798 and 2006,
the period in which all four chronologies had a
minimum of 10 trees, there was an average of
32.0 6 2.9 negative and 25.0 6 1.7 positive marker
rings. During that same period, all four chronol-
ogies had negative marker rings in seven years:
1811, 1876, 1936, 1958, 1960, 1986, and 1987;
three of the four chronologies had negative marker
rings in an additional 16 years: 1810, 1812, 1835,
1856, 1873, 1875, 1877, 1887, 1894, 1896, 1917,
1918, 1920, 1926, 1972, and 1998 (Figure 2).
Between 1798 and 2006, periods of suppressed
growth lasting three to eight years occurred in all
four chronologies in the late 1800s through 1810s,
1870s, the late 1910s through the early 1920s,
1930s, 1950s, 1970s, and the late 1980s (Figure 2).
In addition, correlation analysis indicated a strong
common growth signal for the period 1798–2006.
Correlations between individual site chronologies
ranged from 0.52 to 0.78 (p , 0.001), with an
average of 0.64 6 0.11 (Table 3). Correlations
between the Hayward Creek chronology and each
of the other three chronologies were lowest
(Table 3).
Standing Dead Trees
We successfully crossdated 121 of 158 (77%)
ring-width series from standing dead yellow-cedar
and estimated the year of death of 70 of 79 (89%)
trees. Of the 37 remaining ring-width series, eight
were too suppressed to confidently crossdate and
29 had broken or indiscernible outer rings. Except
for two trees at the Worsfold Bay site, all trees had
outer-ring dates between 1949 and 2006; therefore,
for 68 of the 70 trees assessed, time since death in
2007 ranged from 1 to 58 years. The two
exceptions were trees in more advanced stages of
decay: one with an outer-ring date of 1903 (decay
class IV) and the other with an outer-ring date of
1728 (decay class V).
Time since death increased significantly (F 5
78.65, p , 0.001) with advanced stages of decay
(Figure 3). Standing dead trees in decay classes I,
II, and III died 4.71 6 1.87, 12.56 6 5.31, and
25.15 6 9.87 years ago, respectively. Three trees in
decay class IV (time since death 5 40, 58,
104 years) and one tree in decay class V (time
since death 5 279 years) were not included in the
analysis because of small sample sizes for those
classes.
The outer-ring dates of the two ring-width
series from the same standing dead tree (n 5 51)
differed between 0 and 13 years (Figure 4). A total
of 16% had the same outer-ring date. In contrast,
53% had dates that differed from 1 to 3 years, and
31% had dates that differed by more than 3 years.
The difference in outer-ring dates between indi-
vidual ring-width series from the same standing
dead tree showed an increasing trend with
increasing time since death (Spearman’s r 5
0.56, p , 0.001; Figure 4).
DISCUSSION
Live, Asymptomatic Trees
Crossdating quality of the ring-width series
from live, asymptomatic trees, as expressed by
average mean sensitivity and average interseries
correlation values, is similar among the four sites.
Table 2. Summary characteristics for the ring-width series of
yellow-cedar from four sites near Prince Rupert, British
Columbia.
Site1 No. Series No. Trees Inter. Corr.2 Mean Sens.3
WB 32 17 0.47 0.24
BL 39 20 0.51 0.23
SC 36 19 0.46 0.23
HC 34 19 0.46 0.25
1 WB 5 Worsfold Bay, BL 5 Basil Lump, SC 5 Silver Creek,
and HC 5 Hayward Creek.2 Average interseries correlation of all ring-width series.3 Average mean sensitivity of all ring-width series.
18 STAN, MAERTENS, DANIELS, and ZEGLEN

Figure 2. Standard ring-width chronologies of yellow-cedar from four sites near Prince Rupert, British Columbia.
Reconstructing Yellow-Cedar Population Dynamics from Tree Rings 19

In addition, these values for ring-width series from
our four sites are comparable to those for all other
known yellow-cedar ring-width series, which are
from higher-elevation (.1,000 m a.s.l.), non-
declining sites in southwestern British Columbia
(Laroque and Smith 1999; Kellner et al. 2000;
Parish 2005) and lower-elevation (,300 m a.s.l.),
non-declining and declining sites in southeastern
Alaska (Beier et al. 2008). Our average mean
sensitivity values are in the middle of the range of
all known values for yellow-cedar, indicating that
trees at our sites are intermediate in their
sensitivity to year-to-year environmental fluctua-
tions. However, in all but one instance (i.e. Mount
Washington, Laroque and Smith 1999), our
average interseries correlation values exceed all
other known values for yellow-cedar. Overall,
these findings provide evidence of a moderately
strong common signal and high-quality cross-
dating among the individual ring-width series at
each of our sites.
Common marker rings and periods of sup-
pressed growth among the chronologies indicate
similar growth patterns of yellow-cedar at each of
the four sites. Strong correlations between indi-
vidual chronologies for the period 1798–2006
further indicate coherency in growth patterns. Of
all the correlations, those between the Hayward
Creek chronology and each of the other three
chronologies are lowest. These patterns may
reflect unique site characteristics or differing
weather events at Hayward Creek, as this site is
more distant from the others as well as more
continental. Still, our findings suggest that growth
of yellow-cedar at each of the four sites results
from similar environmental controls.
Furthermore, spatially coherent growth pat-
terns exist among yellow-cedar trees at our sites
and those at sites in southeastern Alaska and
southwestern British Columbia. Along a north-
south gradient, there is general synchrony of
negative marker rings and suppressions among
chronologies (Figure 5). Specifically, for the peri-
od 1798–2006, chronologies from sites in south-
eastern Alaska (Beier et al. 2008) are most similar
to chronologies from our sites on the North Coast
of British Columbia, whereas chronologies from
sites in southwestern British Columbia (Laroque
and Smith 1999; Parish 2005) are most similar to
each other. Our chronologies share growth pat-
terns in common with chronologies from south-
eastern Alaska and southwestern British Colum-
bia and are from sites that lie in between those two
locations (Figure 5). Although synchronous
growth patterns exist along a north-south gradi-
ent, negative marker rings occur in 1812, 1876,
and 1887 and suppressions occur in the 1870s,
Table 3. Pearson’s (r) correlation coefficients for the period in
which all yellow-cedar chronologies had a minimum of 10 trees:
1798–2006. All values are significant at p , 0.001.
Site1 WB BL SC HC
WB 1.00 0.78 0.72 0.56
BL 1.00 0.73 0.54
SC 1.00 0.52
HC 1.00
Grand mean 5 0.64 6 0.11 (SD)
1 WB 5 Worsfold Bay, BL 5 Basil Lump, SC 5 Silver Creek,
and HC 5 Hayward Creek.
Figure 3. Box plots of time since death of standing dead yellow-
cedar trees (n 5 66) in decay classes I to III at four sites near
Prince Rupert, British Columbia. Different letters indicate
significant differences among means at p , 0.001. Values within
the plot along the x-axis are sample sizes. The horizontal line in
each box is the median, the lower and upper limits of each box
are the 25th and 75th percentiles, the lines are the 5th and 95th
percentiles, and the circles are outliers.
20 STAN, MAERTENS, DANIELS, and ZEGLEN

1890s, and 1950s in chronologies from sites in
southeastern Alaska to southwestern British Co-
lumbia (Figure 5), demonstrating the coherence of
growth patterns of yellow-cedar across a broad
geographic range.
Interestingly, our chronologies from declin-
ing sites on the North Coast of British Columbia
have negative marker rings in common with
chronologies from declining sites in southeastern
Alaska (i.e. 1926, 1936, 1986, 1987; Figure 5; Beier
et al. 2008). For the sites in Alaska, Beier et al.
(2008) found a link between growth of yellow-
cedar and late-winter (March-April) temperature
and precipitation. In that same study, years of low
growth often coincided with years of potential
climatic stress to trees (Beier et al. 2008). For
example, negative marker rings, low snowfall, and
consecutive, prolonged, and intensive freeze events
all occurred in 1986 and 1987. Based on the
resemblance of the growth patterns of our yellow-
cedar trees to those of trees in Alaska, similar
growth-climate relations are plausible at declining
yellow-cedar sites in British Columbia. If this is
the case, yellow-cedar in British Columbia may be
vulnerable to damage from similar climatic
stressors as seen in Alaska, which will have
consequences for the long-term growth and
population dynamics of this species.
Standing Dead Trees
Our results demonstrate that year of death
can be estimated for decade- to century-old
standing dead yellow-cedar trees using dendro-
chronology. Other studies have found similar
estimates as ours for time since death of this
species, with reported values of over 100 years
(Hennon et al. 1990c; Parish and Antos 2004) and
200 years (Kellner et al. 2000) for standing dead
trees. Successful crossdating of long-dead yellow-
cedar trees is not surprising, especially considering
that this species occurs in cool climates and is
known to be highly decay resistant (Barton 1976).
Our time-since-death estimates of yellow-
cedar trees in decay classes I to III are very similar
to those of yellow-cedar trees in the same decay
Figure 4. Frequency distribution of the difference in outer-ring dates between individual yellow-cedar ring-width series from the
same standing dead tree (n 5 51). Vertical dashed line is the 90th percentile. Inset: Scatter plot of the difference in outer-ring dates
between individual yellow-cedar ring-width series from the same standing dead tree by time since death (Spearman’s r 5 0.56,
p , 0.001).
Reconstructing Yellow-Cedar Population Dynamics from Tree Rings 21

Figure 5. Top: Summary of negative marker rings (i.e. rings that differed from the mean tree-ring index by 21 standard deviation or
more) in all known yellow-cedar ring-width chronologies from sites at three locations along a north-south gradient: southeastern
Alaska (,300 m a.s.l.), North Coast of British Columbia (300–600 m a.s.l.), and southwestern British Columbia (.1,000 m a.s.l.).
Marker rings for our chronologies and those of Beier et al. (2008) and Parish (2005) were obtained from COFECHA outputs,
whereas marker rings for the chronologies of Laroque and Smith (1999) were taken from Table 2 of their manuscript. Marker rings
present in .50% of the chronologies from each study or decline category within a study are shown. However, because of the high
number of chronologies from declining sites in Alaska, marker rings that are present in at least 50% of those chronologies are shown
to improve interpretations of patterns across sites from all locations. Bottom: Summary of growth suppressions (i.e. multi-year
periods of below-average growth estimated via visual assessments) in all known yellow-cedar ring-width chronologies. Growth
suppressions present in .50% of the chronologies from each study or decline category within a study are shown.
22 STAN, MAERTENS, DANIELS, and ZEGLEN

classes in southeastern Alaska (Hennon et al.
1990c), although slightly lower in variability.
Using dates of radial-growth releases of hemlocks
growing beneath standing dead yellow-cedar trees,
Hennon et al. (1990c) estimated time since death
as 3.6 6 3.2, 13.6 6 6.9, and 26.2 6 12.3 years for
decay classes I, II, and III, respectively. Although
slight, the lower variability in our estimates
demonstrates the value of directly sampling
standing dead trees whenever possible to attain
more precise time-since-death estimates of indi-
viduals in different decay classes.
Still, as our results and those of Hennon et al.
(1990c) illustrate, time-since-death estimates of
yellow-cedar trees within a decay class are quite
variable, regardless of the technique that is used to
obtain them. High variability in time-since-death
estimates has been the case for other species (e.g.
Mast and Veblen 1994; Daniels et al. 1997).
Therefore, the decision to infer time since death
using decay class or dendrochronological dating
will be, at least in some instances, a matter of the
level of precision needed to address the goals of a
study. Although direct dendrochronological dat-
ing can sometimes provide more precise estimates,
this approach does have its shortcomings. Besides
the fact that directly sampling standing dead trees
may not be possible because of erosion of outer
rings, even when it is possible, the correspondence
of an outer-ring date to the actual death date of a
tree is complicated by the potential for a tree to
produce partial or no annual rings as it dies.
A difference in outer-ring dates between
individual ring-width series from the same stand-
ing dead tree suggests that partial cambial
mortality occurs in yellow-cedar at the study sites,
implying an additional source of potential error
when estimating time since death. In most
instances, outer-ring dates differed by three years
or less, but differences as high as 13 years
occurred. These results suggest a gradual cessation
of radial growth around the circumference of
individual yellow-cedar trees, which tends to
happen over just a few years, rather than decades.
Collecting multiple increment cores per tree allows
us to estimate a minimum duration of mortality of
yellow-cedar in declining stands. This estimate
represents the degree of error when determining
year of death using only a single core from a
standing dead tree. However, because this estimate
increases with time since death, it may represent
error from erosion of rings over time as well as
error from partial cambial mortality.
Despite some shortcomings, dendrochronol-
ogy can provide valuable information on time
since death, decay rates, and partial cambial
mortality of yellow-cedar, which will be useful
for reconstructing various aspects of its popula-
tion dynamics in declining stands. For example,
estimating time since death of individual trees will
facilitate reconstructing the frequency of yellow-
cedar mortality through time, which will be
important for exploring mechanisms associated
with tree death. In addition, identifying the range
of time-since-death estimates of trees in different
decay classes will be useful for estimating decay
rates from one class to the next and determining
dead wood persistence in different classes. Fur-
thermore, information on the frequency and
duration of partial cambial mortality allows for
a better understanding of tree decline and the use
of less-intensive sampling procedures in future
studies.
CONCLUSIONS
Our pilot study provides a foundation for
future studies to address new questions concerning
growth-climate relations, patterns of mortality,
and response of declining stands. We have
identified unique growth patterns between our
yellow-cedar chronologies from declining sites and
those from similar sites in Alaska. Additional
studies of growth-climate relations across multiple
sites are underway to assess the extent to which
yellow-cedar in British Columbia is vulnerable to
damage from similar climatic stressors as those
documented in Alaska and to determine spatial
patterns of risk. Furthermore, we have demon-
strated the feasibility of directly estimating time
since death of standing dead yellow-cedar trees
using dendrochronological techniques. Although
limitations exist in the precision of time-since-
death estimates, particularly as dead trees age and
with regard to the presence of partial cambial
mortality, sampling and analytical approaches can
Reconstructing Yellow-Cedar Population Dynamics from Tree Rings 23

be designed to best account for these shortcomings
when reconstructing population dynamics. Future
studies that assess growth-climate relations and
reconstruct the long-term population dynamics of
yellow-cedar in declining stands will provide
managers with information essential to project
timber losses, changes to stands, and ecosystem
reorganization in coastal forests.
ACKNOWLEDGMENTS
We thank Ron Diprose, Rachel Field, Harry
Kope, Alex Marshall, Colin Nelson, and Mike
Symons for assistance in the field, along with
Kevin Johnstone, Jennifer Passmore, and Sonya
Powell for assistance in the lab. Mike Grainger
and the staff at the British Columbia Ministry of
Forests and Range (BCMFR), North Coast
Forest District, provided logistical support while
in Prince Rupert. Colin Beier and Scott Sink
kindly supplied their COFECHA outputs for use
in Figure 5 and the Discussion section of the
manuscript. We thank two anonymous reviewers
for helpful comments. The BCMFR provided
funding for this project.
REFERENCES CITED
Allen, C. D., A. K. Macalady, H. Chenchouni, D. Bachelet, N.
McDowell, M. Vennetier, T. Kitzberger, A. Rigling, D. D.
Breshears, E. H. Hogg, P. Gonzalez, R. Fensham, Z. Zhang,
J. Castro, N. Demidova, J. Lim, G. Allard, S. W. Running,
A. Semerci, and N. Cobb, 2010. A global overview of
drought and heat-induced tree mortality reveals emerging
climate change risks for forests. Forest Ecology and Manage-
ment 259:660–684.
Amoroso, M. M., and L. D. Daniels, 2010. Cambial mortality
in declining Austrocedrus chilensis forests: Implications for
stand dynamics studies. Canadian Journal of Forest Research
40:885–893.
Barton, G. M., 1976. A review of yellow cedar (Chamaecyparis
nootkatensis (D. Don) Spach) extractives and their impor-
tance to utilization. Wood and Fiber 8:172–176.
Beier, C. M., S. E. Sink, P. E. Hennon, D. V. D’Amore, and
G. P. Juday, 2008. Twentieth-century warming and the
dendroclimatology of declining yellow-cedar forests in
southeastern Alaska. Canadian Journal of Forest Research
38:1319–1334.
Cook, E. R., 1985. A Time Series Analysis Approach to Tree-Ring
Standardization. Ph.D. dissertation, University of Arizona,
Tucson.
Cook, E. R., S. Shiyatov, and V. Mazepa, 1990. Estimation of
the mean chronology. In Methods of Dendrochronology:
Applications in the Environmental Sciences, edited by E. R.
Cook, and L. A. Kairiukstis, pp. 123–132. Kluwer Academic
Publishers, Dordrecht.
D’Amore, D. V., and P. E. Hennon, 2006. Evaluation of soil
saturation, soil chemistry, and early spring soil and air
temperatures as risk factors in yellow-cedar decline. Global
Change Biology 12:524–545.
D’Amore, D. V., P. E. Hennon, P. G. Schaberg, and G. J.
Hawley, 2009. Adaptation to exploit nitrate in surface soils
predisposes yellow-cedar to climate-induced decline while
enhancing the survival of western redcedar: A new hypoth-
esis. Forest Ecology and Management 258:2261–2268.
Daniels, L. D., J. Dobry, K. Klinka, and M. C. Feller, 1997.
Determining year of death of logs and snags of Thuja plicata
in southwestern coastal British Columbia. Canadian Journal
of Forest Research 27:1132–1141.
Grissino-Mayer, H. D., 2001. Evaluating crossdating accuracy:
a manual and tutorial for the computer program COFE-
CHA. Tree-Ring Research 57:205–221.
Hennon, P. E., D. V. D’Amore, D. T. Wittwer, and J. P.
Caouette, 2008. Yellow-cedar decline: Conserving a climate-
sensitive tree species as Alaska warms. In Integrated
Restoration of Forested Ecosystems to Achieve Multiresource
Benefits: Proceedings of the 2007 National Silviculture
Workshop, edited by R. L. Deal, pp. 233–245. USDA Forest
Service General Technical Report PNW-GTR-733.
Hennon, P. E., D. V. D’Amore, S. Zeglen, and M. Grainger,
2005. Yellow-Cedar Decline in the North Coast Forest District
of British Columbia. USDA Forest Service Research Note
PNW-RN-549.
Hennon, P. E., E. M. Hansen, and C. G. Shaw, III, 1990a.
Dynamics of decline and mortality of Chamaecyparis
nootkatensis in southeast Alaska. Canadian Journal of Botany
68:651–662.
Hennon, P. E., and C. G. Shaw, III, 1994. Did climatic warming
trigger the onset and development of yellow-cedar decline in
southeast Alaska? European Journal of Forest Pathology 24:
399–418.
Hennon, P. E., and C. G. Shaw, III, 1997. The enigma of
yellow-cedar decline: What is killing these long-lived,
defensive trees? Journal of Forestry 95:4–10.
Hennon, P. E., C. G. Shaw, III, and E. M. Hansen, 1990b.
Symptoms and fungal associations of declining Chamaecy-
paris nootkatensis in southeast Alaska. Plant Disease 74:
267–273.
Hennon, P. E., C. G. Shaw, III, and E. M. Hansen, 1990c.
Dating decline and mortality of Chamaecyparis nootkatensis
in southeast Alaska. Forest Science 36:502–515.
Holmes, R. L., 1983. Computer-assisted quality control in
tree-ring dating and measurement. Tree-Ring Bulletin 43:
69–78.
Kellner, A. M. E., C. P. Laroque, D. J. Smith, and A. S.
Harestad, 2000. Chronological dating of high-elevation dead
and dying trees on northern Vancouver Island, British
Columbia. Northwest Science 74:242–247.
Lamb, M., and T. Wurtz (compilers), 2009. Forest Health
Conditions in Alaska—2008. USDA Forest Service Forest
Health Protection Report R10-PR-20.
24 STAN, MAERTENS, DANIELS, and ZEGLEN

Laroque, C. P., and D. J. Smith, 1999. Tree-ring analysis of
yellow-cedar (Chamaecyparis nootkatensis) on Vancouver
Island, British Columbia. Canadian Journal of Forest
Research 29:115–123.
Mast, J. N., and T. T. Veblen, 1994. A dendrochronological
method of studying tree mortality patterns. Physical Geog-
raphy 15:529–542.
Meidinger, D. V., and J. Pojar, Editors, 1991. Ecosystems of
British Columbia. British Columbia Ministry of Forests
Special Report Series 6.
Parish, R., 2005. Mount Cain, Alaska Yellow-Cedar Tree-Ring
Record (CANA175). In International Tree-Ring Data Bank,
edited by H. D. Grissino-Mayer, and H. C. Fritts, IGBP
PAGES/World Data Center-A for Paleoclimatology. NOAA/
NGDC Paleoclimatology Program, Boulder.
Parish, R., and J. A. Antos, 2004. Structure and dynamics of an
ancient montane forest in coastal British Columbia. Oecolo-
gia 141:562–576.
Parish, R., and J. A. Antos, 2006. Slow growth, long-lived trees,
and minimal disturbance characterize the dynamics of an
ancient, montane forest in coastal British Columbia. Cana-
dian Journal of Forest Research 36:2826–2838.
R Development Core Team, 2007. R: A Language and
Environment for Statistical Computing. R Foundation for
Statistical Computing, Vienna.
Stokes, M. A., and T. L. Smiley, 1968. An Introduction to Tree-
Ring Dating. University of Chicago Press, Chicago.
Wang, T., A. Hamann, D. L. Spittlehouse, and S. N. Aitken,
2006. Development of scale-free climate data for western
Canada for use in resource management. International
Journal of Climatology 26:383–397.
Westfall, J., and T. Ebata, 2009. 2008 Summary of Forest Health
Conditions in British Columbia. British Columbia Ministry of
Forests and Range Pest Management Report Number 15.
Yamaguchi, D. K., 1991. A simple method for cross-dating
increment cores from living trees. Canadian Journal of Forest
Research 21:414–416.
Received 5 June 2009; accepted 18 May 2010.
Reconstructing Yellow-Cedar Population Dynamics from Tree Rings 25